
Submitted:
10 October 2023
Posted:
11 October 2023
You are already at the latest version
Abstract
Recombinant human erythropoietin (rhEPO) treatment is an alternative to erythrocyte transfusions in neonates with anemia of prematurity (AOP). This study assesses the impact of rhEPO administration within the first week of life on the incidence of AOP (any stage, individual AOP stages, and red-blood-cell (RBC) transfusions. Out of 108 preterm neonates, 49 were administered rhEPO and compared to the remaining group using univariate and multivariate analyses. Univariately, gestational age (GA), birth weight (BW), hemoglobin (Hb), hematocrit (HCT), and RBC levels, and iron administration were significantly associated to AOP (p<0.05 each); however, only the latter remained significant after adjusting for covariates (AOR: 2.75, 95% CI, 1.06–7.11). Multinomial analysis revealed rhEOP therapy was associated with a near 3-fold reduction in moderate AOP incidence (OR: 0.36, 95% CI, 0.15–0.89). Furthermore, ANCOVA revealed positive correlations between rhEPO administration and 21-day Hb (p<0.01), HCT (p<0.05), and EPO (p<0.001) levels. The results confirm previously reported benefits of rhEPO treatment, such as reduced moderate AOP incidence and increased Hb, HCT, and serum EPO levels.
Keywords:
rhEPO
; anemia of prematurity
; erythrocyte transfusions
1. Introduction
Anemia of prematurity (AOP) is a hypo-regenerative, normocytic, normochromic anemia that appears between the 2nd and 6th weeks of life and characterized by multiple factors, including reduced serum erythropoietin (EPO) levels, iatrogenic blood loss, hemorrhage, hemolysis, hypovolemia, insufficient erythropoiesis, and reduced red blood cell (RBC) survival [1,2].
AOP primarily affects preterm neonates with gestational ages (GA) under 35 weeks and is considered to be mainly caused by phlebotomy blood loss following laboratory tests that are more frequently performed in preterm than in term neonates [3,4]. Its high incidence rate, symptomatology, and association with increased need for transfusions make it a problematic disease in pediatric practice [3].
AOP has been traditionally treated using RBC transfusion; however, in the past 40 years, EPO has become both an important pathophysiological characteristic of the disease and a treatment for it, in the form of recombinant human EPO (rhEPO) [1,5,6,7,8,9,10].
Data has shown that rhEPO stimulates erythropoiesis and decreases both the dosage and frequency of RBC transfusions [1]. Most reports indicate higher per-kilogram doses are more effective in preterm neonates, as these present increased plasma clearance and distribution volume compared to full-term newborns [2].
Although there is extensive research on the efficacy and side effects of rEPO administration, there is yet not a consensus in regard to whether 7-day or 21-day administration is more effective in treating AOP, with some evidence showing that both contribute to increased reticulocyte counts and hemoglobin levels but that only the latter is also associated with a reduction in the number of neonates requiring transfusion [5]. Furthermore, a Cochrane systematic review [11] revealed that early administration of rhEPO and other erythropoiesis-stimulating agents has been associated with a reduction in the number of transfusions required, neurological impairments between the 18th and 22nd months of life, intraventricular hemorrhage (IVH), and periventricular leukomalacia (PVL), as well as an increase in Bayley-II Mental Development Index (MDI) scores between the 18th and 22nd months of life. Multiple systematic reviews have also reported a reduction in the incidence of necrotizing enterocolitis (any stage) following rhEPO treatment, while finding no significant relationship to mortality or bronchopulmonary dysplasia [11,12,13]. Further, there has been no significant association between early or late rhEPO administration and retinopathy of prematurity (ROP) following 4 recent systematic reviews [11,12,14,15].
The main aim of this study is to assess the impact of rhEPO administration in the first 7 days of life on the presence of AOP (any stage) at 21 days of life, as well as different levels of AOP severity (i.e., mild, moderate, and severe). As a secondary aim, the need for transfusions within the first 21 days of life has been analyzed.
2. Materials and Methods
2.1. Study population
This study includes 108 neonates admitted to the Neonatology and Preterm Department of the “Louis Turcanu” Children’s Emergency Clinical Hospital in Timisoara, Romania during October 2021 and December 2022. The GA was estimated using the last menstrual period. Birth weight (BW), alongside 1- and 5-minute Apgar scores, were measured during the first postnatal minutes. Prothrombin Time (PT) and activated Partial Thromboplastin Time (aPTT) were measured during the first day of life. Lactate dehydrogenase (LDH), a hemolysis marker, was measured within the first six postnatal hours. Hb, HCT, RBC, and serum EPO levels were measured at 1, 7, and 21 days of life. Neonates were administered rhEPO subcutaneously at a dose of 500 U/kg BW at 2, 4, 7, 14, 21, and 28 days of life, if required, RBC transfusions. Approval was obtained from the local Ethical Committee.
2.2. Reference intervals and categorized variables
BW was categorized as extremely low birth weight (< 1000g), very low birth weight (< 1500g), and low birth weight (< 2500g), as per WHO guidelines [18].
GA categorization was also performed as per WHO guidelines [19], namely neonates with a GA less than 28 weeks were classified as extremely preterm, those with a GA of 28 to less than 32 weeks were classified as extremely preterm, and those with a GA of 32 to 37 weeks were classified as moderate to late preterm.
An Apgar score of 7–10 was classified as reassuring, a score of 4–6 was classified as moderately abnormal, and a score of 0–3 was classified as low, as per the American College of Obstetrics and Gynecology [20].
PT and aPTT levels of 11–14 s and 23–35 s, respectively, were considered normal [21].
AOP severity was categorized based on WHO guidelines, using the 6–59 months interval in absence of a 0–6 months interval; therefore, cases with Hb levels of 100–109 g/L were classified as mild AOP, those with Hb levels of 70–99 g/L were classified as moderate AOP, and those with Hb levels less than <70 g/L were classified as severe AOP [22].
2.3. Statistical Analysis
Continuous variables are expressed as mean ± standard deviation (SD), while categorical variables are expressed as numbers and/or percentages. Univariate analysis was performed using Student’s t-test to examine continuous variables, while the one-sample binomial and χ2 tests were used to examine dichotomous variables. Independent nominal variables, such as sex, EPO administration, and Iron administration were dichotomized. Certain independent continuous variables such as 1-minute Apgar score, aPTT, PT, LDH, and serum EPO were used only as scale variables, Hb, HCT, RBC were used both as scale variables and dichotomized variables, while GA, BW, and 5-minutes Apgar score were used both as scale variables and ranked categorical variables. Dependent variables such as transfusion administration, abnormal serum ferritin, and abnormal serum iron were dichotomized, while AOP was used both as a dichotomized variable and a ranked categorical variable (i.e., no AOP, mild AOP, moderate AOP, and severe AOP). Univariate binomial logistic regression analysis was performed, and factors with a statistically significant association to AOP, transfusion administration, abnormal serum ferritin, and abnormal serum iron were then analyzed by multivariate binomial logistic regression. The odds ratios (ORs) and the adjusted ORs (AORs) were calculated for univariate and multivariate analyses, respectively. In the case of AOP, these factors were then used in a multivariate multinominal logistic regression analysis to analyze the relationship between multiple independent factors and AOP severity. The relationship between rank-transformed (GA, BW, 5-minute Apgar score) and dichotomized (sex, LDH, aPTT, PT, iron administration, EPO administration) data and the AOP stage was further studied using the Spearman ranked correlation and rank-biserial correlation coefficient, respectively. ANCOVA was used to further study the correlation between EPO administration and 21-day levels of Hb, HCT, and serum EPO. All statistical tests have been 2-tailed and a p-values < 0.05 was considered statistically significant. All statistical analyses were performed using SPSS Version 23 (Chicago, IL, USA).
3. Results
3.1. Distribution of Patients
In the current study, 108 neonates with GA ≤ 37 weeks and BW < 2500 g were included to study the effects EPO administration in first 7 days of life, iron administration during 7th to 21st days of life, and other perinatal characteristics, including GA, BW, Apgar scores at 1 and 5 minutes, and LDH, Hb, HCT, RBC count, aPTT, PT, and serum EPO at 1 day of life, have on various outcomes, including AOP (any severity), AOP severity, RBC count, Hb, HCT, and serum EPO, ferritin, and iron levels at 21 days of life and transfusion administration within the first 21 days of life.
The male to female ratio was 1.45 (64 males and 44 females), with no statistically significant difference being found between sexes in regard to GA (p=0.33), BW (p=0.79), 1- and 5-minutes Apgar scores (p=0.098 and p=0.171, respectively), RBC count (p=0.078), aPTT (p=0.96), PT (p=0.18), LDH (p=0.72), and serum EPO (p=0.53) at 1 day of life. The only baseline characteristics which significantly differed were day-1 Hb and HCT levels (p<0.01 and p<0.05, respectively).
Out of 108 neonates included in this study, 49 (45.37%) underwent EPO administration within the first 7 days of life, while 60 (55.56%) underwent iron administration in the 7th to 21st day of life, as shown in the schematic diagram above (Figure 1).
Table 1 showcases the incidence of AOP (any severity) and specific stages in different subgroups of our study population.
The newborns were grouped based on various perinatal characteristics, such as sex, GA category, BW category, 1- and 5-minute Apgar score categories, LDH within range, aPTT within range, PT within range, day-1 AOP, and iron and EPO treatment.
Most of the males (78.13%) and females (63.64%) were diagnosed with some AOP stage (mild, moderate, or severe). The incidence of AOP (any severity) gradually decreased as GA and BA increased: 88.89%, 76.36%, and 57.14% for extremely preterm (<28 weeks), very preterm (28–31 weeks), and moderate to late preterm (32–37 weeks), and 85.71%, 74.47%, and 62.50% for extremely low birth weight (<1000 g), very low birth weight (1000–1499 g), and low birth weight (1500–2499 g) neonates, respectively. Similarly, there was a gradual decrease in the incidence of AOP (any severity) as 1- and 5-minute Apgar scores increased: 81.82%, 76.47%, and 65.38% for 0–3, 4–6, and 7–10 1-minute Apgar scores, and 100%, 75.56%, and 69.35% for 0–3, 4–6, and 7–10 5-minute Apgar scores, respectively.
Neonates with pathological LDH, PT, and serum EPO levels on day 1 of life showed higher AOP (any severity) incidence rates compared to those presenting levels within the reference ranges (85.87%, 78.52%, and 83.18%, respectively).
Surprisingly, less neonates with pathological aPTT levels on day 1 of life presented AOP (any severity) compared to those with normal aPTT levels (69.47% vs. 92.31%, respectively).
Neonates that were administered iron during the 7th to 21st days of life showed a higher AOP (any severity) incidence rate compared to those that did not undergo iron treatment (80.00% vs. 62.50%), while neonates that were administered EPO during the first 7 days of life showed a lower AOP (any severity) incidence rate compared to those that did not undergo EPO treatment (63.27% vs. 79.66%).
Table 2 showcases the incidence of RBC transfusions in different subgroups of the study population.
Half of the male neonates required transfusions within the first 21 days of life, compared to only 36.36% of female neonates.
The need for transfusions within the first 21 days of life also gradually decreased as GA and BA increased: 77.78%, 47.27%, and 22.86% for extremely preterm, very preterm, and moderate to late preterm, and 76.19%, 51.06%, and 20.00% for extremely low birth weight, very low birth weight, and low birth weight neonates, respectively.
Neonates with pathological PT levels at 1 day of life required transfusions within the first 21 days of life compared to those with normal PT levels (46.97% vs. 40.48%, respectively).
Surprisingly, less neonates with pathological aPTT levels on day 1 of life required transfusions within the first 21 days of life (42.11% vs. 61.54%, respectively).
Neonates that were administered iron during the 7th to 21st days of life showed a higher transfusion incidence rate compared to those that did not undergo iron treatment (60.00% vs. 25.00%, respectively), while neonates that were administered EPO during the first 7 days of life showed a lower transfusion incidence rate compared to those that did not undergo EPO treatment (24.49% vs. 61.02%, respectively).
3.2. Univariate Comparison of Perinatal Characteristics
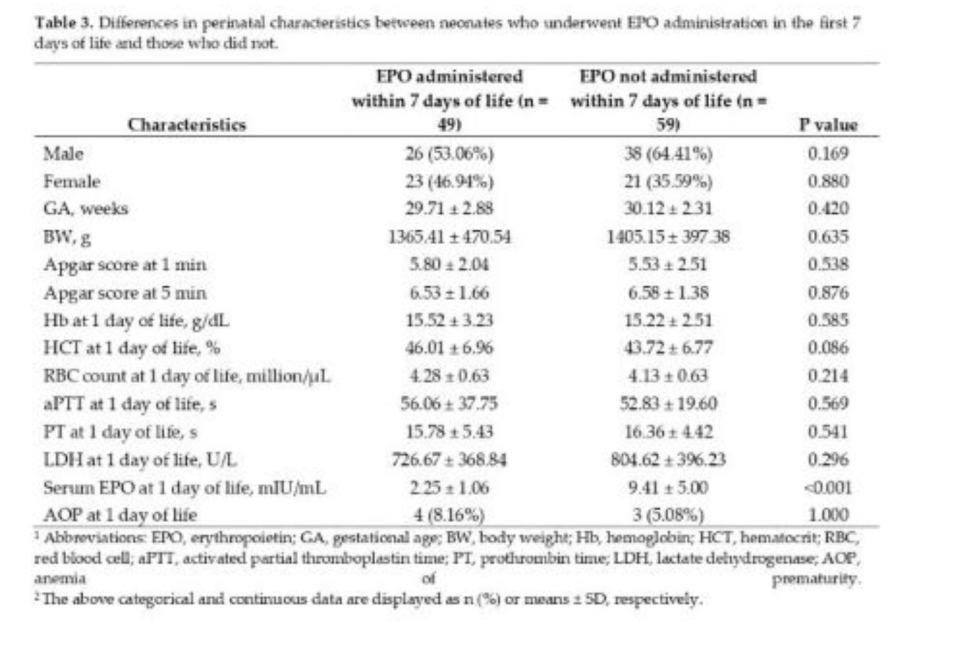
The perinatal characteristics of infants that developed and did not undergo EPO administration have been listed in Table 3. The groups administered EPO within 7 days and not administered EPO within 7 days did not differ at baseline in terms of sex, GA, BW, Apgar scores at 1 and 5 minutes, Hb, HCT, RBC count, aPTT, PT, LDH, or AOP at 1 day of life. The serum EPO levels at 1 days of life was the only perinatal characteristic that was significantly different between neonates that received EPO treatment within the first 7 days of life and those that were not administered EPO within the first 7 days of life.
3.3. Univariate Comparison of Risk Factors
3.3.1. AOP (any severity)
As indicated in Table 4, the group with AOP at 21 days of life and the group without AOP at 21 days of life did not differ at baseline in terms of sex, Apgar scores at 1 and 5 minutes, aPTT, PT, LDH, or serum EPO at 1 day of life but did significantly differ in terms of GA, BW, Hb, HCT, RBC count, and iron administration. The difference between the groups of neonates administered and not administered EPO was nearly significant, with p=0.058, prompting further investigation using logistic regression. The difference between the groups of neonates administered and not administered iron was statistically significant, with the former being more likely to present AOP at 21 days of life (p<0.001).
3.3.2. Transfusions
As presented in Table 5, the group with transfusions within first 21 days of life and the group without transfusions within first 21 days of life differed at baseline in terms of GA, BW, Apgar scores at 1 minute, Hb, HCT, RBC count, serum EPO at 1 day of life, and EPO administration.
3.4. Univariate Analysis of Risk Factors
3.4.1. AOP (any severity)
As indicated in Table 6, GA, BW, Hb, HCT, and RBC count have been found to be significant protective factors against AOP at 21 days, while serum EOP has been found to be a significant risk factors for AOP at 21 days.
3.4.2. Transfusions
As presented in Table 7, GA, BW, HCT level, RBC count and EPO administration have been found to be significant protective factors against transfusion within 21 days, while serum EOP has been found to be a significant risk factors for transfusions within 21 days.
3.5. Multivariate Analysis of Risk Factors
3.5.1. Multivariate Analysis of Risk Factors and Their Correlation to AOP (any severity)
Factors with a statistically significant correlation to AOP in the previous analysis, namely GA, BW, Hb at 1 day of life, HCT at 1 day of life, RBC count at 1 day of life, and iron administration were analyzed by multivariate binomial logistic regression analysis, and the AORs were calculated. The analysis was performed following the same variable classification used in the above tests.
As indicated in Table 8, unlike in univariate logistic regression analysis, the only factor that remains statistically significant is iron administration between the 7th and 21st day of life, with p<0.05. Therefore, iron administration is shown to increase the risk of neonates developing AOP at 21 days of age 2.7-fold, having an AOR of 2.75 (95% CI, 1.06–7.11). However, this wide confidence interval warrants further research involving larger data sets.
3.5.2. Multinomial Analysis of Risk Factors and Their Correlation to Specific AOP Stages
Factors with a statistically significant correlation to AOP above were then analyzed by multivariate multinomial (ordinal/ranked dependent variable) logistic regression analysis, and the ORs were calculated. The analysis was performed following the variable classification used in above, but instead of using the dichotomous any-severity AOP variable, the AOP category variable (ranked) was used to determine which correlation between multiple factors and AOP stages/levels was the highest.
As presented in Table 9, the first set of coefficients represents comparisons between neonates with Absence of AOP at 21 days of life (coded 0) and those with Mild AOP at 21 days of life (coded 1 in this portion of the output). None of the above factors were significant predictors in the model, as all p-values >0.05.
The second set of coefficients represents comparisons between neonates with Absence of AOP at 21 days of life (coded 0) and those with Moderate AOP at 21 days of life (coded 2 in this portion of the output). Only iron administration in the 7th to 21st day of life was a significant predictor (b=1.27, s.e.=0.52, p<0.05) in the model, as neonates that underwent iron administration were more 3.5-fold more likely of having moderate AOP that those who did not undergo iron administration, with an OR of 3.56 (95% CI, 1.28–9.93).
The final set of coefficients represents comparisons between neonates with Absence of AOP at 21 days of life (coded 0) and those with Severe AOP at 21 days of life (coded 3 in this portion of the output). Due to only 1 case of Severe AOP, there was insufficient data to test this set.
EPO administration in the first 7 days of life is insignificant in regard to mild AOP at 21 days of life; however, it is significant in reducing the likelihood of moderate AOP at 21 days of life, with an OR of 0.36 (95% CI, 0.15–0.89) and p<0.05, as also indicated in Figure 2. There were insufficient data for severe AOP at 21 days of life.
3.5.3. Spearman Ranked Correlations to Specific AOP Stages
The relationship between particular AOP stages and either rank-transformed GA (32–37, 28–31, and <28 weeks), BW (1500–2499, 1000–1499, and <1000 g), Apgar score at 5 minutes (7–10, 4–6, and 0–3) and dichotomized data (Sex, Normal LDH, Normal aPTT, Normal PT, Iron administration, and EPO administration) was further studied using either the Spearman ranked and rank-biserial correlation coefficients, respectively.
In regard to GA category, there was a strong (ρ = 0.67), statistically significant (p<0.001) correlation between GA category and BW category (p<0.001), a “near strong” (ρ=0.42), statistically significant (p<0.001) correlation between GA category and 5-minute Apgar score category, and a moderate (ρ=-0.32), statistically significant (p = 0.001) negative correlation (-0.314) between GA category and AOP severity at 21 days of life.
In regard to BW category, there was a strong (ρ=0.67), statistically significant (p<0.001) correlation between BW category and GA category, a moderate (ρ=0.36), statistically significant (p<0.001) correlation between BW category and 5-minute Apgar score category, and a moderate (ρ=-0.28), statistically significant (p<0.01) negative correlation between BW category and AOP severity at 21 days of life.
In regard to 5-minute Apgar score category, there was a “near strong” (ρ=0.42), statistically significant (p<0.001) correlation between 5-minute Apgar score category and GA category, a moderate (ρ=0.36), statistically significant (p<0.001) correlation between 5-minute Apgar score category and BW category, and a weak negative correlation (ρ=-0.10), statistically unsignificant (p>0.05) negative correlation between 5-minute Apgar score category and AOP severity at 21 days of life.
Therefore, following the Spearman Ranked analysis, it was demonstrated that GA had a stronger negative correlation with AOP stage/level than BW (ρ=-0.31 vs. ρ=-0.28) but that it was only a moderate correlation.
3.5.4. Multivariate Analysis of Risk Factors and Their Correlation to Transfusion Administration
Factors with a statistically significant correlation to transfusions in the previous Univariate Binary Logistic Regression Analysis, i.e., GA, BW, Hb at 1 day of life, HCT at 1 day of life, RBC count at 1 day of life, serum EPO at 1 day of life and EPO administration, were analyzed using multivariate binomial logistic regression, and the AORs were calculated. The analysis was performed following the same variable classification used in the above tests.
As indicated in Table 10, unlike in univariate logistic regression analysis, none of the factors remain statistically significant (p<0.05), with BW being the only “near significant” factor, with a p-value of exactly 0.05 and an AOR of 0.998 (95% CI, 0.996–1.000).
3.6. ANCOVA of Hb, HCT, and serum EPO levels at 21 days of life following EPO administration
In order to further examine the effects of EPO administration in regard to AOP, the relationships between EPO treatment in the first 7 days of life and the Hb, HCT, and serum EPO levels of neonates at 21 days of life has been tested using ANCOVA, with Hb, HCT, and serum EPO levels at 21 days of life as dependent continuous variables, EPO administration as independent variable, and GA, BW, Apgar scores at 1 day, Hb, HCT, RBC, LDH, and serum EPO levels, and aPTT and PT as covariate candidates.
As indicated in Table 11, although EPO administration in the first 7 days of life has been shown to only have a statistically significant relationship with moderate AOP at 21 days of life and not with any-stage AOP at 21 days of life in the above regression analyses, the above ANCOVA results show that EPO administration in the first 7 days of life is significantly correlated with increased levels of Hb, HCT, and serum EPO at 21 days of life.
4. Discussion
The results obtained in this study point out well-known previously researched benefits of rhEPO administration as well as considerable differences.
Similar to the results of a recent Cochrane review [11], a reduction in the number of transfusions required has been noted in our study following univariate logistic analysis (OR: 0.21, 95% CI, 0.09–0.48). This however contradicts the findings of Doyle J.J. (1997) [5], where, dissimilar to rhEPO administration starting from the 21st day of life, rhEPO administration starting at less than 7 days of life was not associated with a decreased number of transfusions. Interestingly, following a multivariate analysis in our study, rhEPO therapy was no longer significantly associated with a decrease in transfusions (AOR: 0.24, 95% CI, 0.04–1.33).
Alongside a reduction of required transfusions, increases in Hb and HCT have also been reported in the literature [23]. In our study, ANCOVA revealed rhEPO administration in the first 7 days of life is significantly correlated with increased levels of both Hb (η² = 0.1, p<0.01) and HCT (η² = 0.07, p<0.01) at 21 days of life. Furthermore, the correlation found between rhEPO treatment and 21-day serum levels (η² = 0.20) confirms rhEPO is an erythropoietic growth factor, in this study explaining 20% of the variation in 21-day serum levels.
Although univariate logistic regression analysis revealed only a near significant association between rhEPO administration and AOP (p = 0.061), multivariate logistic regression analysis showed a statistically significant relationship between rhEPO therapy and moderate AOP (OR: 0.36, 95% CI, 0.15–0.89), the most common AOP stage found in our study. This near 3-fold reduction in moderate AOP incidence is consistent with a large majority of studies that recommend rhEPO administration and point out multiple benefits of this treatment [1,5,6,7,8,9,10,11,12,14,15]. Furthermore, this warrants future investigation into the effects rhEPO has on different levels of AOP.
Surprisingly, iron administration within the first 7–21 days of life was the only statistically significant AOP risk factor when undergoing multivariate logistical analysis (AOR: 2.75, 95% CI, 1.06–7.11), albeit a wide CI that warrant further studies involving larger sample sizes. This near 3-fold increase has not been previously reported in the literature and may be statistically unsignificant in larger study populations.
The rise in hemoglobin occurred mainly during the fourth week of rhEPO therapy. Despite the stimulatory effect on erythropoiesis, there were no significant differences in the frequency or total volume of RBC transfusions given to study infants in the post randomization period, irrespective of their randomization status.
Considering that the relatively large or stable preterm neonates who respond best to rhEPO require relatively few RBC transfusions, their need for rhEPO to avoid or minimize transfusions is minimal. Unfortunately, extremely low birth weight newborns, who present more serious health issues and have the greatest need for RBC transfusions shortly after birth, have not consistently responded to rhEPO therapy.
The main limitation of our study is the small number of patients included, which warrants further studies on the effects of rhEPO therapy. Another limitation is the lack of hypothermia data.
Being one of the few studies analyzing AOP in an East-European population of preterm and low birthweight neonates, specifically West Romania, the results can be included in future meta-analyses alongside other studies investigating the relationship between rhEPO treatment and AOP to account for variation of effect sizes across different populations.
5. Conclusions
In this study, rhEPO treatment within the first 7 days of life was confirmed to reduce moderate AOP incidence and increased Hb, HCT, and serum EPO levels at 21 days of life. Additionally, rhEPO therapy has been significantly associated with reduced incidence of transfusions within the first 21 days of life. These results underline the multiple benefits of rhEPO treatment in preterm neonates.
Author Contributions
Conceptualization, O.C.C. and A.M.M; methodology, O.C.C. and D.M.C.; software, F.M.D. and M.D.; validation, E.R.B, E.R.I. and N.L.; formal analysis, F.M.D. and A.M.M; resources, O.C.C. and D.M.C; data curation, N.L. and M.D.; writing—original draft preparation, O.C.C. and M.D.; supervision, M.B.; M.B.; project administration, M.B. All authors have read and agreed to the published version of the manuscript.
Funding
This research received no external funding.
Institutional Review Board Statement
The study was conducted according to the guidelines of the Declaration of Helsinki and approved by the Ethics Committee for Scientific Research and Development of the “Louis Tourcanu” Children’s Emergency Clinical Hospital Timișoara (protocol code number 84; approval date:5.10.2023).
Informed Consent Statement
Informed consent was obtained from the parents and legal guardians of all the neonates involved in the study.
Data Availability Statement
All data showcased in this study can be obtained on request from the corresponding author. Data have not been publicized as per the requirements of the European Union General Data Protection Regulation to limit publicly-available personal information.
Conflicts of Interest
The authors declare no conflict of interest.
References
- Cloherty, J.P.; Eichenwald, E.C.; Stark, A. R. Manual of neonatal care, 6th ed.; Wolters Kluwer Health/Lippincott Williams & Wilkins: Philadelphia, USA, 2008. [Google Scholar]
- Kling, P.J. Anemia of prematurity and indications for erythropoietin therapy. In Neonatal Hematology, 1st ed.; de Alcaron, P., Werner, E., Eds.; Cambridge University Press: The Edinburgh Building, Cambridge, UK, 2005; pp. 59–67. [Google Scholar]
- Spitzer, A.R. Intensive Care of the Fetus and Neonate, 2nd ed.; Mosby: Missouri, USA, 2005. [Google Scholar]
- Strauss, R.G. Anaemia of prematurity: pathophysiology and treatment. Blood Rev. 2010, 24, 221–225. [Google Scholar] [CrossRef] [PubMed]
- Doyle, J.J. The role of erythropoietin in the anemia of prematurity. Semin Perinatol. 1997, 21, 20–27. [Google Scholar] [CrossRef] [PubMed]
- Von Kohorn, I.; Ehrenkranz, R.A. Anemia in the preterm infant: erythropoietin versus erythrocyte transfusion--it's not that simple. Clin Perinatol. 2009, 36, 111–123. [Google Scholar] [CrossRef] [PubMed]
- Garcia, M.G.; Hutson, A.D.; Christensen, R.D. Effect of recombinant erythropoietin on "late" transfusions in the neonatal intensive care unit: a meta-analysis. 2002. Database of Abstracts of Reviews of Effects (DARE): Quality-assessed Reviews [Internet]. York (UK): Centre for Reviews and Dissemination (UK); 1995-.
- Ohlsson, A.; Aher, S.M. Early erythropoietin for preventing red blood cell transfusion in preterm and/or low birth weight infants. Cochrane Database Syst Rev. 2006, CD004863. [Google Scholar] [CrossRef]
- Ohls, R.K. Erythropoietin treatment in extremely low birth weight infants: blood in versus blood out. J Pediatr. 2002, 141, 3–6. [Google Scholar] [CrossRef] [PubMed]
- Juul, S. Erythropoietin in anemia of prematurity. J Matern Fetal Neonatal Med. 2012, 25 (Suppl 5), 80–84. [Google Scholar] [CrossRef] [PubMed]
- Ohlsson, A.; Aher, S. M. Early erythropoiesis-stimulating agents in preterm or low birth weight infants. Cochrane Database Syst Rev . 2017, 11, CD004863. [Google Scholar] [CrossRef] [PubMed]
- Ananthan, A.; Balasubramanian, H.; Rao, S.; Patole, S. Clinical Outcomes Related to the Gastrointestinal Trophic Effects of Erythropoietin in Preterm Neonates: A Systematic Review and Meta-Analysis. Adv Nutr. 2018, 9, 238–246. [Google Scholar] [CrossRef]
- Ananthan, A.; Balasubramanian, H.; Mohan, D.; Rao, S.; Patole, S. Early erythropoietin for preventing necrotizing enterocolitis in preterm neonates - an updated meta-analysis. Eur J Pediatr. 2022, 181, 1821–1833. [Google Scholar] [CrossRef] [PubMed]
- Chou, H.H.; Chung, M.Y.; Zhou, X.G.; Lin, H.C. Early Erythropoietin Administration does not Increase the Risk of Retinopathy in Preterm Infants. Pediatrics and neonatology. Pediatr Neonatol. 2017, 58, 48–56. [Google Scholar] [CrossRef] [PubMed]
- Fischer, H.S.; Reibel, N.J.; Bührer, C.; Dame, C. Effect of Early Erythropoietin on Retinopathy of Prematurity: A Stratified Meta-Analysis. Neonatology 2023, 1–11. [Google Scholar] [CrossRef] [PubMed]
- Mayo Clinic. Available online: https://pediatric.testcatalog.org/show/LD (accessed on 15 September 2023).
- Royal College of Paediatrics and Child Health. Available online: https://www.rcpch.ac.uk/sites/default/files/rcpch/HTWQ/Reference%20ranges%20Jan%2018.pdf (accessed on 15 September 2023).
- WHO. Available online: https://www.who.int/data/nutrition/nlis/info/low-birth-weight (accessed on 15 September 2023).
- WHO. Available online: https://www.who.int/news-room/fact-sheets/detail/preterm-birth (accessed on 15 September 2023).
- American College of Obstetrics and Gynecology, Task Force on Neonatal Encephalopathy; American Academy of Pediatrics. Neonatal Encephalopathy and Neurologic Outcome, Second Edition. Pediatrics 2014, 133, e1482–e1488. [Google Scholar] [CrossRef]
- Centre of Clinical Excellence - Women and Children Safer Care Victoria. Available online: https://www.safercare.vic.gov.au/clinical-guidance/neonatal/normal-laboratory-values-for-neonates (accessed on 15 September 2023).
- WHO. Nutritional anaemias: tools for effective prevention and control, 1st ed.; WHO, 2017. [Google Scholar]
- El-Lahony, D.M.; Saleh, N.Y.; Habib, M.S.; Shehata, M.A.; El-Hawy, M.A. The role of recombinant Human erythropoietin in neonatal anemia. Hematol Oncol Stem Cell Ther. 2020, 13, 147–151. [Google Scholar] [CrossRef] [PubMed]
Figure 1.
Distribution of neonates included in the study.
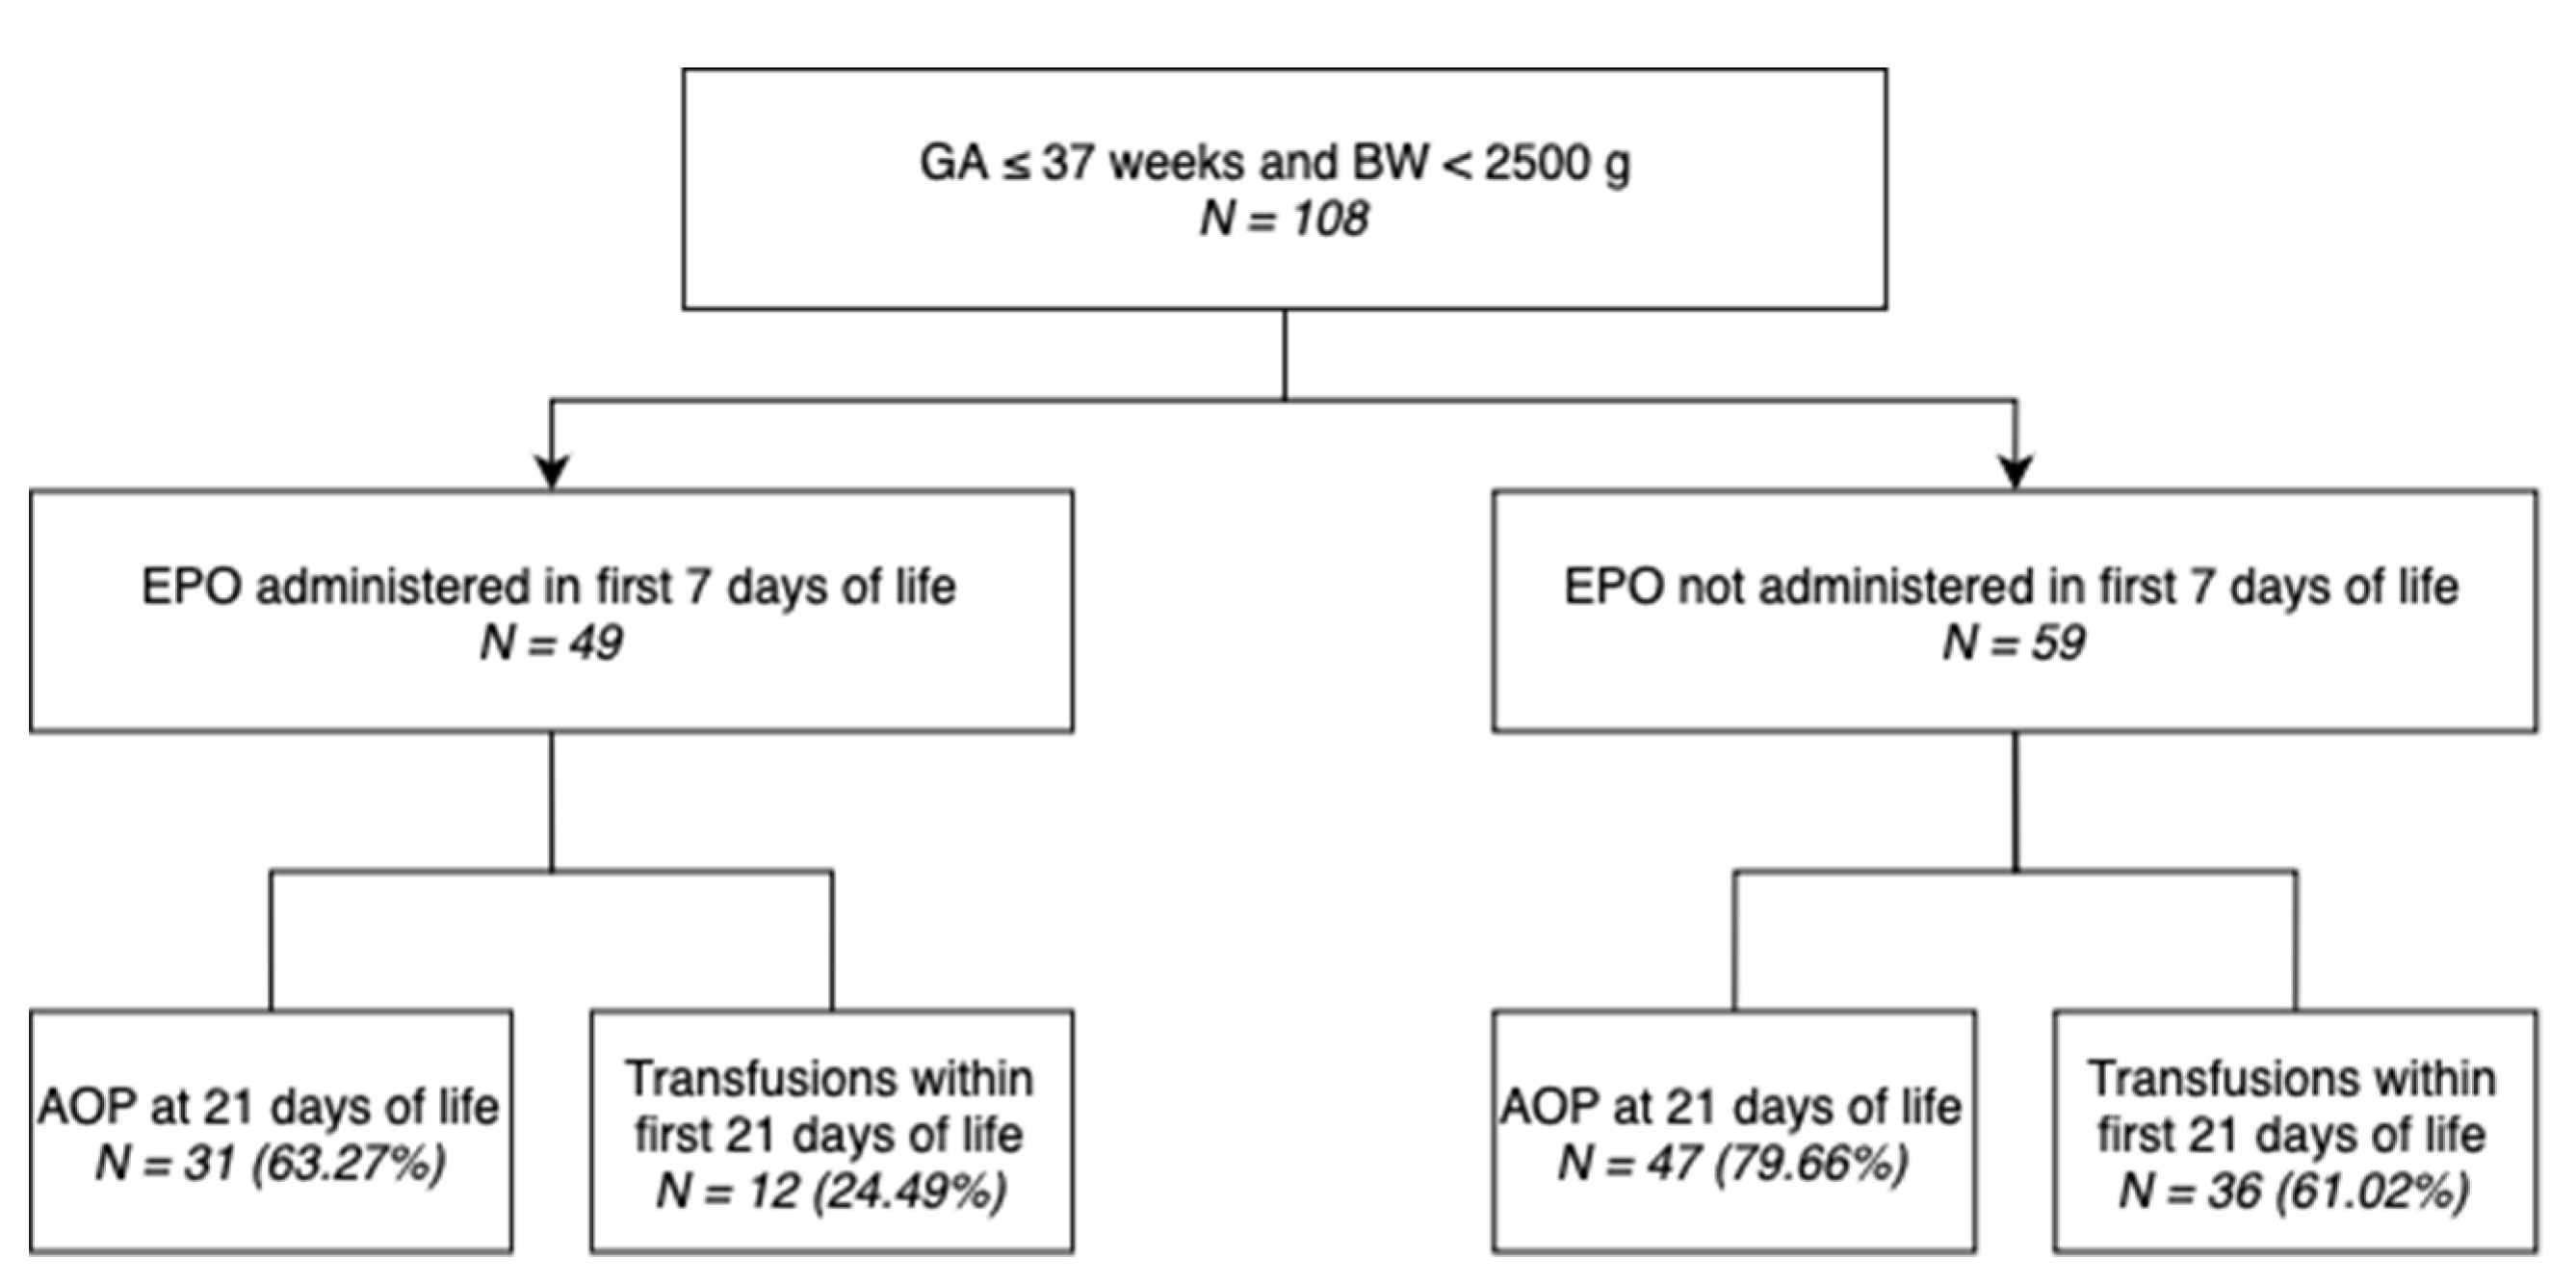
Figure 2.
Proportion of neonates with mild, moderate, severe, or no AOP at 21 days of life grouped by administration of EPO in the first 7 days of life. The proportion of neonates that had moderate AOP at 21 days of life is markedly higher in the group that did not undergo EPO administration.
Figure 2.
Proportion of neonates with mild, moderate, severe, or no AOP at 21 days of life grouped by administration of EPO in the first 7 days of life. The proportion of neonates that had moderate AOP at 21 days of life is markedly higher in the group that did not undergo EPO administration.
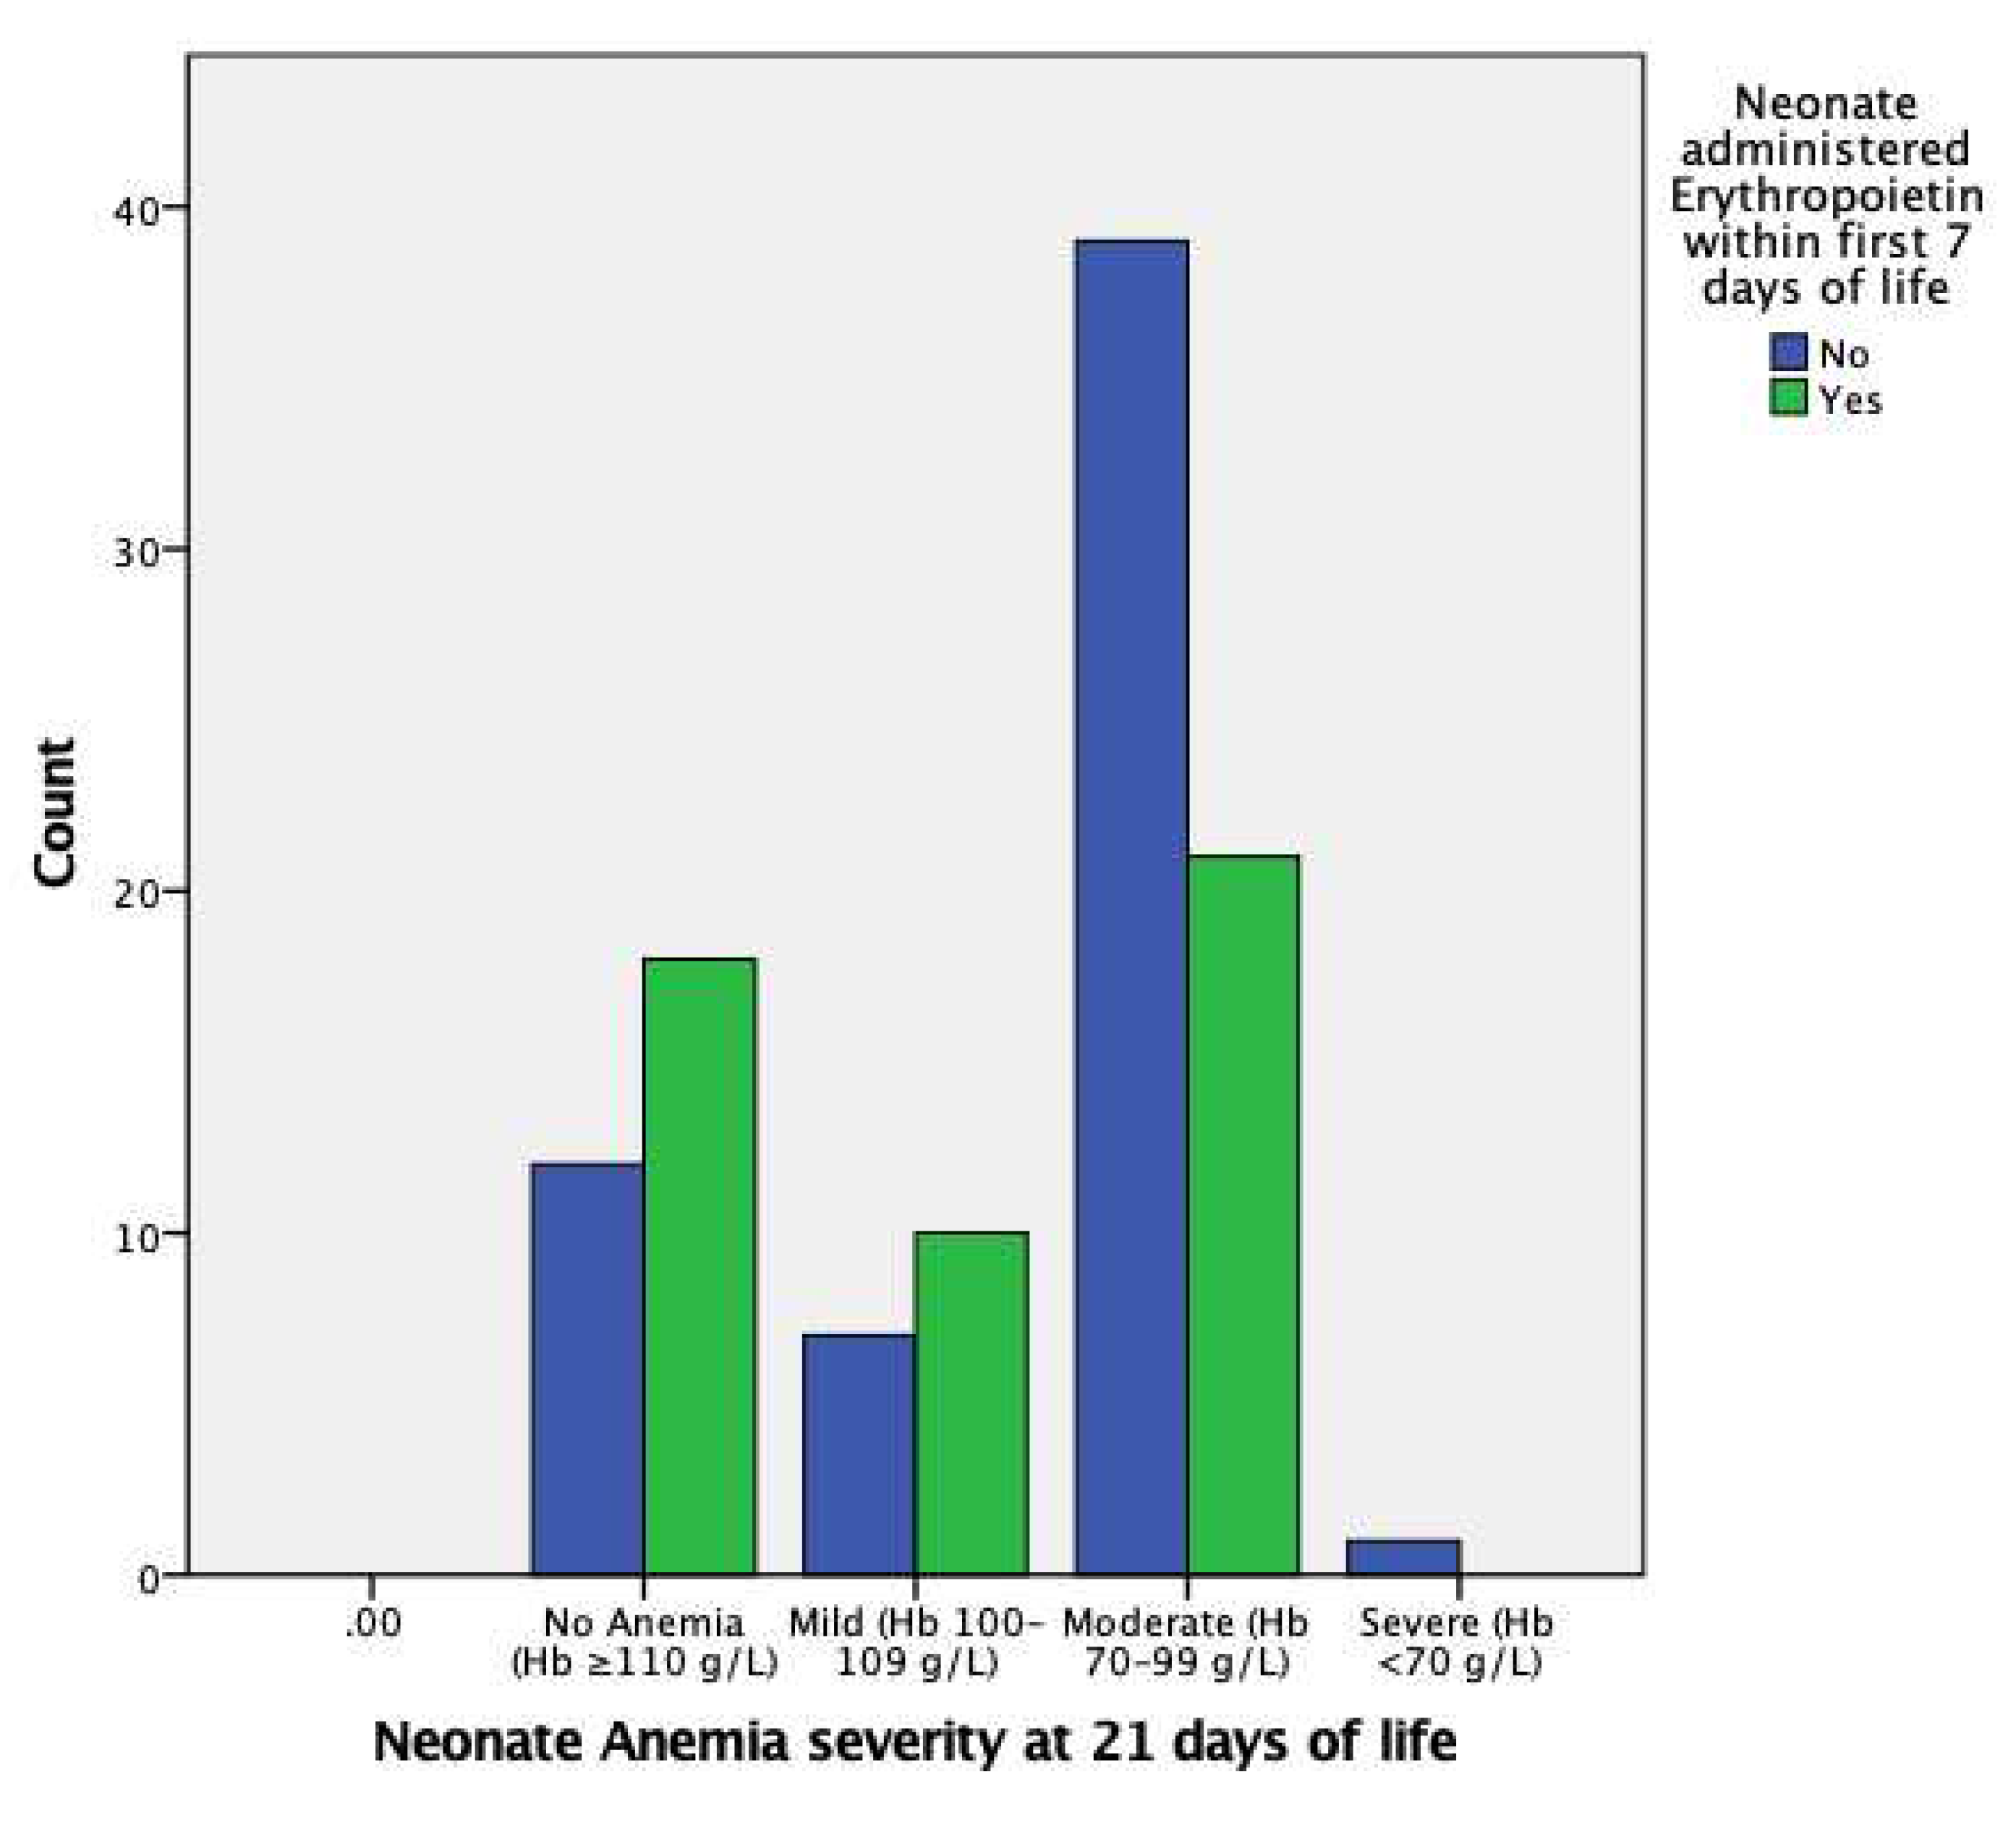

Table 1.
Distributions of AOP (any severity), mild AOP, moderate AOP, and severe AOP groups by perinatal characteristics.
Table 1.
Distributions of AOP (any severity), mild AOP, moderate AOP, and severe AOP groups by perinatal characteristics.
| AOP Severity at 21 days of life | |||||||||
|---|---|---|---|---|---|---|---|---|---|
| AOP at 21 days of life | Mild | Moderate | Severe | ||||||
| Subgrouping | Total Populati-on (n) | No. of Events | Percent with Events | No. of Events | Percent with Events | No. of Events | Percent with Events | No. of Events | Percent with Events |
| Total | 108 | 78 | 72.22% | 17 | 15.74% | 60 | 55.56% | 1 | 0.93% |
| Sex | |||||||||
| Male | 64 | 50 | 78.13% | 7 | 10.94% | 43 | 67.19% | 0 | 0.00% |
| Female | 44 | 28 | 63.64% | 10 | 22.73% | 17 | 38.64% | 1 | 2.27% |
| Gestational age (wks) | |||||||||
| 32–37 | 35 | 20 | 57.14% | 7 | 20.00% | 13 | 37.14% | 0 | 0.00% |
| 28–31 | 55 | 42 | 76.36% | 9 | 16.36% | 32 | 58.18% | 1 | 1.82% |
| <28 | 18 | 16 | 88.89% | 1 | 5.56% | 15 | 83.33% | 0 | 0.00% |
| Body Weight (g) | |||||||||
| 1500–2499 | 40 | 25 | 62.50% | 9 | 22.50% | 16 | 40.00% | 0 | 0.00% |
| 1000–1499 | 47 | 35 | 74.47% | 6 | 12.77% | 29 | 61.70% | 0 | 0.00% |
| <1000 | 21 | 18 | 85.71% | 2 | 9.52% | 15 | 71.43% | 1 | 4.76% |
| Apgar 1 min | |||||||||
| 7–10 | 52 | 34 | 65.38% | 6 | 11.54% | 28 | 53.85% | 0 | 0.00% |
| 4–6 | 34 | 26 | 76.47% | 8 | 23.53% | 17 | 50.00% | 1 | 2.94% |
| 0–3 | 22 | 18 | 81.82% | 3 | 13.64% | 15 | 68.18% | 0 | 0.00% |
| Apgar 5 min | |||||||||
| 7–10 | 62 | 43 | 69.35% | 10 | 16.13% | 33 | 53.23% | 0 | 0.00% |
| 4–6 | 45 | 34 | 75.56% | 7 | 15.56% | 26 | 57.78% | 1 | 2.22% |
| 0–3 | 1 | 1 | 100.00% | 0 | 0.00% | 1 | 100.00% | 0 | 0.00% |
| Normal LDH at 1 day of life (135–750 U/L) | |||||||||
| Yes | 60 | 42 | 70.00% | 12 | 20.00% | 30 | 50.00% | 0 | 0.00% |
| No | 48 | 36 | 75.00% | 5 | 10.42% | 30 | 62.50% | 1 | 2.08% |
| Normal aPTT at 1 day of life (23–35 s) | |||||||||
| Yes | 13 | 12 | 92.31% | 0 | 0.00% | 12 | 92.31% | 0 | 0.00% |
| No | 95 | 66 | 69.47% | 17 | 17.89% | 48 | 50.53% | 1 | 1.05% |
| Normal Prothrombin Time 1 day of life (11–14 s) | |||||||||
| Yes | 42 | 28 | 66.67% | 7 | 16.67% | 21 | 50.00% | 0 | 0.00% |
| No | 66 | 50 | 75.76% | 10 | 15.15% | 39 | 59.09% | 1 | 1.52% |
| Iron administered within 7–21 days of life | |||||||||
| Yes | 60 | 4 | 57.14% | 1 | 14.29% | 3 | 42.86% | 0 | 0.00% |
| No | 48 | 74 | 73.27% | 16 | 15.84% | 57 | 56.44% | 1 | 0.99% |
| AOP at 1 day of life | |||||||||
| Yes | 7 | 31 | 63.27% | 10 | 20.41% | 21 | 42.86% | 0 | 0.00% |
| No | 101 | 47 | 79.66% | 7 | 11.86% | 39 | 66.10% | 1 | 1.69% |
* Abbreviations: AOP, anemia of prematurity; LDH, lactate dehydrogenase; aPTT, activated partial thromboplastin time; EPO, erythropoietin.
Table 2.
Distributions of transfusion groups by perinatal characteristics.
| Transfusions within 21 days of life | |||
|---|---|---|---|
| Subgrouping | Total Population (n) | No. of Events | Percent with Events |
| Total | 108 | 48 | 44.44% |
| Sex | |||
| Male | 64 | 32 | 50.00% |
| Female | 44 | 16 | 36.36% |
| Gestational age (wks) | |||
| 32–37 | 35 | 8 | 22.86% |
| 28–31 | 55 | 26 | 47.27% |
| <28 | 18 | 14 | 77.78% |
| Body Weight (g) | |||
| 1500–2499 | 40 | 8 | 20.00% |
| 1000–1499 | 47 | 24 | 51.06% |
| <1000 | 21 | 16 | 76.19% |
| Apgar 1 min | |||
| 7–10 | 52 | 19 | 36.54% |
| 4–6 | 34 | 15 | 44.12% |
| 0–3 | 22 | 14 | 63.64% |
| Apgar 5 min | |||
| 7–10 | 62 | 24 | 38.71% |
| 4–6 | 45 | 23 | 51.11% |
| 0–3 | 1 | 1 | 100.00% |
| Normal LDH at 1 day of life (135–750 U/L) | |||
| Yes | 60 | 28 | 46.67% |
| No | 48 | 20 | 41.67% |
| Normal aPTT at 1 day of life (23–35 s) | |||
| Yes | 13 | 8 | 61.54% |
| No | 95 | 40 | 42.11% |
| Normal Prothrombin Time 1 day of life (11–14 s) | |||
| Yes | 42 | 17 | 40.48% |
| No | 66 | 31 | 46.97% |
| Iron administered within 7–21 days of life | |||
| Yes | 60 | 36 | 60.00% |
| No | 48 | 12 | 25.00% |
| AOP at 1 day of life | |||
| Yes | 7 | 5 | 71.43% |
| No | 101 | 43 | 42.57% |
| EPO administered in first 7 days | |||
| Yes | 49 | 12 | 24.49% |
| No | 59 | 36 | 61.02% |
* Abbreviations: LDH, lactate dehydrogenase; aPTT, activated partial thromboplastin time; AOP, anemia of prematurity; EPO, erythropoietin.
Table 3.
Differences in perinatal characteristics between neonates who underwent EPO administration in the first 7 days of life and those who did not.
Table 3.
Differences in perinatal characteristics between neonates who underwent EPO administration in the first 7 days of life and those who did not.
| Characteristics | EPO administered within 7 days of life (n = 49) | EPO not administered within 7 days of life (n = 59) | P value |
|---|---|---|---|
| Male | 26 (53.06%) | 38 (64.41%) | 0.169 |
| Female | 23 (46.94%) | 21 (35.59%) | 0.880 |
| GA, weeks | 29.71 ± 2.88 | 30.12 ± 2.31 | 0.420 |
| BW, g | 1365.41 ± 470.54 | 1405.15 ± 397.38 | 0.635 |
| Apgar score at 1 min | 5.80 ± 2.04 | 5.53 ± 2.51 | 0.538 |
| Apgar score at 5 min | 6.53 ± 1.66 | 6.58 ± 1.38 | 0.876 |
| Hb at 1 day of life, g/dL | 15.52 ± 3.23 | 15.22 ± 2.51 | 0.585 |
| HCT at 1 day of life, % | 46.01 ± 6.96 | 43.72 ± 6.77 | 0.086 |
| RBC count at 1 day of life, million/μL | 4.28 ± 0.63 | 4.13 ± 0.63 | 0.214 |
| aPTT at 1 day of life, s | 56.06 ± 37.75 | 52.83 ± 19.60 | 0.569 |
| PT at 1 day of life, s | 15.78 ± 5.43 | 16.36 ± 4.42 | 0.541 |
| LDH at 1 day of life, U/L | 726.67 ± 368.84 | 804.62 ± 396.23 | 0.296 |
| Serum EPO at 1 day of life, mIU/mL | 2.25 ± 1.06 | 9.41 ± 5.00 | <0.001 |
| AOP at 1 day of life | 4 (8.16%) | 3 (5.08%) | 1.000 |
1 Abbreviations: EPO, erythropoietin; GA, gestational age; BW, body weight; Hb, hemoglobin; HCT, hematocrit; RBC, red blood cell; aPTT, activated partial thromboplastin time; PT, prothrombin time; LDH, lactate dehydrogenase; AOP, anemia of prematurity. 2 The above categorical and continuous data are displayed as n (%) or means ± SD, respectively.
Table 4.
Univariate comparison of perinatal characteristics in infants who developed AOP (any severity) at 21 days of life and those who did not.
Table 4.
Univariate comparison of perinatal characteristics in infants who developed AOP (any severity) at 21 days of life and those who did not.
| Characteristics | Without AOP at 21 days of life (n = 30) | With AOP at 21 days of life (n = 78) | P value |
|---|---|---|---|
| Male | 14 (46.67%) | 50 (64.10%) | <0.001 |
| Female | 16 (53.33%) | 28 (35.90%) | 0.097 |
| GA, weeks | 30.90 ± 2.26 | 29.56 ± 2.61 | <0.05 |
| BW, g | 1526.83 ± 434.50 | 1333.38 ± 419.38 | <0.05 |
| Apgar score at 1 min | 6.27 ± 1.95 | 5.41 ± 2.39 | 0.083 |
| Apgar score at 5 min | 6.97 ± 1.56 | 6.40 ± 1.46 | 0.078 |
| Hb at 1 day of life, g/dL | 16.46 ± 3.01 | 14.94 ± 2.68 | <0.05 |
| HCT at 1 day of life, % | 47.00 ± 8.56 | 43.90 ± 6.02 | <0.05 |
| RBC count at 1 day of life, million/μL | 4.48 ± 0.76 | 4.09 ± 0.54 | <0.01 |
| aPTT at 1 day of life, s | 58.76 ± 47.02 | 52.58 ± 18.39 | 0.326 |
| PT at 1 day of life, s | 15.01 ± 4.45 | 16.52 ± 5.01 | 0.151 |
| LDH at 1 day of life, U/L | 808.17 ± 445.65 | 754.29 ± 359.95 | 0.517 |
| Serum EPO at 1 day of life, mIU/mL | 4.77 ± 4.05 | 6.70 ± 5.49 | 0.083 |
| Iron administered during 7th–21st day of life | 12 (40.00%) | 48 (61.54%) | <0.001 |
| EPO administered in first 7 days of life | 3 (10.00%) | 4 (5.13%) | 0.058 |
1 Abbreviations: AOP, anemia of prematurity; GA, gestational age; BW, body weight; Hb, hemoglobin; HCT, hematocrit; RBC, red blood cell; aPTT, activated partial thromboplastin time; PT, prothrombin time; LDH, lactate dehydrogenase; EPO, erythropoietin. 2 The above categorical and continuous data are displayed as n (%) or means ± SD, respectively.
Table 5.
Univariate comparison of perinatal characteristics in infants who required transfusions within the first 21 days of life and those who did not.
Table 5.
Univariate comparison of perinatal characteristics in infants who required transfusions within the first 21 days of life and those who did not.
| Characteristics | Transfusions not required in first 21 days of life (n = 60) | Transfusions required in first 21 days of life (n = 48) | P value |
|---|---|---|---|
| Male | 32 (53.30%) | 32 (66.67%) | 1.000 |
| Female | 28 (46.67%) | 16 (33.30%) | 0.970 |
| GA, weeks | 30.87 ± 2.31 | 28.77 ± 2.44 | <0.001 |
| BW, g | 1539.75 ± 423.64 | 1196.33 ± 360.12 | <0.001 |
| Apgar score at 1 min | 6.08 ± 2.00 | 5.10 ± 2.55 | <0.05 |
| Apgar score at 5 min | 6.80 ± 1.49 | 6.25 ± 1.48 | 0.059 |
| Hb at 1 day of life, g/dL | 16.16 ± 2.88 | 14.36 ± 2.49 | <0.01 |
| HCT at 1 day of life, % | 47.15 ± 5.96 | 41.76 ± 6.92 | <0.001 |
| RBC count at 1 day of life, million/μL | 4.42 ± 0.54 | 3.93 ± 0.64 | <0.001 |
| aPTT at 1 day of life, s | 53.72 ± 34.14 | 55.02 ± 21.71 | 0.819 |
| PT at 1 day of life, s | 15.77 ± 4.75 | 16.51 ± 5.07 | 0.432 |
| LDH at 1 day of life, U/L | 783.17 ± 371.03 | 751.88 ± 403.45 | 0.676 |
| Serum EPO at 1 day of life, mIU/mL | 4.28 ± 2.91 | 8.51 ± 6.35 | <0.001 |
| EPO administered in first 7 days of life | 37 (61.67%) | 12 (25.00%) | <0.01 |
1 Abbreviations: AOP, anemia of prematurity; GA, gestational age; BW, body weight; Hb, hemoglobin; HCT, hematocrit; RBC, red blood cell; aPTT, activated partial thromboplastin time; PT, prothrombin time; LDH, lactate dehydrogenase; EPO, erythropoietin. 2 The above categorical and continuous data are displayed as n (%) or means ± SD, respectively.
Table 6.
Univariate binary logistic regression analysis results of factors potentially associated to AOP.
Table 6.
Univariate binary logistic regression analysis results of factors potentially associated to AOP.
| Characteristics | OR (95% CI) | P value | AOP Incidence rate* |
|---|---|---|---|
| Sex, male/female | 0.490 (0.209–1.150) | 0.101 | 78.13%/63.64% |
| GA | 0.802 (0.668–0.963) | <0.05 | |
| BW | 0.999 (0.999–1.000) | <0.05 | |
| Apgar score at 1 min | 0.836 (0.680–1.026) | 0.087 | |
| Apgar score at 5 min | 0.765 (0.566–1.034) | 0.081 | |
| Hb at 1 day of life | 0.776 (0.635–0.949) | <0.05 | |
| HCT at 1 day of life | 0.930 (0.868–0.997) | <0.05 | |
| RBC count at 1 day of life | 0.316 (0.139–0.716) | <0.01 | |
| aPTT at 1 day of life | 0.993 (0.980–1.007) | 0.356 | |
| PT at 1 day of life | 1.083 (0.970–1.208) | 0.155 | |
| LDH at 1 day of life | 1.000 (0.999–1.001) | 0.514 | |
| Serum EPO at 1 day of life | 1.093 (0.986–1.212) | 0.090 | |
| Iron administered during 7th–21st day of life, yes/no | 2.400 (1.014–5.678) | <0.05 | 80.00%/62.50% |
| EPO administered in first 7 days of life, yes/no | 0.440 (0.186–1.039) | 0.061 | 63.27%/79.66% |
1 Abbreviations: OR, odds ratio; AOP, anemia of prematurity; GA, gestational age; BW, body weight; Hb, hemoglobin; HCT, hematocrit; RBC, red blood cell; aPTT, activated partial thromboplastin time; PT, prothrombin time; LDH, lactate dehydrogenase; EPO, erythropoietin. 2 ORs are displayed as crude values and include only the first subcategory in case of sex, iron administration, and EPO administration, all dichotomous variables. * Incidence rate of AOP among neonates if their sex was male/female and if they underwent/did not undergo iron administration during the 7th to 21st day of life and EPO administration within the first 7 days of life.
Table 7.
Univariate binary logistic regression analysis results of factors potentially associated to transfusion administration.
Table 7.
Univariate binary logistic regression analysis results of factors potentially associated to transfusion administration.
| Characteristics | OR (95% CI) | P value | Transfusion Incidence rate* |
|---|---|---|---|
| Sex, male/female | 1.750 (0.798–3.840) | 0.163 | 50.00%/36.36% |
| GA | 0.694 (0.578–0.833) | <0.001 | |
| BW | 0.998 (0.997–0.999) | <0.001 | |
| Apgar score at 1 min | 0.827 (0.696–0.982) | <0.05 | |
| Apgar score at 5 min | 0.779 (0.599–1.012) | 0.062 | |
| Hb at 1 day of life | 0.762 (0.640–0.907) | <0.01 | |
| HCT at 1 day of life | 0.873 (0.812–0.938) | <0.001 | |
| RBC count at 1 day of life | 0.230 (0.105–0.502) | <0.001 | |
| aPTT at 1 day of life | 1.002 (0.989–1.015) | 0.818 | |
| PT at 1 day of life | 1.032 (0.954–1.117) | 0.432 | |
| LDH at 1 day of life | 1.000 (0.999–1.001) | 0.673 | |
| Serum EPO at 1 day of life | 1.230 (1.103–1.372) | <0.001 | |
| EPO administered in first 7 days of life, yes/no | 0.207 (0.090–0.478) | <0.001 | 24.49%/61.02% |
1 Abbreviations: OR, odds ratio; GA, gestational age; BW, body weight; Hb, hemoglobin; HCT, hematocrit; RBC, red blood cell; aPTT, activated partial thromboplastin time; PT, prothrombin time; LDH, lactate dehydrogenase; EPO, erythropoietin. 2 ORs are displayed as crude values and include only the first subcategory in case of sex, iron administration, and EPO administration, all dichotomous variables. * Incidence rate of transfusions among neonates if their sex was male/female and if they underwent/did not undergo iron administration during the 7th to 21st day of life and EPO administration within the first 7 days of life.
Table 8.
Multivariate binary logistic regression analysis results of factors potentially associated to AOP (any severity).
Table 8.
Multivariate binary logistic regression analysis results of factors potentially associated to AOP (any severity).
| Characteristics | AOR (95% CI) | P value |
|---|---|---|
| GA | 0.952 (0.706–1.283) | 0.745 |
| BW | 0.999 (0.998–1.001) | 0.401 |
| Hb at 1 day of life | 0.669 (0.295–1.515) | 0.335 |
| HCT at 1 day of life | 1.170 (0.864–1.585) | 0.310 |
| RBC count at 1 day of life | 0.351 (0.073–1.698) | 0.193 |
| Iron administration during 7th–21st day of life | 2.749 (1.064–7.106) | <0.05 |
1 Abbreviations: AOR, adjusted odds ratio; GA, gestational age; BW, body weight; Hb, hemoglobin; HCT, hematocrit; RBC, red blood cell. 2 ORs are displayed as adjusted values and include only the first subcategory (yes) in case of iron administration.
Table 9.
Comparisons between neonates with an absence of AOP in all stages and those with mild, moderate, and severe AOP.
Table 9.
Comparisons between neonates with an absence of AOP in all stages and those with mild, moderate, and severe AOP.
| Characteristics | OR (95% CI) | P value |
|---|---|---|
| Mild AOP | ||
| GA | 1.087 (0.719–1.644) | 0.691 |
| BW | 1.000 (0.998–1.002) | 0.908 |
| Hb at 1 day of life | 0.640 (0.270–1.519) | 0.312 |
| HCT at 1 day of life | 1.194 (0.854–1.671) | 0.300 |
| RBC count at 1 day of life | 0.271 (0.031–2.345) | 0.236 |
| Iron administered during 7th–21st day of life | 1.348 (0.373–4.880) | 0.649 |
| Moderate AOP | ||
| GA | 0.912 (0.667–1.247) | 0.564 |
| BW | 0.999 (0.997–1.001) | 0.285 |
| Hb at 1 day of life | 0.704 (0.307–1.614) | 0.407 |
| HCT at 1 day of life | 1.154 (0.847–1.571) | 0.364 |
| RBC count at 1 day of life | 0.366 (0.071–1.879) | 0.228 |
| Iron administered during 7th–21st day of life | 3.564 (1.279–9.927) | 0.015 |
| Severe AOP* |
1 Abbreviations: OR, adjusted odds ratio; GA, gestational age; BW, body weight; Hb, hemoglobin; HCT, hematocrit; RBC, red blood cell. 2 ORs are displayed as adjusted values and include only the first subcategory (yes) in case of iron administration. * Analysis could not be performed due to lack of data, i.e., only one neonate presented severe AOP at 21 days of life.
Table 10.
Multivariate binary logistic regression analysis results of factors potentially associated to transfusion administration.
Table 10.
Multivariate binary logistic regression analysis results of factors potentially associated to transfusion administration.
| Characteristics | AOR (95% CI) | P value |
|---|---|---|
| GA | 0.864 (0.619–1.204) | 0.387 |
| BW | 0.998 (0.996–1.000) | 0.050 |
| Apgar score at 1 min | 0.913 (0.714–1.167) | 0.467 |
| Hb at 1 day of life | 0.850 (0.581–1.243) | 0.401 |
| HCT at 1 day of life | 0.944 (0.785–1.136) | 0.544 |
| RBC count at 1 day of life | 0.695 (0.134–3.611) | 0.665 |
| Serum EPO at 1 day of life | 1161 (0.964–1.398) | 0.117 |
| EPO administered in first 7 days of life, yes/no | 0.236 (0.042–1.333) | 0.102 |
1 Abbreviations: AOR, adjusted odds ratio; GA, gestational age; BW, body weight; Hb, hemoglobin; HCT, hematocrit; RBC, red blood cell. 2 ORs are displayed as adjusted values and include only the first subcategory (yes) in case of iron administration.
Table 11.
ANCOVA results showing percentage of variance in Hb, HCT, and serum EPO levels at 21 days of life explained by EPO administration in the first 7 days of life and the respective statistical significance.
Table 11.
ANCOVA results showing percentage of variance in Hb, HCT, and serum EPO levels at 21 days of life explained by EPO administration in the first 7 days of life and the respective statistical significance.
| Hb level at 21 days of life | HCT level at 21 days of life | Serum EPO at 21 days of life | ||
| EPO administration in first 7 days of life | Percentage of variance explained | 10** | 6.7** | 20.1** |
| p-value | <0.01 | <0.05 | <0.001 | |
** Result is statistically significant, p<0.05.
Disclaimer/Publisher’s Note: The statements, opinions and data contained in all publications are solely those of the individual author(s) and contributor(s) and not of MDPI and/or the editor(s). MDPI and/or the editor(s) disclaim responsibility for any injury to people or property resulting from any ideas, methods, instructions or products referred to in the content. |
© 2023 by the authors. Licensee MDPI, Basel, Switzerland. This article is an open access article distributed under the terms and conditions of the Creative Commons Attribution (CC BY) license (http://creativecommons.org/licenses/by/4.0/).
Copyright: This open access article is published under a Creative Commons CC BY 4.0 license, which permit the free download, distribution, and reuse, provided that the author and preprint are cited in any reuse.


