
Submitted:
09 October 2023
Posted:
11 October 2023
You are already at the latest version
Abstract
In this study, we have included the water footprint (WF) in the process of optimising animal feed rations. The global footprint of cattle production accounts for the largest share (33%) of the global water footprint of livestock production. Using two homogeneous groups of Limousine Podolian young bulls, two different diets were compared: corn silage feeding (CSF), with corn silage-based diet; and the triticale silage feeding (TSF), with triticale silage-based diet. Silage constituted about 41% and 46% of the feed composition (for CSF and TSF, respectively). Diets were characterised by the same energy and protein content. Despite the lower WF in the TSF group than in the CSF group (7726 vs 8571 l/day/calf respectively), no significant differences were found in animal performances (i.e., daily weight gain and final weight), feed conversion and income over feed costs. These results show that simple production decisions can have a significant impact on water resource. Therefore, the use of triticale silage should be further promoted, especially in world regions with limited water resources where low WF feed formulation is more strategic than elsewhere.
Keywords:
Limousine Podolian young bulls
; beef production
; feeding efficiency
; water footprint
1. Introduction
Our dependence on water resources will increase significantly in the future, posing problems for future food security and environmental sustainability [1,2,3]. The relationship between the freshwater resource and human productive activities, the Water Footprint Assessment (WFA), was developed to assess the amount of water consumed and water polluted. This concept was introduced by Hoekstra [4] and then elaborated and validated by Chapagain and Hoekstra [5]. Cattle farming accounts for the largest share (33%) of the global water footprint of livestock production, followed by pigs (19%), dairy cows (19%) and poultry (11%) [6,7]. Poultry has indeed proven to be the most efficient livestock sub-sector in terms of utilising natural resources and providing protein to meet growing global demand [8], requiring 11 times less feed (in dry matter) than beef production [6]. The feeding of cattle has a fundamental function in the economic and technical efficiency of livestock farming and accounts for about 60% of total costs. Its production requires and pollutes large amounts of water, especially for the production of feed [9,10,11]. Feed composition of the is one of the most important factors directly affecting feed conversion in terms of farm income [12,13,14]. Water footprint is inversely related to feed conversion efficiency. Therefore, in order to maximise feed conversion efficiency, barn income must be increased and water footprint reduced [15]. In this view, the present study investigated the effect of replacing corn silage with triticale silage in the diet of Limousine × Podolian young bulls.
2. Materials and Methods
The trial was conducted on a farm in the Basilicata region, Italy, at an altitude of 600 m a.s.l. with 40 Limousine x Podolian young bulls. Podolian cattle are an autochthonous breed belonging to the Hungarian Grey Steppe group and are reared in southern Italy [16]. They are often crossed with specialized breeds to maximise meat production. During the experimental period, the animals, ageing 130 ± 11 days, were kept in two different boxes with straw bedding (8.5 m2/head) in the same barn. Their initial average weight (mean ± SE) was 347.4 ± 0.741 kg in group 1 and 341.3 ± 0.636 kg in group 2. The manure management system used on the farm is the liquid/slurry, where the manure is stored in the excreted form or with a minimal addition of water either in tanks or earthen ponds outside the barn, usually for a period of less than one year.
2.1. Diet composition and feeding
Two different diets were used: Corn Silage Feed (CSF) for group 1 and Triticale Silage Feed (TSF) for group 2. Triticale has a biological cycle that develops during the cold season (maize microtherm) and prefers high temperatures at the end of its cycle, therefore the WF is lower than maize, which shows an opposite behaviour in terms of heat and water requirements. The diets were formulated to be isoenergetic (0.90 UFV kg DM, 1 UFV 1820 kcal net energy) [17], with the same concentration of crude protein, crude fibre, starch and with the same feed cost. Feeding was administered using the Total Mixed Ration (TMR) method [18,19] according to the composition given in Table 1. The TMR was sampled monthly and using a NIRSYSTEM 5000 (Foss, Hillerød, Denmark) the following parameters were analysed: dry matter (DM), crude protein (CP), crude fiber (CF), neutral detergent fiber (NDF), acid detergent fiber (ADF), acid detergent lignin (ADL), ether extract (EE), ash and starch. The percentage of energy and PDI requirements of cattle were calculated according to the method proposed by Garcia et al. [20]. TMR was administered ad libitum to each group. Feed intake and feed refusal were measured every 14 days for each experimental group. There were no individual measurements of feed intake as the young bulls of each group were housed in the same box. The average feed intake for the group was calculated every 14 days according to the following relationship:
Average daily feed intake (g/d) = (Total feed administered – Total feed refusal) / 20.
2.2. Live Weight and Daily Weight Gain
Live Weight (LW) was measured every 14 days (approximately 6 hours after administration of the daily ration) and Average Daily Gain (ADG) in each period was calculated.
2.3. Feed Conversion ratio and Income Over Feed Cost
The assessment of the technical and economic feed rations given to each group during the experimental period was done by calculating, in each interval of 14 days, Feed Conversion ratio (FCR) and Income Over Feed Cost (IOFC). FCR is defined as consumed kg DM/kg LW produced and is used to evaluate the effects of feed quality, environment and management practises on production efficiency in cattle rearing and fattening [21]. The IOFC measures the difference between the production meat value and the feed cost and was calculated according to the following formula proposed by Bailey et al. [22]:
IOFC = PLW *DWG – DFC, where:
PLW = farm-gate price of calf live weight (€/kg); DWG= daily weight gain (kg/d); DFC = daily feed cost (€/head);
2.4. Water footprint estimation
The WF of the Live Weight Gain was calculated by adding feed WF (water for feed production), feed mix WF (water for feed mix), drinking WF (water intake) and service WF (water for cleaning the pen) according to the following formula [5,23]:
WFA meat = WF feed + WF feed mixing + WF drinking + WF service
Green, blue and grey water were estimated during the experimental period for indirect and direct water footprint and live weight gain in kg. The green water footprint refers to soil moisture generated by evaporation of precipitation and used for crop production or moisture present in the product. The blue water footprint refers to evaporated surface or groundwater that enters the product or is reused elsewhere. The grey water footprint is defined as the amount of freshwater required to assimilate the pollutant load based on existing water quality standards [24]. Data from the literature were used to calculate the indirect water footprint of the feed used for both forages [6], while the other fractions (watering, mixing and service) were assessed on the farm using a mechanical water metre. The water used for mixing the animal feed was added to the blue water component in the feed ration.
2.5. Statistical analysis
Data were expressed as mean ± SE and differences between groups were tested by Student’s t-test.
3. Results and discussions
No significant differences were found between the groups in the daily intake of DM. The intake of DM throughout the trial period was 8.00 kg/day for the SF group and 7.80 kg/day for the AF (Table 2).
The CSF and TSF groups achieved 596.43 and 585.91 kg LW and 1,365 and 1,341 kg/day DWG, respectively (Table 3). No significant differences were found between the two groups in terms of final LW and DWG.
Over the entire experimental period, FCR was 5.896 for the SF group and 5.857 for the AF group (Table 4).
During the same period, the income over feed cost (PLW = 3.50 €/kg LW; DFC = 0.420 €/kg DM * DM daily intake) 1.418 €/day in both groups over the whole experimental period was (Table 5).
The average water footprint of the ADG calculated over the whole experimental period was 6221.29 L in the CSF group and 5703.60 L in the TSF group. Therefore, the WF difference per kg LWG was 517.70 L between the two groups (Figure 1). The daily average intake of green, blue and grey water in the groups CSF and TSF was 76.09%, 13.59%, 10.32% and 82.45%, 6.37%, 11.18%, respectively. Gerbens-Leenes et al. [10], in a study on WF industrial beef production in four countries, report values (L/kg LW) in the interval 4000-5000 in NL and USA, and close to 9000 in Brazil and 13000 in China. This study illustrated also that choosing feed ingredients and sourcing wisely, and particularly substituting crops with co-products or crop residues, will help to improve the WP of livestock products, thus reducing the pressure the sector puts on scarce water resources. Highest total WF for beef production was instead evidenced in Brazil by Palhares et al. [25] with values ranging from 9249 to 23521 L/kg LW. In another study in Arcadia Valley (MO-USA) Eady et al. [26] compared two rearing forms in beef cattle production 634-cow enterprise turning off weaner cattle and 720-cow enterprise turning off finished cattle, green water use ranged from 7400 to 12700 L/kg LW depending on class of livestock, with on-farm blue water use of 51-96 L/kg liveweight and off-farm blue water use of 0.1-59 L/kg LW.
The percentage of WF in the consumed feed components observed during the trial period was similar to the data reported by Hoekstra et. al (2011) [23] for industrially bred cattle. As shown in Table 6, the percentage of WF feed was higher in the CSF group than in the TSF group (8471 vs 7726), as there was a relevant water saving (745 L per bovine per day) in the TSF group.
According to Mekonnen and Hoekstra [6], feed consumption accounts for the largest share of water consumption in livestock production (98.83% and 98.70% in our study, in TSF and AF respectively), while the share of drinking, industrial and mixed water is quite low for both types of feed administration (< 3%). Mourad et al. [27] observed a mean percentage of water allocation for WF of 98.3% in the central and north-eastern region of Africa. Given the many variables involved in determining WF, it has been suggested by various authors [25,28] that general recommendations cannot be made on a large scale, e.g., to formulate policy recommendations, but only for individual operations. Furthermore, Broom [29], in a study that considered land use and conserved water data from different parts of the world, showed the large impact of farming systems on water resource use and the need to consider all systems when considering the impact of beef or other products on the global environment.
4. Conclusions
The use of triticale silage in the diet instead of corn, when properly optimised, showed a lower water footprint in meat production, while maintaining the same technical and economic efficiency as feeding corn silage to cattle. These results confirm the possibility of including the water footprint parameter in ration optimisation and show that simple production decisions can have a significant impact on water resources.
This study used data collected at the regional level, the use of which, rather than national average data for food ingredient production characteristics, provides a more accurate estimate of water resource impacts in beef production. One criticism of the present study could be that it was conducted for a single beef production system. The organization of primary data from individual studies into databases and expanding WF studies for the beef product, will contribute to a better understanding of how water efficiency can be improved in this sector through a bottom-up approach.
Author Contributions
Conceptualization, C.C., F.A. and P.F.; methodology, F.A.; software, R.P.; validation, C.C. and S.T.; formal analysis, C.C.; investigation, R.P., E.S. and F.A.; resources, C.C.; data curation, S.T., C.P. and E.S.; writing—original draft preparation, R.P.; writing—review and editing, F.A.; visualization, S.T.; supervision, C.C., C.P. and F.P.; project administration, C.C.; funding acquisition, C.C. All authors have read and agreed to the published version of the manuscript.
Funding
This research received no external funding.
Data Availability Statement
Data are available on request.
Conflicts of Interest
The authors declare no conflict of interest.
References
- Alcamo, J.; Döll, P.; Henrichs, T.; Kaspar, F.; Lehner, B.; Rösch, T.; Siebert, S. Development and testing of the WaterGAP 2 global model of water use and availability. Hydrol. Sci. J. 2003, 48, 317–337. [Google Scholar] [CrossRef]
- Rosegrant, M.W.; Ringler, C.; Zhu, T. Water for agriculture: maintaining food security under growing scarcity. Annu. Rev. Environ. Resour., 2009, 34, 205–22. [Google Scholar] [CrossRef]
- Rosegrant, M.W.; Cai, X.; Cline, S.A. . Global water outlook to 2025. Averting an Impending Crisis. International Food Policy Research Institute: Washington. D.C. USA, 2002; pp. 12–24. https://core.ac.uk/download/pdf/6289055.pdf. (accessed on 28 May 2023).
- Hoekstra, A.Y. Virtual water: An introduction. In Proceedings of the International Expert Meeting on Virtual Water Trade. Delft, The Netherlands. 12 and 13 December 2002; Hoekstra, A.Y. Ed. UNESCO-IHE: Delft, The Netherlands, 2003 www.waterfootprint.org/Reports/Report12.pdf. (accessed on 28 May 2023).
- Chapagain, A.K.; Hoekstra, A.Y. Virtual Water Flows Between Nations in Relation to Trade in Livestock and Livestock Products. Value of Water Research Report. UNESCO-IHE. Delft, The Netherlands, 2003. pp. 11–30. https://www.waterfootprint.org/resources/Report13.pdf. (accessed on 14 April 2023).
- Mekonnen, M.M.; Hoekstra, A.Y. A global assessment of the water footprint of farm animal products. Ecosystems, 2012, 15, 401–415. [Google Scholar] [CrossRef]
- Mekonnen, M.M.; Neale, C.M.U; Ray, C.; Erickson, G.E.; Hoekstra, A.Y. Water producivity in meat an milk production in the US from 1960 to 2016. Environ. Int., 2019, 132, 105084. [CrossRef]
- Mottet, A.; de Haan, C.; Falcucci, A.; Tempio, G.; Opio, C.; Gerber, P. Livestock: on our plates or eating at our table? A new analysis of the feed/food debate. Glob. Food Sec., 2017, 14, 1–8. [Google Scholar] [CrossRef]
- De Fraiture. C.; Wichelns, D.; Rockström, J.; Kemp-Benedict, E.; Eriyagama, N.; Gordon, L.J.; Hanjra, M.A.; Hoogeveen, J.; Huber-Lee, A.; Karlberg, L. Looking ahead to 2050: scenarios of alternative investment approaches. In Water for Food, Water for Life: A Comprehensive Assessment of of Water Management in Agriculture; Molden D., Ed.; International Water Management Institute: Colombo; London, UK, 2007; pp. 91–145.
- Gerbens-Leenes, P.W.; Mekonnen, M.M.; Hoekstra, A.Y. The water footprint of poultry, pork and beef: A comparative study in different countries and production systems. Water Resour. Ind., 2013, 1–2, 25–36. [CrossRef]
- Ridoutt, G.; Sanguansri, P.; Nolan, M.; Marks, N. Meat consumption and water scarcity: beware of generalizations, J. Clean. Prod., 2012, 28, 127–133. [Google Scholar] [CrossRef]
- Adduci, F.; Labella, C.; Musto, M.; D’Adamo, C.; Freschi, P.; Cosentino, C. Use of Technical and Economical Parameters for Evaluating Dairy Cow Ration Efficiency. Ital. J. Agron. 2015, 10, 202–207. [Google Scholar] [CrossRef]
- Campiotti, M. Sistemi pratici per fare più reddito in stalla. Informatore agrario, 2005, 3, 27–33.
- Cosentino, C.; Adduci, F.; Musto, M.; Paolino, R.; Freschi, P.; Pecora, G.; D’Adamo, C.; Valentini, V. Low vs high "water footprint assessment" diet in milk production: A comparison between triticale and corn silage based diets. Emir. J. Food Agric., 2015, 27(3): 312-317.
- Zhang, H.; Zhuo, L.; Xie, D.; Liu, Y.; Gao, J.; Wang, W.; Li, M.; Wu, A.; Wu, P. Water footprints and efficiencies of ruminant animals and products in China over 2008–2017. J. Clean. Prod., 2022, 379, 134624. [Google Scholar] [CrossRef]
- Tarricone, S.; Colonna, M.A.; Giannico, F.; Facciolongo, A.M.; Caputi Jambrenghi, A.; Ragni, M. Effects of dietary extruded linseed (Linum usitatissumum L.) on performance and meat quality in Podolian young bulls. S. Afr. J. Anim. Sci., 2019, 49, 781–789. [Google Scholar] [CrossRef]
- Lanzas, C.; Sniffen, C.J.; Seo, S.; Tedeschi, L.O.; Fox, D.G. A revised CNCPS feed carbohydrate fractionation scheme for formulating rations for ruminants. Anim. Feed Sci. Technol., 2007, 136, 167–190. [Google Scholar] [CrossRef]
- Koch, C.; Schönleben, M.; Mentschel, J.; Göres, N.; Fissore, P.; Cohrs, I.; Sauerwein, H.M.; Ghaffari, H. Growth performance and economic impact of Simmental fattening bulls fed dry or corn silage-based total mixed rations, Animals, 2023. 17(4): 100762. [CrossRef]
- Schingoethe, D.J. A 100-Year Review: Total mixed ration feeding of dairy cows. J. Dairy Sci., 2017, 100, 10143–10150. [Google Scholar] [CrossRef] [PubMed]
- Garcia, F.; Agabriel, J.; Micol, D. Alimentation des bovines in en croissance et à l’engrais. In Alimentation des bovins, ovins et caprins. Besoins des animaux- Valeurs des aliments. Table INRA; Editions Quae, Paris, France, 2010, pp. 91–122. Available online: http://www.civamad53.org/wp-content/uploads/2020/12/Tables-INRA.pdf (accessed on 2 September 2023).
- Fox, D.G.; Tedeschi, L.O.; Guiroy, P.J. 2001. Determining feed intake and feed efficiency of individual cattle fed in groups. Cornell University, Ithaca, NY, USA. https://www.researchgate.net/publication/253681583 (accessed on 28 September 2023).
- Bailey, K.; Beck, T.; Cowan, E.; Ishler, V. (2009). Dairy Risk–Management Education: Managing Income Over Feed Costs. Agricultural Communications and Marketing, The Pennsylvania State University, PA, USA.
- Chapagain, A.K.; Hoekstra, A.Y. Water footprints of nations. Volume 1: Main report; UNESCO-IHE, Delft, The Netherlands, 2004, p. 25. www.waterfootprint.org/Reports/Report16Vol1.pdf. (accessed on 14 April 2023).
- Hoekstra, A.Y.; Mekonnen, M.M. Global Water Scarcity: Monthly Blue Water Footprint Compared to Blue Water Availability for the World’s Major River Basins. Value of Water Research Report Series No.53. UNESCO-IHE: Delft, The Netherlands, 2011; pp. 12–24.
- Palhares, J.C.P.; Morelli, M.; Novelli, T.I. Water footprint of a tropical beef cattle production system: The impact of individual-animal and feed management. Adv. Water Resour., 2021, 149, 103853. [Google Scholar] [CrossRef]
- Eady, S.; Viner, J.; MacDonnell, J. On-farm greenhouse gas emissions and water use: Case studies in the Queensland beef industry. Anim. Prod. Sci. 2011, 51, 667–681. [Google Scholar] [CrossRef]
- Mourad, R.; Jaafar, H.H.; Daghir, N. New estimates of water footprint for animal products in fifteen countries of the Middle East and North Africa (2010–2016). Water Resour. Ind., 2019, 22, 100113. [Google Scholar] [CrossRef]
- Maré, F.A.; Jordaan, H.; Mekonnen, M.M. The Water Footprint of Primary Cow– Calf Production: a revised bottom-up approach applied on different breeds of beef cattle. Water, 2020, 12, 2325. [Google Scholar] [CrossRef]
- Broom, D.M. Land and Water Usage in Beef Production Systems. Animals, 2019, 9, 286. [Google Scholar] [CrossRef] [PubMed]
Figure 1.
Water footprint (L/kg ADG) calculated over the entire experimental period 1.1 CSF: Corn silage feeding; TSF: Triticale silage feeding.
Figure 1.
Water footprint (L/kg ADG) calculated over the entire experimental period 1.1 CSF: Corn silage feeding; TSF: Triticale silage feeding.
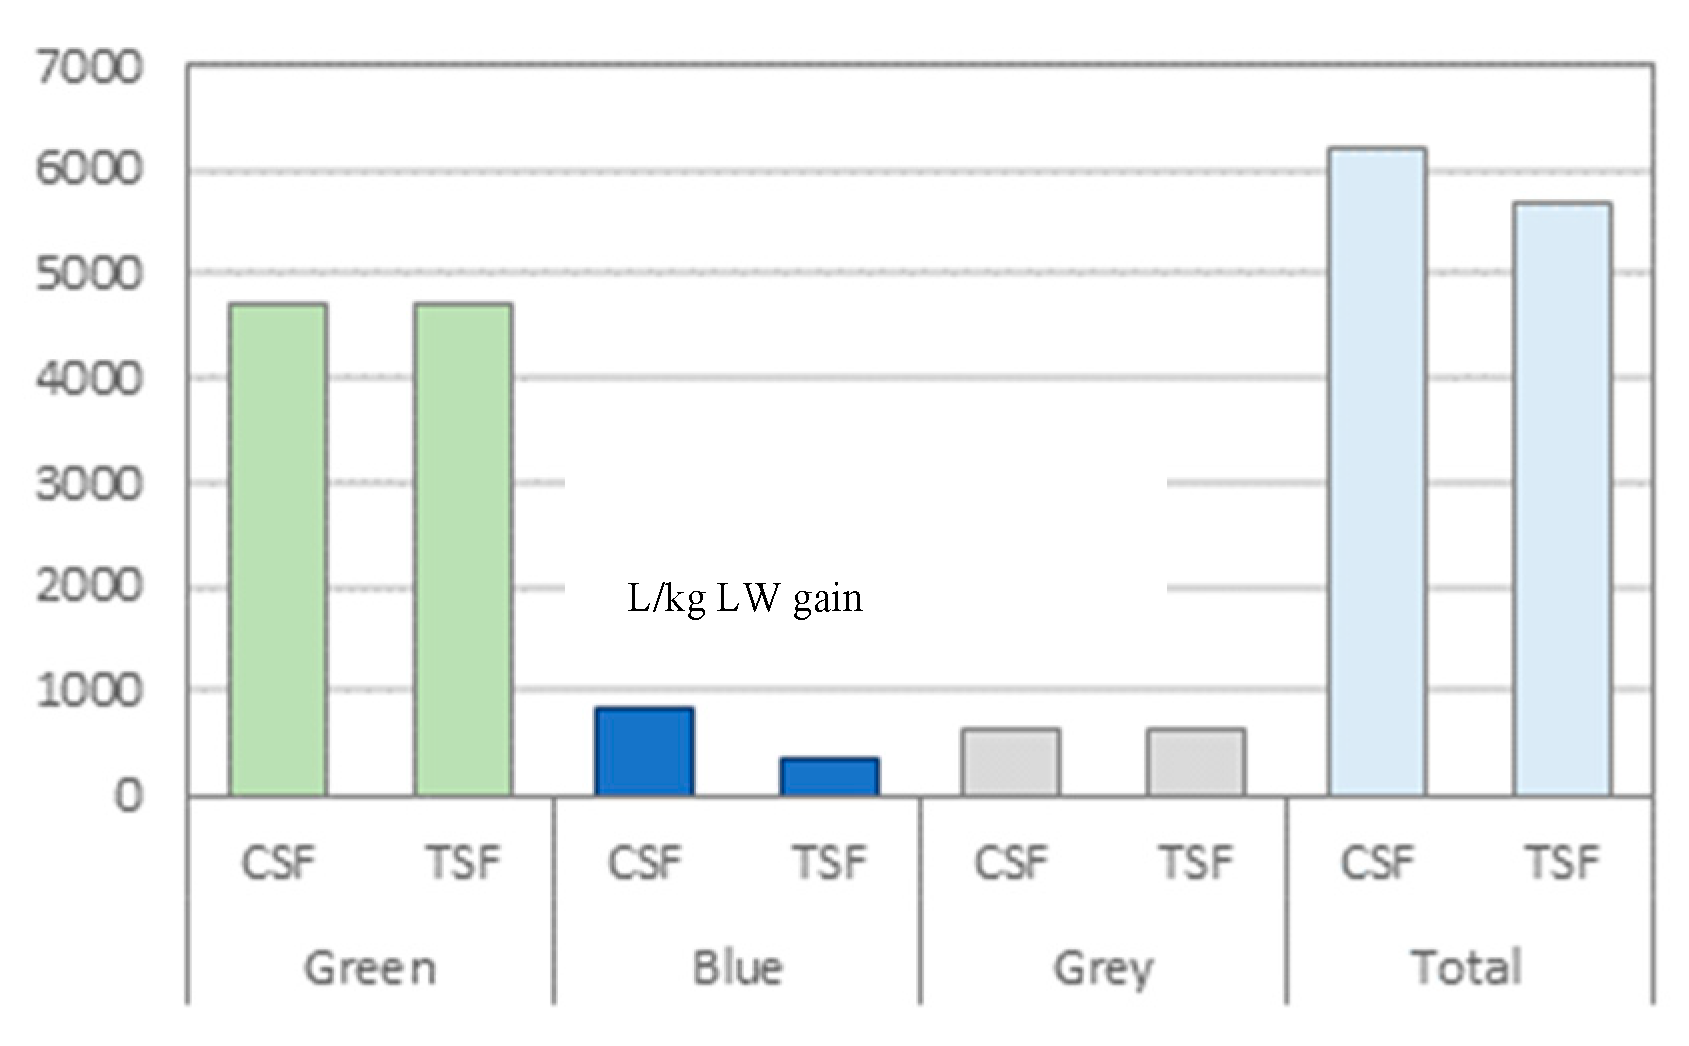

Table 1.
Composition, estimated nutritive values and costs of diet 1.
| Components | CSF | TSF |
|---|---|---|
| Diet composition, % | ||
| Corn Silage | 41.1 | - |
| Triticale Silage | - | 45.9 |
| Corn Meal | 13.7 | 13.7 |
| Wheat Straw | 13.7 | 6.9 |
| Barley Meal | 1.4 | 5.5 |
| Corn Gluten Meal | - | 3.8 |
| Sunflower Meal | - | 6.9 |
| Soybean Meal Extraction | 10.27 | - |
| Beet Pressed Pulp | 3.4 | 5.5 |
| Corn Distillers | 3.4 | 1.7 |
| Hydrogenated Fat | 1.0 | - |
| Vitamin Mineral Supplement | 1.4 | 1.4 |
| NaHCO3 | 1.0 | 1.0 |
| NaCl | 0.7 | 1.03 |
| Water Mixing | 8.9 | 6.8 |
| DM | 58.4 | 58.3 |
| Feed cost | ||
| €/kg DM | 0.42 | 0.42 |
| Chemical composition, g/kg DM a | ||
| CP | 147.4 | 147.0 |
| CF | 166.4 | 167.6 |
| NDF | 367.5 | 390.7 |
| ADF | 212.3 | 239.7 |
| ADL | 42.7 | 46.3 |
| EE | 43.0 | 27.1 |
| Ash | 78.9 | 87.9 |
| Starch | 248.8 | 249.7 |
| Nutritive value, kg/DM | ||
| UFV b | 0.9 | 0.9 |
| PDIN c | 96.5 | 106.0 |
| PDIE d | 105.1 | 111.8 |
| PDIA e | 51.5 | 59.5 |
1 CSF: Corn silage feeding; TSF: Triticale silage feeding; a Calculated by analysis of TMR; b UFV: Feed unit for meat production (net energy); c PDIN: Protein digested in the small intestine when rumen-fermentable nitrogen is limited; d PDIE: Protein digestible in the small intestine); e PDIA = Protein digestible in the small intestine supplied by rumen-undegraded dietary protein.
Table 2.
Average daily dry matter intake ( ± SE) 1.
| Trial day | CSF | TSF | ||
|---|---|---|---|---|
| DM | SE | DM | SE | |
| 0 | 6.56 | 0.039 | 6.41 | 0.033 |
| 14 | 6.80 | 0.041 | 6.64 | 0.035 |
| 28 | 7.03 | 0.043 | 6.86 | 0.036 |
| 42 | 7.26 | 0.044 | 7.09 | 0.037 |
| 56 | 7.49 | 0.046 | 7.31 | 0.039 |
| 70 | 7.71 | 0.048 | 7.52 | 0.04 |
| 84 | 7.93 | 0.049 | 7.73 | 0.042 |
| 98 | 8.14 | 0.051 | 7.94 | 0.043 |
| 112 | 8.35 | 0.052 | 8.15 | 0.044 |
| 126 | 8.55 | 0.054 | 8.34 | 0.045 |
| 140 | 8.75 | 0.055 | 8.54 | 0.046 |
| 154 | 8.95 | 0.057 | 8.73 | 0.048 |
| 168 | 9.13 | 0.058 | 8.91 | 0.049 |
| 182 | 9.32 | 0.059 | 9.09 | 0.05 |
| All | 8.00 | 0.05 | 7.80 | 0.04 |
1 CSF: Corn silage feeding; TSF: Triticale silage feeding; DM: Dry matter.
Table 3.
Live weight (LW) and average daily gain (ADG)( ± SE) 1.
| Trial day | LW, kg | ADG, kg/day | ||||||
|---|---|---|---|---|---|---|---|---|
| CSF | SE | TSF | SE | CSF | SE | TSF | SE | |
| 1 | 347.43 | 0.741 | 341.30 | 0.636 | 1.42 | 0.003 | 1.39 | 0.003 |
| 14 | 367.32 | 0.783 | 360.84 | 0.673 | 1.42 | 0.003 | 1.40 | 0.003 |
| 28 | 387.26 | 0.826 | 380.43 | 0.709 | 1.43 | 0.003 | 1.40 | 0.003 |
| 42 | 407.19 | 0.868 | 400.01 | 0.746 | 1.42 | 0.003 | 1.40 | 0.003 |
| 56 | 427.07 | 0.911 | 419.53 | 0.782 | 1.42 | 0.003 | 1.39 | 0.003 |
| 70 | 446.84 | 0.953 | 438.95 | 0.818 | 1.41 | 0.003 | 1.38 | 0.003 |
| 84 | 466.45 | 0.994 | 458.23 | 0.854 | 1.40 | 0.003 | 1.37 | 0.003 |
| 98 | 485.88 | 1.036 | 477.31 | 0.89 | 1.38 | 0.003 | 1.36 | 0.003 |
| 112 | 505.07 | 1.077 | 496.16 | 0.925 | 1.36 | 0.003 | 1.34 | 0.002 |
| 126 | 524.00 | 1.117 | 514.75 | 0.959 | 1.34 | 0.003 | 1.32 | 0.002 |
| 140 | 542.62 | 1.157 | 533.05 | 0.993 | 1.32 | 0.003 | 1.30 | 0.002 |
| 154 | 560.92 | 1.196 | 551.02 | 1.027 | 1.30 | 0.003 | 1.27 | 0.002 |
| 168 | 578.86 | 1.234 | 568.65 | 1.06 | 1.27 | 0.003 | 1.25 | 0.002 |
| 182 | 596.43 | 1.272 | 585.91 | 1.092 | 1.24 | 0.003 | 1.22 | 0.002 |
| All | - | - | - | - | 1.365 | 0.003 | 1.341 | 0.002 |
1 CSF: Corn silage feeding; TSF: Triticale silage feeding.
Table 4.
Feed conversion ratio (FCR) ( ± SE) 1. .
| Trial day | FCR | |||
|---|---|---|---|---|
| CSF | SE | TSF | SE | |
| 0 | 4.629 | 0.08 | 4.603 | 0.09 |
| 14 | 4.777 | 0.05 | 4.748 | 0.03 |
| 28 | 4.935 | 0.09 | 4.904 | 0.02 |
| 42 | 5.104 | 0.11 | 5.072 | 0.12 |
| 56 | 5.285 | 0.07 | 5.251 | 0.06 |
| 70 | 5.477 | 0.06 | 5.442 | 0.05 |
| 84 | 5.682 | 0.07 | 5.645 | 0.05 |
| 98 | 5.900 | 0.07 | 5.860 | 0.04 |
| 112 | 6.131 | 0.06 | 6.089 | 0.09 |
| 126 | 6.376 | 0.09 | 6.332 | 0.03 |
| 140 | 6.635 | 0.05 | 6.589 | 0.09 |
| 154 | 6.91 | 0.07 | 6.861 | 0.07 |
| 168 | 7.200 | 0.08 | 7.149 | 0.05 |
| 182 | 7.507 | 0.07 | 7.454 | 0.09 |
| All | 5.896 | 0.05 | 5.857 | 0.09 |
1CSF: Corn silage feeding; TSF: Triticale silage feeding.
Table 5.
Income over feed costs (IOFC) ( ± SE)1.
| Trial day | IOFC | |||
|---|---|---|---|---|
| CSF | SE | TSF | SE | |
| 0 | 2.215 | 0.25 | 2.173 | 0.13 |
| 14 | 2.114 | 0.13 | 2.111 | 0.11 |
| 28 | 2.052 | 0.09 | 2.019 | 0.15 |
| 42 | 1.921 | 0.15 | 1.922 | 0.09 |
| 56 | 1.824 | 0.08 | 1.795 | 0.13 |
| 70 | 1.697 | 0.10 | 1.672 | 0.20 |
| 84 | 1.569 | 0.11 | 1.548 | 0.12 |
| 98 | 1.411 | 0.11 | 1.425 | 0.10 |
| 112 | 1.253 | 0.09 | 1.267 | 0.14 |
| 126 | 1.099 | 0.10 | 1.117 | 0.08 |
| 140 | 0.945 | 0.12 | 0.963 | 0.16 |
| 154 | 0.791 | 0.14 | 0.778 | 0.08 |
| 168 | 0.610 | 1.13 | 0.633 | 0.11 |
| 182 | 0.426 | 1.11 | 0.452 | 0.13 |
| All | 1.418 | 0.90 | 1.418 | 0.11 |
1CSF: Corn silage feeding; TSF: Triticale silage feeding
Table 6.
Trial period water footprint average (L/day/animal)1.
| Groups 1 | Indirect water footprint | Direct water footprint | WF Average L/day/animal | ||
|---|---|---|---|---|---|
| WFFeed | WFFeed Mixing | WFDrinking | WFService | ||
| Estimated | Observed | ||||
| CSF | 8471 | 1.439 | 23.99 | 75 | 8571 |
| TSF | 7626 | 1.756 | 23.41 | 75 | 7726 |
1 CSF: Corn silage feeding; TSF: Triticale silage feeding.
Disclaimer/Publisher’s Note: The statements, opinions and data contained in all publications are solely those of the individual author(s) and contributor(s) and not of MDPI and/or the editor(s). MDPI and/or the editor(s) disclaim responsibility for any injury to people or property resulting from any ideas, methods, instructions or products referred to in the content. |
© 2023 by the authors. Licensee MDPI, Basel, Switzerland. This article is an open access article distributed under the terms and conditions of the Creative Commons Attribution (CC BY) license (http://creativecommons.org/licenses/by/4.0/).
Copyright: This open access article is published under a Creative Commons CC BY 4.0 license, which permit the free download, distribution, and reuse, provided that the author and preprint are cited in any reuse.


