Submitted:
07 October 2023
Posted:
10 October 2023
You are already at the latest version
Abstract
Wildfires can be destructive to highway infrastructure. Despite the substantial number of wildfires experienced every year, research on the physical impacts of wildfire on highways has been understudied. This research examines historical and potential future highway physical damage from wildfires. To accomplish our research objectives, we examined three major areas related to physical harm to highways and the consequences of that damage – physical characteristics, roadway impacts, and traffic impacts. These categories were subsequently broken into additional metrics, the first being physical characteristics, which includes length of highway affected and reduced average daily traffic (RADT) impacts during the event. Roadway impacts were broken into the number of trees requiring removal (those that present a danger either standing or fallen), pavement damage (burning asphalt concrete), slope/rock scaling (loose hazard rocks/vegetation), and structural damage (guardrail, signs, and delineators). Traffic impacts included the need for traffic control, road closures required, and reduced annual average daily traffic (RAADT) impacts for the year. The physical characteristics on the three highways researched during the 2020 Oregon Labor Day wildfires (Beachie Creek, Archie Creek, and Holiday Farm) indicated less than 61% of the highways were affected. The highway impacts, which included damage from hazard trees, damage to various structures – guardrail, signs, and delineators as well as bridges, slope/rock scaling damage and pavement destruction – averaged 34% for the three highways, while the three of eight arterial highway routes studied in the Oregon Cascades saw a 21% reduction in AADT. Results from this study can be used not only to assess physical damage to highways from wildfires, but as a baseline for measuring and assessing potential future wildfire highway impacts.
Keywords:
infrastructure damage
; transportation vulnerability
; roadway
; risk
; hazard
Introduction
Wildfire is an unplanned ignition occurring in forested and non-forested landscapes (Mostafiz et al., 2022). Approximately 84% of wildfires are started by humans or human infrastructure but include lightning ignitions as well (Balch et. Al., 2017) and are a major natural hazard globally, representing the third most costly natural hazard in the U.S., following hurricane/tropical storms and flooding (Escaleras et al., 2022). Despite U.S. spending exceeding $3.7 billion yearly on fire suppression, wildfires destroyed more than 35,000 properties in 2017 and 2018, resulting in losses of $32 billion in property and more than 100 fatalities in the U.S. (French, 2021).
Highways play a crucial role in the economic growth of a nation. By lowering travel times and expenses and increasing a region’s economic appeal, the creation of a high-quality road network directly boosts a country’s economic production. Understanding the value of domestic infrastructure investment and comparing it to the significant expenses of constructing and maintaining domestic roads is crucial for comparing it to the relationship between domestic transportation networks, market integration, and globalization (Rogers & Enright, 2023). Economic conditions are improved by connecting geographically isolated populations through transportation (Kitchens et al., 2020). The accessibility of the region’s transportation infrastructure affects both company and individual economic activity. Furthermore, a population’s economic situation can be improved by having a strong transportation infrastructure (Sobieralski, 2021). Companies can reduce transportation expenses thanks to an effective and reliable transportation infrastructure, which also lowers production costs and boosts productivity and profits (Keane, 1996). The importance of highways becomes especially pronounced when considering the destructive potential of wildfires. The destruction wildfires cause to highways can harm local economies by destroying timber, deterring recreation and tourism, and reducing agricultural output, among other things. Replacement of lost facilities and related infrastructure, reduction of watershed and water quality impacts, and restoration of vulnerable species and habitat are all factors that have a long-term impact on state and local budgets (Diaz, 2012).
Unfortunately, little research has been conducted on how wildfire impacts highways, despite infrastructure damage being a significant part of overall wildfire destruction (Habermann & Hedel, 2018). The overall objective of this research is to quantify the damage to highway infrastructure from wildfire by assessing the physical consequences of wildfire damage and therefore improving risk assessments and planning efforts that mitigate negative outcomes. We focus on three elements of wildfire-caused highway impairment – physical characteristics, roadway impacts, and traffic impacts. The following metrics were then separated out from these categories: Physical criteria included the length of the impacted highway and the impacts on the average daily traffic (ADT) during the event. The following groups were used to categorize the impacts on roads: the quantity of trees that needed to be removed (those that presented a danger, either standing or fallen), pavement damage (burning asphalt concrete), slope and rock scaling (loose hazard rocks and vegetation), and structure damage (guardrail, signage, and delineators). In terms of traffic impacts, there were requirements for traffic control, required road closures, and annual average daily traffic (AADT) counts.
The U.S. state of Oregon has historically been impacted by megafires (i.e., fires exceeding 40,000 ha), often driven by synoptic weather events that include high winds and low relative humidity. Since 1900, several significant fires have occurred across western Oregon, including the Yacolt Fire in 1902, the Bandon Fire in 1936, the four Tillamook Burns in 1933, 1939, 1945, and 1951, the Silver Complex Fire in 1987, the Biscuit Fire in 2002, the Chetco Bar Fire in 2017, and the Eagle Creek Fire in 2018. These fires collectively consumed 981,363 ha. (Mass et al., 2021). 2020 was the warmest meteorological summer in the Northern Hemisphere and the second driest year on record for the western U.S. The result: five megafires in western Oregon developed over the 2020 Labor Day weekend (Evers et al., 2022). The 2020 Labor Day wildfires burned more land in the Oregon Cascades than had burned in the previous 36 years combined and, in all probability, exceeded the area burned in any single year for the past 120 years (Abatzoglou et al., 2021). By analyzing the physical effects on three highways in Oregon during the 2020 Labor Day wildfires, a baseline may be established for calculating the risk of wildfire damage to highways.
This research provides a framework for generating standardized formulas to measure highway damage, and in turn, predict potential future damage from wildfire events. Our analysis using data from visual inspections facilitates consistent ways to measure damage based on fire size and roadway length, assisting local, state, and federal agencies in making decisions regarding mitigation of damage to critical infrastructure.
Background
A global issue, wildland-urban interface (WUI) – where development meets wildland vegetation (Radeloff et al., 2005; Maranghides & Mell, 2011) – fires are becoming more significant over time as a result of climate change and increased urbanization in WUI locations (Intini et al., 2019). The density of fires and associated risks has increased in the last 20 years due to the growth of urban and WUI areas, and more focus is being placed on the WUI, which is the region where people are most at risk from wildfires because of the close proximity of flammable vegetation (Nunes et. al., 2023; Radeloff et. al., 2018; Bento-Gonçalves & Vieira, 2020; Fox et. al., 2014). Based on 125 million unique building sites, researchers produced new WUI maps for the United States that provide greater spatial resolution than those produced before using data from the U.S. Census on housing, while maintaining the original Federal Register definition of the WUI represented by WUI maps based on the 500-m neighborhood, which do not include remote, solitary buildings, but rather groups of buildings in and near wildlands (Carlson et al., 2022). Using both WUI and non-WUI land-use categories, the building loss in WUI catastrophes was evaluated in relation to the census-based and point-based WUI maps, while comparing the building losses in connection to the key elements of the United States Federal Register definition of WUI, including dwelling density, plant cover, and proximity to significant areas of wildland vegetation (Caggiano et al., 2020). Recent studies reviewed the key ideas concerning the WUI’s intrinsic characteristics and wildfires in the WUI, the evaluation of methodologies that have been used to the WUI, and to analyze several risk prevention and reduction initiatives created in WUI affected by forest fires around the world (Bento-Gonçalves & Vieira, 2020).
Post-fire debris flows pose a major threat to infrastructure, particularly roadways (Fraser et al., 2020). A better quantification of debris flow risk and more efficient debris flow mitigation have been made possible over the past 30 years by technological advancements in mapping fire effects, improvements in our scientific understanding of post-fire debris flow occurrence, and the development of empirical models to predict debris flow probability and volume (De Graff, 2014). These debris flows appear to be independent of the vegetation community burned and are primarily produced by the process of increasing entrainment of material eroded off hillslopes and channels by surface runoff (De Graff, 2018). In southeast Santa Barbara County and southwest Ventura County of California, 281,893 acres (114,078 ha) of land were destroyed by the Thomas Fire between 2017 and 2018 (Swanson et. al., 2022). On January 9, 2018, an atmospheric river storm passed across the area, causing post-fire debris flows and heavy rains in the burned area’s western and northern regions (Swanson et. al., 2022). The town of Montecito was submerged by the most lethal and destructive flows, resulting in 23 fatalities (Swanson et. al., 2022).
In addition to debris flows, wildfires also impact steep mountain slopes, potentially increasing rockfall activity. This is due to the removal of organic matter from the soil matrix, such as decayed wood and plants, as well as an increase in erosional processes such dry ravel (De Graff et. al., 2015). The dangers to vehicles posed by the challenge of identifying the road segments that will be affected, the size, number, and/or travel behavior of rocks that may impact a given road segment, and the challenge of predicting how long increased rockfall activity may last after a wildfire (De Graff et al., 2015) have been the subject of additional rockfall activity research (De Graff & Gallegos, 2012). New detachment areas and a prolonged rockfall-runout are also observed following a wildfire (Sarro et al., 2021). Furthermore, areas lacking a history of burning are now suffering from forest fires, which can raise the risks of dangerous mudslides that are exceedingly difficult to forecast (Palmer, 2022).
The relationship between fire behavior, the susceptibility of exposed elements, and suppression actions determines how severe a fire will be (Tedim et al., 2013). The most documented sources describe “physical damage” to highways as slides and other debris that land on roads because of disruption to their “natural state” as wildfires occur, though evidence to describe the particular features of the damage is lacking. Other wildfire research has involved case studies of slides and roadways in Seiad, California (De La Fuente & Mikulovsky, 2016), and in the hills of Portugal (Araújo Santos et al., 2020).
While the literature above details the WUI and the subsequent building damages as well as slide damaged/erosion control and rockfall activity, none of the papers identified in this research addresses the three elements of wildfire-caused highway impairment – physical characteristics, roadway impacts, and traffic impacts and their subsequent additional metrics.
Study Area
Oregon, U.S. is selected for this analysis because of its regular periods of drought, which have become more frequent, widespread, and severe across the state. This endeavor offers a chance to constructively contribute to Oregon Natural Hazards Mitigation Plan (ONHMP; 2020) as it is routinely updated. The wildfire hazard, while formidable in Oregon, can intensify and be exacerbated by changes in other Oregon hazards such as extreme heat, drought, and high winds in the summer and autumn seasons (Richardson et al., 2022). Oregon’s highway system is continuously susceptible to wildfire hazards and has experienced recent numerous blazes across the state. This analysis specifically targets three highways in Oregon that were closed for several weeks due to the 2020 Labor Day wildfires. These highways fall within the three of the eight risk assessment regions outlined in the ONHMP (2020). Each of these regions was assessed at a regional scale by profiling the characteristics, natural hazards, and vulnerabilities within the ONHMP Regions. The three highways and the wildfires that affected them are shown in Figure 1 and described in greater detail below.
The Beachie Creek Fire was situated at 44.821°N and 122.88°W, near the towns of Lyons/Mehama, Mill City, Gates, Detroit, and Idanha in Marion and Linn County, Oregon’s Santiam Canyon along State Highway 022. The fire started on August 16, 2020 (Comer et al., 2021), and ultimately burned 73,336 ha in total. The fire was declared contained on October 31, 2020. The Holiday Farm Fire was situated at 44.172°N, 122.231°W, near Springfield in Lane County, Oregon, along State Highway 126. According to FEMA (2020), the fire started on Monday, September 7, 2020, and burned an estimated 70,170 ha. The date of containment was October 29, 2020. The Archie Creek Fire was situated along State Highway 138 at 43.334°N and 122.788°W, near the community of Glide in Douglas County, Oregon (ESRI, 2022). According to ESRI (2022), the fire started on Tuesday, September 8, 2020, and it consumed around 53,233 ha. It was contained on Monday, November 16, 2020 (ESRI, 2022).
Methods and Materials
Physical Characteristics
Physical parameters for this assessment included defining the length of highway impacted as well as the ADT counts during the wildfires. The length of highway impacted was a result of hazard tree damage, pavement damage, slope/rock scaling damage, and structural damage.
Data from the subject fires was provided by the Oregon Department of Transportation (ODOT) and was originally expressed in standard units, which were subsequently converted into metric units for the study. The information in the appendices was kept in standard units, while being converted to metric units throughout the study. Mile post (MP) and ADT count information was obtained through ODOT (ODOT; 2023) and interpolated to align with the various closure areas on each of the three highways. Aligning areas of highway closures with the appropriate ADT information was necessary to provide accurate ADT statistics. This included identifying the MP range limits within the highway closures during the wildfires and summing their ADTs for each range. Physical damage data were collected from ODOT’s Detailed Damage Inspection Reports (DDIRs) and synthesized from the three Labor Day wildfires into a standard format (Appendixes A-F).
Additional information concerning the damage to the roadways during the wildfires was obtained through the ODOT from its Oregon Wildfire Response and Recovery efforts during and after the wildfires. The physical impacts were captured, detailed, and summarized on the Federal Highway Administration (FHWA) DDIRs completed by ODOT for each highway. This information was received from ODOT on January 31, 2022 (Oregon State Highway 138 – Archie Creek Wildfire) and March 3, 2022 (Oregon State Highway 022 – Beachie Creek Wildfire and Oregon State Highway 126 – Holiday Farm Wildfire). The initial damage reports were completed over a five-month period (October 2020 – February 2021). Each physical impact is itemized, with additional detail on site location as well as a description of the damage. Figure 1 provides the wildfire locations in Oregon and facilitates comparison of the highway locations impacted in relation to the wildfire area of influence. During the Beachie Creek wildfire, Oregon State Highway 022 was closed for approximately 36 days (7 September 2020 to 13 October 2020). The Holiday Farm wildfire led to the closure of Oregon State Highway 126 for around 26 days (7 September 2020 to 2 October 2020). Oregon State Highway 138, affected by Archie Creek wildfire, experienced closure for about 14 days (8 September 2020 to 22 September 2020). The ADT associated with the wildfire was examined by comparing the ADT data for the previous five years (2015 – 2019) for each of the three highways using the same MP range noted during the 2020 wildfire occurrences.
Percentage of highway closed () was determined by summing the number of kilometers closed () and dividing by the sum of the total kilometers of highway () for each highway i (Appendix G). The percentage of highway impacted () was determined by summing the damaged number of kilometers impacted () on the three routes and dividing by the sum of the total kilometers of footprint () for each highway i (Appendix G). Total kilometers of highway footprint is defined as the overall length of the highway – based upon mileposts. The reduced ADT () was examined by averaging the ADT data for the previous five years (2015 – 2019) for each of the three highways using the same MP range as noted above. The 2020 ADT was then divided by this five-year average to compute the percentage due to the wildfires (Appendix G).
Roadway Impacts
Roadway impacts to the three highways due to the wildfires included hazard tree removal – trees that needed to be removed (those that present a danger, either standing or fallen), pavement damage (burning asphalt concrete), slopes/rock scaling (loose hazard rocks, and vegetation), and structural damage (guardrail, signage, and delineators).
The impact of hazard trees on the roadways was assessed in terms of the highway length impacted (km) to reflect the physical damage due to hazard trees. The calculations considered the length of the highway affected by hazard trees, irrespective of the specific number of trees, while the number of trees will be part of the roadway impact assessment. Pavement damage refers to the highway’s destruction caused by the fire, measured in meters. The data attained from ODOT’s DDIRs was incomplete. Both the Beachie Creek and Holiday Farm fires had complete pavement damage information. Even though the Archie Creek Fire provided the length of highway impacted, it only offered a generalization of the pavement damage and therefore could not be included in the average meters of pavement damage per kilometer of highway impacted.
Slope/rock scaling damage involves the removal/repair of loose hazard rocks, trees, and vegetation along slopes and is calculated in counts of each. While some of the data were quantitative with repairs specified within specific MPs along the damaged roadways, other reports provided generalized identification of damaged slopes along the roadways needing to be addressed for the roadways to be reopened safely without restrictions. Structural damage is mainly identified as damage to guardrails, signs, delineators along with some bridges, culverts, and retaining walls, measured in meters. While part of the data was numerical, i.e., estimated meters of damaged structures along the roadway, other reports were broader in their identification of such sites.
The number of hazard trees () identified along the highway were divided by the total kilometers of highway () impacted to calculate the average number of hazard trees to be removed per kilometer of highway impacted for each highway I, (). The meters of pavement damage were divided by the total kilometers of highway impacted ( to get the average pavement damage along highway impacted I, ) For highway i (), the average slopes/rock scaling damage were calculated by dividing the total kilometers of impacted roadway () by the average slopes/rock scaling repairs (). Average structural damage (was calculated by dividing the total number of kilometers of impacted highway ( by the structural damage (). (Appendix G)
Traffic Impacts
The kilometers of closed highway and the kilometers of highway requiring traffic management during repair activities were both included in the traffic control statistics. The traffic control information was also obtained from DDIRs received from ODOT. The reports provided a more generalized assessment of the number of kilometers of highway that needed to be closed and the traffic management issues that needed to be resolved for the highways to be safely reopened without limits. The Wildfire Closure Status Maps included the affected mile posts as well as the dates of the road closures. Each report also included the level of road closure, which had a status of one of the following: (A) Full Closure/Evaluating Damage; (B) Critical Services; (C) Partial Opening; or (D) Open w/Ongoing Repairs.
Additional details included the reduced highway speeds experienced during various road closures as well as the work that was being done when the roads were closed. Data also included the hectares of wildfire burned and the estimated length of roadway that were closed and required traffic control throughout the wildfires. The reduced AADT on these three highways was determined by taking the AADT from the five years prior to the 2020 wildfires and comparing them against the 2020 AADT. This included identifying and matching the various MPs identified in the wildfire closure status maps along with the FHWA DDIRs and cross-checking them against the ODOT AADT information (ODOT, 2023).
The total number of hectares burned () was divided by the total number of kilometers of highway traffic control impacted () to arrive at the average number of hectares burned per kilometers of traffic control needed for the highway i (). The total number of hectares burned () was divided by the total number of kilometers of road closed () to determine the average number of hectares burned per kilometers of road closure for the highway i (). The AADT from 2020 must be deducted from the AADT from 2015–2019, which must then be divided by the AADT from 2020, in order to determine the AADT reduction (), which decreased in 2020 compared to the previous five years AADT. (Appendix G)
Results and Discussion
Physical Characteristics
Length of Highway Affected
The wildfires identified in this study encompassed approximately 286 km of highway, or 60.72% of the entire length of the three highways analyzed (Table 1). While this is only 2.2% of the approximately 12,875 km of the Oregon state highway system (2017 Oregon Mileage Report, 2018), all three of these highways are vital east-west connector routes between the two main north-south highway routes of Interstate 5 and Highway 97 within Oregon.
The information provided in Table 2 categorizes the percentage of highway damage in relation to each of the three highways footprints. The table indicates the following for each of the roadway impacts: Structural damage appears to constitute the most damage, averaging 55%, with a high of 65% and a low of 39%. Hazard trees represent the second-greatest damage component, with an average of 45%, a high of 65% and a low of 36%. Slope/rock scaling damage is the next-most type of damage, averaging 22%, with a high of 65% and a low of 0%. Finally, the least amount of damage was the actual pavement damage, which averaged 15%, with a high of 18% and a low of 12%.
ADT Impacts
While the average ADT dropped by approximately 11% on these three highways during the wildfires, they all dropped almost identically: averaging between 11–13% during the wildfires. While not excessive, ADT exceeding 10% may attract attention due to the unplanned impact on commercial freight vehicles as well as normal passenger commuting – both of which had to travel additional distances on detour routes around the wildfires. This is noteworthy due to the different duration each highway was closed, which averaged 25 days. While this does not appear to be a significant reduction, these routes are vital to Oregon’s transportation system in terms of commerce, freight, and tourism. Again, while the information provided in Table 3 is informative, the wildfire area and the RADT do not appear to be related.
Roadway Impacts
Hazard Tree Removal
There were about 40,000 trees that needed to be removed along 84 km of Oregon State Route 22, while there were about 10,000 trees that needed to be removed along 69 km of Oregon State Highway 126 and an unknown number of trees that needed to be removed along 58 km of Oregon State Highway 138 – see Table 4.
The tree removal activities along the damaged routes are compiled in Table 4. The data for the Beachie Creek and Holiday Farm fires were comprehensive, while the data for the Archie Creek wildfire were not. As a result, instead of using three sets of data points to determine the total and average, just two sets of data were used. The number of hazardous trees that needed to be removed increased with the length of route affected. According to the data, which was based on unfinished information from the Archie Creek incident, an average of 381 hazard trees needed to be removed per kilometer of highway affected by the wildfires.
Pavement Damage
The pavement damage activities along the roadways are summarized in Table 5. The average of about 27 m of pavement damage per kilometer of highway affected by the wildfires suggests that length of highway impacted is not directly related to the amount of pavement damage. While part of the information was quantitative, with estimated meters of pavement damage, other reports were broader, identifying damaged highways that needed to be corrected before the roadways could be reopened safely without limits.
Slopes/Rock Scaling Damage
For each of the three highways, Table 6 provides details on the slope/rock scaling damage. In one area along 84 km of Oregon State Highway 022 where the Beachie Creek wildfire occurred, scope assessments were necessary, along with eight (8) locations along Oregon State Highway 126, where the Holiday Farm wildfire occurred. The Archie Creek wildfire broke out in an unidentified number of locations along 19 km of Oregon State Highway 138 where scope assessment was necessary.
With two-thirds of the data unidentified, even a generalization of the slope/rock scaling damage is difficult to quantify or establish a basic average per kilometer affected.
Structural Damage
The specific structural damage information for each of the three highways is shown in Table 7. Highway 022 had structural damage spanning roughly 4,267 m along 84 km, while Highway 126 also had structural damage spanning about 4,267 m along 69 km necessitating repairs to guardrail, signs, and delineators,
Only a portion of the data from ODO’s DDIRs was complete. Unfortunately, the full details of the Beachie Creek and Holiday Farm fires did not establish a link between the amount of highway kilometers affected and the need for structural repairs. An average of 56 m of structures needed to be repaired per kilometer of highway affected. Even though the Archie Creek wildfire data set contained the kilometers of roadway that were affected, it only presented a generalization of the structural damage and could not be considered for calculating the average length of structures damaged per kilometer of highway affected.
In addition, the Bad Banks Bridge (State Bridge #06761) at OR22, MP 36.74 – Beachie Creek wildfire, sustained damage, including structural harm to the concrete inlet, wing walls, and apron, as well as to the culvert liner and retaining wall. It also included the melting of galvanized coating off manhole covers and HDPE diversion pipes, and burned trees that could harm the bridge. There were over 4,267 m of guardrail, 119 signs, and 520 lane delineators along 69 km of Oregon State Highway 126, MP 12.7 to 56 that needed to be repaired where the Holiday Farm wildfire occurred. The damage was reported along 106 km of Oregon State Highway 138 where the Archie Creek wildfire generalized sign, guardrail, fencing, delineator posts, and mile markers and post damage without providing specific quantities.
Traffic Impacts
Traffic Control
The DDIRs gave an overview of traffic management for certain MP spans. The length of highway requiring traffic control required some interpretation of the data from ODO’'s DDIRs. The findings do not indicate that wildfire size is related to the amount (length) of highway traffic control.

Table 8.
Hectares Burned per Length of Traffic Control, by Highway.
| Highway | Wildfire | Area Burned (ha) | Length of Highway Traffic Control (km) | Hectares Burned per Length of Highway Traffic Control (ha/km) |
|---|---|---|---|---|
| Hwy 022 | Beachie Creek Fire | 78,336 | 84 | 933 |
| Hwy 126 | Holiday Farm Fire | 70,170 | unidentified | undetermined |
| Hwy 138 | Archie Creek Fire | 52,233 | 106 | 493 |
| Total* | 130,569 | 190 | 687 | |
*Total based on Beachie Creek Fire and Archie Creek Fire.
Road Closure Status
The length of road closures and the hectares burned per km of highway closures are documented in Table 9. This data was gathered using information from the 2020 Oregon wildfire closure status maps that ODOT provided. These wildfire closure maps, which are listed in appendix F, were made available to the general public during the wildfires. The data does indicate that the size of the wildfire affects how many kilometers of highway were closed or how many hectares were burned for every kilometer of closed highway.
Each of the three highways being studied in Oregon utilized road closure status maps that were updated during the 2020 wildfires. (See appendix F) Road closures fell into four categories:
- Full closure
- Critical services that allow emergency and service vehicles only
- Partial access
- Traffic restored with some ongoing repairs
Three updated corridor status maps were available for the Beachie Creek wildfire, three were available for the Holiday Farm wildfire, and two were available for the Archie Creek fire. Each provided the date, time, and MP span of the closure as well as the road closure status, the normal speed limit vs. the reduced speed limit, and the work being performed on the roadway.
Unfortunately, all the road closure status maps had unidentified information, which made the comparison of the maps challenging.
AADT Impact
The ADT decreased by around 11% during the wildfires, as previously indicated in Table #3, as a result of the varying numbers of days the highways were closed, which had an immediate impact on the highways. Table #10 is used to measure long-term trends or variations in travel demand and illustrates the long-term impact to the AADT on the same routes.
Table 10.
Annual Average Daily Traffic (AADT) Impacts, by Highway.
| Highway–- Wildfire | Milepost Range | Annual ADT (AADT) (2015-2019) | AADT in 2020–(less the # of days highway closed) | AADT Decrease (2015–2019)–2020 | RAADT |
|---|---|---|---|---|---|
| Highway 022–- Beachie Creek Fire | MP 22.40–- MP 81.51 | 2,138,079 | 1,733,685 | 404,394 | 23% |
| Highway 126–- Beachie Creek Fire | MP 21.40–- MP 45.37 | 1,422,040 | 1,191,449 | 230,591 | 19% |
| Highway 138–- Archie Creek Fire | MP 16.35–- MP 100.71 | 497,819 | 425,208 | 72,611 | 17% |
| Total | 4,057,938 | 3,350,342 | 707,596 | 21% | |
The RAADT on these three highways was approximately 21%. This was determined by taking the AADT from the 5 years prior to the 2020 wildfires and comparing them against the 2020 AADT.
Summary and Conclusion
This study creates a method for analyzing historical infrastructure losses due to wildfire in Oregon, a state in the U.S. with average infrastructure, a relatively sparse population, and a likely growing vulnerability to prolonged dry spells–- averaging approximately 131 days of rainfall per year (Oregon Annual Rainfall and Climate Data, 2023). Most archival publications document how climate change affects infrastructure damage as well as the economic impacts associated with wildland fires and consist largely of residential and commercial property losses (homes, personal belongings, commercial structures, and inventory). Overall, there is a dearth of research on damage to highway infrastructure due to wildfires. To achieve the research goals, three distinctive elements were analyzed in this study – physical roadway characteristics, roadway impacts, and traffic impacts. Each of these three elements included sub-features that measured several additional types of damage. Data analysis revealed limited relationships between the size of the wildfires, the subsequent impacts to the highways and the damage that occurred with each one.
The major results from this research can be summarized as follows:
- ➢
-
Physical Roadway Characteristics
- Wildfires affected slightly less than 61% of the approximately 286 total kilometers of the three highways analyzed.
- On average, structural, hazard trees, slope/rock scaling and pavement damage is 55%, 45%, 22%, and 15%, respectively, in relation to the highway footprint.
- ➢
-
The RADT during the wildfires averaged about 11%.
- An average of approximately 381 hazard trees were to be removed per kilometer of highway impacted by the wildfires.
- An average of approximately 27 m of pavement damage/repairs occurred per kilometer of highway impacted by the wildfires.
- An average of approximately 1.0 (EA) instances of slope/rock scaling damage occurred per 100 km of highway impacted by the wildfires.
- An average of approximately 56 m of structural damage occurred per kilometer of highway impacted by the wildfires.
- ➢
-
Traffic Impacts
- An average of approximately 687 ha burned per kilometer of highway traffic control during the wildfires.
- An average of approximately 800 ha burned per kilometer of highway road closures during the wildfires.
- The RAADT due to the wildfires was about 21%
The observed physical roadway characteristics, roadway impacts, and traffic impacts provide valuable information about the vulnerability of highways to wildfires. The analysis of hazard trees, pavement damage, slope/rock scaling, and structural damage indicate areas that require special attention in future wildfire mitigation strategies. These results directly contribute to improving infrastructure resilience and wildfire management strategies. This information will help designers create highways that are more prepared to resist the effects of wildfires. Additionally, integrating the results into existing wildfire risk assessment models will enhance their accuracy and enable more informed decisions regarding land use planning.
Despite the practical benefits of this study, several limitations need to be addressed in future research. The evaluation focused on only three highways in Oregon affected by the 2020 Labor Day wildfires, although many others were affected simultaneously. Supplementary research should include the analysis of more highways within the geographical region. In addition, each of the three distinctive elements analyzed in the study – physical characteristics, roadway impacts, and traffic impacts, along with their sub-features, all had missing information in one form or another. Additional limitations include the ADT information gathered for this report. While this report analyzed the previous five years of AADT information prior to the 2020 Labor Day wildfires, analysis of more years could enhance the accuracy of the calculations and the association between the reduction in ADT and wildfire impacts.
Future research would benefit from more complete information in each of the categories. Some of the challenges that this research faced included initially obtaining the research data, extracting individual elements/sub-features from the data, and recognizing that much of the physical damage information provided for each wildfire was consistently incomplete. Despite these drawbacks, the results of this study will help decision-makers estimate potential physical wildfire roadway damage in other regions in addition to Oregon.
Contribution
Based on the number of ha burned and the length of highway affected by the wildfires, this research developed averages, gathered, and analyzed the data, and developed the initial method for assessing and foreseeing the potential damage from wildfires to highways. This includes physical damage; roadway impacts as well as traffic impacts to the highways. While this information is preliminary, local, and state government leaders can use its applications to assess wildfire damage and aid in determining annual roadway damage forecasts. This paper will be the first to project probable roadway infrastructure damage loss at the micro-scale (three (3) roads) – using Oregon as an example.
Author Contributions
Christiansen developed the methodology, collected, and analyzed the data, and developed the initial text. Mostafiz expanded the literature review, edited the text, prepared Figure 1 and helped to develop specific equations. Friedland provided original ideas and advice on the overall project methodology and edited the text. Rohli edited early and late drafts of the text. Dunn provided advice on the project and edited the text. Al Assi edited late drafts of the text.
Appendix A – Hazard Tree Removal
| Wildfire Site | Date of Report | Site Location | Description of Damage | Emergency Repair Estimated Costs | Permanent Repair Estimated Costs |
| Beachie Creek Fire DDIR Site Number D03-001 |
11/20/2020 | OR22 (Highway 162 North Santiam Highway) MP 13 - 65 | Catastrophic wildfire damage from Beachie Creek Fire to approximately 40K trees along highway requiring immediate removal | $4,000,000 | $0 |
| Holiday Farm Fire DDIR Site Number D5-001 |
11/19/2020 | OR126 (Highway 015) MP 12.7 to 56 | Catastrophic wildfire damage from the Holiday Farm Fire to approximately lOK trees along highway requiring immediate removal | $1,000,000 | $0 |
| Archie Creek Fire DDIR Site Number D07-001 |
12/1/2020 | North Umpqua Hwy, OR138 East, MP 17 to 28.8 | Hazardous trees: weakened standing and fallen trees. | $605,000 | $1,083,000 |
| Archie Creek Fire DDIR Site Number D08-006 |
12/1/2020 | North Umpqua Hwy, OR138 East, MP 28.8 to 43 | Hazardous trees: weakened standing and fallen trees | $605,000 | $1,695,000 |
| Archie Creek Fire DDIR Site Number D08-013 |
1/12/2021 | North Umpqua Hwy, OR138 East, MP 73 to 83 | Hazardous trees: weakened standing and fallen trees | $75,000 | $151,000 |
Appendix B – Pavement Damage
| Wildfire Site | Date of Report | Site Location | Description of Damage | Emergency Repair Estimated Costs | Permanent Repair Estimated Costs |
| Beachie Creek Fire DDIR Site Number D03-007 |
12/14/2020 | OR22 (Highway 162 North Santiam Highway) MP 37 - 51 | Catastrophic wildfire damage to approximately 3100 centerline feet of paving on OR22 caused by Beachie Creek Fire. | $155,700 | $0 |
| Holiday Farm Fire DDIR Site Number D5-005 |
12/15/2020 | OR126 (Highway 015) MP 29 to 47 | Catastrophic wildfire damage to approximately 1500 centerline feet of pavement om OR 126 from the Holiday Farm Fire | $272,960 | $0 |
| Archie Creek Fire DDIR Site Number D07-005 |
12/1/2020 | North Umpqua Hwy, OR138 East, MP 17 to 28.8 | Pavement was damaged by fire burning on the road and during fire cleanup efforts. | Information Not Provided | $156,000 |
| Archie Creek Fire DDIR Site Number D08-012 |
12/1/2020 | North Umpqua Hwy, OR138 East, MP 29.3; 29.4; 30.1; 31.3; 32.0; 34.5; 35.3 | Pavement was damaged by fire burning on the road and during fire cleanup efforts. | Information Not Provided | $186,000 |
Appendix C – Slope/Rock Scaling Damage
| Wildfire Site | Date of Report | Site Location | Description of Damage | Emergency Repair Estimated Costs | Permanent Repair Estimated Costs |
| Beachie Creek Fire DDIR Site Number D03-004 |
11/20/2020 | OR22 (Highway 162 North Santiam Highway) MP 13 - 65 | Catastrophic wildfire damage to highway from Beachie Creek Fire requires scope scaling and assessment to assess corridor slope damage. |
$15,900 | $0 |
| Beachie Creek Fire DDIR Site Number D03-006 |
12/16/2020 | OR22 (Highway 162 North Santiam Highway) MP 34 - 43 | Catastrophic wildfire damage to highway from Beachie Creek Fire requires rock scaling to remove loose hazard rocks, trees, and vegetation on 8 slopes between MP 34 - 43 |
$588,125 | $0 |
| Beachie Creek Fire DDIR Site Number D03-008 |
2/22/2021 | OR22 (Highway 162 North Santiam Highway) MP 40 - 44 | Catastrophic wildfire damage to highway from Beachie Creek Fire requires rock screen repairs to damaged screens on slopes between MP 40 - 44 | $930,286 | $0 |
| Beachie Creek Fire DDIR Site Number D03-009 |
2/22/2021 | OR22 (Highway 162 North Santiam Highway) MP 40 - 60 | Catastrophic wildfire damage to highway from Beachie Creek Fire requires rock screen repairs to damaged screens on slopes between MP 40 - 60 | $1,165,000 | $0 |
| Holiday Farm Fire DDIR Site Number D5-002 |
11/25/2020 | OR126 (Highway 015) | Rock Scaling/Slope Assessment | Information not provided | $0 |
| Archie Creek Fire DDIR Site Number D07-004 |
10/29/2020 | North Umpqua Hwy, OR138 East, MP 24.85 | Unstable slopes causing rock, tree, and other material to fall onto the roadway | $4,000 | $9,500 |
| Archie Creek Fire DDIR Site Number D07-006 |
12/2/2020 | North Umpqua Hwy, OR138 East, MP 26.42 | Unstable slopes causing rock, tree, and other material to fall onto the roadway | Information not provided | $11,000 |
| Archie Creek Fire DDIR Site Number D08-009 |
12/1/2020 | North Umpqua Hwy, OR138 East, MP 34.02 | Unstable slopes causing rock, tree, and other material to fall onto the roadway | $12,500 | $27,000 |
| Archie Creek Fire DDIR Site Number D08-010 |
12/1/2020 | North Umpqua Hwy, OR138 East, MP 37.9 | Unstable slopes causing rock, tree, and other material to fall onto the roadway | $2,500 | $6,500 |
| Archie Creek Fire DDIR Site Number D08-011 |
12/1/2020 | North Umpqua Hwy, OR138 East, MP 31.7 | Unstable slopes causing rock, tree, and other material to fall onto the roadway | $5,000 | $214,850 |
| Archie Creek Fire DDIR Site Number D08-016 |
12/2/2020 | North Umpqua Hwy, OR138 East, MP 33.45 | Unstable slopes causing rock, tree, and other material to fall onto the roadway | Information not provided | $8,000 |
| Archie Creek Fire DDIR Site Number D08-017 |
12/2/2020 | North Umpqua Hwy, OR138 East, MP 34.3 | Unstable slopes causing rock, tree, and other material to fall onto the roadway | Information not provided | $8,000 |
| Archie Creek Fire DDIR Site Number D08-018 |
12/2/2020 | North Umpqua Hwy, OR138 East, MP 36.9 | Unstable slopes causing rock, tree, and other material to fall onto the roadway | Information not provided | $15,000 |
Appendix D – Structural Damage
| Wildfire Site | Date of Report | Site Location | Description of Damage | Emergency Repair Estimated Costs | Permanent Repair Estimated Costs |
| Beachie Creek Fire DDIR Site Number D03-002 |
11/20/2020 | Bad Banks Bridge (State Bridge #06761) at OR22 (Highway 162 North Santiam Highway) MP 36.74 | Catastrophic wildfire damage to Bad Banks Bridge due to Beachie Creek Fire, to include structural damage to the concrete inlet, wing walls, and apron, culvert liner, and retaining wall; galvanized coating melted off of manhole cover; melted HDPE diversion pipes and burned trees that pose a damage to the bridge. |
$386,880 | $0 |
| Beachie Creek Fire DDIR Site Number D03-005 |
11/24/2020 | OR22 (Highway 162 North Santiam Highway) MP 13 - 65 | Catastrophic wildfire damage from the Beachie Creek Fire to approximately 14K linear feet of guardrail, signs, and delineators on
OR22E requiring repair. |
$490,980 | $0 |
| Holiday Farm Fie DDIR Site Number D5-004 |
11/19/2020 | OR126 (Highway 015) MP 12.7 to 56 | Catastrophic wildfire damage from the Holiday Farms Fire to approximately 14k linear feet of guardrail, 119 signs, and 520 Lane delineators on OR126 |
$888,780 | $0 |
| Archie Creek Fire DDIR Site Number D07-003 |
12/1/2020 | North Umpqua Hwy, OR138 East, MP 17 to 28.8 | Sign, Guardrail, fencing, delineator posts, and mile markers and post damage. | $177,500 | $310,000 |
| Archie Creek Fire DDIR Site Number D08-008 |
12/1/2020 | North Umpqua Hwy, OR138 East, MP 28.8 to 83 | Sign, Guardrail, fencing, delineator posts, and mile markers and post damage. | $212,500 | $347,700 |
Appendix E – Traffic Control
| Wildfire Site | Date of Report | Site Location | Description of Damage | Emergency Repair Estimated Costs | Permanent Repair Estimated Costs |
| Beachie Creek Fire DDIR Site Number D03-003 |
11/20/2020 | OR22 (Highway 162 North Santiam Hwy) MP 13 - 65 | Traffic control and pilot car operations for highway closure due to Beachie Creek Fire. | $282,300 | $0 |
| Holiday Farm Fire DDIR Site Number D5-003 |
11/25/2020 | OR126 (Highway 015) | *Erection and removal of barricades and detour signs *Flagging and pilot cars during the emergency period | Information not provided | Information not provided |
| Archie Creek Fire DDIR Site Number D07-002 |
12/1/2020 | North Umpqua Hwy, OR138 East, MP 17 to 28.8 | Traffic Control for Road Closure | $260,000 | $335,000 |
| Archie Creek Fire DDIR Site Number D08-007 |
12/1/2020 | North Umpqua Hwy, OR138 East, MP 28.8 to 83 | Traffic Control for Road Closure | $285,000 | $510,000 |
Appendix F – Road Closure
| Highway | Date of Map | Times of Map | Mileposts | Road Closure Status | Standard Speed | Mileposts | Reduced Speed | Work Performed |
| OR-126 Corridor | 9/15/2020 | 12:35 PM | 12.7 - 47.3 | Level A - Full Closure / Evaluating Damage | 55 mph | unidentified | unidentified | unidentified |
| OR-126 Corridor | 9/15/2020 | 4:40 PM | 12.7 - 47.3 | Level B - Critical Services | 55 mph | unidentified | unidentified | unidentified |
| OR-126 Corridor | Unknown | Unknown | 13 - 47 | Level D - Reduced Speed | 55 mph | 28 - 38 | 45 mph | Active work zone with damaged or missing guardrail and signs and logs/debris piled on roadside |
| OR-022 Corridor | 9/15/2020 | 12:35 PM | 22 - 81 | Level A - Full Closure / Evaluating Damage | 55 mph | unidentified | unidentified | unidentified |
| OR-022 Corridor | 9/15/2020 | 4:40 PM | 22 - 81 | Level B - Critical Services | 55 mph | unidentified | unidentified | unidentified |
| OR-022 Corridor | Unknown | Unknown | 22 - 81 | Level D - Open with Ongoing Repairs | 55 mph | 33 - 63 | 40 mph | Active work zone with damaged or missing guardrail and signs and logs/debris piled on roadside |
| OR-138 East Corridor | 9/15/2020 | 12:35 PM | 21 - 83 | Level A - Full Closure / Evaluating Damage | 55 mph | unidentified | unidentified | unidentified |
| OR-138 East Corridor | 9/16/2020 | 8:15 AM | 21 - 83 | Level B - Critical Services | 55 mph | unidentified | unidentified | unidentified |
Appendix G - Highway Physical Damage Equations
| Hazard | Equation |
| Percentage of Highway Closed | 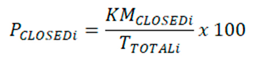 |
| Percentage of Highway Impacted | 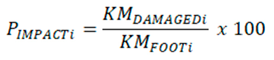 |
| Average Daily Traffic (ADT) Impacts during event |  |
| Average Hazard Trees to be removed per KM of Highway Impacted | 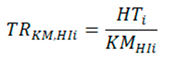 |
| Average Pavement Damage per KM of Highway Impacted | 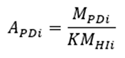 |
| Average Slopes/Rock Scaling Damage per KM of Highway Impacted | 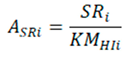 |
| Average Structural Damage per KM of Highway Impacted | 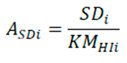 |
| Average # of HA Burned per KM of Traffic Control | 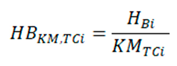 |
| Average # of HA Burned per KM of Road Closure | 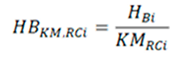 |
| Annual Average Daily Traffic (AADT) Impact | 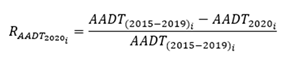 |
References
- Abatzoglou, J. T., Rupp, D. E., O’’Neill, L. W., & Sadegh, M. (2021). Compound extremes drive the western Oregon wildfires of September 2020. Geophysical Research Letters, 48(8), e2021GL092520. 48, 8, e2021GL092520. [CrossRef]
- Araújo Santos, L. M., Correia, A. J., & Coelho, P. A. (2020). Post-wildfire slope stability effects and mitigation: A case study from hilly terrains with unmanaged forest. SN Applied Sciences, 2(11), 1–21. [CrossRef]
- Balch, J. K., Bradley, B. A., Abatzoglou, J. T., Nagy, R. C., Fusco, E. J., & Mahood, A. L. (2017). Human-started wildfires expand the fire niche across the United States. Proceedings of the National Academy of Sciences (PNAS), 114(11), 2946-2951. https://www.pnas.org/doi/abs/10.1073/pnas.1617394114. /: https.
- Bento-Gonçalves, A., & Vieira, A. (2020). Wildfires in the wildland-urban interface: Key concepts and evaluation methodologies. Science of The Total Environment, 707, 135592. [CrossRef]
- Caggiano, M. D., Hawbaker, T. J., Gannon, B. M., & Hoffman, C. M. (2020). Building loss in wui disasters: Evaluating the core components of the wildland–urban interface definition. Fire, 3(4), 73. [CrossRef]
- Carlson, A. R., Helmers, D. P., Hawbaker, T. J., Mockrin, M. H., & Radeloff, V. C. (2022). The wildland–urban interface in the United States based on 125 million building locations. Ecological Applications, 32(5). [CrossRef]
- Comer, G., Popchock, A., Brooks, J., & Szpakowski, D. (2021). Examining the relationship between fire hazard and burn severity for the Beachie Creek and Lionshead wildfires. In AGU Fall Meeting (A45U-2134). https://ui.adsabs.harvard.edu/abs/2021AGUFM.A45U2134C/abstract.
- De Graff, J. V. (2018). A rationale for effective post-fire debris flow mitigation within forested terrain. Geoenvironmental Disasters, 5(1), 1–9. [CrossRef]
- De Graff, J. V., & Gallegos, A. J. (2012). The challenge of improving identification of rockfall hazard after wildfires. Environmental & Engineering Geoscience, 18(4), 389–397. [CrossRef]
- De Graff, J. V. (2014). Improvement in quantifying debris flow risk for post-wildfire emergency response. Geoenvironmental Disasters, 1, 5. [CrossRef]
- De Graff, J. V., Shelmerdine, B., Gallegos, A., & Annis, D. (2015). Uncertainty associated with evaluating rockfall hazard to roads in burned areas. Environmental & Engineering Geoscience, 21(1), 21–33. [CrossRef]
- De La Fuente, J. A., & Mikulovsky, R. P. (2016). Debris flows and road damage following a wildfire in 2014 in the Klamath National Forest, Northern California, near the Community of Seiad, CA. In AGU Fall Meeting Abstracts (Vol. 2016, pp. H43G-1540). https://ui.adsabs.harvard.edu/abs/2016AGUFM.H43G1540D/abstract.
- Diaz, J. M. (2012). Economic Impacts of Wildfire. Southern Fire Exchange Fact Sheet. https://eadn-wc02-7111601.nxedge.io/wp-content/uploads/2012-7.pdf. /.
- Escaleras, M., Jha, A., & Boudreaux, C. J. (2022). Assessing the impact of natural disasters on industry gross domestic product in the United States. In: Handbook on the Economics of Disasters (pp. 193–207). Edward Elgar Publishing. [CrossRef]
- ESRI (2022). Archie Creek Fire, Western Oregon. ArcGIS StoryMaps. https://storymaps.arcgis.com/stories/ce3ee5f7c1704041967588e93dbad175.
- Evers, C., Holz, A., Busby, S., & Nielsen-Pincus, M. (2022). Extreme winds alter influence of fuels and topography on megafire burn severity in seasonal temperate rainforests under record fuel aridity. Fire, 5(2), 41. 2. [CrossRef]
- FEMA (2020). Holiday Farm Fire: Erosion threat assessment/reduction team (ETART) summary report. https://gscdn.govshare.site/1aa8ace4addf06592a8d7dcb775413bf10fd1ec6/ETARTSummary-HolidayFarm.pdf.
- Fox, D. M., Martin, N., Carrega, P., Andrieu, J., Adnès, C., Emsellem, K., Ganga, O., Moebius, F., Tortorollo, N., & Fox, E. A. (2014). Increases in fire risk due to warmer summer temperatures and wildland urban interface changes do not necessarily lead to more fires. Applied Geography, 56, 1-12. [CrossRef]
- Fraser, A. M., Chester, M. V., & Underwood, B. S. (2020). Wildfire risk, post-fire debris flows, and transportation infrastructure vulnerability. Sustainable and Resilient Infrastructure, 7(3), 188–200. [CrossRef]
- French, C. C. (2020). America on fire: Climate change, wildfires & insuring natural catastrophes. University of California, Davis. 54: 817, Penn State Law Research Paper No. 12-2020. https://elibrary.law.psu.edu/fac_works/405/.
- Habermann, N., & Hedel, R. (2018). Damage functions for transport infrastructure. International Journal of Disaster Resilience in the Built Environment, 9(4/5), 420–434. [CrossRef]
- Intini, P., Ronchi, E., Gwynne, S., & Bénichou, N. (2019). Guidance on design and construction of the built environment against wildland urban interface fire hazard: A review. Fire Technology, 56(5), 1853–1883. [CrossRef]
- Keane, T. (1996). The economic importance of the National Highway System. Federal Highway Administration. U.S. Department of Transportation. https://highways.dot.gov/public-roads/spring-1996/economic-importance-national-highway-system. /: Highway Administration. U.S. Department of Transportation. https, 1996.
- Kitchens, C., Nigai, S., & Jaworski, T. (2020). Globalisation and the value of domestic highway infrastructure. CEPR. https://cepr.org/voxeu/columns/globalisation-and-value-domestic-highway-infrastructure.
- Maranghides, A., & Mell, W. (2011). A case study of a community affected by the Witch and Guejito wildland fires. Fire Technology, 47(2), 379–420. [CrossRef]
- Mass, C. F., Ovens, D., Conrick, R., & Saltenberger, J. (2021). The September 2020 wildfires over the Pacific Northwest. Weather and Forecasting, 36(5), 1843–1865. 5. [CrossRef]
- Mostafiz, R. B., Friedland, C. J., Rohli, R. V., & Bushra, N. (2022). Estimating future residential property risk associated with wildfires in Louisiana, USA. Climate, 10(4), 49. [CrossRef]
- Nunes, A. N., Figueiredo, A., Pinto, C., & Lourenço, L. (2023). Assessing wildfire hazard in the wildland–urban interfaces (WUIs) of Central Portugal. Forests, 14(6), 110. [CrossRef]
- Oregon Annual Rainfall and Climate Data (2023). https://coolweather.net/staterainfall/oregon.htm.
- Oregon Department of Transportation (ODOT) (2023). Traffic Counting. https://www.oregon.gov/odot/data/pages/traffic-counting.aspx.
- Oregon Natural Hazards Mitigation Plan (2020). State of Oregon Promulgation. https://www.oregon.gov/lcd/NH/Documents/Approved_2020ORNHMP_00_Complete.pdf.
- Palmer, J. (2022). The devastating mudslides that follow forest fires. Nature, 601, 184–186. [CrossRef]
- Radeloff, V. C., Hammer, R. B., Stewart, S. I., Fried, J. S., Holcomb, S. S., and McKeefry, J. F. (2005). The wildland-urban interface in the United States. Ecological Applications, 15(3), 799–805. [CrossRef]
- Radeloff, V. C., Helmers, D. P., Kramer, H. A., Mockrin, M. H., Alexandre, P. M., Bar-Massada, A., Hawbaker, T. J., Martinuzzi, S., Syphard, A. D., & Stewart, S. I. (2018). Rapid growth of the US wildland-urban interface raises wildfire risk. Proceedings of the National Academy of Sciences (PNAS), 115(13), 3314-3319. [CrossRef]
- Richardson, D., Black, A. S., Irving, D., Matear, R. J., Monselesan, D. P., Risbey, J. S., Squire, D. T., & Tozer, C. R. (2022). Global increase in wildfire potential from compound fire weather and drought. NPJ climate and atmospheric science, 5(1), 23. [CrossRef]
- Rogers, M., & Enright, B. (2023). Highway Engineering. 4th Edition. John Wiley & Sons: NJ, USA. https://books.google.com/books?hl=en&lr=&id=CELGEAAAQBAJ&oi=fnd&pg=PA1&dq=the+importance+of+highways&ots=Wt5UBHEsUQ&sig=2TKuAvTffobDXK4X7kON6ozH5qI#v=onepage&q=the%20importance%20of%20highways&f=false. /: John Wiley & Sons: NJ, USA. https.
- Sarro, R., Pérez-Rey, I., Tomás, R., Alejano, L. R., Hernández-Gutiérrez, L. E., & Mateos, R. M. (2021). Effects of wildfire on rockfall occurrence: a review through actual cases in Spain. Applied Sciences, 11(6), 2545. [CrossRef]
- Sobieralski, J. B. (2021). Transportation Infrastructure and Employment: Are all investments created equal? Research in Transportation Economics, 88. [CrossRef]
- Swanson, B., Lukashov, S., Schwartz, J., Lindsay, D., & Lancaster, J. (2022). Assessment of logistic regression model performance and physical controls on January 9, 2018, debris flows, Thomas Fire, California. Environmental & Engineering Geoscience, 28(1), 113-131. https://pubs.geoscienceworld.org/aeg/eeg/article-abstract/28/1/113/611991/Assessment-of-Logistic-Regression-Model?redirectedFrom=fulltext.
- Tedim, F., Remelgado, R., Borges, C., Carvalho, S., & Martins, J. (2013). Exploring the occurrence of mega-fires in Portugal. Forest Ecology and Management, 294, 86-96. [CrossRef]
- 2017 Oregon Mileage Report (2018). Transportation Data Section Road Inventory & Classification Services. Oregon Department of Transportation. https://www.oregon.gov/odot/Data/Documents/OMR_2017.
Figure 1.
Map of 2020 Labor Day wildfires and highway affected in Oregon.
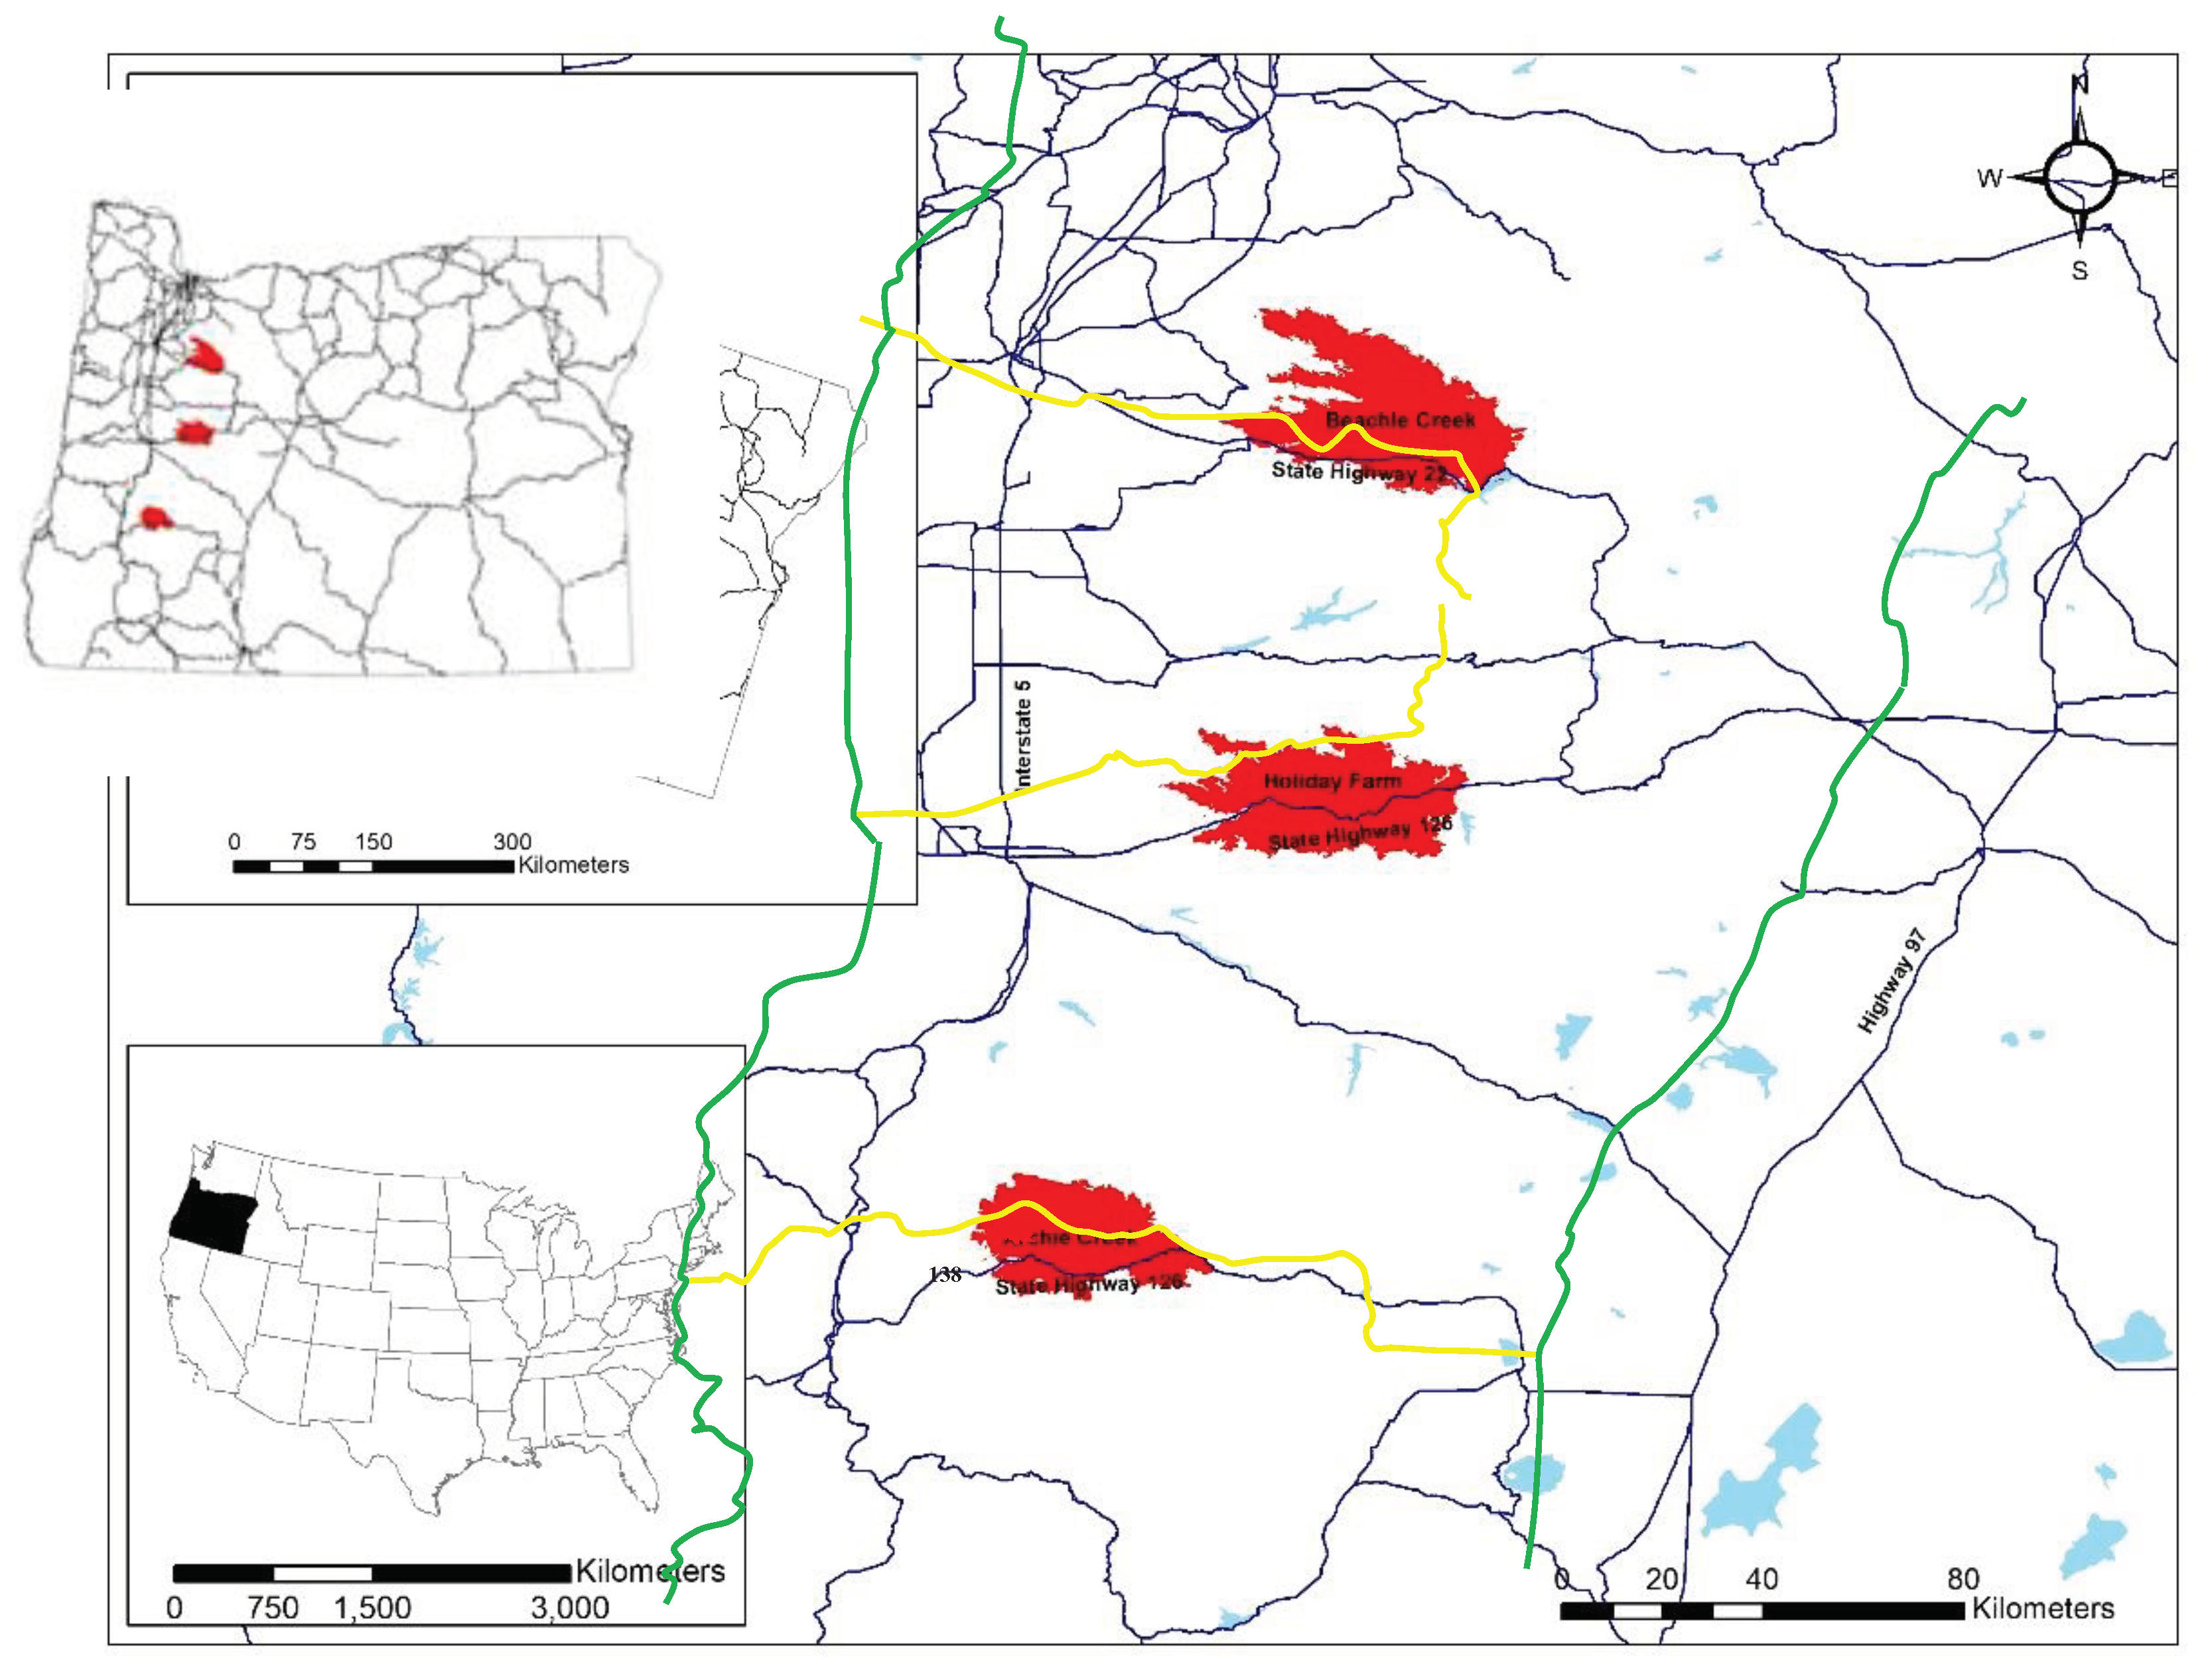
Table 1.
Length of Highway Closed for the Three 2020 Oregon Fires Included in the Case Study, by Highway.
Table 1.
Length of Highway Closed for the Three 2020 Oregon Fires Included in the Case Study, by Highway.
| Highway Impacted | Wildfire | Length of Highway Closed (km) | Total Length of Highway Impacted (Km) |
Percentage of Highway Closed during Wildfire |
|---|---|---|---|---|
| Hwy 022 | Beachie Creek Fire | 113 | 130 | 86.92% |
| Hwy 126 | Holiday Farm Fire | 37 | 178 | 20.79% |
| Hwy 138 | Archie Creek Fire | 136 | 163 | 83.44% |
| Total | 286 | 471 | 60.72% | |
Table 2.
Length and Percentage of Highway Damaged.
| Highway and Fire | Highway Impacted (km) | Highway Impacted by Hazard Tree Damage | Highway Impacted by Pavement Damage | Highway Impacted by Slope/Rock Scaling Damage | Highway Impacted by Structural Damage | Highway Hazard Trees Impacted | Highway Pavement Damage/Repairs Impacted | Highway Slope/Rock Scaling Damage Impacted | Highway Structural Damage Impacted |
|---|---|---|---|---|---|---|---|---|---|
| Highway | Footprint | Kilometers of Damage | Percentages | ||||||
| Beachie Creek Fire, Hwy 022 | 130 | 84 | 23 | 84 | 84 | 65% | 18% | 65% | 65% |
| Holiday Farm Fire, Hwy 126 | 178 | 69 | 29 | 0 | 69 | 39% | 16% | 0% | 39% |
| Archie Creek Fire, Hwy 138 | 163 | 58 | 19 | 19 | 106 | 36% | 12% | 12% | 65% |
| Total | 471 | 211 | 71 | 103 | 259 | 45% | 15% | 22% | 55% |
Table 3.
Average Daily Traffic (ADT) Impacts during the Wildfire Event.
| Highway – Wildfire | Milepost Range | ADT (2015-2019) | ADT in 2020 (during the Wildfires) | RADT |
|---|---|---|---|---|
| Highway 022–- Beachie Creek Fire | MP 22.40–- MP 81.51 | 5,857.75 | 5,269.56 | 11% |
| Highway 126–- Beachie Creek Fire | MP 21.40–- MP 45.37 | 3,896.00 | 3,514.60 | 11% |
| Highway 138–- Archie Creek Fire | MP 16.35–- MP 100.71 | 1,363.89 | 1,211.42 | 13% |
| Total | - | 11,117.64 | 9,995.58 | 11% |
Table 4.
Hazard tree removal, for the 2020 Labor Day wildfires in Oregon.
| Highway | Wildfire | Number of Hazard Trees Removed | Length of Highway Impacted (km) by Hazard Trees | Hazard Trees Removed/Kilometers of Highway Impacted |
|---|---|---|---|---|
| Hwy 022 | Beachie Creek Fire | 40,000 | 84.00 | 476 |
| Hwy 126 | Holiday Farm Fire | 10,000 | 69.00 | 145 |
| Hwy 138 | Archie Creek Fire | unidentified | 58.00 | undetermined |
| Total* | 50,000 | 153 | 381 | |
*Total based on Beachie Creek Fire and Holiday Farm Wildfire.
Table 5.
Pavement Damage, for the 2020 Labor Day wildfires in Oregon.
| Highway | Wildfire | Length of Pavement Damage (m) | Length of Highway Impacted by Pavement Damage (km) | Length of Pavement Damage (m) per (km) of Highway Impacted |
|---|---|---|---|---|
| Hwy 022 | Beachie Creek Fire | 945 | 23 | 41 |
| Hwy 126 | Holiday Farm Fire | 457 | 29 | 16 |
| Hwy 138 | Archie Creek Fire | unidentified | 19 | undetermined |
| Total* | 1,402 | 52 | 27 | |
*Total based on Beachie Creek Fire and Holiday Farm Fire.
Table 6.
Slope/Rock Scaling Damage, for the 2020 Labor Day wildfires in Oregon.
| Highway | Wildfire | Number of Slopes/Rock Scaling Locations (EA) | Length of Highway Impacted by Slope/Rock Scaling Damage (km) | Number of Slope/Rock Scaling Locations (EA) per Length of Highway (km) |
|---|---|---|---|---|
| Hwy 022 | Beachie Creek Fire | 1 | 84.00 | 0.01 |
| Hwy 126 | Holiday Farm Fire | 8 | unidentified | undetermined |
| Hwy 138 | Archie Creek Fire | unidentified | 19.00 | undetermined |
| Total* | 1 | 84 | 0.01 | |
*Total based on Beachie Creek Fire.
Table 7.
Structural Damage, for the 2020 Labor Day wildfires in Oregon.
| Highway | Wildfire | Length of Structures Damaged (m) | Length of Highway Impacted by Structural Damage (km) | Length of Structures Damaged per Length of Highway (m/km) |
|---|---|---|---|---|
| Hwy 022 | Beachie Creek Fire | 4,267 | 84 | 51 |
| Hwy 126 | Holiday Farm Fire | 4,267 | 69 | 62 |
| Hwy 138 | Archie Creek Fire | unidentified | 106 | undetermined |
| Total* | 8,534 | 153 | 56 | |
*Total based on Beachie Creek Fire and Holiday Farm Fire.
Table 9.
Area Burned per Length of Highway Road Closure, by Highway.
| Highway | Wildfire | Area Burned (ha) | Length of Highway Road Closures (km) | Hectares Burned per Length of Highway Road Closure (ha/km) |
|---|---|---|---|---|
| Hwy 022 | Beachie Creek Fire | 78,336 | 95 | 825 |
| Hwy 126 | Holiday Farm Fire | 70,170 | 56 | 1,253 |
| Hwy 138 | Archie Creek Fire | 52,233 | 100 | 522 |
| Total | 200,739 | 251 | 800 | |
Disclaimer/Publisher’s Note: The statements, opinions and data contained in all publications are solely those of the individual author(s) and contributor(s) and not of MDPI and/or the editor(s). MDPI and/or the editor(s) disclaim responsibility for any injury to people or property resulting from any ideas, methods, instructions or products referred to in the content. |
© 2023 by the authors. Licensee MDPI, Basel, Switzerland. This article is an open access article distributed under the terms and conditions of the Creative Commons Attribution (CC BY) license (http://creativecommons.org/licenses/by/4.0/).
Copyright: This open access article is published under a Creative Commons CC BY 4.0 license, which permit the free download, distribution, and reuse, provided that the author and preprint are cited in any reuse.


