Submitted:
03 October 2023
Posted:
10 October 2023
You are already at the latest version
Abstract
Rapid urbanization has led to many ecological problems such as landscape fragmentation, decreased landscape connectivity, and decreased biodiversity. Building an ecological security pattern is an important way to ensure ecological security and maintain sustainable urban development. Harbin is an important large-scale city in northeastern China, and the urban central district of Harbin is used as the study area. Ecological sensitivity assessment, MSPA, gravity model, landscape connectivity assessment and MCR model were used to extract ecological source areas, ecological corridors and ecological nodes in the study area to construct and optimize the ecological security pattern. Research shows that: A total of 23 ecological source areas were identified, mainly located along the Songhua River in the central part of the study area and in the mountain forest areas within the A-cheng District in the southeastern part of the study area. 48 ecological corridors were extracted, mainly in Daowai District, A-cheng District and the eastern part of Xiangfang District. There are 8 important ecological corridors and 10 important connecting corridors. 61 ecological nodes of the first level and 65 ecological nodes of the second level were extracted. High, higher, medium, lower and low security areas were classified based on the minimum cumulative resistance surface, with the highest proportion of high ecological security areas accounting for 45.75% of the study area. 65 ecological breakpoints were extracted and restoration measures were proposed. Finally, The structure of the ecological security pattern optimization of "two axes, two belts and four areas" is proposed, and corresponding ecological management measures are put forward. The experimental system of this study can provide new ideas for the construction of ecological security patterns in other regions and provide scientific support for the ecological sustainable development of similar urban areas.
Keywords:
ecological security pattern
; minimum cumulative resistance model
; morphological spatial pattern analysis
; harbin central district
1. Introduction
After many decades of urbanization, environmental problems in China's urban ecosystems have become increasingly serious[1,2,3]. Environment-related problems such as disordered and chaotic land use, disappearance of ecological land, fragmentation of green space patterns, impairment of ecosystem services, destruction of ecosystems, and loss of biodiversity continue to arise[4]. In 2009, the policy of "Measures of the State Council on Revitalizing the Old Industrial Base in Northeast China" was introduced and the urban transformation of Northeast China has been accelerated, but as a result, it has led to many ecological problems[5]. In the context of having so many environmental problems, many scholars have proposed the concept of ecological security pattern[6,7,8,9,10]. Since its introduction in the 1990s, the theory of ecological security patterns has gradually become a research hot spot in global ecology, environmental science, and urban planning[11]. Ecological security pattern is the spatial structure of ecosystem that sustains the long-term survival and development of life on Earth, including human beings[12]. The construction of a scientific and reasonable ecological security pattern has become an important means of maintaining urban ecological security[13].
Ecological patterns have spatial and temporal heterogeneity. The focus of ecological security pattern construction should be different at different scales and regions[14]. With the expansion of the built-up area of the city, the peripheral space immediately adjacent to the urban central district has always been at the forefront of advancing urbanization. Therefore, the construction of the overall ecological security pattern of the urban central district and the surrounding towns and the construction of integrated spatial planning are conducive to the sustainable development of the city as a whole[8].
At present, extracting ecological source areas, delineating resistance surfaces and identifying corridors are the dominant paradigms for constructing and studying ecological security patterns[15,16]. In the study of regional ecosystems, the ecological source area is the most valuable part for conservation and ecosystem services, and its identification and extraction is the basis for the construction of ecological security patterns[7]. There are currently two main categories of methods for identifying ecological source areas. One category selects patches with better habitat quality directly as base ranges, such as parks, nature reserves, watersheds and woodlands. The identification of ecological source sites was further screened through techniques such as landscape connectivity analysis[17], integrated valuation of ecosystem services and trade-offs (InVEST) model[18,19], and morphological spatial pattern analysis (MSPA)[20,21,22]. These approaches focus more on the spatial morphological attributes of ecosystems. Another category considers the spatial characteristics of the study area for multi-indicator ecological assessments, such as ecosystem service importance assessment[23,24], ecological sensitivity assessment[25,26] and environmental suitability assessment[27,28]. These methods focus more on the functional attributes of ecosystems and facilitate the accurate extraction of areas with potential environmental problems. Morphological Spatial Pattern Analysis (MSPA) is a method for identifying source sites based on spatial morphological attributes such as patches and spatial relationships, which avoids the drawbacks of subjective selection of ecological source areas[29]. However, MSPA categorizes land cover types by raster arithmetic[30]and relies on morphology to get the source areas, which lacks the consideration based on the actual ecological needs of the study areas in the process. Ecological sensitivity is the degree to which ecosystems respond to disturbances from human activities and changes occurring in the natural environment. It indicates the ease and likelihood of regional ecological and environmental problems[31]. Ecological sensitivity assessment is essentially a clear identification of potential ecological problems in the context of the current natural environment, and manifests them in specific spatial scales, which makes ecological sensitivity an important means of constructing an ecological security pattern[32]. The combination of ecological sensitivity evaluation can improve the conventional MSPA method of categorization based on land cover type. This approach can simultaneously increase the applicability and scientific validity of selected ecological source sites. Finally, the ecological corridors between important ecological source areas are extracted by the Minimum Cumulative Resistance (MCR) model to realize the construction of ecological security patterns[33].
Located in the heart of Northeast Asia, Harbin is an important center city in Northeast China, as well as an important national manufacturing base and a center city for development and opening along the border. In recent years, there have been studies on the ecological security pattern of Harbin city center[34], the regional ecological network and the ecological security pattern of the Harbin-Changchun urban agglomeration[35], but there is a lack of studies on the complete urban central district. The densely populated urban central district of Harbin was selected as the study area, and the study was based on the field ecological background characteristics to assess the ecological sensitivity analysis level of the study area. Ecological source sites can be obtained by combining the results of the ecological sensitivity evaluation with the MSPA method. When constructing the resistance surface, the natural and anthropogenic factors should be considered comprehensively, and the minimum resistance model should be utilized to extract the ecological corridor and gradually construct the ecological security pattern. It is hoped that it can provide scientific references for the ecological security of urban areas, achieving sustainable urban development, and discovering ecological space protection and optimization schemes.
2. Overview of the Study Area and Data Sources
2.1. Overview of the Study Area
Harbin is located in the south-central part of Heilongjiang Province (12°42'~130°10'E, 44°04'~46°40'N), on both sides of the Songhua River. It is the largest city in China among provincial municipalities in terms of land area, with a total area of about 53,840 km2(Figure 1). Harbin's overall topography is high in the east and low in the west, with mountains and hills predominating in the east and plains in the west, and it is a typical region in the Northeast where the urbanization process is faster and the natural environment is changing more rapidly. Harbin is rich in land resources and soil types, with a large proportion of arable land, and is an important hub for industrial development and food production base in the northeastern region. According to the Harbin City Urban Master Plan (2011-2020) (2017 revision), the total area of its urban central district is approximately 4,187 km2, and the selected area for the study is about 4,320 km2, which includes: the administrative districts of Daoli, Daowai, Nangang, Xiangfang, Pingfang, and Songbei Districts, as well as parts of Hulan and Acheng Districts[36].
2.2. Data Source
The 2020 land use dataset (30m*30m) used in the study was obtained from the China Geographical Information Monitoring Cloud Platform (http://www.dsac.cn/). The DEM data are derived from the ALOS (Advanced Land Observing Satellite) China regional dataset with a resolution of 12.5m (www.csdn.store). NDVI data were obtained using Landsat-8 remote sensing data for September 2021 with a cloudiness of 0.03 decoded by ENVI software. Landsat-8 remote sensing data obtained from Geospatial Data Cloud (www.gscloud.cn). Vegetation fraction coverage (VFC) were obtained by NDVI. The roadway data is from the Open Street Map platform DE 2023 regional data for Heilongjiang Province (www.openstreetmap.org). Soil data were obtained from the Harmonized World Soil Database China Soil Dataset (v1.2) (1 km*1 km) (www.fao.org/soils-portal). The precipitation data comes from National Earth System Science Data Center, National Science & Technology Infrastructure of China (http://www.geodata.cn).
3. Research Methodology
3.1. Evaluation of Ecological Sensitivity
3.1.1. Selection and Ranking of Evaluation Factors
Ecological sensitivity is the degree of responsiveness of ecosystems to anthropogenic disturbances and changes in the natural environment, indicating the ease and likelihood of occurrence of regional ecological problems[31]. This study combines the current status of the ecological environment in the Harbin area and selects evaluation factors based on the topography and geomorphology of Harbin, soil safety, vegetation and water system, and anthropogenic activities. Elevation, slope, slope direction, degree of topographic relief, soil type, soil erodibility, rainfall, watershed buffer, vegetation fraction coverage (VFC), settlement buffer, and land use type were identified as single factors for ecological sensitivity evaluation. The ecological sensitivity of the evaluation factors is divided into five levels: extremely sensitive, highly sensitive, moderately sensitive, slightly sensitive and insensitive according to the grading standards of the Interim Regulations on Ecological Functional Zoning Techniques (Ministry of Ecology and Environment)[25]. The grades were assigned values of 9, 7, 5, 3, and 1 to obtain the grading table for single factor evaluation of ecological sensitivity (Table 1).
3.1.2. Factor Weight Assignment
In this study, the expert consultation and scoring method was used to compare and assign values to the relative importance of each evaluation factor for elevation, slope, slope direction, topographic relief, soil type, soil erodibility, rainfall, watershed buffer, vegetation fraction coverage (VFC), settlement buffer, and land use type. Based on Analytic Hierarchy Process (AHP)[37], Yaahp software was used to construct judgment matrix to determine the weights of each factor, and consistency test was performed to ensure that the test coefficients met the requirements. Eventually, the weights of the ecological sensitivity factors in the urban central district of Harbin can be obtained (Table 1).
3.2. Ecological Source Area Identification
3.2.1. Landscape Pattern Analysis based on MSPA Model
MSPA model processes raster images through the principles of mathematical morphology and reclassifies the original shapes to describe their morphological characteristics, thus generating landscape ecological patches at the pixel level.First of all, based on the current land use status, woodland, grassland, water area, mudflat, and marsh were selected as the foreground for MSPA analysis, and the rest of the land use types were used as the background[38].
Secondly, according to the characteristics of the urban central district of Harbin, areas with ecological sensitivity evaluated as highly sensitive and extremely sensitive areas were selected to join the foreground. The data were reclassified using ArcGIS 10.2 software with foreground value set to 2, background value set to 1, missing data set to 0. After importing the data into the MSPA analysis software, outputting TIF plots and counting the results, seven categories of landscape types such as Core, Bridge, Islet, and Perforation can be identified. The overall connectivity index (IIC) and the probable connectivity index (PC) were calculated for the core area patches by Conefor2.6 software to characterize the landscape connectivity level of the ecological patches. On the basis of the delta of PC, the top-ranked patches were selected as ecological source areas. The formulae for each index are as follows:
In the formula, i≠j, n denotes the total number of extracted ecological source patches, ai is the area of patch i, aj is the area of patch j, nlij denotes the number of connections between patches i and j, AL2 denotes the total area of the core area, Pij* is the probability of the maximum product of all the paths between patch i and patch j, and PCremove is the value of the overall index of the remaining patches after removing a certain patch. Combined with the situation of the study area, the top 30 core area patches were extracted for landscape connectivity analysis, and with the help of Conefor2.6, the connectivity probability was set to 0.5, the delta of patch connectivity index (dPC) was calculated, and the core area patches with dPC > 0.1 were selected as the ecological source areas.
3.3. Constructing Resistance Surface
The flow of ecological material between ecological source areas requires overcoming site resistance. Ecological resistance surfaces are data surfaces formed by resistance values at various locations within a site[39] that reflect trends and possibilities in landscape ecological functions and ecospatial processes. Referring to relevant studies[40,41,42,43], the differences in habitat suitability due to land type, topography and vegetation fraction coverage were distinguished according to the characteristics of the current situation in the urban central district of Harbin, and taking into account the ecological characteristics of cold regions. The closer the distance to roads and buildings, the stronger the anthropogenic interference, and finally the factors of land use type, topographic relief, slope, vegetation fraction coverage and distance from settlements were selected as resistance factors. Assign values to each resistance factor based on the attenuation principle, etc. AHP was used to determine the weights, and Yaahp software was used to construct the discriminant matrix and perform consistency test to obtain the weights(Table 2). The composite resistance surface was obtained by weighted superposition of each resistance surface using ArcGIS 10.8 software.
3.4. Ecological Corridors and Nodes Extraction
Ecological corridors are the carriers of energy and material flow in the region, and they are the key ecological components that keep ecological processes and functions connected in the region. In this study, the Minimum Cumulative Resistance (MCR) model was used to obtain the ecological corridors. The model calculates the target resistance value between the ecological source and the target source based on the ecological resistance surface, and obtains the least-cost path between the two. This path can be regarded as the optimal path for species to migrate and spread between two locations. The formula is as follows:
In the formula, MCR is the minimum cumulative resistance value; f is a positive function of the migration process of the minimum cumulative resistance value; Dij denotes the spatial distance of energy or material from j to i, and Ri denotes the resistance value of the landscape surface i.
Based on the integrated resistance surface, the minimum cumulative resistance value was calculated among the ecological source areas, and the MCR model was used to generate potential ecological corridors in the study area. Corridors that are closely distributed with overlapping or similar corridors can be screened out by determining the relative importance of potential corridors to regional ecological security through the magnitude of forces. The formula is as follows:
In the formula, Gij denotes the ecological gravity between patches i and j; Ni and Nj denote the weight values of patches i and j; Dij is the normalized value of the potential corridor resistance between i and j. Pi and Pj denote the resistance values of patches i and j; Lij denotes the cumulative resistance value between patches i and j, and Lmax denotes the maximum resistance value of the potential corridor. Combining the results of the gravity values F, the corridors with F ≥ 10 in the source area are classified as important corridors, and the rest are classified as general corridors.
Ecological nodes are located in ecological corridors where ecological functions are more vulnerable and have a vital role in the operation of ecological flows[44,45]. The intersection of the ecological corridor with the resistance surface ridgeline is the first level ecological node, and the intersection between the corridor and the corridor is the second level ecological node.
3.5. Ecological Security Pattern Construction
The ecological security pattern of the urban central district of Harbin is constructed by the superposition of ecological sources, ecological corridors , important nodes, and ecological security zones. The natural breaks method was utilized to reclassify the resistance surfaces in the study area, and the ecological security level of the study area was classified into five categories, namely, high level ecological security area, higher level ecological security area, medium ecological security area, lower level ecological security area, and low level ecological security area.
Based on the source area-corridor-node and ecological security area, the current situation, dilemma and future trend of the spatial operation of urban construction, agriculture, ecology and scenic recreation in the urban central district of Harbin were comprehensively understood through expert consultation and fieldwork. According to the distribution of railroads, highways and national highways in the study area, the ecological corridors were intersected and superimposed using ArcGIS, and then the ecological corridor breakpoints were obtained. Combining the above results, a scientific, effective and practical strategy can be formulated for ecological protection, restoration and spatial optimization.
4. Results and Analysis
4.1. Ecological Sensitivity and Ecological Source Site Identification for MSPA
4.1.1. Ecological Sensitivity Classification of the Study Area
As can be seen from the single factor sensitivities in Figure 2, within the study area, sensitivities regarding topography and geomorphology are generally low; sensitivities regarding soil safety are moderate; and sensitivities related to vegetation, watersheds, and human activities are significantly higher. This situation is more in line with the characteristics of the study area as a plains city: influenced by the topography and geomorphology, there is a significant gap between the few hilly and mountainous areas and the large plains area. Land use types can visualize the impact of human activities on natural ecology. The hilly areas in the southeast are higher in elevation and have steeper slopes, making them difficult to exploit and therefore less affected by human activities. Moreover, this area is prone to landslides and has high sensitivity, but the area is not large. The region is characterized by the presence of large areas of agricultural land and forests as a whole, with high vegetation fraction coverage and associated sensitivities. The soil consists mainly of loam and is not very sensitive overall. Precipitation gradually increases from northwest to southeast. The study area is characterized by the presence of large wetlands and mudflats with a relatively homogenous ecological structure. Moreover, the area lacks a sufficient number of high-level communities such as forests to serve as barriers, and watershed ecological sensitivity is high.
From the comprehensive sensitivity evaluation in Figure 3 and Table 3, it can be seen that the ecological sensitivity in the study area is mainly dominated by moderate sensitivity and slight sensitivity, accounting for 36.13% and 30.87% respectively of the total study area. This indicates that the overall ecological condition is relatively average, mainly due to the high level of construction land and arable land. The overall distribution of ecological sensitivity in the study area shows a low distribution in the northwestern region and a high distribution in the southeastern region. The areas of extremely high ecological sensitivity and high sensitivity accounted for 3.71% and 12.22% of the total area respectively, with most of them distributed in the hilly areas of the southeast and a few in the central and northwestern regions, and with the land use types of forests, grasslands and wetlands. Insensitive areas account for 17.07% of the total, and the main land use type is urban construction land, which is the main site of human activities. This area is a higher threat to other areas of higher ecological sensitivity, so the moderately sensitive area, which covers 36.13% of the study area, is an important buffer area that also requires focused protection.
4.1.2. Ecological Sensitivity Classification of the Study Area
The results were obtained after MSPA analysis (Figure 3a) and as shown in Table 4, the area of the seven landscape types totaled 1,252.35 km², which represents 28.99% of the total area of the study area. The area of the core patches is 916.94km², which is 21.23% of the study area and 73.22% of the ecological landscape area. The core patches are larger and more stable in the mudflats and marshes area along the Songhua and Hulan Rivers, which includes national and provincial ecological reserves such as Sun Island National Wetland Park, Alejin National Wetland Park and Hekou Wetland Park. In addition, the patch stability is also stable in the mountain forest area, which is located in the southeast of Hongxing Township in A-cheng District, adjacent to the Changshou Mountain National Forest Park and Jinlong Mountain National Forest Park.The core patches are smaller and more fragmented, which are distributed in Duiqingshan Township located in Songbei District, along the Ashihe River located in A-cheng District and the west part of Chenggaozi Township, etc. The bridge patches play a role in connecting the structures for biological migration and communication, with an area of 68.80km2, accounting for 5.49% of the ecological landscape area. Bridge patches are heavily distributed in the southeastern portion of the study area, suggesting that the source areas in this region have significant fragmentation, but good connectivity. The areas of edge and perforation patches accounted for 1.59% and 0.19% of the study area and 9.36% and 0.65% of the total ecological landscape area, respectively, both of which are areas that produce edge effects. The large area of edge patches indicates that patches in the study area are heavily fragmented. The small area of perforation patches suggests that the core patches with larger area are stable. As isolated ecological landscape patches, islet patches are small in size and fragmented in distribution. They serve as pedal stones in the ecological network and accounts for 4.88% of the total ecological landscape area. Branch patches also have some connectivity effects, accounting for 5.04% of the total ecological landscape area. Loop patches are small, representing only 1.35% of the total ecological landscape area.
All the core patches were ranked by area and the top 30 of those areas were selected. The dIIC, dPC was calculated for each area using Conefor2.6 software. Finally, 23 important core patches were selected as ecological source areas based on the index results. The geometric center of the source area is the ecological origin, as in Figure 4b.The ecological indices for each source area are shown in Table 5.
4.2. Ecological Resistance Surface Construction
Each single factor resistance surface was calculated by ArcGIS software. The composite resistance surface is obtained by superimposing all the single factor resistance surfaces according to the weights obtained through AHP calculation (Figure 4). The resistance values for the composite resistance surfaces range from 10.65 to 786.6. According to Table 2, the most important factor is the land use type, followed by distance from highway and railroad and vegetation fraction coverage. Most of the land use types in the study area are arable land and water area,with moderate resistance values. The areas with high resistance values are mainly located in the built-up areas in the central part of the study area, as well as in the surrounding settlements and areas of highways and railroads. Human activities have seriously damaged the ecology of these areas, resulting in high ecological resistance and seriously affecting the migration of regional biological species and bioenergy flow. Due to the overall plains topography of the study area, the slope resistance surfaces and topographic relief resistance surfaces are generally low.
According to the ecological source areas and the composite resistance surface, the minimum cumulative resistance surface was calculated using the cost distance tool of ArcGIS software(Figure 5). Extremely high values of resistance are mainly found in the built-up areas of the city center and the Pingfang District, while higher values of resistance are found in the built-up areas of the University Town area in Songbei District, along South Main Street in Hulan District and along Zhongdu Street in A-cheng District. The south bank of the Songhua River has an overall higher resistance value than the north bank, mainly due to the presence of built-up areas such as the city center as well as dense highways and railroads on the south bank. Areas of lower resistance values on the south bank exist primarily in the mountain forest areas in the southeast, as well as in the Ash River National Wetland Park and the Huicai Gulch to the south of the park, making them important areas for building the ecological pattern.
4.3. Extraction of Ecological Corridors and Nodes
Based on the minimum cumulative resistance surface, the MCR model can calculate the minimum cost distance of each landscape element from the original source to the target source to construct the potential ecological corridors.A total of 253 potential ecological corridors were obtained. The gravity model was used to calculate the gravitational force values foro each potential corridor to obtain the gravity matrix(Table 6). Excluding the corridors with gravitational values lower than 0.2 and those that have overlapped occurrences, 48 ecological corridors with a total length of 807.17km were finally obtained(Figure 6). Corridors with gravitational values more than 10 were screened as important ecological corridors, and 10 corridors were screened with a total length of 82.55km. The corridors with higher gravitational values and connecting to more distant source areas were selected as important connecting corridors, totaling 8 corridors with a total length of 195.26km. The remaining 30 are general ecological corridors.
The corridor in the study area exists mainly in the southeastern region, with a tandem covering A-cheng District, Hongxing Town, Chenggaozi Town and Xiangyang Town. Most of the ecological source areas exist in these regions, and the source areas are close to each other, have high gravitational pulls, and are networked and well connected. The remaining small portion of the corridors pass through the Democracy Town to the north to Hulan District, Duiqingshan Town and then south around back to Songbei District. These corridors are only strung together to form a pathway that becomes an important corridor connecting the north and south bands. The overall distribution of ecological corridors in the study area is small and uneven. One reason is that the northeastern region lacks ecological source areas for connectivity, and the other is that the southern urban built-up area has a very high resistance value, making it difficult for the corridor to connect in this area. However, as the Songhua River coastal area alone becomes a huge source area possessing linear features, covering and connecting the eastern and western, northern and central parts of the study area. The ecological corridor connects the central to western part of the study area, so the overall ecological level of the study area is good. Subsequent planning could proceed with the addition of pedal stone patches in the northeastern and southern areas, as well as the protection of existing ecological corridors.
Ecological nodes are an important part of the ecological network, when organisms move in the corridors, ecological nodes can be used as pedal stones and turning points for organisms to migrate, and can provide good resting places for species that migrate long distances. Intersecting the ecological corridors with the resistance surface ridgelines in the study area yielded a total of 61 ecological nodes at the first level; intersecting the corridors with each other yielded 65 ecological nodes at the second level.
4.4. Ecological Security Pattern Construction and Optimization
4.4.1. Ecological Security Pattern Construction
The ecological source areas, ecological corridors and nodes and ecological security areas are superimposed to constitute the ecological security pattern of the urban central district of Harbin(Figure 7a). Ecological security areas in the study area were categorized into 5 levels, high level ecological security areas accounted for 45.75% of the total area; higher level ecological security areas accounted for 28.34% of the total area; medium ecological security areas accounted for 18.09% of the total area; lower level ecological security area(Table 7). A total of 84.09% of high level ecological safety areas and higher level ecological safety areas indicate that the overall ecological condition of the study area is good.The low level ecological safety area is mainly located in the southern urban built-up area, where there is a lack of ecological source areas and obstacles to the formation of corridors between other source areas.
Intersecting the corridor with railroads and highways yielded a total of 75 ecological break points. Of these, 31 are located on railroads and 44 are located on highways. There are 15 break points distributed in 6 corridors on the north bank of the Songhua River and 60 break points distributed in the remaining 42 corridors. The connectivity function of the corridors is easily hindered at break points, where green spaces should be constructed such as biologically passable bridges and underpasses to provide access for species dispersal.
4.4.2. Strategy for optimising ecological security pattern
Based on the identified ecological source areas, corridors and nodes, the structure of the ecological security pattern optimization of "two axes, two belts and four areas" is proposed through the analysis of the characteristics and problems of the study area(Figure 8).
Two axes: Songhua River ecological axes and Hulan River-A cheng ecological axes. The Songhua River ecological axes runs east-west through the study area, within the largest ecological source area in the study area, and plays an important role in transmitting information, energy, and material flows between ecological regions in the study area. Within it exist important ecological areas such as the Sun Island National Wetland Park, Qunli Bund Wetland and Alejin National Wetland Park. The ecological corridors in the study area separated by this axes show a clear difference in north-south distribution. Hulan River-A cheng ecological axes running north-south through the study area. The part of the Hulan River exists within the largest ecological source area in the study area, with important ecological areas such as the Hulan Estuary Wetland and the Whitefish Bubble Wetland. The part of A-cheng exists in the second largest ecological source area in the study area, close to the Changshou Mountain National Forest Park and Jinlong Mountain National Forest Park, and the whole axes needs to be focused on as it covers a large number of ecological corridors. The western part of this axes is the vast majority of the built-up area, while the eastern part is the arable land area.
Two belts: Songbei-Acheng corridor belt and urban eco-corridor restoration belt. The Songbei-Acheng corridor belt consists of ecological corridors on the north and south sides of the Songhua River, spanning a long distance. The northern corridor is narrow and monolithic, and needs to focus on solving the problem of breakpoints and consolidating the level-1 and level-2 ecological nodes. The urban eco-corridor restoration belt is an ecological corridor that connects the north and south areas by another direction, and a narrow and monolithic corridor also exists in its northern part, which is treated in the same way as above. At the same time, its midway area is the saddle of the resistance surface of the city built-up area, which is an easier part to build new ecological corridors, and can focus on the construction of new ecological source areas to increase connectivity.
Four areas:
(1) Argo-ecological development area.
It is distributed in Hulan District in the northern part of the study area, which is a key area for the construction of basic farmland. The main land use type in the region is arable land, resulting in a lack of ecological source area. Protective forest belts can be established to protect arable land and build new basic corridors.
(2) New urban eco-development area.
The area is distributed in Songbei District in the northwestern part of the study area, with a small amount of new built-up area and a small number of narrow and monolithic corridors present. The ecology of this area has not yet been seriously damaged by urban development, but there are only a few ecological source areas and corridors. The size of the ecological source area could be expanded based on the grassland area near the Duiqingshan town , and additional protective forests could be added near the built-up area. This approach can build the corridor network in the region and increase ecological corridor stability.
(3) Urban ecological restoration area.
The area is mainly the built-up urban area on the south bank of the Songhua River, which is in poor ecological condition and lacks basic ecological source areas. Small-scale ecological projects can be planned at multiple points as a solution, such as establishing road greenery to improve the surrounding environment. The route in the direction of Changling Lake Tourist Area to Heilongjiang Forestry Botanical Garden is the resistance saddle of the area, which can be used as the main route for the restoration corridor construction.
(4) Important ecological culvert area.
This area is distributed in the Daowai and A-cheng Districts in the southeastern portion of the study area, and there are widely distributed ecological source areas, high habitat quality and low ecological resistance. Eco-strategic points are mainly located in this area and need to be maintained with emphasis. There are also a large number of ecological breakpoints in this area, and a lot of green space needs to be built to help species spread.
5. Discussion
The construction of ecological security patterns is considered to be an effective way to maintain the stability of regional ecosystems. It can provide guidance for subsequent ecological restoration measures such as the delineation of protected areas and corridors construction[46]. This paper follows the sequence of "identifying source areas, constructing resistance surfaces, extracting corridors and nodes and constructing and optimizing ESP". However, there is no standardized research methodology for the individual steps. Based on the strengths and weaknesses of some of these method selections and applications, we discuss them as follows.
- (1)
- A combination of ecological sensitivity assessment and MSPA analysis was selected to identify ecological source areas. In the past, there have been research approaches such as valuation based on ecosystem service values, subjective selection of patches with better habitat quality and so on within similar studies[36]. This paper combines qualitative and quantitative methods, taking into account the spatial and functional characteristics of the study area, which is more scientific and convincing. In the process of ecological sensitivity evaluation, there is no unified system of rules in academia. In this paper, 11 ecological factors were selected as evaluation indicators, such as topography and geomorphology, soil safety, vegetation and water area, and human activities, which can effectively reflect the remarkable ecological environment status in the study area. However, data collection is limited and factors such as geologic hazards and species distribution were not considered in this study.In the future, the system of indicators could be further refined. At the same time, the weighting of the indicators relies mainly on national regulations and past experience, and relies heavily on subjective decision-making by experts.The presence of a human subjective element is inevitable in the process. Therefore, more objective methods could be added in the future, such as the variation coefficient method and the entropy method. In the MSPA analysis, the selection of foreground is not uniformly definitive and needs to be decided depending on the current state of the area and the purpose of the study. During the selection of foreground, in addition to selecting woodlands and grasslands, this paper features mudflat, marsh, and areas with extremely and highly ecological sensitivity. This enables a more complete extraction of ecological source areas. In the selection of distance thresholds, 2500 m was chosen for this study, which is commonly used at medium scales. In the future, comparative studies of different results at multiple thresholds can be performed. In the process of landscape connectivity evaluation with Conefor2.6 software, larger patches were selected for evaluation, and some smaller source areas with high quality may have been omitted. In the future, source areas could be further searched for in smaller precision areas.
- (2)
- In the construction of the minimum cumulative resistance surface, this study is more scientific because it considers both natural factors such as land use type and vegetation fraction coverage, and anthropogenic factors such as distance to roads, distance to settlements, etc. . However, the ability to access the data is limited, some other factors are missing, such as the distribution of species and differences in the ability of species to find resources. Meanwhile, similar to the ecological sensitivity evaluation, the process of constructing resistance surfaces requires empirically-driven evaluation of scores and weights, and more objective methods need to be added in the future.
- (3)
- The extraction of ecological corridors is based on the gravity matrix calculated by Conefor2.6, and the connectivity index is used to screen potential corridors and identify important corridors, which is intuitive and scientific. However, there is a problem of strong correlation between the evaluation results and the size of the ecological source areas, which leads to the possibility that some high-quality corridors in smaller sizes may be omitted. In the future, corridor networks with specific functions can be further constructed in smaller precision areas.
In terms of data selection for the study, the 30 m precision correlation data used in this study meets the needs of the research process. However, more detailed and valid results would be obtained if more precise land use data were used. Meanwhile, patches with better habitat quality such as nature reserves can be selected as source areas in the future, and the ecological network can be further improved based on the results of the current experiment to solve the dilemma of the lack of source areas and corridors in some areas.
6. Conclusions
This study combines ecological sensitivity assessment, MSPA and landscape connectivity to construct an ecological evaluation system. The system was used to evaluate the ecological security and determine the ecological source areas in the urban central district of Harbin. The ecological corridors and nodes were extracted using MCR, and the ecological nodes and breakpoints were calculated using ArcGIS software. The above elements are superimposed to construct and optimize the ecological security pattern of the urban central district of Harbin. The results are as follows:
(1) The ecological sensitivity level in the study area is mainly moderate and low sensitivity; highly sensitive areas account for only 3.71% of the study area and are concentrated in the southeastern mountain forest area. This indicates that the overall ecological security of the study area is not very good.
(2)A total of 23 ecological source areas were obtained through MSPA calculations, representing 21.23% of the study area. 48 ecological corridors with a total length of 807.17km were obtained through the connectivity index evaluation and MCR. There are 10 important corridors and 8 important connecting corridors with a total length of 82.55km and 195.26km respectively. 61 level-1 ecological nodes and 65 level-2 ecological nodes were identified. Considering the intersection of the corridors with roads and railroads, 75 ecological break points were obtained, including 31 railroad break points and 44 road break points. Based on the resistance surface evaluation, ecological security areas were obtained, the largest of which was the high-level ecological security area, which accounted for 45.75% of the total area.
(3)The structure of the ecological security pattern optimization of "two axes, two belts and four areas" was proposed, which provides guidelines for the ecological restoration of the urban central district of Harbin. In addition, the ecological security evaluation system constructed in this study provides new ideas for ecological security research in other high-latitude urban areas.
Author Contributions
Conceptualization, Y.L.(Yulin Liu) and Y.L.(Yi Lu); methodology, Y.L.(Yulin Liu); software, Y.L.(Yulin Liu), H.Z. and S.Z.; validation, Y.L.(Yulin Liu) and X.Y.; formal analysis, Y.L.(Yulin Liu) and H.Z.; investigation, Y.L.(Yulin Liu) and S.Z.; resources, Y.L.(Yulin Liu); data curation, Y.L.(Yi Lu); writing—original draft preparation, Y.L.(Yulin Liu); writing—review and editing, Y.L.(Yulin Liu) and Y.L.(Yi Lu); visualization, Y.L.(Yulin Liu); supervision, Y.L.(Yi Lu). All authors have read and agreed to the published version of the manuscript.
Funding
This research was funded by the General Program of Joint Funds of the National Natural Science Foundation of China, “A study of the mechanisms of cold islands in the seasonal variation of the horizontal and vertical structure of cold urban forests”(Grant No. 42171246) and Fundamental Research Funds for the Central Universities, Northeast Forestry University (2572018CP06, 2572017CA12).
Institutional Review Board Statement
Not applicable.
Informed Consent Statement
Not applicable.
Data Availability Statement
Data are available from the corresponding author upon reasonable request.
Acknowledgments
Thanks to all the foundation project support and all the authors for their hard work.
Conflicts of Interest
The authors declare no conflict of interest.
References
- Wei, S.; Pan, J.; Liu, X. Landscape Ecological Safety Assessment and Landscape Pattern Optimization in Arid Inland River Basin: Take Ganzhou District as an Example. Human and Ecological Risk Assessment: An International Journal Human and Ecological Risk Assessment: An International Journal 2020, 26, 782–806. [Google Scholar] [CrossRef]
- Wang, Q.; Yuan, X.; Zuo, J.; Zhang, J.; Hong, J.; Lin, C. Optimization of Ecological Industrial Chain Design Based on Reliability Theory – a Case Study. Journal of Cleaner Production 2016, 124, 175–182. [Google Scholar] [CrossRef]
- Shi, F.; Liu, S.; An, Y.; Sun, Y.; Zhao, S.; Liu, Y.; Li, M. patio-Temporal Dynamics of Landscape Connectivity and Ecological Network Construction in Long Yangxia Basin at the Upper Yellow River. Land 2020, 9, 265. [Google Scholar] [CrossRef]
- Cheng, C.; Hu, Y.; Zhao, M. Progress and Prospect of the Spatiotemporal Change and Ecosystem Services Evaluation of Urban Green Space Pattern. Prog. Geogr 2020, 39, 1770–1782. [Google Scholar] [CrossRef]
- Song, S.; Shi, M.; Hu, S.; Wang, S.; Xu, D. Evolutions and Driving Mechanisms of Urban Blue-Green Spaces in Northeast China: A Case Study with the Urban Central District of Harbin City. Journal of Nanjing Forestry University 2022, 46, 221. [Google Scholar]
- Peng, J.; Pan, Y.; Liu, Y.; Zhao, H.; Wang, Y. Linking Ecological Degradation Risk to Identify Ecological Security Patterns in a Rapidly Urbanizing Landscape. Habitat Int. 2018, 71, 110–124. [Google Scholar] [CrossRef]
- Peng, J.; Yang, Y.; Liu, Y.; Hu, Y.; Du, Y.; Meersmans, J.; Qiu, S. Linking Ecosystem Services and Circuit Theory to Identify Ecological Security Patterns. Sci. Total Environ. 2018, 644, 781–790. [Google Scholar] [CrossRef]
- Kang, J.; Zhang, X.; Zhu, X.; Zhang, B. Ecological Security Pattern: A New Idea for Balancing Regional Development and Ecological Protection. A Case Study of the Jiaodong Peninsula, China. Glob. Ecol. Conserv. 2021, 26, e01472. [Google Scholar] [CrossRef]
- Kong-Jian, Y.U.; Di-Hua, L.I.; Tie-Wu, D. Landscape Approaches in Biodiversity Conservation. Biodiversity Science 1998, 6, 205. [Google Scholar]
- Kong-Jian, Y.U. Landscape Ecological Security Patterns in Biological Conservation. Acta Ecologica Sinica 1999, 19, 8–15. [Google Scholar]
- Wei, H.; Zhu, H.; Chen, J.; Jiao, H.; Li, P.; Xiong, L. Construction and Optimization of Ecological Security Pattern in the Loess Plateau of China Based on the Minimum Cumulative Resistance (MCR) Model. Remote Sensing 2022, 14, 5906. [Google Scholar]
- Gao, J.; Du, F.; Zuo, L.; Jiang, Y. Integrating Ecosystem Services and Rocky Desertification into Identification of Karst Ecological Security Pattern. Landsc. Ecol. 2021, 36, 2113–2133. [Google Scholar]
- Lin, G.; Yang, Z.; Xu, L.; Zhang, F.; Yang, R. Urban Ecological Network Construction in Loess Plateau Regions in China-Case Study of Huanxian City. Alexandria Engineering Journal 2023, 74, 153–169. [Google Scholar]
- Keming, M.; Bojie, F.; Xiaoya, L.; Wenbin, G. The Regional Pattern for Ecological Security (RPES): The Concept and Theoretical Basis. Acta Ecologica Sinica 2004, 24, 761–768. [Google Scholar]
- Xu, X.; Wang, S.; Yan, G.; He, X. Ecological Security Assessment Based on the “Importance–Sensitivity–Connectivity” Index and Pattern Construction: A Case Study of Xiliu Ditch in the Yellow River Basin, China. Land 2023, 12, 1296. [Google Scholar]
- Elbakidze, M.; Angelstam, P.; Yamelynets, T.; Dawson, L.; Gebrehiwot, M.; Stryamets, N.; Johansson, K.-E.; Garrido, P.; Naumov, V.; Manton, M. A Bottom-up Approach to Map Land Covers as Potential Green Infrastructure Hubs for Human Well-Being in Rural Settings: A Case Study from Sweden. Landscape and Urban Planning 2017, 168, 72–83. [Google Scholar]
- Wang, Q.; Liu, S.; Liu, Y.; Wang, F.; Liu, H.; Yu, L. Effects of Urban Agglomeration and Expansion on Landscape Connectivity in the River Valley Region, Qinghai-Tibet Plateau. Global Ecology and Conservation 2022, 34, e02004. [Google Scholar]
- Huang, K.; Peng, L.; Wang, X.; Chen, T. Integrating Landscape Connectivity and Natural-Anthropogenic Interaction to Understand Karst Vegetation Restoration: A Case Study of Guizhou Province, China. Front. Ecol. Evol. 2022, 10, 844437. [Google Scholar]
- Ureta, J.C.; Clay, L.; Motallebi, M.; Ureta, J. Quantifying the Landscape’s Ecological Benefits—An Analysis of the Effect of Land Cover Change on Ecosystem Services. Land 2020, 10, 21. [Google Scholar]
- Wei, Q.; Halike, A.; Yao, K.; Chen, L.; Balati, M. Construction and Optimization of Ecological Security Pattern in Ebinur Lake Basin Based on MSPA-MCR Models. Ecological Indicators 2022, 138, 108857. [Google Scholar] [CrossRef]
- Hu, C.; Wang, Z.; Wang, Y.; Sun, D.; Zhang, J. Combining MSPA-MCR Model to Evaluate the Ecological Network in Wuhan, China. Land 2022, 11, 213. [Google Scholar]
- Ye, H.; Yang, Z.; Xu, X. Ecological Corridors Analysis Based on MSPA and MCR Model—A Case Study of the Tomur World Natural Heritage Region. Sustainability 2020, 12, 959. [Google Scholar]
- Lin, Z.; Xiao, Y.; Ouyang, Z. Assessment of Ecological Importance of the Qinghai-Tibet Plateau Based on Ecosystem Service Flows. J. Mt. Sci. 2021, 18, 1725–1736. [Google Scholar]
- Xiao, S.; Wu, W.; Guo, J.; Ou, M.; Pueppke, S.G.; Ou, W.; Tao, Y. An Evaluation Framework for Designing Ecological Security Patterns and Prioritizing Ecological Corridors: Application in Jiangsu Province, China. Landscape Ecol 2020, 35, 2517–2534. [Google Scholar]
- Feng, H.; Zhang, X.; Nan, Y.; Zhang, D.; Sun, Y. Ecological Sensitivity Assessment and Spatial Pattern Analysis of Land Resources in Tumen River Basin, China. Applied Sciences 2023, 13, 4197. [Google Scholar]
- Cui, H.; Liu, M.; Chen, C. Ecological Restoration Strategies for the Topography of Loess Plateau Based on Adaptive Ecological Sensitivity Evaluation: A Case Study in Lanzhou, China. Sustainability 2022, 14, 2858. [Google Scholar]
- Chen, X.; Li, X.; Eladawy, A.; Yu, T.; Sha, J. A Multi-Dimensional Vulnerability Assessment of Pingtan Island (China) and Nile Delta (Egypt) Using Ecological Sensitivity-Resilience-Pressure (SRP) Model. Human and Ecological Risk Assessment: An International Journal 2021, 27, 1860–1882. [Google Scholar]
- Pan, T.; Zhang, Y.; Yan, F.; Su, F. Collaborative Optimal Allocation of Urban Land Guide by Land Ecological Suitability: A Case Study of Guangdong–Hong Kong–Macao Greater Bay Area. Land 2023, 12, 754. [Google Scholar]
- Zhou, S.; Song, Y.; Li, Y.; Wang, J.; Zhang, L. Construction of Ecological Security Pattern for Plateau Lake Based on MSPA–MCR Model: A Case Study of Dianchi Lake Area. Sustainability 2022, 14, 14532. [Google Scholar]
- Classification Evaluation and Spatial-Temporal Analysis of “Production-Living-Ecological” Spaces in China - CNKI. Available online: https://kns.cnki.net/KCMS/detail/detail.aspx?dbcode=CJFD&dbname=CJFDLAST2017&filename=DLXB201707014&uniplatform=OVERSEA&v=07B7c1RAipS9Bs-DtD18L6VksBBfHt2vcQDSJLh5eArFHzCe1jKF-3PwyJ7JjrCd (accessed on 10 June 2023).
- OuYang, Z.; Wang, X.; Miao, H. China’s Eco-Environmental Sensitivity and Its Spatial Heterogeneity. Acta Ecologica Sinica 2000, 20, 9–12. [Google Scholar]
- Pan, F.; Tian, C.; Shao, F.; Zhou, W.; Chen, F. Evaluation of Ecological Sensitivity in Karamay, Xinjiang, China. J. Geogr. Sci. 2012, 22, 329–345. [Google Scholar] [CrossRef]
- Huo, J.; Shi, Z.; Zhu, W.; Li, T.; Xue, H.; Chen, X.; Yan, Y.; Ma, R. Construction and Optimization of an Ecological Network in Zhengzhou Metropolitan Area, China. IJERPH 2022, 19, 8066. [Google Scholar] [CrossRef]
- Yuanjing, Z.; Binyang, Y.; Ashraf, M.A. Ecological Security Pattern for the Landscape of Mesoscale and Microscale Land: a Case Study of the Harbin City Center. Journal of Environmental Engineering and Landscape Management 2015, 23, 192–201. [Google Scholar] [CrossRef]
- Guo, R.; Wu, T.; Liu, M.; Huang, M.; Stendardo, L.; Zhang, Y. The Construction and Optimization of Ecological Security Pattern in the Harbin-Changchun Urban Agglomeration, China. IJERPH 2019, 16, 1190. [Google Scholar] [CrossRef]
- Song, S.; Xu, D.; Hu, S.; Shi, M. Ecological Network Optimization in Urban Central District Based on Complex Network Theory: A Case Study with the Urban Central District of Harbin. IJERPH 2021, 18, 1427. [Google Scholar] [CrossRef]
- Wang, X.; Xie, X.; Wang, Z.; Lin, H.; Liu, Y.; Xie, H.; Liu, X. Construction and Optimization of an Ecological Security Pattern Based on the MCR Model: A Case Study of the Minjiang River Basin in Eastern China. International Journal of Environmental Research and Public Health 2022, 19, 8370. [Google Scholar] [CrossRef]
- Li, Y.-Y.; Zhang, Y.-Z.; Jiang, Z.-Y.; Guo, C.-X.; Zhao, M.-Y.; Yang, Z.-G.; Guo, M.-Y.; Wu, B.-Y.; Chen, Q.-L. Integrating Morphological Spatial Pattern Analysis and the Minimal Cumulative Resistance Model to Optimize Urban Ecological Networks: A Case Study in Shenzhen City, China. Ecol Process 2021, 10, 63. [Google Scholar] [CrossRef]
- Zhi-guang, Y.; Zhi-yun, J.; Cheng-xuan, G.U.O.; Xiao-jing, Y.; Xiao-jun, X.U.; Xiao, U.I.; Zhong-min, H.U.; Hou-yun, Z. Construction of Ecological Network Using Morphological Spatial Pattern Analysis and Minimal Cumulative Resistance Models in Guangzhou City, China. Yingyong Shengtai Xuebao 2018, 29. [Google Scholar]
- Yu, C.L.; Liu, D.; Feng, R.; Tang, Q.; Guo, C.L. Construction of Ecological Security Pattern in Northeast China Based on MCR Model. Acta Ecol. Sin 2021, 41, 290–301. [Google Scholar]
- Wang, Z.; Shi, Z.; Huo, J.; Zhu, W.; Yan, Y.; Ding, N. Construction and Optimization of an Ecological Network in Funiu Mountain Area Based on MSPA and MCR Models, China. Land 2023, 12, 1529. [Google Scholar]
- Wang, S.; Wu, M.; Hu, M.; Fan, C.; Wang, T.; Xia, B. Promoting Landscape Connectivity of Highly Urbanized Area: An Ecological Network Approach. Ecological Indicators 2021, 125, 107487. [Google Scholar] [CrossRef]
- Huang, X.; Wang, H.; Shan, L.; Xiao, F. Constructing and Optimizing Urban Ecological Network in the Context of Rapid Urbanization for Improving Landscape Connectivity. Ecological Indicators 2021, 132, 108319. [Google Scholar] [CrossRef]
- Yu, K. Security Patterns and Surface Model in Landscape Ecological Planning. Landscape and Urban Planning 1996, 36, 1–17. [Google Scholar] [CrossRef]
- Yu, K.J. Ecologically Strategic Points in Landscape and Surface Model. Acta Geogr. Sin 1998, 53, 11–20. [Google Scholar]
- Li, Q.; Zhou, Y.; Yi, S. An Integrated Approach to Constructing Ecological Security Patterns and Identifying Ecological Restoration and Protection Areas: A Case Study of Jingmen, China. Ecological Indicators 2022, 137, 108723. [Google Scholar] [CrossRef]
Figure 1.
Geographical location of the study area.
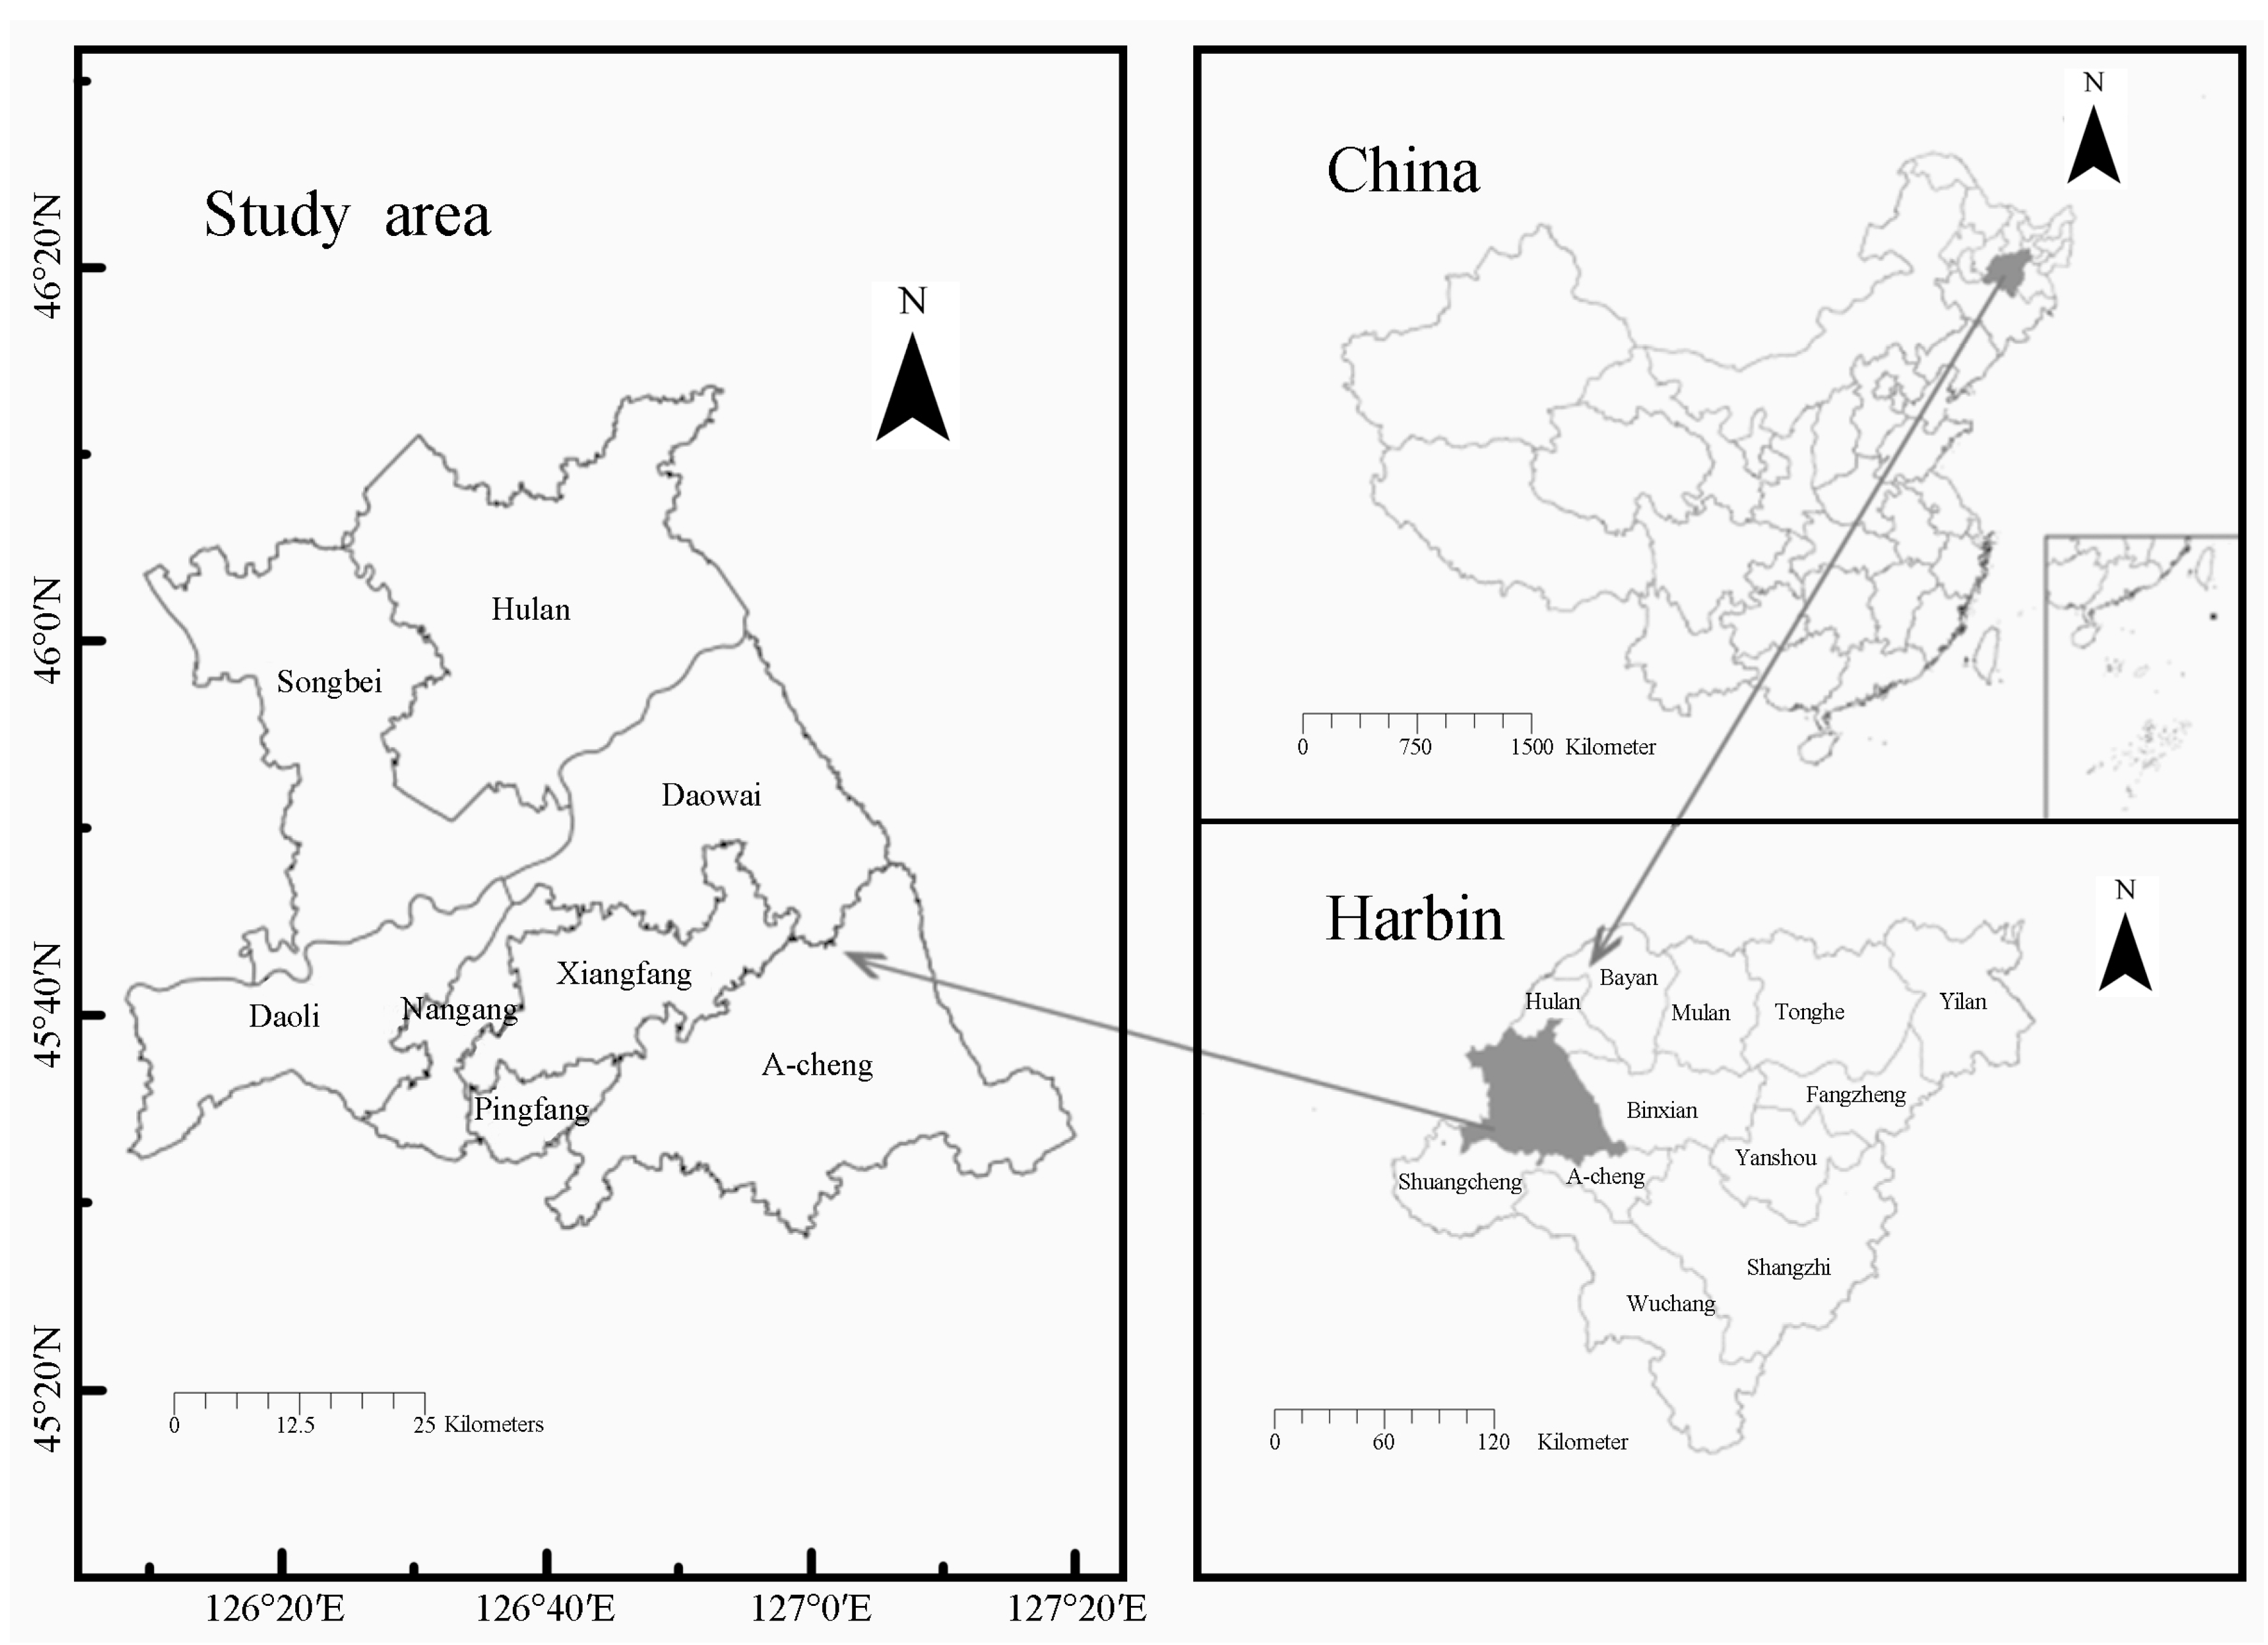
Figure 2.
Results of ecological sensitivity evaluation. a: slope; b: slope direction; c: elevation; d: topographic relief; e: soil type; f: Soil erodibility; g: rainfall; h: watershed buffer; i: vegetation fraction coverage; j: land use type; k:settlement buffer; l: Integrated ecological sensitivity evaluation.
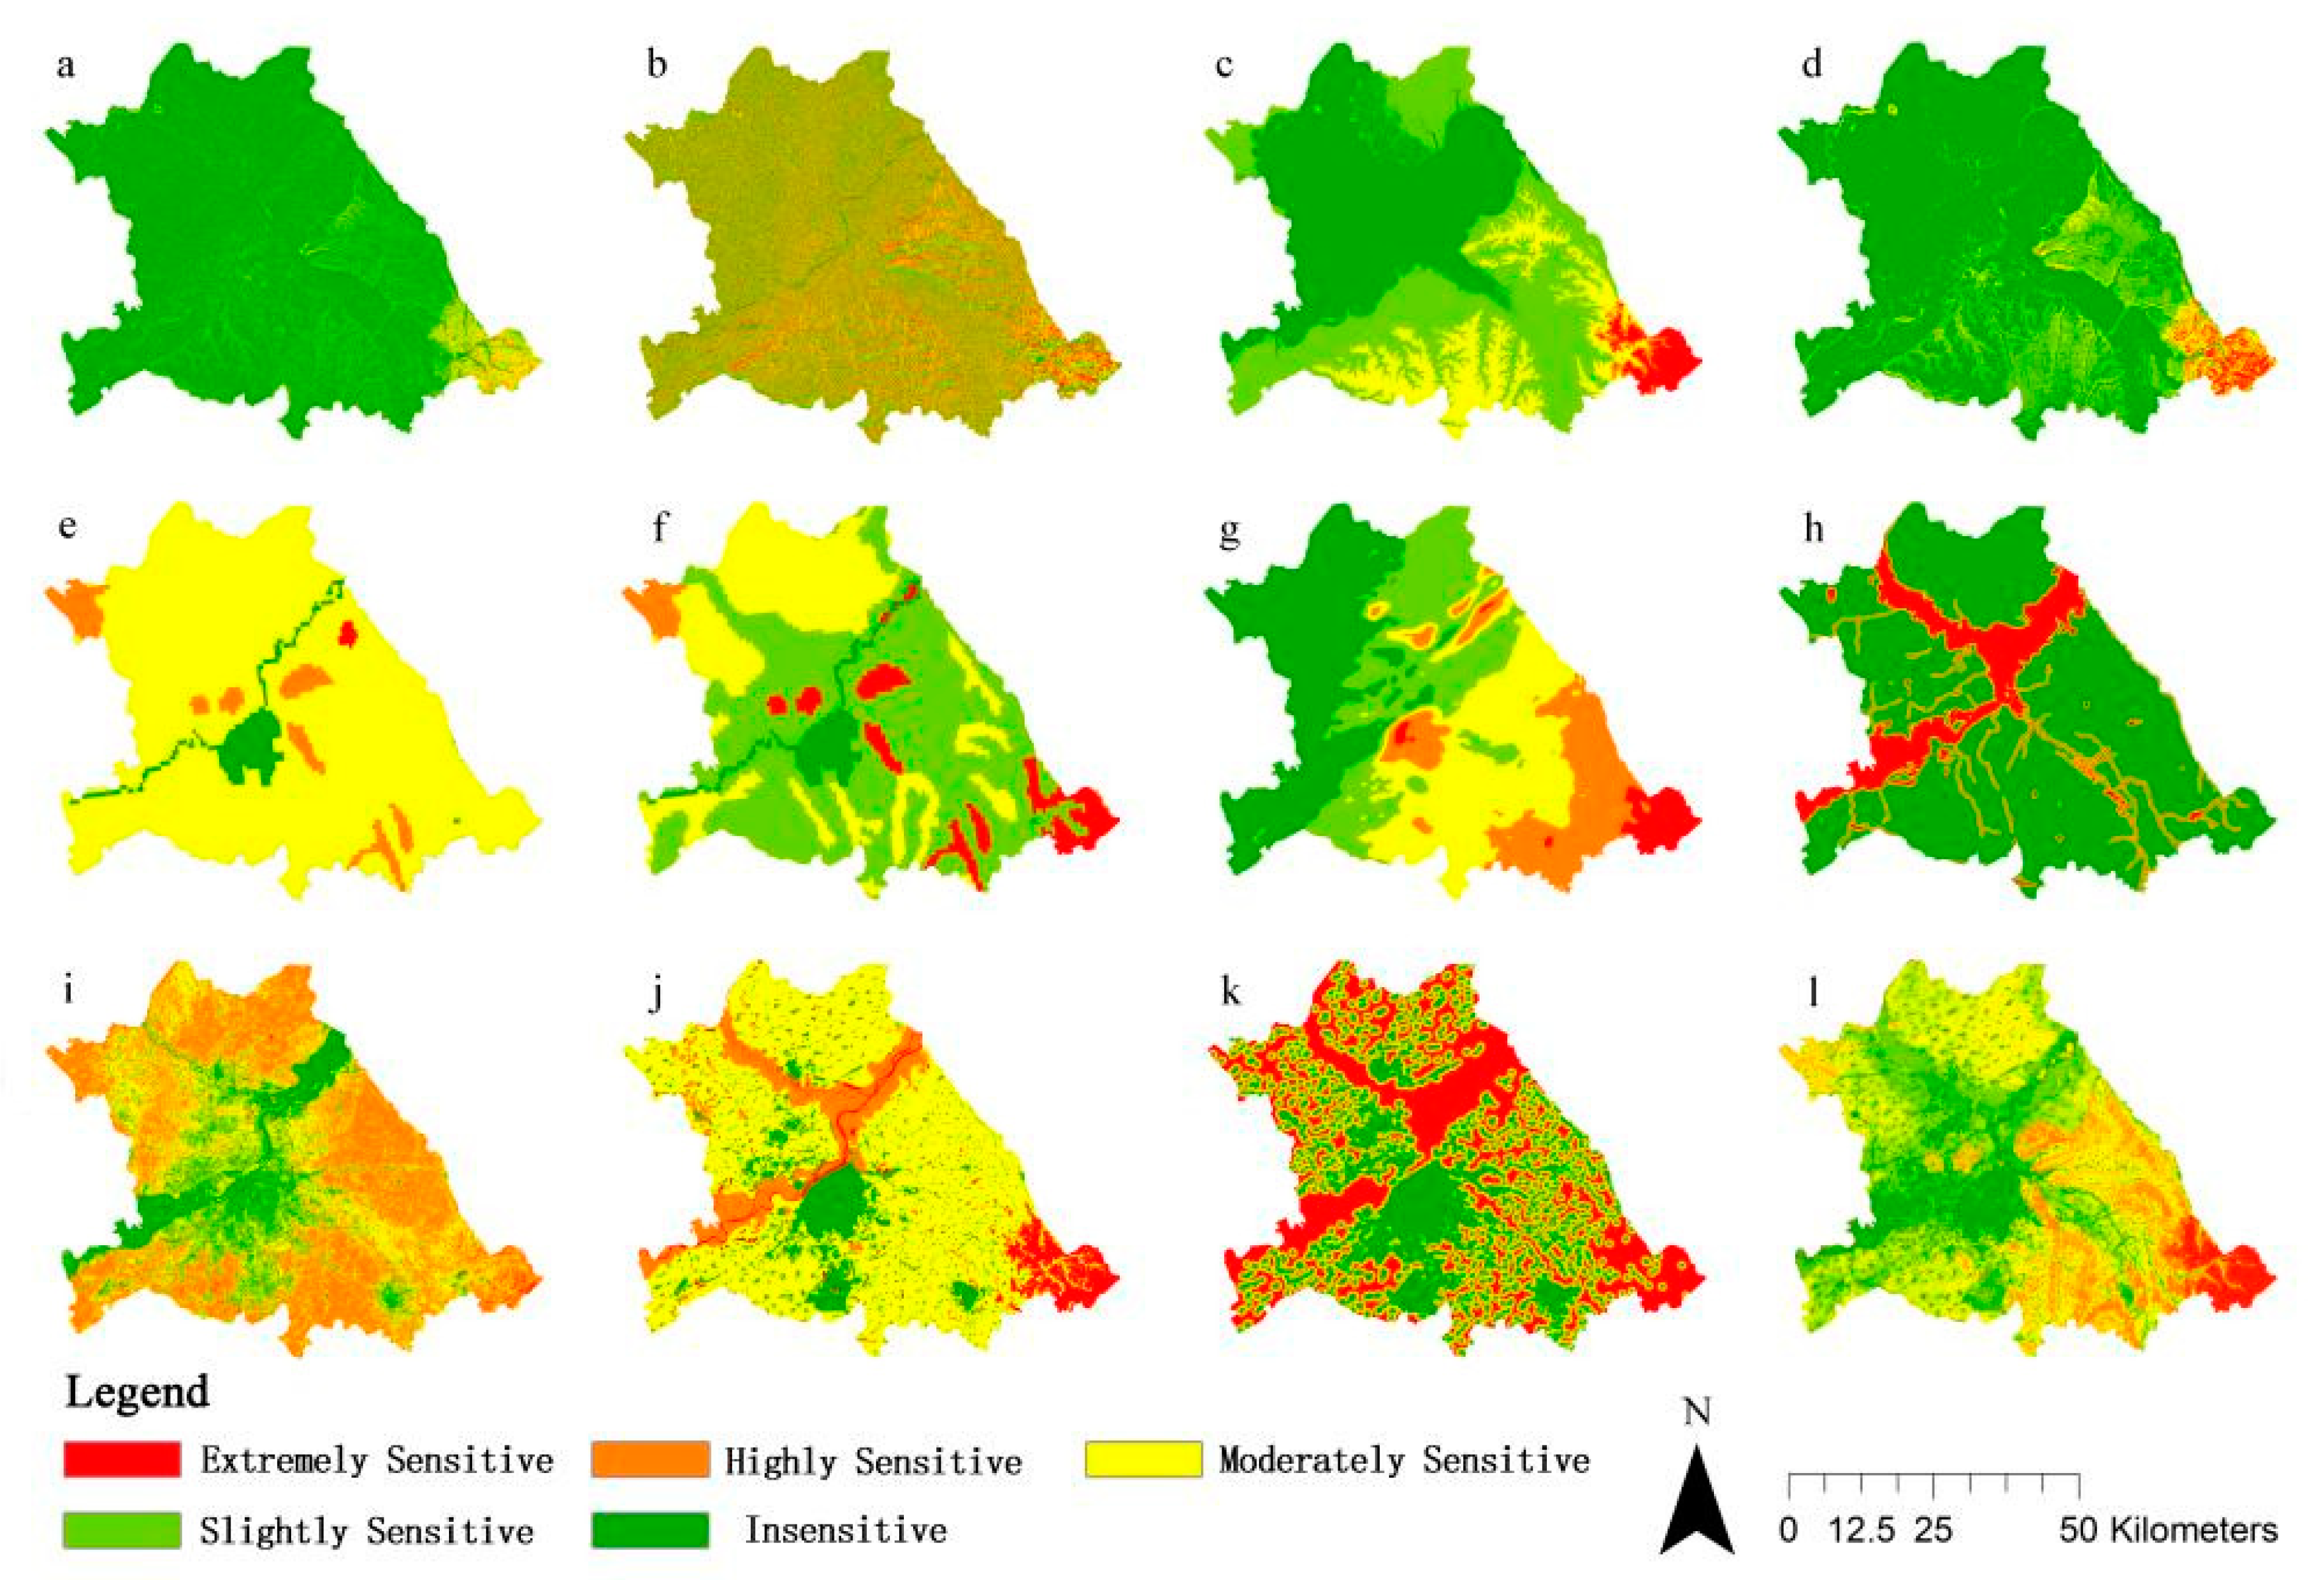
Figure 3.
Extraction of ecological source areas using MSPA. a: Distribution of landscape types. b:Distribution of ecological source sites and ecological source points.
Figure 3.
Extraction of ecological source areas using MSPA. a: Distribution of landscape types. b:Distribution of ecological source sites and ecological source points.
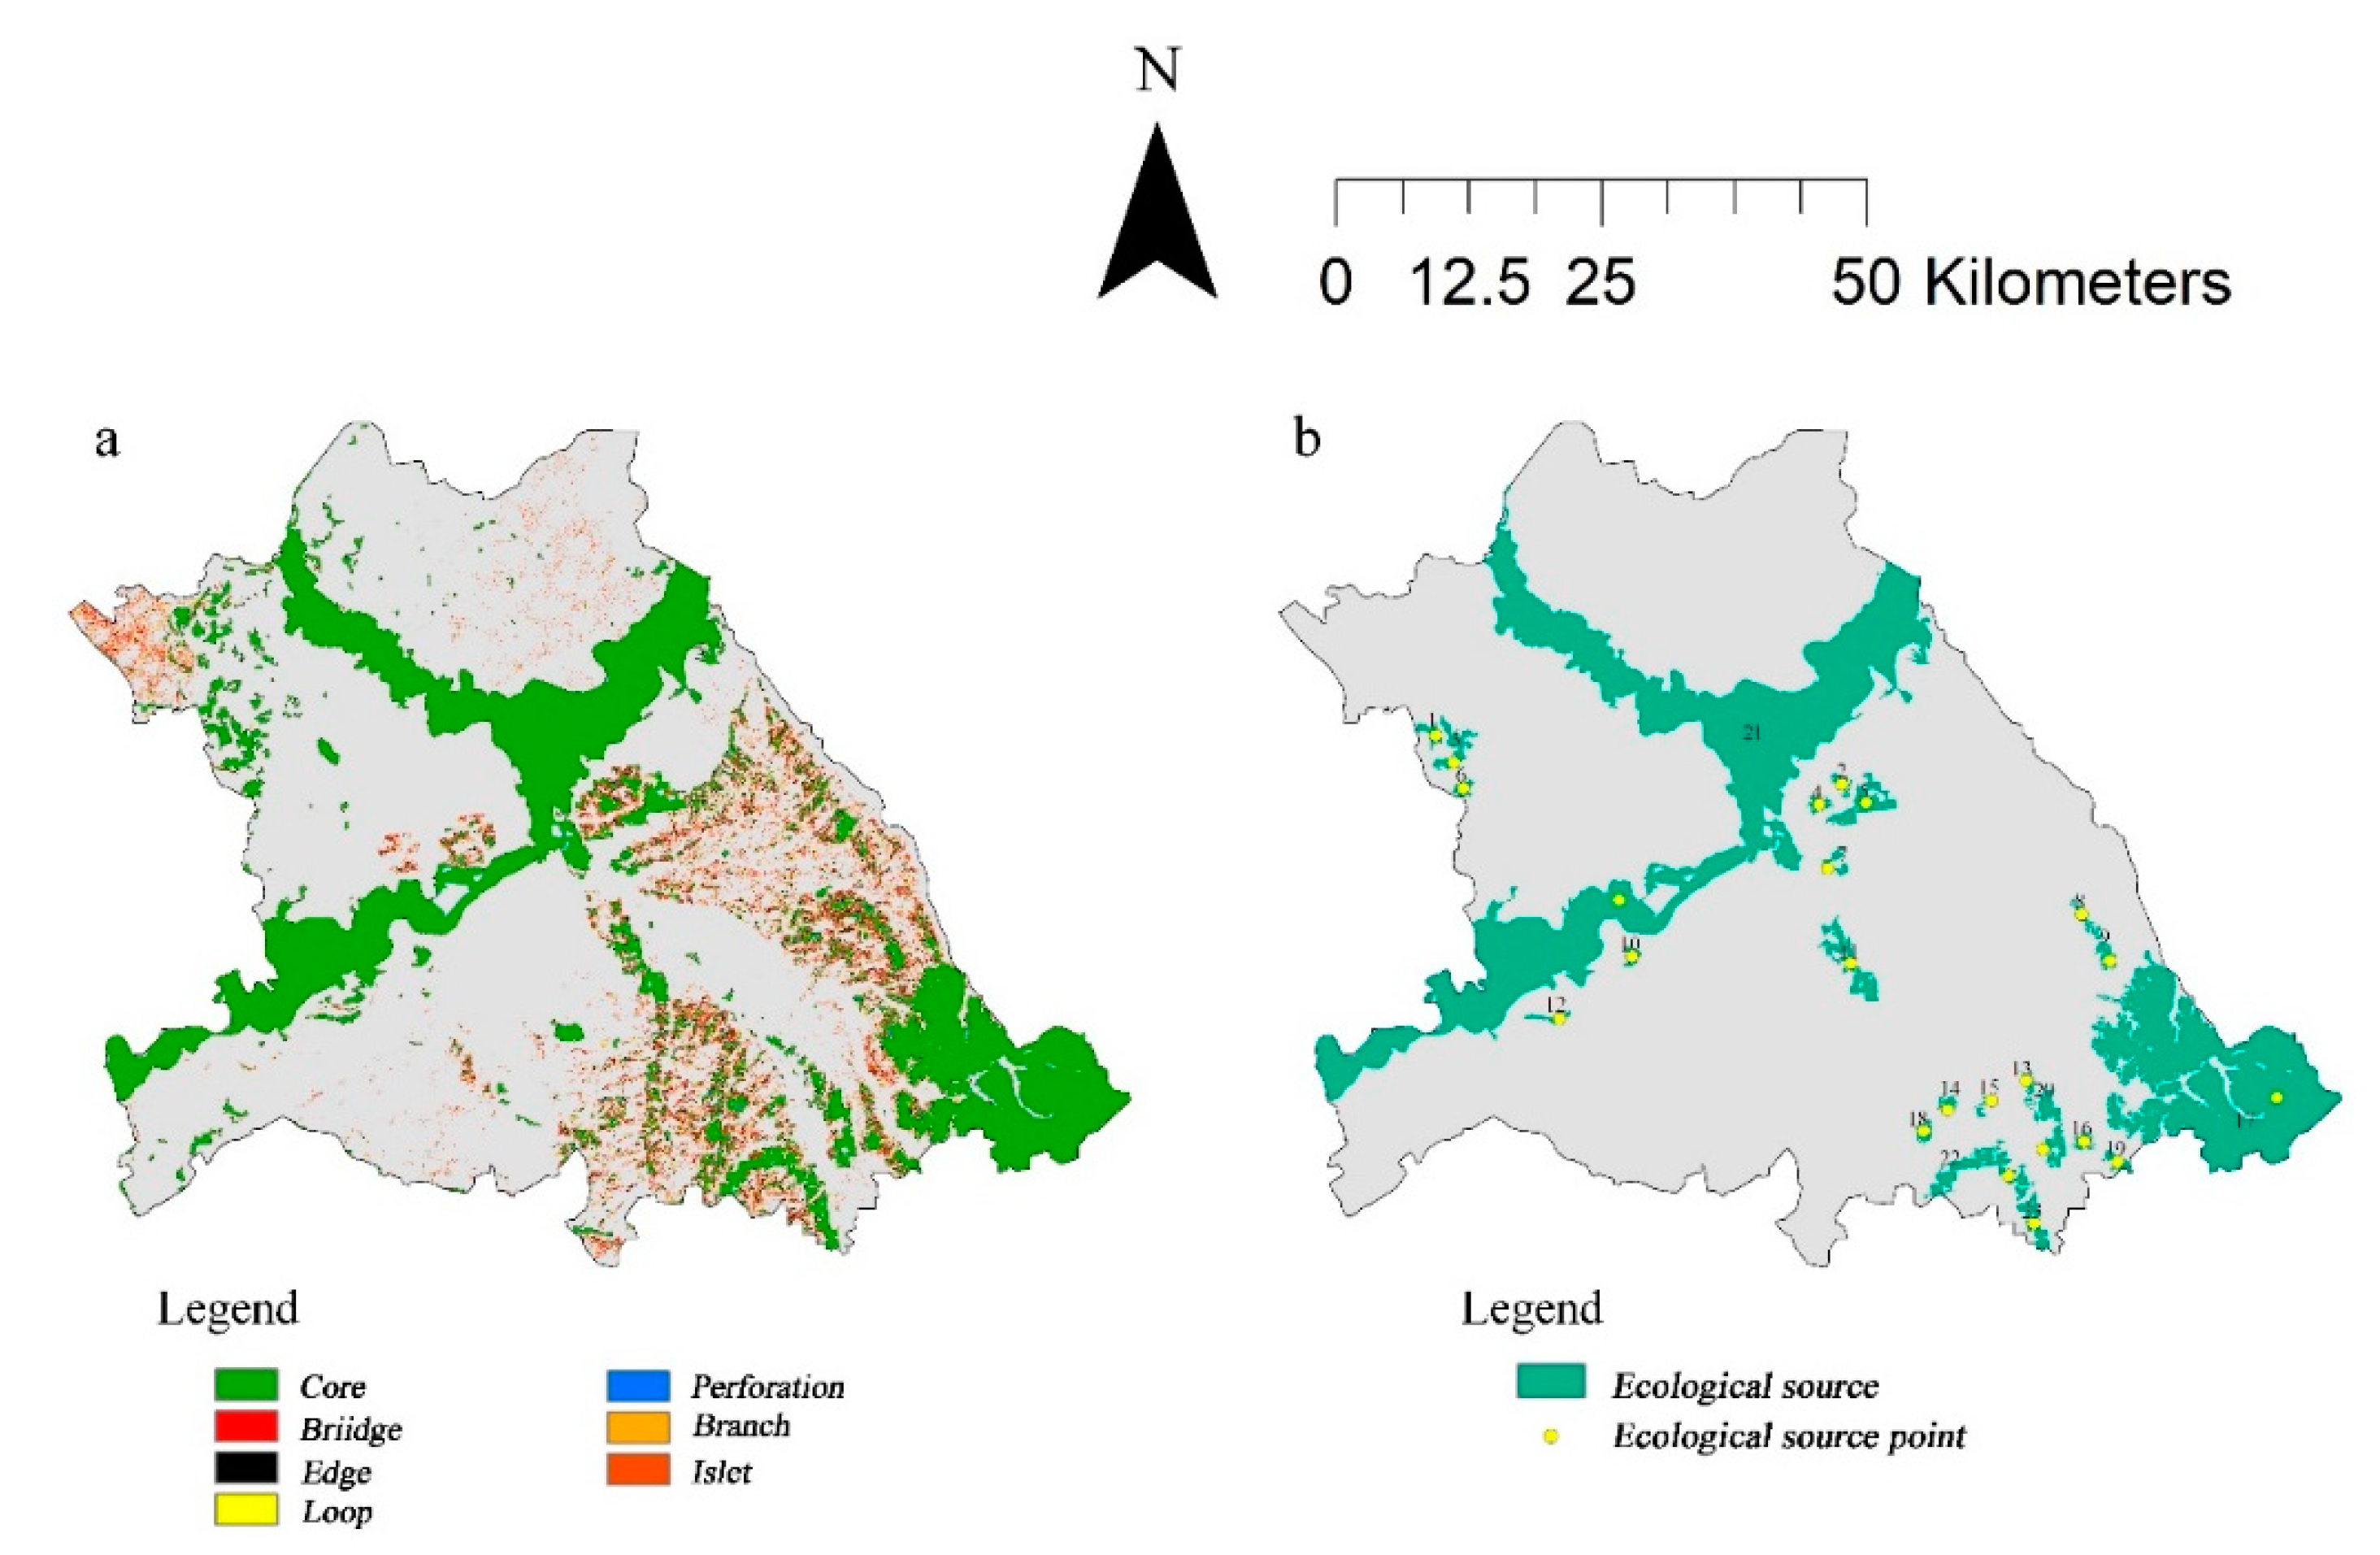
Figure 4.
Ecological resistance surface. a: land use type; b: vegetation fraction coverage; c: slope; d: topographic relief; e: distance from settlement; f: distance from railroad and highway; g: composite ecological resistance surface.
Figure 4.
Ecological resistance surface. a: land use type; b: vegetation fraction coverage; c: slope; d: topographic relief; e: distance from settlement; f: distance from railroad and highway; g: composite ecological resistance surface.
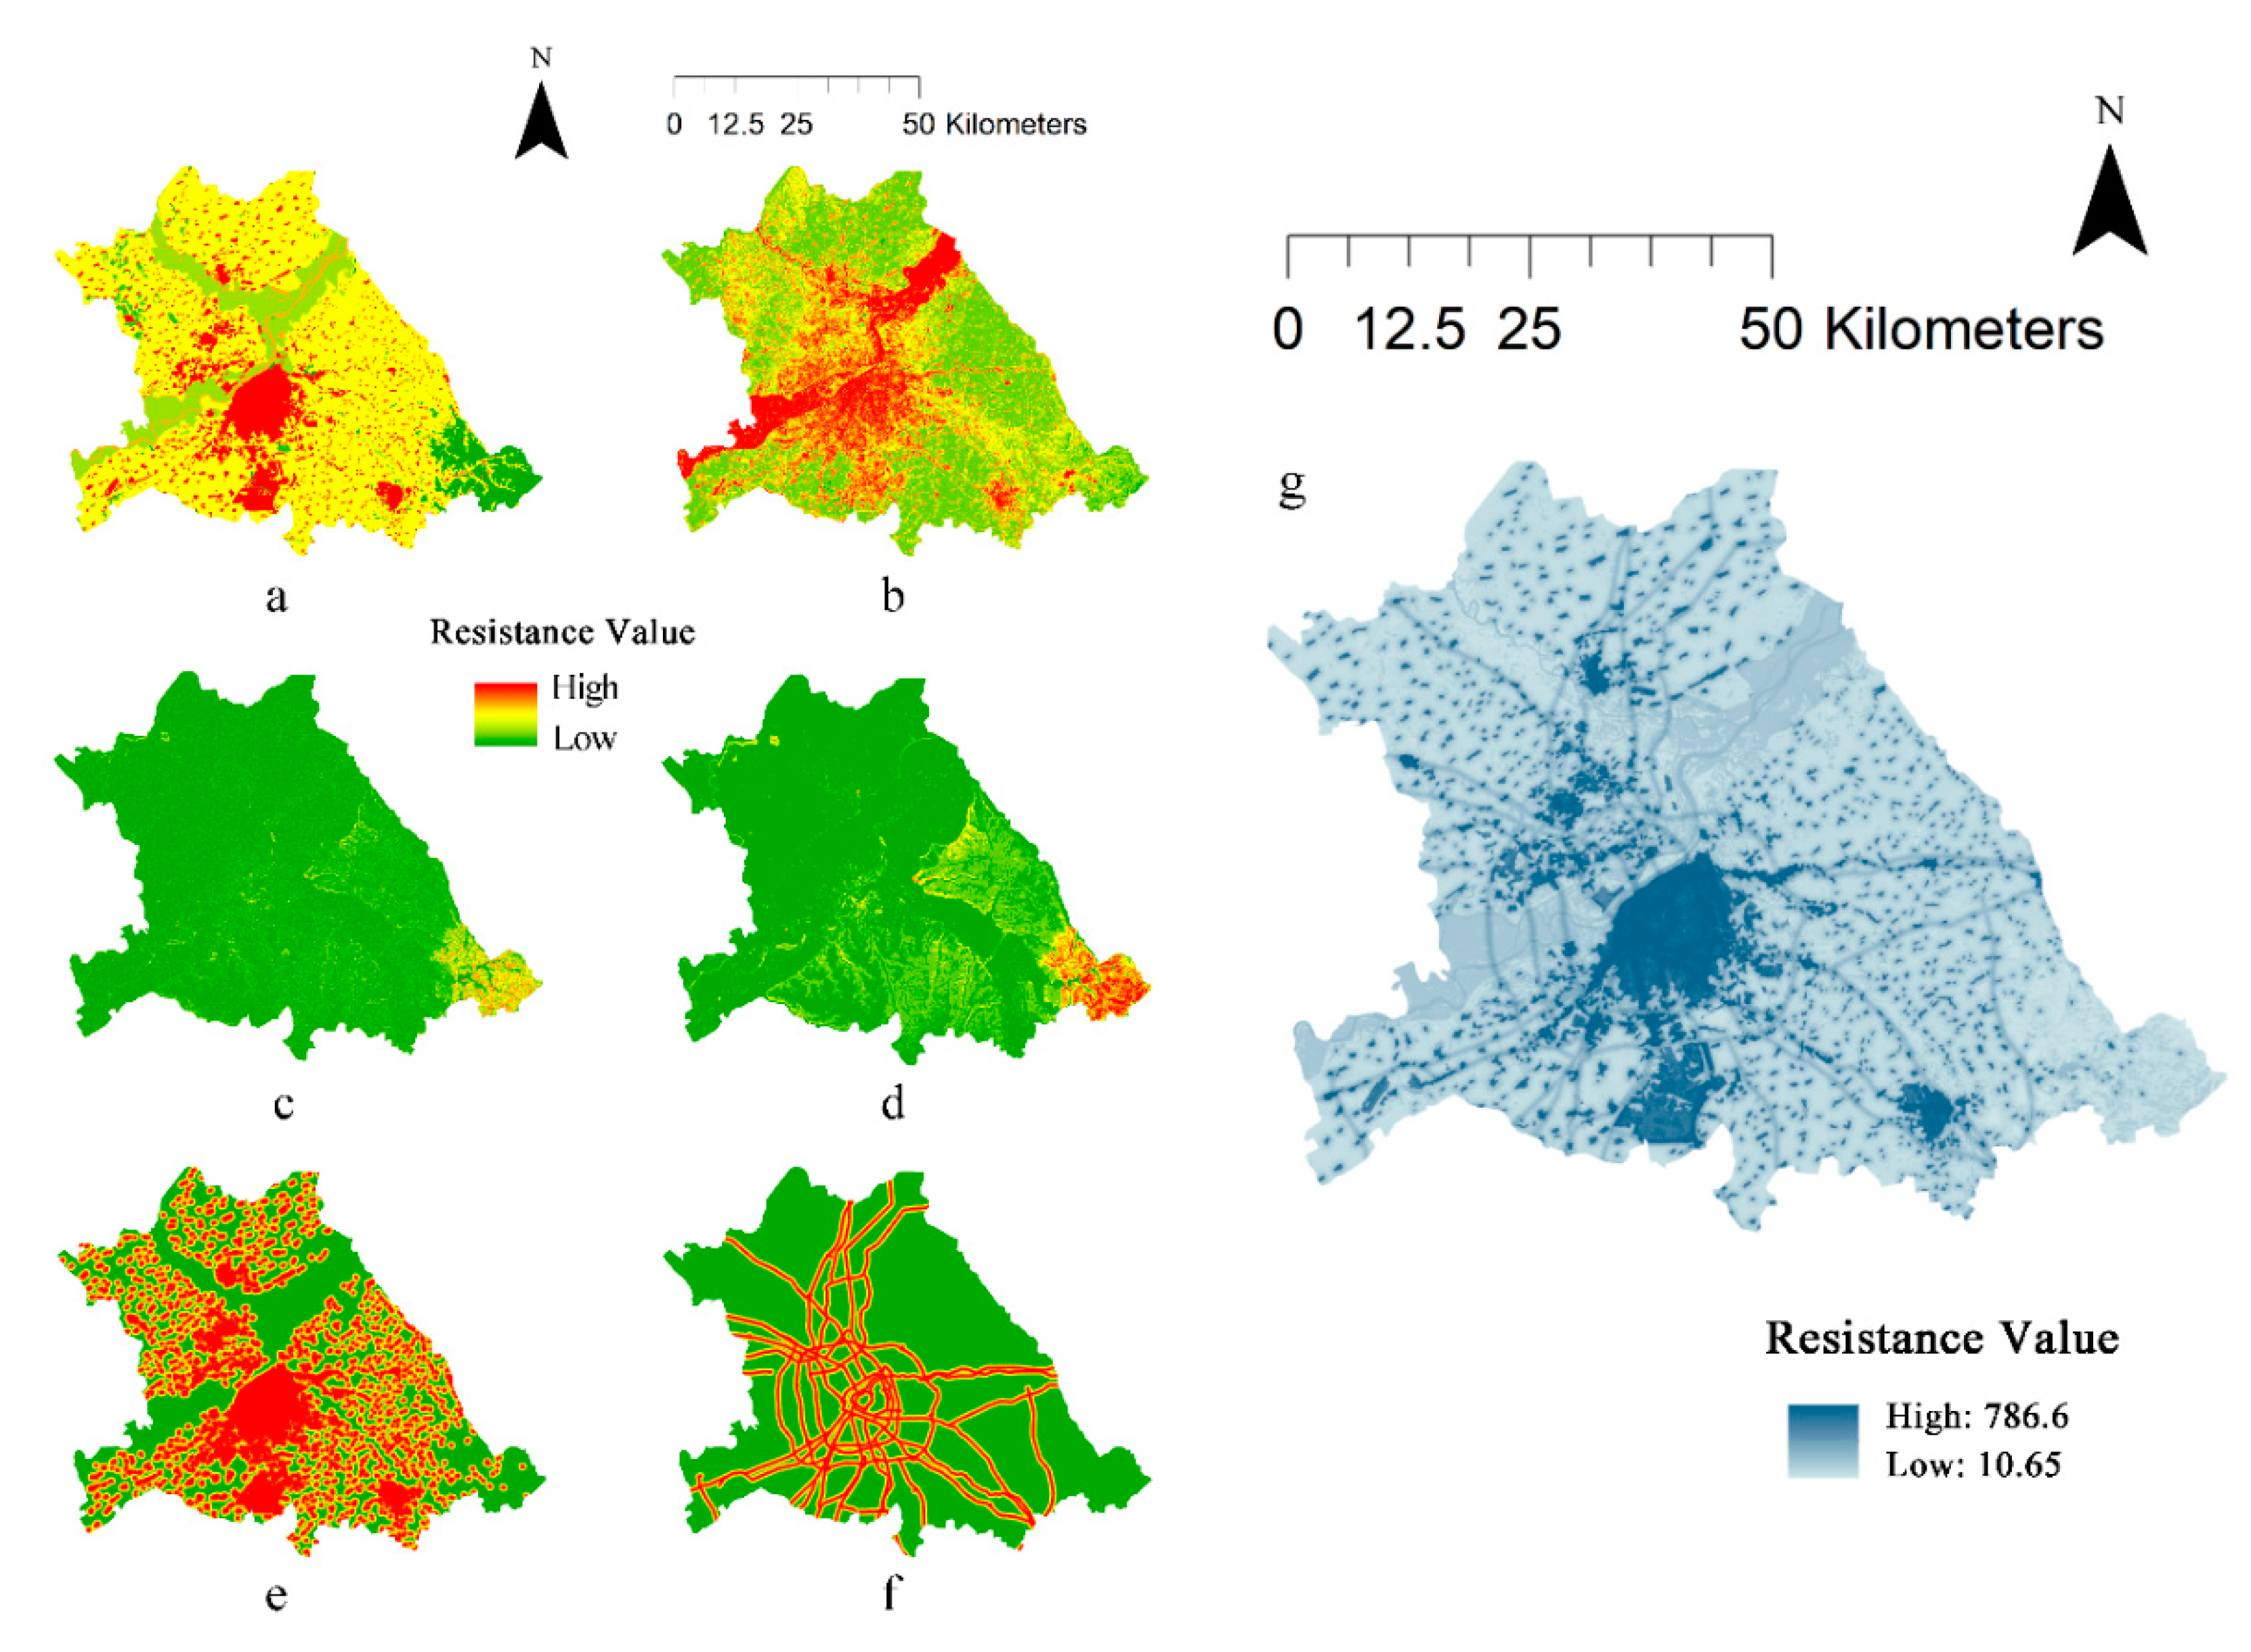
Figure 5.
Minimum cumulative resistance surface.
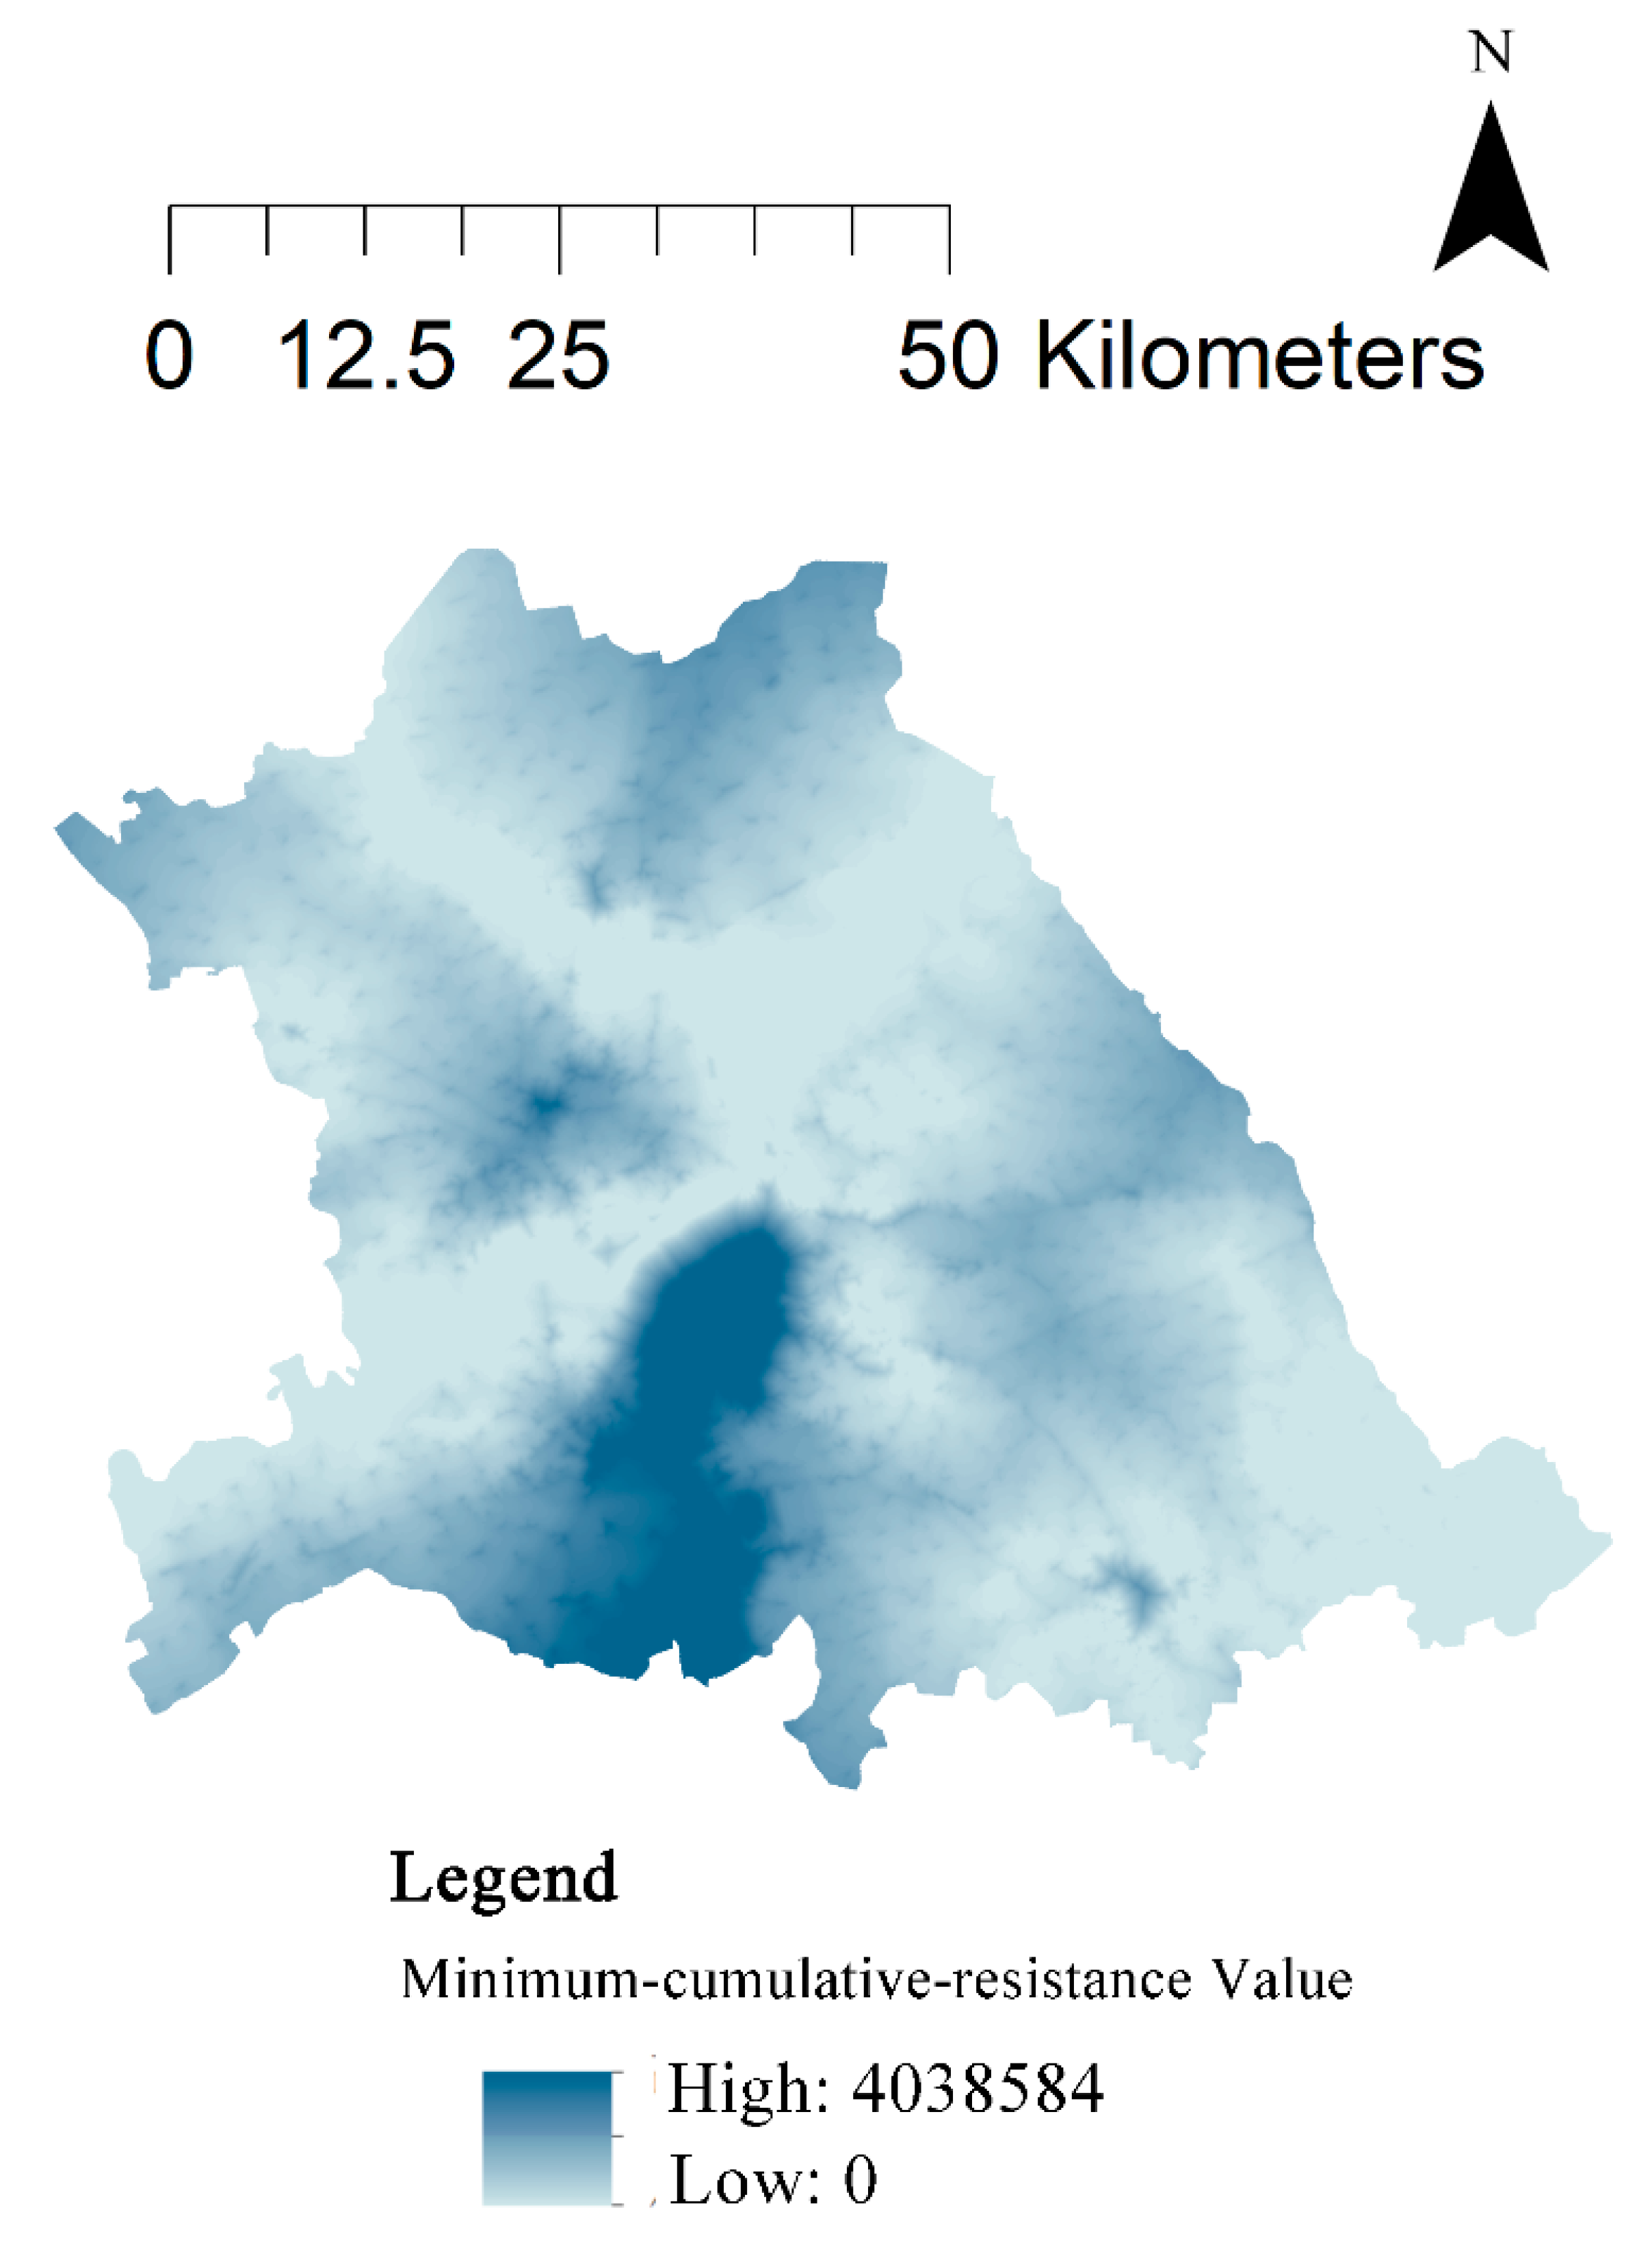
Figure 6.
Classification and distribution of ecological corridors.
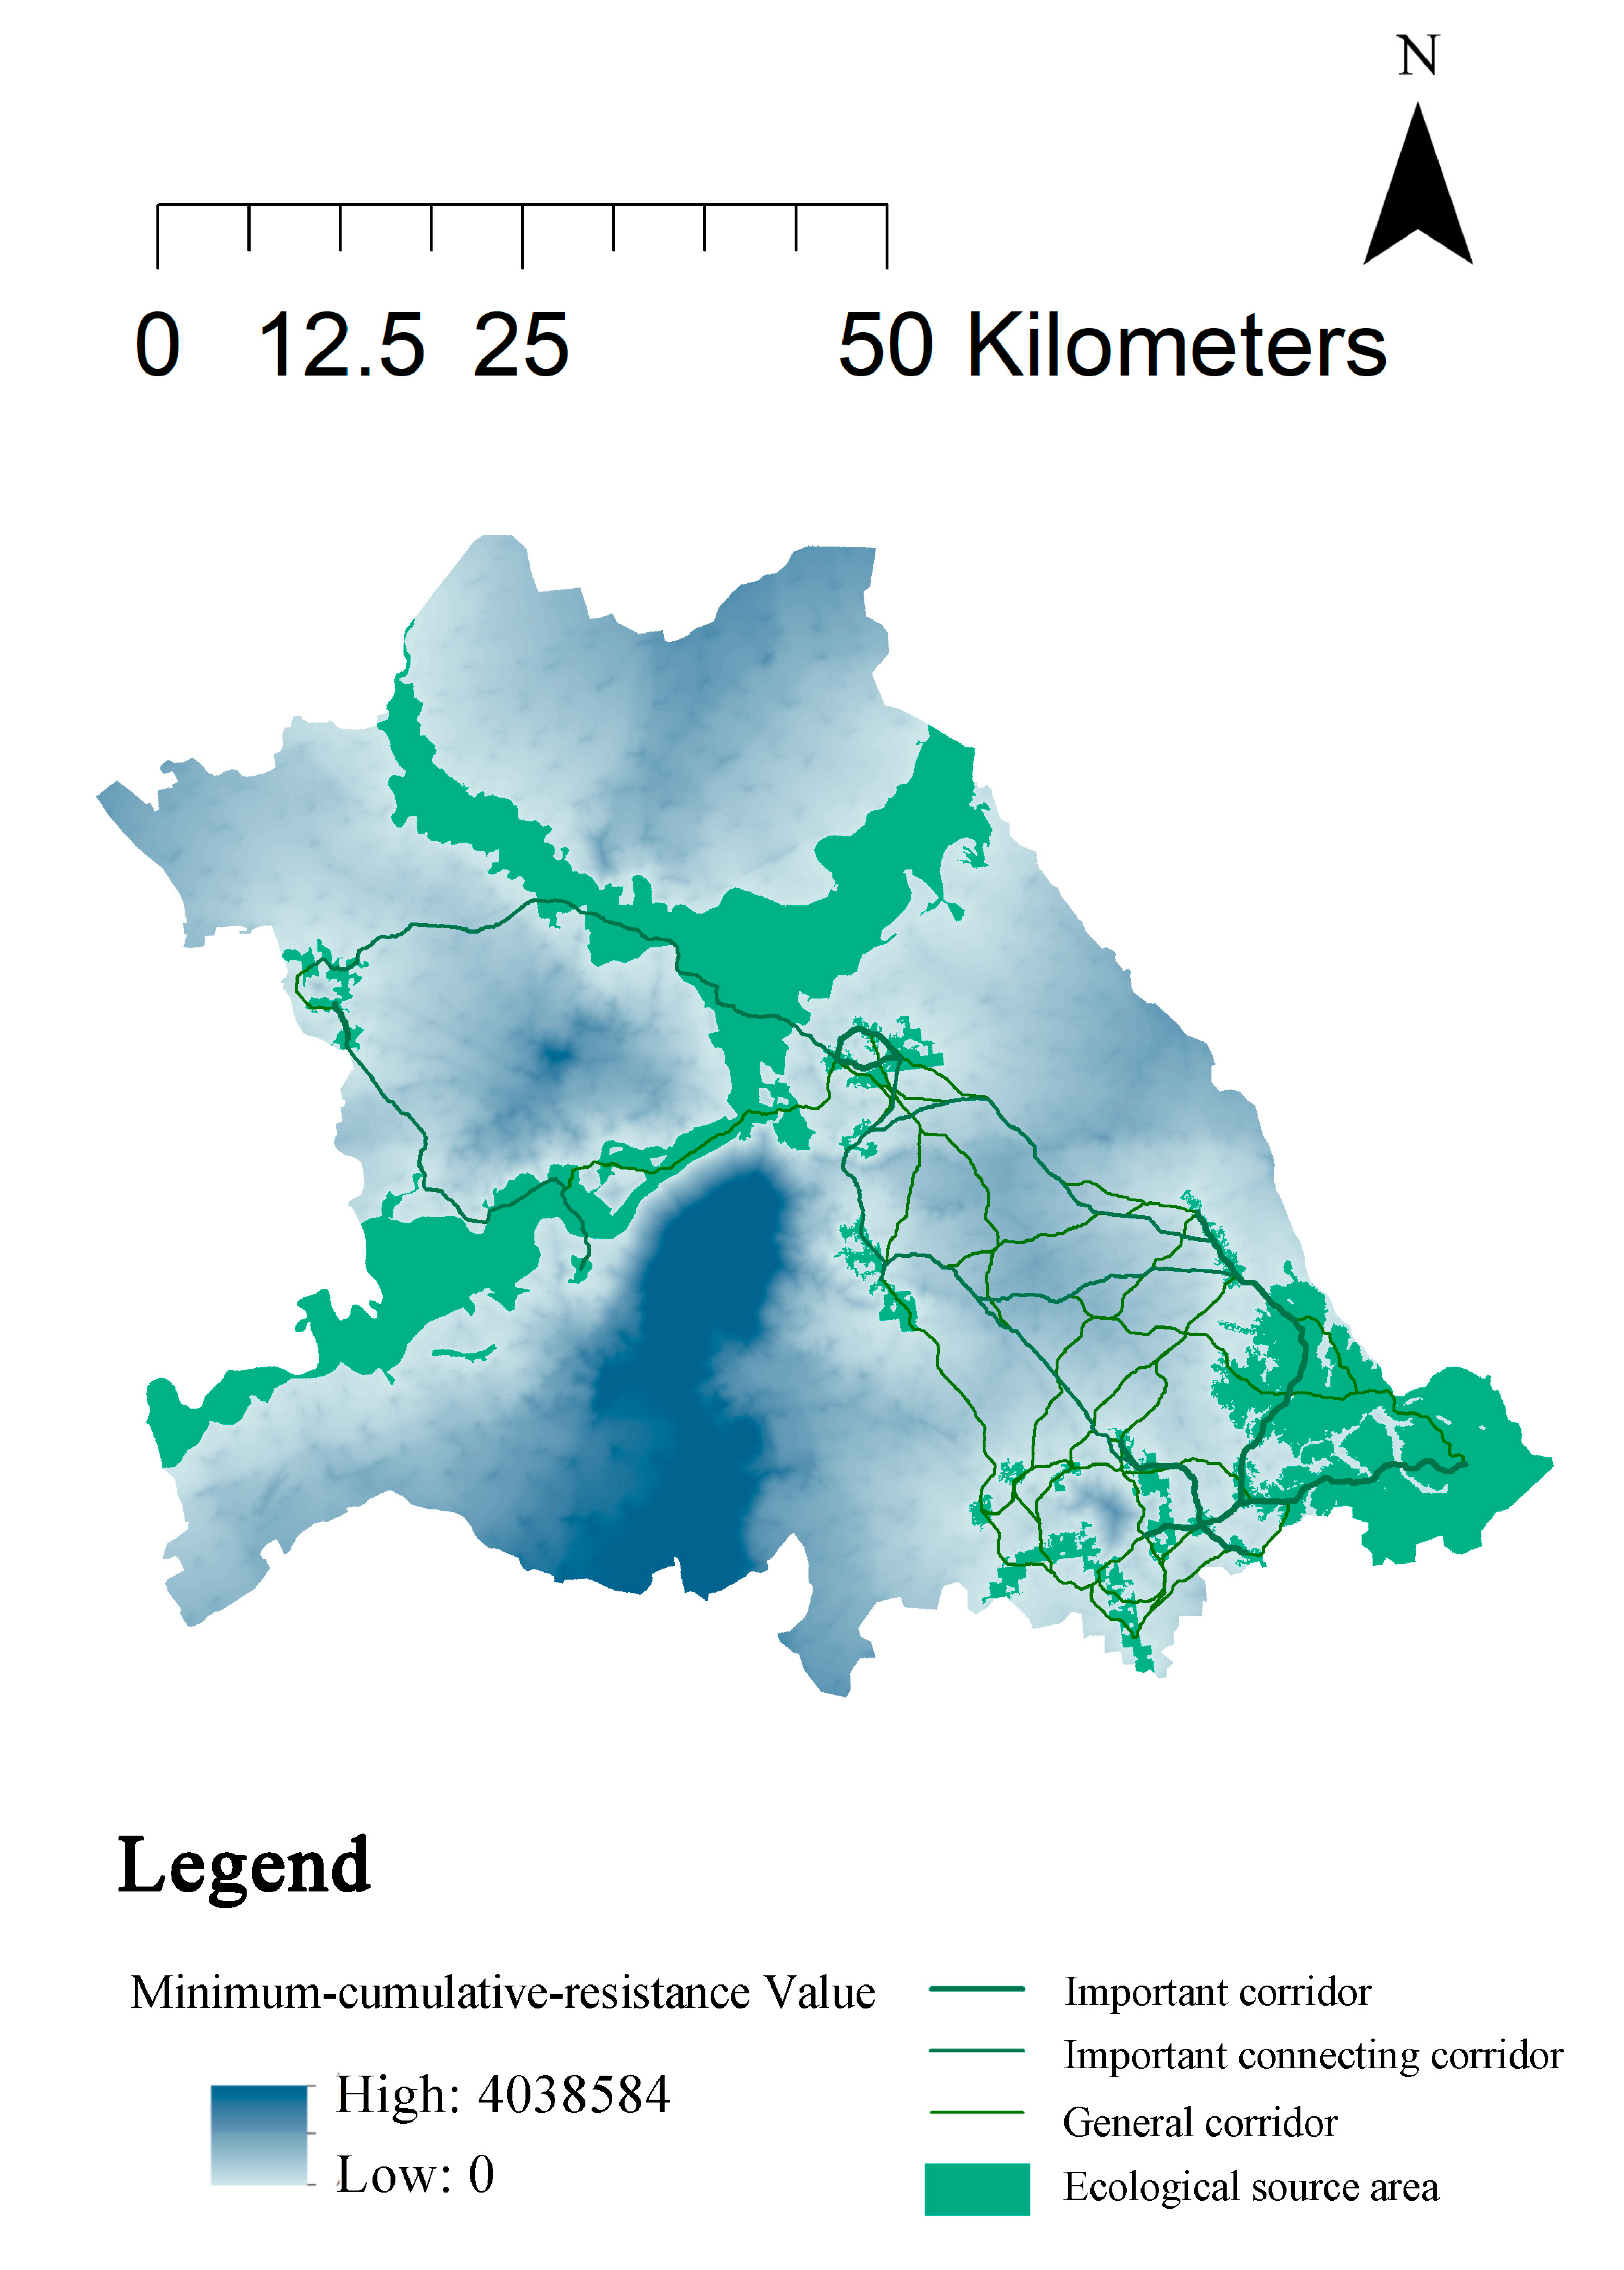
Figure 7.
a: ecological security pattern of the urban central district of Harbin; b: distribution of important roads and ecological breakpoints.
Figure 7.
a: ecological security pattern of the urban central district of Harbin; b: distribution of important roads and ecological breakpoints.
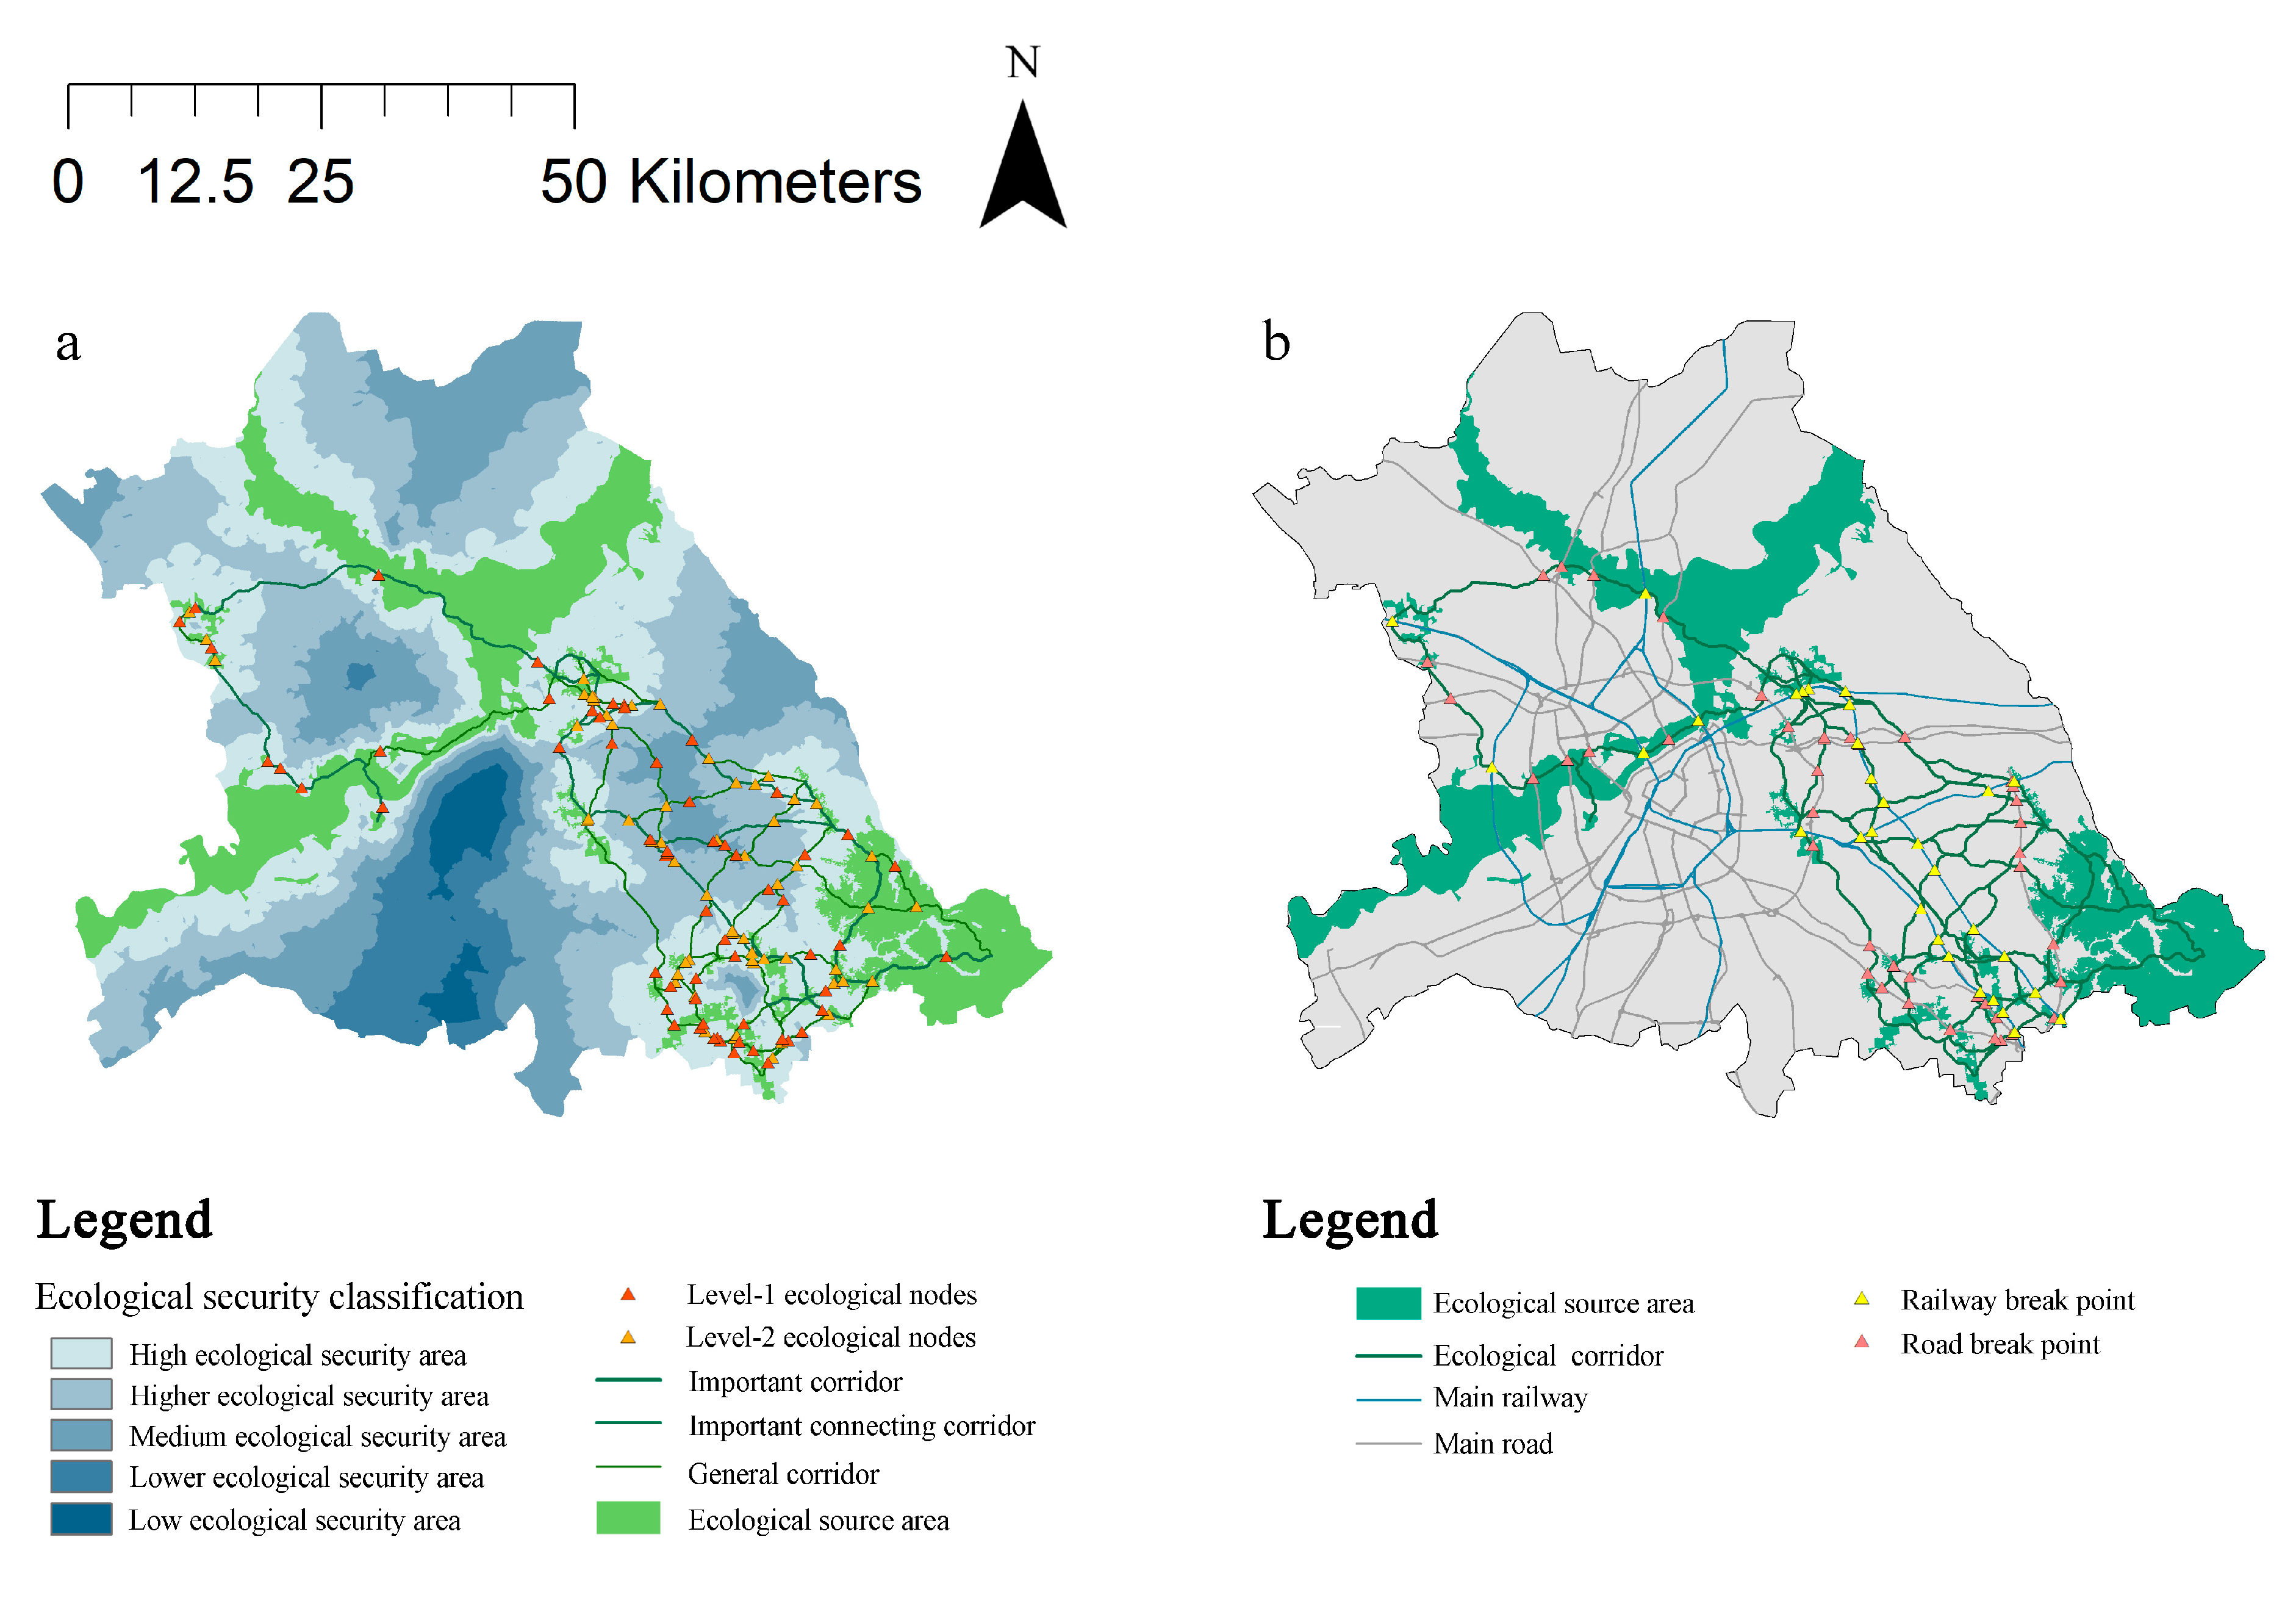
Figure 8.
Optimization of the ecological security pattern in the urban central district of Harbin.
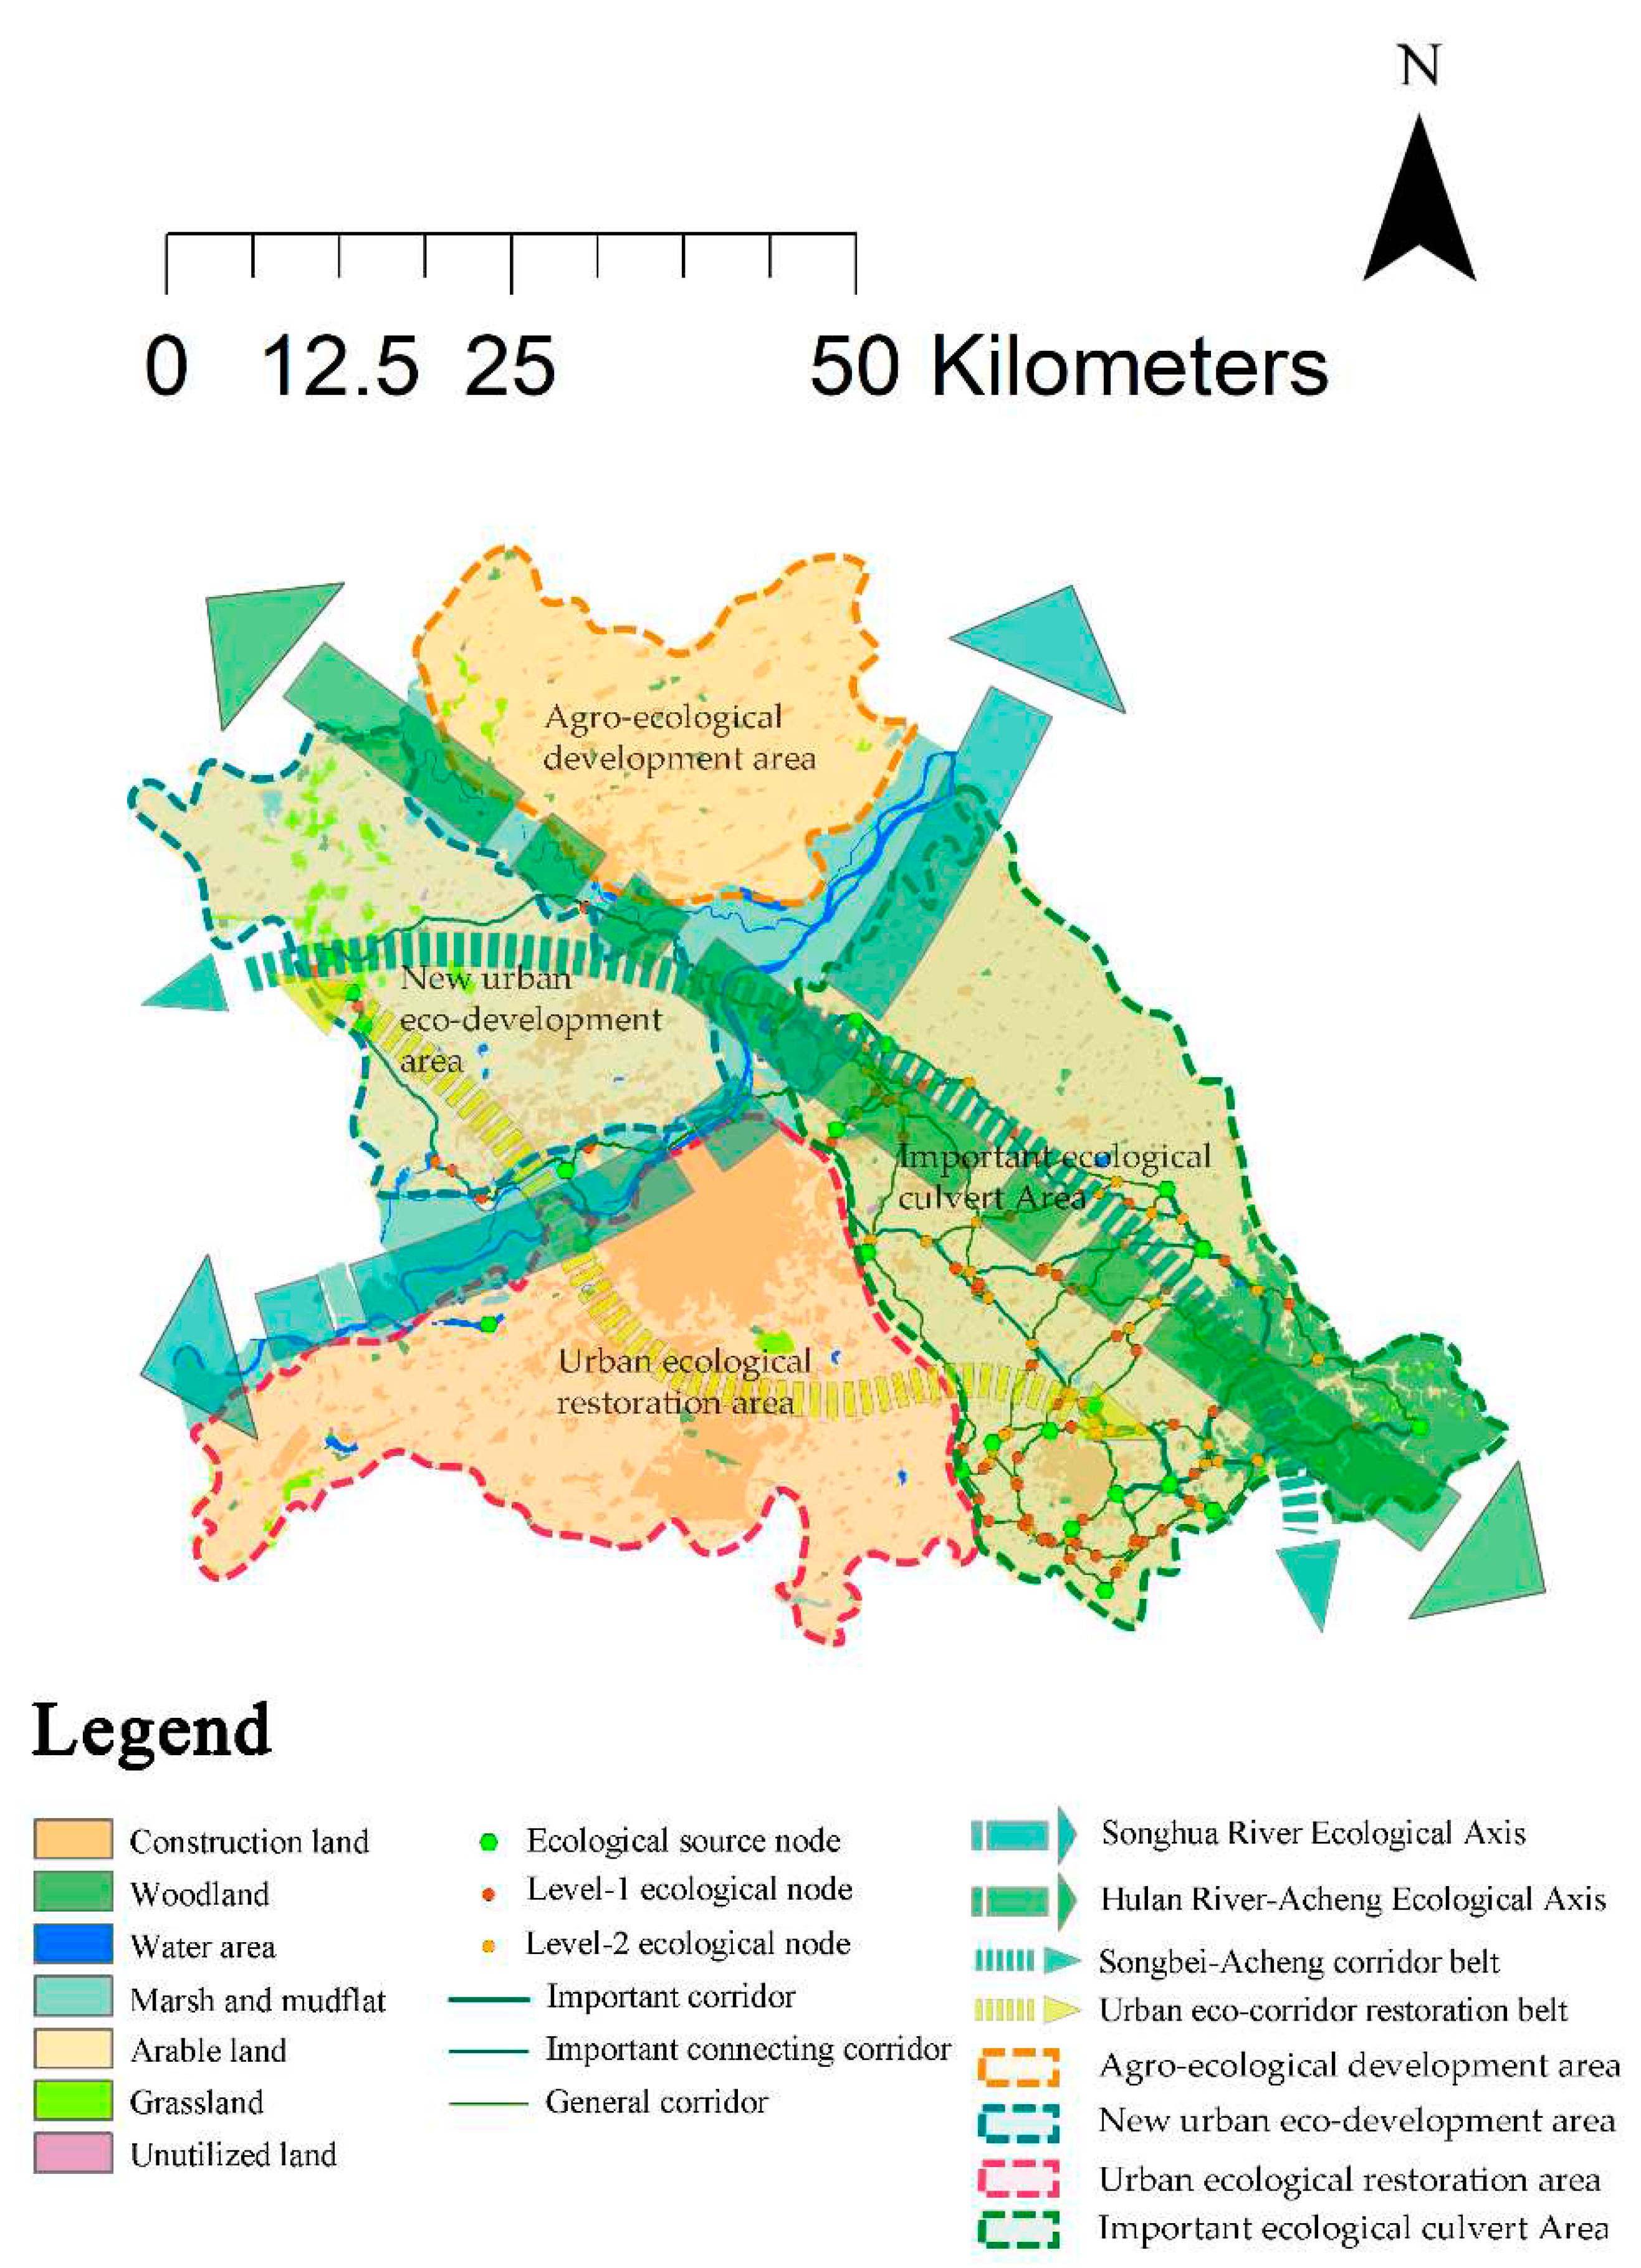

Table 1.
Grading Criteria for Single-Factor Evaluation of Ecological Sensitivity.
| Guideline | Ecological Indicator | Ecological Sensitivity Grade | Weight | ||||
| 1 | 3 | 5 | 7 | 9 | |||
| Topography and Geomorphology |
Elevation (m) | <140 | 140-190 | 190-240 | 240-290 | >290 | 0.0283 |
| Slope (°) | 3 | 8 | 15 | 25 | >25 | 0.0848 | |
| Slope Direction |
Flat, south | Southeast, southwest | East, west | Northeast, northwest | North | 0.0599 | |
| Topographic Relief (m) | 10 | 23 | 45 | 74 | >74 | 0.1199 | |
| Soil Security | Soil Type | Loamy sand | — | Loam | Silt loam | Clay loam | 0.0479 |
| Soil Erodibility |
Extremely low | Low | Medium | High | Extremely high |
0.1580 | |
| Rainfall (mm) | <562 | 562-577 | 577-592 | 592-614 | >614 | 0.0870 | |
| Vegetation and Water Systems |
Watershed Buffer (m) |
>400 | 200-400 | 100-200 | 50-100 | <50 | 0.1036 |
| Vegetation Fraction Coverage (%) |
<0.25 | 0.25-0.4 | 0.4-0.55 | 0.55-0.65 | >0.65 | 0.1036 | |
| Human Activities | Land Use Type | Construction land | Other unutilized land | Arable land | Grassland, swamp |
Water area, woodland | 0.1726 |
| Settlement Buffer (m) |
<200 | 200-400 | 400-600 | 600-800 | >800 | 0.0345 | |
Table 2.
Resistance values and weights of different resistance factors.
| Resistance Factor | Weight | Grade | Resistance Value |
|---|---|---|---|
| Land Use Type | 0.391 | Woodland | 10 |
| Grassland | 30 | ||
| Mudflat and marsh | 50 | ||
| Arable land | 100 | ||
| Water area | 200 | ||
| Unutilized land | 700 | ||
| Construction land | 1000 | ||
| Vegetation Fraction Coverage (%) | 0.138 | >0.65 | 10 |
| 0.65 | 30 | ||
| 0.55 | 50 | ||
| 0.4 | 500 | ||
| 0.25 | 800 | ||
| Topographic Relief (m) | 0.131 | 10 | 10 |
| 23 | 30 | ||
| 45 | 50 | ||
| 74 | 200 | ||
| 188 | 600 | ||
| Slope (°) | 0.065 | 3 | 10 |
| 8 | 20 | ||
| 15 | 80 | ||
| 25 | 200 | ||
| >25 | 600 | ||
| Distance from Railroad and Highway (m) | 0.163 | >800 | 10 |
| 800 | 20 | ||
| 600 | 100 | ||
| 400 | 400 | ||
| 200 | 800 | ||
| Distance from Settlement (m) | 0.112 | >800 | 10 |
| 800 | 30 | ||
| 600 | 150 | ||
| 400 | 500 | ||
| 200 | 800 |
Table 3.
Area and proportion of different ecological sensitivities.
| Sensitivity Classification | Area (hm2) | Percentage(%) |
|---|---|---|
| Insensitive | 73737.0595 | 17.07 |
| Slightly Sensitive | 133348.742 | 30.87 |
| Moderately Sensitive | 156070.2964 | 36.13 |
| Highly Sensitive | 52786.57686 | 12.22 |
| Extremely Sensitive | 16026.03929 | 3.71 |
| Total | 431968.7141 | 100 |
Table 4.
Area and percentage of landscape types.
| Landscape Types | Area/km² | Percentage of the Study Area |
Percentage of Total Ecological Landscape Area |
|---|---|---|---|
| Core | 916.94 | 21.23% | 73.22% |
| Bridge | 68.80 | 1.59% | 5.49% |
| Edge | 117.24 | 2.71% | 9.36% |
| Loop | 16.96 | 0.39% | 1.35% |
| Perforation | 8.16 | 0.19% | 0.65% |
| Branch | 63.17 | 1.46% | 5.04% |
| Islet | 61.09 | 1.41% | 4.88% |
| Total | 1252.35 | 28.99% |
Table 5.
Ecological indices of source areas.
| Node | dIIC | dPC | Area | Node | dIIC | dPC | Area |
|---|---|---|---|---|---|---|---|
| 1 | 0.01 | 0.02 | 253.72 | 13 | 0.08 | 0.15 | 155.97 |
| 2 | 0.34 | 0.45 | 194.30 | 14 | 0.06 | 0.05 | 176.88 |
| 3 | 0.03 | 0.04 | 609.86 | 15 | 0.06 | 0.05 | 141.39 |
| 4 | 0.40 | 0.45 | 230.43 | 16 | 1.68 | 2.27 | 220.71 |
| 5 | 1.18 | 1.70 | 1008.36 | 17 | 18.52 | 18.95 | 21534.43 |
| 6 | 0.01 | 0.01 | 206.22 | 18 | 0.10 | 0.09 | 226.03 |
| 7 | 0.41 | 0.50 | 237.30 | 19 | 0.19 | 0.24 | 227.77 |
| 8 | 0.09 | 0.16 | 155.15 | 20 | 1.63 | 2.19 | 909.51 |
| 9 | 0.38 | 0.52 | 351.74 | 21 | 81.00 | 80.47 | 47079.82 |
| 10 | 0.32 | 0.44 | 188.34 | 22 | 0.94 | 1.15 | 1459.40 |
| 11 | 0.04 | 0.04 | 1087.49 | 23 | 0.30 | 0.38 | 578.13 |
| 12 | 0.31 | 0.40 | 184.49 |
Table 6.
Gravity matrix between ecological source areas.
| No. | 2 | 3 | 4 | 5 | 6 | 7 | 8 | 9 | 10 | 11 | 12 | 13 | 14 | 15 | 16 | 17 | 18 | 19 | 20 | 21 | 22 | 23 |
|---|---|---|---|---|---|---|---|---|---|---|---|---|---|---|---|---|---|---|---|---|---|---|
| 1 | 0.19 | 9.07 | 0.23 | 0.17 | 3.2 | 0.07 | 0.05 | 0.12 | 0.09 | 0.05 | 0.05 | 0.05 | 0.03 | 0.03 | 0.15 | 0.07 | 0.04 | 0.05 | 0.03 | 0.19 | 0.02 | 0.03 |
| 2 | 0.17 | 21.79 | 63.7 | 0.11 | 2.26 | 0.32 | 0.71 | 0.11 | 0.39 | 0.06 | 0.24 | 0.15 | 0.14 | 0.65 | 0.31 | 0.17 | 0.22 | 0.1 | 0.21 | 0.08 | 0.1 | |
| 3 | 0.2 | 0.15 | 21.62 | 0.06 | 0.04 | 0.11 | 0.12 | 0.04 | 0.07 | 0.04 | 0.03 | 0.03 | 0.14 | 0.07 | 0.04 | 0.05 | 0.02 | 0.26 | 0.02 | 0.03 | ||
| 4 | 26.37 | 0.13 | 2.51 | 0.33 | 0.74 | 0.14 | 0.42 | 0.04 | 0.27 | 0.17 | 0.16 | 0.72 | 0.33 | 0.19 | 0.25 | 0.11 | 0.27 | 0.09 | 0.12 | |||
| 5 | 0.1 | 3.43 | 0.39 | 0.85 | 0.12 | 0.46 | 0.03 | 0.28 | 0.17 | 0.16 | 0.74 | 0.36 | 0.19 | 0.25 | 0.11 | 0.22 | 0.09 | 0.12 | ||||
| 6 | 0.04 | 0.03 | 0.07 | 0.09 | 0.03 | 0.05 | 0.03 | 0.02 | 0.02 | 0.09 | 0.05 | 0.03 | 0.03 | 0.02 | 0.22 | 0.01 | 0.02 | |||||
| 7 | 0.15 | 0.34 | 0.07 | 0.3 | 0.02 | 0.13 | 0.08 | 0.08 | 0.36 | 0.15 | 0.09 | 0.12 | 0.05 | 0.14 | 0.05 | 0.06 | ||||||
| 8 | 32.82 | 0.03 | 0.22 | 0.01 | 0.56 | 0.23 | 0.26 | 2.73 | 1.69 | 0.24 | 0.89 | 0.27 | 0.05 | 0.14 | 0.25 | |||||||
| 9 | 0.08 | 0.56 | 0.03 | 2.36 | 0.81 | 1.02 | 12.71 | 8.32 | 0.81 | 3.98 | 1.05 | 0.13 | 0.48 | 0.9 | ||||||||
| 10 | 0.04 | 0.15 | 0.03 | 0.02 | 0.02 | 0.1 | 0.05 | 0.03 | 0.04 | 0.02 | 3.63 | 0.02 | 0.02 | |||||||||
| 11 | 0.01 | 0.38 | 0.23 | 0.2 | 0.84 | 0.24 | 0.25 | 0.28 | 0.11 | 0.07 | 0.1 | 0.11 | ||||||||||
| 12 | 0.01 | 0.01 | 0.01 | 0.04 | 0.02 | 0.02 | 0.02 | 0.01 | 0.16 | 0.01 | 0.01 | |||||||||||
| 13 | 1.95 | 4.72 | 17.9 | 1.31 | 1.31 | 4.22 | 0.9 | 0.06 | 0.4 | 0.65 | ||||||||||||
| 14 | 3.79 | 2.65 | 0.46 | 9.42 | 0.8 | 0.28 | 0.04 | 1.02 | 0.74 | |||||||||||||
| 15 | 4.42 | 0.57 | 1.72 | 1.24 | 0.37 | 0.04 | 0.43 | 0.37 | ||||||||||||||
| 16 | 10.77 | 2.32 | 357.2 | 12.78 | 0.18 | 2.41 | 5.99 | |||||||||||||||
| 17 | 0.49 | 3.72 | 0.88 | 0.08 | 0.4 | 0.75 | ||||||||||||||||
| 18 | 0.73 | 0.49 | 0.05 | 2.15 | 1.4 | |||||||||||||||||
| 19 | 3.09 | 0.06 | 0.77 | 1.88 | ||||||||||||||||||
| 20 | 0.03 | 0.94 | 1.95 | |||||||||||||||||||
| 21 | 0.03 | 0.04 | ||||||||||||||||||||
| 22 | 2.88 |
Table 7.
Area and proportion of ecological safety areas.
| Classification of Ecological Safety Areas | Percentage(%) | Area (km²) |
|---|---|---|
| High | 45.75 | 1976.37 |
| Higher | 28.34 | 1224.38 |
| Medium | 18.09 | 781.37 |
| Lower | 5.95 | 257.05 |
| Low | 1.87 | 80.84 |
Disclaimer/Publisher’s Note: The statements, opinions and data contained in all publications are solely those of the individual author(s) and contributor(s) and not of MDPI and/or the editor(s). MDPI and/or the editor(s) disclaim responsibility for any injury to people or property resulting from any ideas, methods, instructions or products referred to in the content. |
© 2023 by the authors. Licensee MDPI, Basel, Switzerland. This article is an open access article distributed under the terms and conditions of the Creative Commons Attribution (CC BY) license (http://creativecommons.org/licenses/by/4.0/).
Copyright: This open access article is published under a Creative Commons CC BY 4.0 license, which permit the free download, distribution, and reuse, provided that the author and preprint are cited in any reuse.


