
Submitted:
28 September 2023
Posted:
14 October 2023
You are already at the latest version
Abstract
Leishmaniasis is one of the Neglected tropical diseases. Studies show that the poor knowledge about epidemiological aspects of Leishmaniasis within communities causes the collapse of existing disease control programs. Therefore, the present study focuses on a detailed survey of the existing awareness among the threatened population in the Medawachchiya PHI Area in the Anuradhapura District, Sri Lanka aiming to assist the health staff to organize community-based vector control programs effectively in the future. Assessment of the awareness of the two hundred and seventy households (n=270) residents from ten GNDs was carried out by using a structured questionnaire. Among 143 females and 134 males, only 75.1% have knowledge about the disease. 5.8%(n=16) of the participants know only about the vector and 28.9% (n=80) know their control methods. The study shows a shortage of a considerable amount of awareness about the disease among the studied population The study found that age and education levels had significant impacts on knowledge, attitudes, and practices. However, factors like gender, marital status, occupation, income, and expenses did not show significant correlations. The present study suggests the huge scope for community-related vector control methods for greater achievements in vector control methods by implementing a continuous educational program.
Keywords:
Awareness
; KAP survey
; Leishmaniasis
; neglected tropical Diseases
; Questionnaire
; Socio-economic factors
; Vector borne diseases
1. Background
- Why a KAP survey?
One of the neglected tropical vector-borne diseases, Leishmaniasis is reportedly infecting people in regions of Asia, Africa, the Middle East as well as the central and Southern parts of America [1]. This is a zoonotic disease, which is transmitted by phlebotomine female sandflies that carry protozoan parasites of the genus Leishmania. Leishmaniasis infection can show in a range of clinical forms and the three primary disease phenotypes can be considered cutaneous (CL), mucosal (ML), and visceral leishmaniasis (VL)[2].
Regarding the current global situation, estimates of the number of new cases each year for Cutaneous Leishmaniasis have fluctuated from around 700,000 to 1.2 million or more [3]. This disease occurs more frequently in people who have experienced hunger, population relocation, poor housing, weakened health, or a lack of financial resources [4].
The primary clinical type of leishmaniasis in Sri Lanka is cutaneous leishmaniasis [5-6] In 1992, the Southern Province of Sri Lanka reported the first case of locally acquired Cutaneous Leishmaniasis [7] and since then, the disease has become endemic across the country. A study carried out to analyze epidemiological data showed that the biggest prevalence was found to come from the Anuradhapura and Hambantota districts [8]. Certain socio-economic factors such as occupations, life styles and poor knowledge about different epidemiological aspects of Leishmaniasis in rural areas are associated with increased Cutaneous Leishmaniasis incidents.
Control measures that are currently employed often require early detection and weeks of painful drug administration’s [9]. Since there are no vaccines and medications available to prevent the infection, The best strategy to mitigate this condition are vector control and safeguard against sand fly bites. The prevention of these diseases depends heavily on community involvement and they need sufficient knowledge of the disease, its vector, modes of transmission, and other risk factors.
The objective of this questionnaire is to assess the knowledge, attitude and practice of the general public on Cutaneous Leishmaniasis and its various aspects. The survey was carried out in ten Grama Niladari Divisions (GND) at the Medawachchiya PHI Area in the Anuradhapura District of Sri Lanka with the intention of assisting the health sector in properly planning community-based vector control activities in the future. Apart from their basic personnel information and history, some questions were asked about their knowledge on the Leishmaniasis disease and the vector as well as the preventive measures they already have taken to mitigate the condition.
2. Methods
- How did it go?
2.1. Selection of the study setting
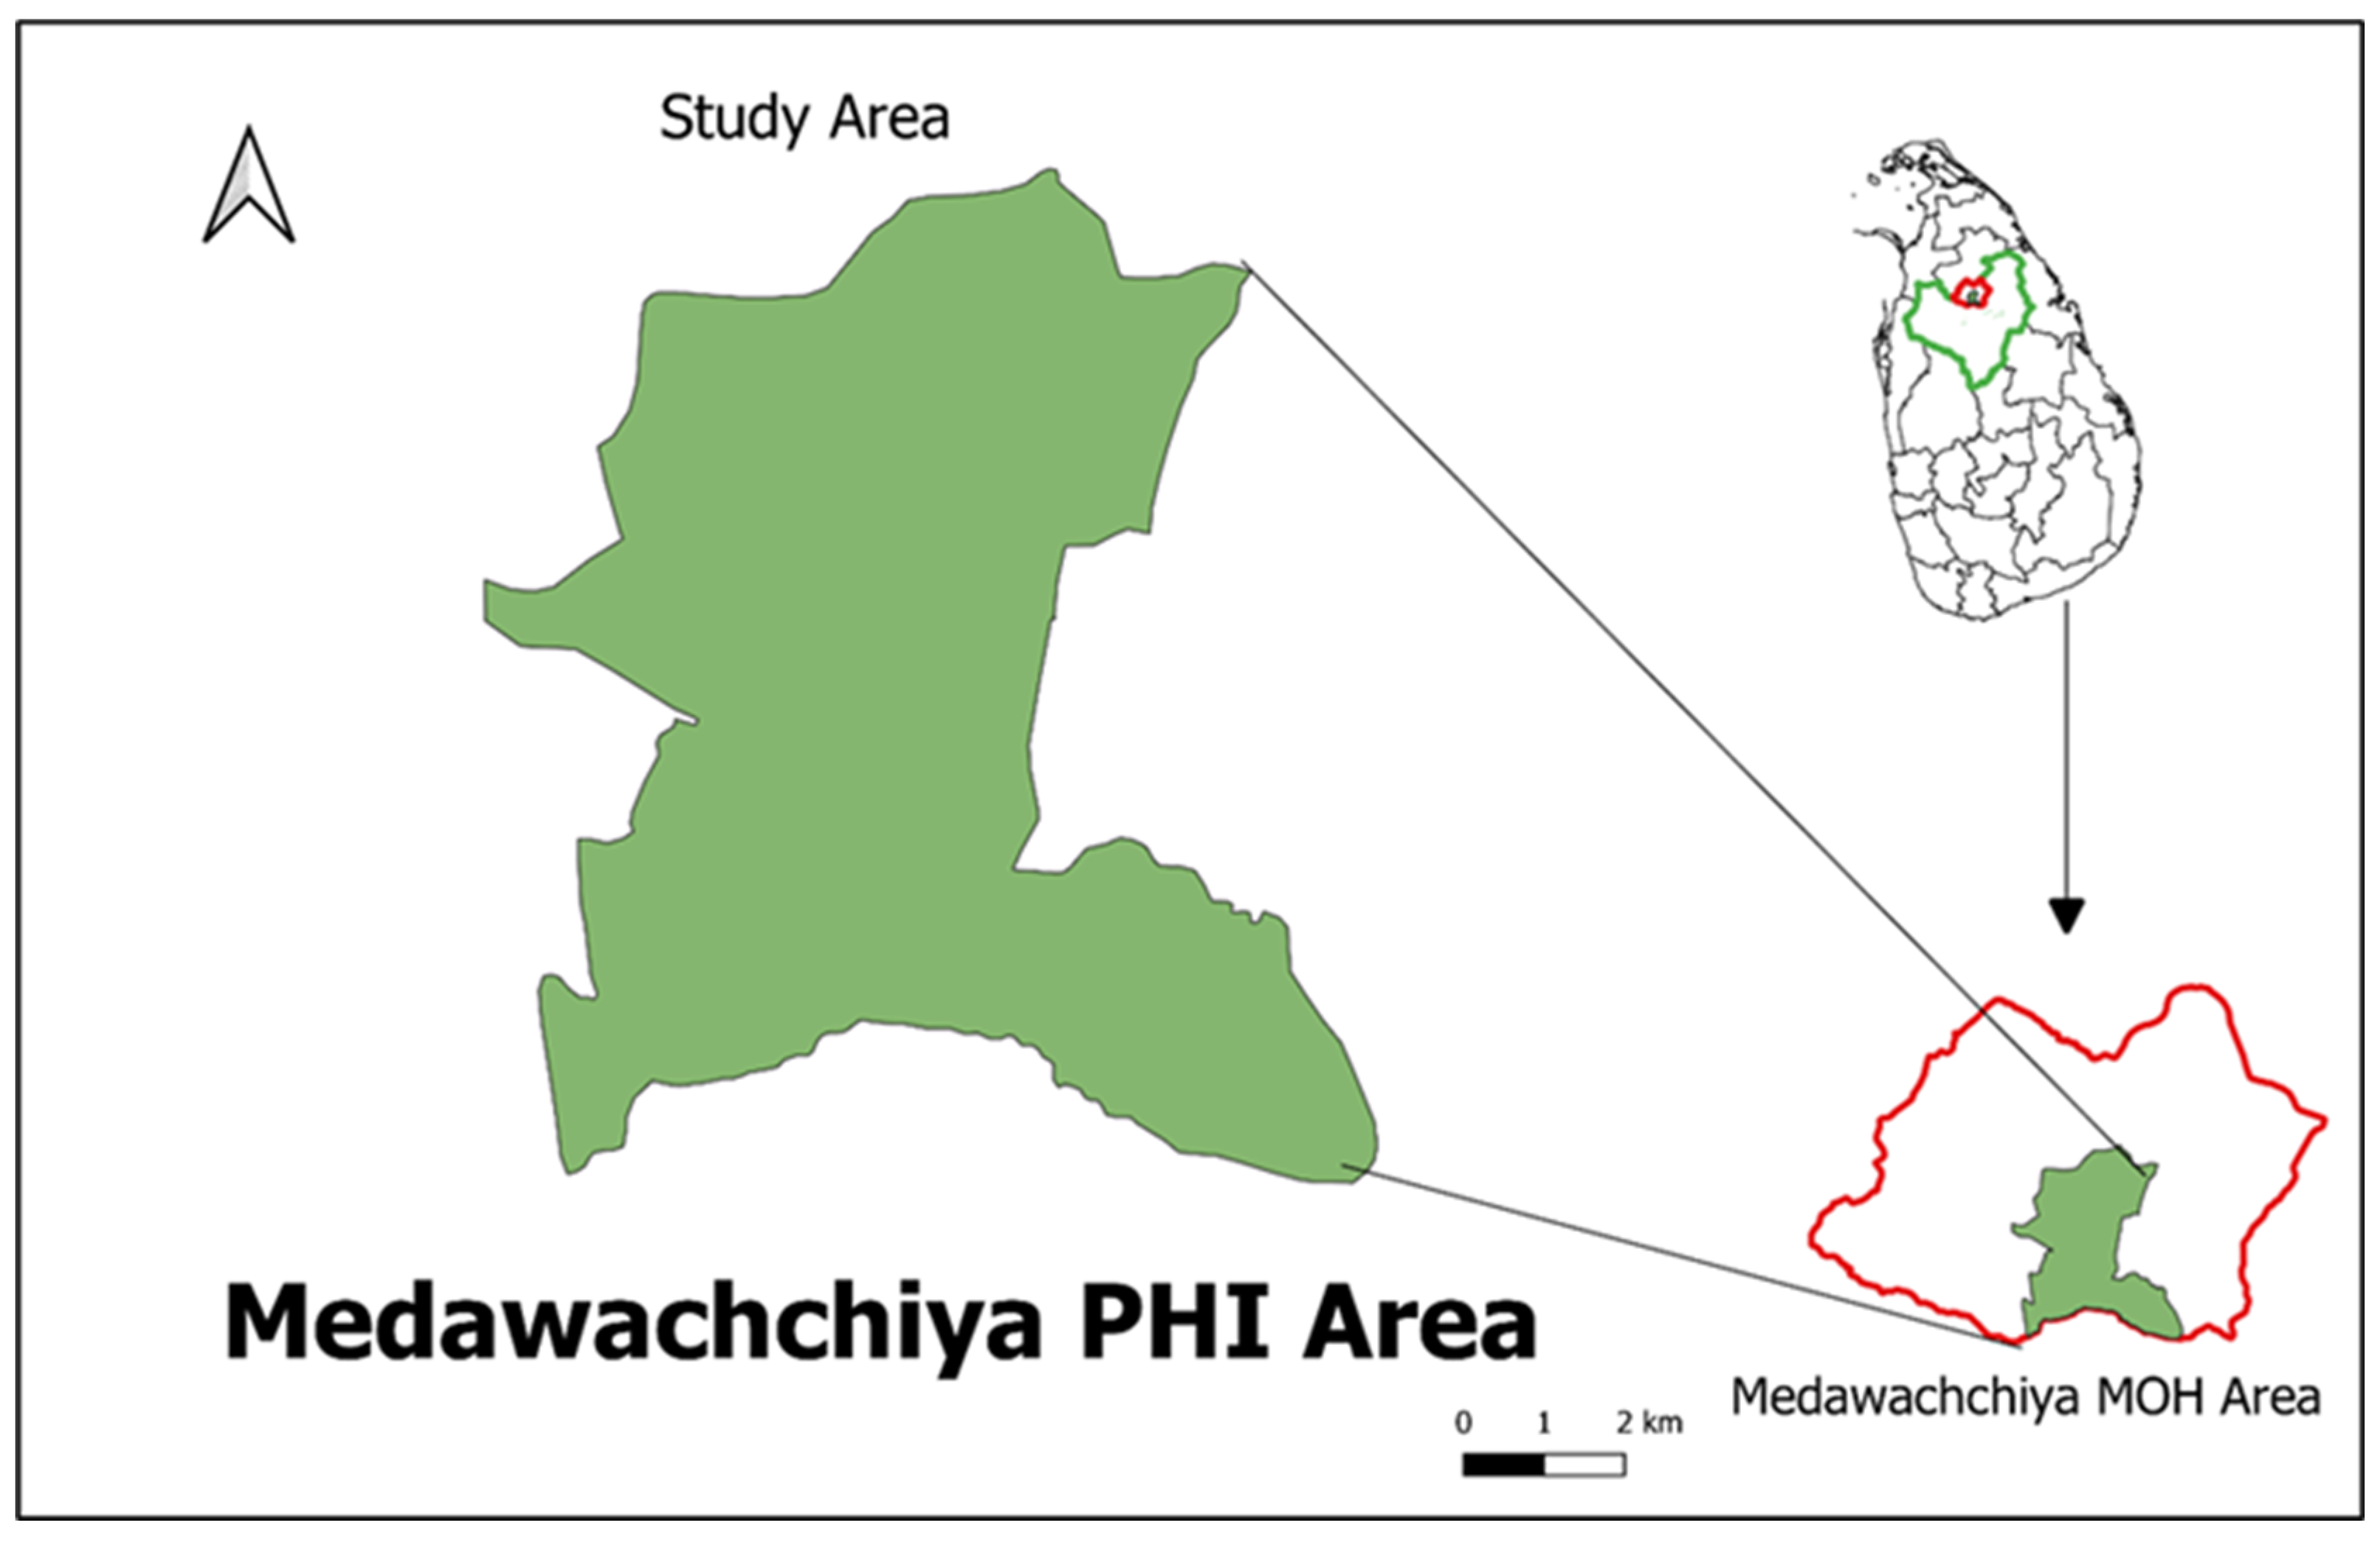
Cross sectional study was carried in 10 GNDs in Medawachchiya Public Health Inspector’s area (PHI area) which is newly emerging high-risk area situated within Anuradhapura district, Sri Lanka (Figure1). Target population size was 300 households representing 30 households per GND.
Figure 1.
Study Area-Madawachchiya PHI area, Anuradhapura District, Sri Lanka.
2.2. Questionnaire validation
A panel of three health care specialists extensively examined the questionnaire. trainee public health specialists, two physician (consultant Parasitologists and Consultant Public Health Community Physician), two entomologist, and two lecturers from the research institution covering both Medical Entomology and Health Promotion specialization. This content validation was performed to ensure that the questions were not unclear and that the material was suitable. Modifications to the layout and structure of questions were made in response to panel reviews. Pilot research was also conducted among randomly selected volunteer community members living in close proximity to study location in Madawachchiya PHI area (n=40) to establish dependability. The test-retest approach was used. After a 10-day delay, the same set of participants was asked to complete the same questionnaire.
2.3. Data collection
The random sampling method were used to collect the data from the residents. The data collection was carried out by interviewer administrated survey using structured questionnaire. The questionnaire contained 38 (thirty-eight) short and pointed questions directing towards to the socio-economic background, knowledge, Attitude and practices toward leishmaniasis of respondents. Interviewers were also carefully selected and Selected interviewers were trained prior to the survey to prevent interviewer biases (Figure 2). The covered area during the survey is 13.2% of the Medawachchiya MOH area.
KAP questions were scored as follows, for the knowledge part lowest score which is 1 was given for the “Don’t know” or “No Idea” while the highest number which is 2 were given to “Yes”. For the practice’s questions, lowest score was given to the “No” which is 1 while the highest score was given to the “Yes” which is 2. During the Attitude test lowest score were given to “Definitely dissatisfied” and highest score were given to the “Definitely satisfied”. The score as follows, “Definitely dissatisfied” = 1, “Moderately dissatisfied” = 2, “Neutral” = 3, “Moderately satisfied” = 4, “Definitely satisfied” = 5.
2.4. Data Processing and Analysis
Questionnaire data was collected by the interviewers using Epicollect5 mobile application and google forms. Each completed forms were manually checked before extract data to the MS Excel 2017 to increase the quality of the data. The extracted data was analyzed by using Statical Package for Social Sciences 25 (SPSS V.25). The Kolmogorov-Smirnov test was used to determine the normality of the data. To show findings, descriptive and inferential statistics such as the Chi-square test, Mann-Whitney U test, Kruskal Wallis H test, and binary regression were utilized. A p-value of less than 0.05 was considered statistically significant for each test.
2.5. Ethical Consideration
All the participants were briefed about the study prior to the survey and gave the verbal consent. Anonymous questionnaire was carried out. The ethical approval for the study was given by the Ethical Review committee of the Faculty of Applied Sciences, Rajarata University of Sri Lanka (ERC approval Ref: ERC/04/021).
3. Results
- What the KAP survey revealed?
The reliability results of the questionnaire showed that there was no statistically significant difference between results of both pilot studies. The questionnaire's Cronbach's alpha was 0.86. For individual domains, the knowledge portion had the highest Cronbach's alpha, followed by the attitude and practices sections. The explanation for the low Cronbach's alpha for the attitude and practice domains might be related to a lower number of questions than in the knowledge portion. A total of 300 surveys were targeted to conducted, with 277 completions, for a 92% response rate. An extremely high response rate might be attributed to a face-to-face personnel contact between the researcher and the survey respondents. Non-respondents were not contacted.
- Whose is this about?
Table 1 shows the demographic profile of study participants, including frequencies for age category, gender, marital status, education level, occupational status, and family income and expenditure category. The age of the participants ranged from 17 to 80 years, with a mean age of 45.64 ± 13.81 years. The ethnicity of the study population was not considered in the survey, as 90% of the study population belongs to a single ethnic group. The reported high unemployment rate and low education level of the study participants could be due to time lags in the survey.
3.1. Knowledge: How much do they know?
- what do they know about the disease?
The study found that knowledge about the disease and the vector in the area is low, although 75.1% of residents have heard of the disease. 79.1% of respondents have no idea whether the disease is curable or not, and 2.9% believe it is not curable. Only 18.1% of the respondents know that the disease is curable. Figure 3 shows the frequency of the participants respond about the symptoms.
- Do they know the vector of the Leishmaniasis?
87.7% of respondents have heard of the sand fly. But only 0.4% of the respondents know that the sand fly is the vector of leishmaniasis and 27.8% believe that sand flies bite only humans. The Figure 4 and Figure 5 illustrate the knowledge about the vector, and breeding places of sand fly vector within participants.
3.2. Attitudes: What do they think?
- Attitude towards the vector control, Disease control and knowledge sources.
Most of the respondents (87.0%) get their knowledge from Medical Officers of Health (MOH Office) and social media. But 93.0% of the respondents are dissatisfied with their knowledge about the disease and vector and 82.1% of the respondents are dissatisfied with the knowledge of their family members, 85.9% of the respondents get their knowledge from the community members but more than half of them (59.55%) are also dissatisfied with the knowledge of the community members. They pointed out that the government and non-governmental health organizations should be more involved in this matter.
3.3. Practices: Are they successful?
- What is their level of Vector Control practices?
The study showed that the level of common vector control practices in the studied population is high. Respondents indicated that this practice was mainly influenced by the educational campaigns of the National Dengue Control Unit, the anti-malaria campaign, the doctors of the health offices and other governmental and non-governmental health organizations. Still, more than 15% (16.1%) of respondents agreed that vector education is important. However, 93.0% were dissatisfied with the existing knowledge about the vector and the disease. They pointed out (64.7%) that the inability to identify the vector and breeding sites is the main obstacle to successful vector control practice, as with other vector-borne diseases such as dengue and malaria.
- What about the level of Disease control practices?
More than half of the respondents (99.6%) in this study indicated that they had no idea what steps to take in relation to someone suffering from this disease. They pointed out that they have no idea about the symptoms and that there is some confusion between normal pimples, blisters and the Leishmania symptoms. Not only that, the fewer deaths there are, the less attention is paid to this issue, and they do not know how to treat a patient.
- What is the inferential study say?
The descriptive statistics for each item of the questionnaire are presented in Table 2. In the knowledge domain, the majority, 212 (71%), could not correctly identify leishmaniasis as a disease that causes sores and scars, while 130 (46.75%) participants knew the disease vector sandfly. The majority of 226 (81.68%) had no idea of the risk factors for leishmaniasis disease, while 48 (17.44%) responded that they had some idea of the risk factors associated with transmission of leishmaniasis disease. Among the risk factors, majority 276 (99.6%) could not identify any possible reservoir hosts for the leishmaniasis parasite, followed by sandfly breeding sites 165 (59.60%) and stinging time 145 (52.30%) as risk factors for transmission of leishmaniasis. Majority 229 (82.60%) did not know about the control measures for sandflies or how to prevent the transmission of the disease. In the attitudes section, 165 (59.40%) stated that attitudes towards sandfly vector control were poor and not known, while the majority 212 (48%) agreed that attitudes towards disease control were poor in their family and community. Similar negative attitudes were observed in the questions about information discrimination about leishmaniasis and its control (223, 80.43%). The frequency of questions about practices showed that the majority of participants (276, 99.6%) rarely thought about the precautions that should be taken to avoid transmission of the disease by infected patients. The majority indicated that disease and sandfly vector control practices by the government (253, 91.3%), private institutions (244, 88.1%), community members (238, 85.9%), family members (133, 48.0%), and themselves (259, 93.5%) were inadequate. A large number mentioned community members (143, 51.6%), followed by television (52, 18.8%) as sources of information, while only 20 (7.2%) mentioned health professionals as sources of information.
The Mann-Whitney U and Kruskal Wallis H tests were applied to compare the values of each area with different demographic factors. The results of the test are shown in Table 3. Considering p < 0.05 as statistically significant, there was a difference between the mean knowledge (p=0.037), attitude (p=0.044), and practices (p=0.041) scores of the different age categories (Table 3). The mean knowledge scores of the different educational categories also differed significantly (p=0.021), with higher levels of education (up to 9th grade) having higher knowledge than lower levels of education with no schooling. However, there were no higher educated participants from the same group of study participants representing other educational categories, such as above 9th grade to college degree. The number of family members also showed that more than 5 members had statistically significant higher mean scores for attitude and practice than the other two categories, i.e., the number of family members of less than 2 and between 2 and 5 (Table 3). No statistically significant differences were found in the results for other demographic factors such as gender, marital status, occupational status, monthly income, and expenses (Table 3).
A correlation between the different areas of the questionnaire was also examined. A positive correlation was found between knowledge and attitude and between attitude and practice (Table 4).
Using the chi-square test, the study participants' scores for each area were categorized into three categories: good, fair, and poor. The results of this categorization are shown in Table 5 and the participants were found to have a good level of knowledge, attitude and practices among unemployed, unmarried, females with barely sufficient income and no schooling in the age group (34-49) years. It also showed significant association between (KAP) regarding leishmaniasis with age, gender and education level while there is significant association between attitude towards leishmaniasis diseases with monthly income and number of family members at p value less than (0.05).
4. Discussion
The current study differs from previously conducted KAP studies in several aspects. First, the current study included participants of different age groups (19 to 85 years). Second, a scoring system was developed, and participants' scores for each domain were analyzed and related to various demographic factors; participants were also categorized according to their scores for each domain. Another important aspect of this study was to evaluate different attitudes and practices of the low educated population regarding leishmaniasis and to analyze different practices that may serve as risk factors for transmission of leishmaniasis parasites and acquisition of the disease. The results of our study show that knowledge of disease transmission and vector control, attitudes and practices related to these two aspects were higher in older people than in young people. The same results were observed with a slightly higher level of education in the study population and with more than 5 family members in a family (Table 3 and Table 4).
We should commonly admit that so-called neglected diseases such as Leishmaniasis have affected exclusively extremely poor populations living in remote areas beyond the reach of health services [10]. As this disease rarely fatal and most commonly found in poor community there is a little or no attention regarding this disease from the researchers, drug developers and Healthcare authorities. To our knowledge this is the first time ever that a KAP survey carried out in this area regarding this matter.
The impact from the years of awareness and education from several Government and non-government organization such as National Dengue Control Unit, Anti Malaria Campaign and MOH offices etc. have increased the common vector control practices such as cleaning the mosquito breeding places, using personal protection measures, insect repellents and attractions. But the sand fly specific vector control practices are still new to them.
Early diagnosis is main key factor for the management of the disease. In Sri Lanka, no programs are conducted to detect patients at early stages infection[11].This lead to a little knowledge among the population . In addition to that late identification cause more complicated situations. Therefore, the study clearly indicated that there is a need of series of education programs.
In the present study, the main knowledge resources among the respondents were social media, MOH office and the community members. Even though a knowledge gap was observed within respondents in terms of understanding the vector , vector control practices , early identification of the disease and seeking for medical attention there is a huge scope for the community directed vector and disease control programs like wise Anopheline elimination using Community-based rice ecosystem before [12].
Though the selection is unbiased, out of the total number of respondents (n=277), more than half (n=143) is female. Most of them are housewives within 34-49 age with ordinary Level education. We think this will not affect to the results of the study as it is natural to be the key person who leads the family to this kind of vector control practices and recognize early symptoms is the housewives or mothers. This indicate that younger housewives and mothers must be considered as the key element for the successful disease control program [13]. However, the maintaining and cleaning outside the immediate living are such as rock cervical, termite nests, animal burrows mainly taken care by the males. Therefore vector control programs should be targeting males and females separately being specifics to their gender roles in the households [14].
The majority of the respondents do not seek the medical care after the identification of the symptoms, they pointed out that people tend to seek traditional remedies first because of various socio- economic factors such economical background, job status. Most of the respondents are self-employed like farmers and hired workers. Even though most of respondents have >LKR 50,000 monthly income but the monthly expenses exceed more than the income. In addition to that all nearby dermatological clinics are more than 20km away which need a day to spend for seeking medical attention.
This kind of situations is common in other Leishmaniasis endemic countries such as North Sudan and Bolivia [15,16]. Even though this study not focus on this matter, it is important to study further , is there a direct relationship between not seeking medical attention right after the identification of the symptoms and tending towards the traditional remedies with the economical background and the job status.
One of the major limitations in our study is the time, study population cannot be extrapolating whole the country but this study will be based for future studies and successful vector and disease control programs. This KAP also will help to our target to improve the early diagnosis and community directed vector control program not only in the study area ultimately entire nation.
- What are the challenges? Limitations of the research
As previously stated, the convenience sample approach was utilized to fill out surveys, and non-respondents were not followed up with. As a result, a better study design based on random stratified sampling may have been used. Because the research participants were chosen from a single community in the study area, the sample group may not fully reflect all Residents.
5. Conclusions
The present study identifies the significant importance of implementing a series of community directed awareness programs through health camps, community meetings and information disseminating through media especially social media. This can be effective to improve the attitude towards the early diagnosis and seeking medical attention and vector controlling. In addition to that the previous experiences learnt from other infectious disease control program should subdividing to these disease and vector control programs.
The results of our study demonstrate an urgent need of a targeted educational and awareness program for university students belonging to different age groups. Educational programs based on the four parameters of the health belief model should be designed and implemented on a large scale.
Author Contributions
Conceptualization, Mayumi Manamperi, N. D. A. D. Wijegunawardana and P. Kandegedara : methodology, Mayumi Manamperi, N. D. A. D. Wijegunawardana and P. Kandegedara; software, N. D. A. D. Wijegunawardana , G. I. C. L. De Zoysa, Mayumi Manamperi,; validation, N. D. A. D. Wijegunawardana and G. I. C. L. De Zoysa; formal analysis, N. D. A. D. Wijegunawardana; investigation, Mayumi Manamperi, N. D. A. D. Wijegunawardana ,P. Kandegedara, J.M.A.I.K. Jayamanna and E. G. Perera; data curation, Mayumi Manamperi, N. D. A. D. Wijegunawardana; writ-ing original draft preparation, Mayumi Manamperi, N. D. A. D. Wijegunawardana , J.M.A.I.K. Jayamanna and E. G. Perera.; writing—review and editing, Mayumi Manamperi, N. D. A. D. Wijegunawardana, P. Kandegedara; visualization, Mayumi Manamperi and N. D. A. D. Wijegunawardana; supervision, N. D. A. D. Wijegunawardana and P. Kandegedara; project administration, N. D. A. D. Wijegunawardana: funding acquisition, N. D. A. D. Wijegunawardana. All authors have read and agreed to the published version of the manuscript.
Funding
This project is funded by WHO/TDR crowdfunding project 2019.
Acknowledgments
The authors would like to express their gratitude to students of faculty of technology in Rajarata University of Sri Lanka and the residents of Medawachchiya PHI area for their voluntary participation in this work.
Conflicts of Interest
None.
References
- S. Mann et al., “A Review of Leishmaniasis: Current Knowledge and Future Directions,” Curr. Trop. Med. Reports, vol. 8, no. 2, pp. 121–132, 2021. [CrossRef]
- R. Arenas, E. Torres-Guerrero, M. R. Quintanilla-Cedillo, and J. Ruiz-Esmenjaud, “Leishmaniasis: A review,” F1000Research, vol. 6, no. May, pp. 1–15, 2017. [CrossRef]
- C.-C. for D. C. and Prevention, “CDC - Leishmaniasis - Epidemiology & Risk Factors.” 2013. [Online]. Available: http://www.cdc.gov/parasites/leishmaniasis/epi.html.
- J. Alvar, S. Yactayo, and C. Bern, “Leishmaniasis and poverty,” Trends Parasitol., vol. 22, no. 12, pp. 552–557, 2006. [CrossRef]
- N. D. Karunaweera, F. Pratlong, H. V. Y. D. Siriwardane, R. L. Ihalamulla, and J. P. Dedet, “Sri Lankan cutaneous leishmaniasis is caused by Leishmania donovani zymodeme MON-37,” Trans. R. Soc. Trop. Med. Hyg., vol. 97, no. 4, pp. 380–381, 2003. [CrossRef]
- H. Siriwardana, P. Chandrawansa, G. Sirimanna, and N. Karunaweera, “Leishmaniasis in Sri Lanka: a decade old story,” Sri Lankan J. Infect. Dis., vol. 2, no. 2, p. 2, 2012. [CrossRef]
- A. Amarasinghe and S. Wickramasinghe, “A Comprehensive Review of Cutaneous Leishmaniasis in Sri Lanka and Identification of Existing Knowledge Gaps,” Acta Parasitol., vol. 65, no. 2, pp. 300–309, 2020. [CrossRef]
- H. V. Y. D. Siriwardana, N. Thalagala, and N. D. Karunaweera, “Clinical and epidemiological studies on the cutaneous leishmaniasis caused by Leishmania (Leishmania) donovani in Sri Lanka,” Ann. Trop. Med. Parasitol., vol. 104, no. 3, pp. 213–223, 2010. [CrossRef]
- F. Chappuis et al., “Visceral leishmaniasis: What are the needs for diagnosis, treatment and control?,” Nat. Rev. Microbiol., vol. 5, no. 11, pp. 873–882, 2007. [CrossRef]
- A. Boutayeb, “Developing countries and neglected diseases: Challenges and perspectives,” Int. J. Equity Health, vol. 6, pp. 4–7, 2007. [CrossRef]
- T. Wijerathna, N. Gunathilaka, K. Gunawardana, and W. Rodrigo, “Potential Challenges of Controlling Leishmaniasis in Sri Lanka at a Disease Outbreak,” Biomed Res. Int., vol. 2017, 2017. [CrossRef]
- J. Yasuoka, R. Levins, T. W. Mangione, and A. Spielman, “Community-based rice ecosystem management for suppressing vector anophelines in Sri Lanka,” Trans. R. Soc. Trop. Med. Hyg., vol. 100, no. 11, pp. 995–1006, 2006. [CrossRef]
- “Empowering Women by Creating Awareness _ United Nations”.
- M. Anker, “Addressing sex and gender in epidemic-prone infectious diseases,” World Heal. Organ., pp.1–46,2007,[Online].Available: https://www.who.int/csr/resources/publications/SexGenderInfectDis.pdf.
- S. Gerstl, R. Amsalu, and K. Ritmeijer, “Accessibility of diagnostic and treatment centres for visceral leishmaniasis in Gedaref State, northern Sudan,” Trop. Med. Int. Heal., vol. 11, no. 2, pp. 167–175, 2006. [CrossRef]
- Eid D, San Sebastian M, Hurtig AK, Goicolea I. Leishmaniasis patients’ pilgrimage to access health care in rural Bolivia: A qualitative study using human rights to health approach. BMC Int Health Hum Rights. 2019;19(1):1-9. [CrossRef]
Figure 2.
interviewer Administrated Questionnaire interviews conducted in the study area.
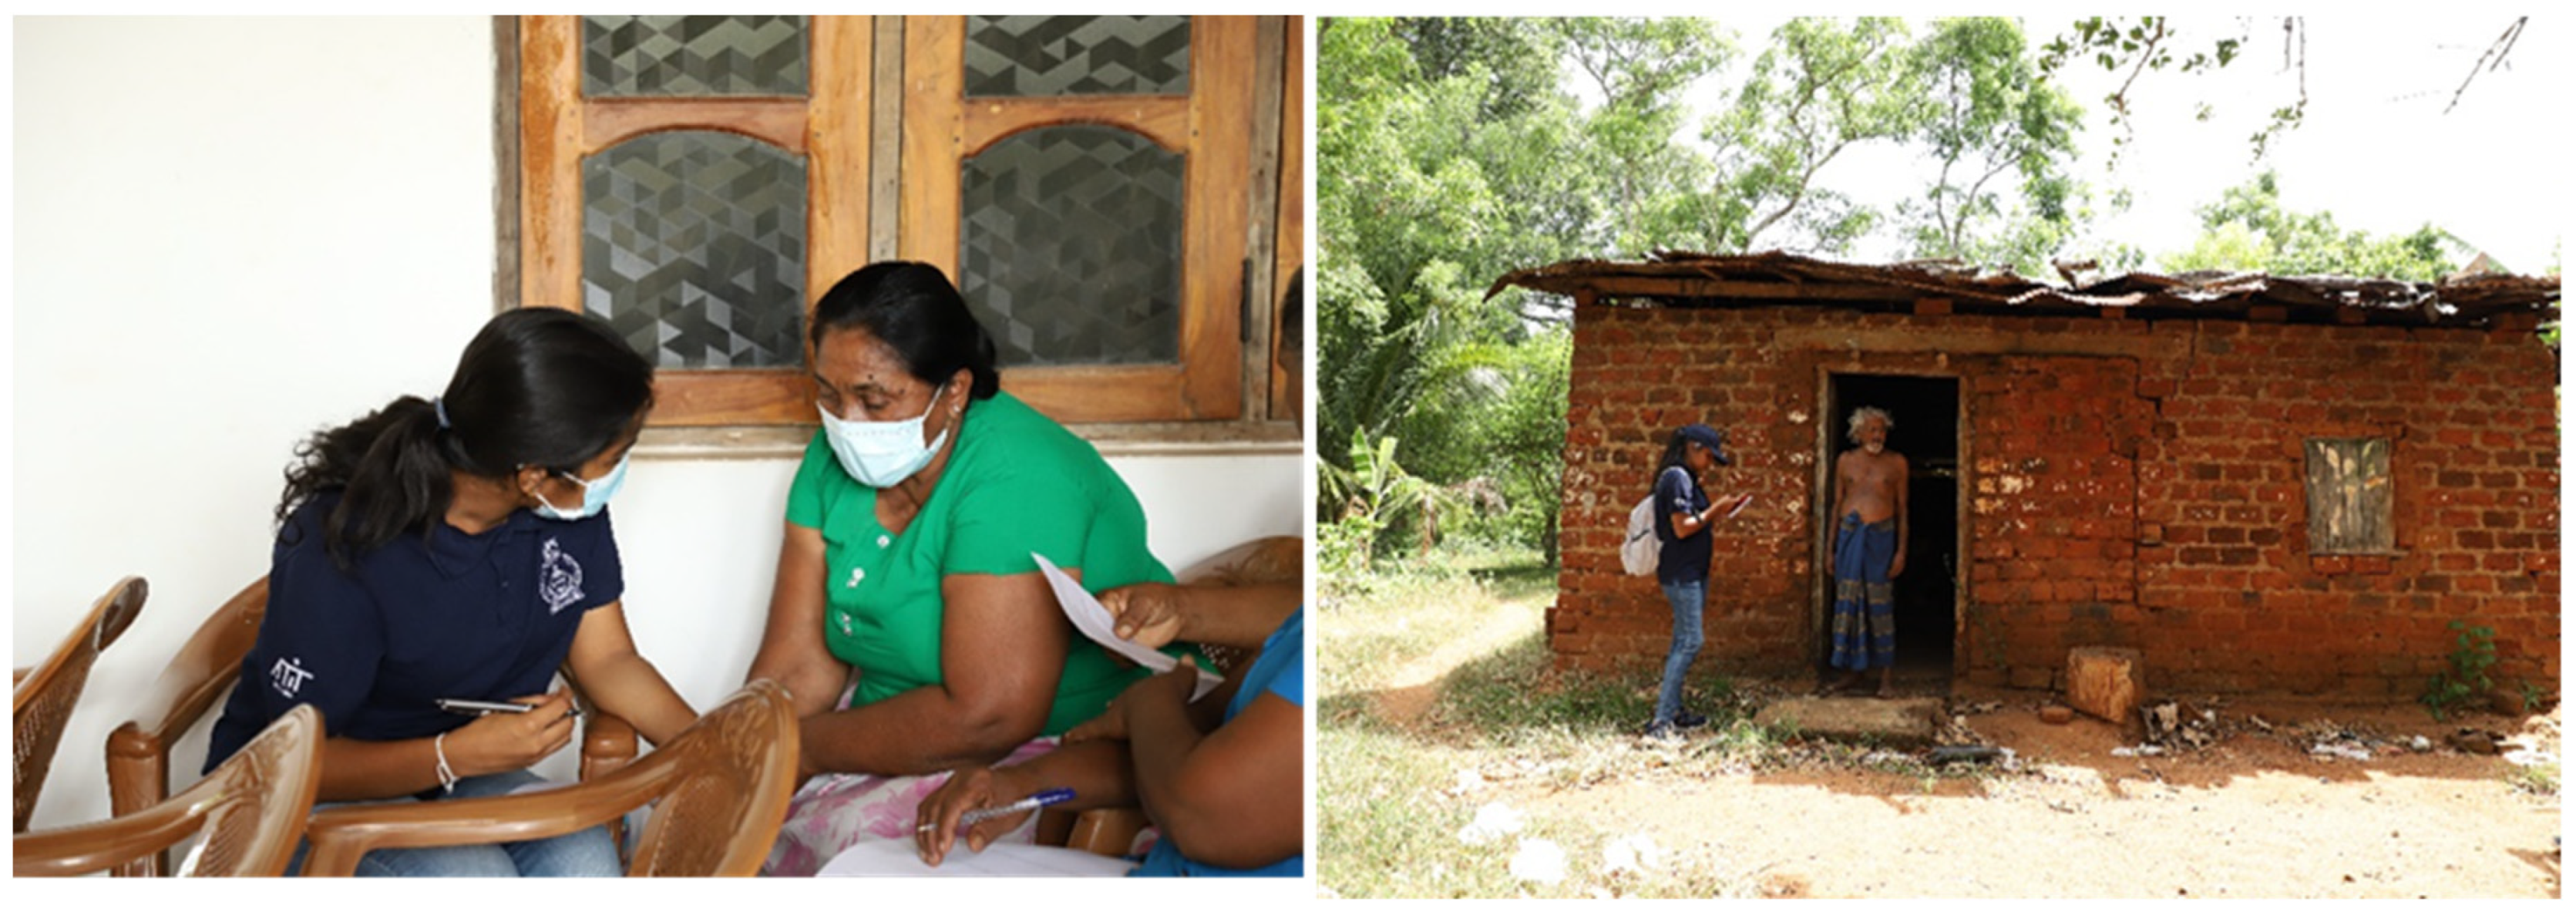
Figure 3.
Knowledge regarding the symptoms.
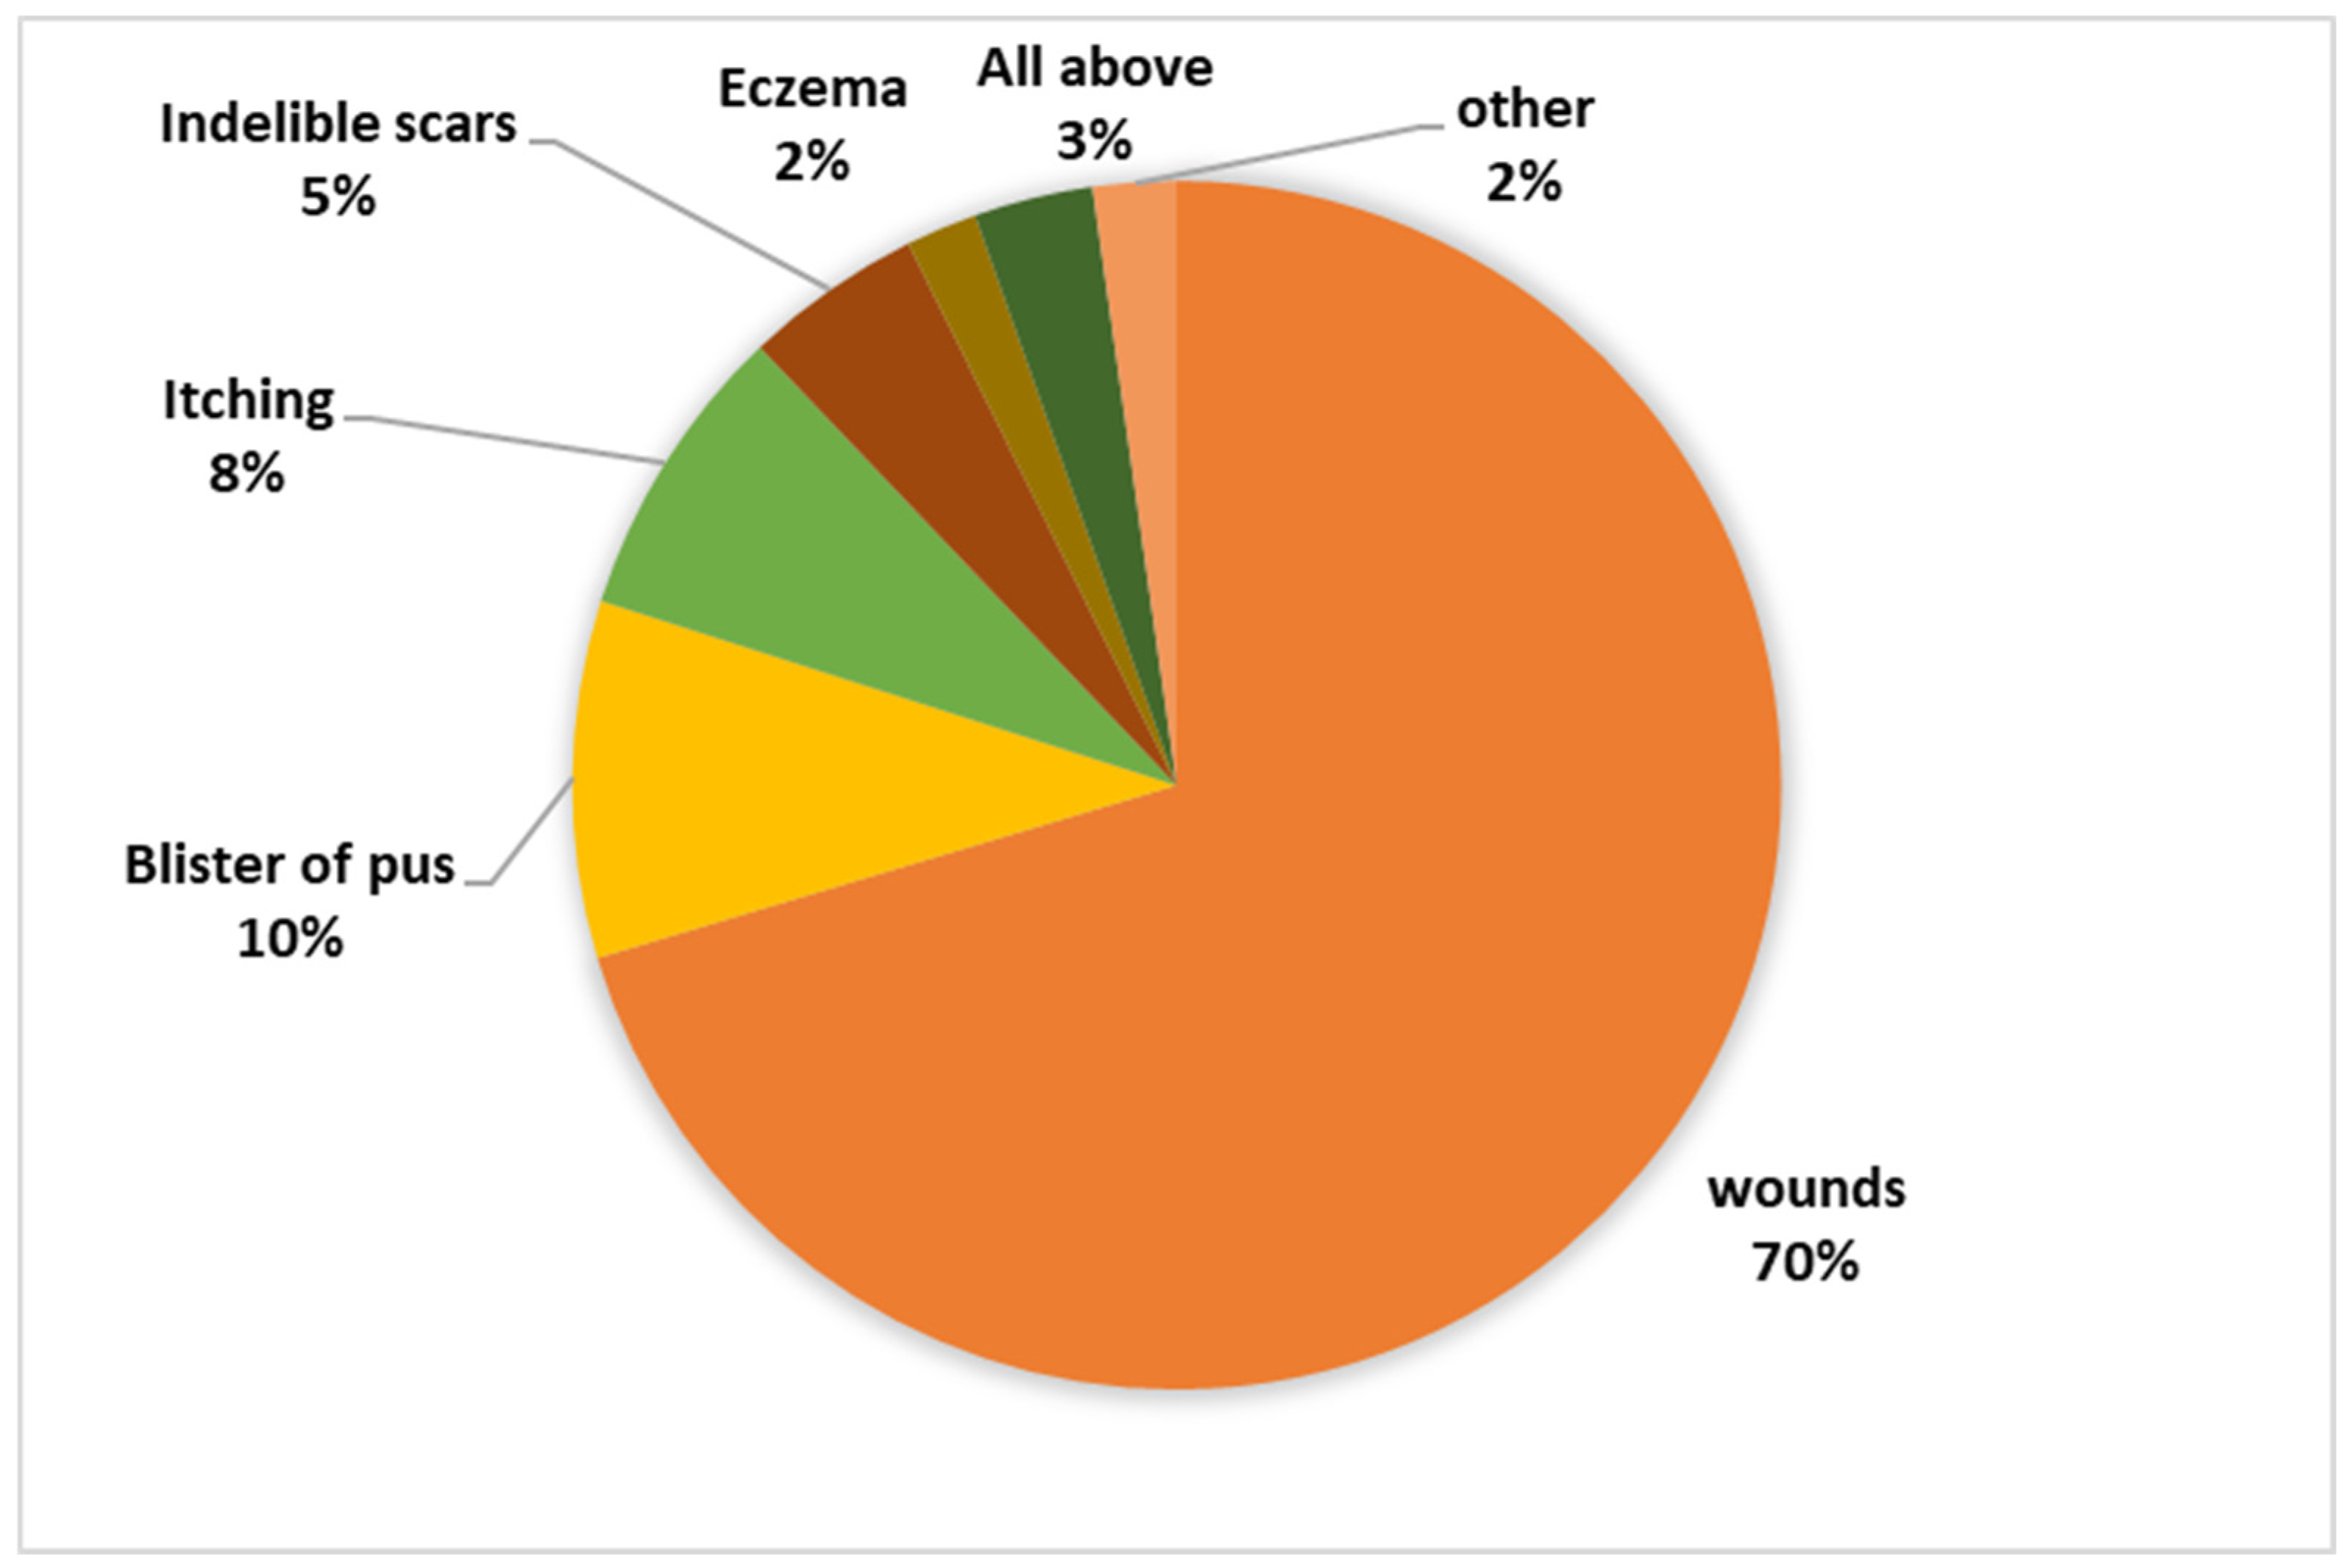
Figure 4.
Knowledge regarding the breeding sites.
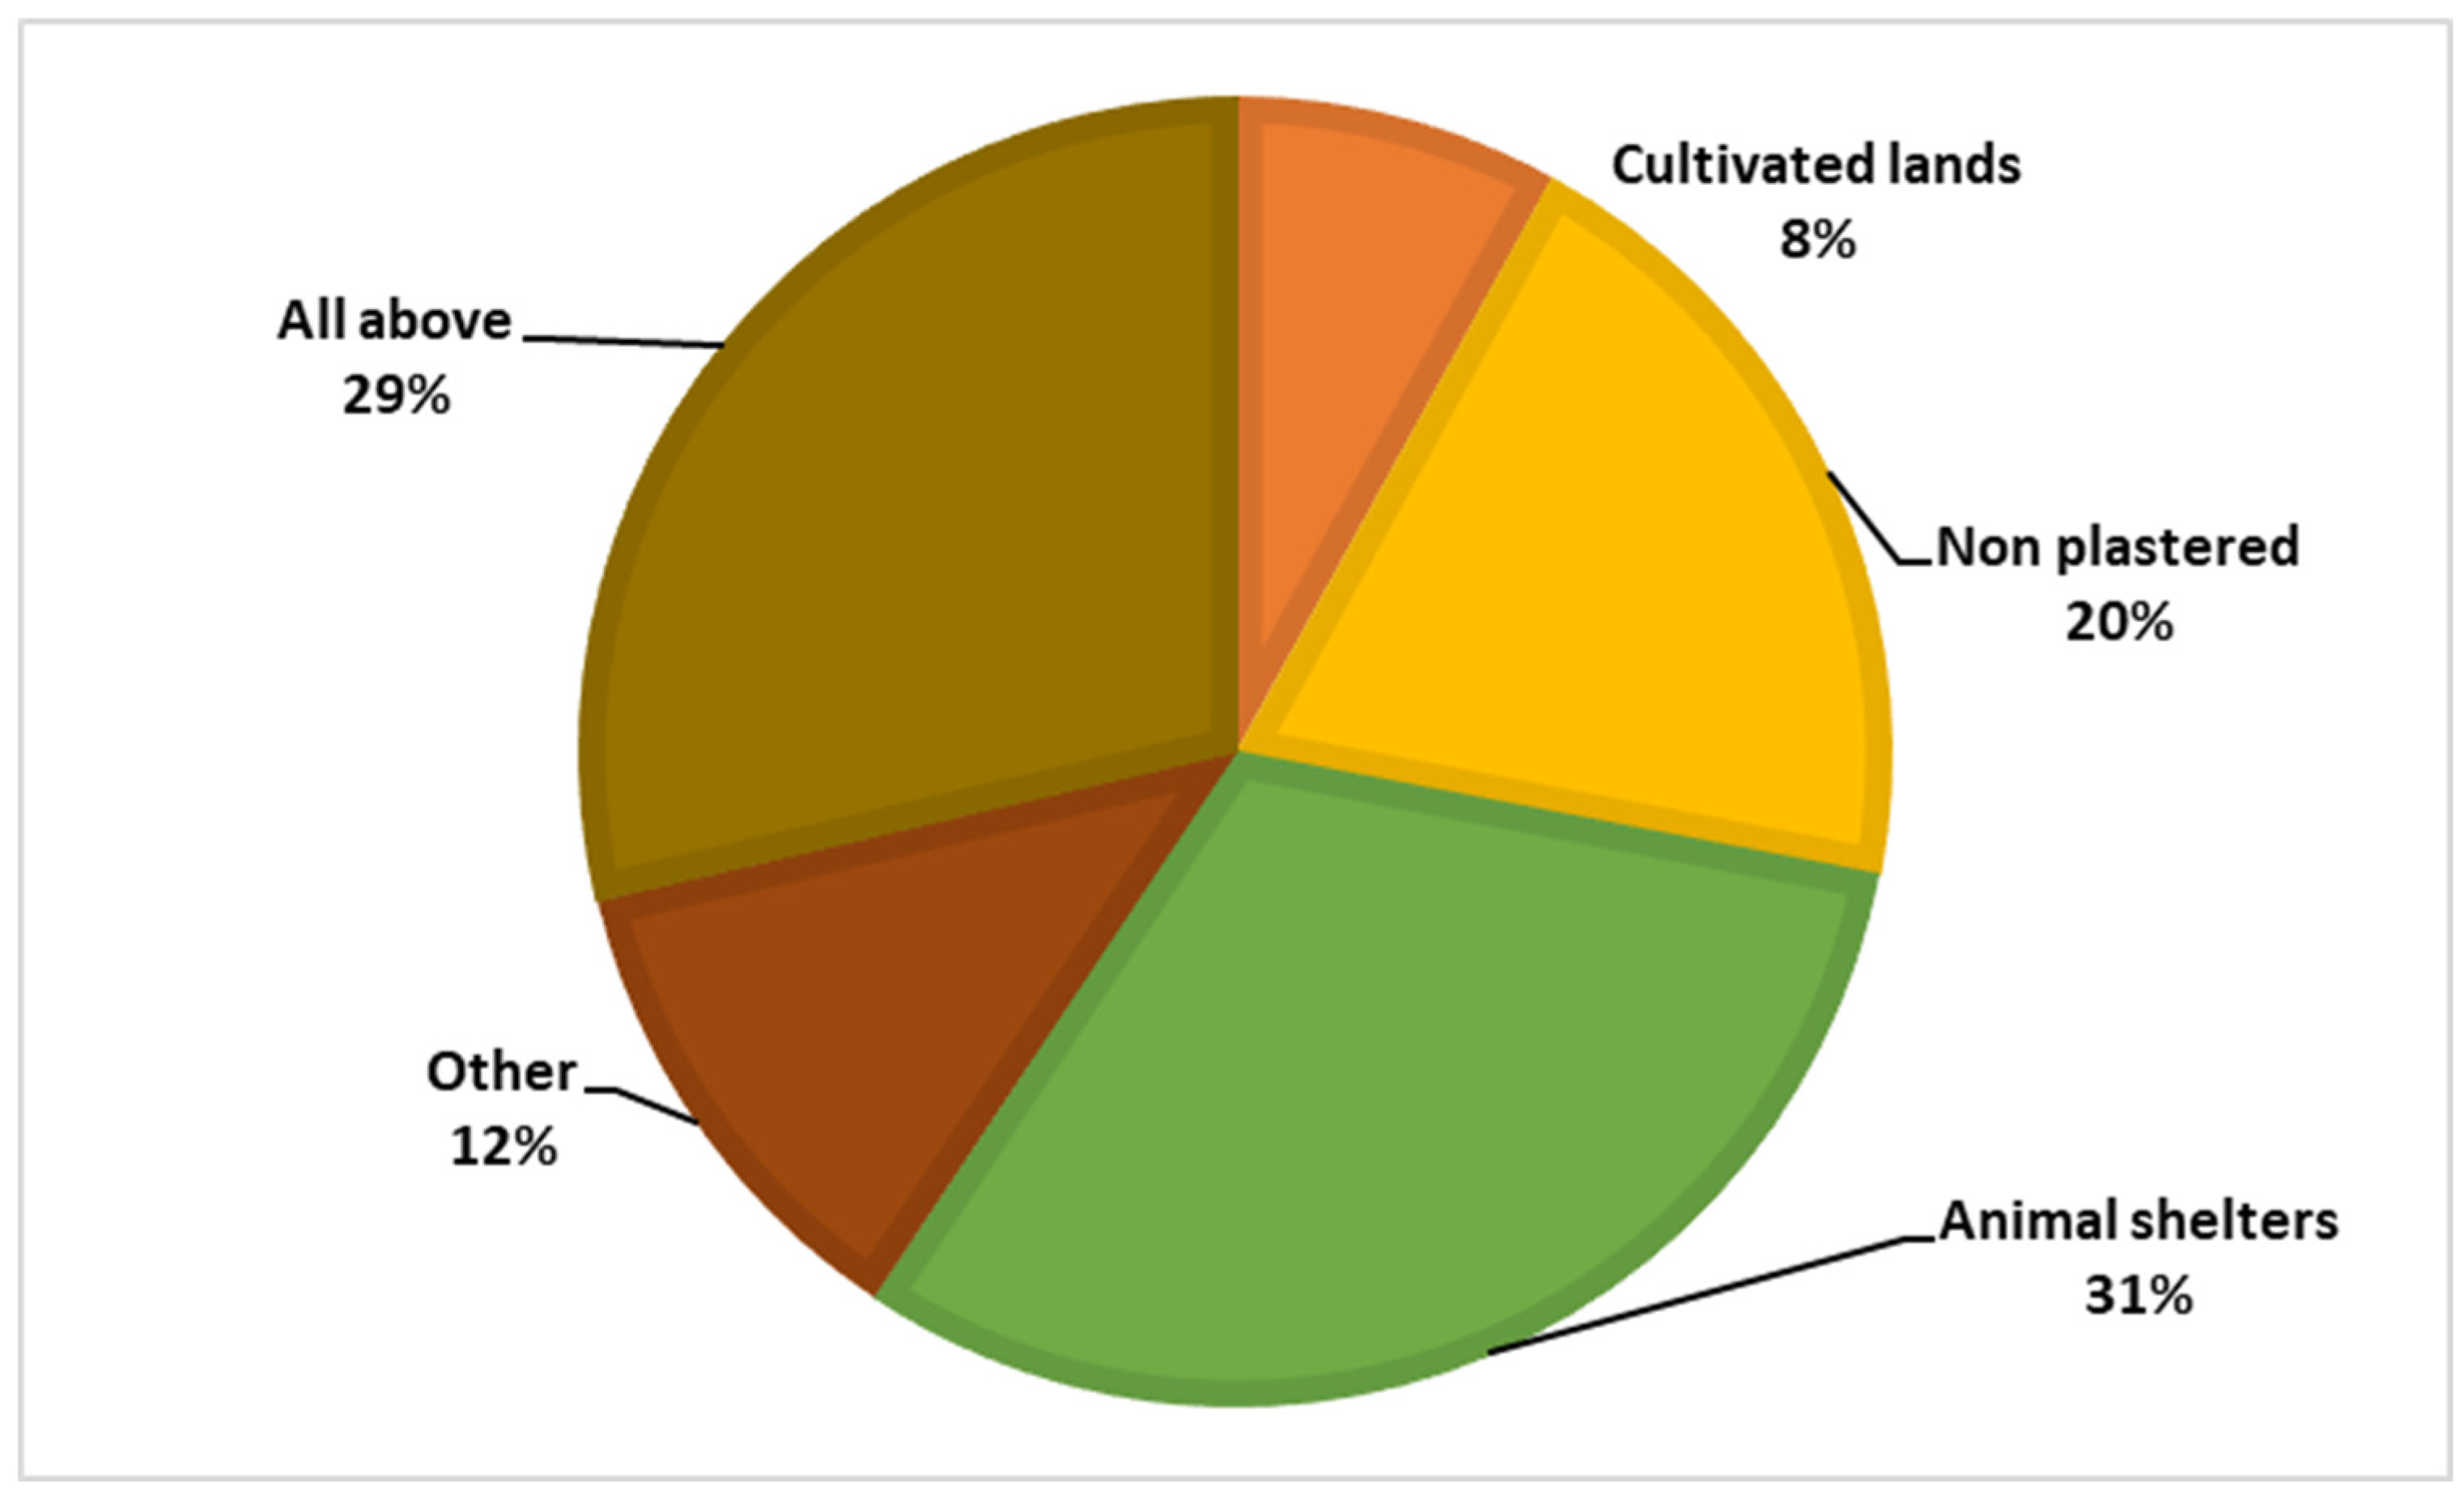
Figure 5.
Knowledge regarding the biting period.
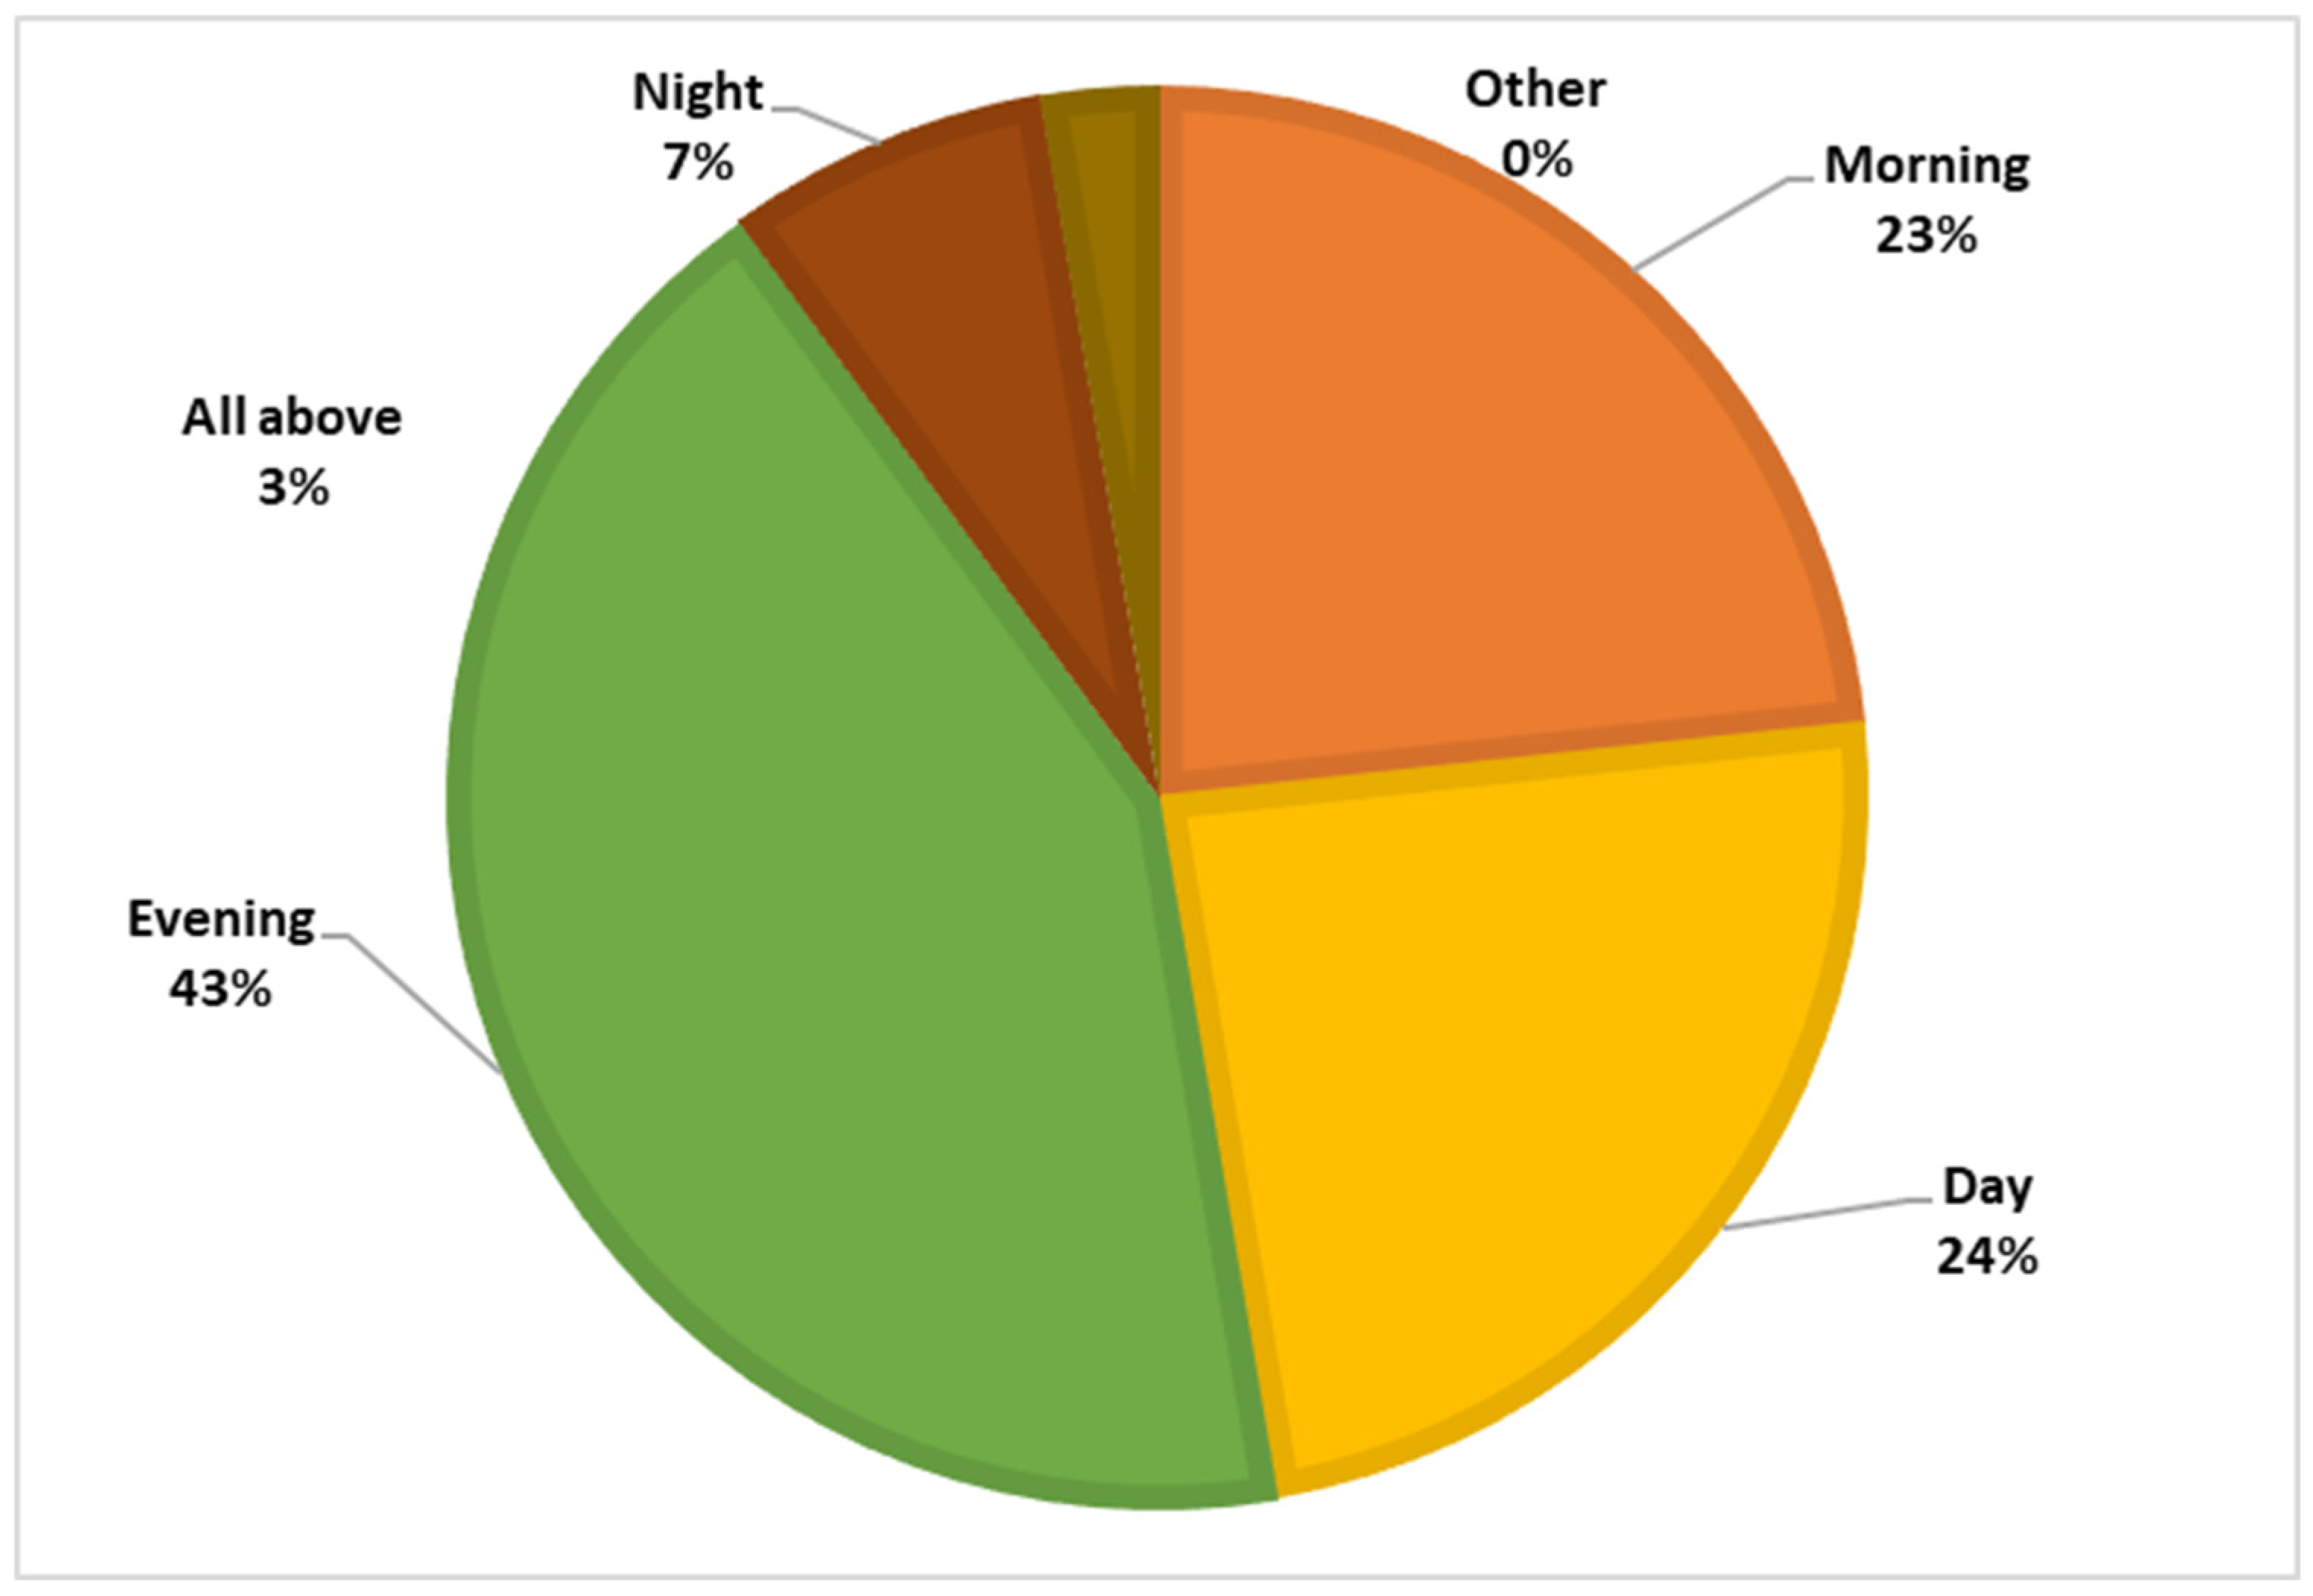

Table 1.
Demographic profile of the study participants.
| Variable | N (%) | Variable | N (%) | ||
| Age (mean±SD) | 45.64± 13.81 | Education | |||
| <18 yrs. | 2 (0.7%) | No schooling | 174 (62.8%) | ||
| 18 – 33 yrs. | 48 (17.3%) | Up to Grade 5 | 84 (30.3%) | ||
| 34 – 49 yrs. | 126 (45.5%) | Up to Grade 9 | 19 (6.9%) | ||
| 50 – 65 yrs. | 73 (26.4%) | ||||
| >65 yrs. | 28 (10.1%) | Monthly income | |||
| Gender | <Rs. 20,000 | 61 (22%) | |||
| Male | 134 (48.4%) | Rs. 20,0000-40,000 | 118 (42.6%) | ||
| Female | 143 (51.6%) | >Rs. 40,000 | 98 (35.4%) | ||
| Marital status | |||||
| Single | 25 (9%) | Monthly expenses | |||
| Married | 252 (91%) | <Rs. 20,000 | 36 (13%) | ||
| Occupation status | Rs. 20,0000-40,000 | 84 (30.3%) | |||
| Unemployed | 105 (37.9%) | >Rs. 40,000 | 157 (56.7%) | ||
| Self employed | 77 (27.8%) | Number of family members | |||
| Employed | 95 (34.3%) | <2 | 25.0 (9%) | ||
| Government sector | 70 (25.3%) | 2-4 | 183 (66.1%) | ||
| Private sector | 25 (9.0%) | >5 | 69 (24.9%) | ||
Table 2.
Frequency of various responses to questions.
| Domain | Item no. | Yes | No | Don’t know |
| Knowledge | ||||
| Disease Symptoms/Complications | 1 | 68 (75.1%) | 208 (24.5%) | 1 (0.4%) |
| 2 | 221 (79.8%) | 56 (20.2%) | - | |
| 2a | 30 (10.8%) | 247 (89.2%) | - | |
| 2b | 25 (9.0%) | 252 (91.0%) | - | |
| 2c | 15 (5.4%) | 262 (94.6%) | - | |
| 2d | 6 (2.2%) | 271 (97.8%) | - | |
| 2e | 10 (3.6%) | 267 (96.4%) | - | |
| 2f | 7 (2.5%) | 270 (97.5%) | - | |
| 2g | 3 (1.1%) | 274 (98.9%) | - | |
| 3 | 50 (18.1%) | 8 (2.9%) | 219 (79.1%) | |
| Vector | 4 | 16 (5.8%) | 235 (84.8%) | 26 (9.4%) |
| 5 | 243 (87.7%) | 12 (4.3%) | 22 (7.9%) | |
| Risk factors | 6 | 77 (27.8%) | 108 (39.0%) | 91 (32.9%) |
| 7 | 151 (54.5%) | 126 (45.5%) | - | |
| 7a | 90 (32.5%) | 187 (67.5%) | - | |
| 7b | 44 (15.9%) | 233 (84.1%) | - | |
| 7c | 10 (3.6%) | 267 (96.4%) | - | |
| 7d | 1 (0.4%) | 276 (99.6%) | - | |
| 7e | 1 (0.4%) | 276 (99.6%) | - | |
| 8 | 112 (40.4%) | 165 (59.6%) | - | |
| 8a | 12 (4.3%) | 265 (95.7%) | - | |
| 8b | 30 (10.8%) | 247 (89.2%) | - | |
| 8c | 47 (17.0%) | 230 (83.0%) | - | |
| 8d | 18 (6.5%) | 259 (93.5%) | - | |
| 8e | 43 (15.5%) | 230 (83.0%) | 4 (1.4%) | |
| 10 | 132 (47.7%) | 145 (52.3%) | - | |
| 10a | 35 (12.6%) | 241 (87.0%) | 1 (0.4%) | |
| 10b | 36 (13.0%) | 241 (87.0%) | - | |
| 10c | 64 (23.1%) | 213 (76.9%) | - | |
| 10d | 11 (4.0%) | 266 (96.0%) | - | |
| 10e | 4 (1.4%) | 273 (98.6%) | - | |
| 10f | - | 277 (100%) | - | |
| Control measures | 11 | 80 (28.9%) | 197 (71.1%) | - |
| 11a | 88 (31.8%) | 189 (68.2%) | - | |
| 11b | 85 (30.7%) | 192 (69.3%) | - | |
| 11c | 30 (10.8%) | 247 (89.2%) | - | |
| 11d | 10 (3.6%) | 267 (96.4%) | - | |
| 11e | 4 (1.4%) | 273 (98.6%) | - | |
| 11f | 38 (13.7%) | 239 (86.3%) | - | |
| Attitude | 12 | 75 (27.1%) | 53 (19.1%) | 149 (53.8%) |
| 13 | 50 (18.1%) | 50 (18.1%) | 180 (65.0%) | |
| 14 | 46 (16.6%) | 213 (76.9%) | 18 (6.5%) | |
| 15 | 46 (16.6%) | 210(76.5%) | 18 (6.5%) | |
| 16 | 45 (16.2%) | 209 (75.8%) | 22 (7.9%) | |
| 17 | 3 (1.1%) | 253 (91.3%) | 21 (7.6%) | |
| 18 | 7 (2.5%) | 244 (88.1%) | 26 (9.4%) | |
| 19 | 1 (0.4%) | 238 (85.9%) | 38 (13.7%) | |
| 20 | 118 (42.6%) | 133 (48.0%) | 23 (8.3%) | |
| 21 | - | 259 (93.5%) | 18 (6.5%) | |
| Practice | 22 | 189 (68.2%) | 88 (31.8%) | - |
| 23 | 173 (62.5%) | 104 (37.5%) | - | |
| 24 | 20 (7.2%) | 257 (92.8%) | - | |
| 25 | 14 (5.1%) | 263 (94.9%) | - | |
| 26 | 52 (18.8%) | 225 (81.2%) | - | |
| 27 | 13 (4.7%) | 264 (95.3%) | - | |
| 28 | 143 (51.6%) | 134 (48.4%) | - | |
| 29 | 5 (1.8%) | 272 (98.2%) | - | |
| 30 | 11 (4.0%) | 266 (96.0%) | - |
Table 3.
Mean score with respect to demographics variables.
| Variable | Knowledge score 1.82+0.197 Mean rank |
P-value | Attitude score 1.63+0.341 Mean rank |
P-value | Practices score 1.48+.0341 Mean rank |
P-value | |
|---|---|---|---|---|---|---|---|
| Gender | Male | 140.51 | 0.756 | 140.60 | 0.725 | 140.89 | 0.675 |
| Female | 137.58 | 137.29 | 136.98 | ||||
| Age | <18 yrs. | 199.00 | 0.037 | 157.75 | 0.044 | 157.75 | 0.041 |
| 18-33 yrs. | 131.67 | 131.75 | 134.45 | ||||
| 34-49 yrs. | 140.32 | 128.79 | 127.71 | ||||
| 50-65 yrs. | 153.83 | 163.17 | 163.17 | ||||
| >65 yrs. | 102.70 | 133.00 | 133.00 | ||||
| Marital status | Single | 136.48 | 0.866 | 123.60 | 0.303 | 149.80 | 0.466 |
| Married | 139.25 | 140.53 | 137.93 | ||||
| Occupation status | Unemployed | 134.48 | 0.400 | 139.83 | 0.127 | 139.83 | 0.127 |
| Self employed | 131.30 | 121.91 | 121.91 | ||||
| Employed | |||||||
| Government sector | 154.66 | 153.89 | 153.89 | ||||
| Private sector | 139.78 | 149.42 | 149.42 | ||||
| Other | 125.31 | 112.63 | 112.63 | ||||
| Education | No schooling | 129.29 | 0.021 | 132.07 | 0.149 | 132.07 | 0.149 |
| Up to Grade 5 | 152.72 | 152.08 | 152.08 | ||||
| Up to Grade 9 | 167.26 | 144.66 | 144.66 | ||||
| Monthly income | <10,000 | 140.07 | 0.354 | 122.55 | 0.179 | 122.55 | 0.179 |
| 10,000-20,000 | 122.42 | 128.98 | 128.98 | ||||
| 20,000-30,000 | 133.45 | 137.72 | 137.72 | ||||
| 30,000-40,000 | 129.90 | 135.91 | 135.91 | ||||
| 40,000-50,000 | 151.94 | 170.14 | 170.14 | ||||
| >50,000 | 153.31 | 137.85 | 137.85 | ||||
| Monthly expenses | <10,000 | 79.00 | 0.058 | 86.50 | 0.306 | 86.50 | 0.306 |
| 10,000-20,000 | 121.30 | 120.40 | 120.40 | ||||
| 20,000-30,000 | 125.57 | 141.26 | 141.26 | ||||
| 30,000-40,000 | 130.62 | 150.61 | 150.61 | ||||
| 40,000-50,000 | 158.50 | 133.71 | 133.71 | ||||
| >50,000 | 147.02 | 143.47 | 143.47 | ||||
| Number of family members | <2 | 125.66 | 0.690 | 82.36 | 0.000 | 82.36 | 0.000 |
| 2-4 | 139.81 | 138.46 | 138.46 | ||||
| >5 | 139.71 | 159.24 | 159.24 |
P-value < 0.05 is statistically significant; “Kruskal Wallis H test. Note: K-score = average knowledge score; A-score = average attitude score; P-score = average practice score.
Table 4.
Co-relation between KAP.
| Variables | rho | p-value |
|---|---|---|
| Knowledge, attitude | 0.099* | 0.049 |
| Knowledge, practice | 0.060 | 0.159 |
| Practice, attitude | 0.358* | 0.000 |
* Correlation is significant at the 0.05 level (1-tailed). **Correlation is significant at the 0.05 level (1-tailed).
Table 05.
Categorization of study participants score on KAP domains
| Variable | Knowledge | p-value | Attitude | p-value | Practice | p-value | |||||||
| Good | Fair | Poor | Good | Fair | Poor | Good | Fair | Poor | |||||
| Gender | Male | 130 | 4 | 0 | .810 | 96 | 38 | 0 | .622 | 32 | 98 | 4 | .803 |
| Female | 138 | 5 | 0 | 101 | 41 | 1 | 31 | 106 | 6 | ||||
| Age | <18 yrs. | 2 | 0 | 0 | .993 | 2 | 0 | 0 | .399 | 0 | 2 | 0 | .614 |
| 18-33 yrs. | 47 | 2 | 0 | 37 | 12 | 0 | 16 | 32 | 1 | ||||
| 34-49 yrs. | 121 | 4 | 0 | 82 | 43 | 0 | 27 | 92 | 6 | ||||
| 50-65 yrs. | 71 | 2 | 0 | 57 | 15 | 1 | 13 | 57 | 3 | ||||
| >65 yrs. | 27 | 1 | 0 | 19 | 9 | 0 | 7 | 21 | 0 | ||||
| Marital status | Single | 25 | 0 | 0 | .337 | 14 | 11 | 0 | .193 | 9 | 15 | 1 | .243 |
| Married | 243 | 9 | 0 | 183 | 68 | 1 | 54 | 189 | 9 | ||||
| Occupation status | Unemployed | 102 | 3 | 0 | .703 | 72 | 32 | 1 | .156 | 31 | 71 | 3 | .069 |
| Self employed | 67 | 2 | 0 | 43 | 26 | 0 | 6 | 68 | 3 | ||||
| Employed | |||||||||||||
| Government sector | 68 | 2 | 0 | 58 | 12 | 0 | 16 | 51 | 3 | ||||
| Private sector | 23 | 2 | 0 | 20 | 5 | 0 | 8 | 17 | 0 | ||||
| Other | 8 | 0 | 0 | 4 | 4 | 0 | 2 | 5 | 1 | ||||
| Education | No schooling | 168 | 6 | 0 | .791 | 116 | 57 | 1 | .304 | 36 | 131 | 7 | .802 |
| Up to Grade 5 | 82 | 2 | 0 | 66 | 18 | 0 | 22 | 600 | 2 | ||||
| Up to Grade 9 | 18 | 1 | 0 | 15 | 4 | 0 | 5 | 13 | 1 | ||||
| Monthly income | <10,000 | 28 | 1 | 0 | .956 | 13 | 16 | 0 | .031* | 7 | 19 | 3 | .311 |
| 10,000-20,000 | 31 | 1 | 0 | 24 | 8 | 0 | 6 | 25 | 1 | ||||
| 20,000-30,000 | 59 | 3 | 0 | 46 | 15 | 1 | 9 | 51 | 2 | ||||
| 30,000-40,000 | 54 | 2 | 0 | 39 | 17 | 0 | 11 | 43 | 2 | ||||
| 40,000-50,000 | 35 | 1 | 0 | 32 | 4 | 0 | 11 | 25 | 0 | ||||
| >50,000 | 61 | 1 | 0 | 43 | 19 | 0 | 19 | 41 | 2 | ||||
| Monthly expenses | <10,000 | 6 | 0 | 0 | .641 | 1 | 5 | 0 | .073 | 2 | 3 | 1 | .150 |
| 10,000-20,000 | 28 | 2 | 0 | 20 | 10 | 0 | 8 | 20 | 2 | ||||
| 20,000-30,000 | 36 | 2 | 0 | 26 | 11 | 1 | 8 | 29 | 1 | ||||
| 30,000-40,000 | 46 | 0 | 0 | 36 | 10 | 0 | 9 | 33 | 4 | ||||
| 40,000-50,000 | 45 | 1 | 0 | 35 | 11 | 0 | 15 | 31 | 0 | ||||
| >50,000 | 107 | 4 | 0 | 79 | 32 | 0 | 21 | 88 | 2 | ||||
| Number of family members | <2 | 25 | 0 | 0 | .780 | 9 | 16 | 0 | .000* | 10 | 13 | 2 | .244 |
| 2-4 | 176 | 7 | 0 | 131 | 52 | 0 | 36 | 141 | 6 | ||||
| >5 | 67 | 0 | 0 | 57 | 11 | 1 | 17 | 50 | 2 | ||||
Disclaimer/Publisher’s Note: The statements, opinions and data contained in all publications are solely those of the individual author(s) and contributor(s) and not of MDPI and/or the editor(s). MDPI and/or the editor(s) disclaim responsibility for any injury to people or property resulting from any ideas, methods, instructions or products referred to in the content. |
© 2023 by the authors. Licensee MDPI, Basel, Switzerland. This article is an open access article distributed under the terms and conditions of the Creative Commons Attribution (CC BY) license (http://creativecommons.org/licenses/by/4.0/).
Copyright: This open access article is published under a Creative Commons CC BY 4.0 license, which permit the free download, distribution, and reuse, provided that the author and preprint are cited in any reuse.


