Submitted:
08 October 2023
Posted:
08 October 2023
You are already at the latest version
Abstract
Acceleration parameters in sit-to-stand (STS) movements are useful for measuring lower-limb function in older adults. The purpose of this study was to examine the relationship between acceleration in STS movements and physical function and the test-retest reliability of acceleration parameters in older adults. We performed cross-sectional analyses on 244 older adults including 107 men (mean age:77.4±4.7) and 137 women (mean age: 75.6±5.3). Four acceleration parameters were measured in STS movements: maximum acceleration (MA), maximum velocity (MV), maximum power (MP), and stand-up time (ST). Good intraclass correlation coefficients (ICC>0.70) were observed for all parameters. For the acceleration parameters, MA, MV, and MP were relatively strongly associated with the 5-time STS test (men: r=-0.36~-0.47; women: r=-0.37~-0.45) and the Timed up and Go test (men: r=-0.39~0.47, women: r=-0.43~-0.51): MP was also strongly associated with grip strength (men: r=0.48, women: r=0.43). All acceleration parameters were poorer in participants reporting mobility limitations than in those reporting no mobility limitations. These findings support the usefulness of sensor-based STS measurement. The system is expected to be useful in various settings where care prevention is addressed.
Keywords:
acceleration parameters
; chair-rise
; performance test
1. Introduction
Decreased lower extremity muscle strength in older adults is known to be an independent factor in the occurrence of serious events in old age, such as falls [1], decreased independence [2], and high mortality rates [3]. As a result, many attempts have been made to evaluate lower limb muscle strength in older adults, and various methods have been adopted [4,5,6].
Recent attempts have evaluated lower limb muscle strength and lower limb muscle power using acceleration in sit-to-stand (STS) movement [7,8,9]. In this method, a participant was asked to stand up while wearing a small sensor such as an accelerometer, and the evaluation was based on the parameters obtained from the sensor. Specifically, acceleration parameters (maximum acceleration and speed) and time parameters (time to complete the action) were used. The advantages of this measurement method include its ability to evaluate the exertion of muscle strength during daily activities [10], and the fact that the sensor itself is small and portable [11].
The relationship between acceleration parameters and a lower limb muscle strength evaluation index (knee extension muscle strength) in STS movement has already been examined [12] and validated and is being studied as a lower limb muscle strength evaluation method. In addition, studies on acceleration parameters and factors that influence the quality of life of older adults, such as physical function [13] and experience of falling [14,15], have also been reported. Regterschot et al [16]. examined the relationship between acceleration parameters and ground reaction force during STS movement and found that acceleration assessment during STS movement could be an alternative method for assessing physical function in clinical settings. However, in various sites and fields working to prevent the need for nursing care, various performance tests are used to assess all types of physical function, in addition to lower limb muscle strength and muscle power assessment.
In addition to performance tests, older adults’ physical function can also be assessed through questionnaires and interviews. It is recommended to consider performance tests and questionnaires as distinct but complementary methods [17]. In addition, they have been reported to correlate with each other [18]. To disseminate the use of acceleration assessment in STS movement in the field, it is necessary to examine the extent to which it relates to existing performance tests and questionnaires and to clarify its relationship with them. Few studies have examined the association between acceleration parameters and physical function, which had been assessed using performance tests and questions in older adults. Regterschot et al. also examined the association between acceleration parameters and physical function (Timed Up and Go, 5 times STS time, and stair climbing test) in 36 older adults and found significant associations. Van Lummel et al. examined the association between subjective physical function and STS movement in older adult participants and reported that sensor-based recorded times were more strongly associated than manually recorded times [19].
The limitations of previous studies to date include the small number of participants and the fact that the study focused on older female residents in hospitals and other institutions. Second, performance test items were limited. Although previous studies have mainly examined the relationship between the muscle function of the lower limbs, the relationship between the muscle function of the upper limbs, balance ability, and other functions that enable the older adults to smoothly perform their daily lives has not been sufficiently examined.
Although test-retest reliability in acceleration parameters in STS movements has been examined in the past, the subjects were limited to males [20]. In addition, compared to previous studies [8] that reported good reliability, the reliability of the acceleration parameter used in this study needs to be confirmed once again, since this study uses a measurement device with a high sampling period.
This study aimed to clarify the relationship between acceleration parameters and physical function based on performance tests (objective assessment) and questionnaires (subjective assessment) in STS movements in older adults. In addition, the test-retest reliability was examined. This study hypothesized that each of the acceleration parameters in STS movement would show good test-retest reliability, and that better values for each parameter would be associated with better physical function. It has also been reported that kinematic (acceleration, velocity) and kinetic (power) parameters are more strongly associated with lower limb muscle strength, lower limb muscle power and falls than time parameters (rise time) in acceleration parameters in STS movement [15,21]. We hypothesized that kinematic and kinetic parameters would be more strongly associated with physical function than temporal parameters in this study.
2. Materials and Methods
2.1. Participants
This study included community-dwelling older individuals who participated in the 2020 Kasama Longevity Health Examination. This open cohort study was initiated in Kasama City in 2009 [22]. Participants were randomly selected from the Basic Resident Registration Network System according to the following criteria: (i) age 65 years or older, (ii) living in Kasama City, and (iii) not receiving long-term care insurance. In 2020, 840 people were informed by mail and 252 (30.0%) participated in the survey. Of the 252 individuals, 3 with missing questions and 5 who required assistance in getting up from a chair were excluded, leaving 244 for the final analysis. Acceleration measurements were conducted again on 12 participants and the results were analyzed to examine reliability. This study was approved by the Ethics Committee of the University of Tsukuba (ref. no. Tai 30-5). All participants provided written informed consent to participate in the study, which was conducted in accordance with the Declaration of Helsinki.
3. Measurement Items
3.1. Acceleration Parameters in STS
3.1.1. Procedures
We measured acceleration in STS movement exercises with reference to previous studies [21] [23,24]. After explaining the sitting posture and movement pattern of the STS movements, participants sat on a chair at a standard height (40 cm) and were placed in a sitting posture using a triaxial accelerometer (TANITA Co., Ltd. Tokyo, Japan) attached to their waist. In the sitting posture, the participants sat with their legs hip- width apart, arms crossed in front of their chest, back straightened perpendicular to the floor, and the ankle joints held at 90°. In the sitting posture, the participant stood up quickly with maximum effort after receiving a signal from the test person, held the upright posture for approximately 2 s, sat down at normal speed, and held the sitting posture for approximately 2 s. The sampling period of the triaxial accelerometer (±8G) was 128 Hz.
3.1.2. Data Acquisition
The data obtained from the sensors were transferred to a laptop and filtered by applying a low-pass Butterworth filter (cutoff frequency = 6 Hz) in MATLAB (The Mathworks, Inc.; version 9.22).
3.1.3. Acceleration Parameters
The acceleration parameter was converted to composite acceleration based on previous studies 23)24)25) and corrected as follows: four parameters were calculated (Figure 1).
- Maximal Acceleration (MA): maximum acceleration in STS movement.
- Maximal Velocity (MV): The maximum velocity in STS movement operation was calculated by integrating the acceleration, assuming that the velocity at the start of STS was 0 m/s.
- Maximal Power (MP): Maximum power during rising motion. First, muscle power (F) was calculated by fitting it to the formula on the right: , where m indicates the body weight. Next, muscle power (P) was calculated by multiplying the muscle force (F) by velocity (v): , which corresponds to the maximum value obtained by multiplying the solid and dotted lines in Figure 1 (bottom) by body weight.
- Stand -up time (ST): Based on previous studies, the start of the stand-up motion was calculated using the differential acceleration value (Figure 1). The end of the standing motion was defined as the first sample in which acceleration reached the reference value after the minimum value was recorded.
3.2. Performance Test
Muscle strength, lower limb function, and balance ability, which are widely used physical function tests in older adults, were evaluated. Muscle strength was measured twice for each hand using a grip strength meter (Takei Kiki Kogyo) and the average of the maximum values for each type was used. Lower limb function was measured using the five-chair standing time, 5 m normal walking time, and timed up-and-go (TUG) test. Balance ability was measured using the one-leg standing balance test with eyes open. The performance test employed in this study was like previous studies [26].
3.3. Mobility Limitation
Mobility limitation was investigated according to Visser et al. [27] and Tsuji et al. [28]. Three activities were investigated: ascending and descending stairs, rising from a chair, and walking for 15 minutes. The survey consisted of three questions: "Do you climb stairs without holding onto a handrail or wall?", "Do you stand up from a chair without holding onto anything?", and "Do you walk continuously for about 15 minutes? Both required a "yes" or "no" response, and those who answered "yes" were categorized as "good" and those who answered "no" as "poor," respectively. Those who were " poor" in even one of the three movements were categorized as "mobility limitation".
4. Statistical Analyses
The intraclass correlation coefficient (ICC) was calculated to examine test-retest reliability. As the sample was measured twice by a single person, the ICC (two-way mixed model, type consistency) was calculated for the one-way randomization model. Based on the test between trials by analysis of variance, if no significant trial differences were found, the obtained ICC was considered significant; an ICC of 0.70 or higher was considered good [29].
Pearson’s correlation analysis was performed separately for men and women to ex amine the relationship between the acceleration parameters and performance tests. An analysis of covariance was used to compare the presence or absence of limitations in the ability to move from place to place. Adjustments were made for sex, age, BMI, presence or absence of low back pain, and presence or absence of knee pain. For each comparison, Cohen's d [30] was calculated as the effect size, which indicates the magnitude of the difference. In this study, 0.2 was considered small, 0.5 was considered moderate, and 0.8 as large and these values were used based on previous studies 30). SPSS (version 26.0; IBM Corp., Armonk, NY, USA) was used for statistical analyses. The statistical significance level was set at p < 5% for all cases.
5. Results
5.1. Descriptive Data of Participants
Table 1 presents the basic demographics, acceleration parameters, performance tests, and mobility limitations of the 244 participants. The mean age was significantly higher in men than in women. For the acceleration parameters, significant sex differences were found for MV and MP, with men having greater values (shorter ST) than women for all four parameters. In performance tests, significant differences were found only in grip strength. A higher percentage of women (43.8%) than men (30.8%) had mobility limitations, although no sex differences were observed.
5.2. Test-Retest Reliability of Acceleration Parameters
Table 2 lists the physical characteristics of the 12 participants in the reliability study and the values measured during the first acceleration measurement trial. No significant differences were found between the 244 and 232 participants who were not included in the reliability study.
Table 3 shows the measured values of each parameter in the two trials of acceleration measurement and the ICC based on them as well as the results of the comparison of the differences between the two trials. ICCs of 0.70 or higher were obtained, which is considered good for all parameters, confirming excellent repeatability.
5.3. Relationships among Acceleration Parameters and Performance Tests
Table 4 lists the Pearson's reserve correlation coefficients between each acceleration parameter and the performance test. Significant associations were found between many items in both men and women. The ST showed a relatively weak association with a small correlation coefficient compared to the other acceleration parameters.
5.4. Relationships among Acceleration Parameters and Mobility Limitations
Table 5 presents the results for each acceleration parameter, based on the presence or absence of orthostatic mobility limitations. Comparisons based on the presence or absence of mobility limitations confirmed significant associations for all the parameters in the unadjusted model. After adjustment, all parameters showed significance, except for ST. Regarding effect sizes, which indicate the magnitude of differences, small effect sizes (d=0.30–0.48) were identified for all parameters, with a relatively low value (d=0.30) for ST compared to the other parameter.
6. Discussion
This study was conducted with a more representative and larger sample size of community-dwelling older individuals than previous studies to examine the reliability of acceleration in STS movement and its relationship with physical function. The results showed that many of the items were consistent with the hypotheses. Previous studies examining the relationship between acceleration in STS movement and physical function have methodological limitations such as a small number of participants and limited performance test items. However, in this study, random sampling from the basic resident registry was used to increase the representativeness of participants, reduce the influence of sampling bias, and increase the number of performance test items; thus, the results may have higher internal validity. We believe that the results obtained in this study will be a valuable resource for the development of field tests for acceleration in STS movement.
The acceleration parameters used in this study showed excellent reliability, with ICCs of 0.70 or higher, which were judged to be good 29) for all the parameters (Table 3). The reliability of acceleration parameters in STS movements in older participants has been examined in previous studies 20)31) and excellent reliability has been confirmed. The reliability of acceleration parameters in STS movements in older participants has been examined in previous studies 20)31) and excellent reliability has been confirmed. Although all the reports reviewed in previous studies differ from the present study in the measurement equipment and calculation method of acceleration parameters, good ICCs were confirmed, and this is considered to confirm the reliability of the evaluation of acceleration in STS movements.
Low to moderately significant correlation coefficients were found between accelera tion in STS movement (MA, MV, and MP) and several field tests for both men and women. Relatively strong negative associations were found between Timed Up and Go and five STS movement times, which were measured using STS movements and acceleration measurements. A relatively strong positive correlation (men: r=0.48; women: r=0.43) was observed between MP and grip strength (Table 4). The relationship between acceleration parameters and the TUG test has been examined in previous studies13) and was found to be significantly related to the maximum acceleration, maximum velocity, and maximum power. The present study also confirmed a moderate association between MA, MV, and MP, supporting the findings of a previous study.
In the present study, the TUG test was moderately related to MP, which estimates lower -limb muscle power; MV, which reflects speed while standing up; and MA, which evaluates the rate of increase in speed. In the MP group, both men and women showed moderate correlation with grip strength. Despite differences in the methods and equipment used to calculate muscle power, previous studies33)34) have reported a significant association between power and grip strength in STS movements, and the results of the present study support these findings. Since lower limb muscle power in older adults has been associated with changes in grip strength35) and the STS movement test has been considered a performance test to assess overall physical function in older adults, along with grip strength and gait tests36), we believe that a relatively strong association between MP and grip strength was confirmed in this study. In addition, MP showed significant associations with many items in this study, including 5 times chair standing times (lower limb muscle strength), TUG (dynamic balance), and 5 m walking time (mobility), which may reflect the overall physical function of older adults.
In addition, more items were significantly associated with acceleration parameters and field tests in women than in men, and more items tended to show relatively strong associations (Table 4). This trend supports the report that the associations between lower limb muscle strength, lower limb muscle power, and physical function tests, such as gait speed and TUG, are stronger in women than in men 37).
As shown in Table 5, small effect sizes were identified for all parameters between the presence and absence of orthostatic mobility limitation, and significant associations were still found for MA, MV, and MP even after adjusting for sex, age, and BMI. The association between mobility, lower limb muscle strength, and power, assessed using a questionnaire-based survey, has been previously reported38). MA and MV, which directly evaluate the speed of the rising motion, and MP, which estimates muscle power based on these parameters, were more strongly related to lower -limb muscle strength and lower -limb muscle power than ST, a time parameter, in the acceleration parameter in the STS movement evaluated in this study15)21). In addition, it has been reported that lower limb muscle power is closely related to smooth performance of activities of daily living in older adults, and the results of the association between MA, MV, and MP and the presence or absence of mobility limitations are reasonable.
In addition to the physical functions objectively evaluated by the performance test, the acceleration parameters (MA, MV, and MP) were found to be related to the ability to move based on the subjective assessment of older participants.
This may provide valuable data to support the usefulness of acceleration assessment as a field test to evaluate acceleration in STS movements. However, this study has some limitations. The first limitation of this study is the possibility of selection bias. Participants in this study were selected from a single municipality and may have had a high level of physical fitness because they were older adults who participated in the physical fitness test. Second, as this was a cross-sectional study, causal relationships could not be established. As this study was based on baseline measurements from a prospective study, future studies should follow these participants longitudinally to determine whether acceleration parameters are useful in predicting the occurrence of mobility limitations. This study was conducted using a triaxial accelerometer; however, future studies using an angular velocity system or other devices to examine acceleration by axis (mediolateral and anterior-posterior) may provide more information and useful findings on acceleration in STS movements in the older adult population.
7. Conclusions
The acceleration parameters in STS movement showed good reliability and validity as a method for assessing lower limb function in older adults. MA, MV, and MP were strongly associated with the five STS movement times, TUG test results, and the ability to perform standing and moving movements. MP was also strongly related to grip strength, indicating that it may be useful as a muscle strength assessment method in older adults. These findings support the usefulness of sensor-based STS movement measurements, which are expected to be useful in various care -prevention settings.
Author Contributions
Conceptualization, K.T.; methodology, K.T., T.T., S.T; formal analysis, K.T., T.T., S.T., S.T., T.O.; investigation, K.T., S.T., S.T.; writing—original draft preparation, K.T.; writing—review and editing, T.T., S.T., S.T., O.T. All authors have read and agreed to the published version of the manuscript.
Funding
This work was supported by JST Grant Number JPMJPF2017.
Institutional Review Board Statement
The study was conducted according to the guidelines of the Declaration of Helsinki and approved by the by the Ethical Committee of the University of Tsukuba (Ref No. Tai 30-5).
Informed Consent Statement
Informed consent was obtained from all participants involved in the study.
Data Availability Statement
The data that support the findings of this study are available on request from the corresponding author. The data are not publicly available due to privacy or ethical restrictions.
Acknowledgments
We are grateful to the participants and our staff members
Conflicts of Interest
The authors declare no conflict of interest. The funders had no role in the design of the study; in the collection, analyses, or interpretation of data; in the writing of the manuscript, or in the decision to publish the results.
References
- Wilson, A.W.; Farthing, J.P.; Chilibeck, P.D.; Arnold, C.M.; Davison, K.S.; Olszynski, W.P.; Kontulainen, S.A. Lower leg muscle density is independently associated with fall status in community-dwelling older adults. Osteoporos. Int. 2016, 27, 2231–2240. [Google Scholar] [CrossRef] [PubMed]
- Zhang, F.; Ferrucci, L.; Culham, E.; Metter, J.; Guralnik, J.; Deshpande, N. Performance on five times STS task as a predictor of subsequent falls and disability in older persons. J. Aging Health 2013, 25, 478–492. [Google Scholar] [CrossRef]
- Grau, G.A.; Carnicero, J.A.; Cabello, A.G.; Avila, G.G.; Humanes, S.; Alegre, L.M.; Castro, M.; Manas, L.R.; Garcia, J. Association of regional muscle strength with mortality and hospitalization in older people. Age Aging 2015, 44, 790–795. [Google Scholar] [CrossRef]
- Csuka, M.; McCarty, D.J. Simple method for measurement of lower extremity muscle strength. Am. J. Med. 1985, 78, 77–81. [Google Scholar] [CrossRef]
- Le Berre, M.; Apap, D.; Babcock, J.; et al. The psychometric properties of a modified STS test with use of the upper extremities in institutionalized older adults. Percept. Mot. Skills. 2016, 123, 138–152. [Google Scholar] [CrossRef]
- Tsuji, T.; Tsunoda, K.; Mitsuishi, Y.; Okura, T. Ground reaction force in STS movement reflects lower limb muscle strength and power in community-dwelling older adults. Int. J. Gerontol. 2015, 10, 111–118. [Google Scholar] [CrossRef]
- Zijlstra, W.; Bisseling, R.W.; Schlumbohm, S.; Baldus, H. A body-fixed-sensor-based analysis of power during STS movements. Gait Posture 2010, 31, 272–278. [Google Scholar] [CrossRef]
- Millor, N.; Lecumberri, P.; Gomez, M.; Martinez-Ramirez, A.; Izquierdo, M. Kinematic parameters to evaluate functional performance of sit-to-stand and stand-to-sit transitions using motion sensor devices: A systematic review. IEEE Trans. Neural Syst. Rehabil. Eng. 2014, 22, 926–936. [Google Scholar] [CrossRef] [PubMed]
- Zhang, W.; Regterschot, G.R.H.; Schaabova, H.; Baldus, H.; Zijlstra, W. Test–retest reliability of a pendant-worn sensor device in measuring STS movement performance in older persons. Sensors 2014, 14, 8705–8717. [Google Scholar] [CrossRef]
- Lindemann, U.; Claus, H.; Stuber, M.; et al. Measuring power during the STS transfer. Eur. J. Appl. Physiol. 2003, 89, 466–470. [Google Scholar] [CrossRef] [PubMed]
- Van Acht, V.; Bongers, E.; Lambert, N.; Verberne, R. Miniature wireless inertial sensor for measuring human motions. Conf. Proc. IEEE Eng. Med. Biol. Soc. 2007, 2007, 279–282. [Google Scholar]
- Alcazar, J.; Kamper, R.S.; Aagaard, P.; Haddock, B.; Prescott, E.; Schnorh, P.; et al. Relation between leg extension power and the 30-s STS muscle power in older adults: Validation and translation to functional performance. Sci. Rep. 2020, 10, 16337. [Google Scholar] [CrossRef] [PubMed]
- Regterschot, G.R.H.; Zhang, W.; Baldus, H.; Stevens, M.; Zijlstra, W. Gait & Posture Sensor-based monitoring of STS performance is indicative of objective and self-reported aspects of functional status in older adults. Gait Posture. 2015, 41, 935–940. [Google Scholar]
- Doheny, E.P.; Walsh, C.; Foran, T.; Greene, B.R.; Fan, C.W.; Cunningham, C.; Kenny, R.A. Falls classification using tri-axial accelerometers during the five-times-STS test. Gait Posture. 2013, 38, 1021–1025. [Google Scholar] [CrossRef] [PubMed]
- Atrsaei, A.; Paraschiv-Ionescu, A.; Krief, H.; Henchoz, Y.; Santos-Eggimann, B.; Büla, C.; Aminian, K. Instrumented 5-Time STS Test: Parameters Predicting Serious Falls beyond the Duration of the Test. Gerontology 2021, 21, 6831. [Google Scholar]
- Regterschot, G.R.H.; Zhang, W.; Baldus, H.; Stevens, M.; Zijlstra, W. Accuracy and concurrent validity of a sensor-based analysis of STS movements in older adults. Gait Posture 2016, 45, 198–203. [Google Scholar] [CrossRef] [PubMed]
- Guralnik, J.M.; Simonsick, E.M.; Ferrucci, L.; Glynn, R.J.; Berkman, L.F.; Blazer, D.G.; Scherr, P.A.; Wallace, R.B. A short physical performance battery assessing lower extremity function: Association with self-reported disability and prediction of mortality and nursing home admission. J. Gerontol. 1994, 49, M85–M94. [Google Scholar] [CrossRef]
- Kivinen, P.; Sulkava, R.; Halonen, P.; Nissinen, A. Self-reported and performance-based functional status and associated factors among elderly men: The Finnish cohorts of the Seven Countries Study. J. Clin. Epidemiol. 1998, 51, 1243–1252. [Google Scholar] [CrossRef] [PubMed]
- Van Lummel, R.C.; Walgaard, S.; Maier, A.B.; Ainsworth, E.; Beek, P.J.; van Dieën, J.H. The instrumented STS test (iSTS) has greater clinical relevance than the manually recorded STS test in older adults. PLoS ONE 2016, 11, e0157968. [Google Scholar] [CrossRef] [PubMed]
- Cerrito, A.; Bichsel, L.; Radlinger, L.; Schmid, S. Reliability, and validity of a smartphone-based application for the quantification of the STS movement in healthy seniors. Gait Posture 2015, 41, 409–413. [Google Scholar] [CrossRef]
- Regterschot, G.R.; Folkersma, M.; Zhang, W.; Baldus, H.; Stevens, M.; Zijlstra, W. Sensitivity of sensor-based STS peak power to the effects of training leg strength, leg power and balance in older adults. Gait Posture. 2014, 39, 303–307. [Google Scholar] [CrossRef]
- Okura, T.; Tsuji, T.; Tsunoda, K. Study protocol and overview of the Kasama study: Creating a comprehensive, community-based system for preventive nursing care and supporting successful aging. J. Phys. Fitness Sports Med. 2017, 6, 49–57. [Google Scholar] [CrossRef]
- Marques, D.L.; Neiva, H.P.; Pires, I.M.; Marinho, D.A.; Marques, M.C. Accelerometer data from the performance of STS test by elderly people. Data Brief. 2020, 33, 106328. [Google Scholar] [CrossRef]
- Shukla, B.; Bassement, J.; Vijay, V.; Yadav, S.; Hewson, D. Instrumented analysis of the STS movement for geriatric screening: A systematic review. Bioengineering 2020, 7, 139. [Google Scholar] [CrossRef]
- Janssen, W.G.; Bussmann, J.B.; Horemans, H.L.; Stam, H.J. Validity of accelerometry in assessing the duration of the STS movement. Med. Biol. Eng. Comput. 2008, 46, 879–887. [Google Scholar] [CrossRef] [PubMed]
- Tsunoda, K.; Soma, Y.; Kitano, N. Age and gender differences in correlations of leisure-time, household, and work-related physical activity with physical performance in older Japanese adults. Geriatric Gerontology Int. 2013, 13, 919–927. [Google Scholar] [CrossRef]
- Visser, M.; Goodpaster, B.H.; Kritchevsky, S.B.; Newman, A.B.; Nevitt, M.; Rubin, S.M.; Simonsick, E.M.; Harris, T.B. Muscle mass, muscle strength, and muscle fat infiltration as predictors of incident mobility limitations in well-functioning older persons. J. Gerontol. A Biol. Sci. Med. Sci. 2005, 60, 324–333. [Google Scholar] [CrossRef] [PubMed]
- Tsuji, T.; Mitsuishi, Y.; Tsunoda, K.; Yoon, J.; Kitano, N.; Yoon, J.; Okura, T. Japanese Journal of Physical Fitness and Sports Medicine 2011, 387–399.
- Currier, D.P. Elements of Research in Physical Therapy (3rd ed.), Baltimore, MD: Williams & Wilkins, 1990, pp. 150–171.
- Cohen, J. Statistical Power Analysis for the Behavioral Science (2nd ed.), New Jersey: Lawrence Erlbaum Assoc Inc, 1988.
- Regterschot, G.R.H.; Zhang, W.; Baldus, H.; Stevens, M.; Zijlstra, W. Test–retest reliability of sensor-based STS measures in young and older adults. Gait Posture 2014, 40, 220–224. [Google Scholar] [CrossRef] [PubMed]
- Bean, J.F.; Leveille, S.G.; Kiely, D.K.; Bandinelli, S.; Guralnik, J.M.; Ferrucci, L. A comparison of leg power and leg strength within the InCHIANTI study: Which influences mobility more? J. Gerontol. Ser. A Biol. Sci. Med. Sci. 2003, 58, M728–M733. [Google Scholar] [CrossRef]
- Ruiz-Cardenas, J.D.; Rodriguez-Juan, J.J.; Smart, R.R.; Jakobi, J.M.; Jones, G.R. Validity, and reliability of an iPhone App to assess time, velocity and leg power during a STS functional performance test Gait Posture, 2018, 59, 261–266.
- Glenn, J.M.; Gray, M.; Binns, A. Relationship of STS lower-body power with functional fitness measures among older adults with and without sarcopenia. J. Geriatr. Phys. Ther. 2017, 40, 42–50. [Google Scholar] [CrossRef] [PubMed]
- Lara, J.; Cooper, R.; Nissan, J.; Ginty, A.T.; Khaw, K.-T.; Deary, I.J.; Lord, J.M.; Kuh, D.; Mathers, J.C. A proposed panel of biomarkers of healthy ageing. BMC Med. 2015, 13. [Google Scholar] [CrossRef] [PubMed]
- Fragala, M.S.; Alley, D.E.; Shardell, M.D.; Harris, T.B.; McLean, R.R.; Kiel, D.P.; Cawthon, P.M.; Dam, T.-T.L.; Ferrucci, L.; Guralnik, J.M. Kenny Comparison of handgrip and leg extension strength in predicting slow gait speed in older adults. J. Am. Geriatr. Soc. 2016, 64, 144–150. [Google Scholar] [CrossRef] [PubMed]
- Samson, M.M.; Meeuwsen, I.B.; Crowe, A.; Dessens, J.A.; Duursma, S.A.; Verhaar, H.J. Relationships between physical performance measures, age, height, and body weight in healthy adults. Age Ageing 2000, 29, 235–242. [Google Scholar] [CrossRef] [PubMed]
- Puthoff, M.L.; Nielsen, D.H. Relationships among impairments in lower-extremity strength and power, functional limitations, and disability in older adults. Phys. Ther. 2007, 87, 1334–1347. [Google Scholar] [CrossRef] [PubMed]
Figure 1.
acceleration parameters during STS, Aref: acceleration reference; ST: Stand up time; MA: Maximum Acceleration; MV: Maximum Velocity.
Figure 1.
acceleration parameters during STS, Aref: acceleration reference; ST: Stand up time; MA: Maximum Acceleration; MV: Maximum Velocity.
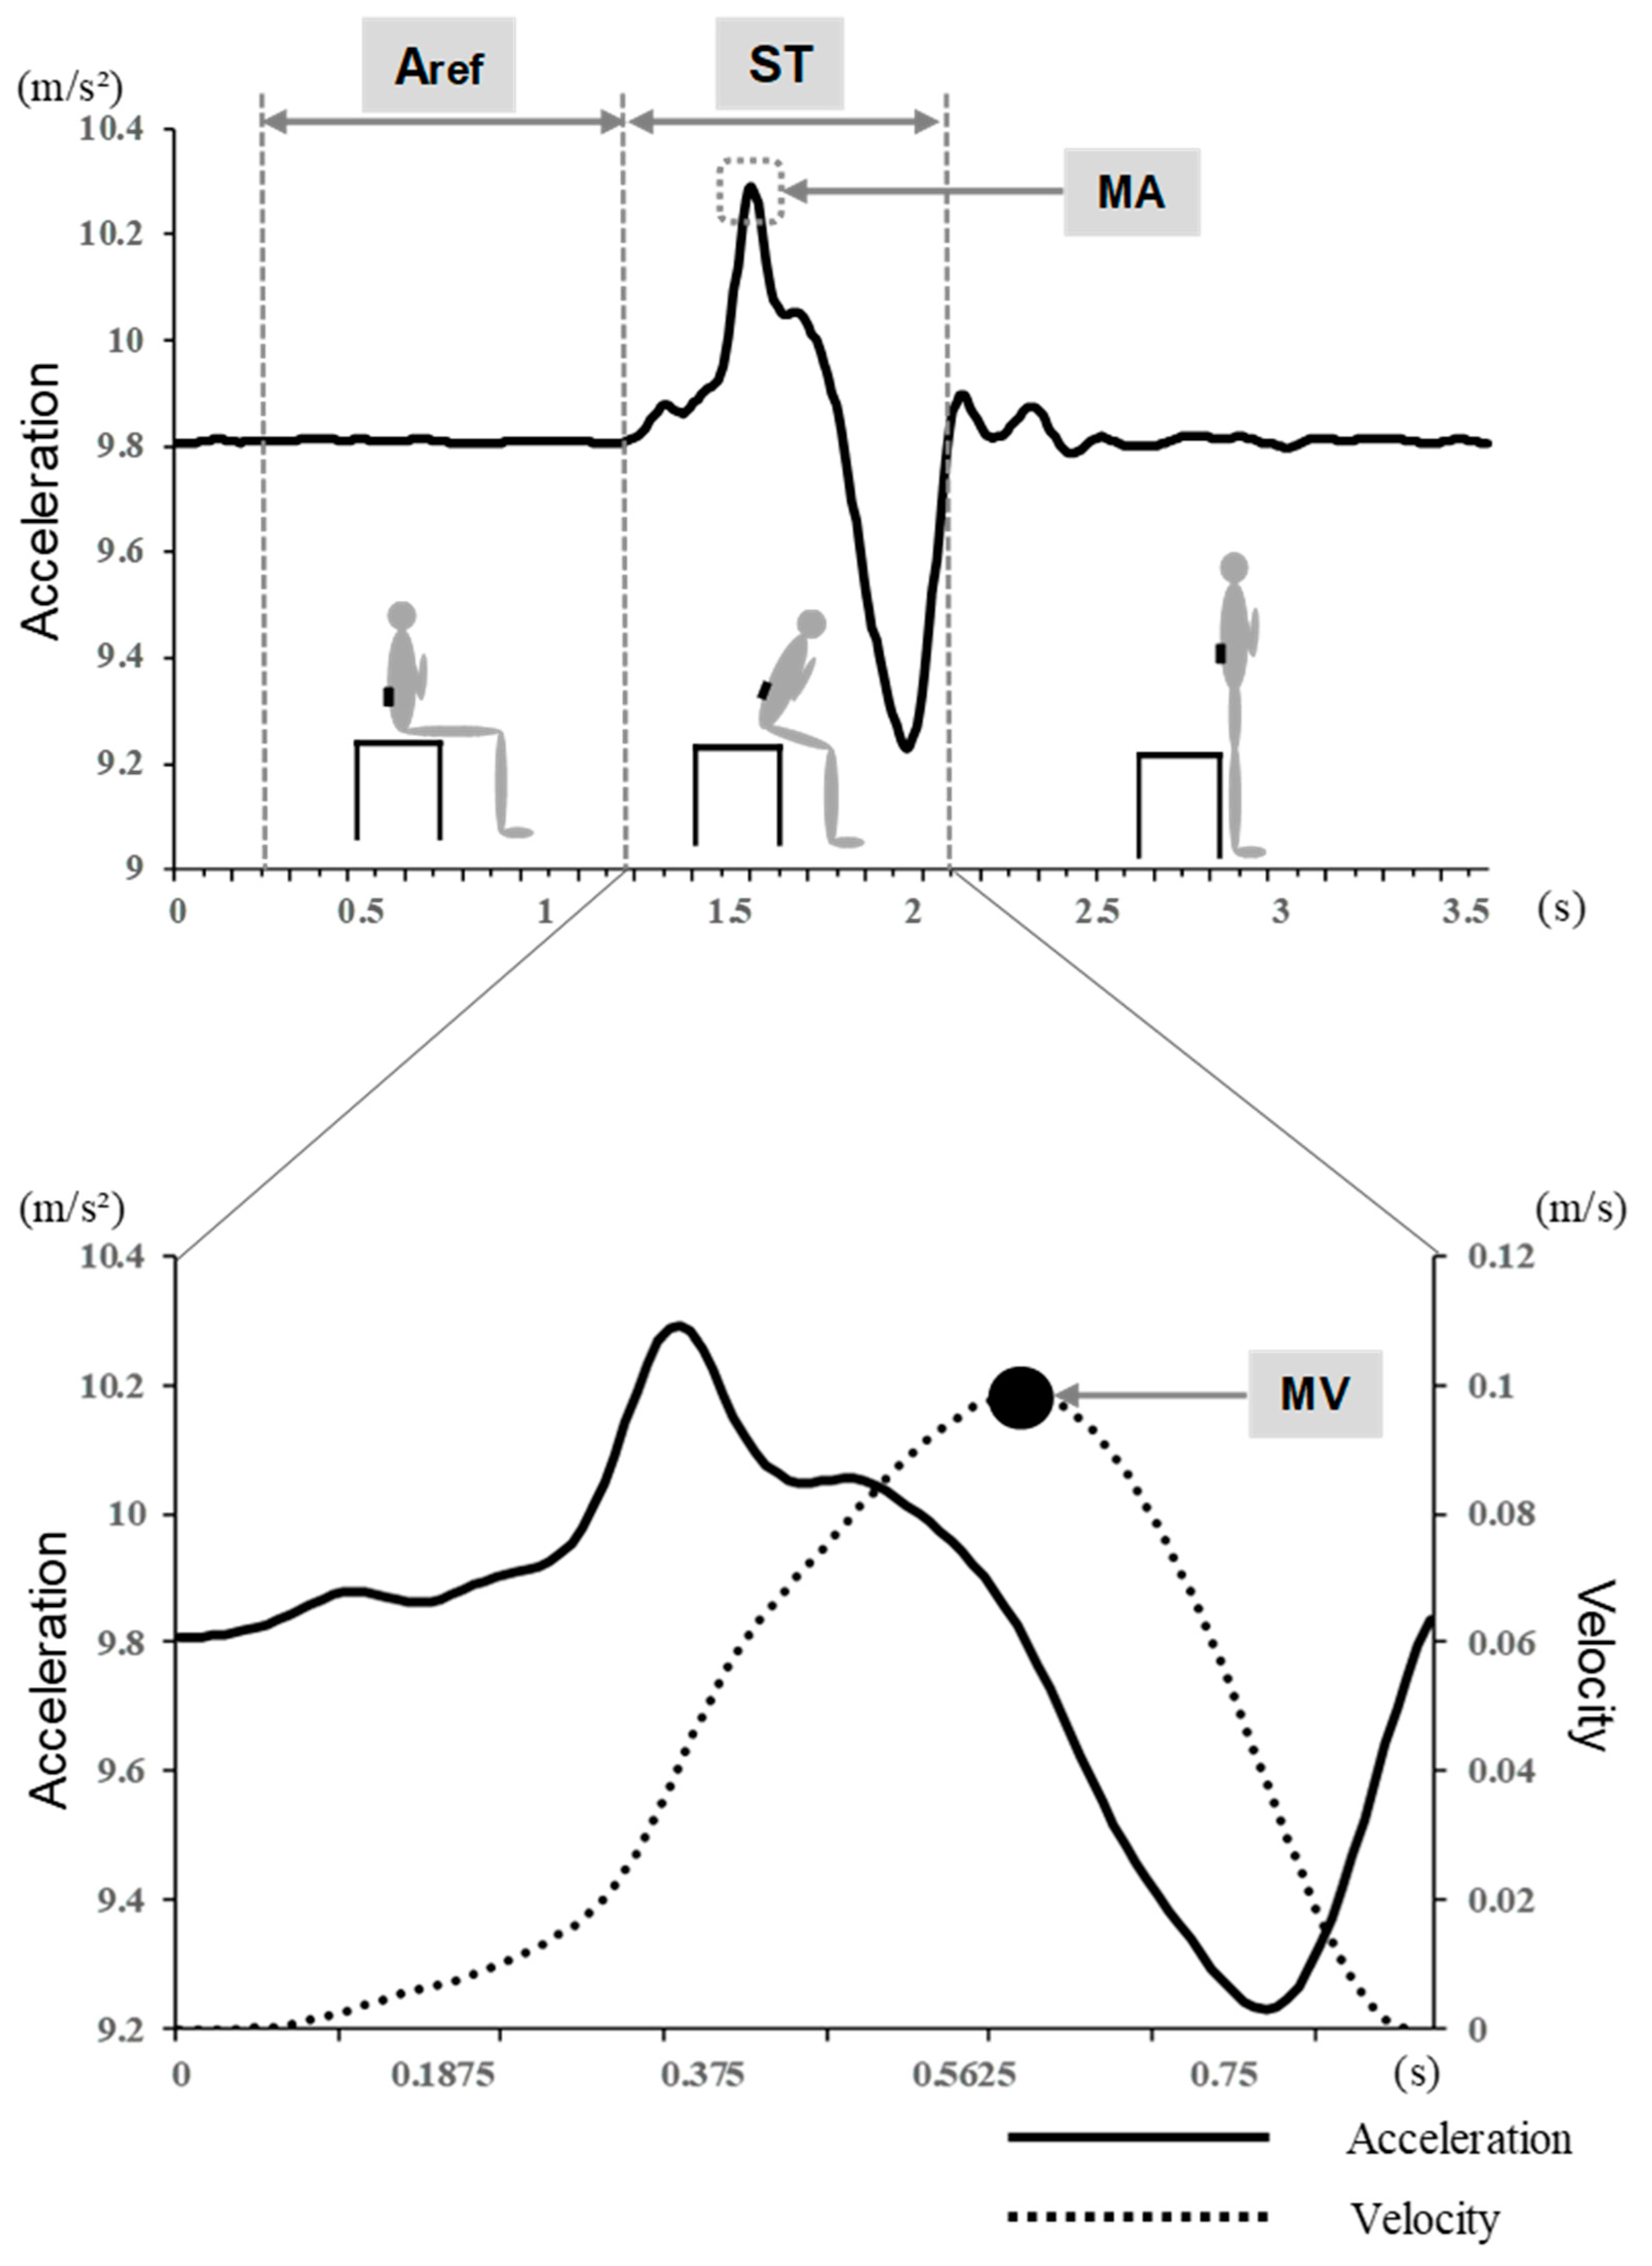

Table 1.
Characteristics of participants.
| Men (n=107) | Women (n=137) | ||
|---|---|---|---|
| <Characteristics> | |||
| Age (years), mean±SD | 77.4 ± 4.7 | 75.6 ± 5.3 | * |
| Height (cm), mean±SD | 163.6 ± 5.6 | 151.6 ± 5.1 | * |
| Body weight (kg), mean±SD | 63.2 ± 8.9 | 51.2 ± 7.5 | * |
| BMI (kg/m²) %(n) | |||
| <18.5 | 5.6% (6) | 9.5% (13) | |
| 18.5~24.9 | 65.4% (70) | 72.3% (99) | |
| ≥25 | 29.0% (31) | 18.2% (25) | |
| Lower back painª, yes % (n) | 33.6% (36) | 28.5% (39) | |
| Lower limb painª, yes % (n) | 6.5% (7) | 20.4% (28) | |
| <Acceleration parameters> | |||
| MA (m/s²) mean±SD | 10.25 ± 0.17 | 10.21 ± 0.15 | |
| MV (m/s) mean±SD | 0.11 ± 0.02 | 0.09 ± 0.02 | * |
| MP (W) mean±SD | 69.62 ± 17.39 | 45.85 ± 13.91 | * |
| ST (s) mean±SD | 1.09 ± 0.16 | 1.10 ± 0.18 | |
| <Physical performance test> | |||
| 5-time STS (s) mean±SD | 7.00 ± 2.19 | 6.61 ± 1.81 | |
| Timed up and go (s) mean±SD | 5.71 ± 1.26 | 5.66 ± 1.09 | |
| One-leg balance with eyes open (s) mean±SD | 31.82 ± 22.28 | 36.01 ± 21.74 | |
| 5-m habitual walk (s) mean±SD | 3.59 ± 0.66 | 3.46 ± 0.52 | |
| Grip strength (s) mean±SD | 34.13 ± 6.04 | 22.79 ± 3.93 | * |
| <Self-reported mobility limitations> | |||
| Climbing 10 stepsª, difficult %(n) | 22.4% (24) | 32.8% (45) | |
| Rising from chairª, difficult %(n) | 8.4% (9) | 14.6% (20) | |
| Walking for 15 minutesª, difficult %(n) | 7.5% (8) | 13.1% (18) | |
| Mobility limitationsª, incident %(n) | 30.8% (33) | 43.8% (60) | |
| *P<0.05 (presence of gender difference) a: χ²test SD: standard deviation BMI: body mass index MA: maximum acceleration, MV: maximum velocity, MP: maximum power, ST: stand up time | |||
Table 2.
Comparison in characteristics and acceleration parameters between participants with and without assessment of reliability.
Table 2.
Comparison in characteristics and acceleration parameters between participants with and without assessment of reliability.
| Participants with assessment of reliability(n=12) | Participants without assessment of reliability (n=232) | P-value | |
|---|---|---|---|
| <Characteristics> | |||
| Age (years), mean±SD | 77.0 ± 4.0 | 76.4 ± 5.2 | 0.676 |
| Percentage of womanª % (n) | 50.0 (6) | 56.5 (131) | 0.768 |
| Height (years), mean±SD | 156.9 ± 7.1 | 156.8 ± 8.0 | 0.992 |
| Body weight (years), mean±SD | 54.6 ± 7.6 | 56.6 ± 10.2 | 0.512 |
| BMI (kg/m²) % (n) | |||
| <18.5 | 8.3% (1) | 7.8% (18) | |
| 18.5~24.9 | 83.3% (10) | 68.5% (159) | 0.463 |
| ≥25 | 8.3% (1) | 23.7% (55) | |
| Lower back painª, yes % (n) | 50.0% (6) | 29.7% (69) | 0.196 |
| Lower limb painª, yes % (n) | 8.3% (1) | 14.7% (34) | 0.465 |
| <Acceleration parameters> | |||
| MA (m/s²), mean±SD | 10.26 ± 0.13 | 10.23 ± 0.16 | 0.477 |
| MV (m/s), mean±SD | 0.11 ± 0.02 | 0.11 ± 0.03 | 0.160 |
| MP (W), mean±SD | 59.23 ± 13.87 | 56.12 ± 19.75 | 0.590 |
| ST (s), mean±SD | 1.05 ± 0.10 | 1.10 ± 0.18 | 0.934 |
| a: χ²test, SD: standard deviation, ns: not significant BMI: body mass index MA: maximum acceleration, MV: maximum velocity, MP: maximum power ST: stand up time | |||
Table 3.
Test-retest reliability of acceleration parameters.
| Test1 | Test2 | ICC | F | P-value | ||
|---|---|---|---|---|---|---|
| Mean SD | Mean SD | |||||
| MA | (m/s²) | 10.26 ± 0.13 | 10.23 ± 0.12 | 0.761 | 1.523 | 0.243 |
| MV | (m/s) | 0.11 ± 0.02 | 0.11 ± 0.02 | 0.772 | 0.353 | 0.565 |
| MP | (W) | 59.23 ± 13.87 | 58.06 ± 14.61 | 0.894 | 0.363 | 0.559 |
| ST | (s) | 1.05 ± 0.10 | 1.06 ± 0.12 | 0.714 | 0.132 | 0.723 |
| n=12 SD: standard deviation, ICC: intraclass correlation coefficients MA: maximum acceleration, MV: maximum velocity, MP: maximum power, ST: stand up time | ||||||
Table 4.
Pearson correlation coefficient between acceleration parameters and physical performance test.
Table 4.
Pearson correlation coefficient between acceleration parameters and physical performance test.
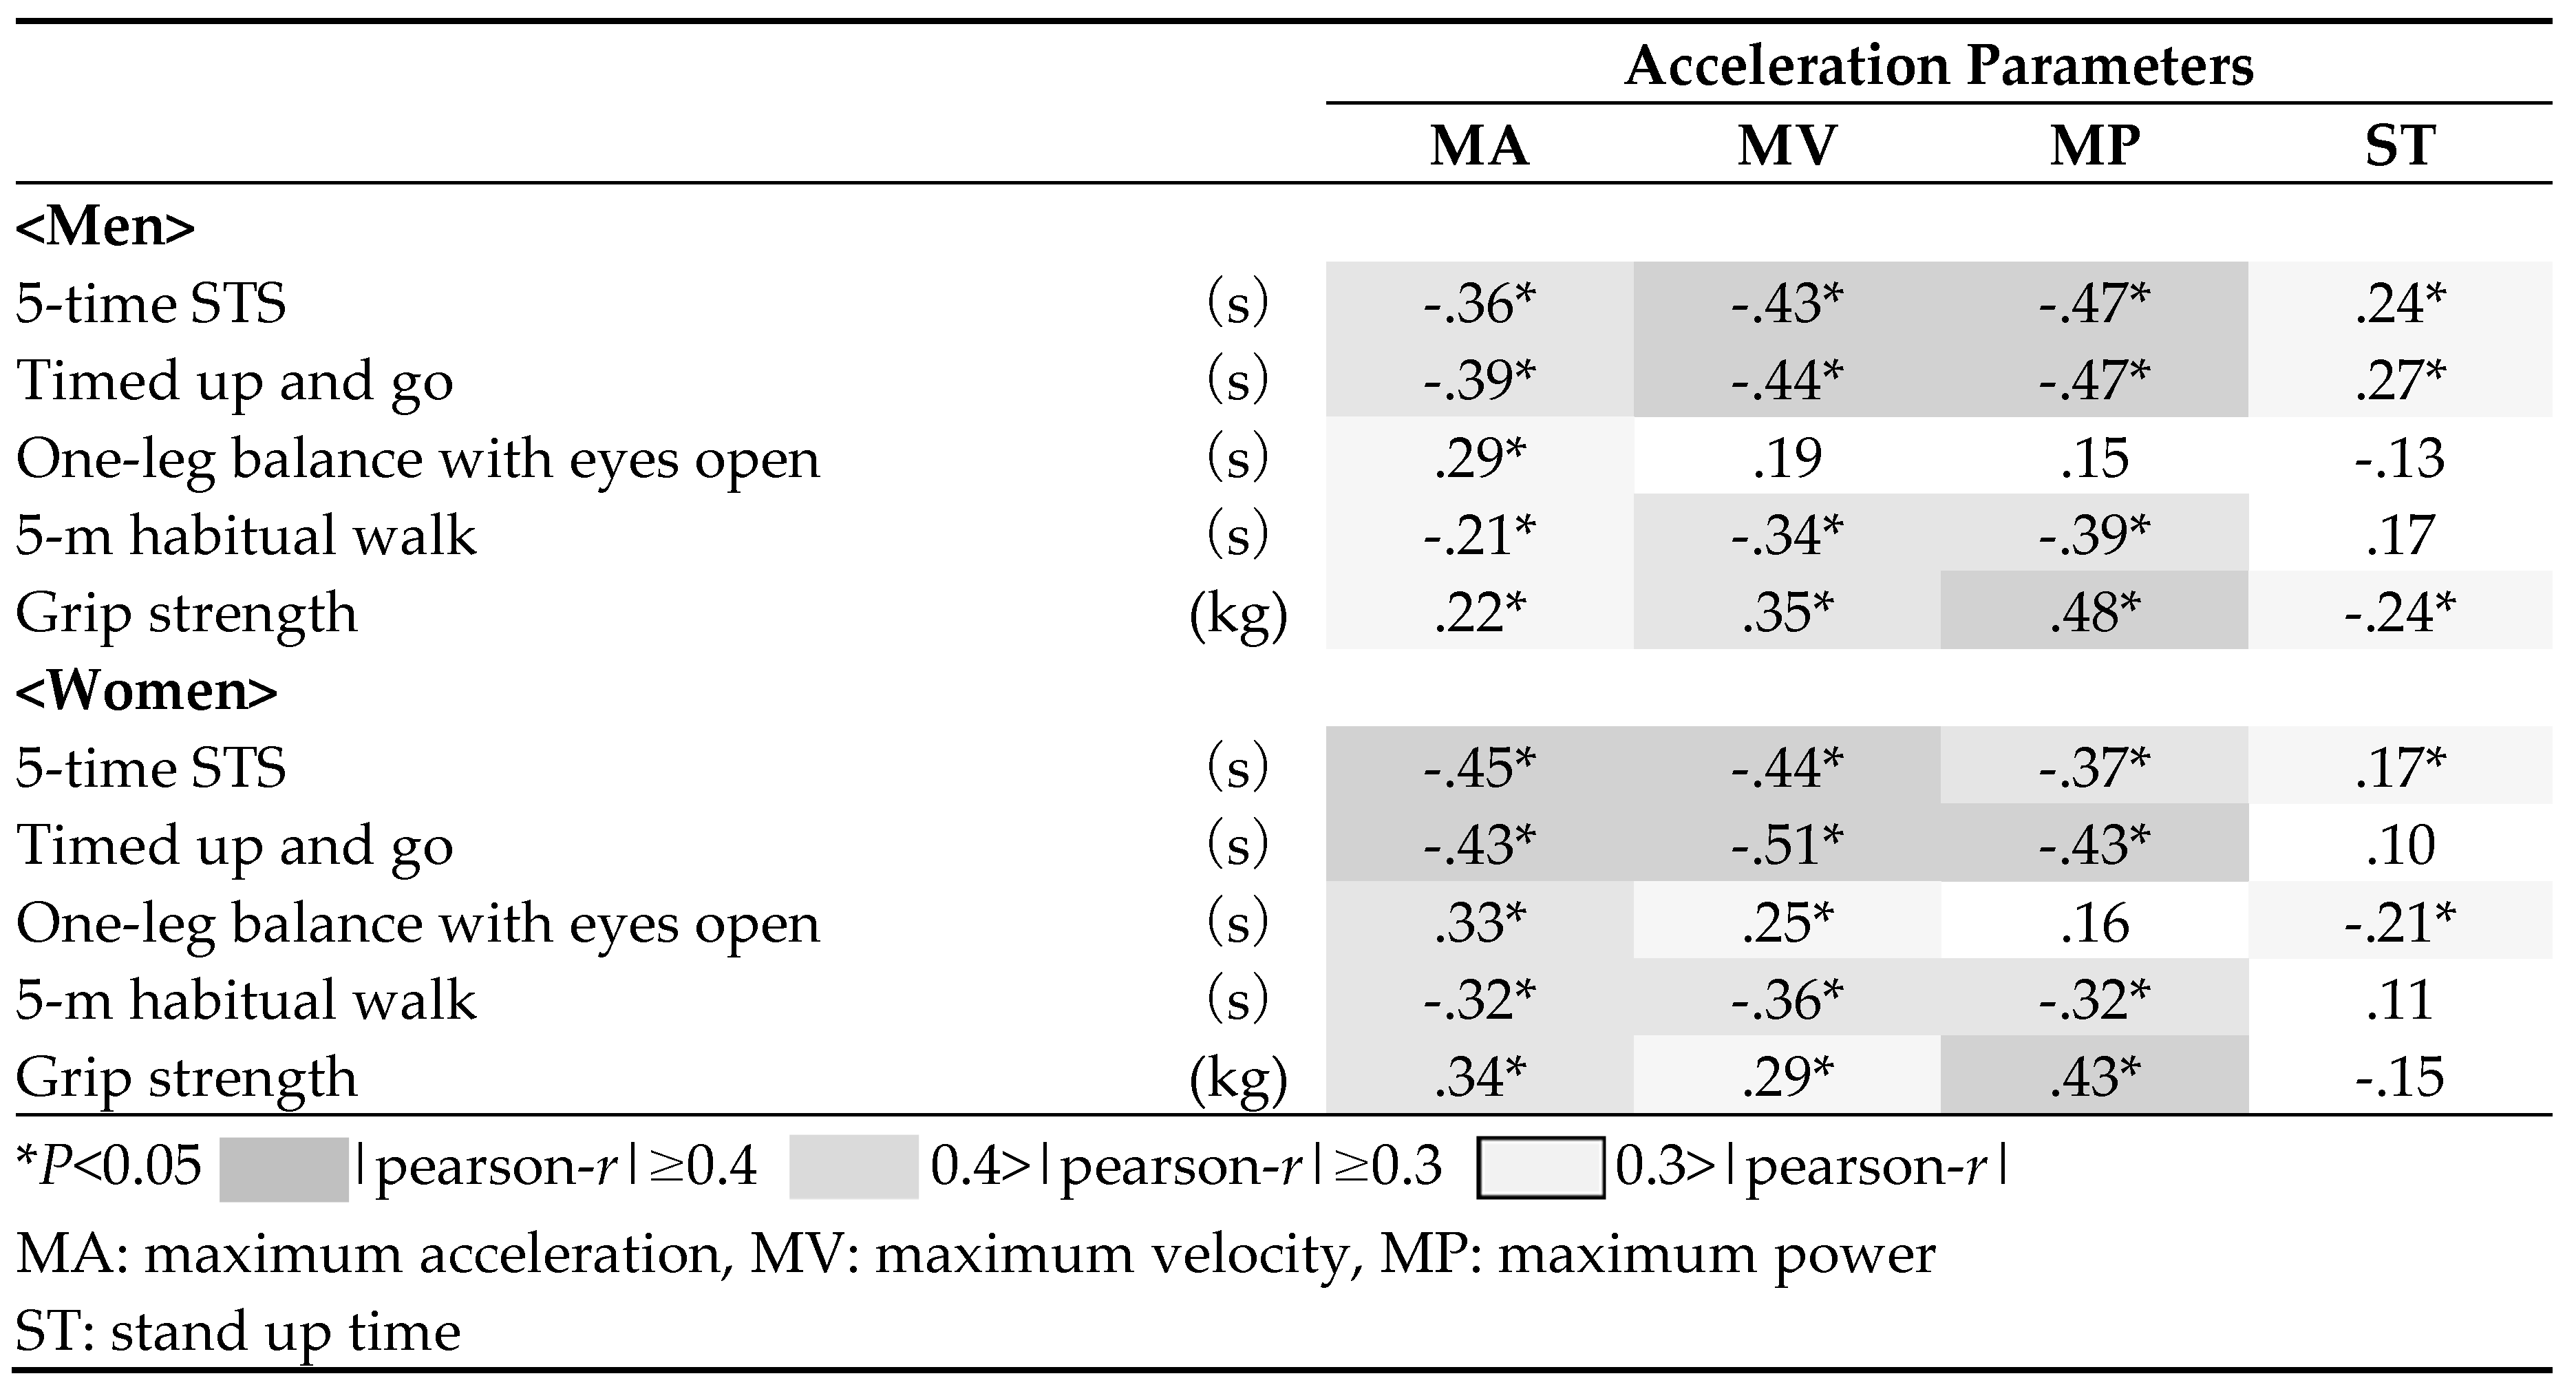 |
Table 5.
Comparison of acceleration parameters between with and without mobility limitation.
| No (n=151) | Yes (n=93) | P-value | Effect size(Cohen's d) | AdjustedP-valuea | AdjustedP-valueb | ||
|---|---|---|---|---|---|---|---|
| Mean SD | Mean SD | ||||||
| MA | (m/s²) | 10.25 ± 0.16 | 10.19 ± 0.15 | 0.002 | 0.41 | 0.015 | 0.012 |
| MV | (m/s) | 0.10 ± 0.02 | 0.09 ± 0.03 | <0.001 | 0.48 | 0.011 | 0.010 |
| MP | (W) | 59.63 ± 19.19 | 50.82 ± 18.82 | <0.001 | 0.46 | 0.032 | 0.014 |
| ST | (s) | 1.07 ± 0.18 | 1.12 ± 0.16 | 0.027 | 0.30 | 0.063 | 0.069 |
| a: ANCOVA models adjusted for age and gender b: ANCOVA models adjusted for BMI, Lower back pain and Lower limb pain, in addition to "a". SD: standard deviation, ns: not significant MA: maximum acceleration, MV: maximum velocity, MP: maximum power, ST: stand up time | |||||||
Disclaimer/Publisher’s Note: The statements, opinions and data contained in all publications are solely those of the individual author(s) and contributor(s) and not of MDPI and/or the editor(s). MDPI and/or the editor(s) disclaim responsibility for any injury to people or property resulting from any ideas, methods, instructions or products referred to in the content. |
© 2023 by the authors. Licensee MDPI, Basel, Switzerland. This article is an open access article distributed under the terms and conditions of the Creative Commons Attribution (CC BY) license (http://creativecommons.org/licenses/by/4.0/).
Copyright: This open access article is published under a Creative Commons CC BY 4.0 license, which permit the free download, distribution, and reuse, provided that the author and preprint are cited in any reuse.


