Submitted:
04 October 2023
Posted:
09 October 2023
You are already at the latest version
Abstract
(1) Background: Type-2 Diabetes (T2DM) is a long-term medical disorder characterized by Insulin deficiency and high blood glucose levels. Among other medication to cure T2DM, the review of the literature found that various Pyrimidine derivative act as an agonist for G-protein-coupled receptor 119 (GPR119) was proposed to control blood glucose levels by enhancing the function of pancreatic beta-cells and its mechanism of action with fewer adverse effects.; (2) Methods: In the present research work, in-silico investigations were carried out to investigate the potential of Pyrimidine analogue as an agonists to the protein target GPR119 receptor. We performed exhaustive molecular modelling and protein modelling methodologies such as homology mod-elling, molecular docking along with various drug designing tools such as 3D-QSAR and pharmacophore mapping to ascertain the design of better GPR119 agonists.; (3) Results: On the basis of in-depth computa-tional studies, we designed new pyrimidine moiety and analyzed them for GPR-119 receptor agonist and fur-ther explored the ADME properties. Designed compounds found to exhibit better predicted activities as com-pared to reference compound; (4) Conclusions: The current research on pyrimidine derivatives, using molec-ular docking, 3D-QSAR and Pharmacophore mapping demonstrated that the obtained computational model has significant properties and the designed molecules and Dataset from this model, produced antidiabetic compound against the target GPR119 i.e., compound 1S, 1Z and 1D with the docking score of −11.696, -9.314 and -8.721 respectively. The pharmacokinetics and drug-likeness studies revealed that these compounds may be the future candidate for the treatment of diabetes acting via GPR119 agonist mechanism.
Keywords:
Pyrimidine
; Homology Modelling
; Pharmacophore Mapping
; 3D-QSAR
; Molecular Docking
; ADMET
; Drug Design
1. Introduction
Diabetes Mellitus, specifically Type 2 Diabetes Mellitus (T2DM), is a progressive and chronic metabolic disorder characterized by elevated blood glucose levels (hyperglycemia). This condition is primarily associated with metabolic factors such as insulin resistance, impaired glucose tolerance, and, in some cases, insufficient insulin production. To manage T2DM, a variety of antidiabetic drugs have been developed, each with distinct mechanisms of action aimed at regulating blood glucose levels. However, many of these medications are associated with adverse effects, notably hypoglycemia and potential impairment of pancreatic beta-cell function.
Metformin is currently a widely used first-line therapy for T2DM due to its effectiveness in improving glycemic control. However, in cases where metformin fails to adequately regulate glucose homeostasis, alternative therapeutic options are required. Consequently, there is a critical imperative to develop novel antidiabetic agents that not only minimize these undesirable side effects but also enhance the overall quality of life for individuals with T2DM. This necessitates extensive research and development efforts in the field of diabetes pharmacotherapy, focusing on the discovery and design of innovative drugs with improved safety profiles and efficacy. Such novel agents should aim to address the complex pathophysiology of T2DM, targeting key factors like insulin resistance, beta-cell dysfunction, and glucose metabolism, while also minimizing the risk of hypoglycemia. Furthermore, these developments should enhance the management of T2DM and contribute to a higher standard of living for individuals affected by this chronic condition. [1,2,3,4,5,6].
GPR119, a receptor of interest in the treatment of type 2 diabetes, has been identified as a potential target based on numerous published reports. When GPR119 is stimulated by an agonist, it primarily activates the Gs signaling pathway. This activation leads to an increase in Adenyl cyclase activity, resulting in elevated levels of intracellular cAMP (cyclic adenosine monophosphate). This rise in cAMP levels subsequently triggers an increase in intracellular calcium (Ca2+) and the release of incretin hormones such as GLP-1 (glucagon-like peptide-1), GLP-2, and GIP (glucose-dependent insulinotropic peptide). These incretin hormones collectively contribute to reducing gastric emptying, body mass, and increasing insulin secretion and glucose tolerance in the context of diabetes management [1].
Extensive literature surveys have unveiled the synthesis, evaluation, and reporting of numerous Pyrimidine derivative analogues by researchers, all designed with the aim of potentially interacting with the GPR119 receptor. These research endeavors have yielded noteworthy findings in the quest for synthetic GPR119 agonists, with compounds like MBX-2982, PSN821, LEZ 763, DS 8500, and GSK129263 being particularly prominent. These agonists hold substantial promise for therapeutic interventions targeting Type 2 Diabetes Mellitus [1].
In our study, a comprehensive set of computational analyses was undertaken employing drug design tools (Table 1), specifically focusing on the Pyrimidine scaffold compounds reported in the existing literature. The primary objectives of these analyses were as follows: 3D-Pharmacophore Mapping: A 3D-pharmacophore mapping exercise was conducted to identify the critical pharmacophoric features responsible for the observed biological activity of these compounds. 3D-QSAR Modeling: Quantitative Structure-Activity Relationship (QSAR) modeling was employed to assess the significance of each atom within the molecular structures, thereby contributing to the development of predictive models. 3D-QSAR: Three-dimensional QSAR analyses, encompassing Comparative Molecular Field Analysis (CoMFA) and Comparative Molecular Similarity Indices Analysis (CoMSIA), Atom Based and Field Base QSAR, were carried out. These analyses elucidated the individual contributions of different molecular fields, including steric effects, electrostatic interactions, hydrogen bond donors, hydrogen bond acceptors, and hydrophobic interactions, for each molecule within the dataset. Protein Modeling: Due to the unavailability of a co-crystallized protein structure of the human GPR119 receptor in the Protein Data Bank (PDB), protein modeling studies were executed. These efforts led to the generation of a 3D structural model for the GPR119 receptor. Molecular Docking: Molecular docking studies were performed, wherein key molecular interactions at the active site of the GPR119 receptor were investigated. Docking studies are invaluable for conducting virtual screenings of extensive compound libraries, such as those from Zinc and Swiss similarity databases. These screenings enable the ranking of results and the formulation of structured hypotheses regarding how ligands interact with the target receptor. Overall, these findings suggest that Pyrimidine scaffold compounds could serve as potential GPR119 agonists. Such agonists may hold promise for improving β-cell function and reducing blood glucose levels in individuals with Type 2 diabetes. These computational hypotheses provide a rational basis for further lead optimization efforts, combining both experimental and in-silico methodologies. Additionally, these hypotheses can be validated through docking studies and assessed for ADMET (Absorption, Distribution, Metabolism, Excretion, and Toxicity) properties, further advancing the development of new molecular structures with therapeutic potential.
2. Results and Discussion
In the pursuit of developing novel anti-diabetic drugs with improved therapeutic profiles, we conducted an extensive computational analysis using drug design tools on a dataset comprising 35 Pyrimidine analogues reported in the literature. Our research aimed to identify potent GPR119 agonists through a comprehensive set of molecular modeling studies. These findings signify a significant step toward the development of new anti-diabetic drugs with enhanced therapeutic efficacy and reduced adverse effects, thereby contributing to an improved quality of life for individuals living with diabetes.
2.1. Pharmacophore Mapping
Pharmacophore mapping analysis was conducted on a dataset comprising 35 compounds, which were carefully selected due to their demonstrated agonistic activity against the GPR119 receptor. The generated hypotheses are presented in Table 3 and Table 4, with particular emphasis on Hypothesis AAAHH_1, which exhibited the most favorable attributes based on multiple scoring criteria. Among the various hypotheses generated during the analysis, Hypothesis AAAHH_1 emerged as the most promising, as indicated by its phase hypo score of 1.32, survival score of 5.3946, site score of 0.7779, and vector score of 0.9927. This best hypothesis highlights the essential pharmacophoric features required for optimal biological activity. Notably, it underscores the significance of two key features: aromatic and hydrophobic moieties. These findings are particularly noteworthy because aromatic and hydrophobic features were consistently present in the majority of compounds within the dataset exhibiting agonistic activity against the GPR119 receptor. Consequently, these identified features hold paramount importance when designing new molecules with the potential for potent GPR119 agonistic activity. In summary, the robust pharmacophore mapping analysis has unveiled crucial insights into the spatial arrangement of pharmacophoric features essential for GPR119 receptor activation. Hypothesis AAAHH_1, with its high scores and emphasis on aromatic and hydrophobic features, provides valuable guidance for the rational design of novel compounds aimed at achieving potent GPR119 activity.
2.2. 3D-QSAR
In our study, a comprehensive 3D-QSAR analysis was conducted using a series of pyrimidine compounds with GPR119 receptor agonistic activity. The models developed exhibited strong statistical validation parameters, meeting the necessary criteria for significance within the Sybyl-X v2.1.1 software.
For the CoMFA (Comparative Molecular Field Analysis) model, the best model selection was based on the following criteria: a high squared cross-validation coefficient (q^2 = 0.59), a high squared correlation coefficient (r^2 = 0.98), a low standard error of estimate (SEE = 0.1755), and a number of compounds (ONC = 3), as discussed in Table 7. Similarly, for the CoMSIA (Comparative Molecular Similarity Indices Analysis) model, the best model selection was guided by a high squared cross-validation coefficient (q^2 = 0.4), a high squared correlation coefficient (r^2 = 0.987), a low standard error of estimate (SEE = 0.1425), and a number of compounds (ONC = 3), also detailed in Table 7. These statistical parameters, presented in Table 8 and Table 9, underscore the robustness and reliability of the developed CoMFA and CoMSIA models.
Additionally, Atom-based and Field-based 3D-QSAR models were constructed using Schrodinger Maestro v13.5 suite based on aligned ligands to predict activities. In the Atom-based 3D-QSAR model, the values for Q^2, R^2, and R^2CV for 4 factors were 0.675, 0.8321, and -0.0001, respectively (Table 11, Table 12 and Table 13). Meanwhile, in the Field-based 3D-QSAR model, the values for Q^2, R^2, and R^2CV for 4 factors were 0.8186, 0.7945, and -0.6463, respectively (Table 14, Table 15 and Table 16 ). These results indicate the development of statistically significant models, as all parameters meet the desired criteria for significance. The contour maps generated from the best CoMFA and CoMSIA models (Figure 4 and Figure 5) and Atom and Field-based 3D-QSAR models (Figure 7 and Figure 9) can be utilized for further optimization and the design of new compounds with potent GPR119 activity. Contour maps are instrumental in predicting biological activity and elucidating the correlation between various substitutions on the core molecular structure and their effects on biological activity.
In conclusion, our comprehensive 3D-QSAR analysis has yielded robust models with strong statistical validation parameters. These models, along with the contour maps, provide valuable insights for the rational design of new compounds targeting GPR119 activity, contributing to the development of potential anti-diabetic drugs with enhanced efficacy.
2.3. Homology Modelling
In our study, we successfully generated Homology Models of the GPR119 receptor using various computational tools, including Modeller v10.2, Robetta, Swiss Model, and I-tasser. A total of 31 models were produced, as detailed in Table 17, Table 18, Table 19, Table 20, Table 21, Table 22, Table 23 and Table 24. These models underwent rigorous evaluation, employing various bioinformatics tools to assess their structural stability and reliability. Among the generated models, Model 3 exhibited superior accuracy and was further refined using GalaxyWEB, considering critical parameters such as Clash-score, MolProbity, Ramachandran Plot favorability, RMSD score, and Galaxy energy, as documented in Table 24. Following the successful generation of these protein structures, we rigorously assessed their structural stability, ensuring their suitability for subsequent molecular docking studies. These Homology Models served as the foundation for our investigations into the interaction between the Ligands structure and the GPR119 receptor. Our research leveraged Homology Modeling techniques to design and evaluate protein structures for selected drug targets, with a focus on GPR119. These structurally stable models were subsequently employed for molecular docking studies, utilizing SwissSimilarity, Zinc Database, and the design pyrimidine compounds. This integrated approach holds promise for the development of novel therapeutics targeting GPR119 and has implications for potential applications in the treatment of diabetic conditions.
2.4. Molecular Docking
Molecular docking studies were conducted to investigate the interactions between compounds retrieved from databases (Zinc and Swiss similarity) and the designed pyrimidine compounds with the Homology Modelled GPR119 receptor. Among the top-ranking docking scores documented in Table 25, Table 26 and Table 27, compounds 1S, 2S, 3S, 1Z, 2Z, 3Z, 1D, 2D, and 3D displayed noteworthy binding interactions with the receptor. Notably, analogues 1S, 1Z, and 1D exhibited the highest XP (Extra Precision) docking scores, with values of -11.696, -9.314, and -8.721, respectively. These docking scores suggest strong and favorable binding interactions between these specific compounds and the GPR119 receptor, indicating their potential as promising ligands for further investigation in the context of GPR119 agonism and their potential application as therapeutic agents.
2.5. Pharmacological Prediction
The results obtained from the Pharmacological Prediction study revealed that all nine (1S, 2S, 3S, 1Z, 2Z, 3Z, 1D, 2D, and 3D) screened molecules exhibit favorable pharmaceutical properties. These properties include high gastrointestinal (GI) absorption, good water solubility, a significant lipophilic profile, and a moderate level of synthetic accessibility. Moreover, these compounds not only demonstrated the most promising docking interactions but also exhibited favorable Absorption, Distribution, Metabolism, Excretion, and Toxicity (ADMET) profiles. In the context of designing new molecules, it is essential to consider parameters such as molecular weight and water solubility to ensure precision in the design process. In light of these findings, it is reasonable to anticipate that these compounds may exhibit enhanced biological activity, akin to the most potent compound within the series. This suggests their potential as promising candidates for further development and optimization as part of ongoing drug discovery efforts.
3. Materials and Methods
3.1. Software’s
In our research, a comprehensive set of computational tools and software applications were employed to facilitate various aspects of the study. These tools and their respective functions are summarized in Table 1. These computational tools and software applications collectively played pivotal roles in enabling various aspects of the research, from compound structure visualization to molecular modeling, docking, and prediction of important pharmacological and pharmacokinetic properties, ultimately contributing to the comprehensive analysis and design of potential drug candidates.

Table 1.
Computational Tools and Software Functions in the Research.
| Tools | Functions |
|---|---|
| 1) Science Direct/ PubMed/ Google Scholar | Literature Survey, source for scientific, technical, and medical research. |
| 2) ChemDraw Professional 17.1 | ChemDraw, along with Chem3D, draw ligand Structure and saved in .mol, .sdf, .mol2 and .cdx format. |
| 3) Sybyl-X v2.1.1 | Generation of 3D-QSAR Model (CoMFA, CoMSIA) |
| 4) Swiss Model | Homology-Modelling Server |
| 5) I-Tesser | Hierarchical approach to protein structure prediction |
| 6) Robetta | Protein Structure Prediction server |
| 7) Modeller v10.2 | MODELLER, is a computer program used for homology modelling to produce models of protein tertiary structures and quaternary structures. |
| 8) Biovia Discovery Studio Visualizer 2016 | These Program are the leading visualization tool for viewing, sharing, and analysing protein and modelling data. |
| 9) Swiss Similarity | SwissSimilarity is to provide user-friendly interface to perform ligand-based virtual screening of chemical libraries. |
| 10) Zinc Database | The ZINC database is a curated collection of commercially available chemical compounds prepared especially for virtual screening. |
| 11) Pymol | Software for 3D visualization of Protein and Ligands for preparing high resolution images for publication. |
| 12) Schrodinger Maestro Suite 13.5 | |
| ∙ Phase | Generate Pharmacophore Hypothesis. |
| ∙ 3D-QSAR | Generation of 3D-QSAR models (Atom based and Field base) |
| ∙ Macromodel | Minimization of the Protein |
| ∙ Protein Preparation workflow | Prepare Protein for Docking |
| ∙ Ligprep | Prepare Ligands for Docking |
| ∙ Site Map Tools | Detect best Binding Pocket for Molecular Docking |
| ∙ Glide | Molecular Docking |
| ∙ QikProp | ADMET Profile for Ligands |
3.2. Dataset
In our study, we curated a dataset comprising 35 Pyrimidine derivatives, which had been previously reported in the literature [7,8]. To facilitate further analyses, the chemical structures of these compounds were meticulously drawn using ChemDraw Professional 17.1 and saved in mol format. The agonistic potency of these compounds against the GPR119 receptor was quantified in terms of EC50 values, expressed in nanomolar (nM) units. These EC50 values were then transformed into their negative logarithms (pEC50 = -LogEC50) to establish a linear relationship for subsequent 3D-QSAR and Pharmacophore model development. The activity data for the Pyrimidine derivatives are presented in Table 5. The Pyrimidine structure, along with its substitution sites, is depicted below for reference:
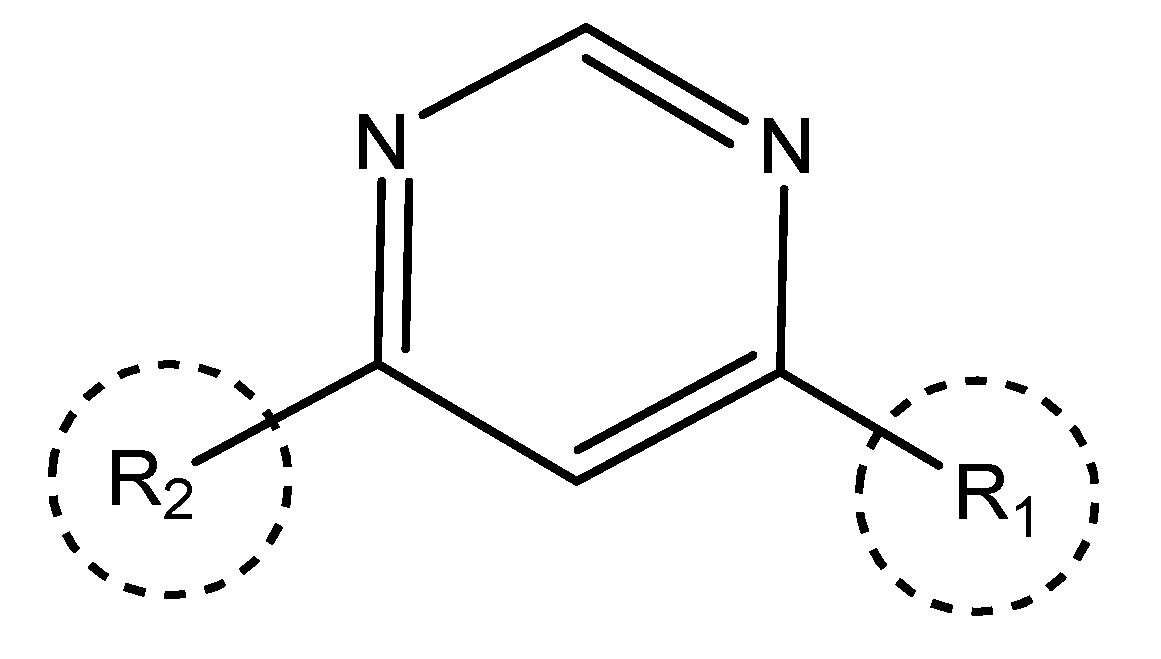
These preparations and transformations of the dataset, as described above, provided the foundational data required for subsequent modelling and analysis of the Pyrimidine derivatives in the context of GPR119 receptor agonism.
3.3. Pharmacophore Mapping
The International Union of Pure and Applied Chemistry (IUPAC) offers a precise definition of a pharmacophore, characterizing it as the collective set of both steric (relating to the spatial arrangement of atoms or molecules) and electronic (related to the distribution of electrons) characteristics. The ultimate goal of these interactions is to initiate and activate the biological response associated with that target structure [9,10,11].
3.3.1. Generation of Pharmacophore Hypothesis
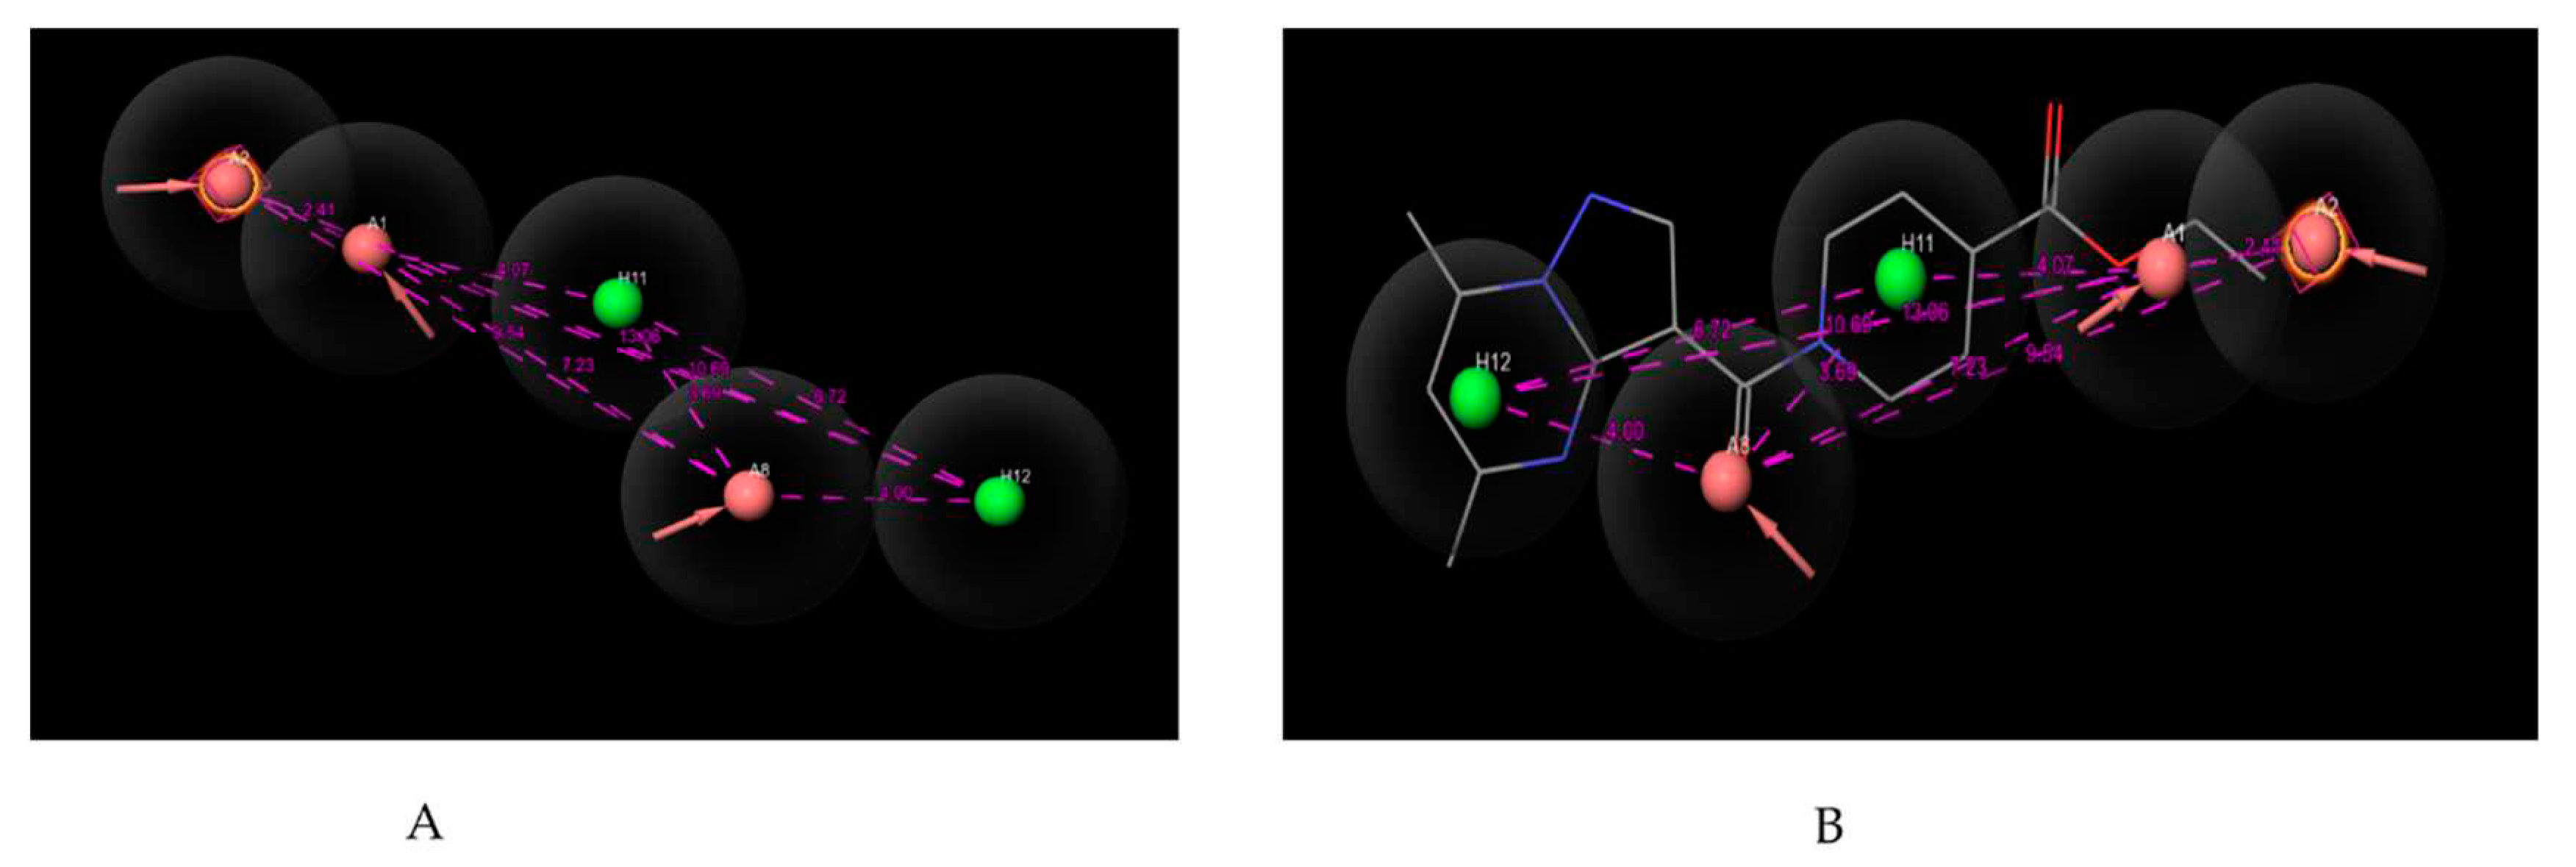
Pharmacophore mapping is used for determining the unique feature essential for producing pharmacological activity. The pharmacophore hypothesis was generated by PHASE module of Schrodinger Maestro v13.5 software. For the pharmacophore mapping, 35 compounds were selected [7,8] from the datasets and the parameters have been selected as how the active molecule bind to the receptor with a default box size 1 Å and 2 Å minimum inter-site distance followed by the minimization and alignment of all 35 compounds. Where we choose six features such as hydrogen bond donor, hydrogen bond acceptor, aromatic ring, positive, negative and hydrophobic. Based on the chemical features related to the structural similarities of all the 35 compounds the PHASE generated 20 possible hypothesizes (Table 3 and Table 4) to explain how the active molecules bind to the receptor. In our study, the software module identified two recurring chemical features: hydrogen bond acceptor (A) and hydrophobic group (H). To precisely locate these features, an in-built distance calculation tool was employed to determine inter-featuric distances (Table 2), as illustrated in Figure 1.
Figure 1.
(A) Pharmacophoric features of AAAHH_1 with their inter-featuric distances map. Hydrogen bond acceptor- salmon, aromatic ring- orange & hydrophobic- green. (B) Pharmacophoric features mapped over most potent molecule.
Figure 1.
(A) Pharmacophoric features of AAAHH_1 with their inter-featuric distances map. Hydrogen bond acceptor- salmon, aromatic ring- orange & hydrophobic- green. (B) Pharmacophoric features mapped over most potent molecule.
3.3.2. Evaluation of Pharmacophore Model
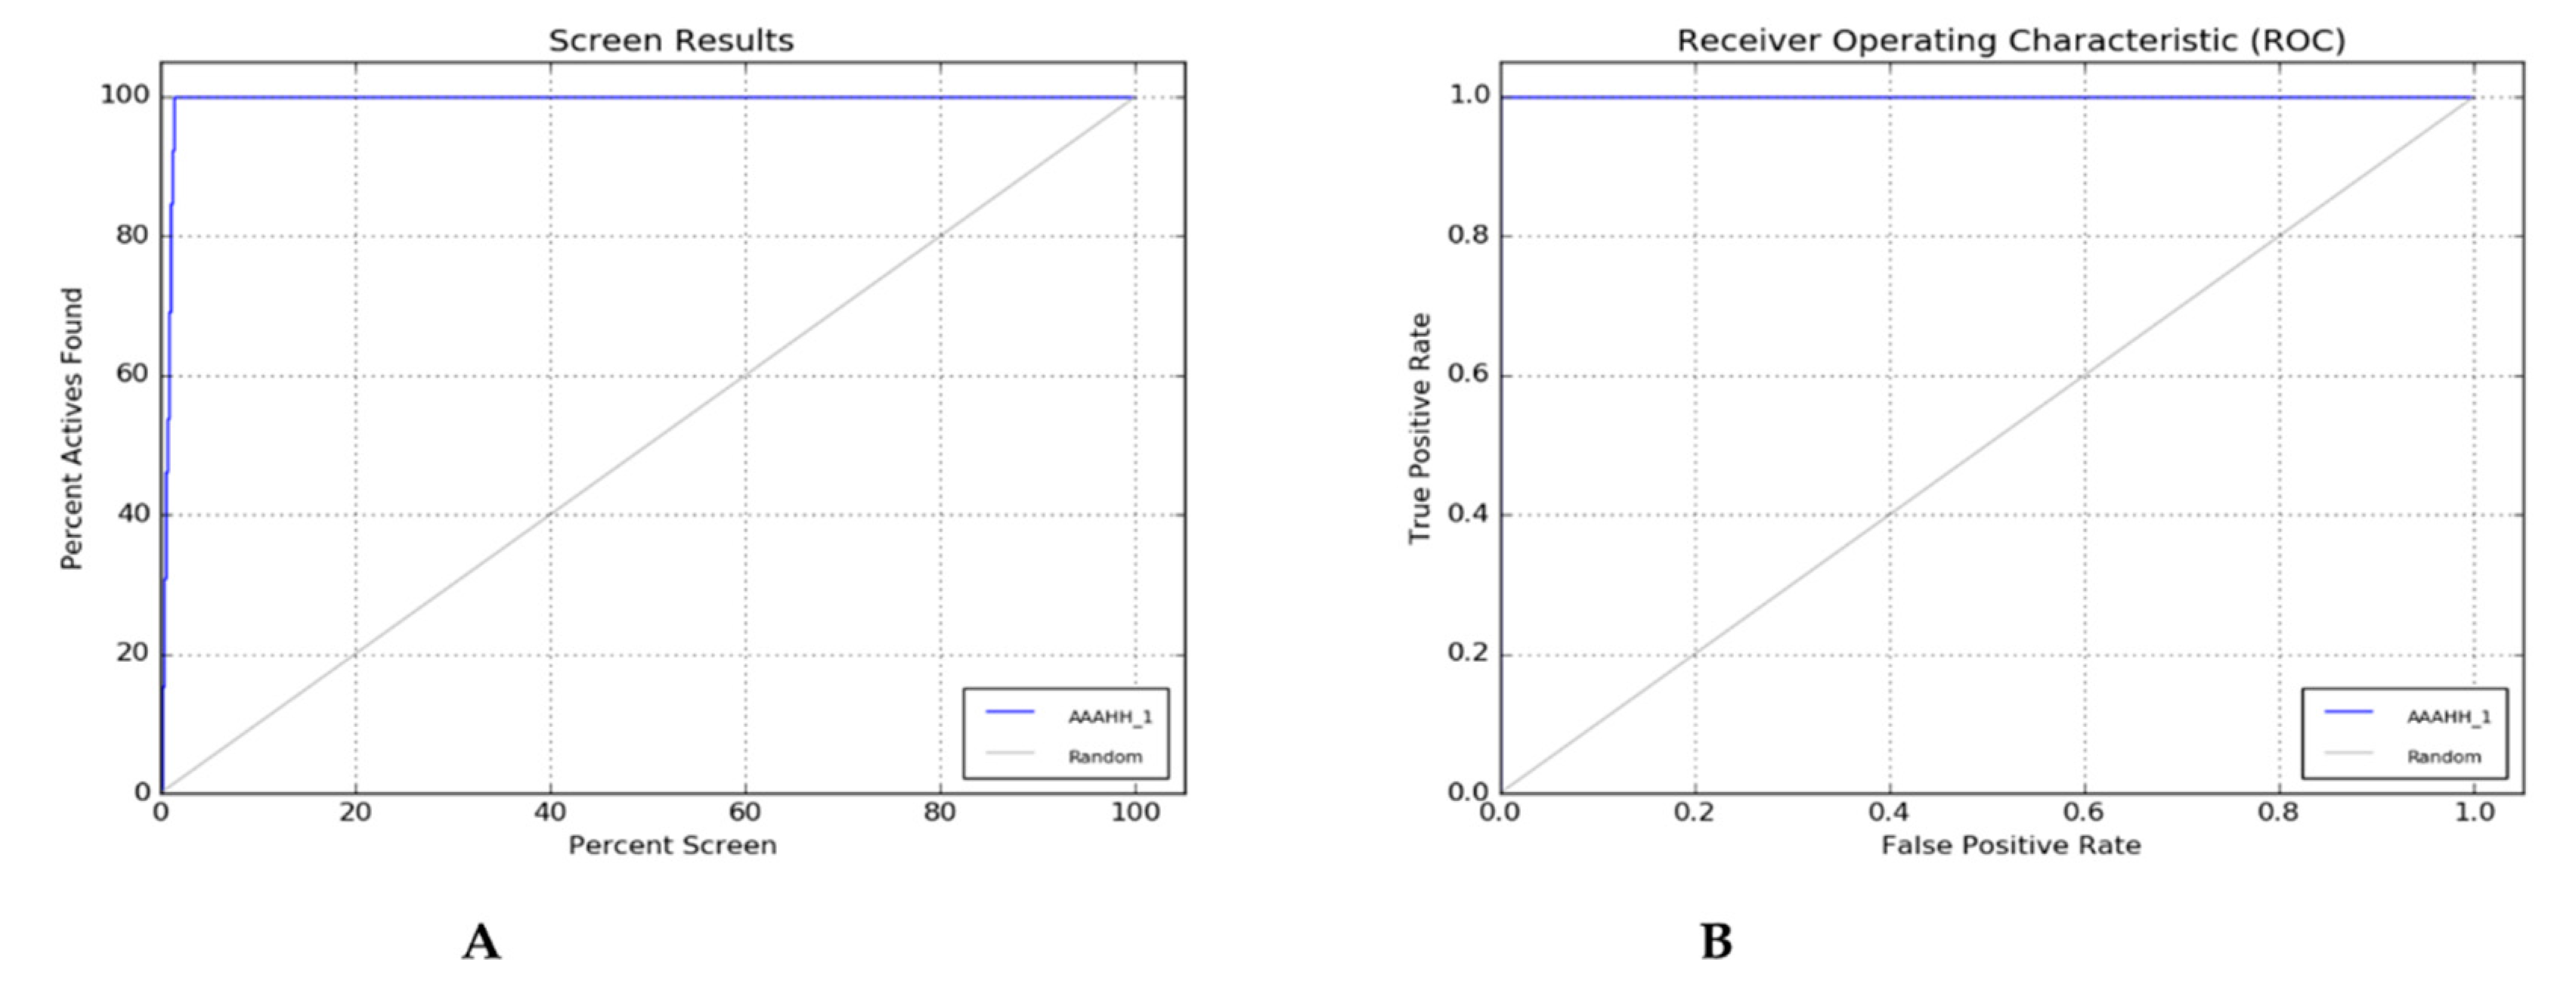
Two evaluation methods—the percent Screen plot (Figure 2A) and the ROC plot (Figure 2B) can be used to rate the effectiveness of a pharmacophore model. The decoy dataset from Dud-E-Database can generated an enrichment report (Table 4) and by the report, we can choose the best hypothesis concerning the highest percentage Enrichment factor, Receiver Operating Characteristics (ROC), Boltzmann Enhance Discrimination (BEDROC value tends to 1) value shown in the report. The percentage of actives recovered was represented by a percentage screen plot whereas the plot between the true positive rate (Sensitivity) and false positive rate (Specificity) was shown by ROC plot at various cut-off points. The test represents its perfect value when not found any overlapping in the two distributions and 100% specificity and 100% sensitivity represent by passing through the left upper corner. The accuracy of the method is represented by the positions of curves in the left upper corner. The method's overall accuracy increases as the curves get closer to the upper left corner. Figure 2 (A) & (B) illustrate how the extreme left corner of the percent screen plot and ROC plot indicates the accuracy of the hypothesis created by the PHASE module [9,10,11].
Figure 2.
(A) Percent Plot; (B) ROC Plot.
3.3.3. Selection of Best Hypothesis
Pharmacophore hypothesis were developed successfully by the PHASE module of Schrodinger Maestro 13.5 software. All the selected compounds from the database (Table 5) were screened to obtain 20 probable common pharmacophore features (Table 3). The accuracy of the generated models was assessed by two evaluating tools: % screen plot and ROC plot. One hypothesis AAAHH_1 was considered as best depending on the phase hypo score, survival score, site score & vector score, and other evaluation parameter. The best hypothesis indicates that five pharmacophoric features are essential for biological activity. These features are 3 “A” hydrogen bond acceptors (A1, A2, A8) & 2 “H” hydrophobic interaction (H11 & H12) were identified from the list of variants. These features are assumed to play crucial roles for the agonistic potencies of compounds towards the target. The field distances between atoms shown in Table 2. The number of molecules contributing to develop the hypothesis, this hypothesis generated by the PHASE module can be considered for designing new molecules for GPR119 receptor.
Table 2.
Pharmacophoric Features and their Distance value in Å.
| S No | Pharmacophoric Features | Distance value(Å) |
|---|---|---|
| 1 | A1-A2 | 2.41 |
| 2 | A2-A8 | 9.54 |
| 3 | A2-H11 | 4.07 |
| 4 | A2-H12 | 10.69 |
| 5 | A2-H1 | 4.07 |
| 6 | A1-H11 | 3.69 |
| 7 | A8-H11 | 6.72 |
| 8 | H12-H11 | 6.12 |
| 9 | A8-H12 | 4.00 |
| 10. | A1-H12 | 10.69 |
Table 3.
Different Pharmacophore Hypotheses generated by the use of compounds and their activity.
| HypoID | Survival | Site | Vector | Volume | Select | Matches | Inactive | Adjusted | BEDROC | RefLig |
|---|---|---|---|---|---|---|---|---|---|---|
| AAAHH_1 | 5.3946 | 0.7779 | 0.9927 | 0.7814 | 1.7287 | 13 | 2.4228 | 2.9718 | 1 | mol_17 |
| AAAHH_2 | 5.2944 | 0.8044 | 0.9855 | 0.7594 | 1.6312 | 13 | 2.5041 | 2.7903 | 1 | mol_20 |
| AAAHH_3 | 5.2618 | 0.7882 | 0.9347 | 0.6988 | 1.7261 | 13 | 2.2126 | 3.0493 | 1 | mol_17 |
| AAAHH_4 | 5.253 | 0.7698 | 0.9365 | 0.7848 | 1.6479 | 13 | 2.3528 | 2.9002 | 1 | mol_17 |
| AAHHR_1 | 5.2477 | 0.7744 | 0.9414 | 0.7765 | 1.6415 | 13 | 2.3569 | 2.8908 | 0.9931 | mol_17 |
| AAAHH_5 | 5.1913 | 0.6764 | 0.9892 | 0.7173 | 1.6945 | 13 | 2.3577 | 2.8336 | 1 | mol_22 |
| AAAHH_6 | 5.1495 | 0.7862 | 0.94 | 0.7606 | 1.5487 | 13 | 2.3536 | 2.7959 | 0.9904 | mol_17 |
| AAHHR_2 | 5.0008 | 0.6268 | 0.9029 | 0.7229 | 1.6342 | 13 | 2.2504 | 2.7504 | 0.9921 | mol_22 |
| AAAHH_7 | 4.9879 | 0.624 | 0.8993 | 0.7307 | 1.6199 | 13 | 2.2514 | 2.7365 | 1 | mol_22 |
| AAAHH_8 | 4.9717 | 0.646 | 0.8671 | 0.649 | 1.6956 | 13 | 2.0455 | 2.9262 | 1 | mol_22 |
| AHHR_1 | 5.105 | 0.8134 | 0.9733 | 0.7349 | 1.4695 | 13 | 2.4748 | 2.6302 | 0.9905 | mol_17 |
| AAHH_1 | 4.9845 | 0.7561 | 0.9911 | 0.7806 | 1.3427 | 13 | 2.3871 | 2.5974 | 0.9877 | mol_17 |
| AAAH_1 | 4.9729 | 0.7905 | 0.9932 | 0.7698 | 1.3055 | 13 | 2.4231 | 2.5498 | 0.9841 | mol_17 |
| AAHR_1 | 4.9621 | 0.895 | 0.9331 | 0.7866 | 1.2334 | 13 | 2.5203 | 2.4418 | 0.9921 | mol_16 |
| AHHR_2 | 4.9615 | 0.7616 | 0.9936 | 0.7745 | 1.318 | 13 | 2.3892 | 2.5723 | 0.9559 | mol_17 |
| AAHH_2 | 4.9532 | 0.7897 | 0.9802 | 0.756 | 1.3134 | 13 | 2.3886 | 2.5646 | 1 | mol_20 |
| AAAH_2 | 4.9382 | 0.9702 | 0.9755 | 0.7484 | 1.1301 | 13 | 2.6184 | 2.3198 | 0.9987 | mol_16 |
| AAHH_3 | 4.9378 | 0.8127 | 0.9804 | 0.742 | 1.2888 | 13 | 2.4926 | 2.4453 | 1 | mol_17 |
| AAHH_4 | 4.9127 | 0.8759 | 0.9926 | 0.7566 | 1.1737 | 13 | 2.5978 | 2.3149 | 0.9959 | mol_19 |
| AAHH_5 | 4.9002 | 0.7756 | 0.9914 | 0.7562 | 1.2631 | 13 | 2.385 | 2.5152 | 0.9599 | mol_17 |
Table 4.
Enrichment report of Pharmacophore Hypothesis.
| +++ | Phase Hypo Score | EF1% | BEDROC | Matches |
|---|---|---|---|---|
| AAAHH_1 | 1.32 | 77.92 | 1 | 5 of 5 |
| AAAHH_2 | 1.32 | 77.92 | 1 | 5 of 5 |
| AAAHH_3 | 1.32 | 77.92 | 1 | 5 of 5 |
| AAAHH_4 | 1.32 | 77.92 | 1 | 5 of 5 |
| AAAHH_5 | 1.31 | 77.92 | 1 | 5 of 5 |
| AAHHR_1 | 1.31 | 70.13 | 0.97 | 5 of 5 |
| AAAHH_6 | 1.3 | 70.13 | 0.97 | 5 of 5 |
| AAAHH_7 | 1.3 | 77.92 | 1 | 5 of 5 |
| AAAHH_8 | 1.3 | 77.92 | 1 | 5 of 5 |
| AAHH_2 | 1.3 | 77.92 | 1 | 4 of 4 |
| AHHR_1 | 1.3 | 70.13 | 0.97 | 4 of 4 |
| AAHH_3 | 1.3 | 77.92 | 1 | 4 of 4 |
| AAAH_2 | 1.29 | 77.92 | 1 | 4 of 4 |
| AAHHR_2 | 1.29 | 77.92 | 0.98 | 5 of 5 |
| AAHH_4 | 1.29 | 77.92 | 0.99 | 4 of 4 |
| AAHR_1 | 1.29 | 77.92 | 0.98 | 4 of 4 |
| AAHH_1 | 1.29 | 70.13 | 0.96 | 4 of 4 |
| AAAH_1 | 1.28 | 70.13 | 0.95 | 4 of 4 |
| AAHH_5 | 1.25 | 62.34 | 0.87 | 4 of 4 |
| AHHR_2 | 1.25 | 62.34 | 0.89 | 4 of 4 |
3.4. 3D-Quantitative Structure Activity Relationship (3D-QSAR)
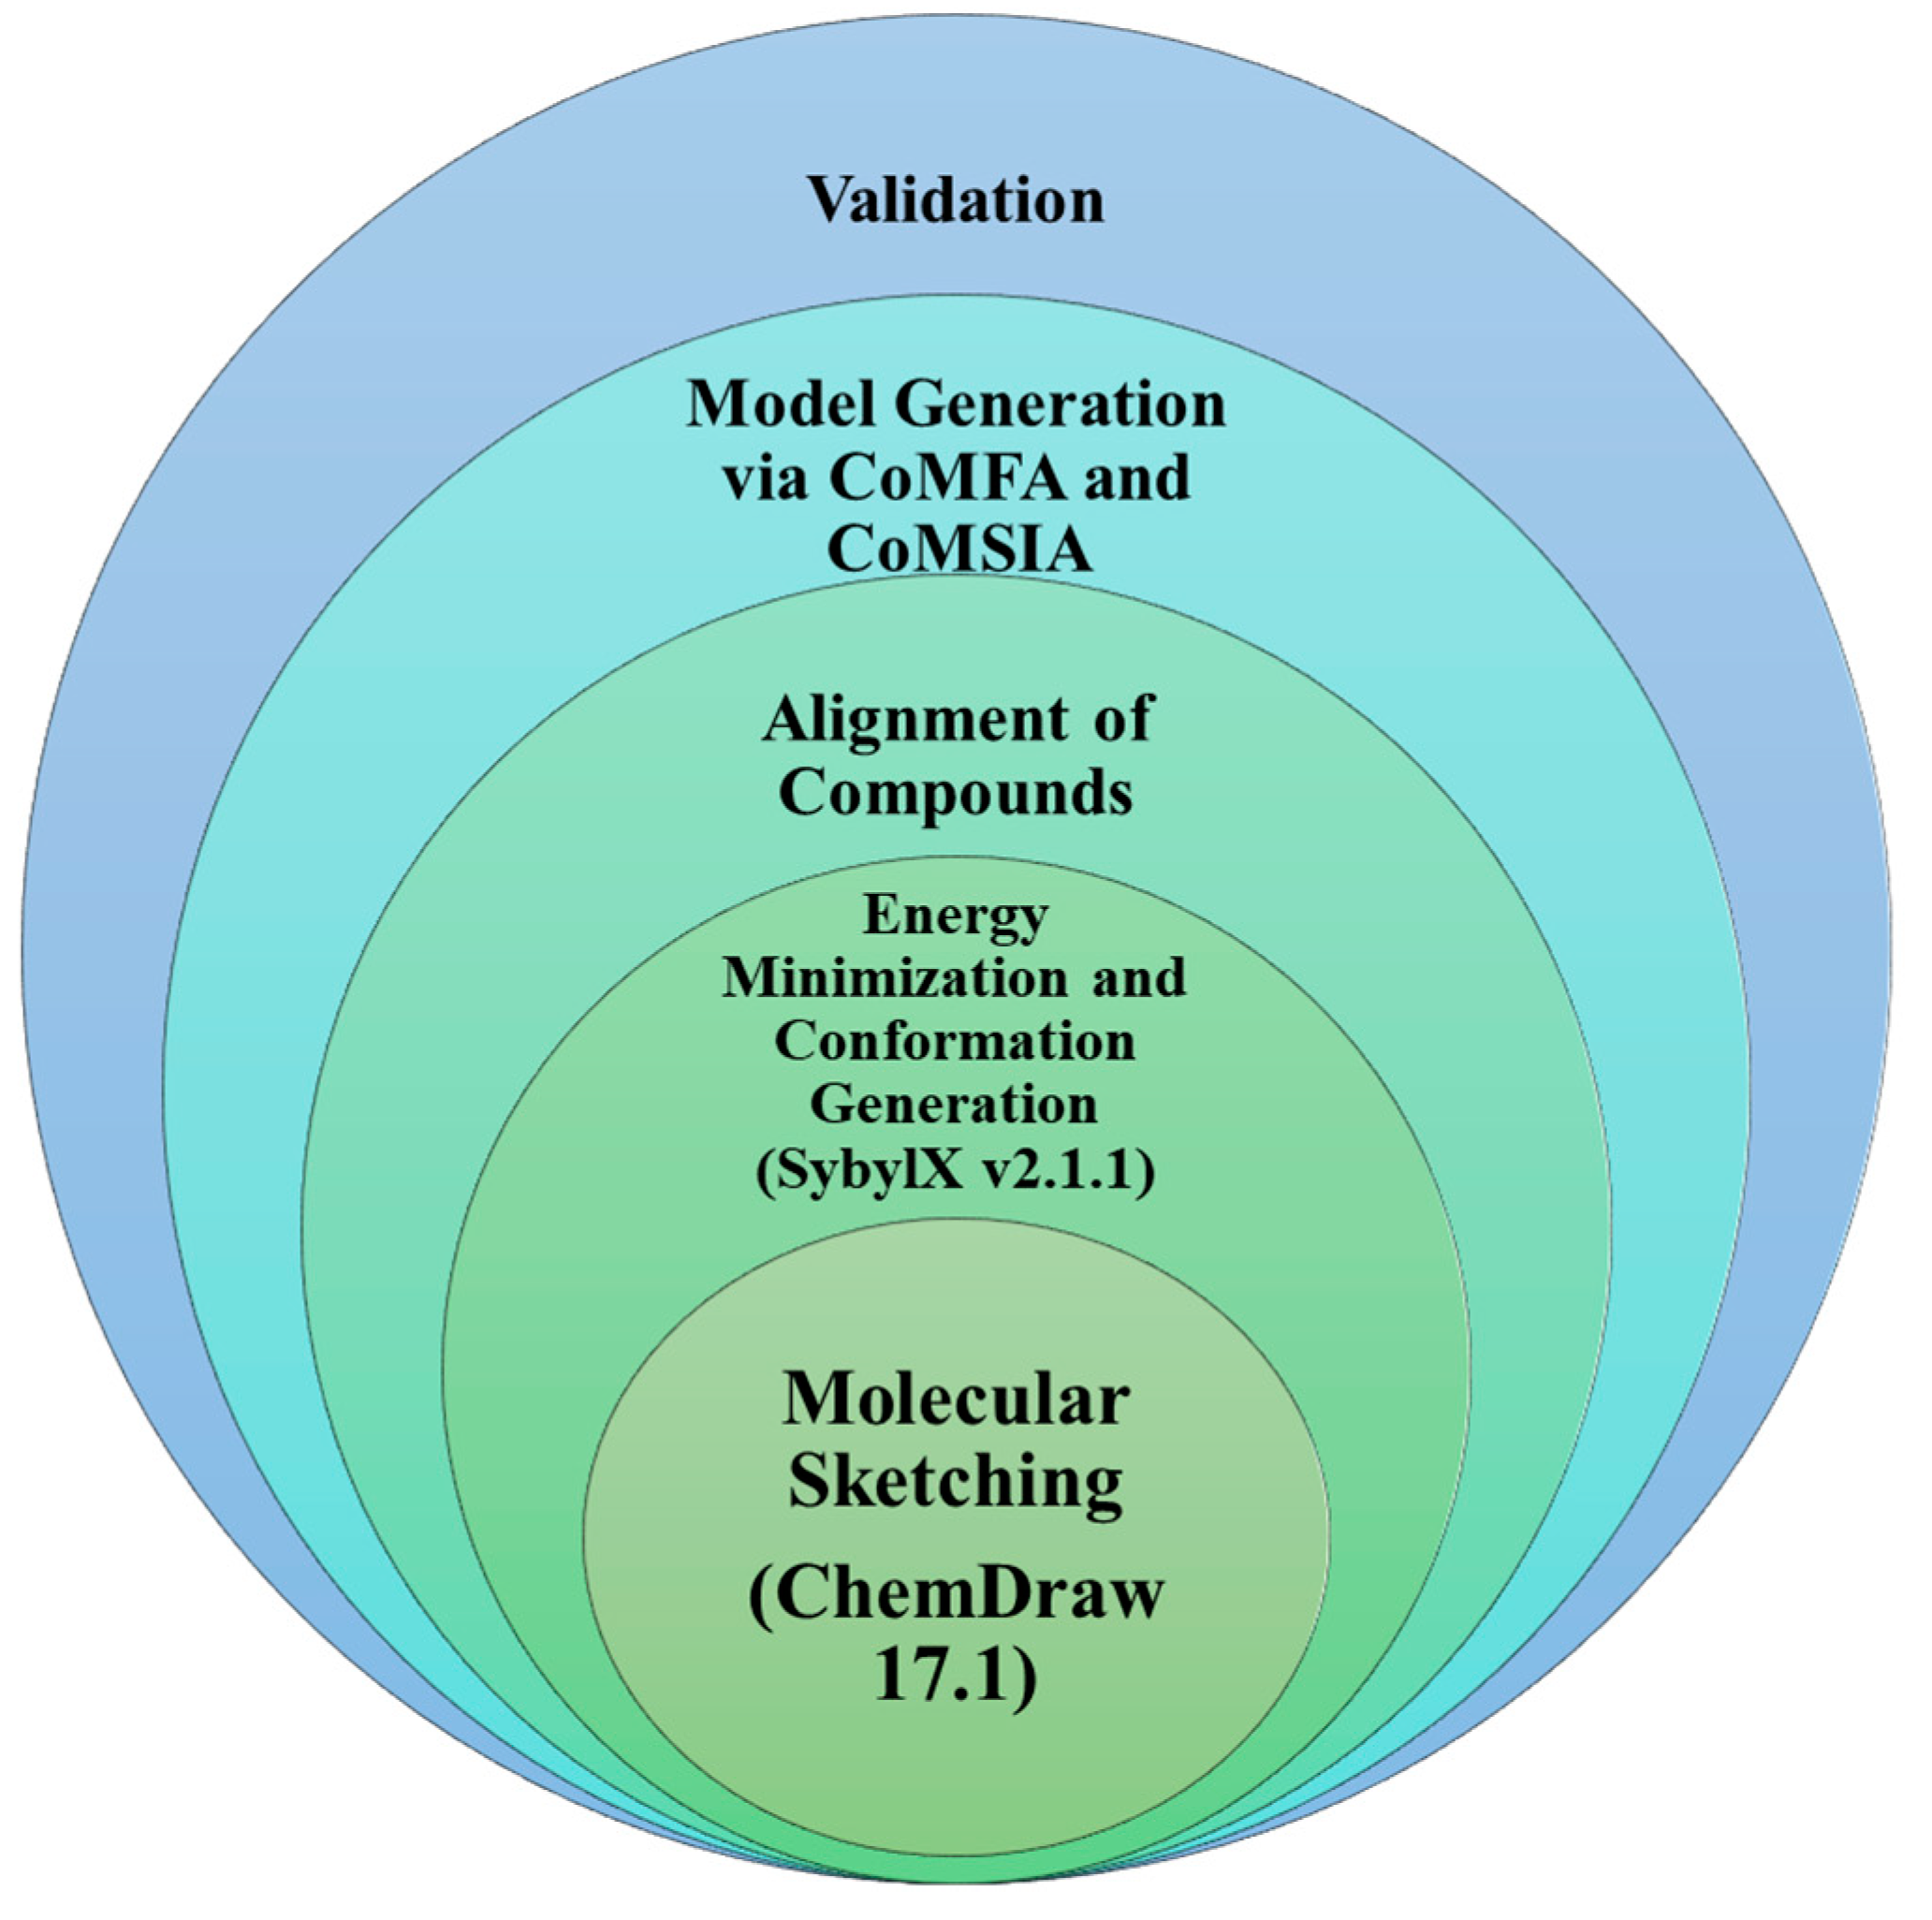
To establish robust predictive models for gauging the biological activities of novel chemical compounds, Quantitative Structure-Activity Relationship (QSAR) techniques are employed. QSAR serves to establish correlations between the physicochemical characteristics of substances and their biological responses, whether observed in vitro or in vivo. Within the domain of 3D QSAR methods, diverse approaches such as Comparative Molecular Field Analysis (CoMFA), Comparative Molecular Similarity Index Analysis (CoMSIA), Atom-based 3D-QSAR, and Field-based QSAR are utilized. These methodologies enable the exploration of how various factors such as steric effects, electrostatic properties, the presence of hydrogen bond donors, acceptors, and hydrophobic interactions influence the observed biological activities of chemical entities. This process further utilized for the development of novel GPR119 agonists as anti-diabetic drugs. We gathered datasets comprising known activity data associated with G-Protein Coupled Receptor 119 (GPR119) agonistic effects, quantified in terms of EC50 values measured in nanomolar units (nM). These datasets were compiled from research articles and served as the foundation for constructing 3D-QSAR models. The process involved in conducting the 3D-QSAR studies is delineated in Figure 3, encompassing various essential steps and methodologies employed for model development and analysis [12,13,14,15,16,17,18,19,20,21].
Figure 3.
Steps involved in the 3D-QSAR studies.
3.4.1. Selection of Series for 3D-QSAR Studies
In our study, we focused on Indolinylpyrimidine derivatives containing the Pyrimidine nucleus, which exhibited GPR119 agonist activity. We meticulously curated a dataset comprising 35 such Pyrimidine derivatives. The biological activity of these compounds was originally reported in the literature as EC50 values, expressed in nanomolar (nM) concentrations. To facilitate our quantitative structure-activity relationship (QSAR) investigations, we systematically converted all these biological activity values (EC50) into molar units and subsequently transformed them into their negative logarithmic representation, denoted as pEC50 values (refer to Table 5). These pEC50 values were employed as the dependent variable in our QSAR analysis, forming a crucial component of the study to establish meaningful relationships between chemical structures and biological activity[7,8].
Table 5.
Representation of structure and their activity.
| S. No | Name | Chemical Structure | EC50(nM) | pEC50 |
|---|---|---|---|---|
| 1 | 1.mol | 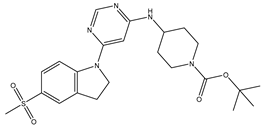 |
300 | -2.47712 |
| 2 | 2.mol | 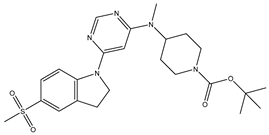 |
21 | -1.32222 |
| 3 | 3.mol | 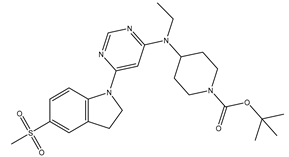 |
14 | -1.14613 |
| 4 | 4.mol | 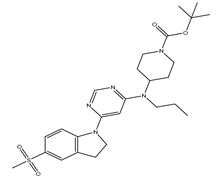 |
18 | -1.25527 |
| 5 | 5.mol | 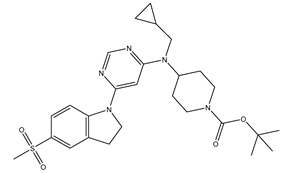 |
51 | -1.70757 |
| 6 | 6.mol | 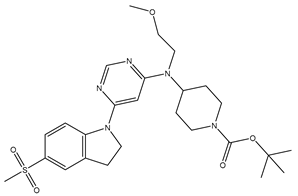 |
29 | -1.4624 |
| 7 | 7.mol | 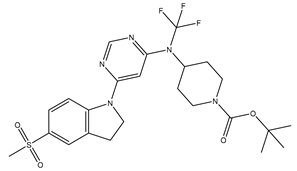 |
2.5 | -0.39794 |
| 8 | 8.mol | 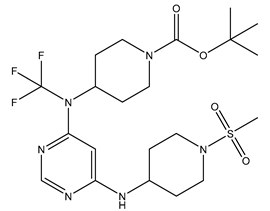 |
43 | -1.63347 |
| 9 | 9.mol | 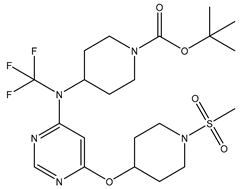 |
3.6 | -0.5563 |
| 10 | 10.mol | 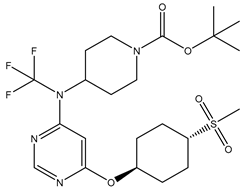 |
270 | -2.43136 |
| 11 | 11.mol | 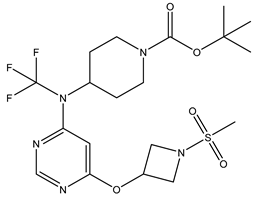 |
7100 | -3.85126 |
| 12 | 12.mol | 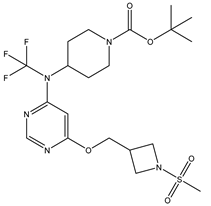 |
960 | -2.98227 |
| 13 | 13.mol | 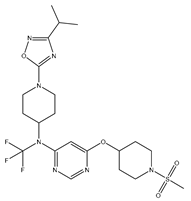 |
2.7 | -0.43136 |
| 14 | 14.mol | 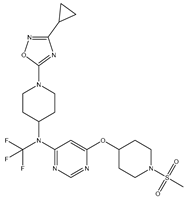 |
5.4 | -0.73239 |
| 15 | 15.mol | 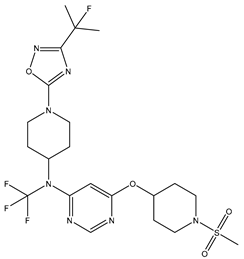 |
4.6 | -0.66276 |
| 16 | 16.mol | 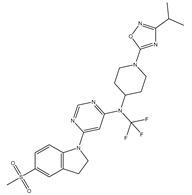 |
2.9 | -0.4624 |
| 17 | 17.mol | 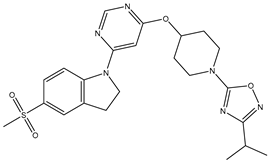 |
7.7 | -0.88649 |
| 18 | 18.mol | 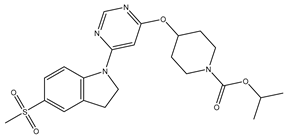 |
17 | -1.23045 |
| 19 | 19.mol |  |
3.2 | -0.50515 |
| 20 | 20.mol | 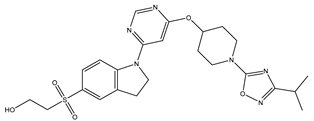 |
41 | -1.61278 |
| 21 | 21.mol | 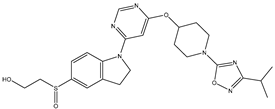 |
48 | -1.68124 |
| 22 | 22.mol | 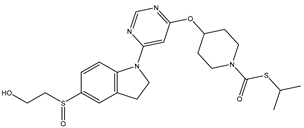 |
14 | -1.14613 |
| 23 | 23.mol | 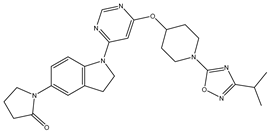 |
33 | -1.51851 |
| 24 | 24.mol |  |
17 | -1.23045 |
| 25 | 25.mol | 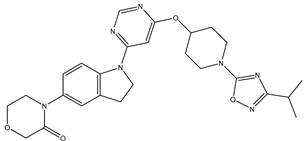 |
15 | -1.17609 |
| 26 | 26.mol | 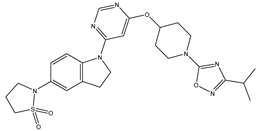 |
9.7 | -0.98677 |
| 27 | 27.mol | 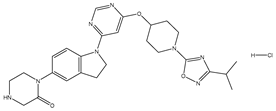 |
36 | -1.5563 |
| 28 | 28.mol | 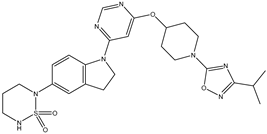 |
24 | -1.38021 |
| 29 | 29.mol | 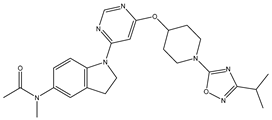 |
75 | -1.87506 |
| 30 | 30.mol | 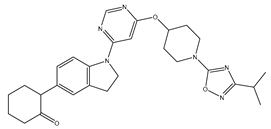 |
48 | -1.68124 |
| 31 | 31.mol | 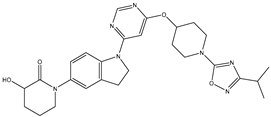 |
17 | -1.23045 |
| 32 | 32.mol | 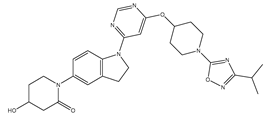 |
89 | -1.94939 |
| 33 | 33.mol | 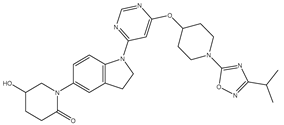 |
90 | -1.95424 |
| 34 | 34.mol | 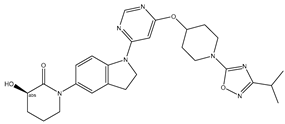 |
25 | -1.39794 |
| 35 | 35.mol |  |
16 | -1.20412 |
3.4.2. Generation of CoMFA and CoMSIA model
All the structures in the above dataset were sketched in ChemDraw 17.1 software and saved in mol format. To get best conformers of each molecule the Sybyl-X v2.1.1 software was used for energy minimization. The energy minimizations were done using Tripos force field and the Powell gradient algorithm with a convergence criterion of 0.005 or 0.05 kcal/(mol*Å) and maximum iteration count of 10000. The partial atomic charges were calculated using Gasteiger-Huckel method.
3.4.2.1. Alignment of compounds
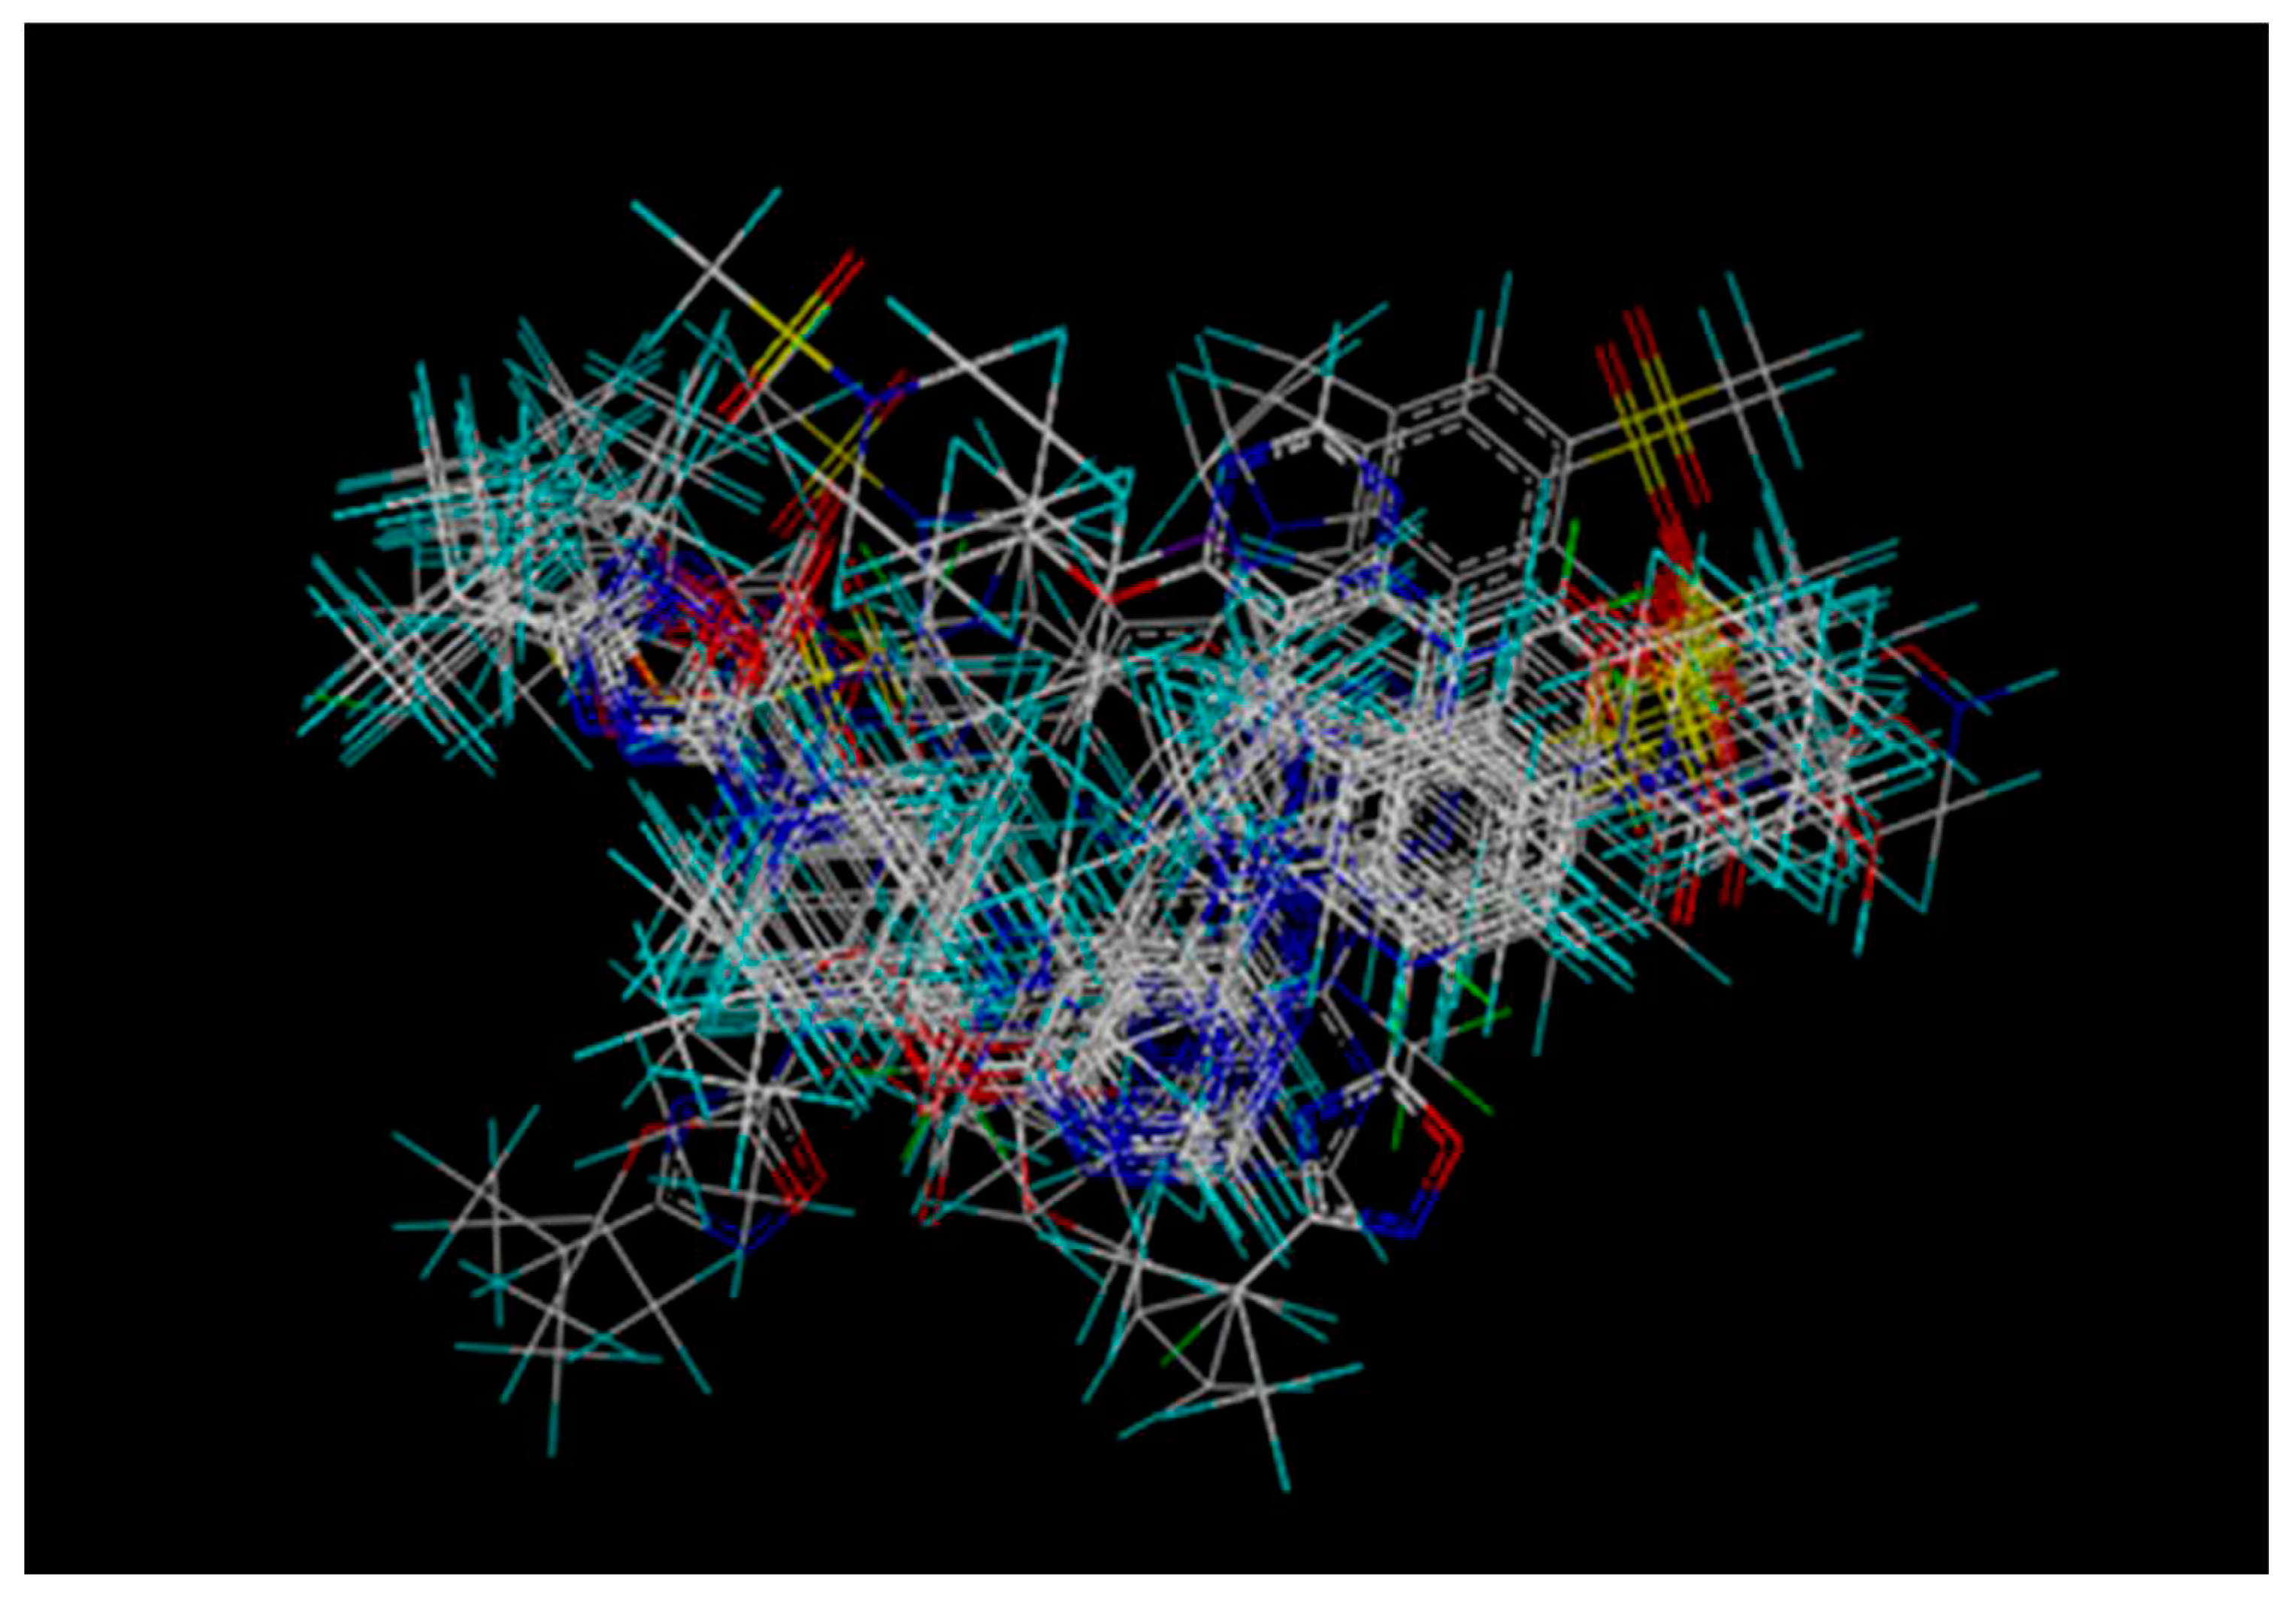
Bioactive conformations and molecular alignment are two vital parameters to construct more reliable CoMFA and CoMSIA models. First, an initial geometry optimization was performed using Powell method (The Tripos force field, Gasteriger- Huckel charge, 10000 iterations and an energy convergence cut-off of 0.001 kcal.mol). Next simulated annealing was conducted by heating at an initial temperature of 1000K for 1000fs and then cooling to 250K within 1500 fs of annealing time. The exponential annealing function was utilized, and 100 cycle were conducted. Next, the conformations at 250-300 K were calculated hierarchical clustering in the advance CoMFA module. The lowest energy conformers in each larger cluster were selected for further minimization as described above. Finally, all minimized conformers were superimposed by Sybyl X-2.1.1 Matchfit function, and the most similar conformers to the others was chosen as a template. In the present study only Distill Rigid alignment type were used and represented in Figure 4 [12,13,14,15,16,17,18,19].
Figure 4.
Representation of Distill Rigid Alignment.
3.4.2.2. Descriptors Calculation, 3D-QSAR Model development
3D-QSAR models (CoMFA and CoMSIA) were developed using the ‘QSAR Tools’ module in the Sybyl-X v2.1.1 software package.
- A. Dataset Division
A dataset of thirty-five Indolinylpyrimidine derivatives (Table 5), screened according to the same pharmacological protocol, were selected from literature. All the compounds have been built, parameterized (Gasteiger-Huckel method) and energy minimized within MOE using MMFF94 forcefield. In every model generation the compounds in the datasets were randomly divided into the training set (70% of total number of compounds) for model generation, and the test set (30% of the total number of compounds) to verify the external predictive ability of the model (Table 6).
- B. CoMFA method
In a final model, the training set contained many molecules, whereas the test set comprised few compounds. The CoMFA method steric and electrostatic fields were calculated using Lennard-Jones and Coulombic potentials respectively. A 3D cubic lattice having a grid spacing of 2.0 Å, was generated automatically to surround the aligned molecules in all directions. These grid points were generated using the Tripos force field, a sp3 carbon atom probe with a Van der Waals radius of 1.52 Å, and a charge of +1.00 (default probe atom in Sybyl-X v2.1.1) to calculate various steric and electrostatic fields. The default energy cut off for steric and electrostatic fields was 30 kcal/mol [12,13,14,15,16,17,18,19].
Table 6.
Division of Training set and Test set.
| Model | CoMFA | CoMSIA | ||
| Training Set | Test Set | Training Set | Test Set | |
| 70% | 30% | 70% | 30% | |
- C. CoMSIA method
In this study, the CoMSIA model was creating using Sybyl X v2.1.1, and the attenuation factors was set to the default value of 0.3. The sp3- Hybridized carbon atom with +1.0 probe charge, A total of five descriptors (i.e., steric, electrostatic, hydrophobic, hydrogen bond donor, and hydrogen bond acceptor fields) were calculated in CoMSIA method. The CoMSIA model was obtained with the use of the partial least square (PLS) technique. In this calculation, the CoMSIA field were used as independent variable, whereas value of the pEC50 of each compound were treated as dependent variables.
3.4.3. Internal validation and partial least squares (PLS) analysis
In our study, we employed the Partial Least Squares (PLS) approach, an extension of multiple regression analysis, on the training dataset. This analysis aimed to establish correlations between the QSAR models (CoMFA and CoMSIA) and biological activity. To assess the predictive performance of our models and identify the optimal number of components yielding the highest cross-validated r2 (r2cv), we utilized the leave-one-out (LOO) cross-validation method. In LOO cross-validation, one compound is systematically removed from the dataset, and a model is constructed using the remaining compounds. This model is then used to predict the activity of the omitted molecule. The process is repeated for each compound, allowing us to assess the overall predictive power of our model. The optimal number of components obtained from this cross-validation procedure was subsequently employed in the subsequent regression model, ensuring its reliability and predictive accuracy. Final CoMFA and CoMSIA model were generated using non-cross-validation PLS analysis. To further assess the statistical confidence and robustness of the derived models, a 100-cycle bootstrap analysis was performed. This procedure in which n random selections out of the original set of n object are performed several times (100 times). The mean correlation coefficient is represented as bootstrap r2 (r2boot) [12,13,14,15,16,17,18,19].
3.4.4. CoMFA and CoMSIA Contour Maps
The region in the space where the aligned molecules would interact with the receptor positively or unfavourably is indicated on the CoMFA contour map. The CoMSIA contour maps denote those areas within the specified region where the presence of a group with a particular physic-chemical property will be favoured or disfavoured for biological activity. Thus, it is clear that biological activity will be greater when there is more steric bulk near green, less steric bulk near yellow, more positive charge near blue and more negative charge near red (Figure 5). The CoMSIA steric and electrostatic contour maps were both similar to the CoMFA contour maps discussed above. In CoMSIA hydrogen bond donor contour map, donor bulk near cyan is favourable but donor bulk near purple is unfavourable for greater biological activity. For the hydrogen bond acceptor contour map, acceptor bulk near magenta is desired and acceptor bulk undesired near red for improved biological activity. In hydrophobic contour map, hydrophobicity desired near yellow and hydrophobicity is undesired near white areas for better biological activity (Figure 7).
Figure 5.
Contour Map analysis of CoMFA study were (A) Green contours represent regions with favourable steric fields, while the yellow contours represent the regions indicating unfavourable steric fields. Moreover, (B) The blue and red contours highlight the positions where electropositive groups and electronegative groups would be favourable, respectively.
3.4.5. Model development
A) QSAR (CoMFA AND CoMSIA) Models Developed
We assembled a dataset comprising a total of 35 compounds retrieved from a previously known database. These compounds were collectively utilized for the purpose of generating a Quantitative Structure-Activity Relationship (QSAR) model. The selection of the best-performing model was based on a comprehensive assessment of various statistical parameters, as detailed in Table 7, Table 8 and Table 9. Consequently, the model demonstrating the most favourable statistical characteristics and predictive capabilities was chosen for further investigations and subsequent studies.
Table 7.
Results of different CoMFA and CoMSIA models developed using GPR119 agonistic values with all datasets.
Table 7.
Results of different CoMFA and CoMSIA models developed using GPR119 agonistic values with all datasets.
| GPR119 Agonist | |||||||
|---|---|---|---|---|---|---|---|
| Dataset | Na | Energy minimization parameters | Alignment | Training Test: set | Internal Validation Parameters | ||
| CoMFA | CoMSIA | ||||||
| 1-35 | 35 | Max. Iteration =10000; Gradient= 0.005 |
Distil Rigid | 7:3 | q2=0.59 r2=0.98 SEE=0.1755 ONC=3 |
q2=0.4; r2=0.987; SEE=0.1425; ONC=3 |
|
a number of compounds in datasets. .
B) Observations of Generated Model
In case of CoMFA method a combination of steric and electrostatic fields having q2= 0.59, r2= 0.98, SEE= 0.1755 and ONC= 3 was used. On the other hand, in CoMSIA method a combination of five fields i.e., steric, electrostatic, hydrophobic, hydrogen bond donor and hydrogen bond acceptor having q2= 0.4, r2= 0.987, SEE= 0.1425 and ONC= 3 were used.
C) CoMFA Model generation result analysis and validation
The experimental versus predicted pEC50 value for CoMFA and CoMSIA test set and training set represented in Figure 6 and Figure 8. As an additional method of validation, a scrambling stability test was performed. This test was carried out to find an ideal number of components and check whether the CoMFA and CoMSIA model is sensitive to small perturbations applied to the data (Table 8 and 9). The selection of best QSAR model has been used for the designing of the new compounds and further activity will be check via molecular docking analysis.
Table 8.
Summary of CoMFA PLS Results of Indolinylpyrimidine Derivatives.
| Statistical parameters | Results |
|---|---|
| NO Validate | |
| r² | 0.642 |
| Number of components | 3 |
| Standard error of estimate | 0.456 |
| F-values | 18.555 |
| (LOO) leave-one-out | |
| Cross-validate r² (q²) | 0.056 |
| Standard error of prediction | 0.772 |
| Cross validate | |
| r² (cv) | 0.183 |
| Standard error of estimate | 0.316 |
| Bootstrap | |
| r² (bs) | 0.546 |
| Standard error of estimation (bs) | 0.522 |
| Scrambling | |
| Q**² | -10.59 |
| cSDEP | 2.55 |
| dq**² / dr² yy’ | 17.83 |
| Fraction | |
| Steric | 1.536 |
| Electrostatic | 2.599 |
Table 9.
Summary of CoMSIA PLS Results of Indolinylpyrimidine Derivatives.
| Statistical parameters | Results |
|---|---|
| NO Validate | |
| r² | 0.725 |
| Number of components | 3 |
| Standard error of estimate | 0.400 |
| F-values | 27.229 |
| (LOO) leave-one-out | |
| Cross-validate r² (q²) | 0.362 |
| Standard error of prediction | 0.608 |
| Cross Validate | |
| r² (cv) | 0.386 |
| Standard error of estimate | 0.242 |
| Bootstrap | |
| r² (bs) | 0.777 |
| Standard error of estimation (bs) | 0.366 |
| Scrambling | |
| Q**² | -1.057802 |
| cSDEP | 1.0567714 |
| dq**² / dr² yy’ | 5.024658 |
| Fraction | |
| Steric | 0.047 |
| Electrostatic | 0.199 |
| Hydrophobic | 0.147 |
| Hydrogen bond acceptor | 0.177 |
| Hydrogen bond donor | 0.047 |
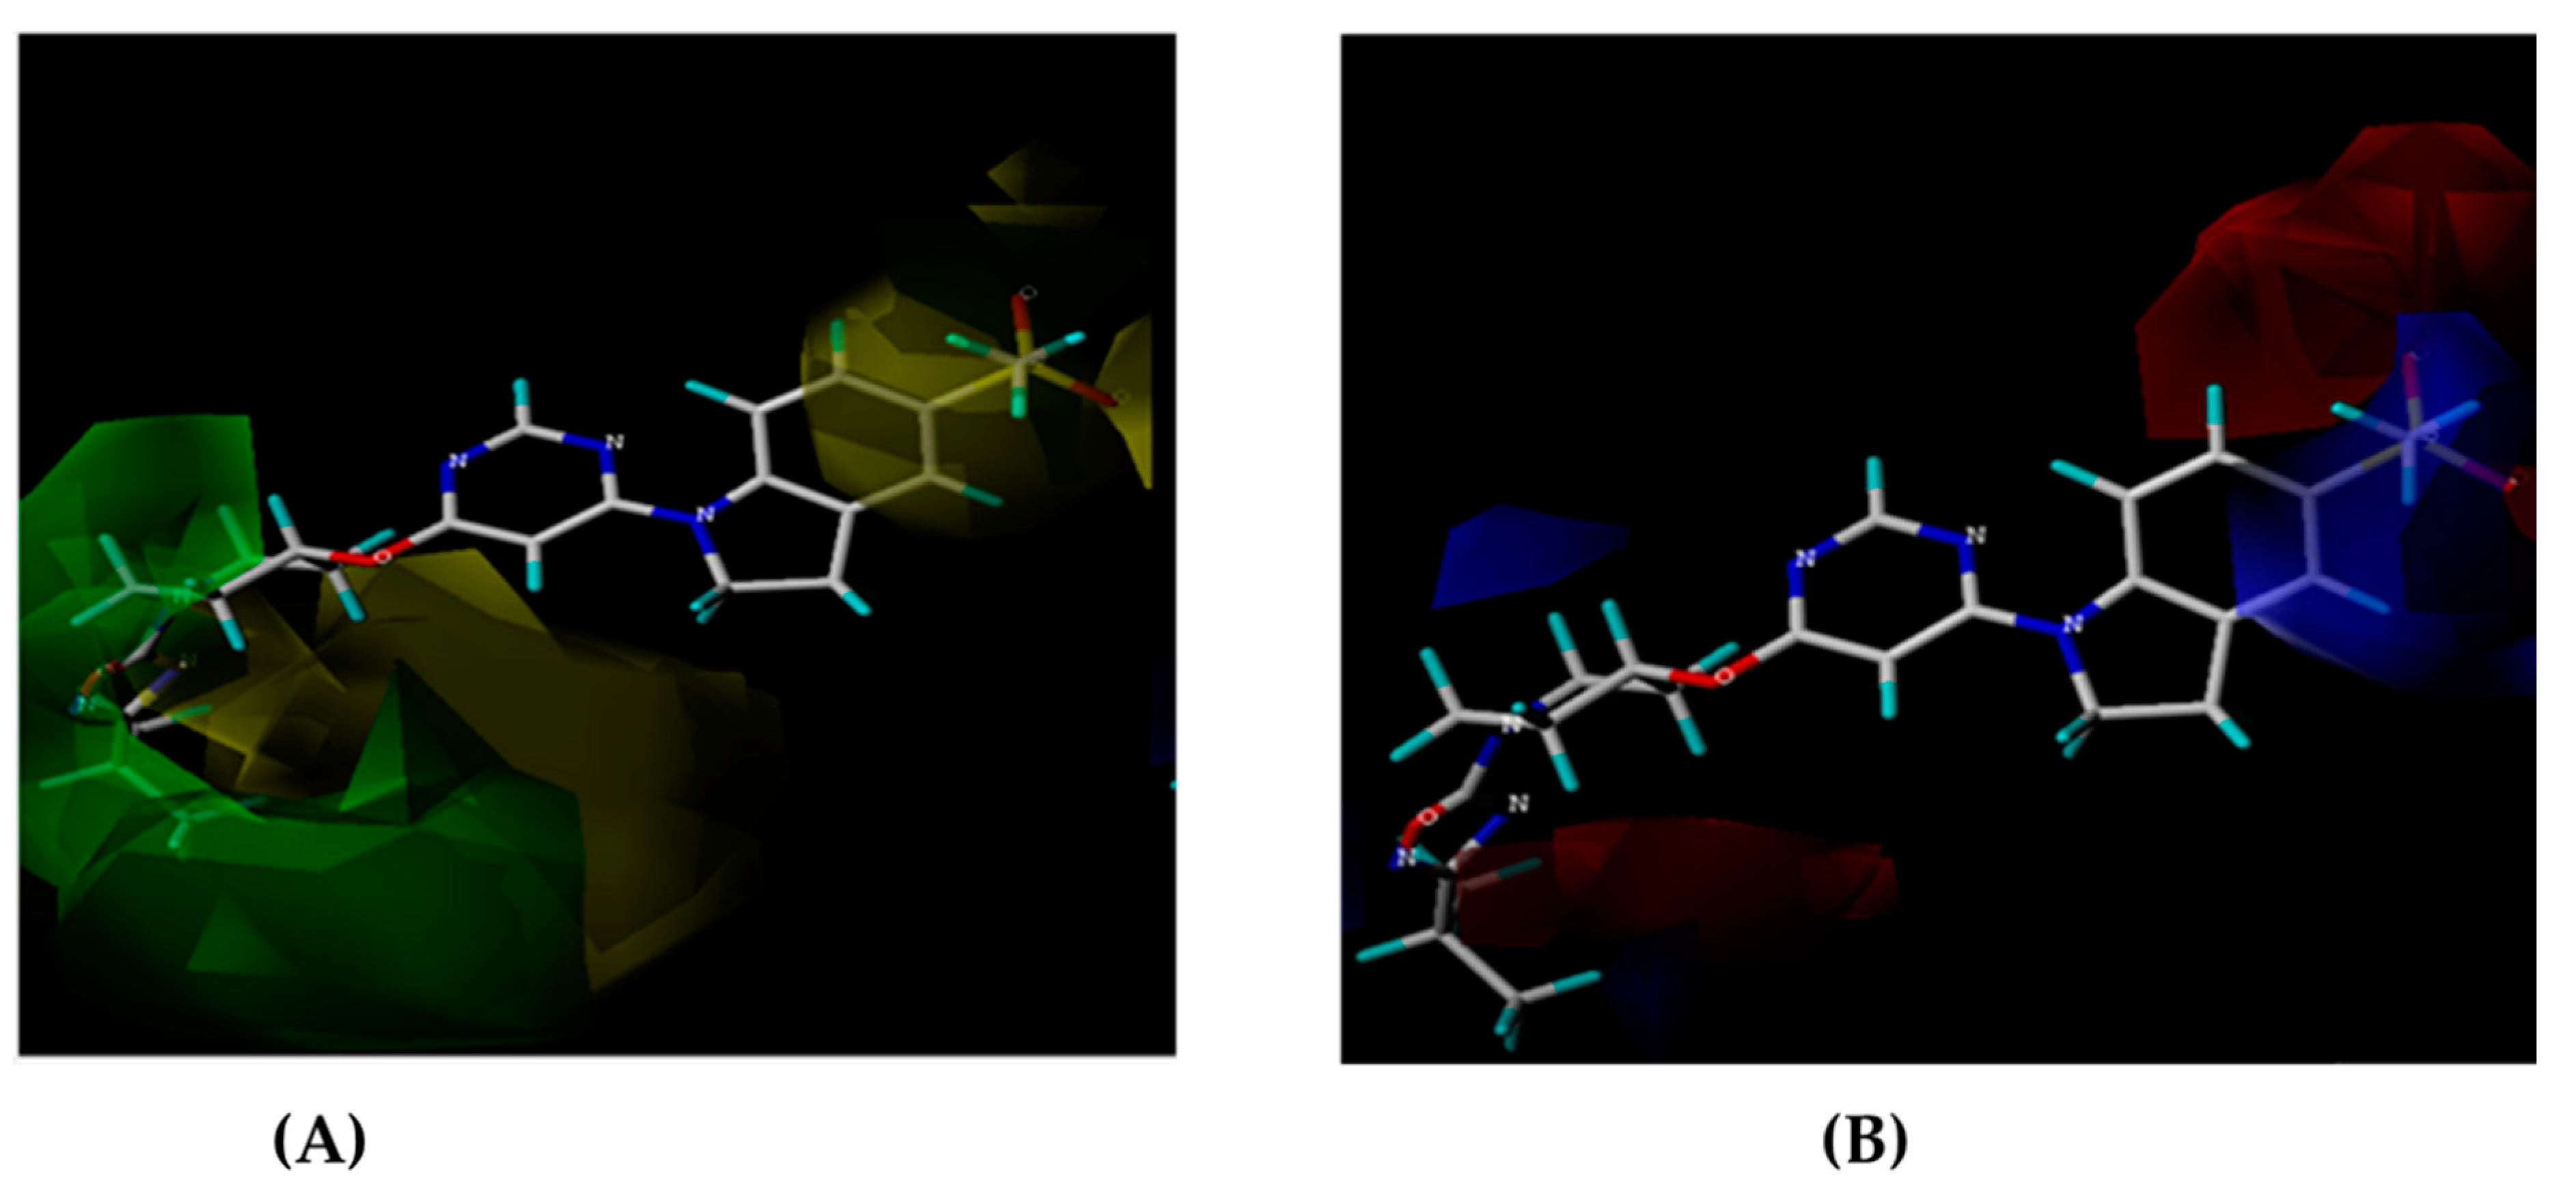
Figure 6.
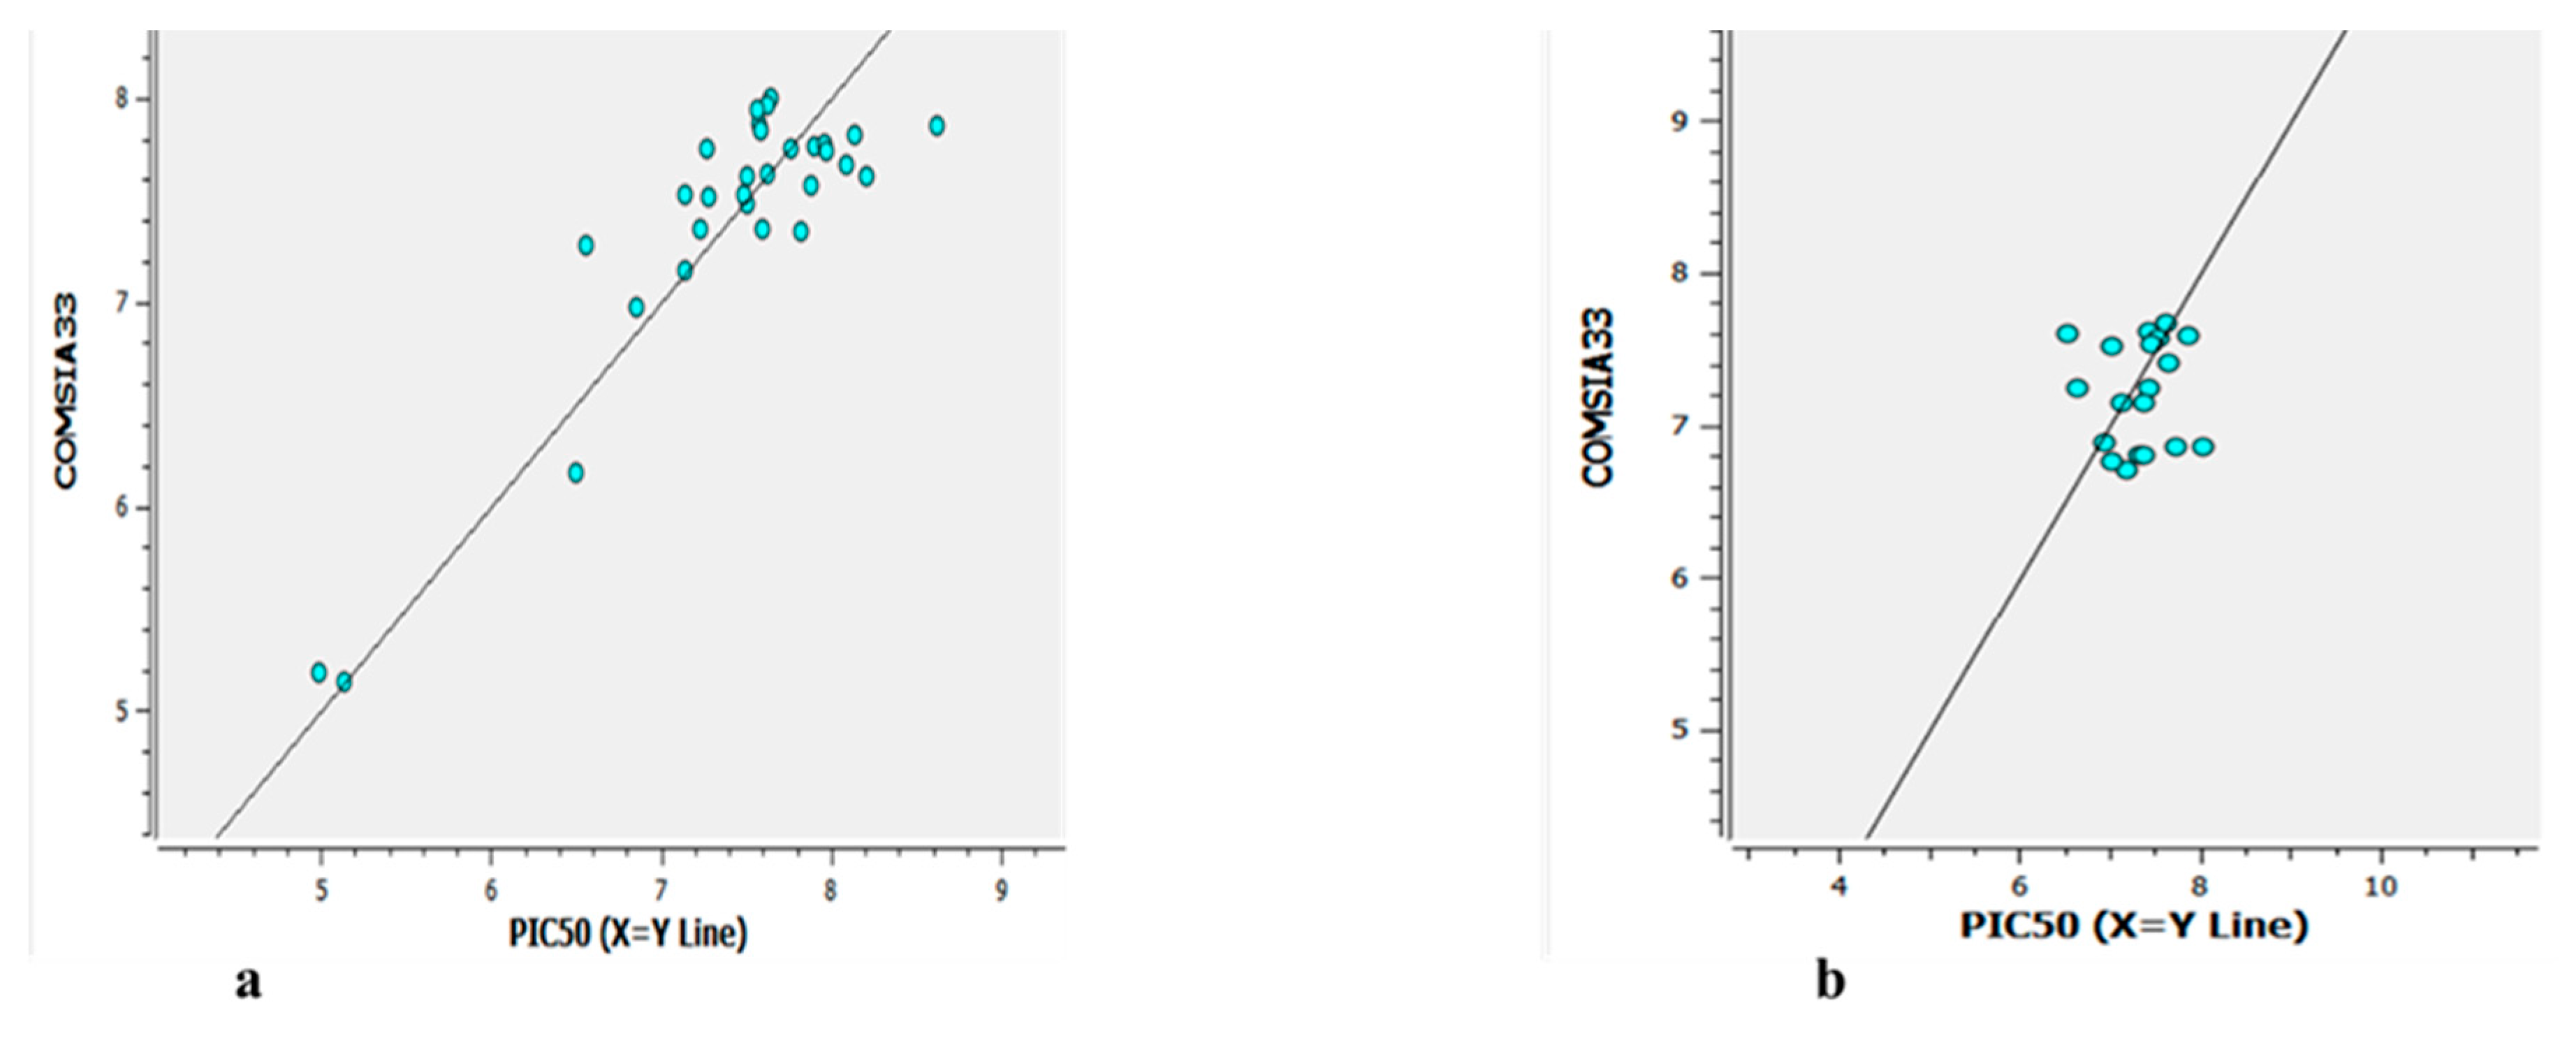
The experimental versus predicted pEC50 value for CoMFA test set(a) and training set (b).
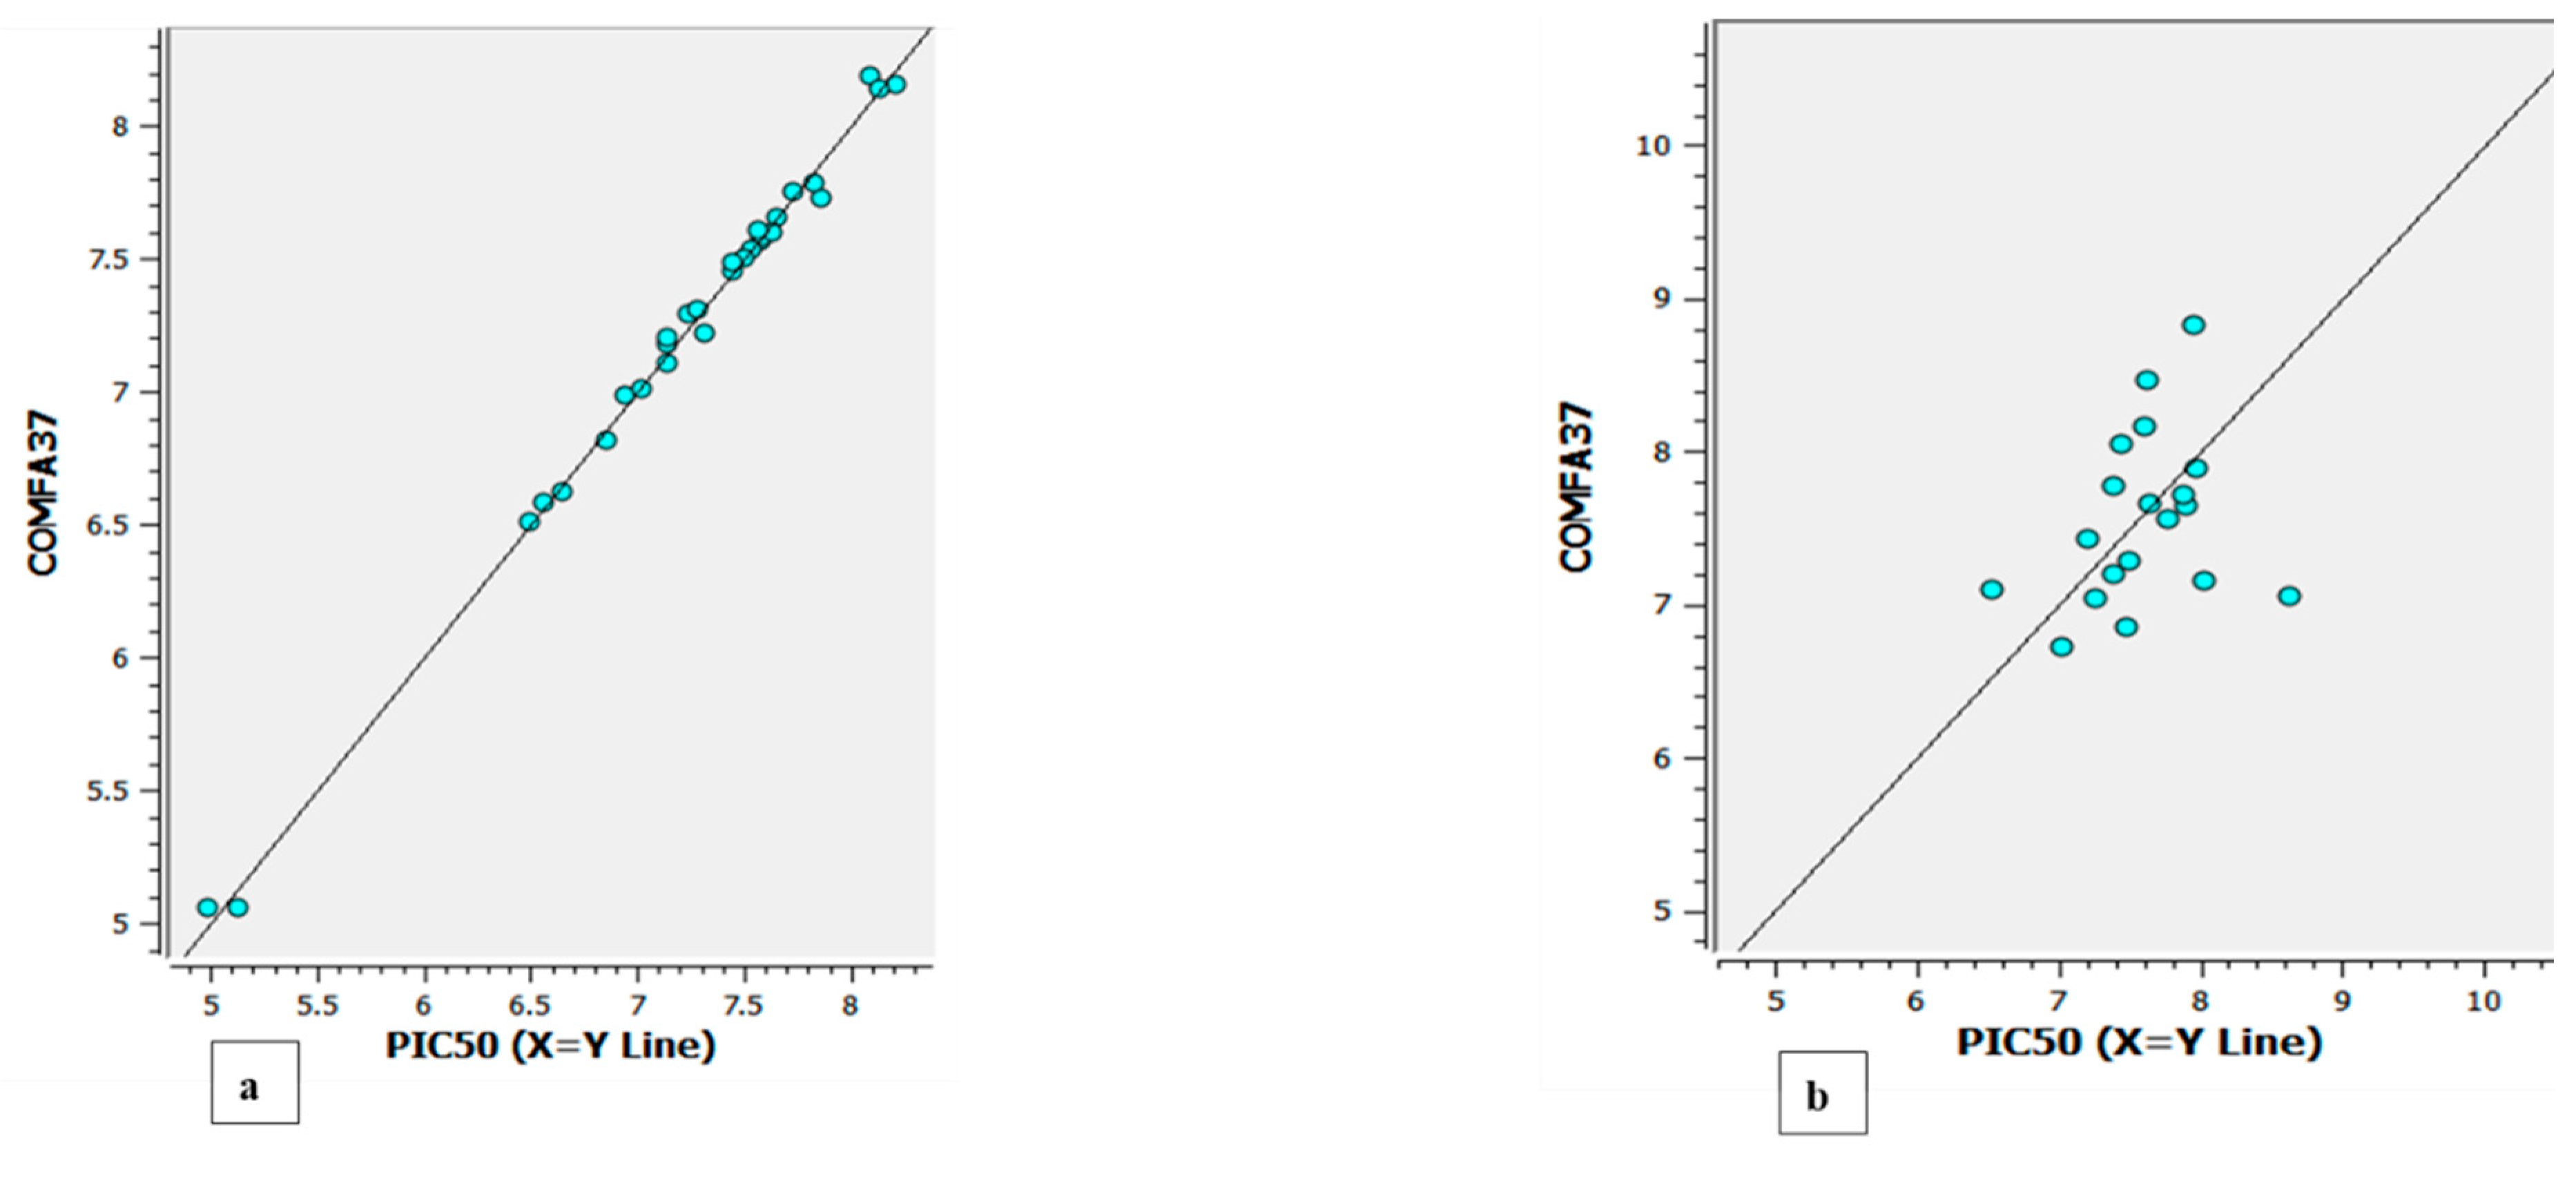
Figure 7.
Contour Map analysis of CoMSIA study where (A) CoMSIA steric field contour map green contour is favoured; yellow contour is disfavoured; (B) CoMSIA electrostatic field contour map blue contour is favoured for electropositive groups; red contour is favoured for electronegative groups; (C) Hydrogen bond donor field contour map cyan contour is favoured, purple contour is disfavoured; (D) Hydrogen bond acceptor field contour map , magenta contour is favoured, red contour is disfavoured (E) Hydrophobic field contour map , yellow contour is favoured, white contour is disfavoured.
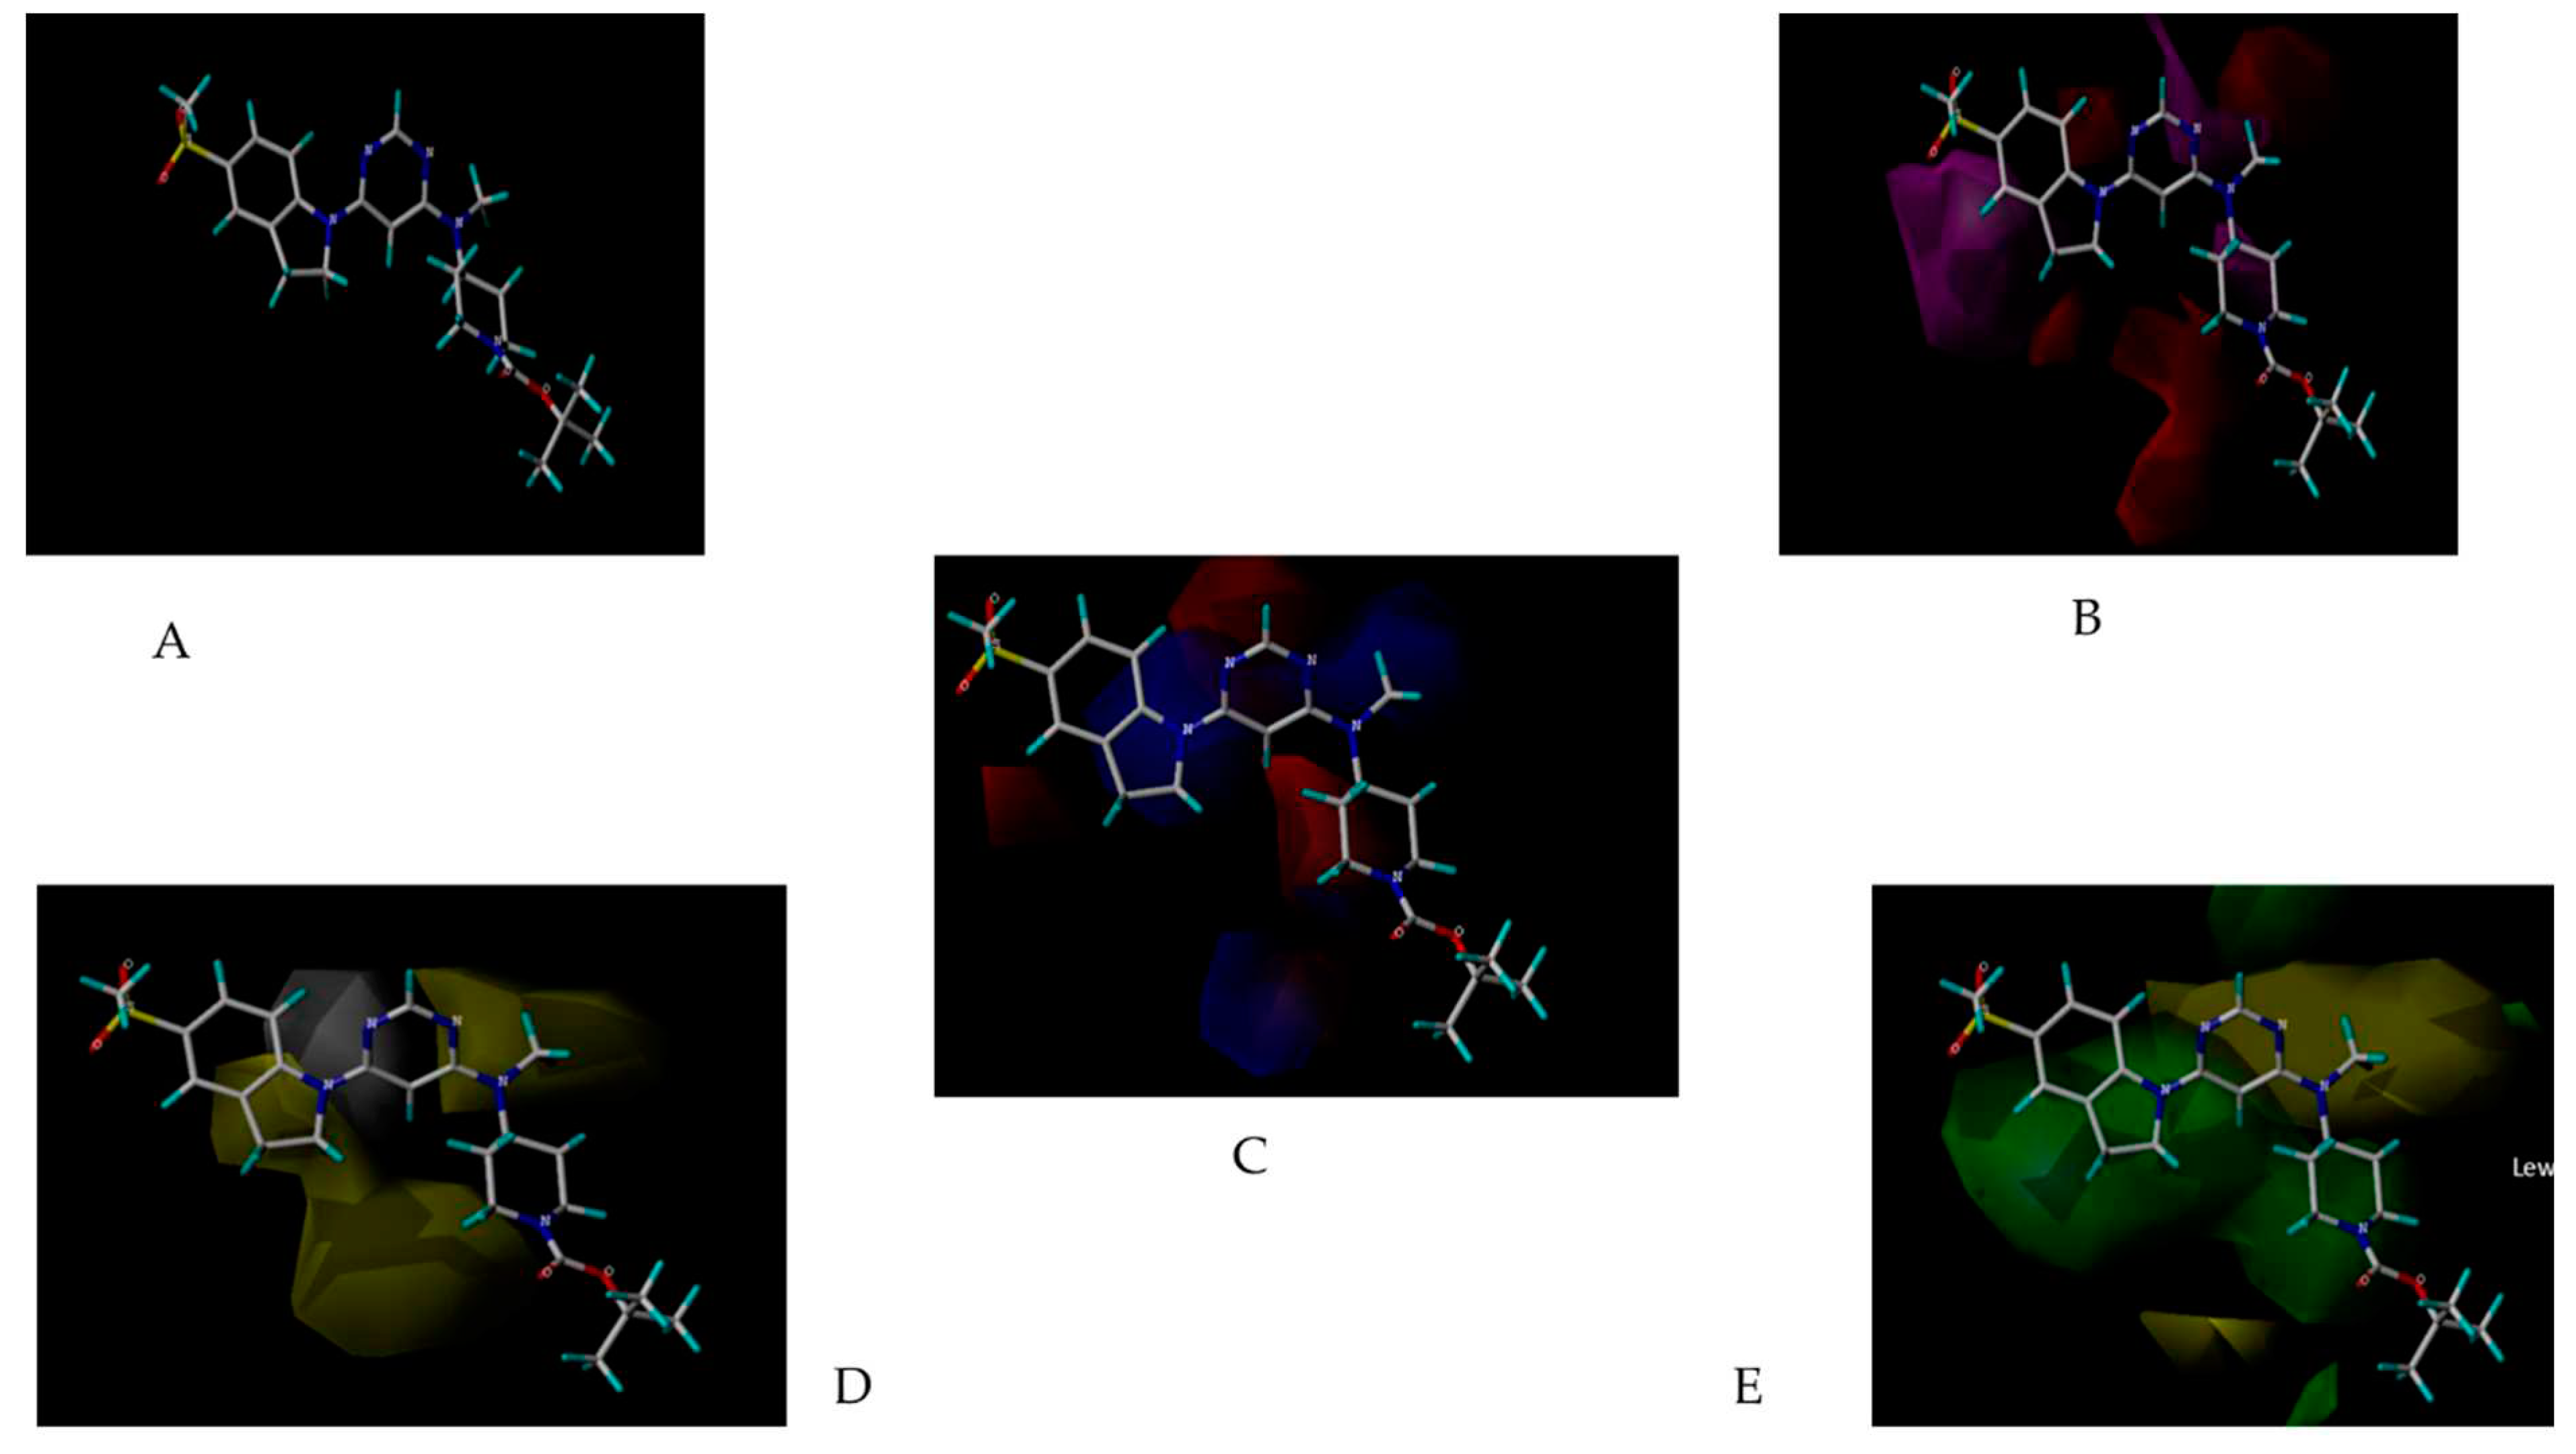
Figure 8.
The experimental versus predicted pEC50 value for CoMSIA test set(a) and training set (b).
Figure 8.
The experimental versus predicted pEC50 value for CoMSIA test set(a) and training set (b).
3.5. Atom and Field based 3D-QSAR
To generate the 3D-QSAR models the chosen congeneric series of 35 compounds (Table 5) have been used after performing alignment and minimization in Schrodinger Maestro v13.5. In the atom based QSAR model atoms are dictated by van der Waals models where atoms are treated as a sphere and occupy the same regions of space. Atom based 3D-QSAR model was developed from a set of aligned ligands to predict activities for other molecules. The splitting of compounds was set up as 68% compounds in training set and the remaining 32% compounds in test set in case of Atom Based 3D-QSAR, whereas 70% compounds in training set and the remaining 30% compounds in test set in case of field base 3D-QSAR. The clustering of compounds was done with a 4-5 PLS factor [20,21]. Table 10 summarized the different parameters of the QSAR model which are as follow:
Table 10.
Various parameters of the QSAR model.
| Parameters | Significance |
|---|---|
| SD | Standard Deviation of the regression |
| R2 | For the regression |
| R2 CV | cross-validated R2 value computed from predictions obtained by a leave-N-out approach |
| F | Variance ratio, large values of F indicate a more statistically significant regression |
| P | significance level of variance ratio, smaller values indicate a greater degree of confidence |
| RMSE | Root-Mean-Square Error of the test set |
| Q2 | value of Q2 for the predicted activities of the test set |
| Pearson-R | value of Pearson-R for the predicted activities of the test set |
Segment displayed the fraction due to each type (Atom based and Field base) in the QSAR model for each number of PLS factors used in the model (Table 11, Table 12, Table 13, Table 14, Table 15 and Table 16). A scatter plot (Figure 10 and Figure 12) was generated by plotting actual activity vs. predicted activity to confirm minimal diversity in the biological activities between training set molecules.
3.5.1. Generation of Contour Maps
The contour map help in predicting the favorably or unfavorably interaction of aligned molecules with the receptor for biological activity and correspond to the spatial arrangement of aligned molecules. Figure 9 and Figure 11 represent the contour map of 3D-Atom and Field Based QSAR respectively.
Table 11.
Data analysis of 3D- Atom-Based 3D-QSAR model.
| # Factors | SD | R^2 | R^2 CV | R^2 Scramble | Stability | F | P | RMSE | Q^2 | Pearson-r |
|---|---|---|---|---|---|---|---|---|---|---|
| 1 | 0.5661 | 0.4267 | -0.3411 | 0.2056 | 0.356 | 18.6 | 0.000221 | 0.41 | 0.5959 | 0.8358 |
| 2 | 0.4318 | 0.6797 | -0.0409 | 0.4277 | 0.442 | 25.5 | 1.17E-06 | 0.43 | 0.5552 | 0.752 |
| 3 | 0.3508 | 0.7974 | 0.1452 | 0.6065 | 0.325 | 30.2 | 3.77E-08 | 0.4 | 0.6045 | 0.7909 |
| 4 | 0.3265 | 0.8321 | -0.0001 | 0.7517 | 0.169 | 27.3 | 3.03E-08 | 0.37 | 0.675 | 0.8652 |
Table 12.
Statistics for 3D-Atom-Based QSAR.
| # Factors | H-bond donor | Hydrophobic/non-polar | Electron-withdrawing | Other |
|---|---|---|---|---|
| 1 | 0.014 | 0.552 | 0.314 | 0.119 |
| 2 | 0.017 | 0.521 | 0.326 | 0.136 |
| 3 | 0.027 | 0.509 | 0.336 | 0.128 |
| 4 | 0.036 | 0.517 | 0.327 | 0.119 |
Table 13.
Actual and Predicted pEC50 and Residual values of Generated 3D-Atom Based Models.
| Ligand Name | QSAR Set | Activity | # Factors | Predicted Activity | Prediction Error |
|---|---|---|---|---|---|
| 01.mol | training | 6.523 | 1 2 3 4 | 7.15565 7.30504 7.14352 7.12796 | 0.632769 0.782161 0.620637 0.605078 |
| 02.mol | training | 7.678 | 1 2 3 4 | 7.22467 7.53085 7.62643 7.73954 | -0.453112 -0.146926 -0.0513511 0.0617595 |
| 03.mol | training | 7.854 | 1 2 3 4 | 7.23218 7.58119 7.75294 7.88755 | -0.621688 -0.272686 -0.100937 0.0336749 |
| 04.mol | training | 7.745 | 1 2 3 4 | 7.23517 7.61568 7.77783 7.84612 | -0.509555 -0.129049 0.0331019 0.101396 |
| 05.mol | training | 7.292 | 1 2 3 4 | 7.20921 7.57267 7.69414 7.73108 | -0.0832154 0.280242 0.401714 0.438648 |
| 06.mol | training | 7.538 | 1 2 3 4 | 7.23122 7.61033 7.75712 7.80396 | -0.306386 0.0727319 0.21952 0.266362 |
| 07.mol | training | 8.602 | 1 2 3 4 | 7.2088 7.55259 7.76428 7.98303 | -1.39326 -1.04947 -0.837784 -0.619028 |
| 08.mol | test | 7.367 | 1 2 3 4 | 7.20392 7.49431 7.7244 7.49078 | -0.162613 0.127775 0.357872 0.124246 |
| 09.mol | training | 8.444 | 1 2 3 4 | 7.21745 7.52969 7.80546 7.59608 | -1.22625 -0.914008 -0.638237 -0.847616 |
| 10.mol | training | 6.569 | 1 2 3 4 | 7.08317 7.2743 7.33465 6.98422 | 0.514535 0.705662 0.766017 0.415579 |
| 11.mol | training | 5.149 | 1 2 3 4 | 6.1075 5.46513 4.93061 4.87658 | 0.95876 0.316385 -0.218136 -0.272158 |
| 12.mol | test | 6.018 | 1 2 3 4 | 6.83295 6.79354 6.70556 6.70529 | 0.815219 0.775811 0.687832 0.687557 |
| 13.mol | training | 8.569 | 1 2 3 4 | 8.20201 8.54941 8.59306 8.3265 | -0.366624 -0.019231 0.0244264 -0.24214 |
| 14.mol | test | 8.268 | 1 2 3 4 | 8.1205 8.45592 8.46934 8.19624 | -0.147108 0.188314 0.201736 -0.0713698 |
| 15.mol | training | 8.337 | 1 2 3 4 | 8.20111 8.55679 8.59317 8.31732 | -0.136134 0.219547 0.255929 -0.0199211 |
| 16.mol | training | 8.538 | 1 2 3 4 | 8.19975 8.59184 8.58466 8.74273 | -0.337857 0.0542393 0.047062 0.205133 |
| 17.mol | training | 8.114 | 1 2 3 4 | 8.16041 8.36814 8.08125 8.10823 | 0.0468988 0.254631 -0.0322618 -0.00527856 |
| 18.mol | training | 7.77 | 1 2 3 4 | 7.87836 8.09215 7.58063 7.67686 | 0.108809 0.322603 -0.188924 -0.0926923 |
| 19.mol | training | 7.824 | 1 2 3 4 | 7.68312 7.90336 7.63149 7.74225 | -0.140794 0.0794543 -0.192417 -0.0816583 |
| 20.mol | training | 8.013 | 1 2 3 4 | 8.05836 8.04152 7.73825 7.80756 | 0.0451315 0.0282953 -0.27498 -0.205669 |
| 21.mol | training | 7.319 | 1 2 3 4 | 7.95743 7.82166 7.35065 7.28806 | 0.638676 0.502897 0.0318935 -0.0306997 |
| 22.mol | test | 7.854 | 1 2 3 4 | 7.55015 7.51286 7.29122 7.3628 | -0.30372 -0.341014 -0.562656 -0.491074 |
| 23.mol | training | 7.481 | 1 2 3 4 | 7.88128 7.57583 7.54275 7.53815 | 0.399794 0.0943484 0.0612667 0.0566677 |
| 24.mol | training | 7.77 | 1 2 3 4 | 7.74746 7.2418 7.52799 7.55767 | -0.0220896 -0.527751 -0.24156 -0.211877 |
| 25.mol | test | 7.824 | 1 2 3 4 | 7.74925 7.24392 7.46259 7.4745 | -0.074658 -0.579987 -0.361314 -0.349409 |
| 26.mol | training | 8.013 | 1 2 3 4 | 8.01282 7.8414 7.85475 7.93212 | -0.000404467 -0.171832 -0.158482 -0.0811093 |
| 27.mol | training | 7.444 | 1 2 3 4 | 7.75083 7.2403 7.46031 7.47708 | 0.30713 -0.2034 0.0166132 0.0333783 |
| 28.mol | training | 7.62 | 1 2 3 4 | 7.87164 7.54692 7.64137 7.71512 | 0.251853 -0.0728685 0.0215804 0.0953287 |
| 29.mol | training | 7.125 | 1 2 3 4 | 7.73534 7.31943 7.18278 7.11437 | 0.610399 0.194491 0.05784 -0.0105667 |
| 30.mol | training | 7.319 | 1 2 3 4 | 7.74751 7.28288 7.48377 7.46461 | 0.428747 -0.0358823 0.165008 0.145853 |
| 31.mol | test | 7.77 | 1 2 3 4 | 7.78365 7.31113 7.65926 7.73627 | 0.0141037 -0.458425 -0.110286 -0.0332829 |
| 32.mol | training | 7.051 | 1 2 3 4 | 7.71669 7.17078 7.39968 7.37178 | 0.666085 0.12017 0.349075 0.321168 |
| 33.mol | test | 7.046 | 1 2 3 4 | 7.75601 7.25968 7.50199 7.51464 | 0.71025 0.213925 0.456235 0.468882 |
| 34.mol | test | 7.602 | 1 2 3 4 | 7.75936 7.26662 7.55747 7.5912 | 0.157297 -0.335436 -0.0445856 -0.0108575 |
| 35.mol | training | 7.796 | 1 2 3 4 | 7.78365 7.31113 7.65926 7.73627 | -0.0122252 -0.484754 -0.136615 -0.0596118 |
3.5.2. Selection of the Best Model
The QSAR models showed the statics of test and training set molecules. Different statistical parameters such as SD, R2, P, F, RMSE and Pearson-r were used in the reliable QSAR model predictions and evaluations. The high value of R2 is essential but for the development of an ideal QSAR model predictions and evaluation some other parameters are also essential. Among all the models one model was found to be a significant model owing to higher values of 0.675, 0.8321 and -0.0001 for Q2, R2 and R2cv values respectively for 4 factors in case of Atom-Based QSAR (Table 11). Similarly, generated model owing to higher values of 0.8186, 0.7945 and -0.6463 for Q2, R2 and R2cv values respectively for 4 factors in case of Field-Based QSAR (Table 14). Table 13 and Table 16 represent the predicted pEC50 and actual pEC50 for generated model.
Figure 9.
3D-QSAR atom-based representation of group containing, (A) Electron withdrawing group increases light green and decreases magenta, (B) HBD- increase blue; (C) Hydrophobic and positive ionic group: increase yellow and decrease purple; (D) Others: increase sky blue and decrease pink.
Figure 9.
3D-QSAR atom-based representation of group containing, (A) Electron withdrawing group increases light green and decreases magenta, (B) HBD- increase blue; (C) Hydrophobic and positive ionic group: increase yellow and decrease purple; (D) Others: increase sky blue and decrease pink.
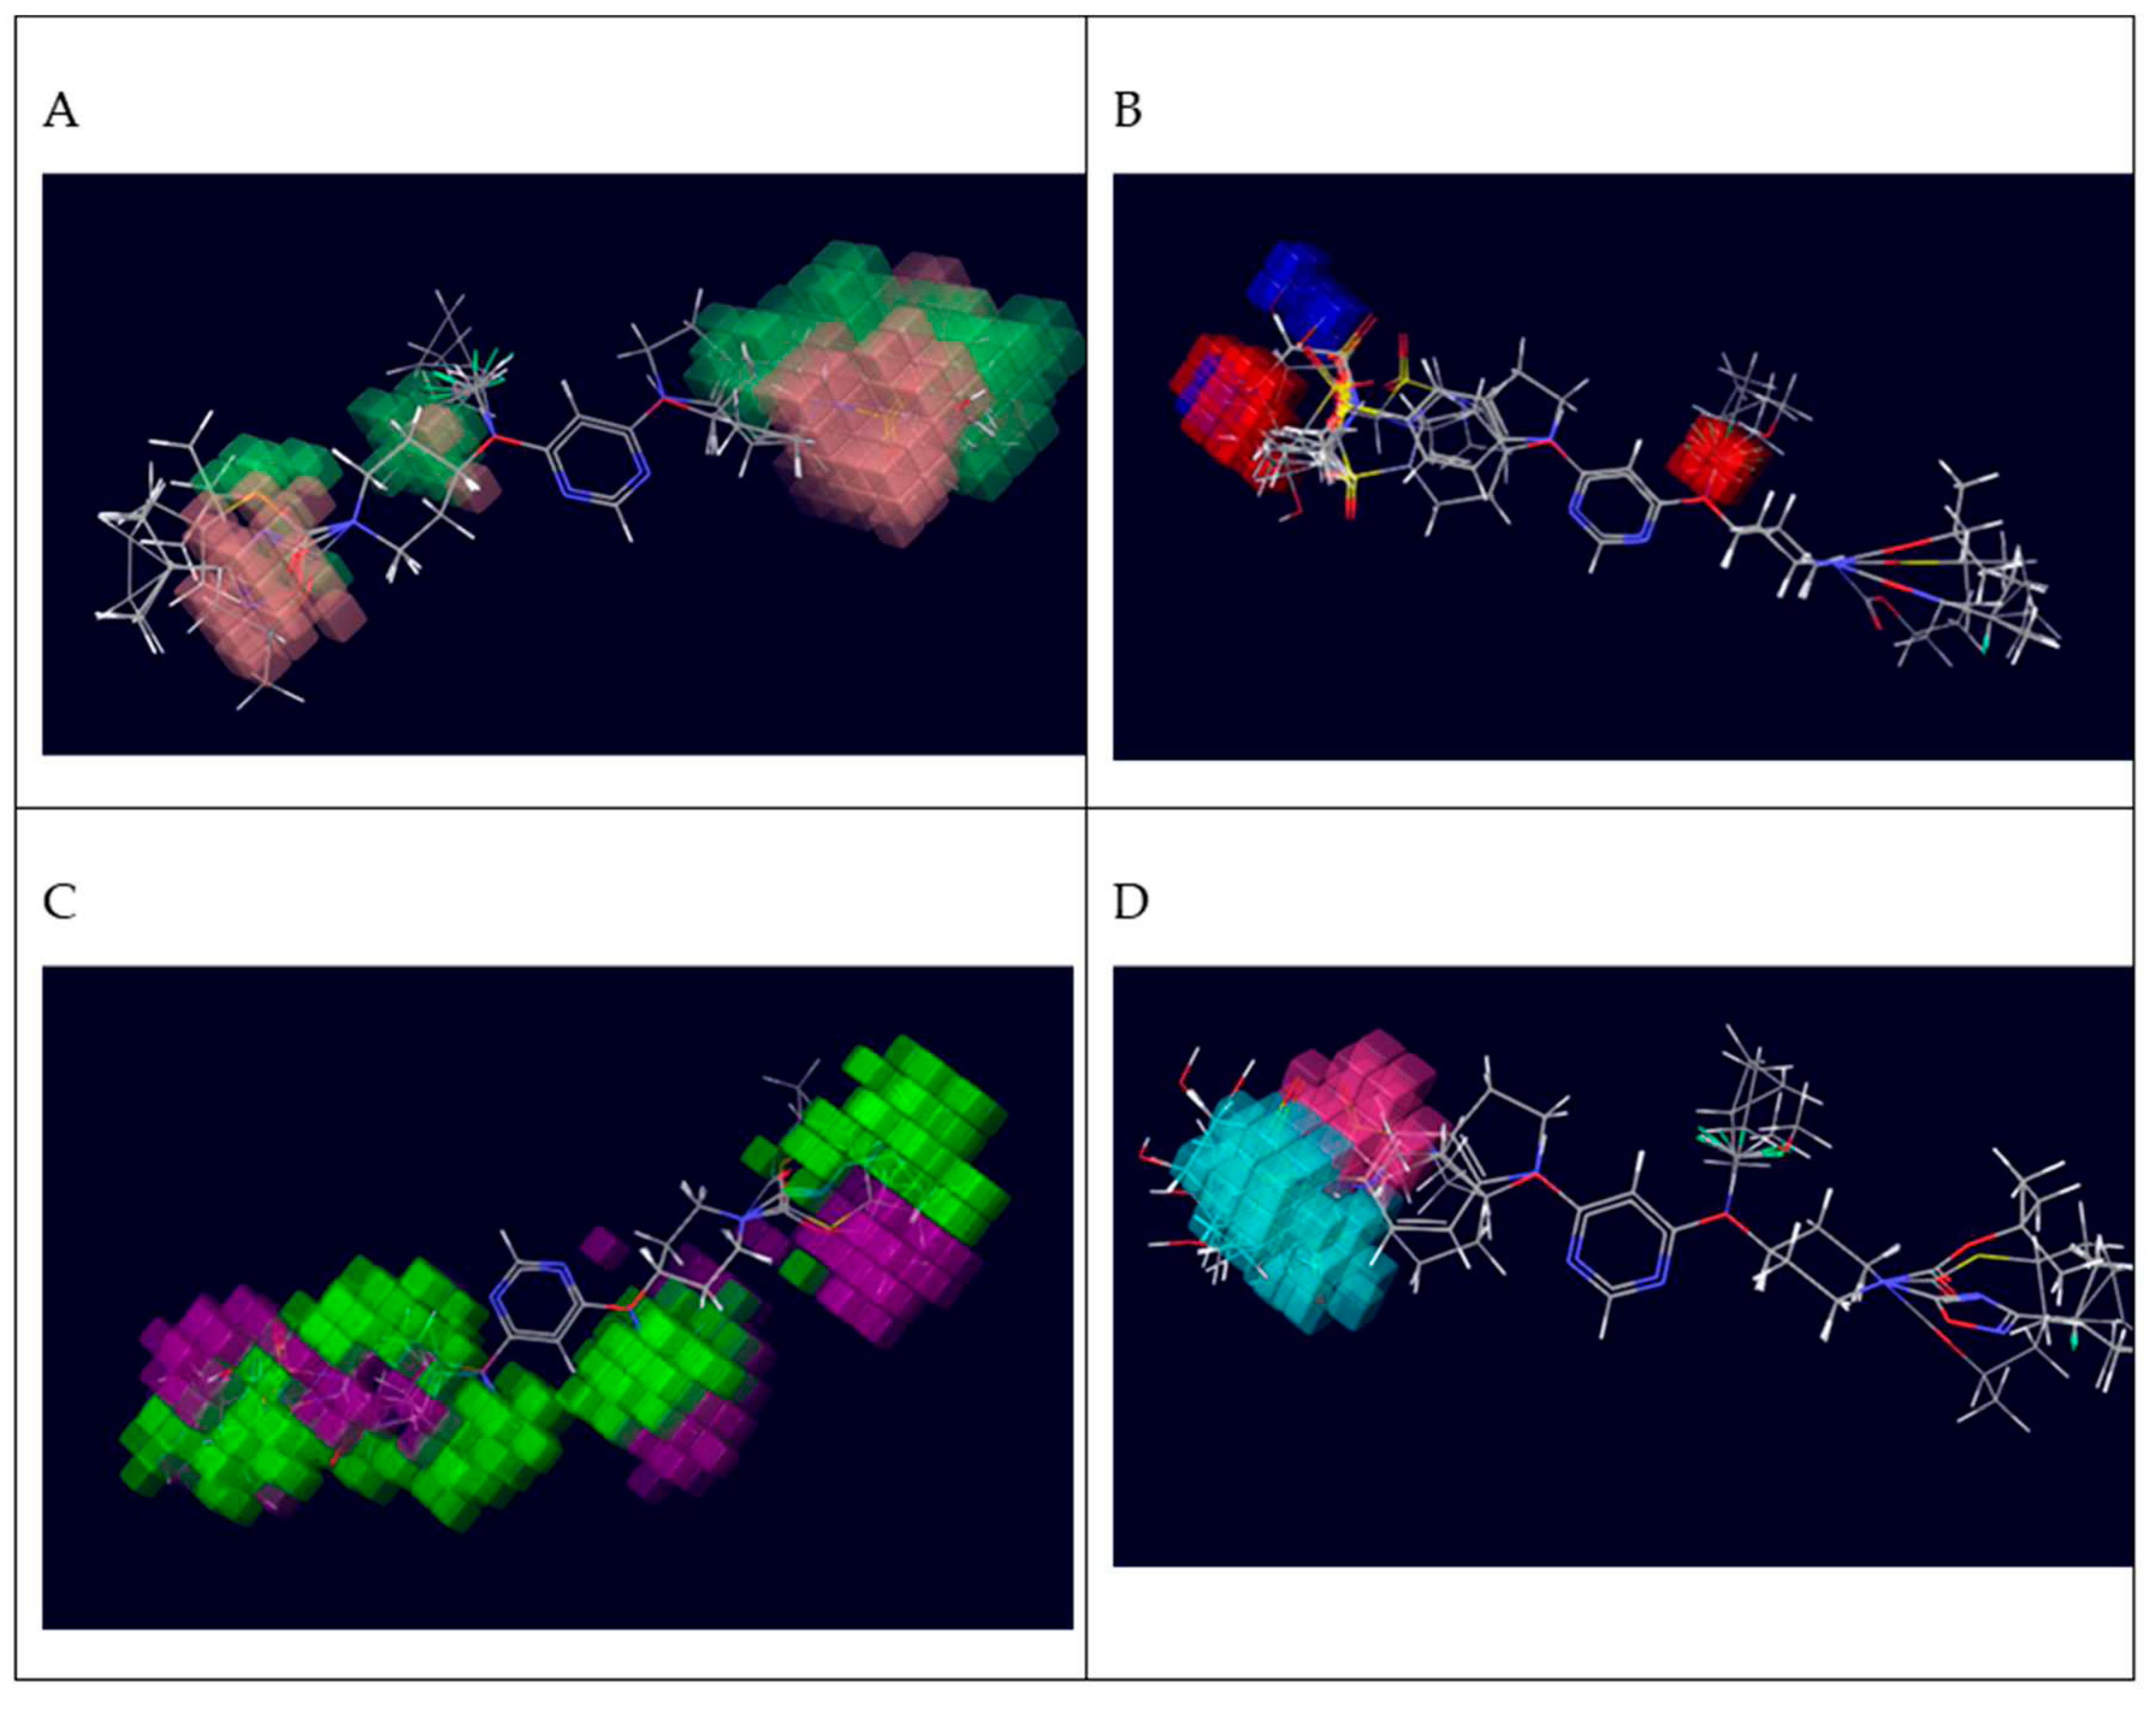
Figure 10.
Scatter plot (Actual vs. Predicted activity) of Atom Based 3D-QSAR.
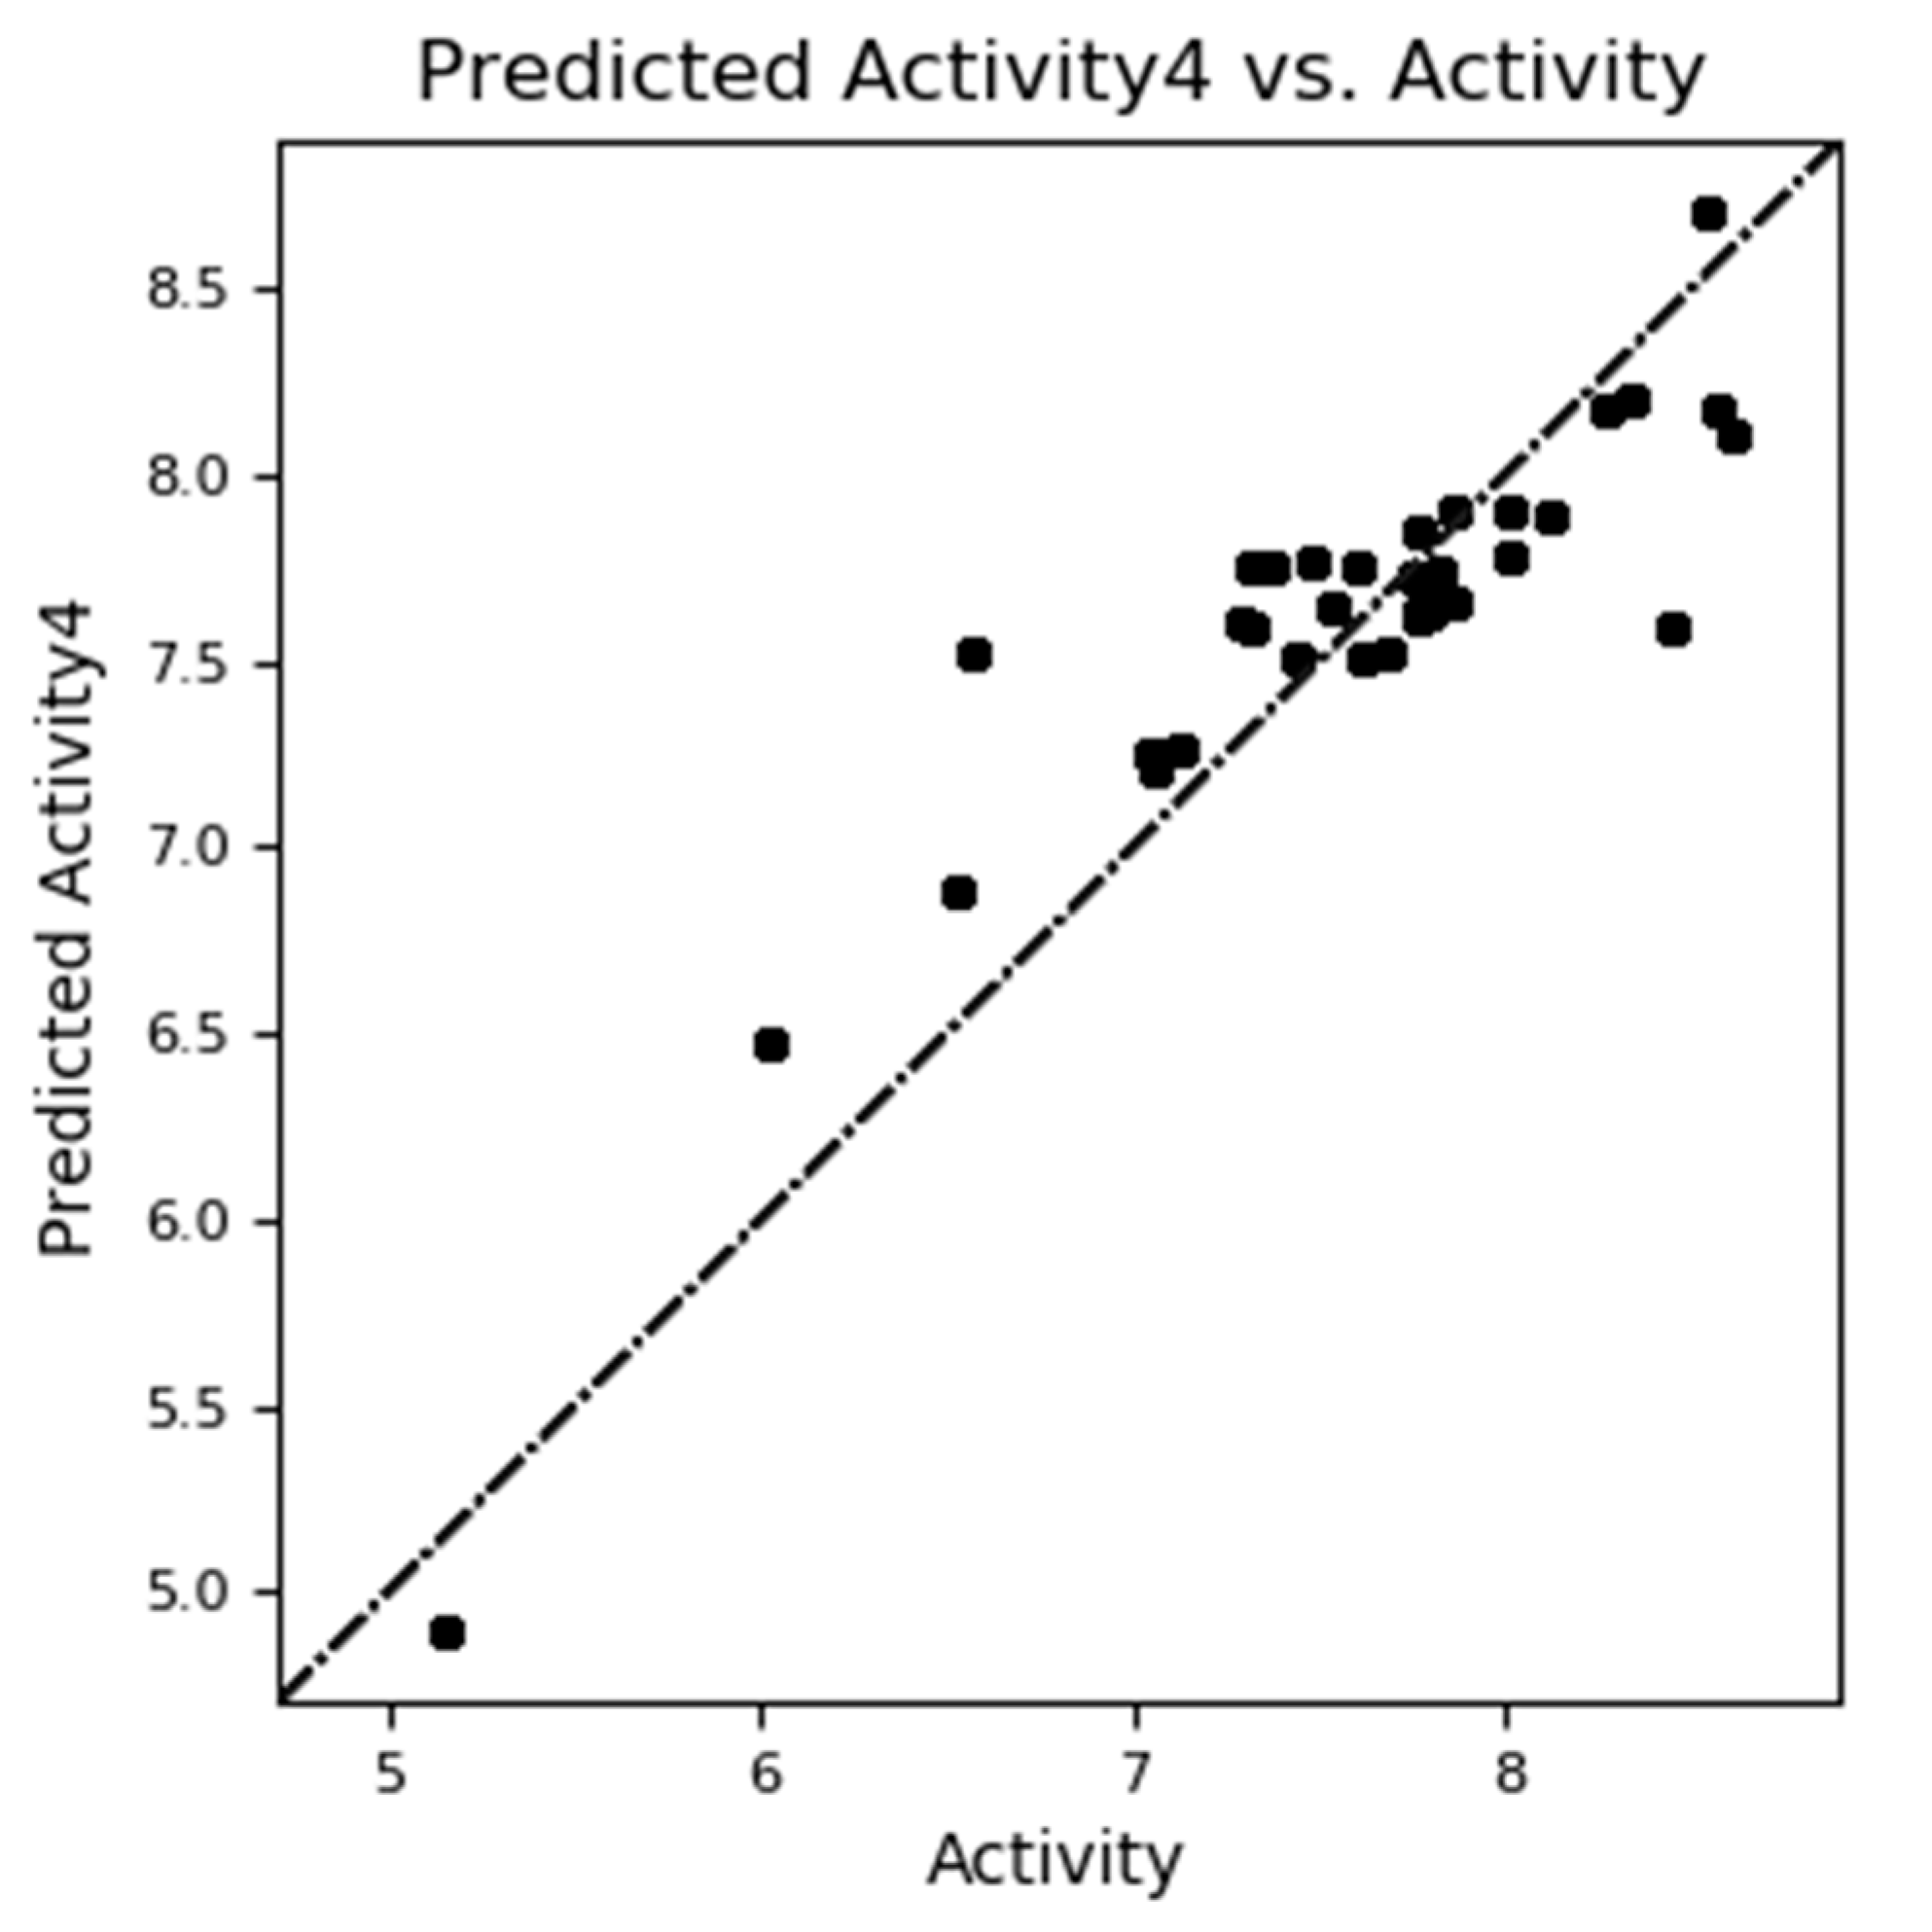
Figure 11.
3D-QSAR field-based representation of group containing, (A) Gaussian Electrostatic, (B) Gaussian Steric, (C) Gaussian H bond acceptor, (D) Gaussian H bond donor, (E) Gaussian Hydrophobic; (A)- increase blue and decrease red; (B)- increase light green and decrease red (absent here) ; (C)- increase dark green and decrease magenta, (D)- increase light blue,(E)- increase yellow and decrease white.
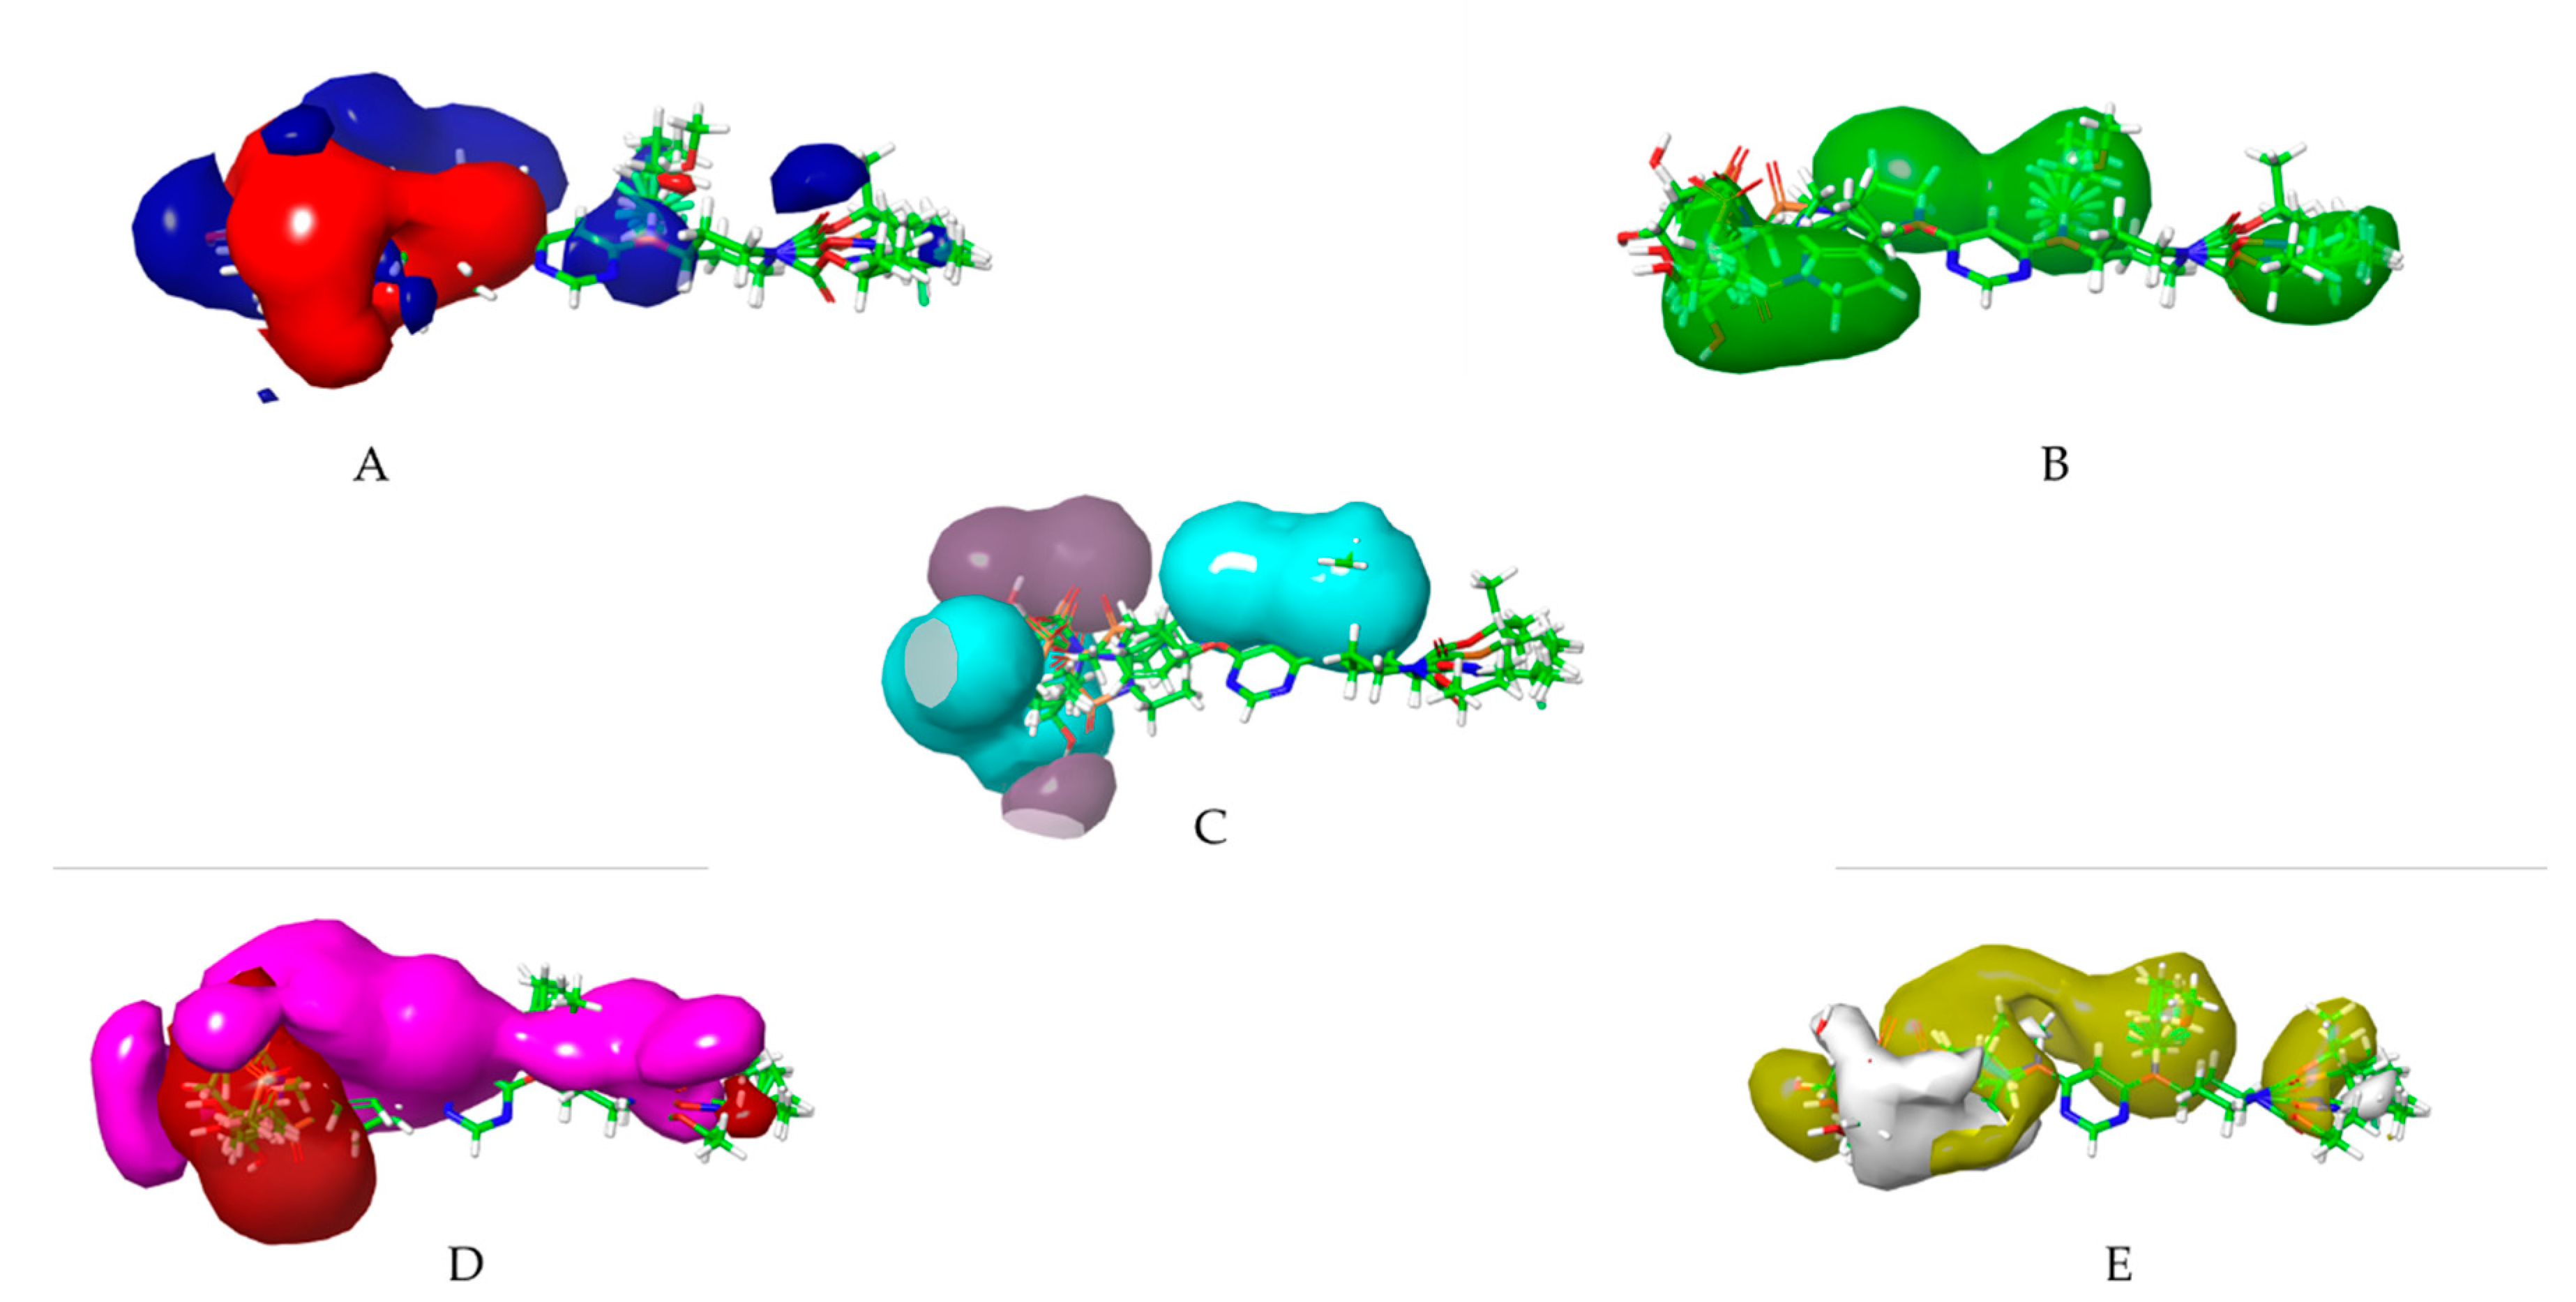
Figure 12.
Represents the comparison between actual vs predicted pEC50 values of the training set (A) and test set (B) molecules, consecutively in the case of force field QSAR.
Figure 12.
Represents the comparison between actual vs predicted pEC50 values of the training set (A) and test set (B) molecules, consecutively in the case of force field QSAR.
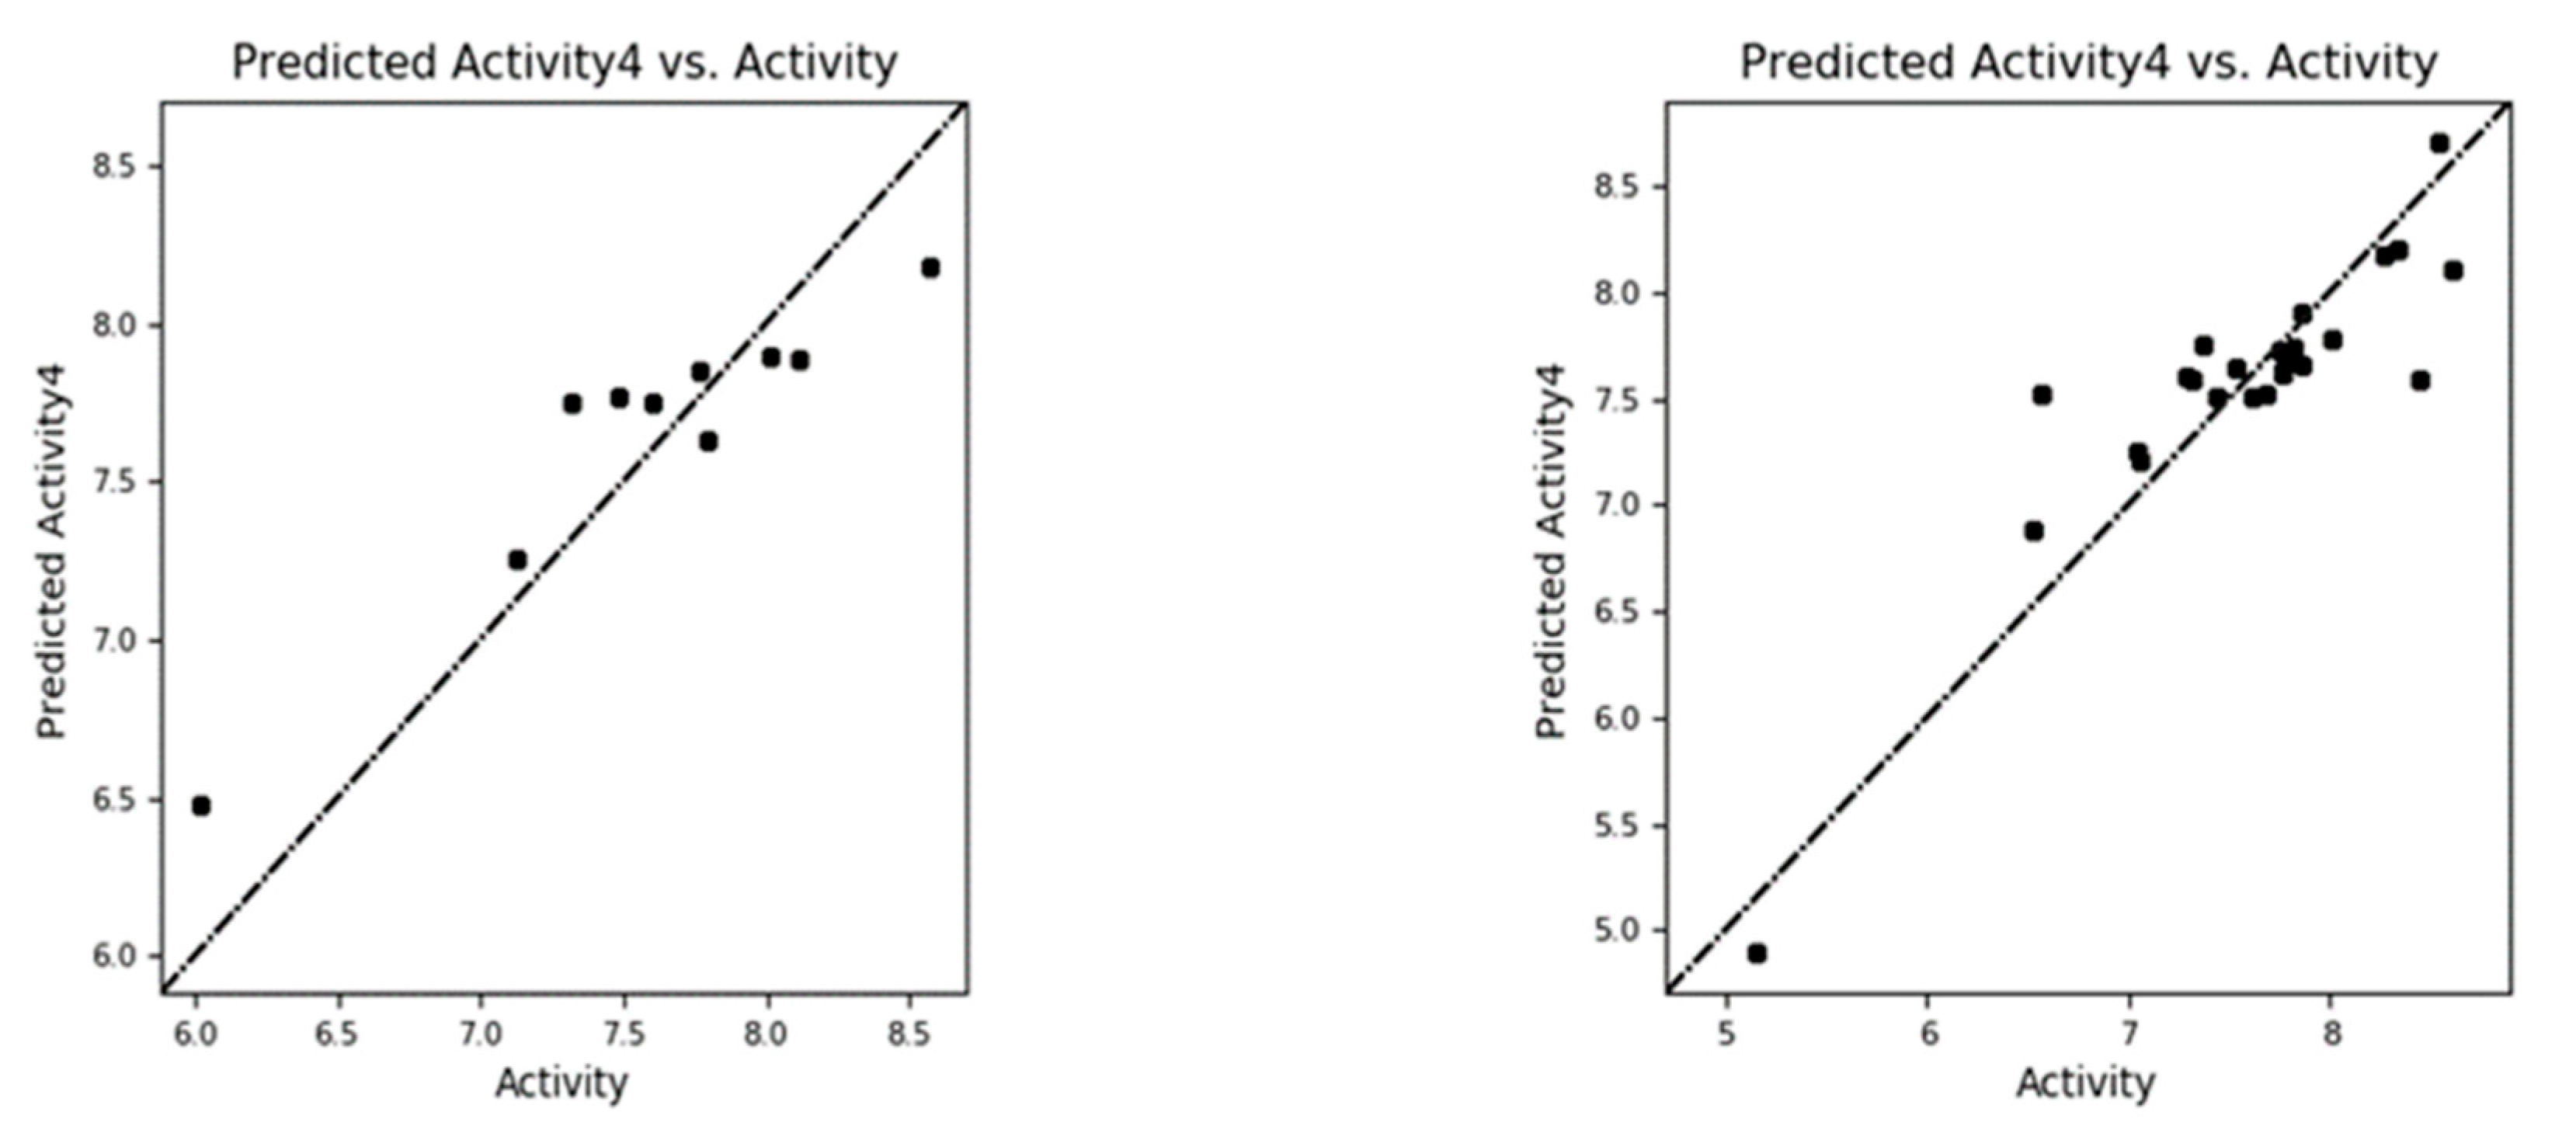
Table 14.
Data analysis of 3D- Field-Based QSAR model.
| # Factors | SD | R^2 | R^2 CV | R^2 Scramble | Stability | F | P | RMSE | Q^2 | Pearson-r |
|---|---|---|---|---|---|---|---|---|---|---|
| 1 | 0.6129 | 0.3432 | -0.518 | 0.2033 | 0.206 | 12 | 0.00209 | 0.46 | 0.4982 | 0.8984 |
| 2 | 0.4764 | 0.6205 | -0.2145 | 0.4427 | 0.337 | 18 | 2.35E-05 | 0.39 | 0.6443 | 0.848 |
| 3 | 0.4404 | 0.6903 | -0.2573 | 0.6388 | 0.126 | 15.6 | 1.45E-05 | 0.38 | 0.657 | 0.8545 |
| 4 | 0.3677 | 0.7945 | -0.6463 | 0.7877 | -0.505 | 19.3 | 1.20E-06 | 0.28 | 0.8186 | 0.9469 |
Table 15.
Statistics for 3D- Field-Based QSAR.
| # Factors | Gaussian Steric | Gaussian Electrostatic | Gaussian Hydrophobic | Gaussian Hbond Acceptor | Gaussian Hbond Donor |
|---|---|---|---|---|---|
| 1 | 0.487 | 0.061 | 0.213 | 0.203 | 0.036 |
| 2 | 0.448 | 0.077 | 0.215 | 0.22 | 0.04 |
| 3 | 0.442 | 0.084 | 0.2 | 0.229 | 0.045 |
| 4 | 0.356 | 0.079 | 0.261 | 0.214 | 0.091 |
Table 16.
Actual and Predicted pEC50 and Residual values of Generated 3D-Field Based Models.
| Ligand Name | QSAR Set | Activity | # Factors | Predicted Activity | Prediction Error | % Extrapolated |
|---|---|---|---|---|---|---|
| 01.mol | training | 6.523 | 1 2 3 4 | 7.07119 7.02254 7.12644 6.87695 | 0.548314 0.499661 0.603566 0.354069 | 0 |
| 02.mol | training | 7.678 | 1 2 3 4 | 7.17222 7.31881 7.48545 7.51875 | -0.505559 -0.358975 -0.192334 -0.15903 | 0 |
| 03.mol | training | 7.854 | 1 2 3 4 | 7.18845 7.42623 7.6217 7.66315 | -0.665427 -0.427638 -0.232172 -0.19072 | 0 |
| 04.mol | training | 7.745 | 1 2 3 4 | 7.20248 7.50893 7.72164 7.72096 | -0.542246 -0.235793 -0.0230886 -0.0237656 | 0 |
| 05.mol | training | 7.292 | 1 2 3 4 | 7.18861 7.49142 7.70334 7.60262 | -0.103821 0.198989 0.410912 0.31019 | 0 |
| 06.mol | training | 7.538 | 1 2 3 4 | 7.16991 7.43166 7.65704 7.64623 | -0.367689 -0.105939 0.119434 0.108626 | 0 |
| 07.mol | training | 8.602 | 1 2 3 4 | 7.29281 7.63078 7.76215 8.11332 | -1.30925 -0.971278 -0.839913 -0.488742 | 0 |
| 08.mol | training | 7.367 | 1 2 3 4 | 7.37574 7.7155 7.43744 7.75183 | 0.00920452 0.348969 0.0709041 0.385295 | 0 |
| 09.mol | training | 8.444 | 1 2 3 4 | 7.33947 7.63036 7.31978 7.59726 | -1.10423 -0.813341 -1.12392 -0.846439 | 0 |
| 10.mol | training | 6.569 | 1 2 3 4 | 7.3477 7.64772 7.35939 7.51857 | 0.779068 1.07909 0.79075 0.949931 | 0 |
| 11.mol | training | 5.149 | 1 2 3 4 | 6.4315 5.79346 5.39658 4.90344 | 1.28276 0.644722 0.247843 -0.245301 | 0 |
| 12.mol | test | 6.018 | 1 2 3 4 | 6.90583 6.74883 6.56688 6.47747 | 0.888102 0.731102 0.549156 0.459737 | 5.51 |
| 13.mol | test | 8.569 | 1 2 3 4 | 8.1885 8.68356 8.37181 8.17959 | -0.380137 0.114922 -0.196825 -0.389043 | 3.24 |
| 14.mol | training | 8.268 | 1 2 3 4 | 8.17402 8.67425 8.36159 8.18066 | -0.09359 0.40664 0.093985 -0.0869485 | 0 |
| 15.mol | training | 8.337 | 1 2 3 4 | 8.19771 8.70279 8.39139 8.20029 | -0.13953 0.365545 0.0541505 -0.136952 | 0 |
| 16.mol | training | 8.538 | 1 2 3 4 | 8.14245 8.68569 8.81544 8.69983 | -0.395151 0.148085 0.277838 0.162231 | 0 |
| 17.mol | test | 8.114 | 1 2 3 4 | 7.99656 8.17795 8.31019 7.88773 | -0.116953 0.064442 0.196679 -0.225783 | 5.64 |
| 18.mol | test | 7.77 | 1 2 3 4 | 7.87647 8.04528 8.18228 7.85262 | 0.106919 0.275732 0.412731 0.0830724 | 19.66 |
| 19.mol | training | 7.824 | 1 2 3 4 | 7.60588 7.71983 7.86889 7.74681 | -0.218033 -0.104082 0.044982 -0.0770983 | 0 |
| 20.mol | training | 8.013 | 1 2 3 4 | 8.10361 8.26955 8.42617 7.77444 | 0.0903775 0.256326 0.412939 -0.238789 | 0 |
| 21.mol | test | 7.319 | 1 2 3 4 | 8.02306 8.01378 8.06062 7.75123 | 0.704306 0.695021 0.741863 0.43247 | 6.56 |
| 22.mol | training | 7.854 | 1 2 3 4 | 7.63976 7.58589 7.60471 7.89876 | -0.21411 -0.267984 -0.249158 0.044888 | 0 |
| 23.mol | test | 7.481 | 1 2 3 4 | 7.94082 7.79496 7.82999 7.77176 | 0.459334 0.31347 0.348508 0.290275 | 10.28 |
| 24.mol | training | 7.77 | 1 2 3 4 | 7.86299 7.43584 7.46244 7.61315 | 0.0934369 -0.333713 -0.307114 -0.156405 | 0 |
| 25.mol | training | 7.824 | 1 2 3 4 | 7.91539 7.58511 7.63991 7.70076 | 0.0914774 -0.238795 -0.184001 -0.123149 | 0 |
| 26.mol | test | 8.013 | 1 2 3 4 | 7.96637 7.84908 7.93501 7.90016 | -0.0468581 -0.16415 -0.0782186 -0.113068 | 6.09 |
| 27.mol | training | 7.444 | 1 2 3 4 | 7.86348 7.41466 7.43334 7.5148 | 0.419781 -0.0290408 -0.0103606 0.0711049 | 0 |
| 28.mol | training | 7.62 | 1 2 3 4 | 7.79041 7.33603 7.39629 7.50296 | 0.170622 -0.283764 -0.223495 -0.11683 | 0 |
| 29.mol | test | 7.125 | 1 2 3 4 | 7.74957 7.39888 7.38236 7.25876 | 0.624629 0.273944 0.257423 0.133821 | 8.35 |
| 30.mol | training | 7.319 | 1 2 3 4 | 7.8616 7.43626 7.47181 7.59733 | 0.542846 0.117499 0.153053 0.278574 | 0 |
| 31.mol | training | 7.77 | 1 2 3 4 | 7.84718 7.37218 7.40018 7.62834 | 0.077627 -0.39737 -0.369368 -0.141212 | 0 |
| 32.mol | training | 7.051 | 1 2 3 4 | 7.8202 7.2842 7.27637 7.21068 | 0.769591 0.233595 0.225756 0.160074 | 0 |
| 33.mol | training | 7.046 | 1 2 3 4 | 7.82929 7.31435 7.29457 7.25216 | 0.783529 0.268595 0.248811 0.206401 | 0 |
| 34.mol | test | 7.602 | 1 2 3 4 | 7.8789 7.44746 7.49874 7.74993 | 0.276839 -0.154599 -0.103325 0.147873 | 4.5 |
| 35.mol | test | 7.796 | 1 2 3 4 | 7.84718 7.37218 7.40018 7.62834 | 0.0512981 -0.423699 -0.395697 -0.167541 | 0 |
3.6. Homology Modelling
In the context of the G-protein coupled receptor 119 (GPR119), a pivotal player in drug discovery, the predicament surrounding experimental structural determination is accentuated. Herein, homology modelling emerges as an indispensable technique for the design and evaluation of biological experiments. The significance of homology modelling in the case of GPR119 protein cannot be overstated. The structural insights furnished by this modelling technique greatly inform the rational design of drug candidates and guide subsequent biological inquiries. The accuracy and fidelity of the predicted protein structure hold paramount importance. Parameters for validation, such as the Ramachandran plot, the Errat score, and other relevant metrics, are pivotal in gauging the geometric integrity of the protein model. Homology Modelling has been done by several tools to predict the better quality or validated GPR119 protein structure [22].
3.6.1. Homology Modelling by Modeller 10.2
Comparative modelling with Modeller 10.2 module predicts protein structure in five sequential steps. In the very first step of modelling, searching of 3D structure of proteins related to the target. For this we have used the site (www.ncbi.nlm.nih.gov) and downloaded the GPR119 sequence in FASTA file format. The second step denotes selection of templates for alignment by BLAST. As templates based on maximum identity related to the target sequence from a list of generated sequences. We choose five template structure for alignment (6H7J, 6KR8,6TKO, 7BZ2 and 7DHI). In the third step we have aligned the target protein with template. Fourth step is model building step which after python script run, automatically calculates 3D model of the target using auto model class of the module (Table 17). Fifth step is the evaluation step, in this the model is evaluated using DOPE (Discrete Optimized Protein Energy) and GA341 assessment score. If several models are calculated for the same target, the best model can be selected as low DOPE score & high GA341 score as mentioned in Modeller v10.2 and also validated via Ramachandran plot and Errat Score (Table 18). Model qseq.B99990009.pdb was found to be best among total 10 models [23].
Table 17.
Generated Models by Modeller 10.2.
| Filename | molpdf | DOPE score | GA341 score | |
|---|---|---|---|---|
| qseq1.B99990001.pdb | 2263.30200 | -35315.05078 | 0.61879 | |
| qseq1.B99990002.pdb | 2390.90942 | -35056.51172 | 0.20713 | |
| qseq1.B99990003.pdb | 2337.51270 | -35100.41797 | 0.32889 | |
| qseq1.B99990004.pdb | 1864.64026 | -35398.23828 | 0.08412 | |
| qseq1.B99990005.pdb | 3202.83374 | -35460.10938 | 0.26161 | |
| qseq.B99990006.pdb | 1749.76917 | -35692.45313 | 0.22756 | |
| qseq.B99990007.pdb | 1907.31177 | -35349.53516 | 0.18760 | |
| qseq.B99990008.pdb | 1791.94470 | -35724.58594 | 0.14950 | |
| qseq.B99990009.pdb | 1752.6450 | -35961.87891 | 0.24333 | |
| qseq.B999900010.pdb | 1891.46082 | -35927.78125 | 0.31061 | |
Table 18.
Validation of Generated Models by Modeller 10.2.
| Generated model | Ramachandra Plot | Errat |
|---|---|---|
| qseq1.B99990001.pdb | 86.00% | 59.807 |
| qseq1.B99990002.pdb | 85.2% | 59.30 |
| qseq1.B99990003.pdb | 84.6% | 36.94 |
| qseq1.B99990004.pdb | 87.9% | 45 |
| qseq1.B99990005.pdb | 82.2% | 47.22 |
| qseq.B99990006.pdb | 81.6% | 58 |
| qseq.B99990007.pdb | 80.1% | 60 |
| qseq.B99990008.pdb | 79.1% | 45.22 |
| qseq.B99990009.pdb | 82.6% | 55.12 |
| qseq.B999900010.pdb | 78.22% | 58.33 |
3.6.2. Homology Modelling by I-TASSER:
A Homology Model of GPR119 also obtained by the I-TASSER server (https://zhanggroup.org/I-TASSER). The I-TASSER server built the 3D model using multiple threading templates. The top 10 templates accessed by I-TASSER server, which uses different features in this regard, such as sequence identity, predicted secondary structure/solvent exposure, etc. Finally, the best models from the largest cluster of structures were selected by I-TASSER accessing the SPICKER program. The Protein Preparation Wizard from the Schrödinger Maestro v13.5 package programs were used for refinement of the 3D structures, while the Procheck server were employed for the assessment and validation of the built homology model (Table 19 & Table 20). Protein Preparation Wizard was involved in in the energy minimization of the 3D structure using the OPLS 2005 force field, with a default setting of 0.3 Å for the root mean square deviation (RMSD). The 3D model was examined via Ramachandran plot and Errat score and Model.5 was found to be more accurate [24].
Table 19.
Top 10 threading templates used by I-TASSER.
| Rank | PDB Hit | Iden1 | Iden2 | Cov | Z-score |
|---|---|---|---|---|---|
| 1. | 7dh5A | 0.25 | 0.27 | 0.94 | 4.55 |
| 2. | 7s0fR | 0.27 | 0.29 | 0.92 | 1.97 |
| 3. | 6zfz | 0.22 | 0.30 | 0.99 | 0.98 |
| 4. | 6zfz | 0.22 | 0.30 | 0.99 | 0.75 |
| 5. | 7e32R | 0.22 | 0.23 | 0.96 | 2.70 |
| 6. | 6zfz | 0.22 | 0.30 | 0.99 | 1.09 |
| 7. | 6iblA | 0.27 | 0.29 | 0.96 | 4.39 |
| 8. | 7dh5R | 0.25 | 0.27 | 0.94 | 2.54 |
| 9. | 7v3zA | 0.24 | 0.24 | 0.92 | 2.61 |
| 10. | 4ug2A | 0.26 | 0.29 | 0.93 | 3.02 |
Table 20.
Top 5 final models predicted by I-TASSER.
| Generated model | Procheck | Errat | C-score |
|---|---|---|---|
| Model 1 | 87.8% | 92.0578 | 0.48 |
| Model 2 | 85.0% | 94.2238 | -4.93 |
| Model 3 | 86.2% | 93.120 | -1.86 |
| Model 4 | 87.8% | 86.154 | -2.71 |
| Model 5 | 90.9% | 87.0036 | -0.53 |
3.6.3. Homology Modelling by Robetta:
The Robetta server (http://robetta.bakerlab.org) provides automated tools for protein structure prediction and analysis. For structure prediction, sequences were submitted to the server and parsed into putative domains and structural models are generated using comparative modelling structure prediction methods. Generated models Discussed in Table 21. Experimental constraints data (NMR, Cryo-EM and XRD data) also be submitted with a query sequence for Rosetta structure determination also validated via Ramachandran plot and Errat Score and Model.1 was found to be more accurate [25].
Table 21.
Models Predicted by Robetta webserver.
| Generated model | Procheck | Errat |
|---|---|---|
| a. Model 1 | 93.7% | 94.58 |
| b. Model 2 | 90.2% | 95.30 |
| c. Model 3 | 88.6% | 94.94 |
| d. Model 4 | 87.9% | 100 |
| e. Model 5 | 85.2% | 92 |
| f. Model 6 | 86.6% | 88 |
| g. Model 7 | 80.1% | 91 |
| h. Model 8 | 79.1% | 93.22 |
| i. Model 9 | 82.6% | 88.12 |
| j. Model 10 | 78.22% | 85.33 |
3.6.4. Homology Modelling by Swiss Model:
In comparative modelling, a 3D protein model of a GPR119 receptor sequence is generated by: Input data: The target protein amino acid sequence put in FASTA format from the NCBI database. Template search: Data provided in step1 was served as a query to search for evolutionary related protein structures against the SWISS-MODEL template library SMTL. Template selection: The template search was completed, templates are ranked according to expected quality of the resulting models, as estimated by Global Model Quality Estimate (GMQE) so based on this 6ni3 and 7e32 PDB were choose as a template for model building (Table 22). Model building: Each selected template (6ni3 and 7e32), a 3D protein model was automatically generated by first transferring conserved atom coordinates as defined by the target template alignment. Model quality estimation: To quantify modelling errors and give estimates on expected model accuracy by QMEAN score Ramachandran Plot and Errat score and Model.1 was found to be more accurate (Table 23) [26].
Table 22.
PDB Hits Predicted by Swiss model webserver.
| PDB ID | GMQE | METHOD |
|---|---|---|
| 6ni3 | 0.67 | EM |
| 6ibl | 0.67 | XRD |
| 7e32 | 0.67 | EM |
| 6e67 | 0.67 | XRD |
| 6h7n | 0.67 | XRD |
Table 23.
Models Predicted by Swiss model webservers.
| Generated model | Procheck | Errat |
|---|---|---|
| a. Model 1 | 94.1% | 90.074 |
| b. Model 2 | 92.1% | 88.645 |
| c. Model 3 | 91.7% | 89.925 |
| d. Model 4 | 90.1% | 85.818 |
| e. Model 5 | 91.3% | 88.148 |
| f. Model 6 | 93.3% | 92.989 |
3.6.5. Refinement of the Best Protein Model
Three-dimensional protein structures provide invaluable information for understanding and regulating biological functions of proteins. We generated total 31 Homology Models from different tools and the model generated by SwissModel server was found to be more accurate among all. To increases the accuracy of the generated model for further docking study to improve the drug-ligand interaction. We submit a refinement job in GalaxyWEB to provide a model structure generated by SwissModel (Model.1) to refine. Refined model Details discussed in Table 24. Among all ten models, Model 3 found to be more accurate based on their different validation parameter for further docking studies (Figure 12) [27].
Table 24.
REFINEMENT- GALAXY WEB.
| Model | RMSD | MolProbity | Clash score | Poor rotamers | Rama favoured | GALAXY energy |
|---|---|---|---|---|---|---|
| Initial | 0.000 | 1.421 | 3.4 | 0.8 | 95.7 | -3853.82 |
| MODEL 1 | 1.609 | 1.301 | 2.5 | 0.0 | 96.1 | -7530.36 |
| MODEL 2 | 2.815 | 1.186 | 2.5 | 0.0 | 97.2 | -7515.12 |
| MODEL 3 | 2.631 | 1.125 | 1.7 | 0.4 | 96.8 | -7479.19 |
| MODEL 4 | 2.826 | 1.231 | 2.5 | 0.0 | 96.8 | -7466.99 |
| MODEL 5 | 1.598 | 1.224 | 1.7 | 0.0 | 95.7 | -7460.29 |
| MODEL 6 | 1.841 | 1.252 | 2.1 | 0.4 | 96.1 | -7459.13 |
| MODEL 7 | 0.989 | 1.219 | 2.1 | 0.0 | 96.5 | -7447.88 |
| MODEL 8 | 2.104 | 1.244 | 2.3 | 0.0 | 96.5 | -7442.79 |
| MODEL 9 | 0.711 | 1.195 | 1.7 | 0.0 | 96.1 | -7438.90 |
| MODEL 10 | 2.544 | 1.254 | 2.7 | 0.0 | 96.8 | -7437.72 |
3.7. Molecular Docking
Our research delved into the realm of intermolecular interactions, specifically between a protein model representing GPR119 and small chemical molecules sourced from datasets, namely SwissSimilarity and the Zinc Database. Additionally, we examined interactions with chemically designed structures through molecular docking studies. This investigation aimed to shed light on the binding modes responsible for stimulating the protein. An essential prerequisite for conducting such studies is a high-resolution protein structure. However, in our project, the structural information for the GPR119 receptor was unavailable. Consequently, we adopted the approach of generating a homology-modelled structure for the GPR119 receptor. Subsequently, we employed this homology model to facilitate docking investigations, providing valuable insights into the interactions between the receptor and the chemical ligands. Molecular Docking studies were performed by the Glide (Grid-based Ligand Docking with Energetics) module of Schrodinger Maestro v13.5, favourable interactions between a GPR119 receptor molecule obtained from the Homology modelling (Model.3) and one or more ligand molecules from Database structure or Designed Structures. Steps for molecular docking discussed in following section:
Protein Preparation: The accuracy of glide results depends on the validity of the protein initial structures. It is strongly encouraged that the processed protein was used to receive the best docking results. In this step we were added a homology modelled protein structure to Maestrov13.5. All waters (apart from those coordinated to metals) was removed. The protein structure was minimalized with caution. By using a user-selected RMSD tolerance, the minimization was constrained to the input protein coordinates and the produced structures to ensure that water molecules were oriented correctly and that steric conflicts and H-bonding issues have been resolved. Ligand preparation: The docked Dataset (Zinc and Swissimilarity) and design compounds must accurately reflect the real ligand structures as they would look in a protein-ligand complex in order to produce the best results. With the use of 2D or 3D structures in the mol2 formats, the Schrödinger ligand preparation product LigPrep can create high-quality, all-atom 3D structures for numerous drug-like compounds. The LigPrep procedure was made up of several processes that converted data into correct structures, create variants on structures, get rid of unnecessary structures, and optimise structures. Sitemap Generation: To understand the structure and exploiting the function of protein active sites. For molecular docking study location of a binding site for protein-ligand remains unknown. SiteMap proven algorithm for binding site identification and evaluation can help researchers to locate binding sites with a high degree of confidence and predict the draggability of those sites. For our study 5 different sitemap was generated for better accuracy. Receptor Grid Generation: It is not possible to start a ligand docking job until the receptor grids have been produced. A prepared homology model structure with the proper bond ordering and formal charges, is necessary for receptor grid formation. The force field utilised for grid generation is the OPLS 2005. Ligand Docking: Glide ligand docking jobs require a set of previously calculated receptor grids and Dataset structures [28,29,30,31].
Here instead of individual docking of each ligand, we made chemical library using SwissSimilarity and Zinc Database of already existing chemical moiety and also Designed compounds library made up from Pharmacophore modelling and 3D-QSAR analysis; with each protein grid, we have done a module name Virtual Screening Workflow. Here three approaches of molecular docking we have done- HTVS (High Throughput Virtual Screening), SP (Standard Precision), XP (Extra Precision) approaches to screen a huge number of hit molecules for Lead molecule findings. In every stage HTVS to XP, the generated number of spatial conformations usually increased as the XP docking score in the most accurate and acceptable.
HTVS (100%)> SP (10%)> XP (1%)
3.7.1. Molecular Docking of Chemical Library
3.7.1.1. Swiss Similarity
Obtaining the smile format of each of the 35 compounds has been uploaded in Swiss similarity and according to the similarity values the compounds are taken to design compounds library for structure-based drug design (3188 compounds). In this process, pharmacophore mapping, scaffold hopping, electro shape and combined approaches have been used to screen the compounds and their cut-off similarity values are threshold above 0.89. All the compounds in the datasets were docked in the binding site of the GPR119 receptor to understand the binding interactions of these compounds with the receptor. Using Swiss Similarity Database as set of ligands and protein GPR119 as target, docking is performed resulting into the interactions which are essential for GPR119 Agonistic activity. Top 15 potent compounds (Table 25) have shown good interaction results with receptor GPR119, with good docking score on interaction (Figure 13) with GPR119 receptor. These binding interactions are significant for the Agonistic activity against GPR119 receptor. The Below interactions can be considered for further development of novel GPR119 Agonist for antidiabetic potential [32].
Figure 13.
Representation of Model.3 (A) Ramachandran plot of (B) Final Refine Homology Model.
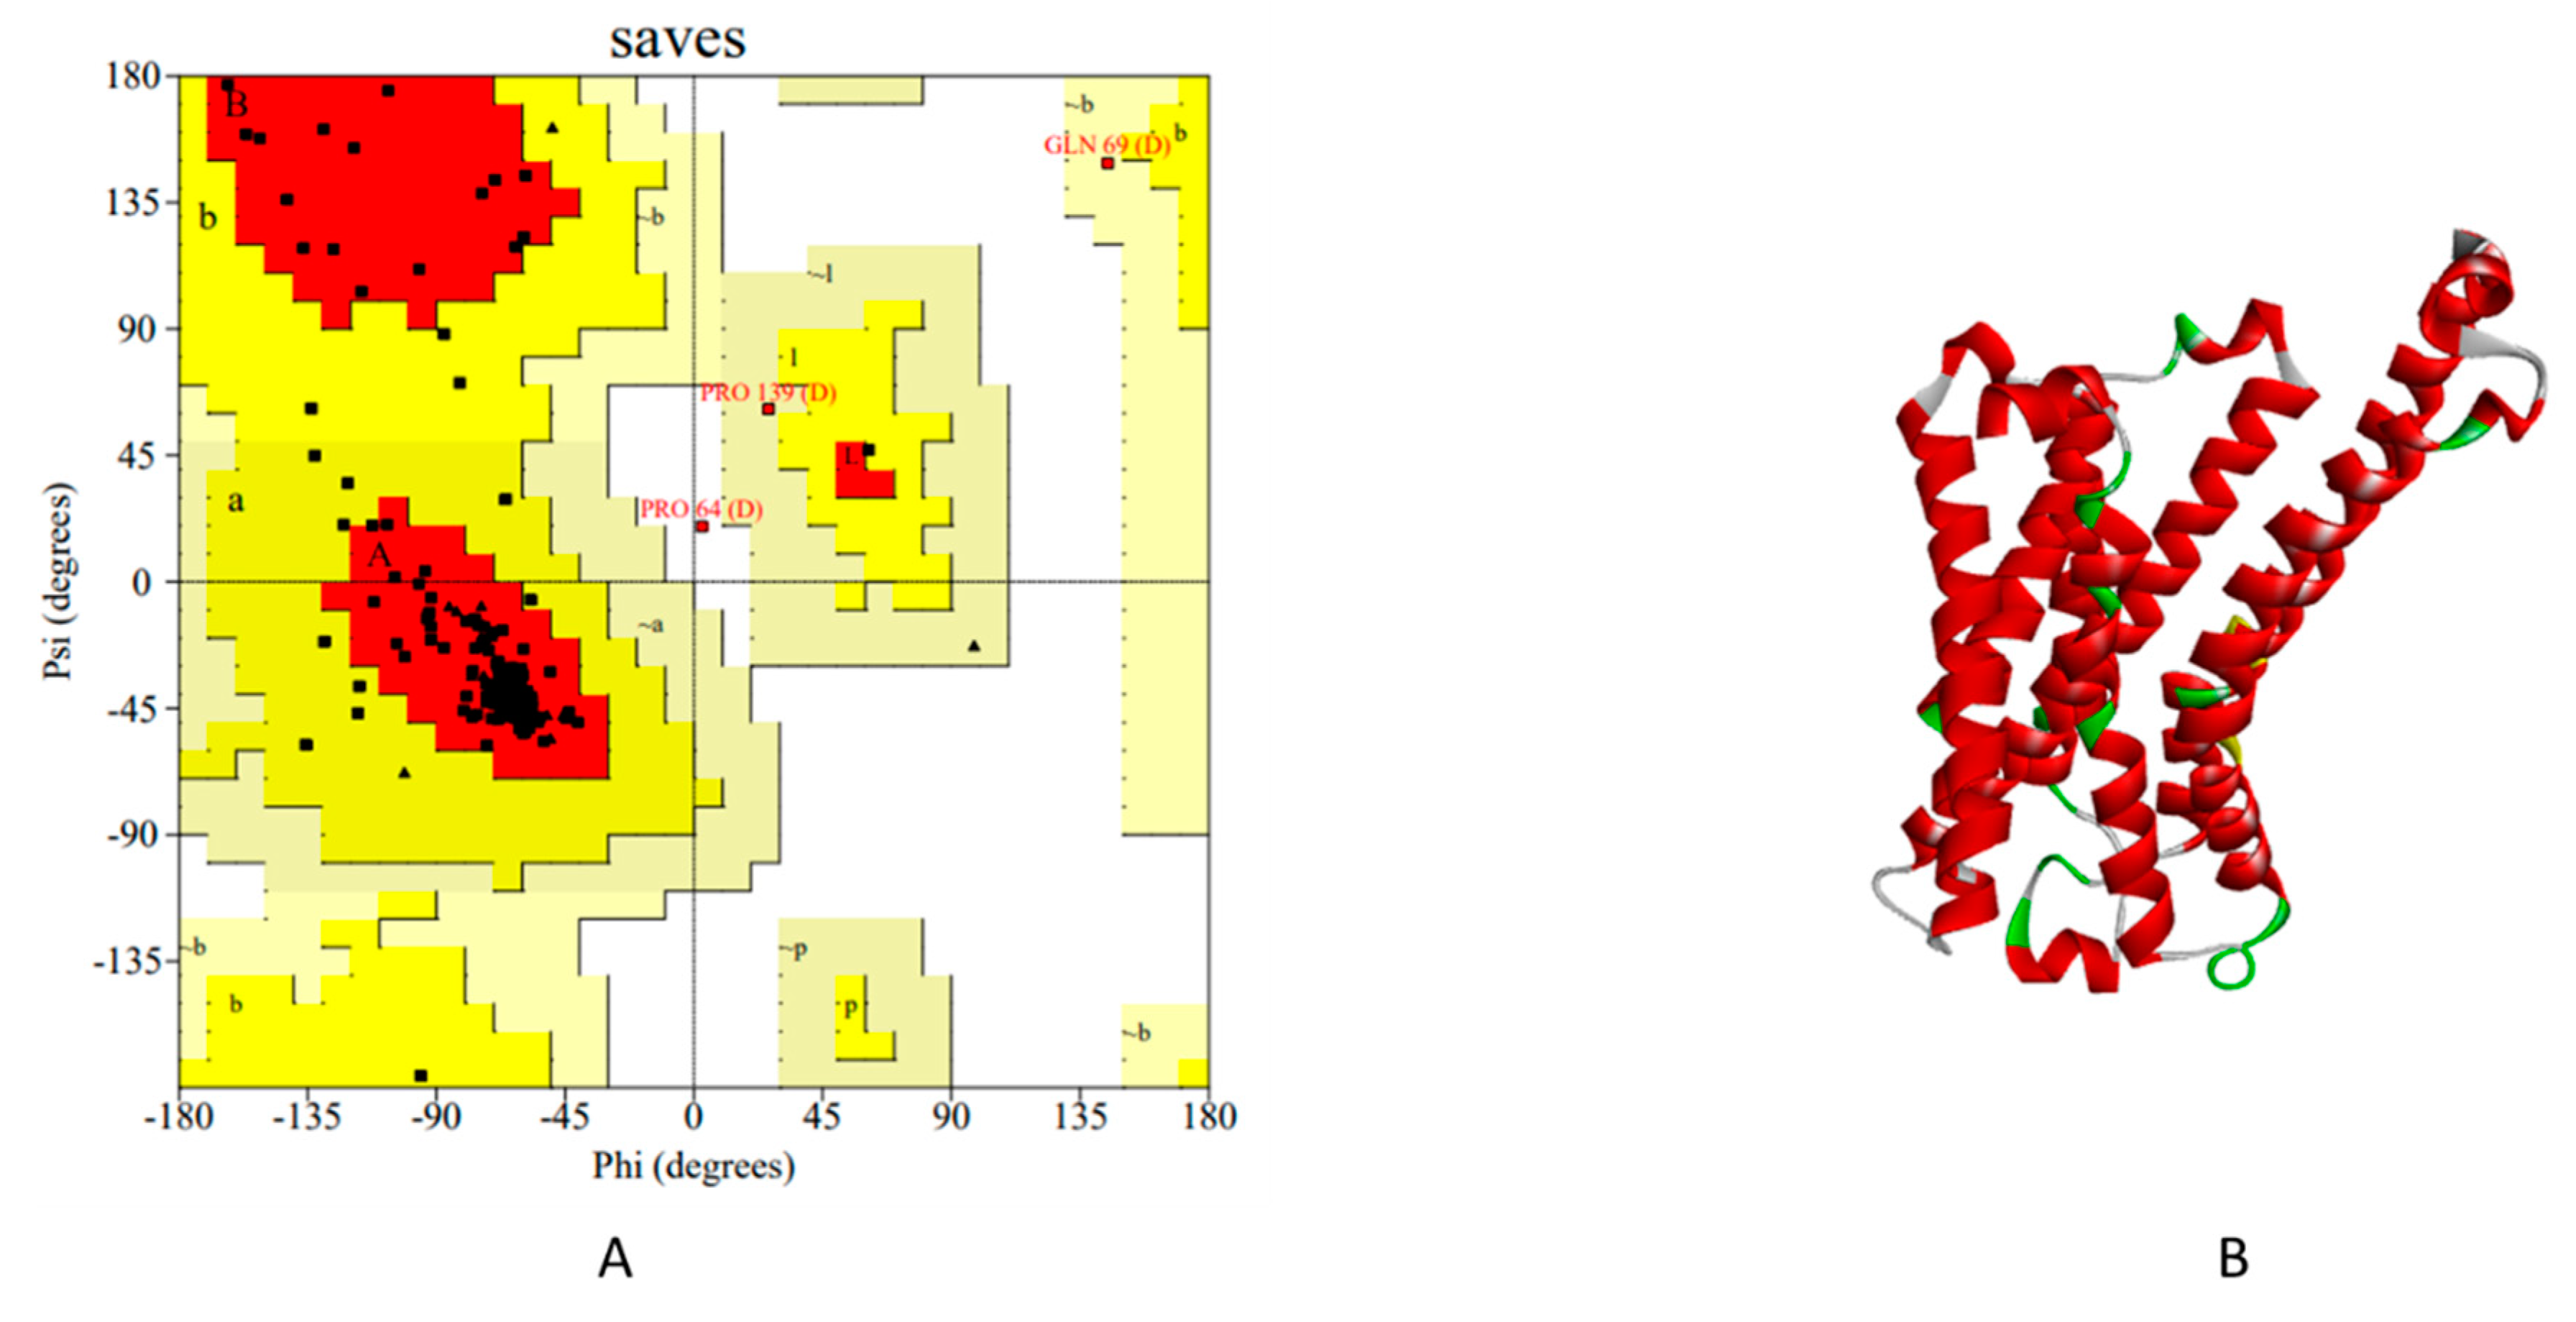
Table 25.
List of selected top scored Compounds in Swiss Similarity Database.
| Compound Code | Compound Structure | Docking Score | Glide Score | Glide emodel |
|---|---|---|---|---|
| 1S |  |
-11.696 | -11.696 | -92.980 |
| 2S | 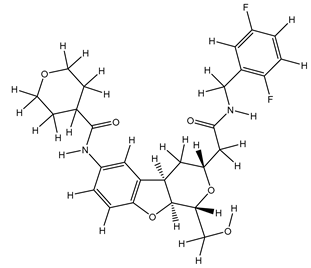 |
-11.646 | -11.646 | -92.783 |
| 3S | 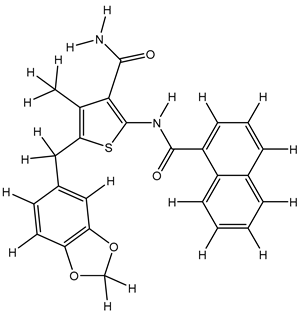 |
-10.486 | -10.486 | -83.250 |
| 4S |  |
-9.396 | -9.396 | -73.399 |
| 5S |  |
-8.871 | -8.871 | -89.744 |
| 6S | 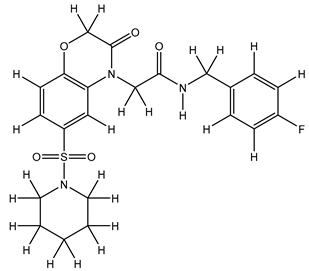 |
-8.314 | -8.314 | -76.180 |
| 7S | 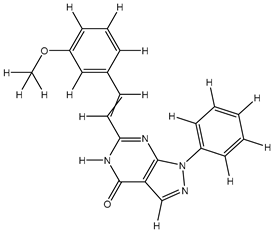 |
-8.263 | -8.267 | -60.831 |
| 8S | 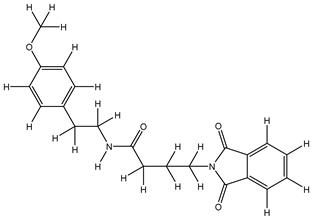 |
-8.189 | -8.189 | -59.884 |
| 9S | 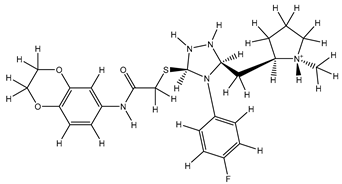 |
-8.092 | -8.093 | -71.204 |
| 10S | 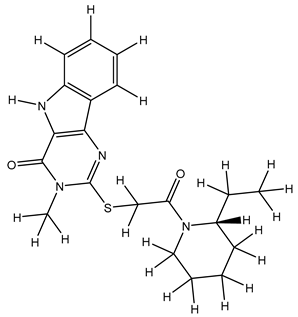 |
-7.952 | -7.952 | -73.802 |
| 11S | 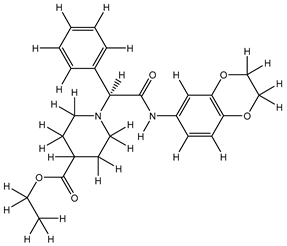 |
-7.813 | -7.813 | -66.468 |
| 12S | 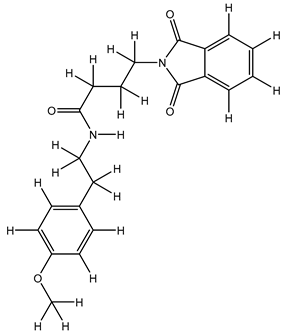 |
-7.169 | -7.465 | -77.221 |
| 13S | 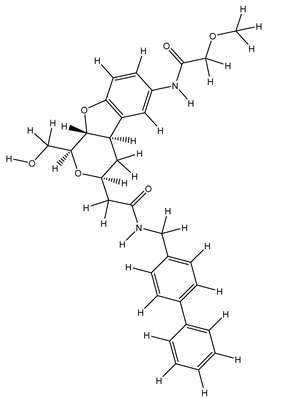 |
-6.975 | -6.975 | -61.712 |
| 14S | 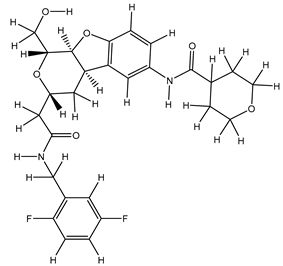 |
-6.511 | -6.511 | -75.519 |
| 15S |  |
-6.269 | -6.269 | -74.090 |
3.7.1.2. Zinc database:
Within the context of the Zinc Pharmer platform, compounds are selected from the library based on their lowest Root Mean Square Deviation (RMSD) values. This metric quantifies the degree of similarity between a given compound from our dataset, which belongs to the series of 35 derivatives, and the compounds present in the database. This postulate guided our screening process, where we conducted an extensive examination of 6464 compounds. We employed a tool known as the virtual screening workflow integrated with molecular docking studies. This approach, rooted in computational techniques, was instrumental in identifying promising compounds for further exploration within the domain of structure-based drug design. Top 15 potent compounds (Table 26) have shown good interaction results with receptor GPR119, with good docking score on interaction (Figure 14) with GPR119 receptor [33].
Figure 14.
Binding cavity and 2D interaction of best docked compound 1S with Receptor GPR119.
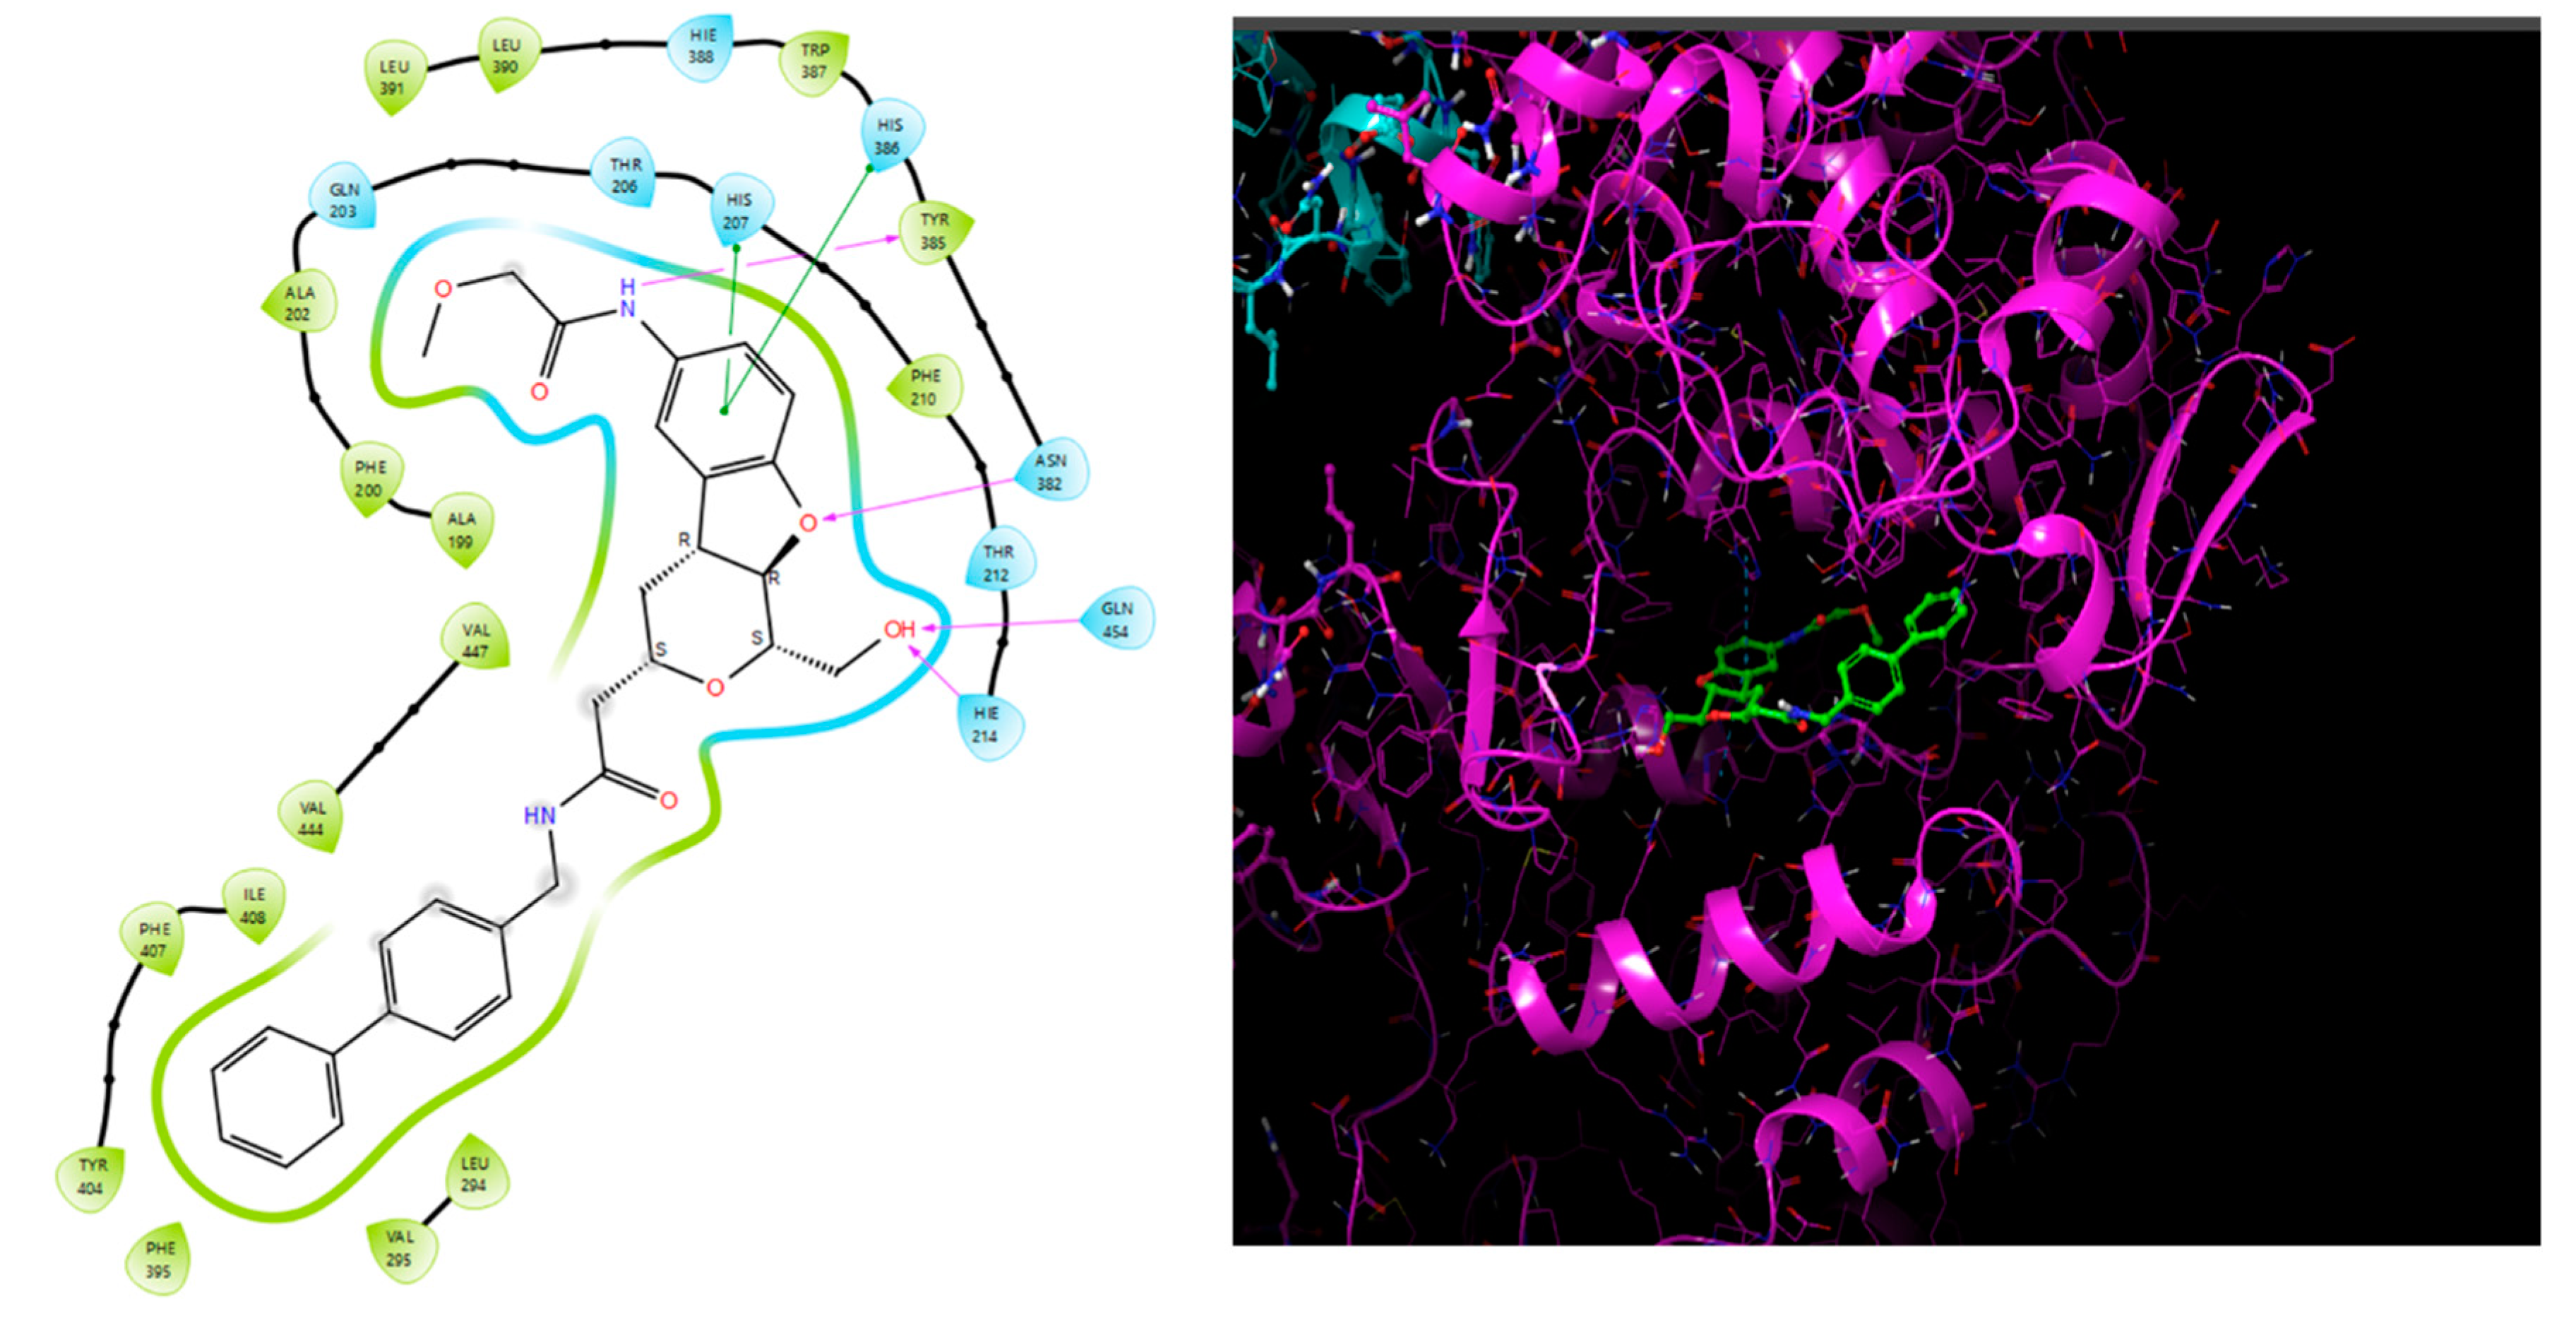
Table 26.
List of selected top scored Compounds in Zinc Database.
| Compound Code | Structure | Zinc Id | Docking Score | Glide Score | Glide emodel |
|---|---|---|---|---|---|
| 1Z |  |
ZINC000475405859 | -9.314 | -9.314 | -63.066 |
| 2Z | 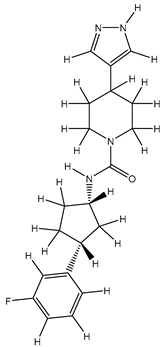 |
ZINC000475405855 | -9.308 | -9.308 | -66.037 |
| 3Z | 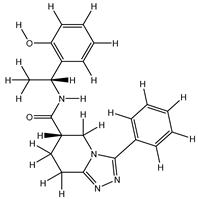 |
ZINC000827952435 | -8.511 | -8.511 | -70.233 |
| 4Z | 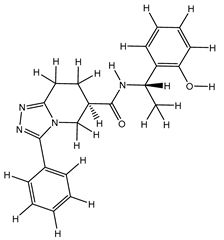 |
ZINC000827952435 | -8.203 | -8.203 | -71.484 |
| 5Z | 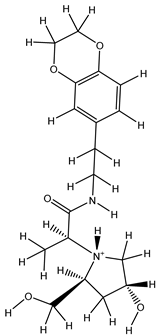 |
ZINC000475254957 | -8.867 | -8.867 | -60.449 |
| 6Z |  |
ZINC000475254963 | -8.867 | -8.867 | -60.449 |
| 7Z |  |
ZINC000004255815 | -8.457 | -8.457 | -62.914 |
| 8Z |  |
ZINC000075283043 | -8.398 | -8.399 | -62.771 |
| 9Z |  |
ZINC000016671076 | -8.381 | -8.381 | -60.642 |
| 10Z | 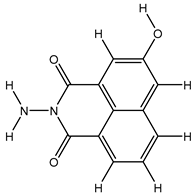 |
ZINC000005059642 | -8.091 | -8.126 | -56.200 |
| 11Z | 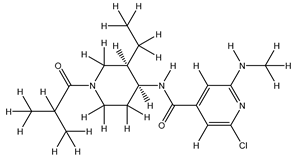 |
ZINC000096928013 | -7.964 | -7.964 | -62.346 |
| 12Z | 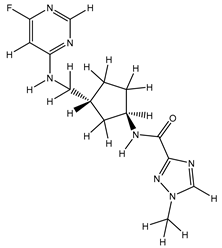 |
ZINC001069463124 | -7.914 | -7.914 | -66.350 |
| 13Z | 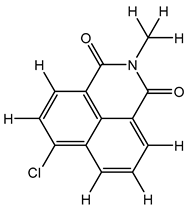 |
ZINC000003897044 | -7.894 | -7.894 | -55.195 |
| 14Z |  |
ZINC000004156458 | -7.686 | -7.686 | -50.661 |
3.7.1.3. Designing of New Compounds
On the basis of data interpretations of 3D-QSAR, pharmacophore modelling some new 10 compounds have been designed as shown in Table 27. During the design of new compounds, desirable changes were made to get better activity against Diabetes Mellitus. The binding affinities of the designed compounds were checked by molecular docking using Schrodinger Maestro v13.5 software (Figure 15).
Figure 15.
Binding cavity and 2D interaction of best docked compound 1Z with Receptor GPR119.
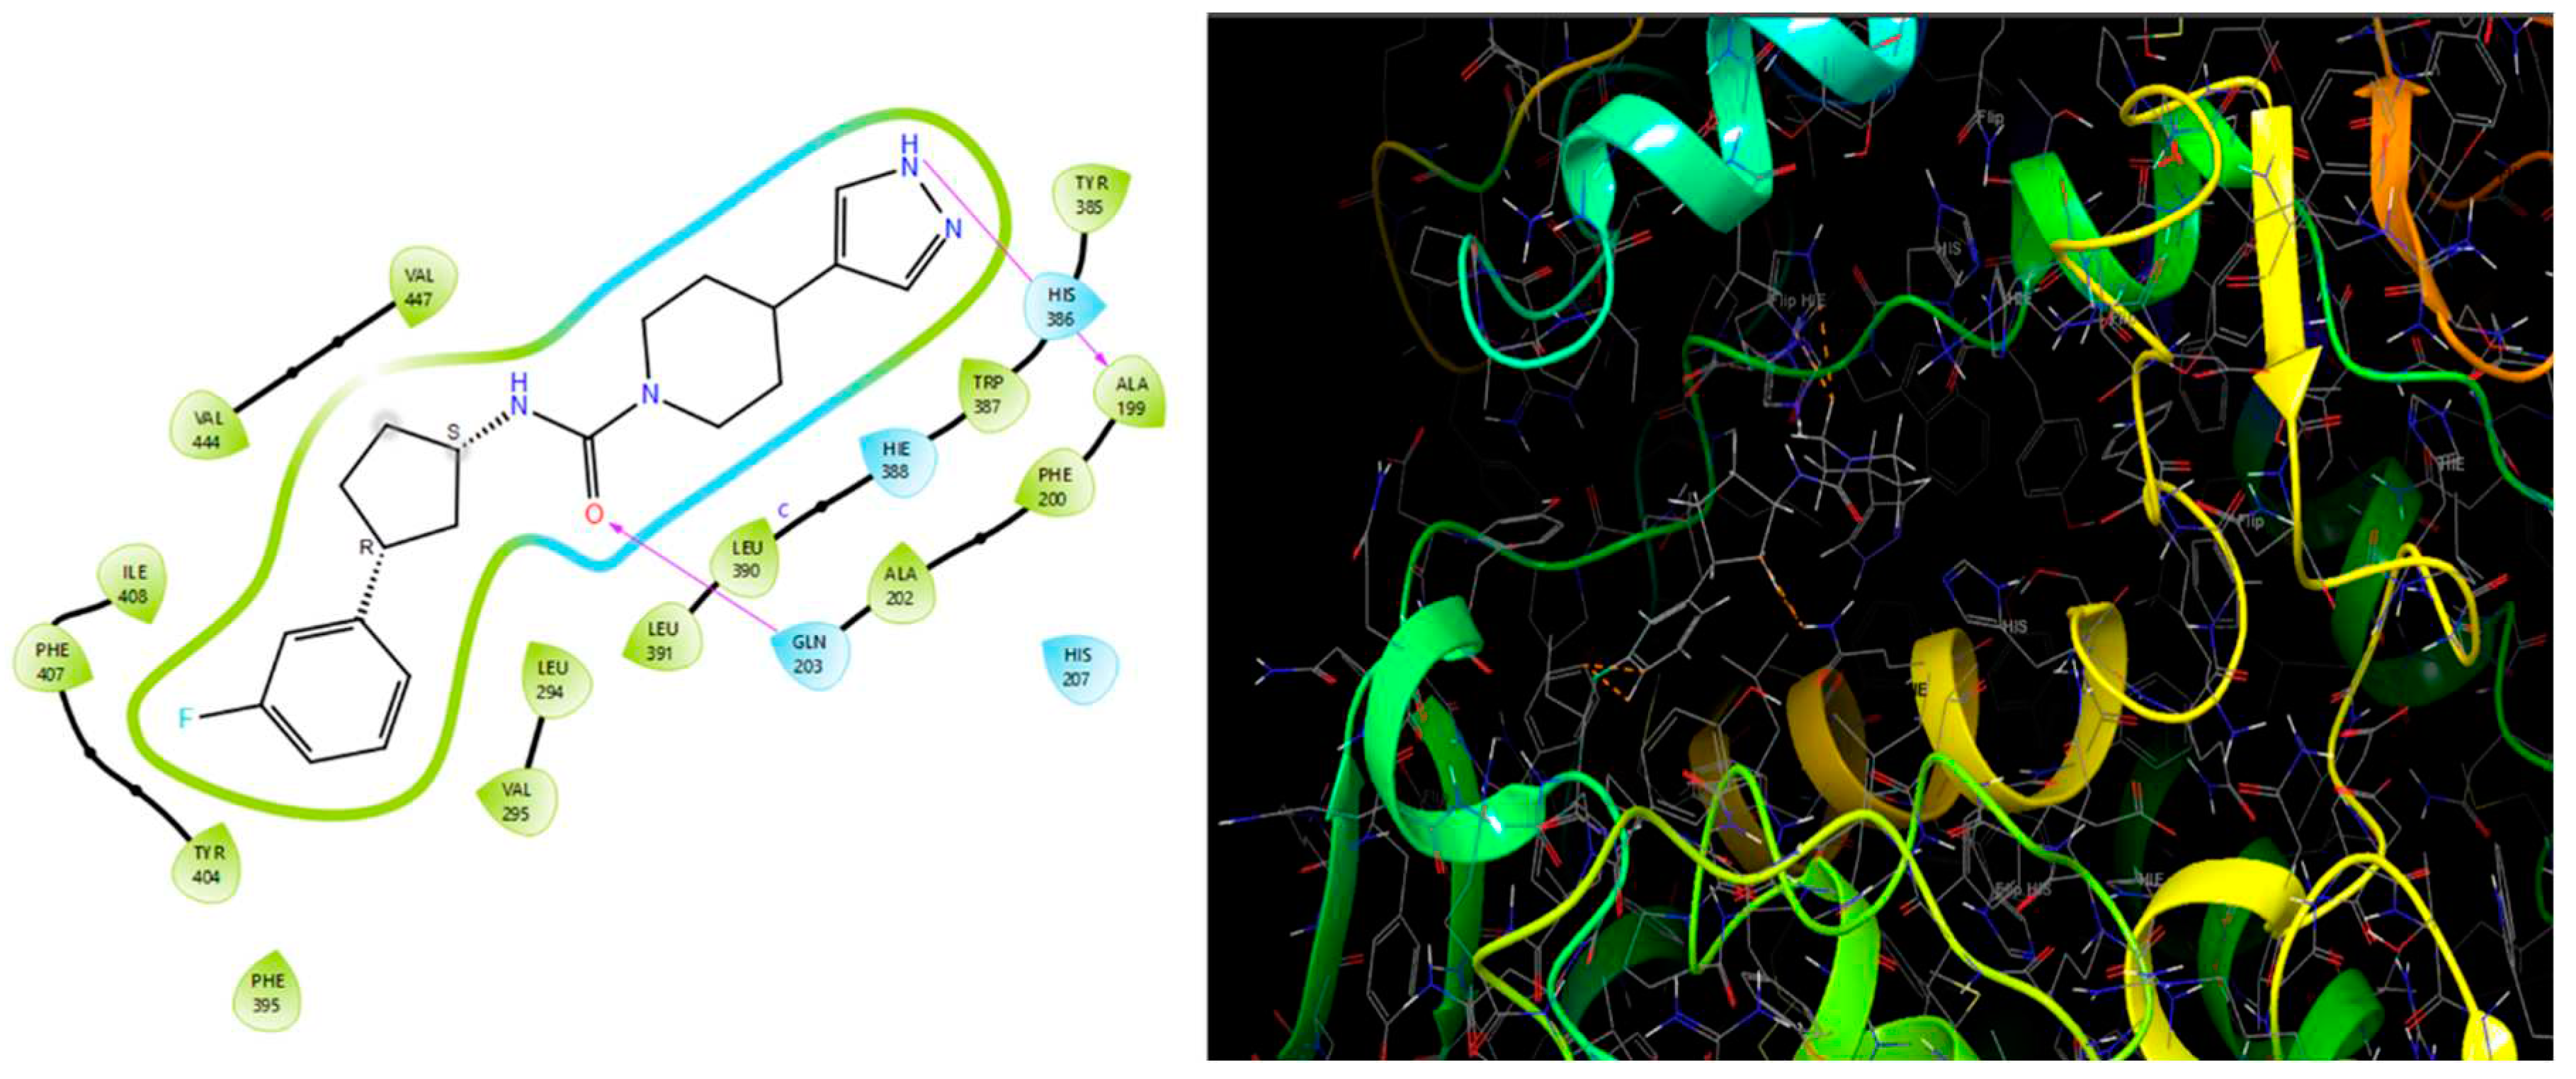
Figure 16.
Binding cavity and 2D interaction of best docked compound 1D with Receptor GPR119.
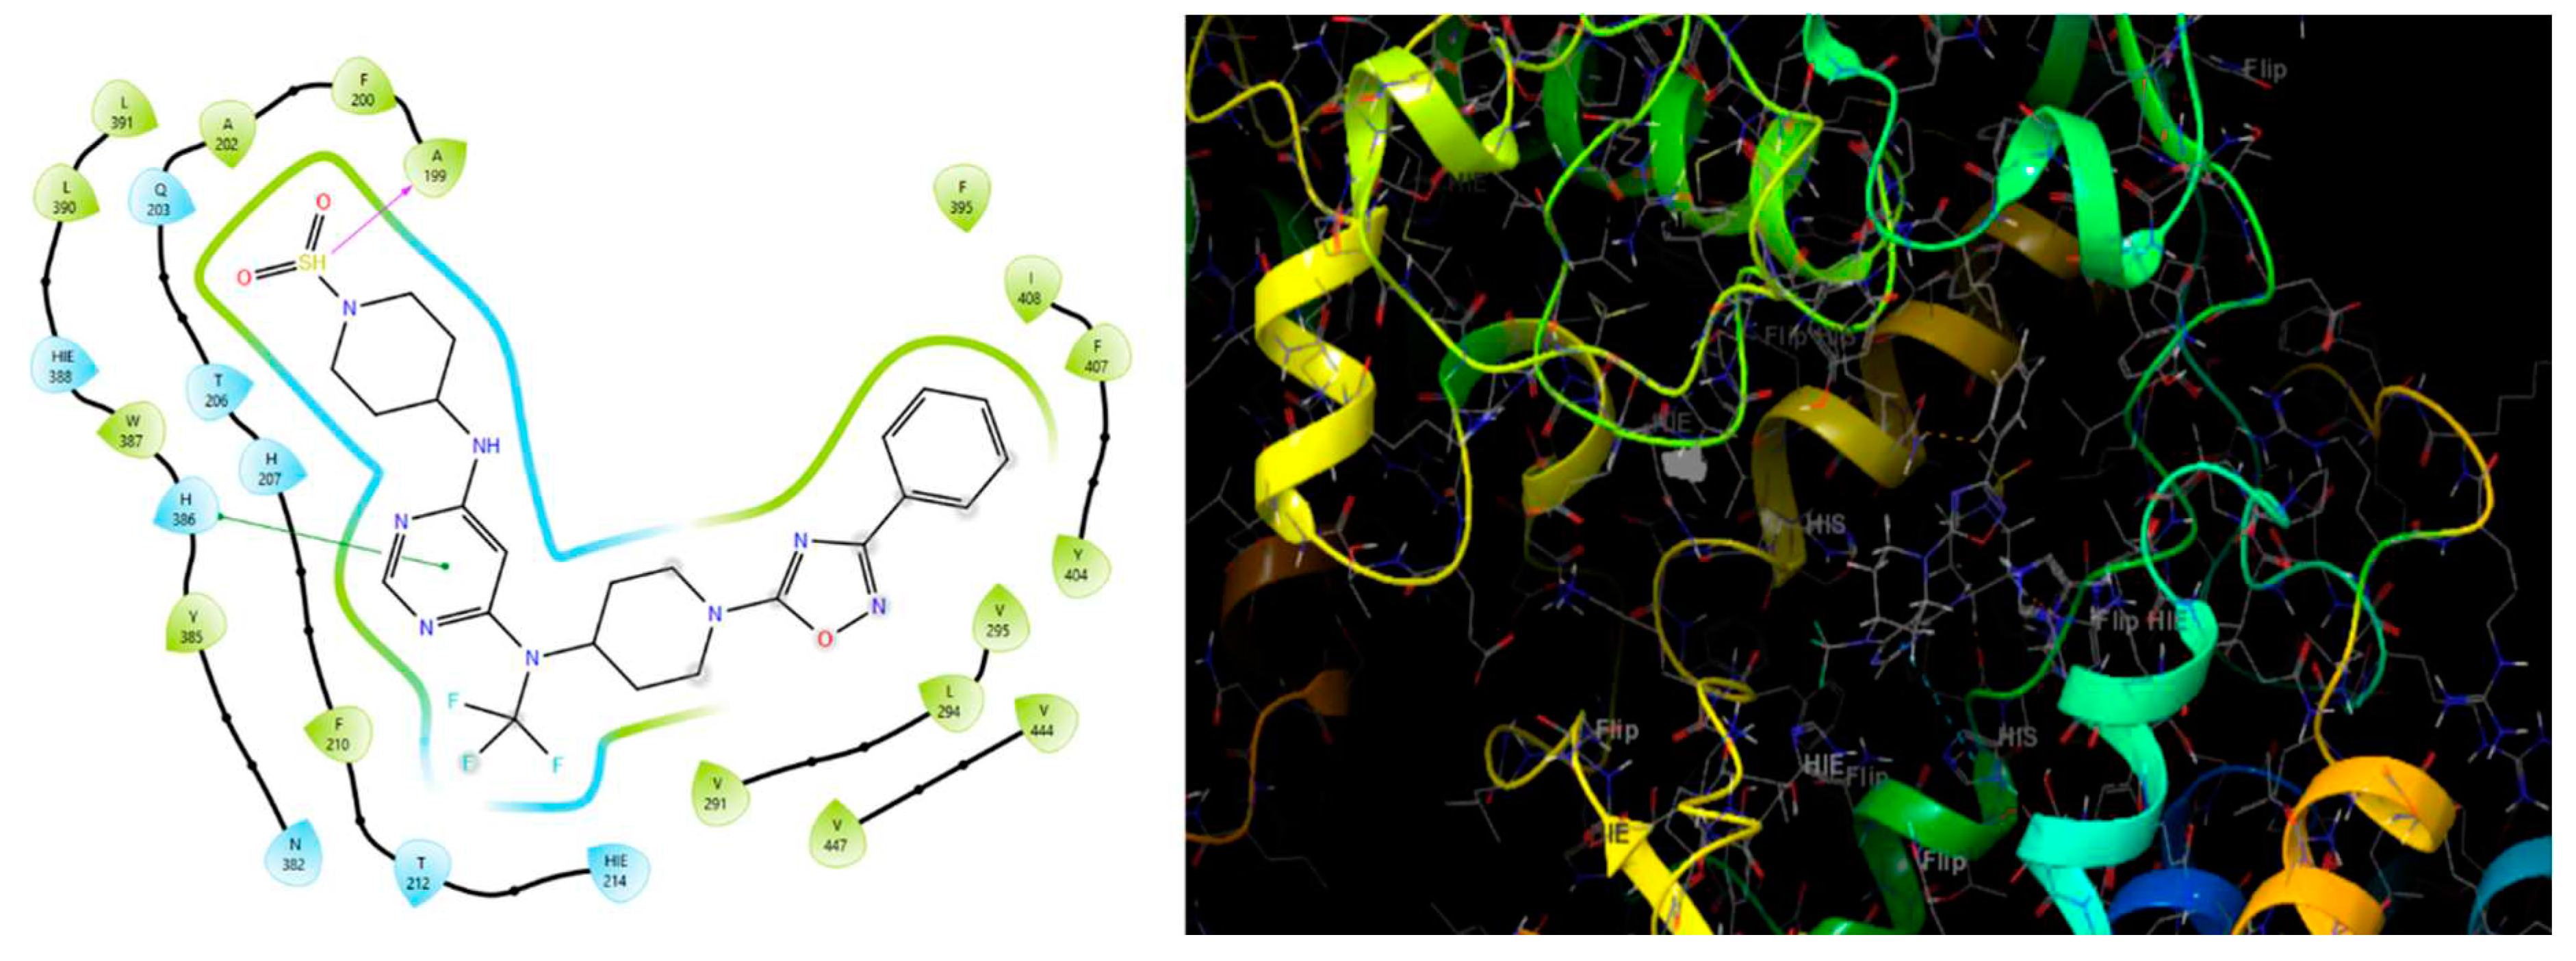
Table 27.
List of the designed compounds on the basis of the SAR of the Parent Molecule.
| Compound Code | Structure | Docking Score | Glide Score | Glide emodel |
|---|---|---|---|---|
| 1D | 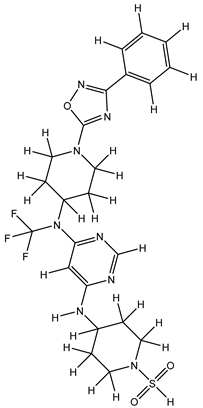 |
-8.721 | -8.744 | -89.229 |
| 2D | 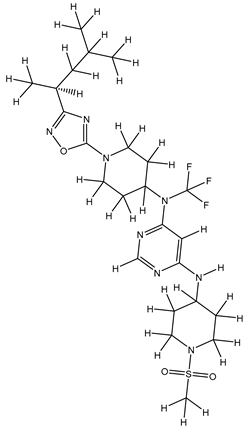 |
-8.519 | -8.547 | -72.262 |
| 3D | 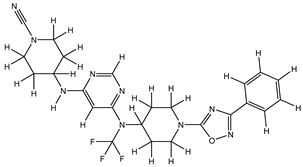 |
-7.964 | -8.028 | -85.860 |
| 4D | 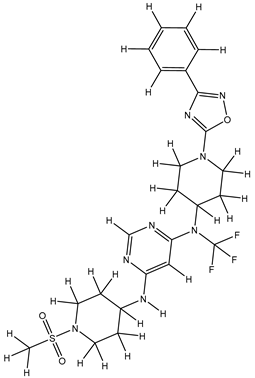 |
-7.539 | -7.567 | -72.278 |
| 5D | 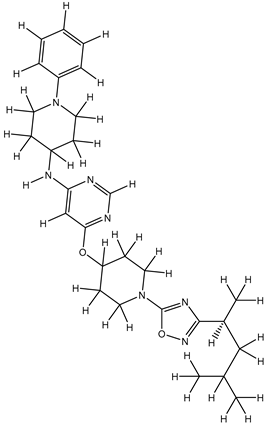 |
-7.311 | -7.387 | -67.306 |
| 6D | 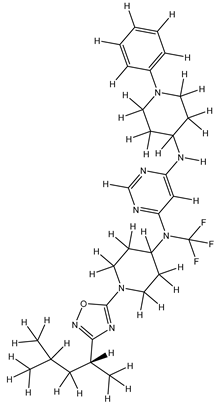 |
-7.242 | -7.352 | -57.416 |
| 7D | 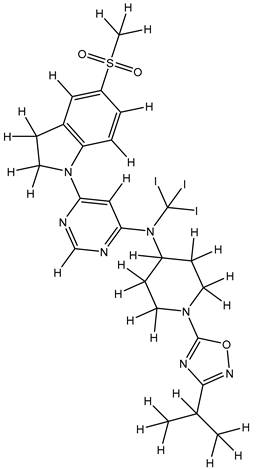 |
-7.118 | -7.390 | -86.241 |
| 8D | 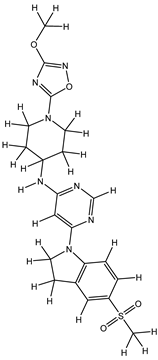 |
-7.038 | -7.557 | -76.340 |
| 9D | 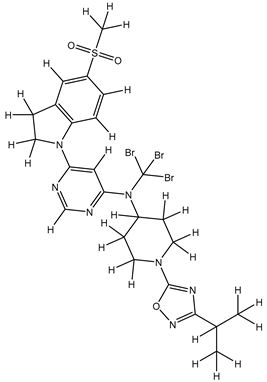 |
-6.423 | -6.763 | -65.122 |
| 10D | 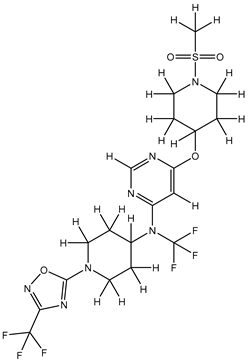 |
-6.029 | -6.030 | -65.503 |
3.8. Validation of Docking results
The docking analysis yielded a selection of 39 compounds. These 39 compounds exhibited superior activity levels in comparison to the most potent compounds, namely Compound 15 and Compound 35 (Table 5), which were initially utilized in the QSAR and Pharmacophore mapping studies, as substantiated by our research findings.
Table 28.
Docking result of Most potent compound of the series.
| Compound Code | Structure | Docking Score | Glide Score | Glide emodel |
|---|---|---|---|---|
| 15 | 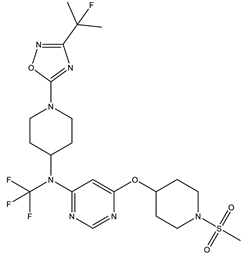 |
-6.457 | -6.457 | -66.070 |
| 35 | 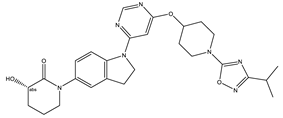 |
-5.758 | -5.758 | -64.544 |
3.9. Pharmacological Prediction
In our study, we assessed the pharmacological and ADME/T (Absorption, Distribution, Metabolism, Excretion, and Toxicity) properties of the compounds, focusing on their behaviour within the human body. We employed the QikProp module, a computational tool provided by Schrodinger, for this purpose. Evaluating ADME/T properties is vital as they provide insight into the pharmacokinetic profile of drug molecules, which is crucial in understanding their pharmacodynamic activities. For the ADME study, we selected compounds from the entire chemical library based on their docking scores and interactions. These selected compounds underwent scrutiny through the ADMET software module, which predicted various physicochemical properties. These properties encompassed lipophilicity, water solubility, pharmacokinetics, drug-likeness, lead-likeness, and synthetic accessibility. The Schrodinger ADME tool was instrumental in determining these properties. To assess drug-likeness, we applied the Lipinski (Pfizer) filter criteria, which includes molecular weight (MW) ≤ 500, MLOGP ≤ 4.15, N or O ≤ 10, and NH or OH ≤ 5. Additionally, we applied the Ghose filter criteria with limits such as 160 ≤ MW ≤ 480, -0.4 ≤ WLOGP ≤ 5.6, 40 ≤ MR (molar refractivity) ≤ 130, and 20 ≤ atoms ≤ 70. Furthermore, we examined lead-likeness, employing criteria of 250 ≤ MW ≤ 350, XLOGP ≤ 3.5, and a maximum of 7 rotatable bonds. Synthetic accessibility, indicating the ease of compound synthesis, was also considered, ranging from 1 (very easy) to 10 (very difficult). Our results, as presented in Table 28, highlighted that the compounds within the screened chemical library exhibited promising ADME properties, with a hydrogen-bond donor range between 0 and 4, hydrogen-bond acceptor range between 3 and 7, rotatable bond range between 1 and 4, and a molecular weight falling within the 300-500 range. The lipophilicity profile of these selected compounds indicated a favourable balance between lipophilic character and high gastrointestinal absorption. In assessing drug-likeness, we applied Lipinski and Ghose filters, which indicated that the compounds adhered to desirable drug-like properties. Moreover, the synthetic accessibility of these compounds was found to be moderate, suggesting that their synthesis is feasible. This comprehensive evaluation of ADME/T properties enhances our understanding of these compounds and their potential as drug candidates [34,35].
Table 29.
Physicochemical properties to evaluate drug likeness of selected compounds.
| Compound Code | Rotatable bonds | CNS | MW | No. H-bond acceptor | No. H-bond donors | SASA | FOSA | FISA | PISA | Dipole |
|---|---|---|---|---|---|---|---|---|---|---|
| 1S | 10 | -2 | 516.593 | 10.850 | 3.00 | 874.457 | 333.133 | 138.620 | 402.704 | 3.490 |
| 2S | 9 | -1 | 516.541 | 10.805 | 3.00 | 782.615 | 398.541 | 90.115 | 217.753 | 5.739 |
| 3S | 1 | -1 | 444.504 | 5.500 | 2.000 | 706.642 | 165.958 | 122.796 | 403.537 | 8.058 |
| 1Z | 1 | 0 | 356.442 | 3.500 | 2.00 | 654.469 | 280.681 | 116.896 | 209.907 | 4.701 |
| 2Z | 1 | 0 | 356.442 | 3.500 | 2.00 | 665.594 | 282.569 | 112.801 | 223.267 | 5.685 |
| 3Z | 4 | -1 | 362.430 | 5.250 | 2.00 | 646.565 | 185.693 | 123.145 | 337.727 | 6.645 |
| 1D | 5 | -1 | 552.573 | 11.00 | 1.800 | 552.573 | 276.279 | 147.604 | 254.217 | 5.263 |
| 2D | 8 | -2 | 574.663 | 11.00 | 1.000 | 574.663 | 595.468 | 135.003 | 64.195 | 4.733 |
| 3D | 5 | -2 | 513.524 | 8.500 | 1.000 | 513.524 | 281.353 | 169.078 | 289.640 | 5.040 |
Table 29.
Physicochemical properties to evaluate drug likeness of selected compounds (Cont….).
| Compound Code | PISA | QPlog PC16 |
QPlog Poct |
QPlog Po/w |
QP logS |
CIQP logS |
QPlog Po/w |
QP logS |
CIQP logS |
QPlog Pw |
XPGScore |
|---|---|---|---|---|---|---|---|---|---|---|---|
| 1S | 402.704 | 17.993 | 29.061 | 3.499 | -5.880 | -5.819 | 3.499 | -5.880 | -5.819 | 19.593 | -11.696 |
| 2S | 217.753 | 14.389 | 27.358 | 3.175 | -5.304 | -5.494 | 3.175 | -5.304 | -5.494 | 17.683 | -11.646 |
| 3S | 403.537 | 14.400 | 21.985 | 4.532 | -6.274 | -7.353 | 4.532 | -6.274 | -7.353 | 12.249 | -10.486 |
| 1Z | 209.907 | 11.516 | 19.120 | 3.935 | -5.882 | -4.978 | 3.935 | -5.882 | -4.978 | 11.702 | -9.308 |
| 2Z | 223.267 | 11.628 | 19.297 | 4.000 | -6.127 | -4.987 | 4.000 | -6.127 | -4.987 | 11.686 | -9.314 |
| 3Z | 337.727 | 12.745 | 19.985 | 3.169 | -4.650 | -4.784 | 3.169 | -4.650 | -4.784 | 13.336 | -8.511 |
| 1D | 254.217 | 15.108 | 27.550 | 3.872 | -6.452 | -7.080 | 3.872 | -6.452 | -7.080 | 16.788 | -8.744 |
| 2D | 64.195 | 14.940 | 26.315 | 4.556 | -7.272 | -7.169 | 4.556 | -7.272 | -7.169 | 13.784 | -8.547 |
| 3D | 289.640 | 15.309 | 24.741 | 4.652 | -7.806 | -7.326 | 4.652 | -7.806 | -7.326 | 13.616 | -8.028 |
Table 29.
Physicochemical properties to evaluate drug likeness of selected compounds (Cont…..).
| Compound Code | QPlog BB |
QPP MDCK |
QPlog Kp |
QPP Caco |
QPlog Khsa |
Human Oral Absorption | Percent Human Oral Absorption | |
|---|---|---|---|---|---|---|---|---|
| 1S | -1.632 | 223.646 | -1.696 | 355.584 | 0.041 | 2 | 80.132 | |
| 2S | -0.658 | 1838.955 | -1.645 | 1180.653 | -0.141 | 3 | 87.565 | |
| 3S | -0.960 | 389.714 | -1.887 | 678.299 | 0.758 | 1 | 100 | |
| 1Z | -0.542 | 676.076 | -2.838 | 468.761 | 0.666 | 3 | 100 | |
| 2Z | -0.535 | 744.409 | -2.716 | 526.185 | 0.672 | 3 | 100 | |
| 3Z | -0.874 | 322.524 | -2.215 | 440.934 | 0.234 | 3 | 92.830 | |
| 1D | -0.979 | 840.397 | -2.864 | 394.609 | 0.343 | 1 | 70169 | |
| 2D | -1.229 | 812.103 | -3.013 | 519.600 | 0.522 | 1 | 76.310 | |
| 3D | -1.455 | 361.20 | -3.135 | 246.906 | 0.755 | 1 | 84.045 |
4. Conclusions
GPR119 has been well established target that essentially regulates the secretion of insulin in the body. Hence, GPR119 agonists can be used to activate the respective receptor that causes enhanced production of intracellular cAMP levels and, in turn, leads to glucose-dependent insulin secretion. In the realm of drug design and discovery, integrated methodologies of molecular modelling like QSAR, pharmacophore mapping and molecular docking-based prediction have been successfully used in a number of statistically supported parameters. Moreover, lack of GPR119 crystallographic structure further contributes to hurdles in the development of potential GPR119 agonists. In this study, we proposed 3D structure for GPR119 by homology modelling and utilized the strategy of SBVS to discover a novel agonist from the Design chemical databases and designed compounds based on the QSAR and Pharmacophore Mapping. The current research on pyrimidine derivatives, using molecular modeling approach demonstrated that it has a sizable antidiabetic effect against the target GPR119 which led to the development of best 3 compounds (1S, 1Z and 1D) with the docking score of −11.696, -9.314 and -8.721 respectively. The pharmacokinetics and drug-likeness studies of these compounds revealed that the compounds could be the best drug candidate against diabetes.
5. Future Prospects
In this current research endeavor, we have undertaken an exhaustive investigative approach encompassing Pharmacophore mapping, 3D-QSAR (Quantitative Structure-Activity Relationship) analysis, Homology Modelling, Molecular Docking, and ADME (Absorption, Distribution, Metabolism, and Excretion) studies. Our focus has been directed towards a series of GPR119 Agonists, with the overarching aim of elucidating their potential as antidiabetic agents. The primary objective of this comprehensive study is to amass critical insights into the structural characteristics that are requisite for the development of potent yet minimally toxic compounds for the treatment of type 2 diabetes mellitus. These meticulously designed compounds will subsequently undergo a rigorous evaluation through Molecular Dynamics Simulations (MDS). The paramount criterion for their further consideration will be their stability ascertained post-MDS analysis. Should these designed compounds exhibit robust stability profiles following MDS, they will be earmarked for synthesis in future research endeavors. The synthesized compounds will then undergo screening to gauge their GPR119 agonistic antidiabetic activities with respect to the GPR119 receptor. Furthermore, the designed molecules hold the potential for repurposing, extending their utility to target other druggable entities beyond their primary antidiabetic role.
Author Contributions
The authors have read and approved the manuscript: Prof. Sushil K. Kashaw and Dr. Shivangi Agarwal; Worked on different aspects of computational design: Priyanshu Nema; Data collection, Data analysis or interpretation: Dr. Varsha Kashaw, Priyanshu Nema and Shivam Kori. Writing the paper Priyanshu Nema and Prof. Sushil K Kashaw; Study concept, design, research supervisor Prof. Sushil K Kashaw and Dr. Arun K Iyar. .
Funding
This research was funded by All India Council for Technical Education, grant number 1-9337642121.
Acknowledgments
We extend our sincere gratitude to Prof. Sushil K. Kashaw for his invaluable guidance and unwavering support throughout this research endeavor. His expertise and mentorship have been instrumental in shaping this study. We express our heartfelt appreciation to Schrodinger for generously providing a one-month free trial for the entire computational study. This support significantly contributed to the success of our research. Our sincere thanks go to the dedicated members of the IDDRL Lab mates Nikhil, Anushka, Priyadarshi, Firdosh, Bishwadip, Chhaya, and Pramod and lovely senior Devyani ma’am, Shivam sir, Satyam sir, Shyamji sir, Rashmi Ma’am. Their collaboration and contributions were pivotal in the execution of this project. We also extend our gratitude to Arpana Purohit for her valuable assistance in the writing and documentation aspects of this work.
Conflicts of Interest
The authors declare no conflict of interest.
References
- Nema, P.; Asati, V.; Kendya, P.; Gupta, T.; Agarwal, S.; Kori, S.; Kashaw, V.; Iyer, A.K.; Kashaw, S.K. Structural Insight on GPR119 Agonist as Potential Therapy for Type II Diabetes: A Comprehensive Review. Mini-Reviews in Medicinal Chemistry 23, 1–33.
- Halban, P.A.; Polonsky, K.S.; Bowden, D.W.; Hawkins, M.A.; Ling, C.; Mather, K.J.; Powers, A.C.; Rhodes, C.J.; Sussel, L.; Weir, G.C. Β-Cell Failure in Type 2 Diabetes: Postulated Mechanisms and Prospects for Prevention and Treatment. Diabetes Care 2014, 37, 1751–1758. [CrossRef]
- Koc, E.M.; Aksoy, H.; Ayhan Başer, D.; Baydar Artantaş, A.; Kahveci, R. Quality Assessment of Clinical Practice Guidelines for Management of Type 2 Diabetes Mellitus: Assessment of Type 2 Diabetes Mellitus Guidelines. Diabetes Res. Clin. Pract. 2019, 152, 119–124. [CrossRef]
- Pazdernik, T. Lippincott’s Illustrated Reviews: Pharmacology, 4th Edition. Med. Sci. Sports Exerc. 2009, 41, 447–463. [CrossRef]
- Moneva, M.H.; Dagogo-Jack, S. Multiple Drug Targets in the Management of Type 2 Diabetes. Curr. Drug Targets 2002, 3, 203–221. [CrossRef]
- Weir, G.C.; Laybutt, D.R.; Kaneto, H.; Bonner-Weir, S.; Sharma, A. The Progression of Diabetes. Diabetes 2001, 50, 154–159.
- Kubo O, Takami K, Kamaura M, Watanabe K, Miyashita H, Abe S, et al. Discovery of a novel series of GPR119 agonists: Design, synthesis, and biological evaluation of N-(Piperidin-4-yl)-N-(trifluoromethyl)pyrimidin-4-amine derivatives. Bioorg Med Chem [Internet]. 2021;41(116208):116208. [CrossRef]
- Kamaura M, Kubo O, Sugimoto H, Noguchi N, Miyashita H, Abe S, et al. Discovery of a novel series of indolinylpyrimidine-based GPR119 agonists: Elimination of ether-a-go-go-related gene liability using a hydrogen bond acceptor-focused approach. Bioorg Med Chem [Internet]. 2021;34(116034):116034. [CrossRef]
- Van Drie JH. Generation of three-dimensional pharmacophore models: Generation of 3D pharmacophore models. Wiley Interdiscip Rev Comput Mol Sci [Internet]. 2013;3(5):449–64. [CrossRef]
- Leach AR, Gillet VJ, Lewis RA, Taylor R. Three-dimensional pharmacophore methods in drug discovery. J Med Chem [Internet]. 2010;53(2):539–58. [CrossRef]
- Schaller D, Šribar D, Noonan T, Deng L, Nguyen TN, Pach S, et al. Next generation 3D pharmacophore modeling. Wiley Interdiscip Rev Comput Mol Sci [Internet]. 2020;10(4):e1468. [CrossRef]
- Raichurkar AV, Kulkarni VM. Understanding the antitumor activity of novel hydroxysemicarbazide derivatives as ribonucleotide reductase inhibitors using CoMFA and CoMSIA. J Med Chem [Internet]. 2003;46(21):4419–27. [CrossRef]
- Gokhale VM, Kulkarni VM. Comparative molecular field analysis of fungal squalene epoxidase inhibitors. J Med Chem [Internet]. 1999;42(26):5348–58. [CrossRef]
- Juvale DC, Kulkarni VV, Deokar HS, Wagh NK, Padhye SB, Kulkarni VM. 3D-QSAR of histone deacetylase inhibitors: hydroxamate analogues. Org Biomol Chem [Internet]. 2006;4(15):2858–68. [CrossRef]
- Kharkar PS, Desai B, Gaveria H, Varu B, Loriya R, Naliapara Y, et al. Three-dimensional quantitative structure-activity relationship of 1,4-dihydropyridines as antitubercular agents. J Med Chem [Internet]. 2002;45(22):4858–67. [CrossRef]
- Kulkarni SS, Kulkarni VM. Three-dimensional quantitative Structure−Activity relationship of interleukin 1-β converting enzyme inhibitors: A comparative molecular field analysis study. J Med Chem [Internet]. 1999;42(3):373–80. [CrossRef]
- Kulkarni SS, Gediya LK, Kulkarni VM. Three-dimensional quantitative structure activity relationships (3-D-QSAR) of antihyperglycemic agents. Bioorg Med Chem [Internet]. 1999;7(7):1475–85. [CrossRef]
- Murthy VS, Kulkarni VM. 3D-QSAR CoMFA and CoMSIA on protein tyrosine phosphatase 1B inhibitors. Bioorg Med Chem [Internet]. 2002;10(7):2267–82. [CrossRef]
- Purushottamachar P, Kulkarni VM. 3D-QSAR of N-myristoyltransferase inhibiting antifungal agents by CoMFA and CoMSIA methods. Bioorg Med Chem [Internet]. 2003;11(16):3487–97. [CrossRef]
- Kwon S, Bae H, Jo J, Yoon S. Comprehensive ensemble in QSAR prediction for drug discovery. BMC Bioinformatics [Internet]. 2019;20(1):521. [CrossRef]
- Dixit, A., Kashaw, S. K., Gaur, S., & Saxena, A. K. (2004). Development ofCoMFA, advance CoMFA and CoMSIA models in pyrroloquinazolines as thrombin receptor antagonist. Bioorganic & Medicinal Chemistry, 12(13), 3591–3598.
- Hameduh T, Haddad Y, Adam V, Heger Z. Homology modeling in the time of collective and artificial intelligence. Comput Struct Biotechnol J [Internet]. 2020;18:3494–506. [CrossRef]
- Webb B, Sali A. Comparative protein structure modeling using MODELLER. Curr Protoc Protein Sci [Internet]. 2016;86(1):2.9.1-2.9.37. [CrossRef]
- Zhou X, Zheng W, Li Y, Pearce R, Zhang C, Bell EW, et al. I-TASSER-MTD: a deep-learning-based platform for multi-domain protein structure and function prediction. Nat Protoc [Internet]. 2022;17(10):2326–53. [CrossRef]
- Kim DE, Chivian D, Baker D. Protein structure prediction and analysis using the Robetta server. Nucleic Acids Res [Internet]. 2004 [cited 2023 Sep 24];32(Web Server):W526–31. [CrossRef]
- Waterhouse A, Bertoni M, Bienert S, Studer G, Tauriello G, Gumienny R, et al. SWISS-MODEL: homology modelling of protein structures and complexes. Nucleic Acids Res [Internet]. 2018;46(W1):W296–303. [CrossRef]
- Seok C, Baek M, Steinegger M, Park H, Lee GR, Won J. Accurate protein structure prediction: what comes next? Korean Soc Struct Biol [Internet]. 2021;9(3):47–50. [CrossRef]
- Dar AM, Mir S. Molecular docking: Approaches, types, applications and basic challenges. J Anal Bioanal Tech [Internet]. 2017;08(02). [CrossRef]
- Sethi A, Joshi K, Sasikala K, Alvala M. Molecular docking in modern drug discovery: Principles and recent applications. In: Drug Discovery and Development - New Advances. IntechOpen; 2020.
- Meza Menchaca T, Juárez-Portilla C, C. Zepeda R. Past, present, and future of molecular docking. In: Drug Discovery and Development - New Advances. IntechOpen; 2020.
- Asati V, Bharti SK, Das R, Kashaw V, Kashaw SK. Discovery of novel ALK2 inhibitors of pyrazolo-pyrimidines: A computational study. J Biomol Struct Dyn [Internet]. 2022;40(20):10422–36. [CrossRef]
- Bragina ME, Daina A, Perez MAS, Michielin O, Zoete V. The SwissSimilarity 2021 web tool: Novel chemical libraries and additional methods for an enhanced ligand-based virtual screening experience. Int J Mol Sci [Internet]. 2022 [cited 2023 Sep 24];23(2):811. Available from: https://www.mdpi.com/1422-0067/23/2/811.
- Koes DR, Camacho CJ. ZINCPharmer: pharmacophore search of the ZINC database. Nucleic Acids Res [Internet]. 2012;40(W1):W409–14. [CrossRef]
- Lipinski CA, Lombardo F, Dominy BW, Feeney PJ. Experimental and computational approaches to estimate solubility and permeability in drug discovery and development settings. Adv Drug Deliv Rev [Internet]. 2012;64:4–17. [CrossRef]
- Teague SJ, Davis AM, Leeson PD, Oprea T. The design of leadlike combinatorial libraries. Angew Chem Int Ed Engl [Internet]. 1999;38(24):3743–8. [CrossRef]
Disclaimer/Publisher’s Note: The statements, opinions and data contained in all publications are solely those of the individual author(s) and contributor(s) and not of MDPI and/or the editor(s). MDPI and/or the editor(s) disclaim responsibility for any injury to people or property resulting from any ideas, methods, instructions or products referred to in the content. |
© 2023 by the authors. Licensee MDPI, Basel, Switzerland. This article is an open access article distributed under the terms and conditions of the Creative Commons Attribution (CC BY) license (https://creativecommons.org/licenses/by/4.0/).
Copyright: This open access article is published under a Creative Commons CC BY 4.0 license, which permit the free download, distribution, and reuse, provided that the author and preprint are cited in any reuse.


