
Submitted:
05 October 2023
Posted:
09 October 2023
Read the latest preprint version here
Abstract
Type 2 diabetes (T2D) has a complex pathophysiology which makes modeling the disease difficult. We aimed to develop a novel model for simulating T2D in vitro, including hyperglycemia, hyperlipidemia, and variably elevated insulin levels targeting muscle cells. We investigated insulin resistance (IR), cellular respiration, mitochondrial morphometry and the associated function in different T2D -mimicking conditions in rodent skeletal (C2C12) and cardiac (H9C2) myotubes. Physiological controls included 5mM glucose with 20mM mannitol as osmotic controls. To mimic hyperglycemia, cells were exposed to 25mM glucose. Further treatments included insulin, palmitate, or both. After short-term (24h) or long-term (96h) exposure, we performed radioactive glucose uptake and mitochondrial function assays. Mitochondrial size and relative frequencies were assessed by morphometric analyses using electron micrographs. C2C12 and H9C2 cells treated short- or long-term with insulin and/or palmitate and HG showed IR. C2C12 myotubes exposed to T2D -mimicking conditions showed significantly decreased ATP-linked respiration and spare respiratory capacity, and less cytoplasmic area occupied by mitochondria, implying mitochondrial dysfunction. In contrast, H9C2 myotubes showed elevated ATP-linked and maximal respiration and increased cytoplasmic area occupied by mitochondria, indicating better adaptation to stress and compensatory lipid oxidation in a T2D environment. Both cell lines displayed elevated fractions of swollen/vacuolated mitochondria after T2D -mimicking treatments.Our stable and reproducible in vitro model of T2D rapidly induced IR, changes in ATP-linked respiration, shifts in energetic phenotypes, and mitochondrial morphology, which are comparable to the muscles of patients suffering from T2D. Thus, our model should allow studying disease mechanisms, potential new targets, and screen candidate therapeutic compounds.
Keywords:
Insulin resistance
; type 2 diabetes
; cell model
; mitochondrial dysfunction
1. Introduction
Diabetes mellitus (DM) represents a large global disease burden with an ominous prognosis [1]. It is predicted that more than 550 million people worldwide will be diabetic by 2030, compared to 108 million in 1980 [2]. Diabetes is among diseases with the most rapidly increasing global prevalence and improving therapies and prevention methods to reduce diabetes-related complications and premature mortality is of utmost importance.
DM is characterized by a relative or absolute lack of insulin, resulting in elevated blood glucose levels. Type 2 diabetes (T2D) accounts for more than 90% of DM cases and is primarily caused by an inappropriate cellular response to insulin. In response to insulin resistance (IR) or intolerance, pancreatic beta cells hypertrophy and release more insulin, consequently leading to pancreatic exhaustion and failure in later stages of the disease [3]. The natural history of T2D is characterized by obesity in >80% of cases, which is further exacerbated by a Western diet and physical inactivity leading to IR, hyperglycemia, hyperlipidemia, and hyperinsulinemia. Taken together with an older age of onset, T2D results in extremely robust insulin insensitivity [4]. Chronic hyperglycemia can lead to microvascular (e.g., nephropathy, retinopathy, and polyneuropathy) and macrovascular (e.g., stroke, cardiovascular disease) complications [5]. In T2D patients, cardiovascular disease is a major cause of morbidity and mortality, accounting for 68% of all diabetes-related deaths [6].
Given the physiological complexity of the disease, in vitro models that could provide a path to discovery and testing of novel therapeutics have been limited. By modeling this complex disease in vitro, we want to increase and accelerate the discovery of therapeutic targets, improve disease screening, and enable improved preclinical drug testing. In vitro cell models can provide an economically and ethically acceptable research tool and enable the targeting of specific processes linked to a single cell type of interest, without uncontrolled influences of the whole organism. In vitro cell models can be performed with high throughput and reproducibility and can be genetically modified by transfection to investigate specific genes of interest [7]. Thus, cell-based models, if developed properly, could serve as tools to accelerate therapeutic discovery. This study aimed to develop a novel model for simulating T2D in vitro in skeletal and cardiac muscle cells that reflects the cellular response typified by T2D patients.
2. Materials and Methods
2.1. Cell Culture
C2C12 (CRL-1772™) and H9C2 (CRL-1446™) cell lines were purchased from American Type Culture Collection (ATCC, Manassas, VA, USA). C2C12 and H9C2 cells were cultured in Dulbecco’s Modified Eagle’s Medium (DMEM) (GIBCO/BRL, 11885092) containing 5mM glucose, supplemented with 10% fetal bovine serum (FBS, Thermo Fisher Scientific, 16000044) and 1% penstrep (Penicillin/Streptomycin, GIBCO, 15140122). For differentiation of C2C12, DMEM (5mM glucose) was supplemented with 2% horse serum (HS) (Thermo Fisher, 26050088) and 1% penstrep was refreshed daily. For differentiation of H9C2 cells, DMEM (5mM glucose) was supplemented with 1% FBS, 1% penstrep and 10nM All-trans-retinoic acid (RA) (Sigma Aldrich, R2625-500MG). RA was diluted in DMSO and stored at -20°C in the dark. Medium change was performed daily in the dark. Cell treatments for assays were started 5-8 days after differentiation. C2C12 and H9C2 cell cultures were used in passages 2-6 in all experiments.
2.2. Treatments
DMEM containing 25mM glucose (GIBCO/BRL, 11995073) was used as a hyperglycemic condition (HG). This hyperglycemic condition was also used in combination with insulin (HG-I) (1nM, insulin glargine, Lantus, Sanofi), or palmitate (HG-P) (150µM for C2C12, 75µM for H9C2). A further hyperglycemic condition was combined with both insulin and palmitate (HG-PI). Groups treated with low glucose (LG, 5mM) and the same combinations with palmitate and/or 1nM insulin served as physiological controls (LG-I, LG-P, LG-PI). To exclude a possible hyperosmolar effect, cells treated with 20mM mannitol plus 5mM glucose served as control cultures (high mannitol, HM). The same treatment combinations were used (HM-I, HM-P, HM-PI). The cells were exposed to different conditions, either short-term (24h) or long-term (96h). Before all experiments, the culture medium was changed to serum-free medium for 4-6 hours. For long-term treatments, the concentration of palmitate was escalated every 24 hours to prevent myotube loss (Table 1).

Table 1.
Escalation of palmitate concentrations for long term (96h) treatments of C2C12 and H9C2 myotubes. Palmitate concentrations were increased every 24 hours.
Table 1.
Escalation of palmitate concentrations for long term (96h) treatments of C2C12 and H9C2 myotubes. Palmitate concentrations were increased every 24 hours.
| Treatment Duration | Conc. for C2C12 | Conc. for H9C2 |
|---|---|---|
| 24h | 35µM | 5µM |
| 48h | 70µM | 25µM |
| 72h | 105µM | 50µM |
| 96h | 150µM | 75µM |
Before adding sodium palmitate to cell differentiation medium, it was conjugated to fatty acid free bovine serum albumin (BSA). Transportation into cells is then enabled and cytotoxicity lowered. Briefly, ultra-fatty acid free BSA (Sigma Aldrich, A8806) was dissolved in the respective differentiation medium for each cell line, heating the solution to approximately 37°C. Sodium palmitate (Sigma Aldrich, P9767) was dissolved in a 150mM NaCl solution, stirring at 70°C. The palmitate solution was added to the BSA solution while stirring at 37°C. After stirring for 1 h, pH was adjusted to 7.4 with NaOH. The conjugated palmitate-BSA solution was aliquoted in glass vials and frozen at -20°C. Stock solutions were made at 75mM.
2.3 3H-2-Deoxy-Glucose-Uptake
3H-2-deoxy-glucose-uptake assays were performed using published methods [8]. Briefly, culture media were discarded 3-4 hours prior to the assay and changed to serum-free DMEM with 0.25% fatty acid-free BSA. Serum-Starvation was held in respective treatment media (serum-free DMEM with either high or low glucose (5mM vs 25mM) and supplemented with palmitate or 1nM insulin respectively). After starvation cultures were washed twice with Hepes fortified Krebs-Ringer Bicarbonate buffer (HKRB), containing 10 mM Hepes, pH 7.4, NaH2PO4 (0.83 mM), Na2HPO4 (1.27 mM), NaHCO3 (15 mM), NaCl (120 mM), KCl (4.8 mM), calcium (1 mM), magnesium (1mM), pH 7.35 and 0.25% fatty acid-free BSA. Cultures were incubated in HKRB for 60 minutes at 37°C. Half of the cultures were pre-assigned for acute insulin treatment. These cultures were treated with 100nM insulin from a 100x stock and incubated for 20 minutes at 37°C. After this incubation period 3H-2-deoxy-glucose (3H-2DOG, 2-[1,2-3H(N)]-, 250µCi (9.25MBq), Perkin Elmer, NET549A250UC) was added to each well for further 10 minutes incubation. 3H-2DOG-treatment was terminated by quick aspiration, followed by cold wash (2x) with ice-cold PBS. Next, we added 1N NaOH and swirled the plates slowly for 30 minutes to dissolve the cells. Aliquots of 20µl were taken out of each well for protein measurements. The whole lysate of each well was transferred into a scintillation vial. After neutralizing NaOH with 1N HCl, scintillation cocktail (Ecoscint original, National Diagnostics, LS-271) was added and radioactivity was measured. Results were normalized with protein concentrations and presented as counts per minute (cpm) per mg protein. Alternately, the results were presented as cpm per million cells. assays were performed using published methods [8]. Briefly, culture media were discarded 3-4 hours prior to the assay and changed to serum-free DMEM with 0.25% fatty acid-free BSA. Serum-Starvation was held in respective treatment media (serum-free DMEM with either high or low glucose (5mM vs 25mM) and supplemented with palmitate or 1nM insulin respectively). After starvation cultures were washed twice with Hepes fortified Krebs-Ringer Bicarbonate buffer (HKRB), containing 10 mM Hepes, pH 7.4, NaH2PO4 (0.83 mM), Na2HPO4 (1.27 mM), NaHCO3 (15 mM), NaCl (120 mM), KCl (4.8 mM), calcium (1 mM), magnesium (1mM), pH 7.35 and 0.25% fatty acid-free BSA. Cultures were incubated in HKRB for 60 minutes at 37°C. Half of the cultures were pre-assigned for acute insulin treatment. These cultures were treated with 100nM insulin from a 100x stock and incubated for 20 minutes at 37°C. After this incubation period 3H-2-deoxy-glucose (3H-2DOG, 2-[1,2-3H(N)]-, 250µCi (9.25MBq), Perkin Elmer, NET549A250UC) was added to each well for further 10 minutes incubation. 3H-2DOG-treatment was terminated by quick aspiration, followed by cold wash (2x) with ice-cold PBS. Next, we added 1N NaOH and swirled the plates slowly for 30 minutes to dissolve the cells. Aliquots of 20µl were taken out of each well for protein measurements. The whole lysate of each well was transferred into a scintillation vial. After neutralizing NaOH with 1N HCl, scintillation cocktail (Ecoscint original, National Diagnostics, LS-271) was added and radioactivity was measured. Results were normalized with protein concentrations and presented as counts per minute (cpm) per mg protein. Alternately, the results were presented as cpm per million cells.
2.4. Mitochondrial Function Measurements
Mitochondrial function measurements were performed with the Agilent Seahorse XFe 96 Extracellular Flux Analyzer (Agilent Technologies, La Jolla, California). C2C12 and H9C2 cells were seeded and differentiated in a density of ~1.2 x10⁴ cells per well, and the assay was carried out as previously described [9]. The following respiration rates were measured: Basal respiration: Oxygen consumption used to meet cellular ATP demand under baseline conditions. It can be set by the rate of ATP utilization and substrate availability and oxidation. ATP-linked respiration: Upon injection of the ATP synthase inhibitor oligomycin a decrease in OCR represents the part of basal respiration that accounts for ATP-linked respiration, meeting the energetic needs of the cell. It is largely set by the ATP demand of the cell and substrate oxidation, which can be decreased if there is mitochondrial dysfunction. Maximal respiration: By adding the uncoupler carbonyl cyanide p-(trifluoromethoxy) phenylhydrazone (FCCP) the maximal OCR can be attained. FCCP mimics an “energy demand” and stimulates the respiratory chain to operate at maximum capacity and substrates are rapidly oxidized. It is also set by substrate supply and oxidation including the functional substrate transport across the plasma and mitochondrial membranes. Changes may reflect membrane defects, altered mitochondrial biogenesis and function and decreased oxidation abilities. Spare respiratory capacity: This value can be calculated with basal and maximal respiration values. It indicates the cell’s capability to respond to an energetic demand and can be an indicator of cell fitness or flexibility. A decreased capacity can be linked to mitochondrial dysfunction but can also reflect an increased ATP demand/increased basal respiration (i.e., highly proliferative cells). Increases may reflect high substrate provision or enhanced oxidative capacity [10].
2.5. Electron Microscopy
C2C12 and H9C2 myotubes maintained short-term (24h) and long-term (96h) in different T2D-mimicking and control conditions (see: treatments) were fixed and embedded for electron microscopy (EM) as previously described [11]. Grids were viewed using a Jeol JEM1400-plus Transmission Electron Microscope and photographed with a Gatan OneView digital camera with 4k x 4k resolution.
2.6. Morphometric Analyses of Mitochondria
Using the free-hand tool of NIH ImageJ, we manually traced around the mitochondria to determine mitochondrial area and length as described previously [12]. Cytoplasmic area (excluding the area occupied by the nucleus) was also calculated using the ImageJ software. Mitochondrial numbers were calculated by placing the EM micrographs onto a grid with 10 horizontal x 10 vertical square grids followed by dividing the mitochondrial numbers with the area. The data were expressed as mitochondrial number/10 µm2 area.
2.7. Statistical Analysis
All Data analyses were performed using GraphPad Prism 9.5.1 (GraphPad Software, La Jolla, CA). For glucose uptake assays the results are expressed as mean ± SD of 6 biological replicates for all LG and HG groups and 3 replicates for all HM groups. For Mito Stress Tests, all data shown are the means ± SD of 3-4 replicate plates with 8-15 wells per treatment group per plate. Relative frequencies of mitochondria area and length were analyzed by Kolmogorov-Smirnov test, mitochondrial number, and density were analyzed by one-way ANOVA, of 6-14 cells. For statistical analysis a p value <0.05 was considered significant. We used analysis of variance (one-way or two-way ANOVA), provided that the assumptions were fulfilled. For Agilent Seahorse measurements two-way ANOVA was used with row factor for treatment groups and column factor for biological replicates/assays. Overall significance for factor treatment is indicated by §: p<0.05; §§: p<0.01; §§§: p<0.001 in the legend of the figure panels. Significance of secondary pairwise comparisons among different treatments by Tukey’s test is indicated by asterisks over brackets in the figure panels (*: p<0.05; **: p<0.01; ***: p<0.001).
3. Results
3.1. 3H-2-Deoxy-Glucose-Uptake
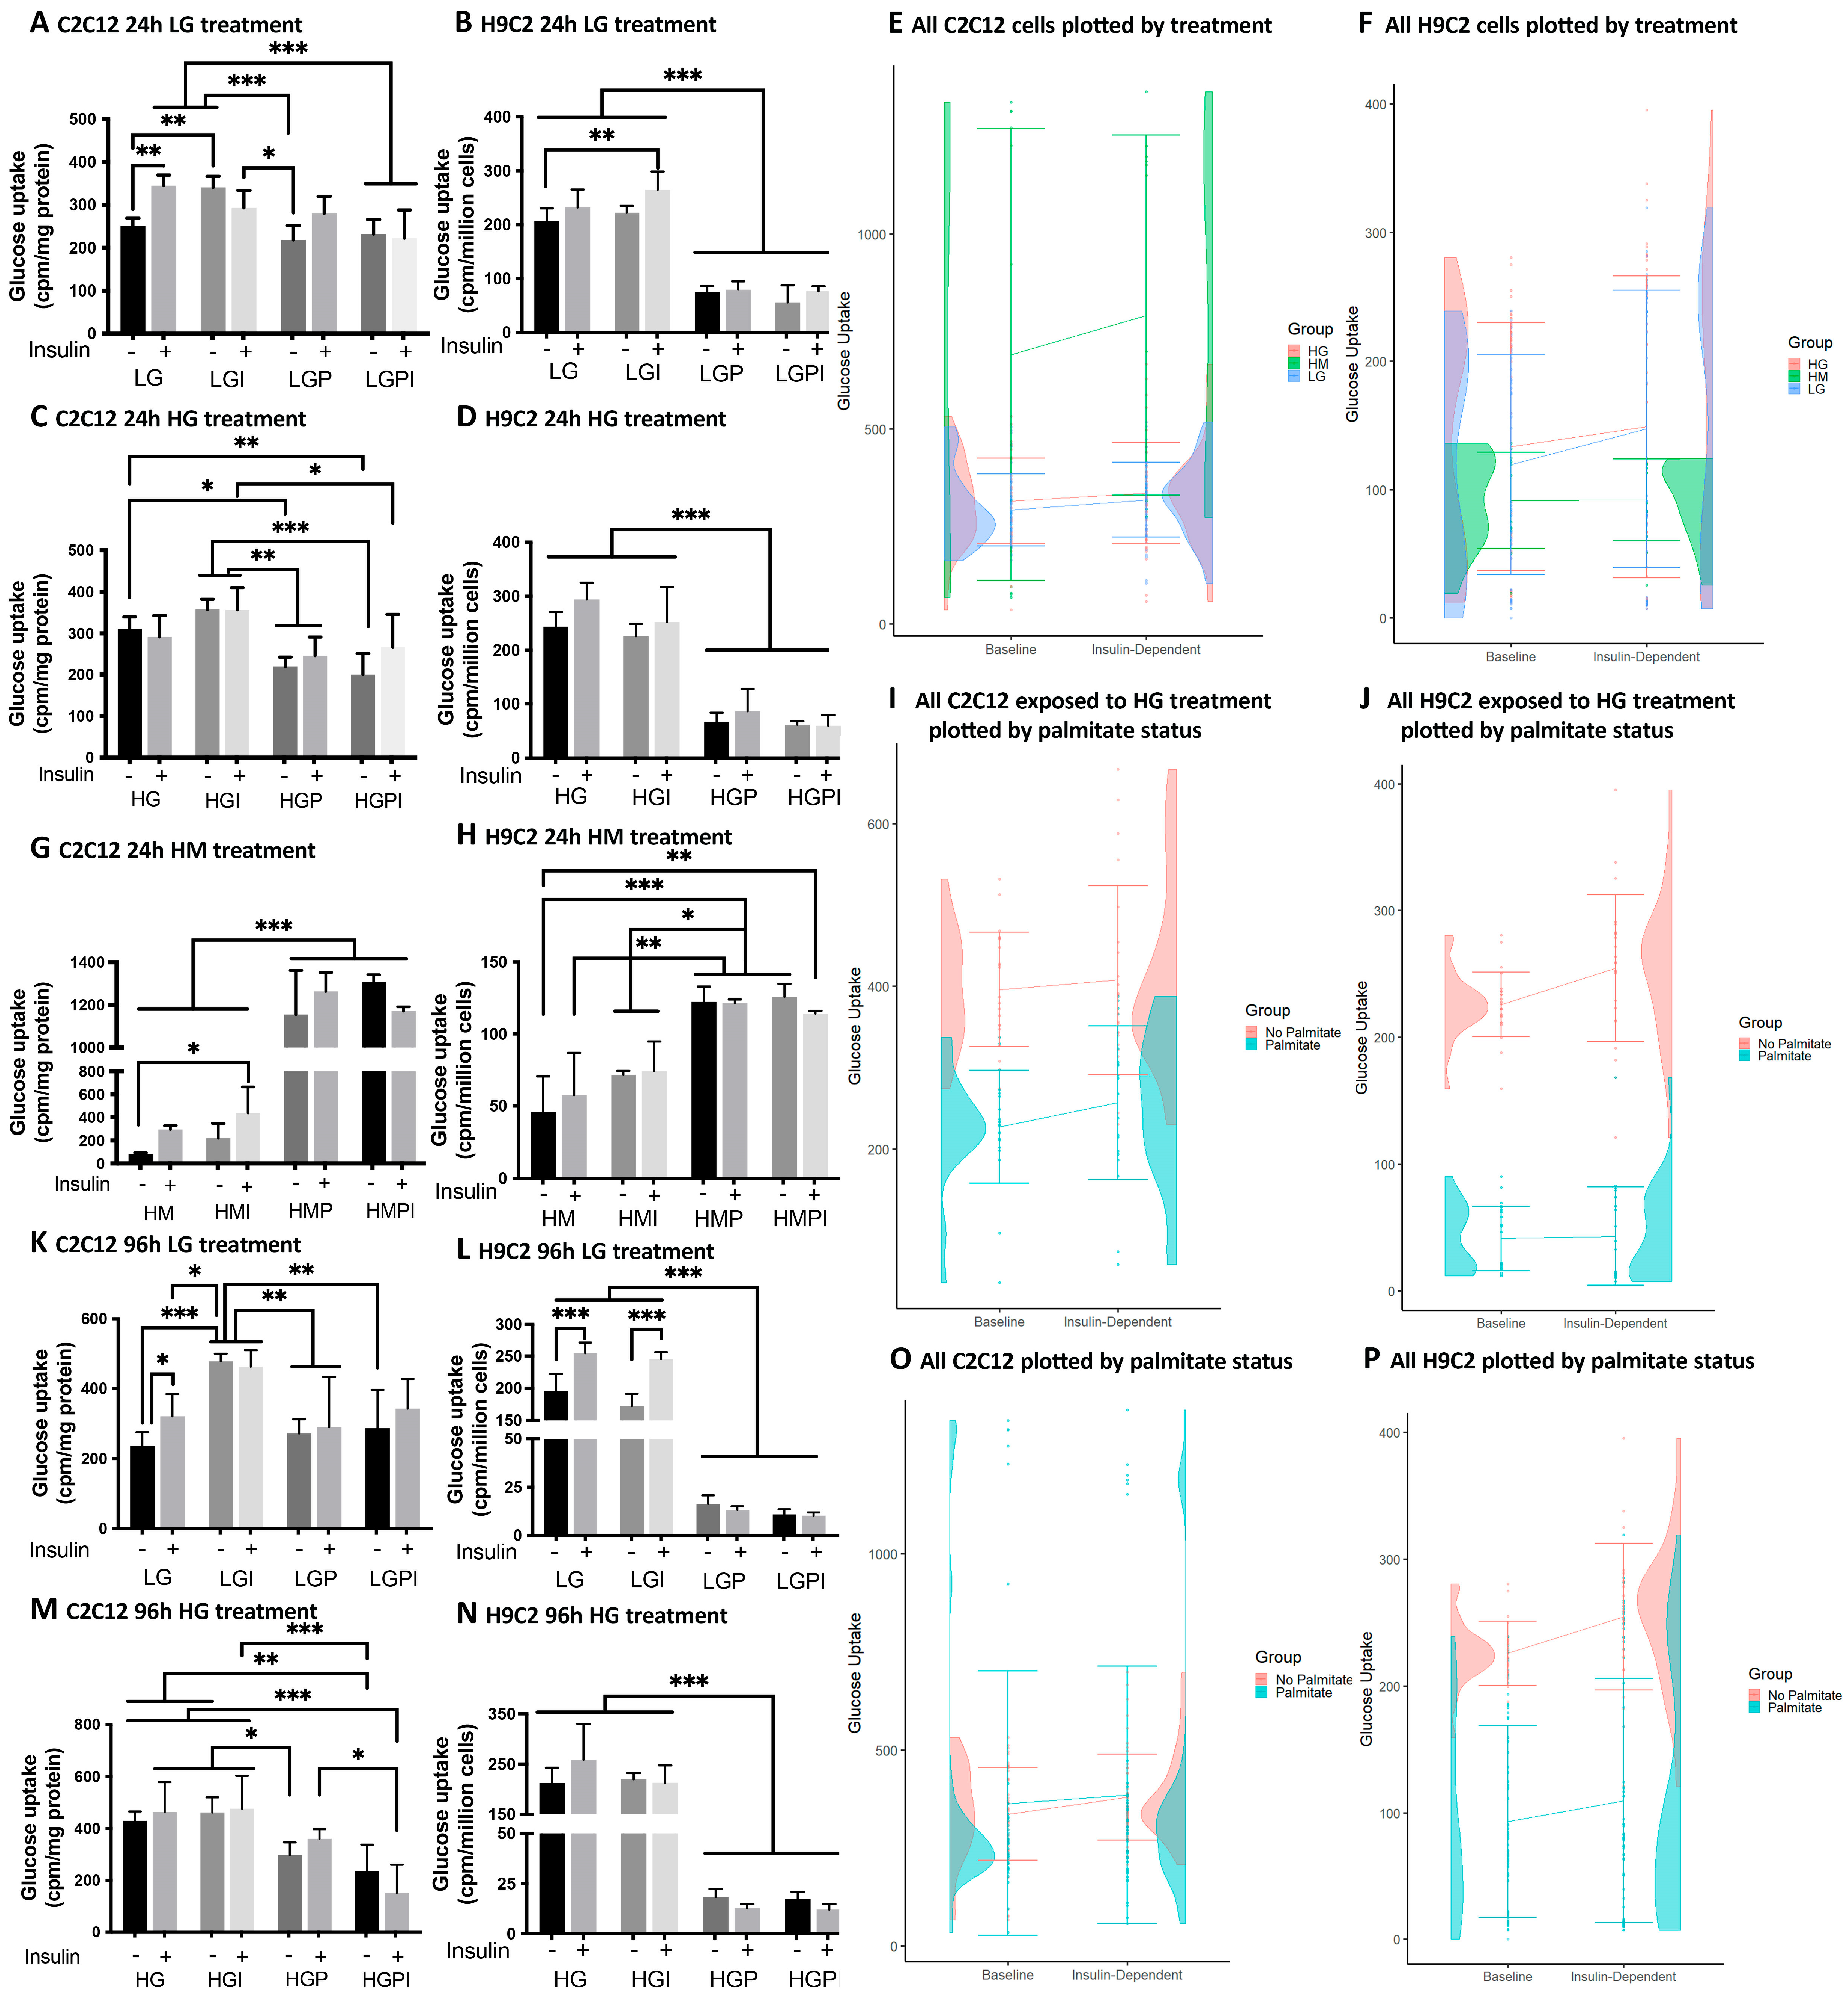
C2C12 myotubes: We found that treatment of C2C12 myotubes with T2D-mimicking conditions including insulin and palmitate treatments resulted in IR compared to controls. Control cultures preincubated with LG for 24h showed a significant increase in glucose uptake upon stimulation with 100nM test insulin (Figure 1A) (LG +/- insulin). Short-term (24h) pretreatments with 150µM palmitate either in presence or absence of 1nM insulin impeded the stimulatory effect of insulin, indicating that palmitate caused IR in consistence with existing literature [12]. Similar effects were seen after 96h (Figure 1A,K). After short- and long-term treatment, basal glucose uptake was increased in LG-I treated groups compared to LG controls (Figure 1A,K). LG-P and LG-PI-treated myotubes displayed decreased glucose uptake rates compared to LG and LG-I treatments. Cultures treated short- or long-term in a HG condition did not increase glucose uptake upon insulin stimulus (Figure 1C,M) but showed elevated basal rates compared to LG. We observed no significant increase in insulin-dependent vs. basal glucose uptake in all T2D-mimicking treatment groups (HG, HG-I, HG-P, HG-PI). Myotubes treated with HG-P or HG-PI showed significantly lower basal and insulin-dependent glucose uptake rates compared to HG and HG-I groups (Figure 1C,M). Myotubes treated with HM or HM-I for 24h showed a significant decrease in basal glucose uptake compared to LG or HG and no significant up-regulation of glucose uptake upon insulin stimulation. Interestingly, C2C12 myotubes treated with HM and palmitate (HM-P and HM-PI) showed a marked increase in both basal and insulin-dependent glucose uptake (Figure 1G), compared to all other treatment groups. Looking at the half-violin plots with combined data of 24h and 96h treatments, treatments including mannitol show the widest spread in values due to the stimulatory effect on glucose uptake of palmitate in combination with HM (Figure 1E), whereas in cells exposed to HG and palmitate an inhibitory effect of palmitate is apparent (Figure 1I).
H9C2 cardiac myotubes: IR occurred in all T2D-mimicking treatment groups. LG or LG-I treated control cultures showed an increase in glucose uptake upon an acute insulin stimulus (100nM). After 24h treatment, the increase was not significant, whereas, after 96h treatment, we observed a significant rise in insulin-dependent glucose uptake compared to basal uptake (Figure 1B,L). Basal glucose uptake rates in both LG and LG-I treatment groups were similar, but insulin-dependent rates were significantly higher in LG-I compared to basal rates in LG (Figure 1B). H9C2 myotubes treated short or long-term with LG and palmitate (LG-P and LG-PI) showed significantly decreased glucose uptake rates compared to LG and LG-I. We observed similar effects on glucose uptake after short- or long-term treatments with HG-P or HG-PI (Figure 1D,N), which indicates a massive suppression of basal glucose influx and insulin insensitivity by palmitate [13]. Groups treated short- or long-term with HG or HG-I were at least partially insulin-resistant and showed a significantly higher glucose uptake compared to groups treated with high glucose and palmitate (Figure 1D,N). In contrast, osmotic control cultures treated with HM-P or HM-PI showed a remarkable increase in basal glucose uptake compared to HM or HM-I treatment, but insulin response was suppressed (Figure 1H) even more marked than in C2C12 myotubes (Figure 1G). In summary, HM-treated groups showed markedly lower glucose uptake rates compared to LG groups (LG basal rate mean = 207.33; HM basal rate mean = 45.95). Cultures treated with HM or HM-I showed a non-significant trend towards an increase in glucose uptake upon an acute insulin stimulus (Figure 1H). Looking at the half-violin plots with combined data of 24h and 96h treatments, cells exposed to mannitol show the lowest glucose uptake rates of all treatments (Figure 1F). Overall, palmitate exerted a marked inhibitory effect on both basal and insulin-dependent glucose uptake, particularly in combination with HG treatment (Figure 1J,P).
Figure 1.
Basal and insulin dependent 3H-2-deoxy-glucose-uptake of C2C12 (A-G, I) and H9C2 (H, J-P) myotubes after 24h and 96h treatments. The effect upon an acute insulin stimulus (100nM) was compared between different T2D-mimicking conditions and physiological (LG) and osmotic (HM) controls. IR occurred in all T2D-mimicking conditions. E, F, I, J, O, P: Half-violin plots for combined 24h and 96h baseline and insulin-dependent glucose uptake, with error bars for standard error and lines connecting mean glucose uptake between conditions, by group. A: C2C12 LG control groups after 24h treatment. B: H9C2 LG control groups after 24h treatment. C: C2C12 treated with high glucose, palmitate and insulin for 24h. D: H9C2 treated with HG, palmitate and insulin for 24h. G: C2C12 osmotic control groups treated with HM for 24h. E: All C2C12 cells by treatment F: All H9C2 cells by treatment. I: C2C12 cells receiving high glucose treatment by palmitate status. J: H9C2 cells receiving high glucose treatment by palmitate status. H: H9C2 osmotic control groups treated with HM for 24h. K: C2C12 96h LG treatment. L: H9C2 96h LG treatment. M: C2C12 96h HG treatments. N: H9C2 96h HG treatments. O: All C2C12 cells by palmitate status. P: All H9C2 cells by palmitate status. Insulin (+): 100 nM acute insulin; LG: low glucose 5mM; LGI: low glucose + 1 nM insulin; LGP: low glucose + 150 µM palmitate for C2C12 and 75 µM palmitate for H9C2; LGPI: low glucose + 150 µM palmitate for C2C12 and 75 µM palmitate for H9C2 + 1 nM insulin; HG: high glucose 25mM; HGI: high glucose + 1 nM insulin; HGP: high glucose + 150 µM palmitate for C2C12 and 75 µM palmitate for H9C2; HGPI: high glucose + 150 µM palmitate for C2C12 and 75 µM palmitate for H9C2 + 1 nM insulin; HM: 20 mM mannitol + 5 mM glucose; HMI: 20 mM mannitol + 5 mM glucose + 1 nM insulin; HMP: 20 mM mannitol + 5 mM glucose + 150 µM palmitate for C2C12 and 75 µM palmitate for H9C2; HMPI: 20 mM mannitol + 5 mM glucose + 150 µM palmitate for C2C12 and 75 µM palmitate for H9C2 + 1 nM insulin. Basal glucose uptake and insulin dependent glucose uptake are presented as cpm per mg protein or per million cells. Values represent the means (SD); n=6 per treatment group for LG and HG treatments, n=3 per group for HM treatments. One-way ANOVA for A-E + I-M p<0.0001. Brackets indicate Tukey’s multiple comparisons tests with *p<0.05, **p<0.01, ***p<0.001.
3.2. Mitochondrial Function Measurements Using the Agilent Seahorse XFe 96 Extracellular Flux Analyzer
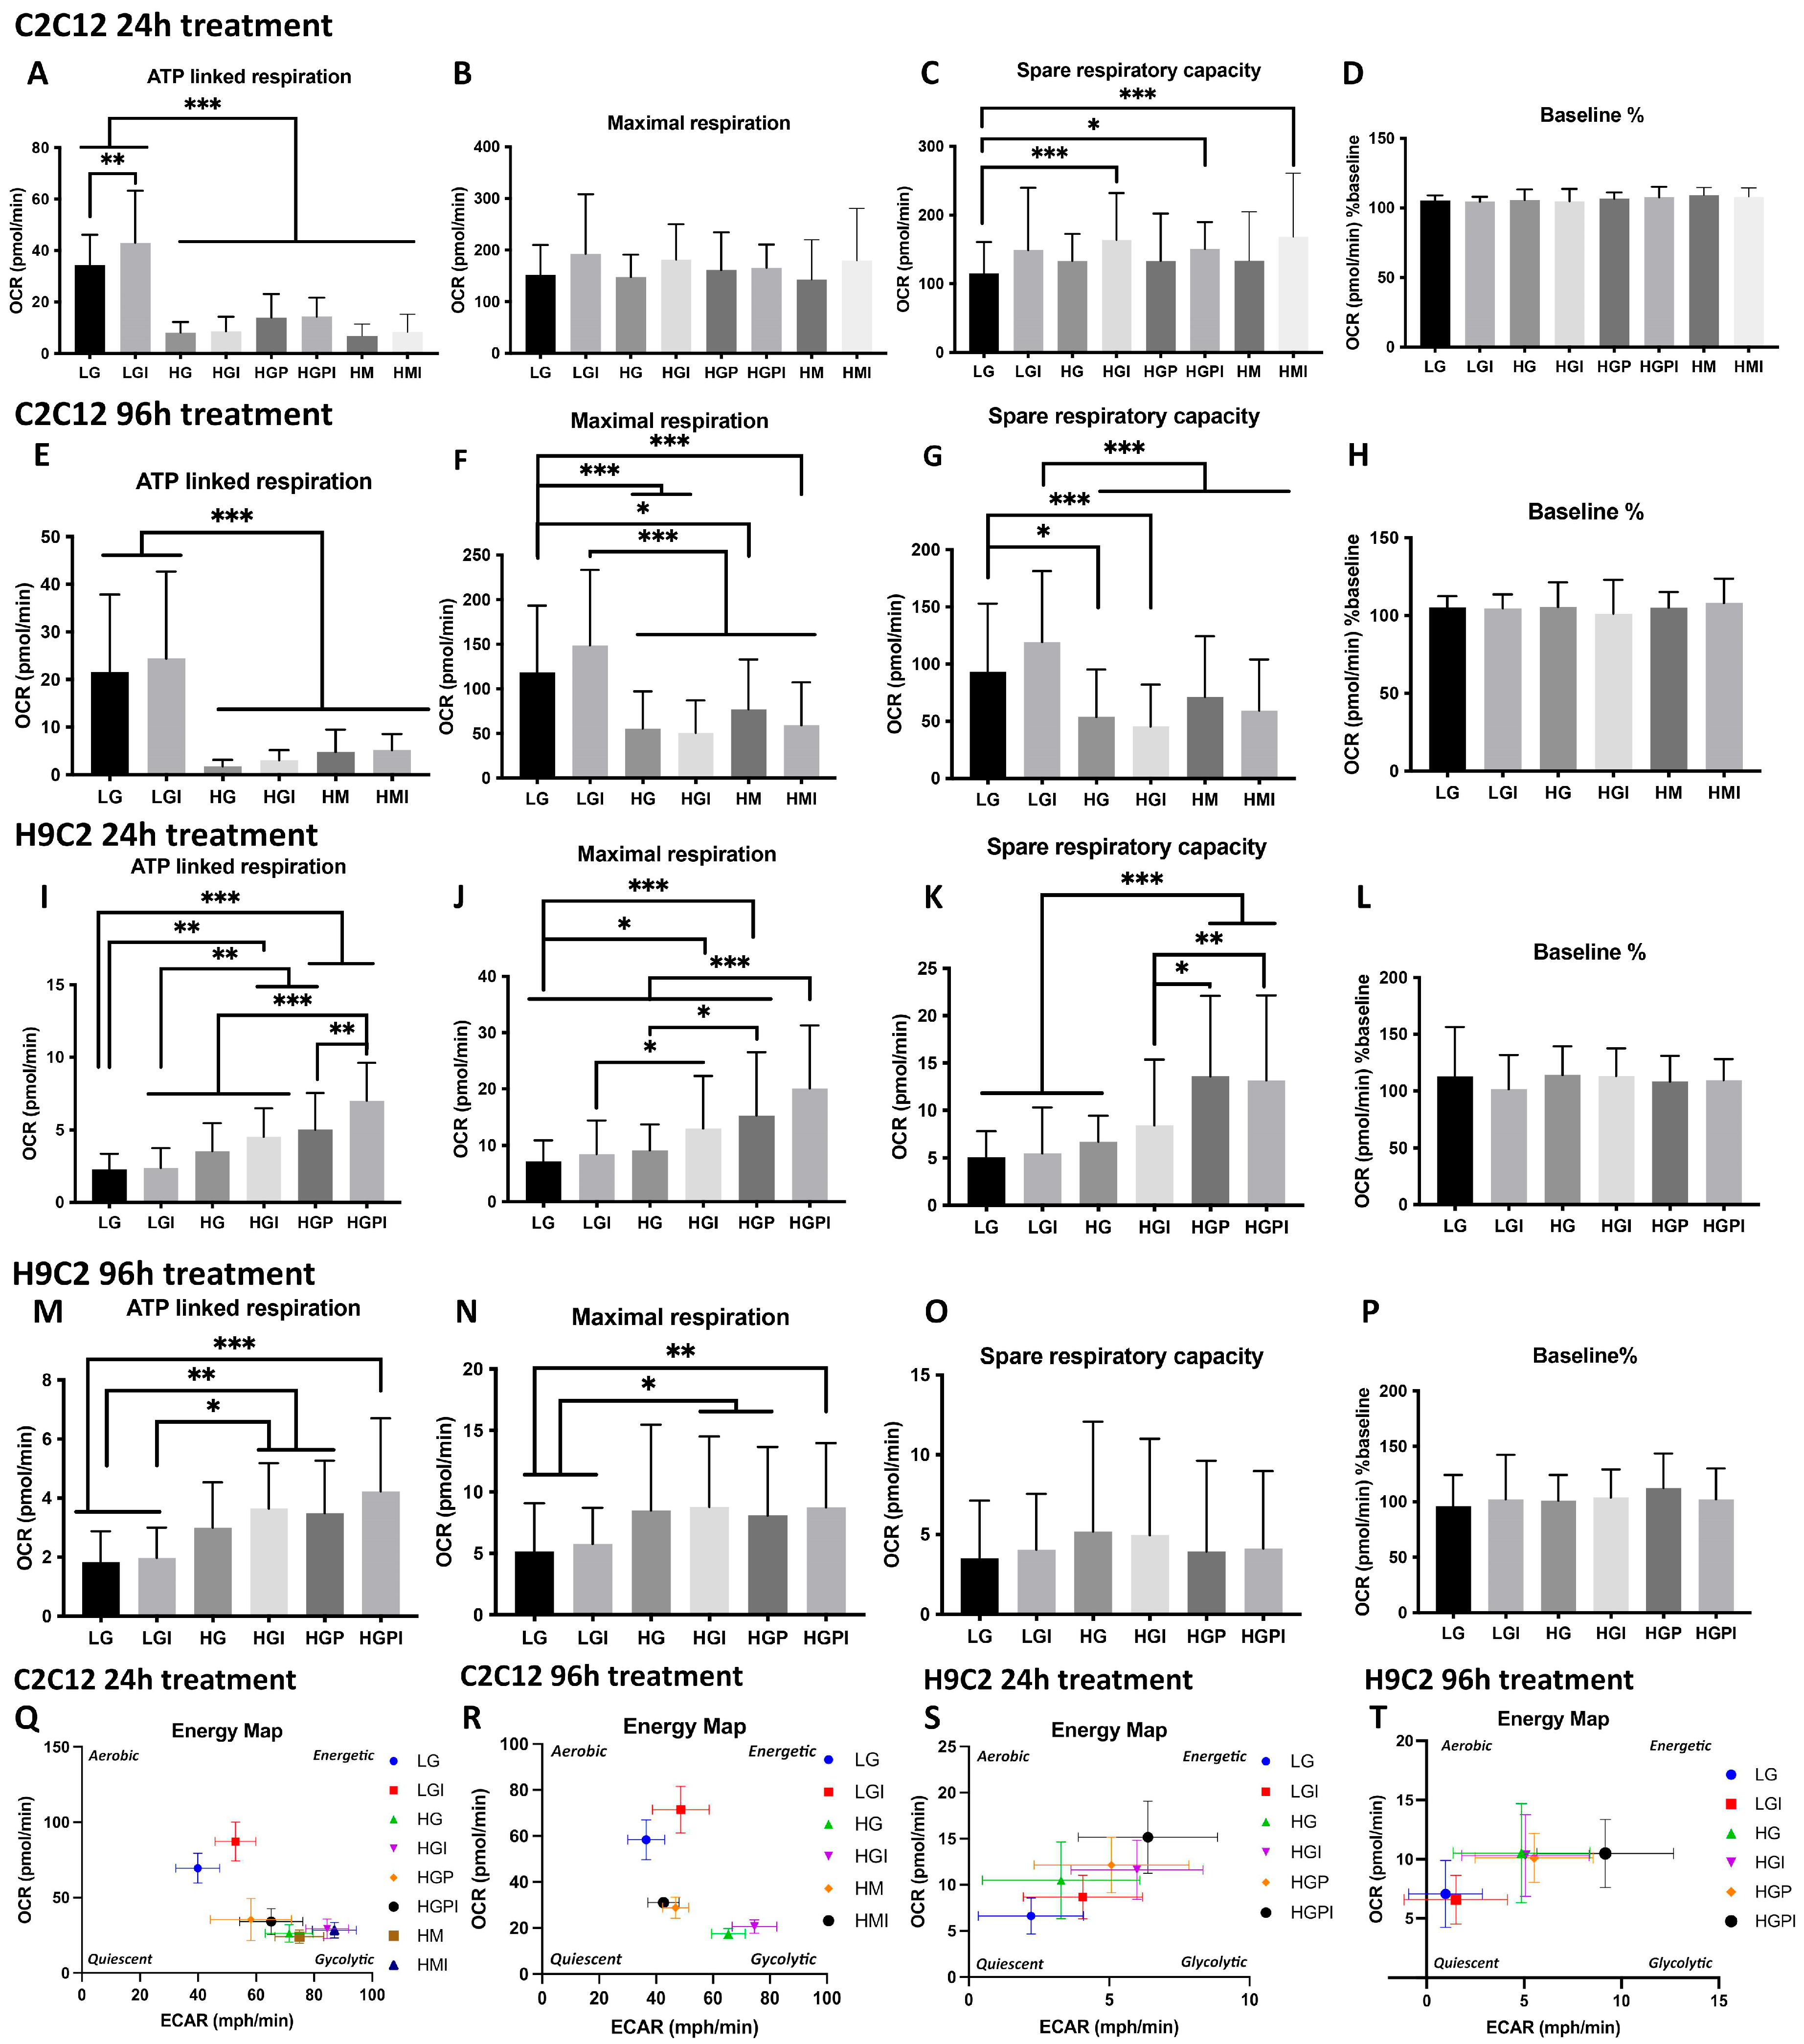
In all Mito Stress Test assays with C2C12 and H9C2 myotubes, baseline relative oxygen consumption rate percentage did not differ (Figure 2D,H,L,P).
Figure 2.
Plate-based oxygen consumption measurements of C2C12 (A-H, Q-R) and H9C2 (I-P, S-T) myotubes. The cells were plated at 1.2 x10⁴ cells per well in XF96 microplates and differentiated for 5 days. Treatments were carried out for 24h or 96h prior to the assay. A-H, Q, R = C2C12 myotubes, I-P, S,T = H9C2 myotubes. A: ATP-linked respiration of C2C12 myotubes after 24h treatments (§§§). B: Maximal respiration of C2C12 Myotubes after 24h treatments (§). C: Spare respiratory capacity of C2C12 Myotubes after 24h treatments (§§). D, H, L, P: Relative oxygen consumption rate percentage. E: ATP-linked respiration 96h (§§§). F: Maximal respiration 96h (§§§). G: Spare respiratory capacity 96h (§§§). I: ATP-linked respiration of H9C2 myotubes after 24h treatments (§§§). J: Maximal respiration 24h (§§§). K: Spare respiratory capacity 24h (§§§). M: ATP-linked respiration 96h (§§§). N: Maximal respiration 96h (§§§). O: Spare respiratory capacity 96h. Q, R: OCR plotted versus ECAR of C2C12 after 24h (Q) and 96h (R) treatment. S, T: OCR plotted versus ECAR of H9C2 after 24h (S) and 96h (T) treatment. LG: low glucose; LGI: low glucose + 1 nM insulin; HG: high glucose; HGI: high glucose + 1 nM insulin; HGP: high glucose + 150 µM palmitate for C2C12 and 75 µM palmitate for H9C2; HGPI: high glucose + 150 µM palmitate for C2C12 and 75 µM palmitate for H9C2 + 1 nM insulin; HM: 20 mM mannitol + 5 mM glucose; HMI: 20 mM mannitol + 5 mM glucose + 1 nM insulin. Each graph represents data of minimum three independent biological replicates and presented as means ± standard deviation, n per treatment group = 8-15 (C2C12) or 6-15 (H9C2) wells per assay. Two-way-ANOVA for factor treatment and factor Seahorse assays. Overall significance for factor treatment is indicated by §: p<0.05; §§: p<0.01; §§§: p<0.001 in the panel legends. Significance of secondary pairwise comparisons among treatments by Tukey´s test is indicated by brackets and asterisks *: p<0.05; **: p<0.01; ***: p<0.001 in the panels.
3.2.1. C2C12 Myotubes
24h treatments: C2C12 myotubes treated 24h with non-physiological glucose levels (HG, HG-I, HG-P, HG-PI) showed a significant decrease in ATP-linked respiration compared to LG and LG-I controls (Figure 2A). Osmotic control cultures (HM, HM-I) showed no difference to LG control groups in maximal respiration (Figure 2B) but a significant decrease in ATP-linked respiration (Figure 2A). In all groups including insulin treatment maximal respiration rates were higher compared to treatments without insulin, but no significant changes were detectable (Figure 2B). Spare respiratory capacity rates were significantly increased in HG-I and HM-I groups compared to LG control (Figure 2C). In short-term assays with C2C12 myotubes we observed a shift towards glycolysis in all HG treated groups. HM treated groups showed a metabolic shift towards glycolysis. LG groups showed a mainly aerobic metabolism and LG-I groups were in between an aerobic and high energetic phenotype (Figure 2Q).
96h treatments: C2C12 myotubes treated 96h with high glucose (HG, HG-I) or HM-I showed a significant decrease in maximal respiration compared to LG control (Figure 2F). ATP-linked respiration of myotubes treated with HG or HM was significantly decreased (Figure 2E). Spare respiratory capacity rates were significantly decreased in HG and HG-I treated groups compared to LG. HM and HM-I treated groups displayed a lower spare respiratory capacity compared to LG-I (Figure 2G). In the XF energy map HG and HG-I treated groups showed a more glycolytic phenotype, while LG and LG-I control groups were in between an aerobic (oxidative phosphorylation) and a high energetic phenotype. HM and HM-I groups were less energetic compared to LG and less glycolytic compared to HG (Figure 2R). All respiration rates were lower after 96h treatment compared to 24h treatment, with maximal respiration rates being remarkably lower in T2D-mimicking conditions after 96h compared to 24h treatment. After 96h treatment with HG-P and HG-PI, we didn’t observe significant difference to LG controls in one Mito Stress Test and therefore excluded these treatment groups in the following repetitions.
3.2.1. C2C12 Myotubes
24h treatments: H9C2 myotubes treated 24h with high glucose in combination with insulin or palmitate (HG-I, HG-P, HG-PI) showed a significant increase in ATP-linked respiration and maximal respiration compared to LG and LG-I controls, with HG-PI groups displaying the significantly highest ATP linked respiration and respiration rates (Figure 2I,J). Spare respiratory capacity was significantly increased in treatment groups including palmitate (HG-P and HG-PI) (Figure 2K). Plotting OCR vs ECAR showed a trend towards more energetic phenotypes in T2D-mimicking conditions compared to LG controls (Figure 2S). All treatment groups utilized both glycolysis and oxidative phosphorylation to generate energy. High mannitol control cultures showed no significant differences in all respiration rates compared to LG control groups in one Mito Stress Test assay and were therefore excluded in the following assay repetitions.
96h treatments: H9C2 myotubes treated 96h with high glucose in combination with insulin or palmitate (HG-I, HG-P, HG-PI) showed a significant increase in ATP linked respiration and maximal respiration compared to LG and LGI controls (Figure 2M,N). After 96h treatment no significant changes in spare respiratory capacity was detectable (Figure 2O). Plotting OCR vs ECAR respiration rates after 96h treatment revealed LG control cultures to be more quiescent compared to 24h treatment and compared to T2D-mimicking conditions. HG, HG-I, HG-P and HG-PI treated groups showed a phenotype in between glycolysis and oxidative phosphorylation, with HG-PI being the most energetic (Figure 2T).
3.3. Morphometric Analyses of Mitochondrial Number, Density, Relative Frequency of Mitochondria with Differing Area and Length
3.3.1. Electron Microscopy for Mitochondrial Appearance
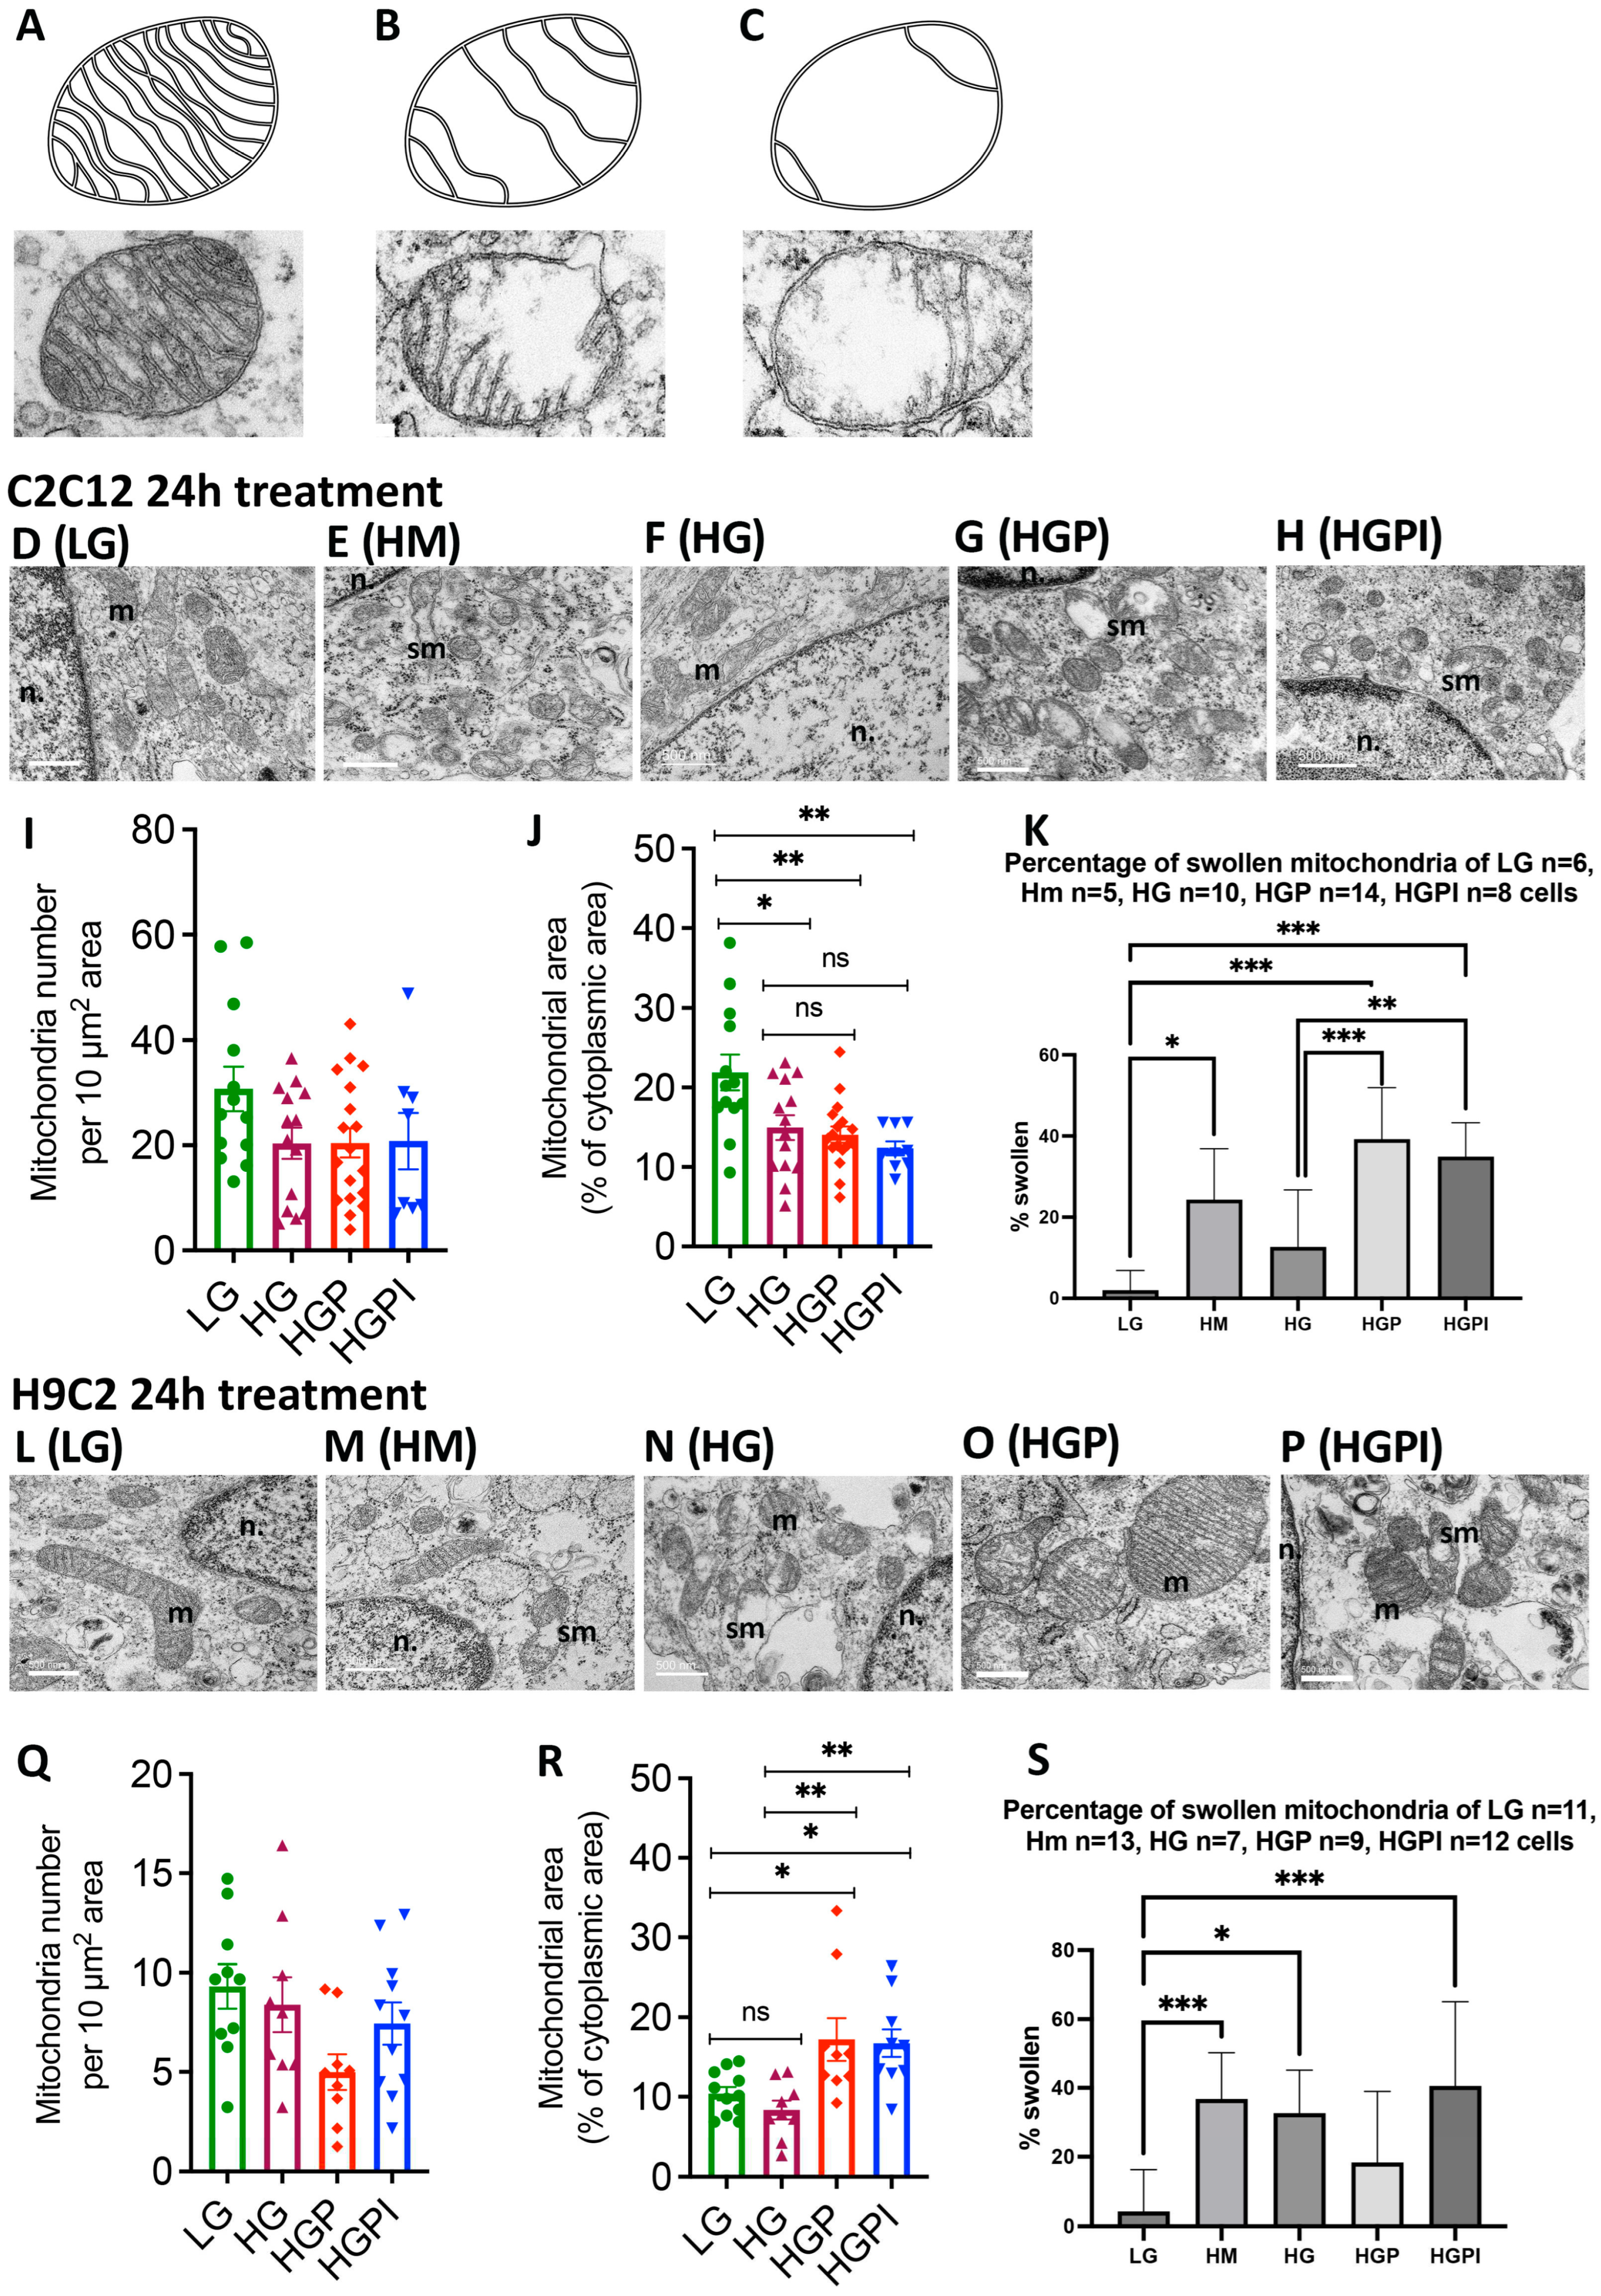
The abnormalities caused by T2D conditions in mitochondrial function raised the question of accompanying structural abnormalities. For mitochondrial morphology analysis, the number of normal versus swollen/vacuolated mitochondria was compared after 24h treatment of C2C12 and H9C2 myotubes. Normal mitochondria were defined as indicated in Figure 3A, swollen/vacuolated mitochondria as indicated in Figure 3B,C. HM, HG-P and HG-PI treated C2C12 myotubes showed a significantly higher fraction of swollen/vacuolated mitochondria compared to LG control (Figure 3N). The fraction of swollen/vacuolated mitochondria in HG compared to LG groups was not significantly different (Figure 3N). Compared to LG, the percentage of swollen/vacuolated mitochondria in H9C2 myotubes was higher in HM, HG and HG-PI groups (Figure 3W). Swollen mitochondria are marked as “sm” in Figure 3 in C2C12 HM, HG-P, and HG-PI treatments (Figure 3G, I, J) and H9C2 HG and HG-PI treatments (Figure 3Q,S).
3.3.2. No Change in Mitochondrial Number
Morphometric analyses revealed no significant changes in mitochondrial number per 10 µm2 area of cytoplasm after exposure to T2D conditions in both C2C12 (Figure 3I) and H9C2 (Figure 3Q) cells.
Opposite changes in mitochondrial density between C2C12 and H9C2 cells: Morphometric analyses of mitochondrial density (area occupied by mitochondria in total area of cytoplasm) revealed a significant decrease in mitochondrial density when C2C12 cells were exposed to HG, HGP, or HGPI compared to LG (Figure 3J). In contrast, H9C2 cells showed significant increase in mitochondrial density when exposed to HGP or HGPI (Figure 3R). These findings are consistent with ATP-linked respiration as described above.
Figure 3.
Mitochondrial morphology and number of C2C12 and H9C2 myotubes after 24h treatment with T2D mimicking conditions. A: Normal muscular mitochondria. B-C: Swollen mitochondria. D-H: Mitochondria of C2C12 myotubes after different treatments in 15kX magnification. L-P: Mitochondria of H9C2 myotubes, n. = nucleus, m = normal mitochondria, sm = swollen/vacuolated mitochondria. I, Q: Mitochondrial number per 10 µm2 area of cytoplasm of C2C12 (I) and H9C2 (Q). J, R: Mitochondrial density (area occupied by mitochondria in total area of cytoplasm) in C2C12 (J) and H9C2 (R). K, S: Percentage of swollen mitochondria in C2C12 (K) and H9C2 (S) myotubes. LG: low glucose 5mM; HG: high glucose 24mM; HGP: high glucose + 150 µM palmitate for C2C12 and 75 µM palmitate for H9C2; HGPI: high glucose + 150 µM palmitate for C2C12 and 75 µM palmitate for H9C2 + 1 nM insulin; HM: 20 mM mannitol + 5 mM glucose. One-way ANOVA of I p= 0.1241; J p=0.0007, K + S p<0.0001; Q p=0.0681; R p=0.0009. *p<0.05, **p<0.01, ***p<0.001.
3.3.3. Palmitate but Not HG Changed Relative Frequency of Mitochondria with Respect to Area and Length
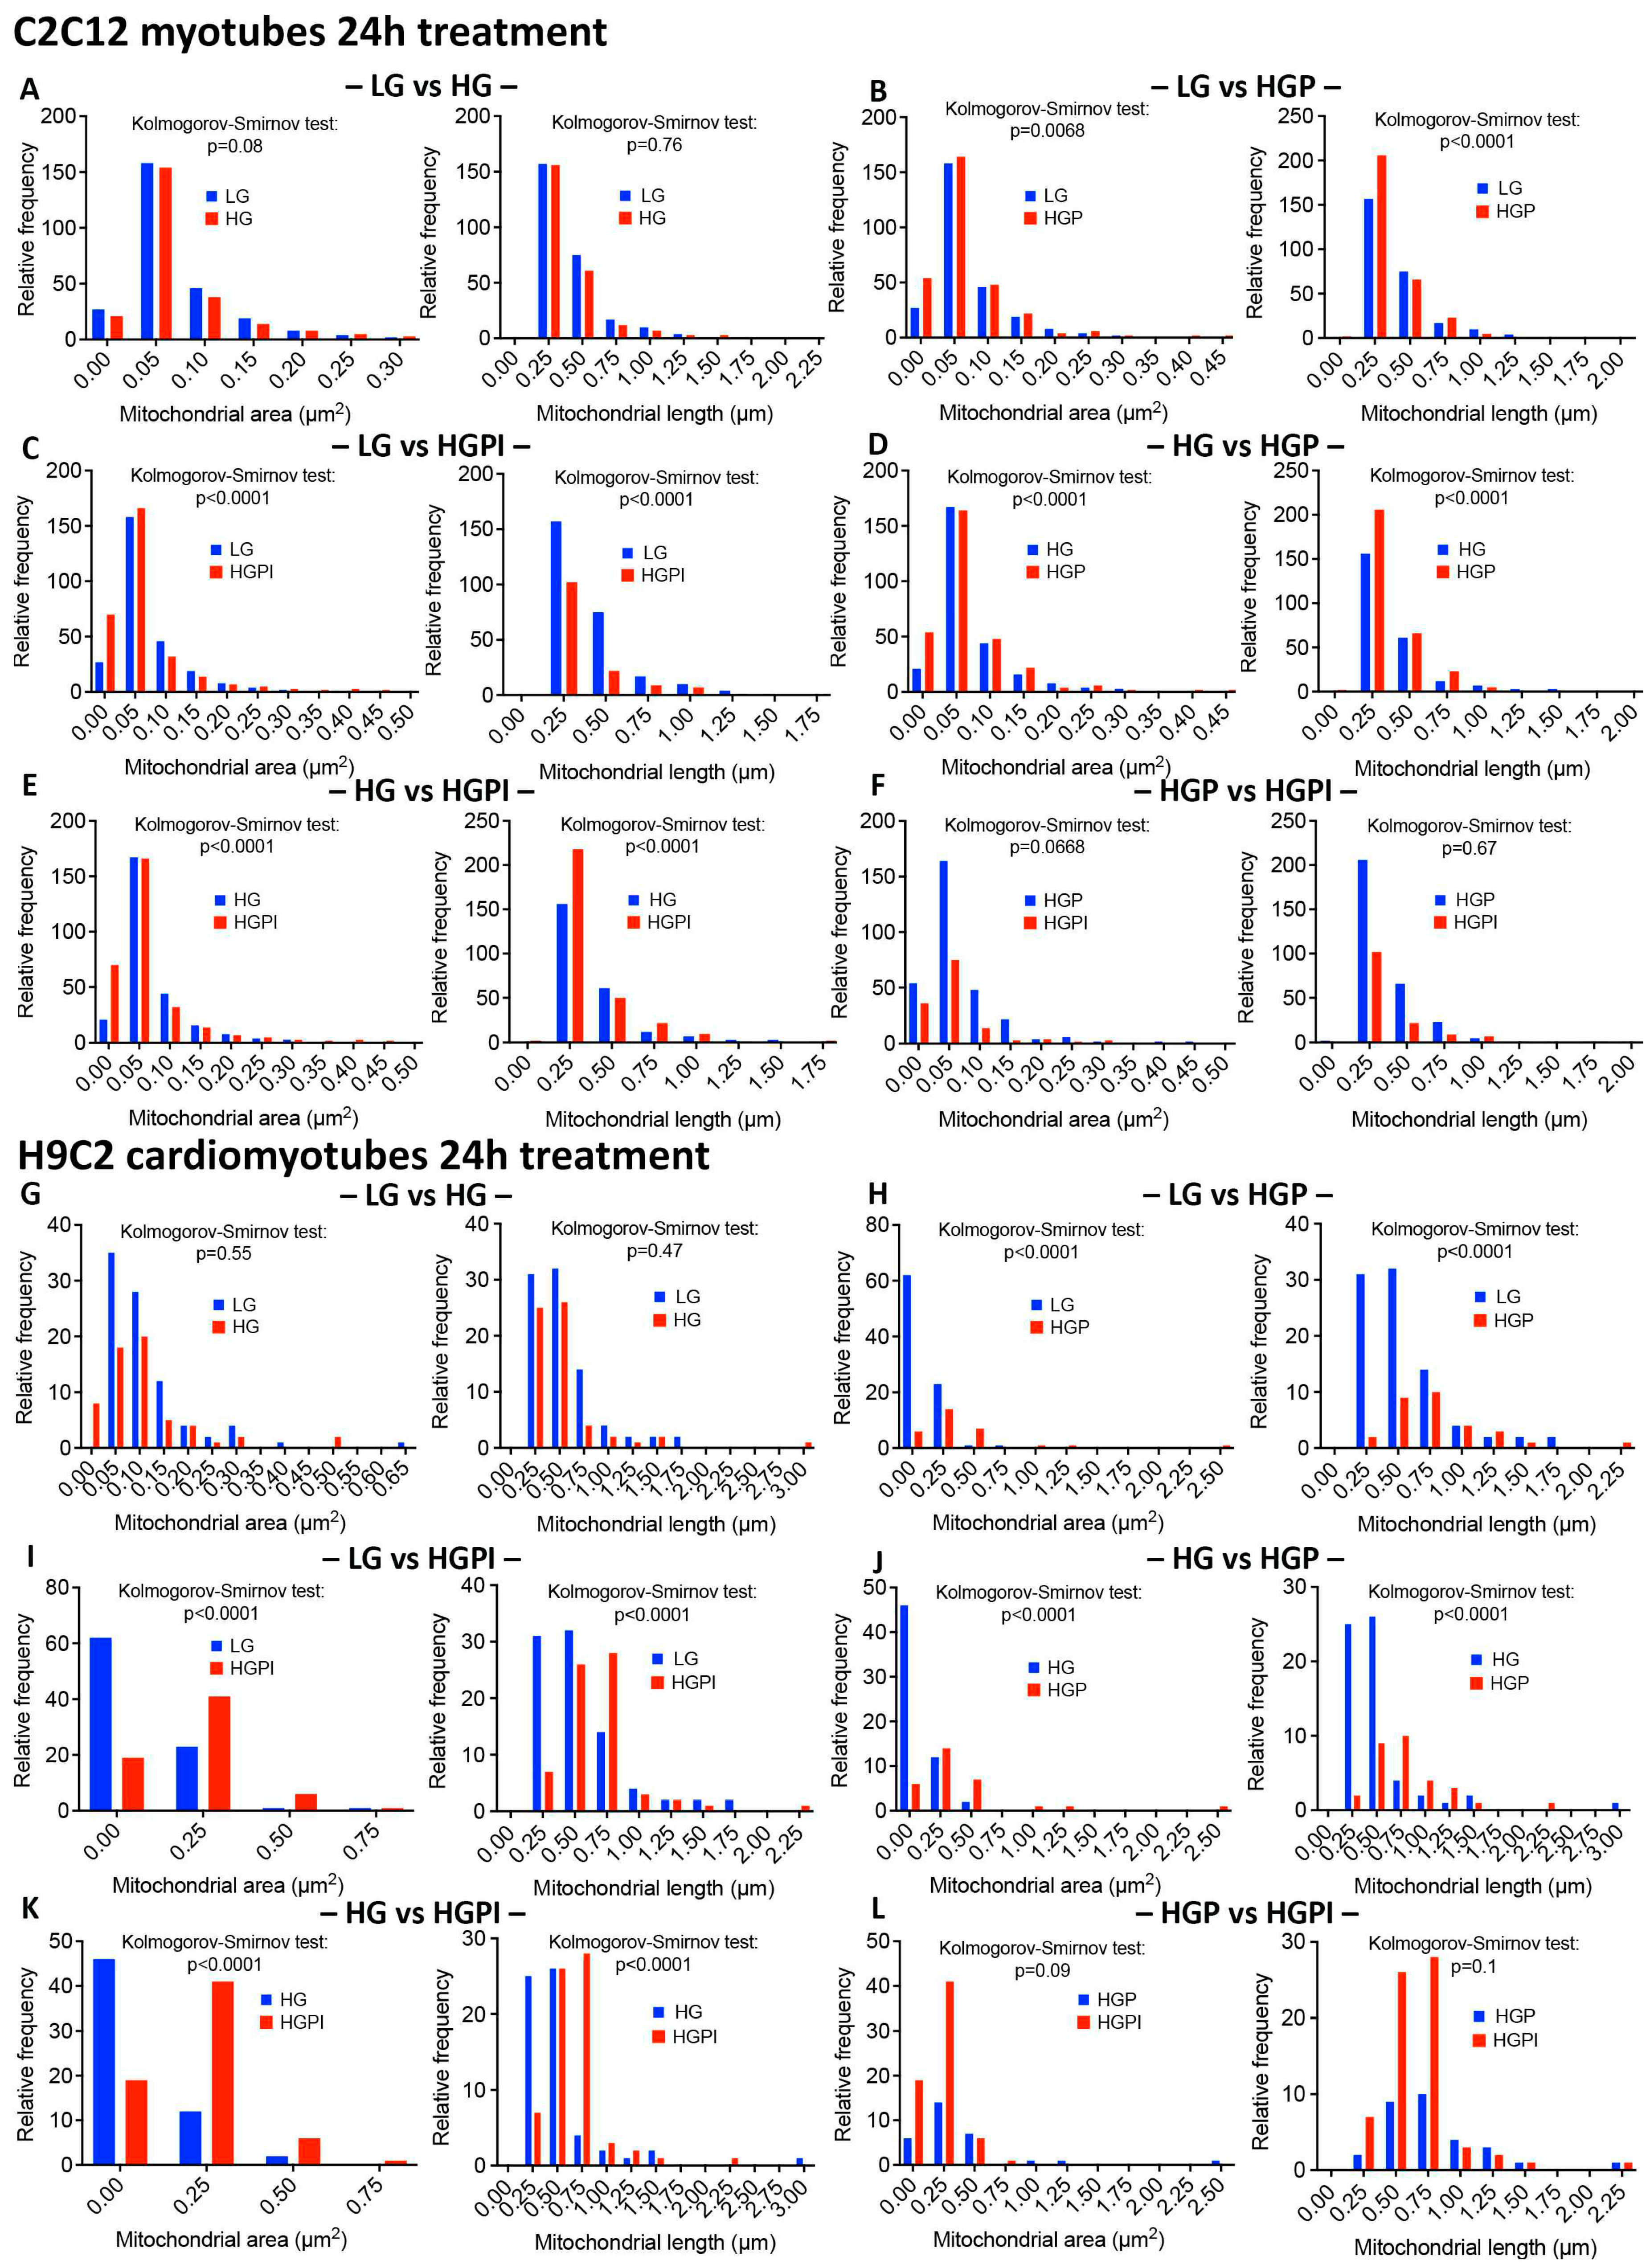
Morphometric analyses revealed that HG alone was not sufficient to alter the relative frequency of mitochondria with respect to area and length in both C2C12 and H9C2 cells (Figure 4A,G). In contrast, palmitate alone caused marked changes in relative frequency of mitochondria with respect to area and length in both C2C12 and H9C2 cells (Figure 4B,H), indicating that palmitate is a stronger reagent than glucose to affect mitochondrial health.
3.3.4. Insulin Failed to Alter Palmitate-Induced Changes in Mitochondrial Health
We found no significant changes in mitochondrial area and length between HGP and HGPI groups in both C2C12 and H9C2 cells (Figure 4F,L), indicating that palmitate in combination with HG caused profound IR in muscle cells.
Figure 4.
Relative frequency of mitochondria with respect to area and length after 24h treatment with T2D mimicking conditions. A-F C2C12 myotubes, G-L H9C2 myotubes. Kolmogorov-Smirnov-Test of mitochondrial area (µm2) and length (µm) of LG vs HG (A, G), LG vs HGP (B, H), LG vs HGPI (C, I), HG vs HGP (D, J), HG vs HGPI (E, K), HGP vs HGPI (F, L). LG: low glucose 5mM; HG: high glucose 25mM; HGP: high glucose + 150 µM palmitate for C2C12 and 75 µM palmitate for H9C2; HGPI: high glucose + 150 µM palmitate for C2C12 and 75 µM palmitate for H9C2 + 1 nM insulin.
4. Discussion
We observed that complex T2D in vitro modeling has significant effects on the functionality of rodent skeletal and heart muscle cells, leading to severe IR, changes in ATP-linked respiration, shifts in energetic phenotypes, and mitochondrial morphology changes, all consistent with what has been observed in the muscle of patients suffering from T2D [14]. Pre-existing in vitro models of T2D often disregard many critical and complex aspects of the disease. The current study shows that by following some essential steps lacking in the literature, a representative in vitro model of human T2D-related changes in muscle cells can be created (Table 2).
Table 2.
Selection of current in vitro models of type 2 diabetes and insulin resistance.
| Cell Type and Differentiation | Preincubation | Type of Treatment, Concentration, Duration | Read outs | Reference |
|---|---|---|---|---|
| 3T3-L1 adipocytes | DMEM 5mM glucose | Palmitate 0.75mM 17h Hypoxia 16h Dexamethasone 1 µmol/l 24h High glucose 25mM 18h |
Inhibition of phosphorylation of insulin receptor and protein kinase B; decrease in insulin dependent glucose uptake Impaired GLUT4 membrane intercalation |
[15] [16] [17] [18] |
| C2C12 myoblasts | DMEM 25mM glucose | Insulin 60nM 24h Palmitate 0.4mM 24h |
Inhibition of insulin stimulated activation of Akt/protein kinase B; Swollen mitochondria | [19] |
| DMEM 5mM glucose | Glucose 15mM 24h Palmitate 0.25mM 24h |
Increased apoptosis, increased ROS production | [20] | |
| C2C12 myotubes | DMEM 5mM glucose DMEM not specified |
Palmitate 0.75mM 17h Palmitate 0.6mM 24h |
Inhibition of insulin stimulated glycogen synthesis and activation of protein kinase B, diacylglyceride accumulation Reduced Akt phosphorylation, glucose uptake and GLUT4 expression |
[15] [21] |
| Huh7 differentiated hepatocellular carcinoma | DMEM 25mM glucose | Insulin 60nM 24h Palmitate 0.4mM 24h |
Inhibition of insulin stimulated activation of Akt/protein kinase B | [19] |
| Primary human myotubes | DMEM not specified | Palmitate 0.5mM 48h | Decrease in insulin stimulated glucose uptake | [22] |
| H9C2 myoblasts | DMEM 25mM glucose DMEM 5mM glucose |
Glucose 33mM 36h Glucose 40mM 24h Glucose 25mM + insulin 100nM 24h |
Enhanced apoptosis, activation of cardiac hypertrophy proteins Increased ROS production + apoptosis Decrease in insulin stimulated glucose uptake, Inhibition of insulin stimulated activation of Akt |
[23] [24] [25] |
| H9C2 myotubes | DMEM not specified | Palmitate 100µM 24h | Decrease in insulin stimulated glucose uptake | [13] |
Basal glucose uptake rates were increased in both cell lines after HG treatment compared to LG, especially after long-term exposure. The gradient-driven glucose uptake might have facilitated this via GLUT1 instead of insulin-dependent GLUT4. McMillin et al. showed that mGLUT4 knockout mice still showed increased basal glucose uptake after chronic exposure to HG. They also found that in mouse skeletal muscle cells, GLUT1, 3, 6 or 10 almost exclusively mediate glucose uptake after chronic glucose overload [26]. Gosmanov et al. observed that, compared to 5mM glucose exposure, HG treatment (30mM, up to 48h) of aortic endothelial cells increased GLUT1 expression and GLUT4-dependent glucose uptake, but didn’t change baseline glucose uptake rates. Heilig et al. saw an 134% increase in GLUT1 mitochondrial RNA as well as a 50% increase in deoxy-glucose uptake in rat mesangial cells exposed to 20mM glucose for 3 days, when compared to cells adapted to physiological glucose levels (8mM).
We examined mitochondrial function and metabolic phenotypes in rodent skeletal and heart muscle. Skeletal myotubes from insulin-sensitive subjects with T2D family history have decreased ATP content, consistent to previous studies showing decreased ATP and impaired mitochondrial activity in myotubes from lean offspring of T2D patients [27,28,29].
C2C12 myotubes exposed to 24mM glucose for 24h showed a glycolytic phenotype and more ROS production than a low glucose control with an oxidative phenotype; however, ATP-linked respiration was not altered, indicating that those myotubes still were metabolically flexible and achieved the ATP demand via glycolysis [30]. Elkalaf et al. followed a similar approach and saw differences in maximal respiration in hyperglycemic C2C12 myotube cultures and a phenotype switch. In both studies, cells were differentiated for up to 7 days in media containing 5mM or 25mM glucose before any experiment [31]. Differentiating cells in high glucose might have caused an adaptation of the cells, leading to restored cellular flexibility. In the current study, cells were differentiated in low glucose levels and only exposed to high glucose for 24-96h when already differentiated, which more accurately represents the changes of T2D in vivo. Future experiments should include longer exposure to high glucose to investigate if, following differentiation, an adaptation to supraphysiological glucose and correspondingly non-altered ATP levels is possible.
Strongly increased respiration rates might be associated with elevated cellular stress since high glucose and palmitate levels lead to apoptosis in cardiomyocytes [32,33,34]. On the other hand, it can also reflect a highly energetic phenotype with increased oxidation abilities [10]. The increase in ATP-linked respiration might be associated with an increase of FA oxidation and decreased glucose utilization, which is assumed to be increased in the T2D heart in humans [35,36]. Unlike glucose uptake, FA uptake into the heart is not hormonally controlled and mainly driven by the availability in the blood stream [37]. With an oversupply in fatty acids, not only is FA oxidation increased but also detrimental lipid metabolites (i.e., ceramides) [33,38]. Reliance of the heart on FA oxidation to produce ATP might lead to oxidative stress and ischemic damage [39]. Therefore, losing the ability to switch to glycolysis combined to an increase in ROS due to the increased FA oxidation and increasing lipotoxicity contribute to both decreased ATP production and cardiac inefficiency.
In patients with T2D mitochondrial content is reduced, size and fusion are impaired, and endoplasmic reticulum stress occurs in different cell types [40,41,42]. Increased fission and impaired fusion was observed in human renal glomerular endothelial cells treated with high glucose (30mM for 72h) [43]. A reduced number and fragmented mitochondria were found in skeletal muscle from T2D and obese subjects, as well as decreased electron transport chain activity [44,45]. In our study, we did observe a significant decrease in mitochondrial density in diabetic C2C12 cells, consistent with decreased ATP-linked respiration. We did not observe any significant changes in mitochondrial number per 10 µm2 area of cytoplasm after 24h exposure to T2D mimicking conditions. Thus, it is likely that the reduction of mitochondrial number that was reported in patients suffering from T2D, is a chronic condition that will only occur in vitro after longer treatments.
H9C2 myotubes treated with T2D mimicking conditions including palmitate (HGP, HGPI) showed a significant increase in mitochondrial density compared to control, which can be a sign of increased fusion, allowing an enhanced transport of metabolites and enzymes. This observation is consistent to our Mito Stress Tests, where these cells showed increased ATP-linked respiration, confirming a better adaptability to an in vitro T2D environment of heart muscle cells.
Both C2C12 and H9C2 myotubes treated with HM and T2D mimicking conditions showed a higher fraction of swollen/vacuolated mitochondria compared to LG controls. Mitochondrial swelling can be caused by osmotic changes in cell culture media and FA treatments but is also a known sign of apoptosis and necrosis [46,47,48]. The question remains if whether the decreased ATP-linked respiration we observed in skeletal muscle cells in the T2D environment led to imminent apoptosis and then mitochondrial swelling, or if the T2D mimicking treatments directly caused mitochondrial swelling, subsequently leading to mitochondrial dysfunction and decreased ATP turnover.
There are several limitations to consider in our studies. We chose to use the saturated FA palmitate for our investigations, as it was previously used for studies addressing IR. Even when the Western diet is dominated by saturated FAs, using only one saturated FA is not physiologically accurate since in vivo circulating FFAs are a mixture of various saturated and unsaturated FAs. For future experiments, a mixture (i. e. palmitate and oleate) could be used.
High mannitol treatments served as osmotic controls for high glucose treatments in our study, as it has been widely applied in the literature. Yet we observed some hitherto undescribed effects, especially after 96h high mannitol treatments, such as decreased ATP-linked respiration, a shift to glycolysis but decreased basal glucose uptake, and mitochondrial swelling. The mechanistic background of the effects that we observed must still be explored. Still, it can be stated that the impact of hyperosmolarity and hyperlipidemia in a hyperglycemic T2D environment appears more complex than expected.
We used two well-established cell skeletal and cardiac myoblast lines for this model under differentiating myotubes conditions with close ‘normoglycemic and normoinsulinemic’ conditions thus avoiding diabetogenic preconditioning before use in experiments. In the experiments, we simulated, in addition to hyperglycemia and hyperinsulinemia also, other aspects of T2D, i.e. hyperlipemia and hyperosmolarity. Despite using lower concentrations than previous studies, closer to the range seen in patients with T2D, we demonstrated a very rapid and progressive development of insulin resistance, derangements in mitochondrial metabolism and morphology with specific differences between skeletal and cardiac myotubes that parallel findings in biopsies from T2D patients. The model could potentially be extended to other tissues impacted by diabetes. Our model should therefore help to spare animal experiments and studies requiring human biopsies and has the potential for exploring pathomechanisms, defining potential new targets, and screening candidate therapeutic compounds in T2D.
Author Contributions
Conceptualization, E.K. and H.P.; methodology, E.K. and S.M.; validation, E.K., D.D., R.L. and S.M.; formal analysis, R.C. .; investigation, E.K. and D.D., resources, H.P., D.R., S.M.; writing—original draft preparation, E. K.; writing—review and editing, E.K., H.P., R.L., D.R., D.D.; visualization, E.K.; supervision, H.P.; project administration, E. K.; funding acquisition, H.P. All authors have read and agreed to the published version of the manuscript.
Funding
This work was supported by the Department of Veterans Affairs (BX001963 to HHP) and a Research Career Scientist Award (# IK6 BX005229 to HHP).
Data Availability Statement
All data is available upon request.
Acknowledgments
We would like to thank Ying Jones from the Department of Cellular and Molecular Medicine, University of California San Diego, La Jolla, CA, USA and Ingrid Niesman from the Electron microscopy facility, SDSU, CA, USA.
References
- Bommer C, Sagalova V, Heesemann E, et al. (2018) Global Economic Burden of Diabetes in Adults: Projections From 2015 to 2030. Diabetes care 41(5): 963-970. 10.2337/dc17-1962. [CrossRef]
- International Diabetes Federation (2019) IDF Diabetes Atlas, 9th edn. Available at: https://www.diabetesatlas.org, Brussels, Belgium.
- Harreiter J, Roden M (2019) [Diabetes mellitus-Definition, classification, diagnosis, screening and prevention (Update 2019)]. Wiener klinische Wochenschrift 131(Suppl 1): 6-15. 10.1007/s00508-019-1450-4. [CrossRef]
- Centers for Disease Control and Prevention (2020) National Diabetes Statistics Report, 2020. In, Atlanta, GA: , U.S. Dept of Health and Human Services.
- World Health Organization (2016) Global Report on Diabetes, Geneva, Switzerland.
- Mozaffarian D, Benjamin EJ, Go AS, et al. (2015) Heart disease and stroke statistics--2015 update: a report from the American Heart Association. Circulation 131(4): e29-322. 10.1161/cir.0000000000000152. [CrossRef]
- Lilao-Garzón J, Valverde-Tercedor C, Muñoz-Descalzo S, Brito-Casillas Y, Wägner AM (2021) In Vivo and In Vitro Models of Diabetes: A Focus on Pregnancy. In: Islam MS (ed) Diabetes: from Research to Clinical Practice: Volume 4. Springer International Publishing, Cham, pp 553-576.
- Li P, Oh DY, Bandyopadhyay G, et al. (2015) LTB4 promotes insulin resistance in obese mice by acting on macrophages, hepatocytes and myocytes. Nat Med 21(3): 239-247. 10.1038/nm.3800. [CrossRef]
- Serrage HJ, Joanisse S, Cooper PR, et al. (2019) Differential responses of myoblasts and myotubes to photobiomodulation are associated with mitochondrial number. J Biophotonics 12(6): e201800411. 10.1002/jbio.201800411. [CrossRef]
- Divakaruni AS, Paradyse A, Ferrick DA, Murphy AN, Jastroch M (2014) Chapter Sixteen - Analysis and Interpretation of Microplate-Based Oxygen Consumption and pH Data. In: Murphy AN, Chan DC (eds) Methods in Enzymology. Vol 547. Academic Press, pp 309-354.
- Patel HH, Zhang S, Murray F, et al. (2007) Increased smooth muscle cell expression of caveolin-1 and caveolae contribute to the pathophysiology of idiopathic pulmonary arterial hypertension. FASEB journal : official publication of the Federation of American Societies for Experimental Biology 21(11): 2970-2979. 10.1096/fj.07-8424com. [CrossRef]
- Pasqua T, Mahata S, Bandyopadhyay GK, et al. (2016) Impact of Chromogranin A deficiency on catecholamine storage, catecholamine granule morphology and chromaffin cell energy metabolism in vivo. Cell and Tissue Research 363(3): 693-712. 10.1007/s00441-015-2316-3. [CrossRef]
- Chang W, Chen L, Hatch GM (2016) Berberine treatment attenuates the palmitate-mediated inhibition of glucose uptake and consumption through increased 1,2,3-triacyl-sn-glycerol synthesis and accumulation in H9c2 cardiomyocytes. Biochimica et Biophysica Acta (BBA) - Molecular and Cell Biology of Lipids 1861(4): 352-362. https://doi.org/10.1016/j.bbalip.2015.12.017. [CrossRef]
- Fealy CE, Mulya A, Axelrod CL, Kirwan JP (2018) Mitochondrial dynamics in skeletal muscle insulin resistance and type 2 diabetes. Transl Res 202: 69-82. 10.1016/j.trsl.2018.07.011. [CrossRef]
- Chavez JA, Summers SA (2003) Characterizing the effects of saturated fatty acids on insulin signaling and ceramide and diacylglycerol accumulation in 3T3-L1 adipocytes and C2C12 myotubes. Archives of Biochemistry and Biophysics 419(2): 101-109. https://doi.org/10.1016/j.abb.2003.08.020. [CrossRef]
- Regazzetti C, Peraldi P, Grémeaux T, et al. (2009) Hypoxia Decreases Insulin Signaling Pathways in Adipocytes. Diabetes 58(1): 95-103. 10.2337/db08-0457. [CrossRef]
- Sakoda H, Ogihara T, Anai M, et al. (2000) Dexamethasone-induced insulin resistance in 3T3-L1 adipocytes is due to inhibition of glucose transport rather than insulin signal transduction. Diabetes 49(10): 1700-1708. 10.2337/diabetes.49.10.1700. [CrossRef]
- Nelson BA, Robinson KA, Buse MG (2000) High glucose and glucosamine induce insulin resistance via different mechanisms in 3T3-L1 adipocytes. Diabetes 49(6): 981-991.
- Krako Jakovljevic N, Pavlovic K, Zujovic T, et al. (2021) In vitro models of insulin resistance: Mitochondrial coupling is differently affected in liver and muscle cells. Mitochondrion 61: 165-173. https://doi.org/10.1016/j.mito.2021.10.001. [CrossRef]
- Dohl J, Foldi J, Heller J, Gasier HG, Deuster PA, Yu T (2018) Acclimation of C2C12 myoblasts to physiological glucose concentrations for in vitro diabetes research. Life Sciences 211: 238-244. https://doi.org/10.1016/j.lfs.2018.09.041. [CrossRef]
- Yang M, Wei D, Mo C, et al. (2013) Saturated fatty acid palmitate-induced insulin resistance is accompanied with myotube loss and the impaired expression of health benefit myokine genes in C2C12 myotubes. Lipids in health and disease 12: 104. 10.1186/1476-511x-12-104. [CrossRef]
- Chanon S, Durand C, Vieille-Marchiset A, et al. (2017) Glucose Uptake Measurement and Response to Insulin Stimulation in In Vitro Cultured Human Primary Myotubes. J Vis Exp(124): 55743. 10.3791/55743. [CrossRef]
- Feng CC, Pandey S, Lin CY, et al. (2018) Cardiac apoptosis induced under high glucose condition involves activation of IGF2R signaling in H9c2 cardiomyoblasts and streptozotocin-induced diabetic rat hearts. Biomedicine & pharmacotherapy = Biomedecine & pharmacotherapie 97: 880-885. 10.1016/j.biopha.2017.11.020. [CrossRef]
- Ding W, Chang WG, Guo XC, et al. (2019) Exenatide Protects Against Cardiac Dysfunction by Attenuating Oxidative Stress in the Diabetic Mouse Heart. Frontiers in endocrinology 10: 202. 10.3389/fendo.2019.00202. [CrossRef]
- Ha H, Pak Y (2005) Modulation of the caveolin-3 and Akt status in caveolae by insulin resistance in H9c2 cardiomyoblasts. Experimental & molecular medicine 37(3): 169-178. 10.1038/emm.2005.23. [CrossRef]
- McMillin SL, Schmidt DL, Kahn BB, Witczak CA (2017) GLUT4 Is Not Necessary for Overload-Induced Glucose Uptake or Hypertrophic Growth in Mouse Skeletal Muscle. Diabetes 66(6): 1491-1500. 10.2337/db16-1075. [CrossRef]
- Petersen KF, Dufour S, Befroy D, Garcia R, Shulman GI (2004) Impaired mitochondrial activity in the insulin-resistant offspring of patients with type 2 diabetes. The New England journal of medicine 350(7): 664-671. 10.1056/NEJMoa031314. [CrossRef]
- Morino K, Petersen KF, Dufour S, et al. (2005) Reduced mitochondrial density and increased IRS-1 serine phosphorylation in muscle of insulin-resistant offspring of type 2 diabetic parents. J Clin Invest 115(12): 3587-3593. 10.1172/JCI25151. [CrossRef]
- Befroy DE, Petersen KF, Dufour S, et al. (2007) Impaired Mitochondrial Substrate Oxidation in Muscle of Insulin-Resistant Offspring of Type 2 Diabetic Patients. Diabetes 56(5): 1376-1381. 10.2337/db06-0783. [CrossRef]
- Mailloux RJ, Harper M-E (2010) Glucose regulates enzymatic sources of mitochondrial NADPH in skeletal muscle cells; a novel role for glucose-6-phosphate dehydrogenase. The FASEB Journal 24(7): 2495-2506. https://doi.org/10.1096/fj.09-151803. [CrossRef]
- Elkalaf M, Anděl M, Trnka J (2013) Low glucose but not galactose enhances oxidative mitochondrial metabolism in C2C12 myoblasts and myotubes. PLoS One 8(8): e70772-e70772. 10.1371/journal.pone.0070772. [CrossRef]
- Wang X, McLennan SV, Allen TJ, Tsoutsman T, Semsarian C, Twigg SM (2009) Adverse effects of high glucose and free fatty acid on cardiomyocytes are mediated by connective tissue growth factor. American Journal of Physiology-Cell Physiology 297(6): C1490-C1500. 10.1152/ajpcell.00049.2009. [CrossRef]
- Hickson-Bick DL, Buja LM, McMillin JB (2000) Palmitate-mediated alterations in the fatty acid metabolism of rat neonatal cardiac myocytes. J Mol Cell Cardiol 32(3): 511-519. 10.1006/jmcc.1999.1098. [CrossRef]
- Nishi H, Higashihara T, Inagi R (2019) Lipotoxicity in Kidney, Heart, and Skeletal Muscle Dysfunction. Nutrients 11(7). 10.3390/nu11071664. [CrossRef]
- Lisa CH, Kieran C (2011) Metabolism, hypoxia and the diabetic heart. Journal of Molecular and Cellular Cardiology 50(4): 598-605. https://doi.org/10.1016/j.yjmcc.2011.01.007. [CrossRef]
- Barsotti A, Giannoni A, Di Napoli P, Emdin M (2009) Energy metabolism in the normal and in the diabetic heart. Current pharmaceutical design 15(8): 836-840. 10.2174/138161209787582066. [CrossRef]
- An D, Rodrigues B (2006) Role of changes in cardiac metabolism in development of diabetic cardiomyopathy. American Journal of Physiology-Heart and Circulatory Physiology 291(4): H1489-H1506. 10.1152/ajpheart.00278.2006. [CrossRef]
- Sharma S, Adrogue JV, Golfman L, et al. (2004) Intramyocardial lipid accumulation in the failing human heart resembles the lipotoxic rat heart. The FASEB Journal 18(14): 1692-1700. https://doi.org/10.1096/fj.04-2263com. [CrossRef]
- 39. Carpentier AC (2018) Abnormal Myocardial Dietary Fatty Acid Metabolism and Diabetic Cardiomyopathy. The Canadian journal of cardiology 34(5): 605-614. 10.1016/j.cjca.2017.12.029. [CrossRef]
- Abdelmoez AM, Sardón Puig L, Smith JAB, et al. (2020) Comparative profiling of skeletal muscle models reveals heterogeneity of transcriptome and metabolism. American journal of physiology Cell physiology 318(3): C615-c626. 10.1152/ajpcell.00540.2019. [CrossRef]
- 41. Zorzano A, Liesa M, Palacín M (2009) Role of mitochondrial dynamics proteins in the pathophysiology of obesity and type 2 diabetes. The international journal of biochemistry & cell biology 41(10): 1846-1854. 10.1016/j.biocel.2009.02.004. [CrossRef]
- Peter A, Weigert C, Staiger H, et al. (2009) Individual stearoyl-coa desaturase 1 expression modulates endoplasmic reticulum stress and inflammation in human myotubes and is associated with skeletal muscle lipid storage and insulin sensitivity in vivo. Diabetes 58(8): 1757-1765. 10.2337/db09-0188. [CrossRef]
- Chen W, Xiang H, Chen R, et al. (2019) S1PR2 antagonist ameliorate high glucose-induced fission and dysfunction of mitochondria in HRGECs via regulating ROCK1. BMC Nephrology 20(1): 135. 10.1186/s12882-019-1323-0. [CrossRef]
- 44. Ritov VB, Menshikova EV, He J, Ferrell RE, Goodpaster BH, Kelley DE (2005) Deficiency of Subsarcolemmal Mitochondria in Obesity and Type 2 Diabetes. Diabetes 54(1): 8-14. 10.2337/diabetes.54.1.8. [CrossRef]
- Kelley DE, He J, Menshikova EV, Ritov VB (2002) Dysfunction of mitochondria in human skeletal muscle in type 2 diabetes. Diabetes 51(10): 2944-2950.
- Davis MA, Jeffery EH (2002) 4 - Organelle Biochemistry and Regulation of Cell Death. In: Haschek WM, Rousseaux CG, Wallig MA (eds) Handbook of Toxicologic Pathology (Second Edition). Academic Press, San Diego, pp 67-81.
- Lemasters JJ (2013) Chapter 5 - Hepatotoxicity Due to Mitochondrial Injury. In: Kaplowitz N, DeLeve LD (eds) Drug-Induced Liver Disease (Third Edition). Academic Press, Boston, pp 85-100.
- Ghadially FN (1988) 3 - Mitochondria. In: Ghadially FN (ed) Ultrastructural Pathology of the Cell and Matrix (Third Edition). Butterworth-Heinemann, pp 191-328.
Disclaimer/Publisher’s Note: The statements, opinions and data contained in all publications are solely those of the individual author(s) and contributor(s) and not of MDPI and/or the editor(s). MDPI and/or the editor(s) disclaim responsibility for any injury to people or property resulting from any ideas, methods, instructions or products referred to in the content. |
© 2023 by the authors. Licensee MDPI, Basel, Switzerland. This article is an open access article distributed under the terms and conditions of the Creative Commons Attribution (CC BY) license (http://creativecommons.org/licenses/by/4.0/).
Copyright: This open access article is published under a Creative Commons CC BY 4.0 license, which permit the free download, distribution, and reuse, provided that the author and preprint are cited in any reuse.


