Preprint
Article

Crystal Growth and Structure of a New Quaternary Adamantine CuGaGeS4

Altmetrics

Downloads

94

Views

34

Comments

0

A peer-reviewed article of this preprint also exists.

Submitted:

05 October 2023

Posted:

06 October 2023

You are already at the latest version

Alerts
Abstract
Single crystals of quaternary adamantine type Cu•GaGeS4 were grown by chemical vapor transport technique using iodine as transport agent. Dark red transparent crystals grew in a temperature gradient of dT = 900–750 °C. Chemical characterization by X-ray fluorescence showed an off-stoichiometric composition of the Cu•GaGeS4 crystals, in particular a slight Ge-deficit. By X-ray diffraction, Cu•GaGeS4 was found to adopt the chalcopyrite-type structure with the space group I-42d. The cation distribution in this structure was analyzed by multiple energy anomalous synchrotron X-ray diffraction and it was found that Cu and vacancies occupy the 4a site, whereas Ga and Ge occupy the 4b site. The band gap energies of several off-stoichiometric Cu•GaGeS4 crystals were determined by UV-Vis spectroscopy and are in the range of 2.1 to 2.4 eV. A non-linear correlation of the band gap energy with the Ge-content of the compound follows the usual bowing behaviour of semiconductor alloys with a bowing parameter of b = 1.45(0.08).
Keywords: 
Subject: Chemistry and Materials Science  -   Electronic, Optical and Magnetic Materials

1. Introduction

“Adamantine”- type compounds, including kesterite, are currently the most promising material for fully inorganic thin film photovoltaic technology that is free of critical raw-materials and thus provides sustainable solutions. The ternary AIBIIIXVI2 chalcopyrite compound family can be transformed into a quaternary adamantine such as AI2BIICIVXVI4 and AI☐BIIICIVXVI4 compounds by chemical substitution (the symbol ☐ indicates vacancies, i. e. empty cation sites in the crystal structure). The latter are referred to as defect adamantine [1]. A number of studies on defect adamantine selenides have been published [2,3,4], but less information is available on sulfides [5,6]. A less known sulfide defect adamantine is Cu☐GaGeS4. In order to study the material properties, single crystals are prepared as a representative material.

Structural considerations

Adamantines crystallize in tetrahedral coordinated structures derived from the diamond-type (space group F d 3 ¯ m ) and the lonsdaleite-type (space group P 6 3 m m c ) crystal structure. Pamplin [1] summarized 249 adamantines derived from these two different crystal structures of carbon (diamond and lonsdaleite). A pre-requisite is not only the tetrahedral coordination of the cations by the anions and vice versa, but also that there are four electrons per structural site and the number of cations and anions is equal. In case a structural site is a vacancy, like in AI☐BIIICIVXVI4 compounds, they are called “defect adamantine”.
Ternary compounds of the adamantine family with the general formula AIBIIIXVI2 crystallize in the chalcopyrite-type crystal structure (space group I 4 ¯ 2 d ) belonging to the tetragonal crystal system. In this crystal structure, each metal ion is tetrahedral coordinated to four chalcogen anions and vice versa each anion is bonded to two mono-valent and two three-valent cations (Figure 1). In the chalcopyrite-type crystal structure, the AI cation occupies the Wyckoff position 4a at (0,0,0) and the BIII cation occupies the 4b position at (0,0,0.5). The anions occupying the Wyckoff position 8d at (x,0.25,0.125).
Quaternary compounds of the adamantine family are of AI2BIICIVXVI4 and AI☐BIIICIVXVI4 type. Figure 1 shows that the distribution of metal ions is important and determines the crystal structure of the quaternary compound. The AI☐BIIICIVXVI4 defect adamantines can be formed from the ternary chalcopyrite-type compounds by doubling the entire formula unit (AIBIIIXVI2) and replacing one A1+ and one B3+ cation by one C4+ cation. This results a balanced valency but an unbalanced cation/anion ratio (with respect to the ratio of cation and anion sites in the chalcopyrite-type structure). Accordingly, the structure must be compensated by vacancies (AI + BIII ↔ vacancy + CVI).

Thermodynamic properties

Only limited information is available on the properties of the adamantine compounds of interest. Table 1 shows structural information as well as melting point and band gap energies of Cu☐GaGeXVI4 with X = S, Se.
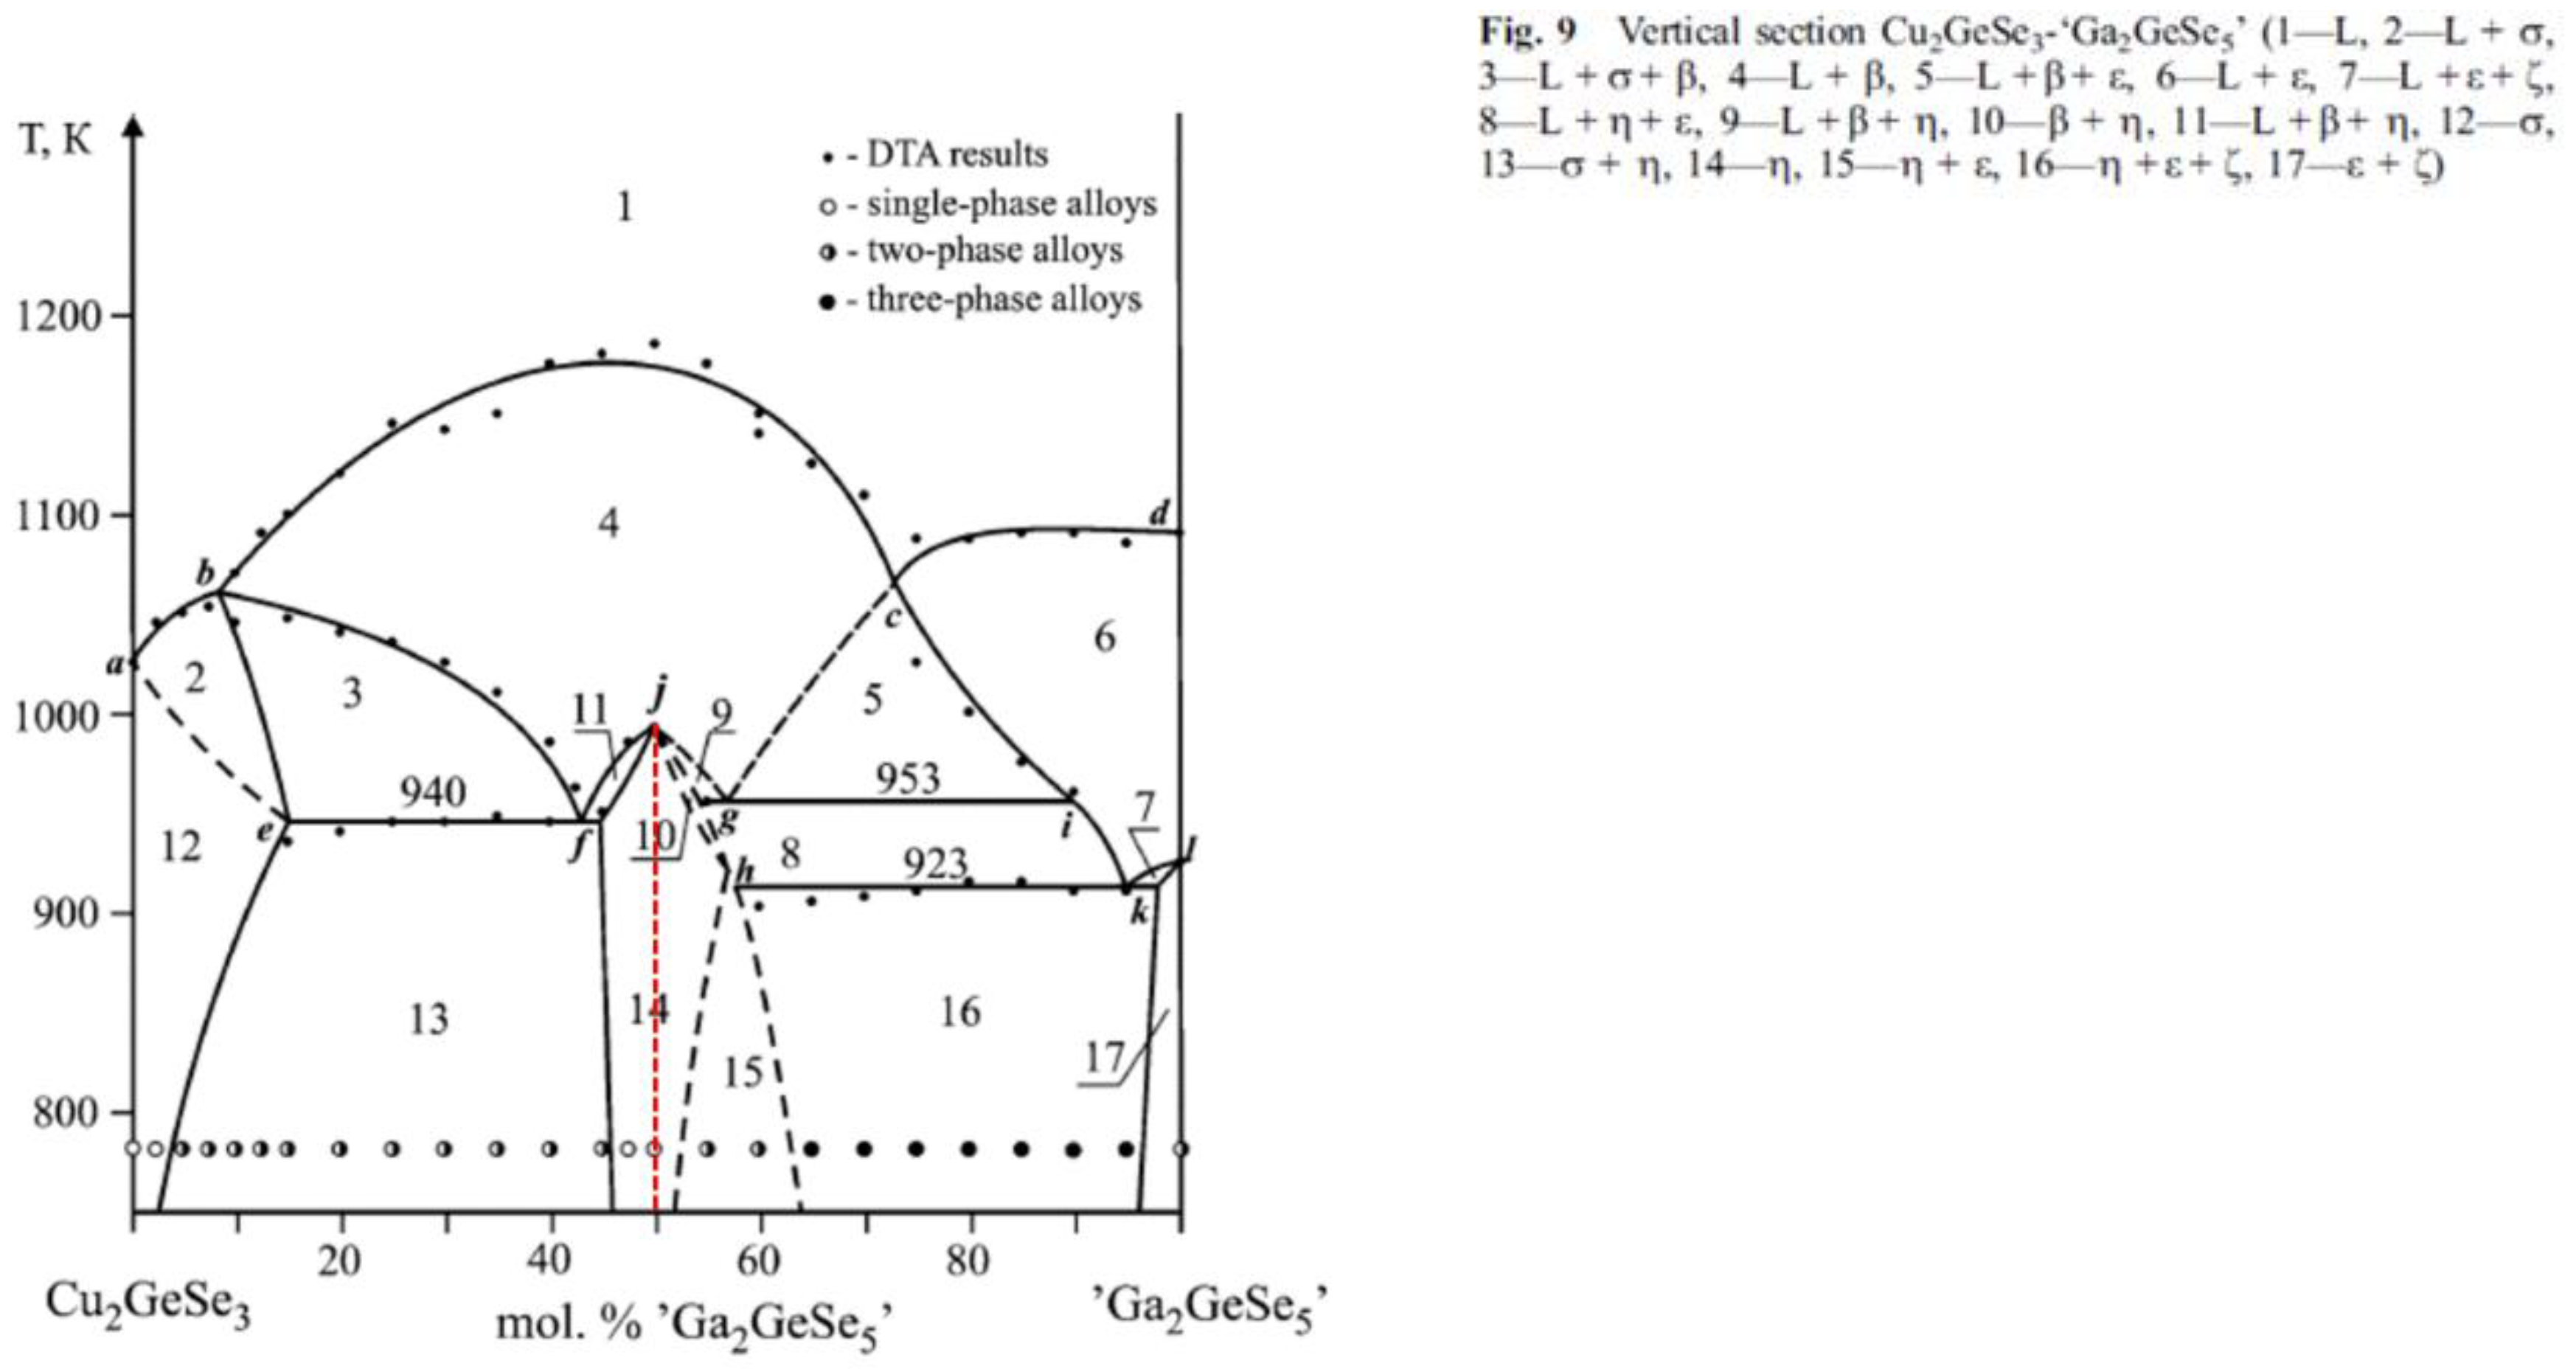
Since little is known in literature about the phase diagram CuGaS2 - GeS2, the phase diagram Cu2GeSe3 - Ga2GeSe5 [12] is taken as a reference point for the discussion of the material synthesis (Figure 2). As a representative, the more complex phase relations in the class of adamantine are obvious here - peritectic and eutectic points as well as phase transitions. These are rather difficult conditions for single crystal growth.
The most appropriate way of single crystal growth would be chemical vapor transport (as introduced by Nitsche [13]). With chemical vapor transport (CVT) enhanced by halogens, crystals can be grown below critical temperatures. Such crystals will grow close to thermodynamic equilibrium.
In this work, we report on the growth of Cu☐GaGeS4 single crystals using the chemical vapor transport technique. Starting with the ternary compound CuGaS2, the conditions for growing single crystals of Cu☐GaGeS4 were investigated. The evolved material and the crystals grown were characterized regarding their chemical composition, crystal structure and band gap energy.

2. Materials and Methods

Crystal growth

Crystal growth experiments were performed using the chemical vapor transport technique (CVT). The starting elements Cu, Ga, Ge and S are placed in a closed system, in this case a quartz glass ampoule of 20 mm diameter and 200 mm length. A halogen, for example iodine, is used to enhance the transport. The ampoule is evacuated, sealed, and placed in a two-zone furnace where the elements are to react. The iodine reacts with the metals at elevated temperatures to form volatile species. The halogen-containing species transport from the hot (900 °C) to the cold (750 °C) part of the ampoule. The transport takes place with the species given in equation (1) and (2)
C u s + G a s + G e s + 4 S s + I 2 s C u G a G e S 4 + I 2 ( s ) ,
C u I 3 g + G a I 3 g + G e I 3 g + 2 S 2 ( g ) .
After cooling to ambient temperature, the ampoules are opened and gaseous species present in the ampoule were allowed to evaporate.
In chemical vapor transport, the growth conditions such as temperature of the source, temperature gradient, concentration of the transport agent are of great importance for the growth of the crystals of interest. All the phases formed require analysis. The results of the growth experiments, in this sense the occurring phases, show how important a consideration of the gaseous phase is for the transport in a closed system. The main challenge here is to control the composition of the gas phase as well as to optimize the temperature field during growth.

Chemical characterization

Wavelength dispersive X-ray spectroscopy (WDX) was used to determine the composition of the phases present using an electron microprobe analysis system. In order to obtain reliable results from the WDX measurements, the microprobe system was calibrated using NIST elemental standards. High accuracy of the compositional parameters was achieved by averaging over 10 local measured points within one grain and averaging over more than 30 grains of the quaternary phase showing the same compositional values.
Additionally the composition was measured by X-ray fluorescence (XRF) using a Bruker M4 Tornado Micro-XRF spectrometer with Rh excitation beam and two detectors.

Structural characterization

X-ray diffraction. The grown crystals have been characterized by powder X-ray diffraction (XRD). X-ray powder diffraction data were recorded over a 2θ range of 10-140° with a step size of 0.01313° by means of a BRUKER D8 diffractometer using Cu Kα1,2 radiation with a wavelength of 1.540598 Å and 1.544426 Å, respectively. The lattice parameters of the material were determined by LeBail analysis of the diffraction pattern.
Multiple Edge Anomalous Diffraction (MEAD). For clarifying the cation distribution, anomalous X-ray powder diffraction data (AXRPD) of Cu☐GaGeS4 were collected at the KMC-2 Diffraction station at KMC-2 beamline, BESSY II, Berlin, Germany [14] and analyzed as described in the literature [15]. Scans of the intensity of the 101 Bragg peak for Multiple Edge Anomalous Diffraction (MEAD) analysis were collected at the Κ X-ray absorption edges of the elements Cu, Ga and Ge. Experimental absorption edges are at energies of 8987(1) eV, 10370(1) eV, 11104(1) eV. These values do not deviate significantly from the literature values of 8979 eV (Cu-Κ), 10367 eV (Ga-Κ) and 11103 eV (Ge-Κ) [16], with the notable exception of the Cu-Κ edge, which was found to be 8 eV higher than the reference value. Absorption correction for the experimental data was calculated based on the chemical composition of the sample as determined experimentally by WDX. Full powder diffraction sets in the 2θ-range 6 – 132° were collected at energies of 8048 eV (λ= 1.5406 Å, equivalent to Cu Kα1), and below the absorption edges at 8965 eV, 10353 eV, and 11089 eV.

Optical characterization

Diffuse Reflectance Spectroscopy (DRS) measurements were carried out in air at room temperature in a spectrophotometer equipped with an integrating sphere (Perkin Elmer UV/Vis-spectrometer Lambda 750S). The wavelength range of the measurement was adjusted to 800 – 1800 nm with a step size of 1 nm. Tauc plots were obtained by plotting (F(R)*hν)2 versus the photon energy [17]. The linear part of the curve was extrapolated to the baseline, and the optical band gap was extracted from the value of intersection.

3. Results and Discussion

Crystal growth

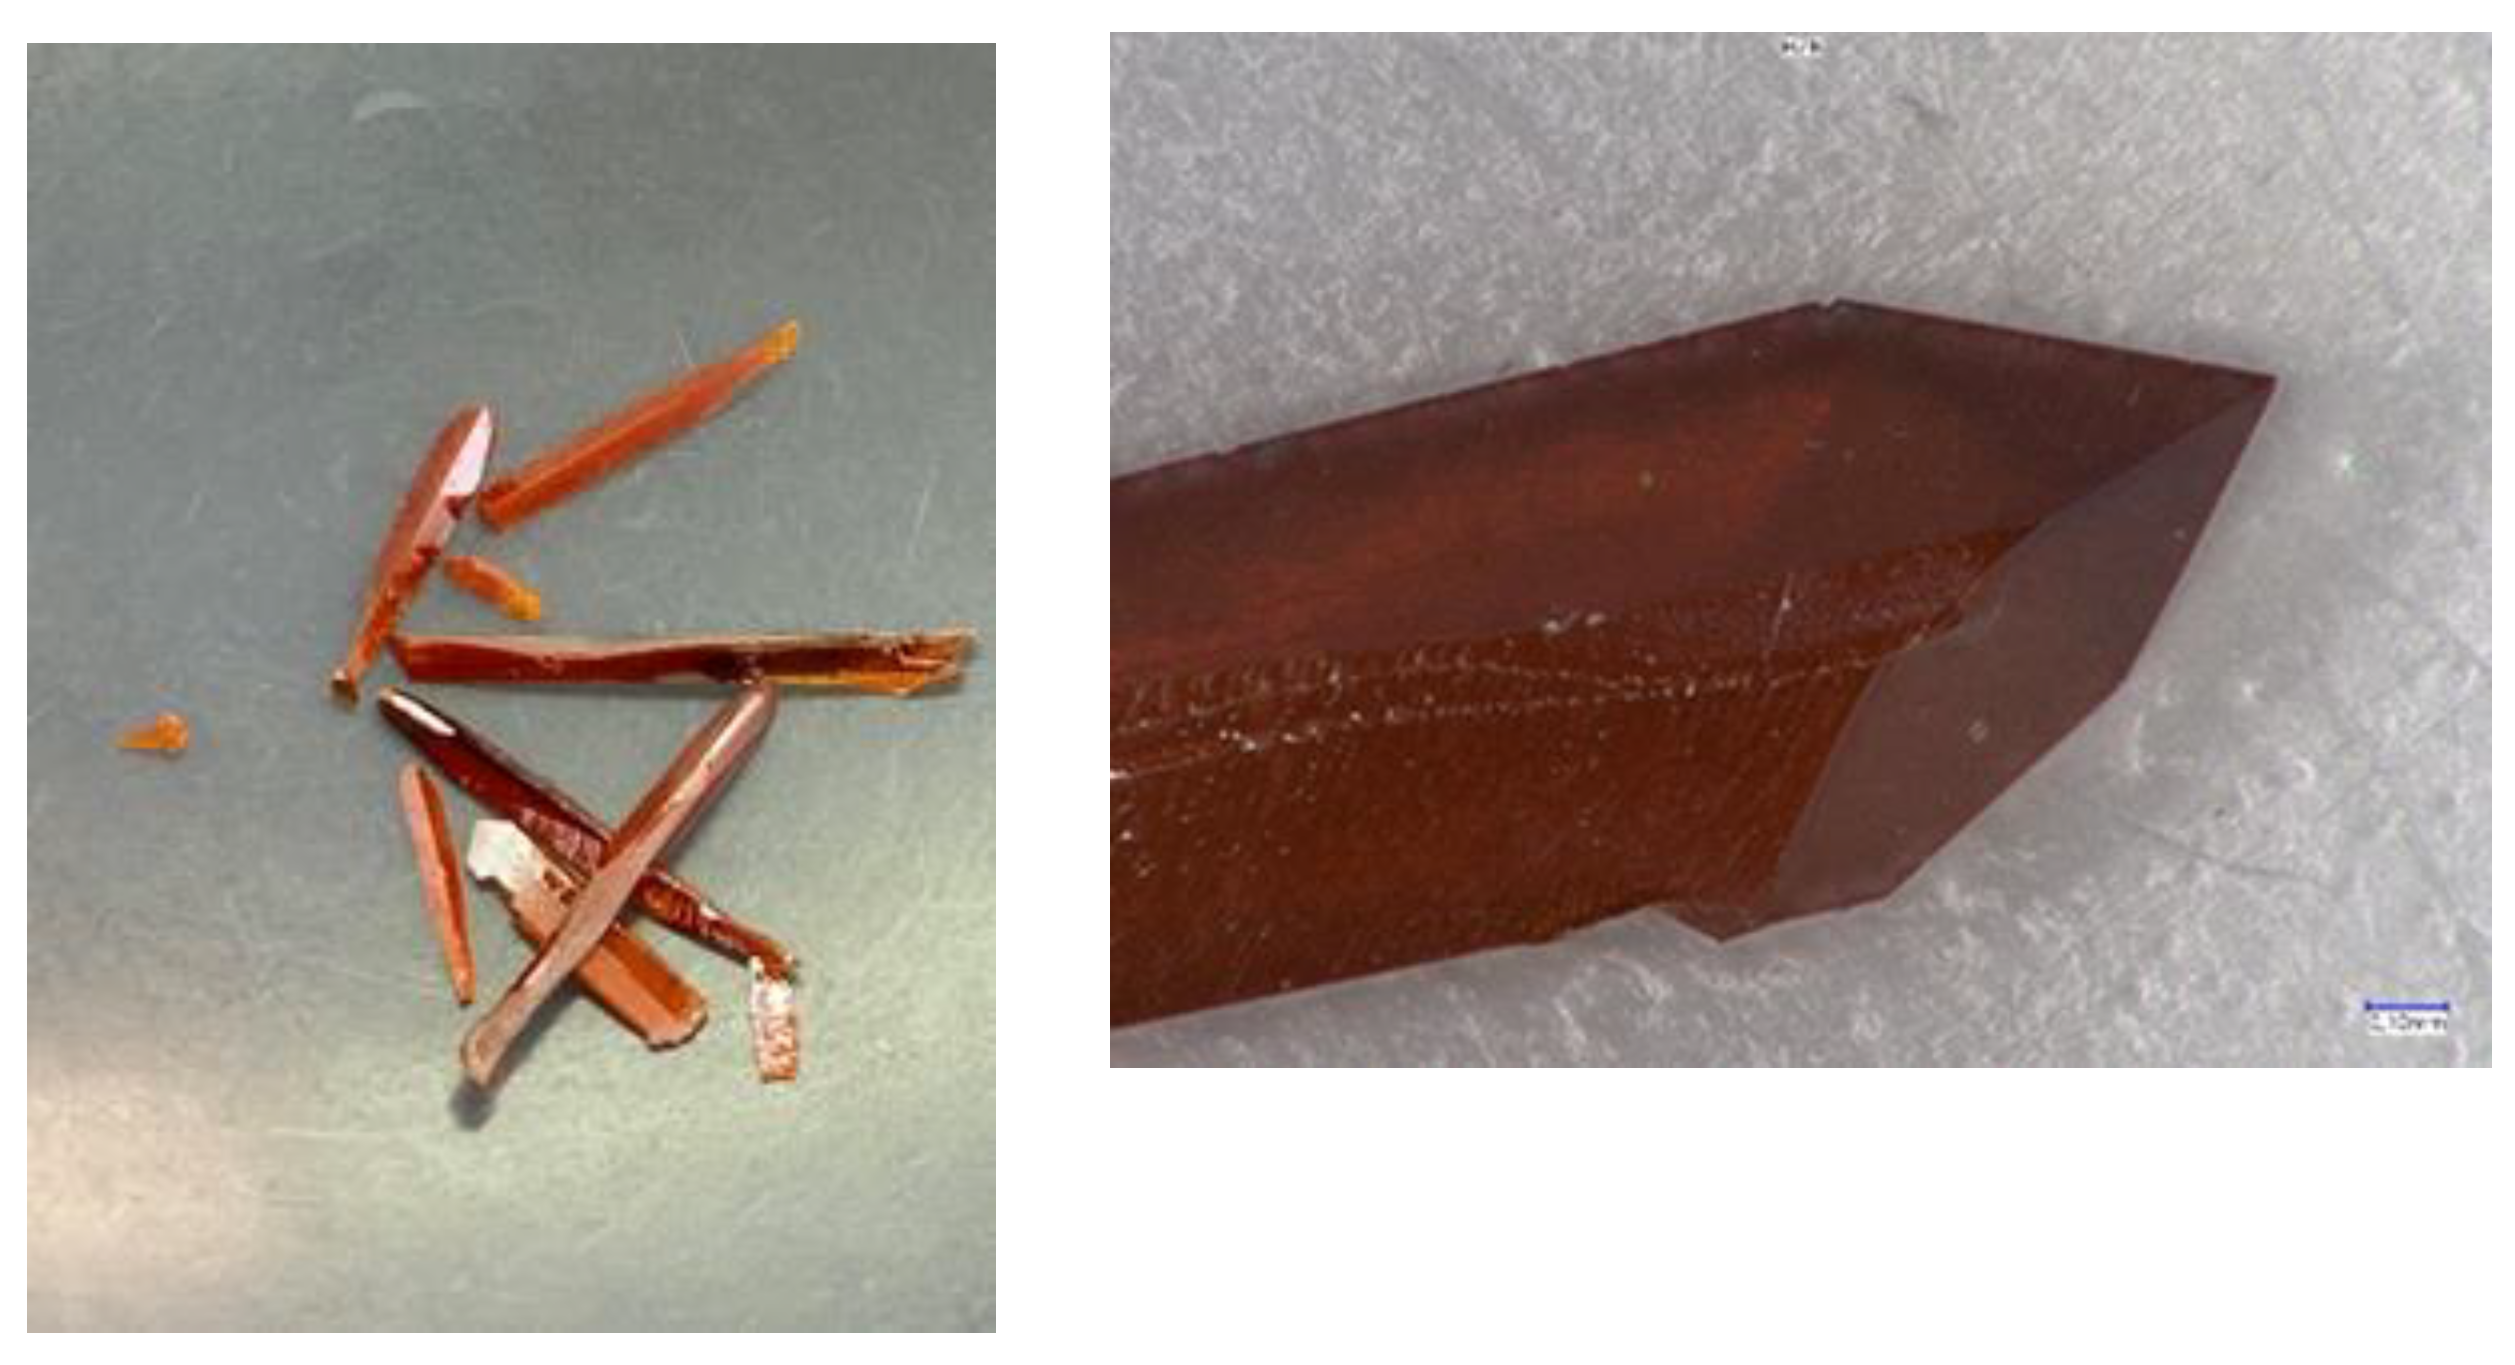
In the CVT growth experiments, single crystals of Cu☐GaGeS4 up to 10 mm in length were obtained, as shown in Figure 3. The obtained crystalline material has a dark red orange color. In the growth experiments, in addition to the transparent red-orange Cu☐GaGeS4 crystals, other phases also appear, such as GeS2 and GaI3.

Chemical composition and off-stoichiometry relations

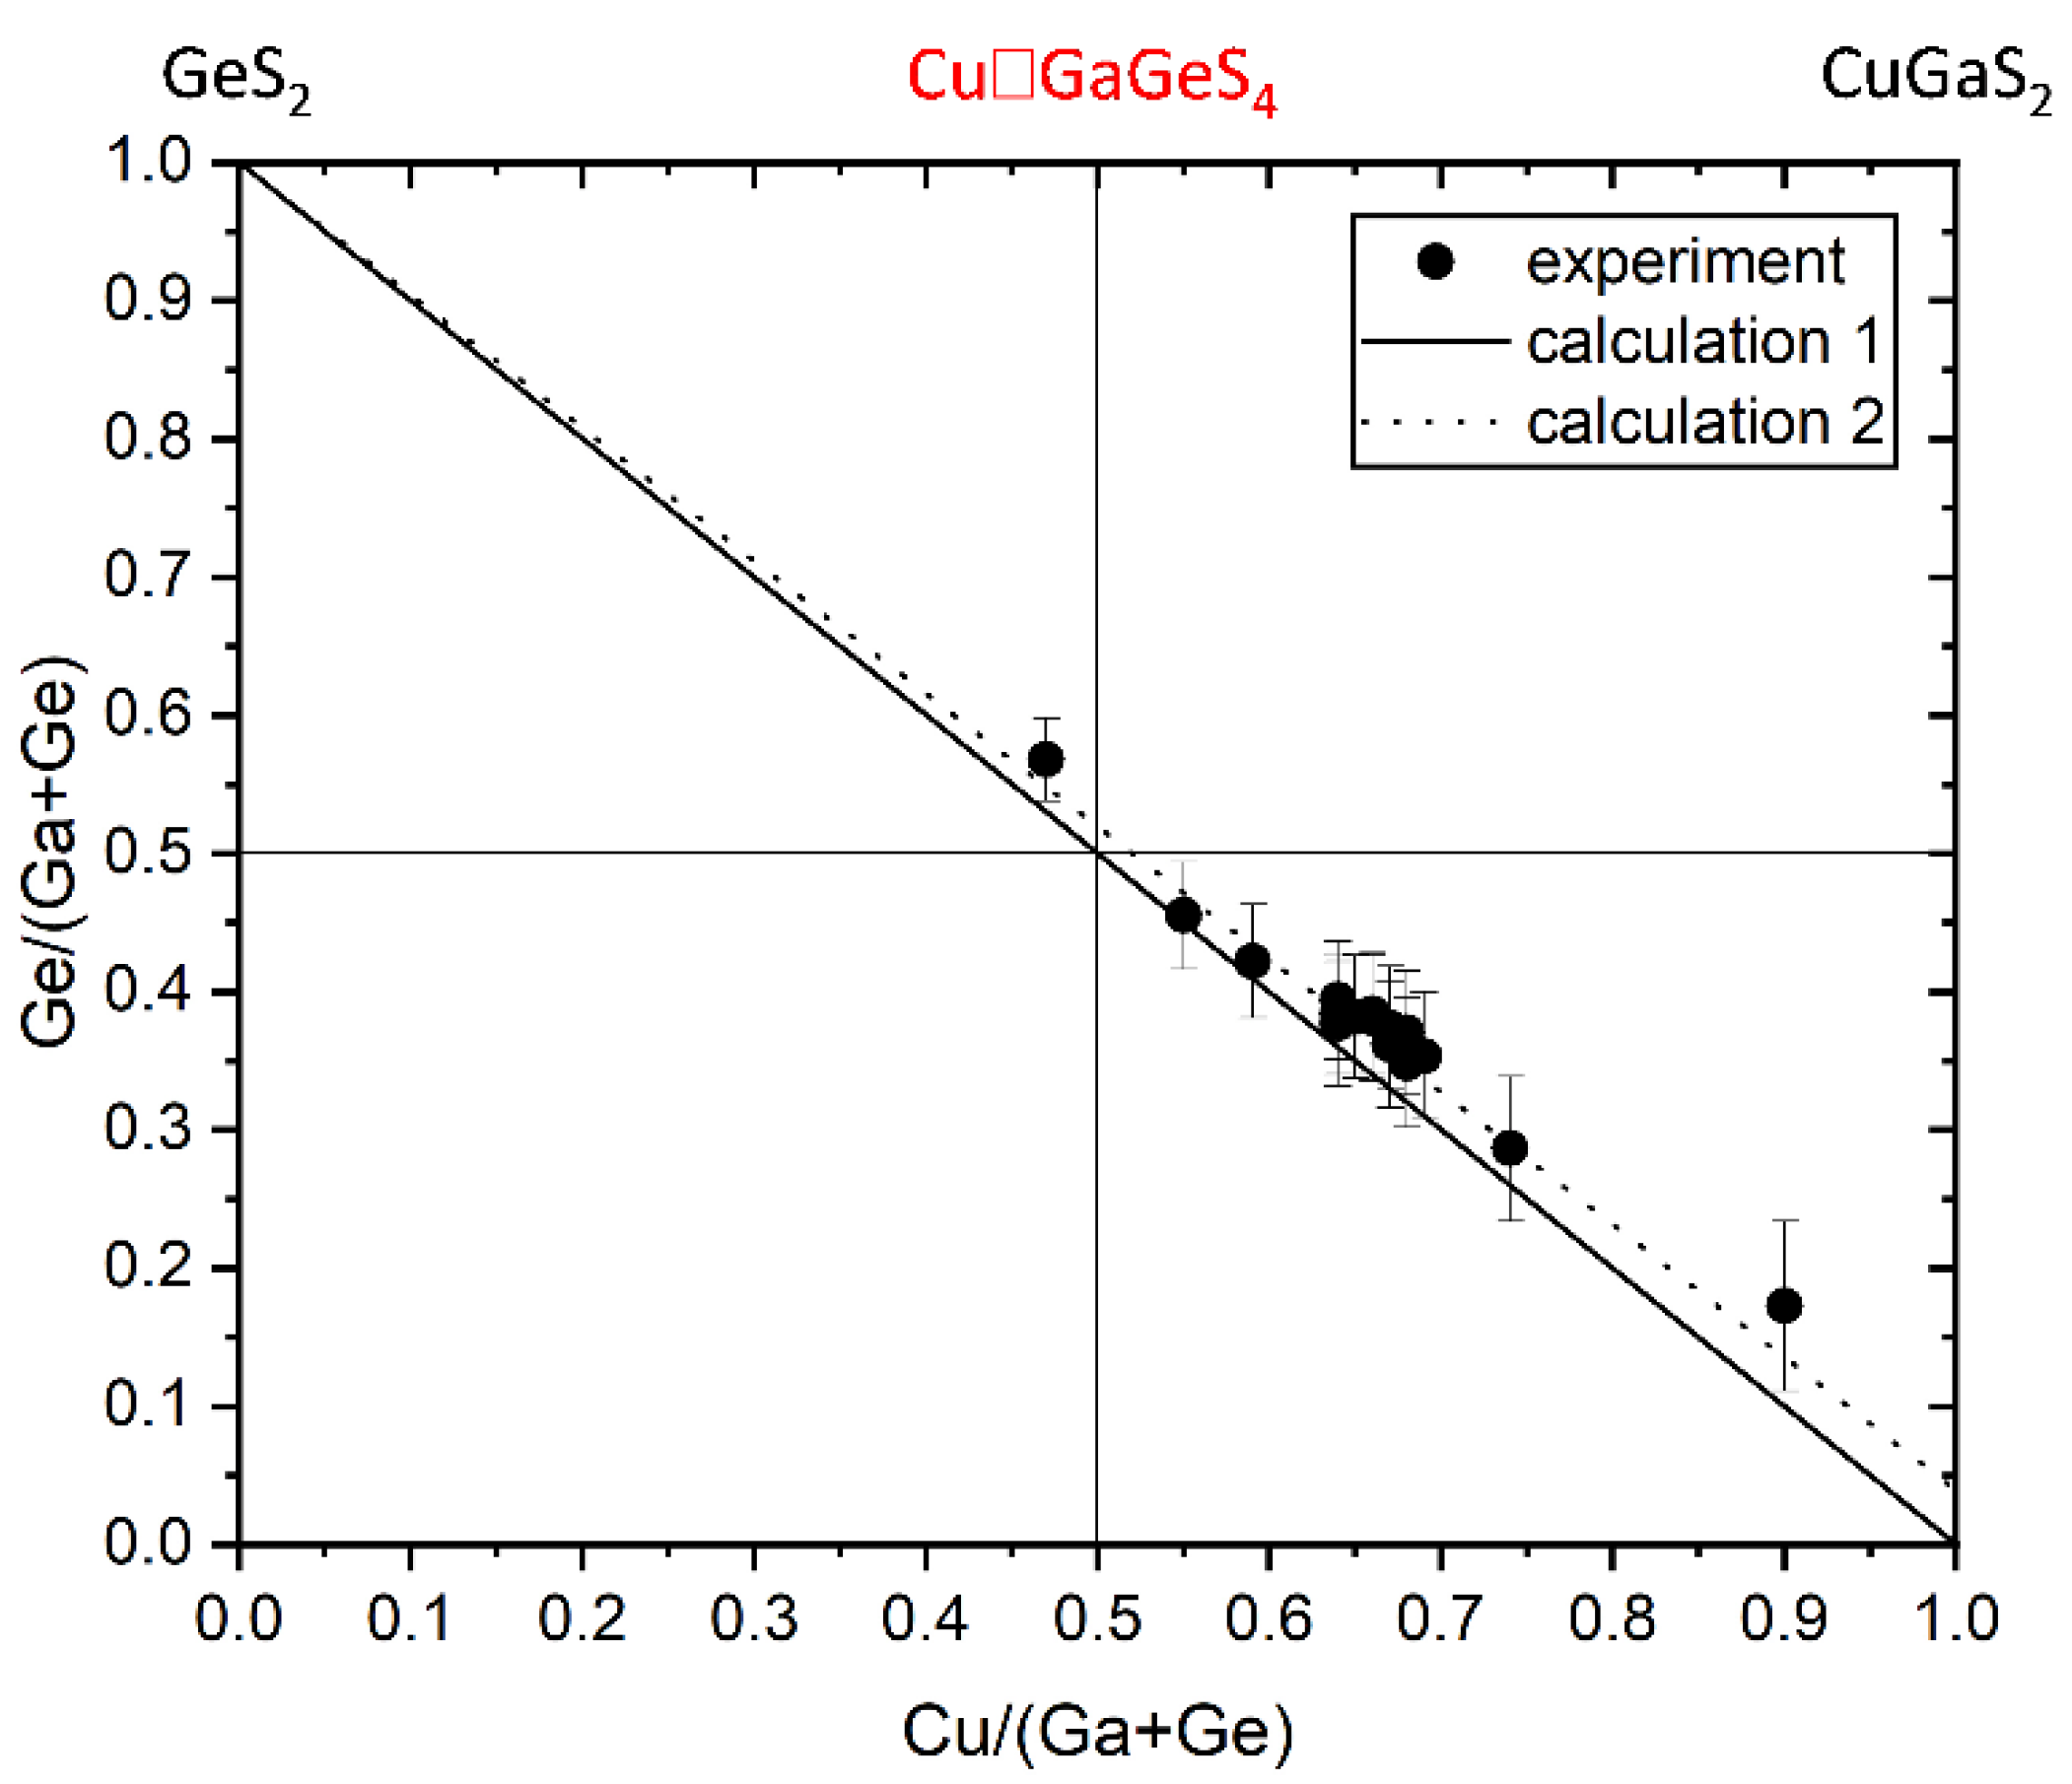
Aiming for chemical compositions according to the defect adamantine, chemical analysis of the grown crystals by X-ray fluorescence (XRF) has revealed, that the crystals show Cu/(Ga+Ge) ratios between 0.45 and 0.9 as well as Ge/(Ga+Ge) ratios between 0.15 and 0.6 (see Table 2). Thus, the single crystals show a quite strong deviation from the stoichiometric composition which is according to Cu/(Ga+Ge) = Ge/(Ga+Ge) = 0.5. Therefore the defect adamantine Cu☐GaGeS4 can be seen as a compound formed within the solid solution between CuGaS2 and GeS2 which can be described by (CuGaS2)1-x(GeS2)x (see Figure 4). The general formula Cu2(1-x)2(1-x)Ga2(1-x)Ge2xS4 can be applied to describe the off-stoichiometric composition of the material, x = 0.5 results in the stoichiometric composition Cu☐GaGeS4.

Crystal structure of Cu2(1-x)2(1-x)Ga2(1-x)Ge2xS4 defect adamantines

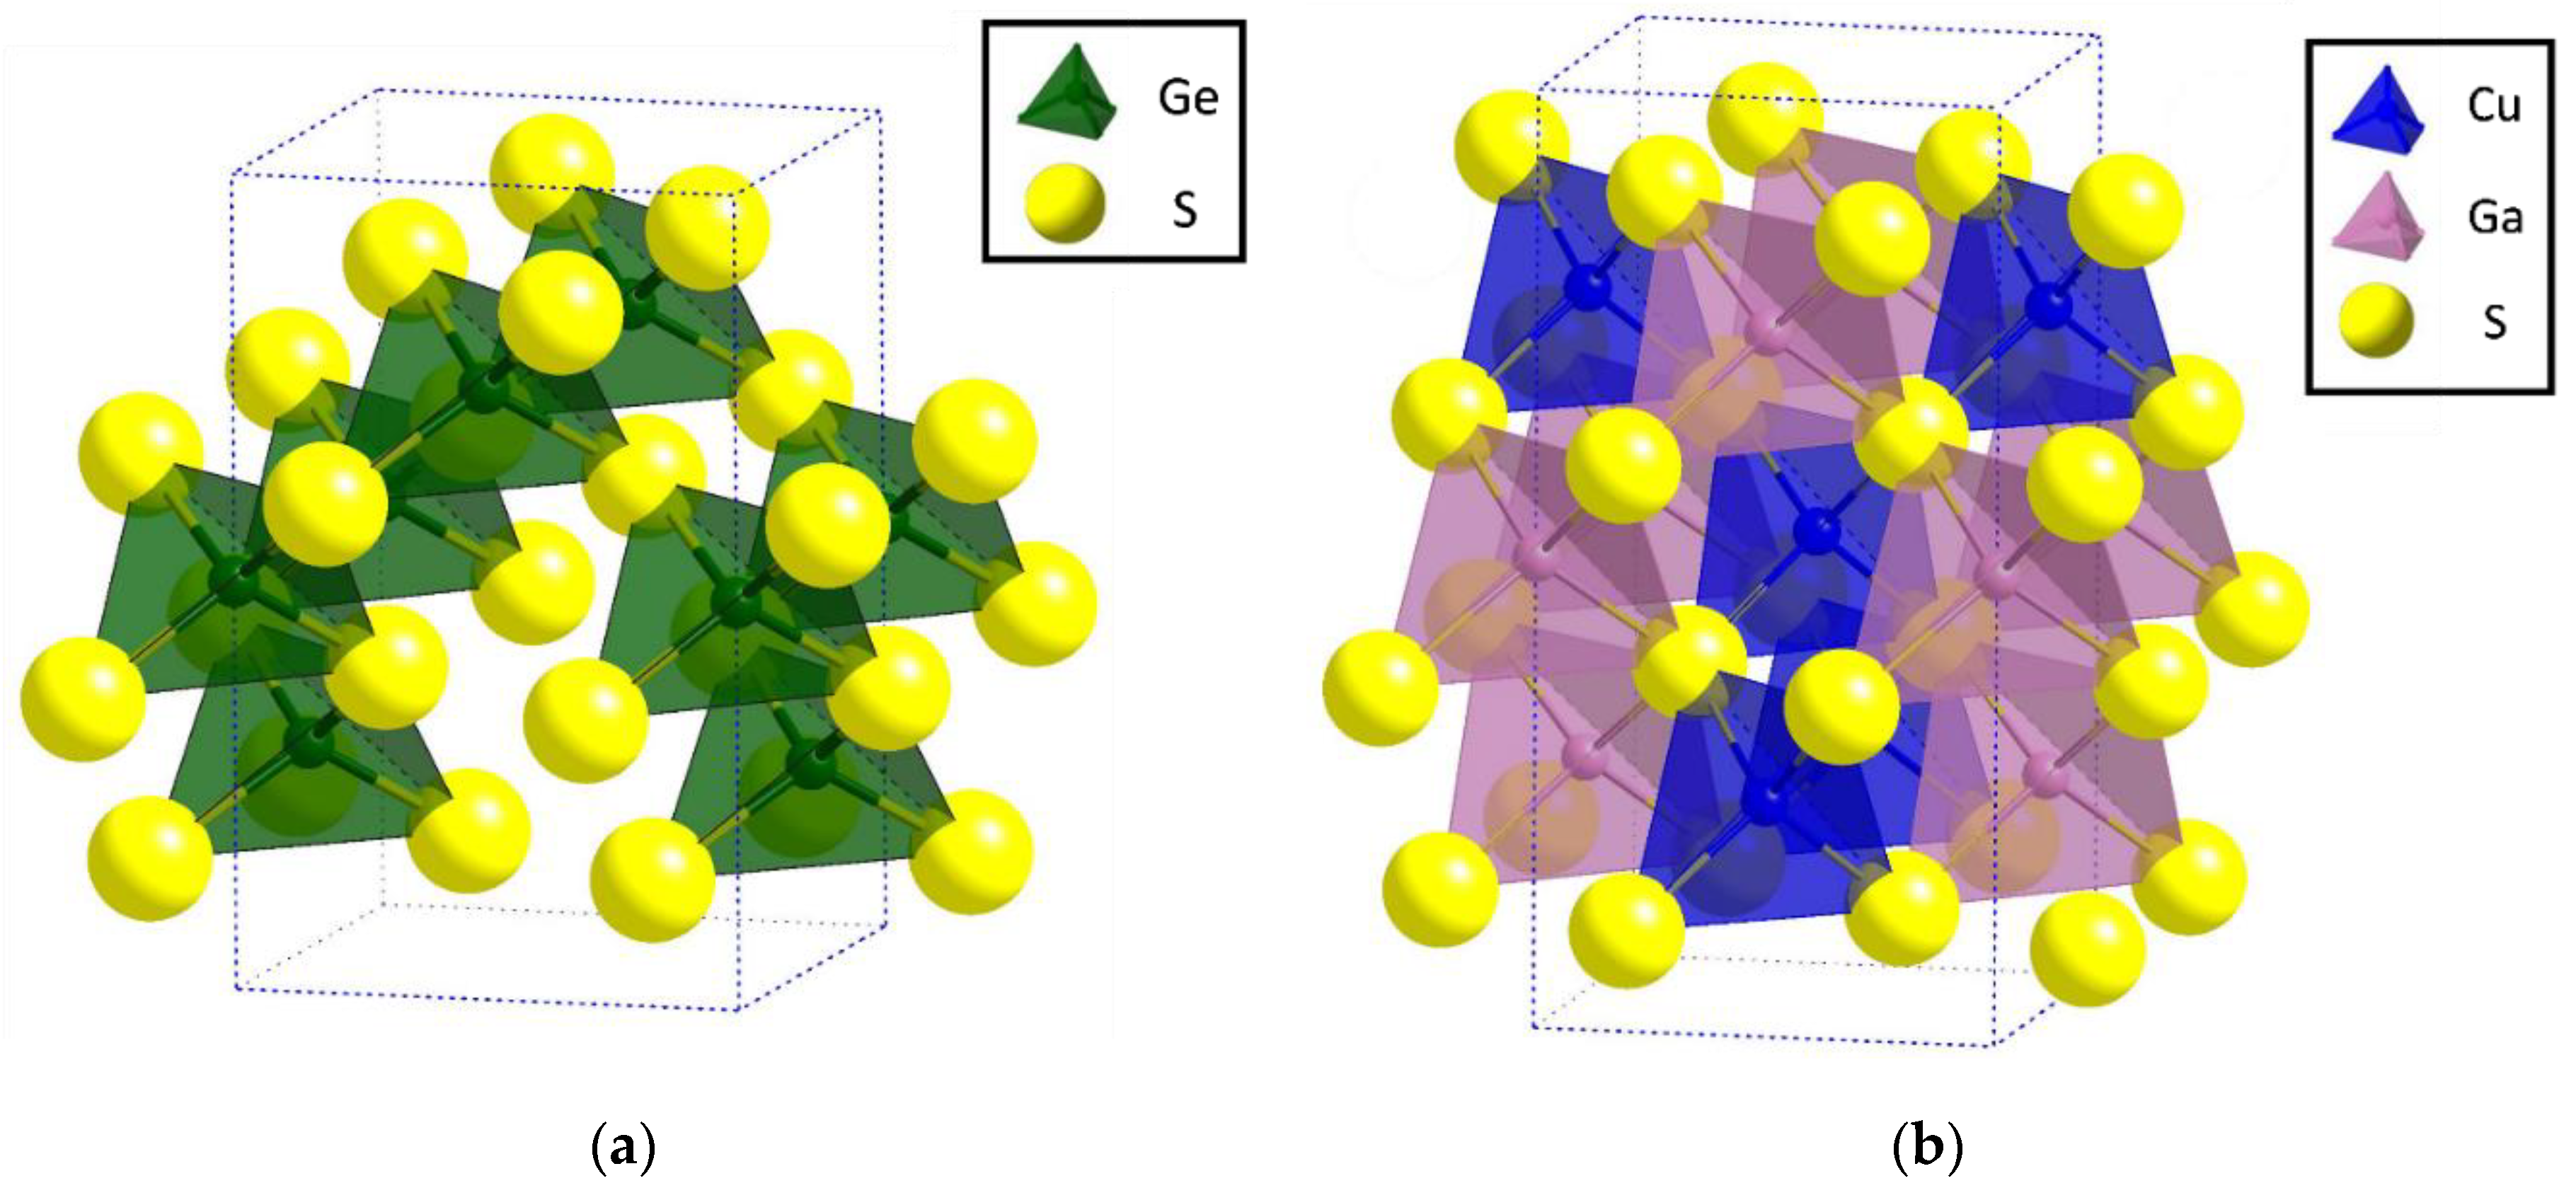
The crystal structure of the end members CuGaS2 and GeS2 of the (CuGaS2)1-x(GeS2)x series are both based on a corner-sharing network of tetrahedra (see Figure 5). CuGaS2 crystallizes in the chalcopyrite type structure (space group I 4 ¯ 2 d ) formed by corner sharing CuS4, GaS4 and GeS4 tetrahedra [18]. For the network of corner sharing GeS4 tetrahedra forming the crystal structure of GeS2, a tetragonal (space group I 4 ¯ 2 d , an orthorhombic (space group Fdd2) as well as a monoclinic (space group Pc) modification are reported [19,20]. The difference between these modifications is the degree of the distortion of the GeS4 tetrahedra. The (CuGaS2)1-x(GeS2)x series is realized by the substitution C u + + G a 3 + G e 4 + + ☐, thus with increasing Ge-content in CuGaS2 the fraction of vacancies (☐) and thus the fraction of ☐S4 tetrahedra is increasing (see Figure 6).
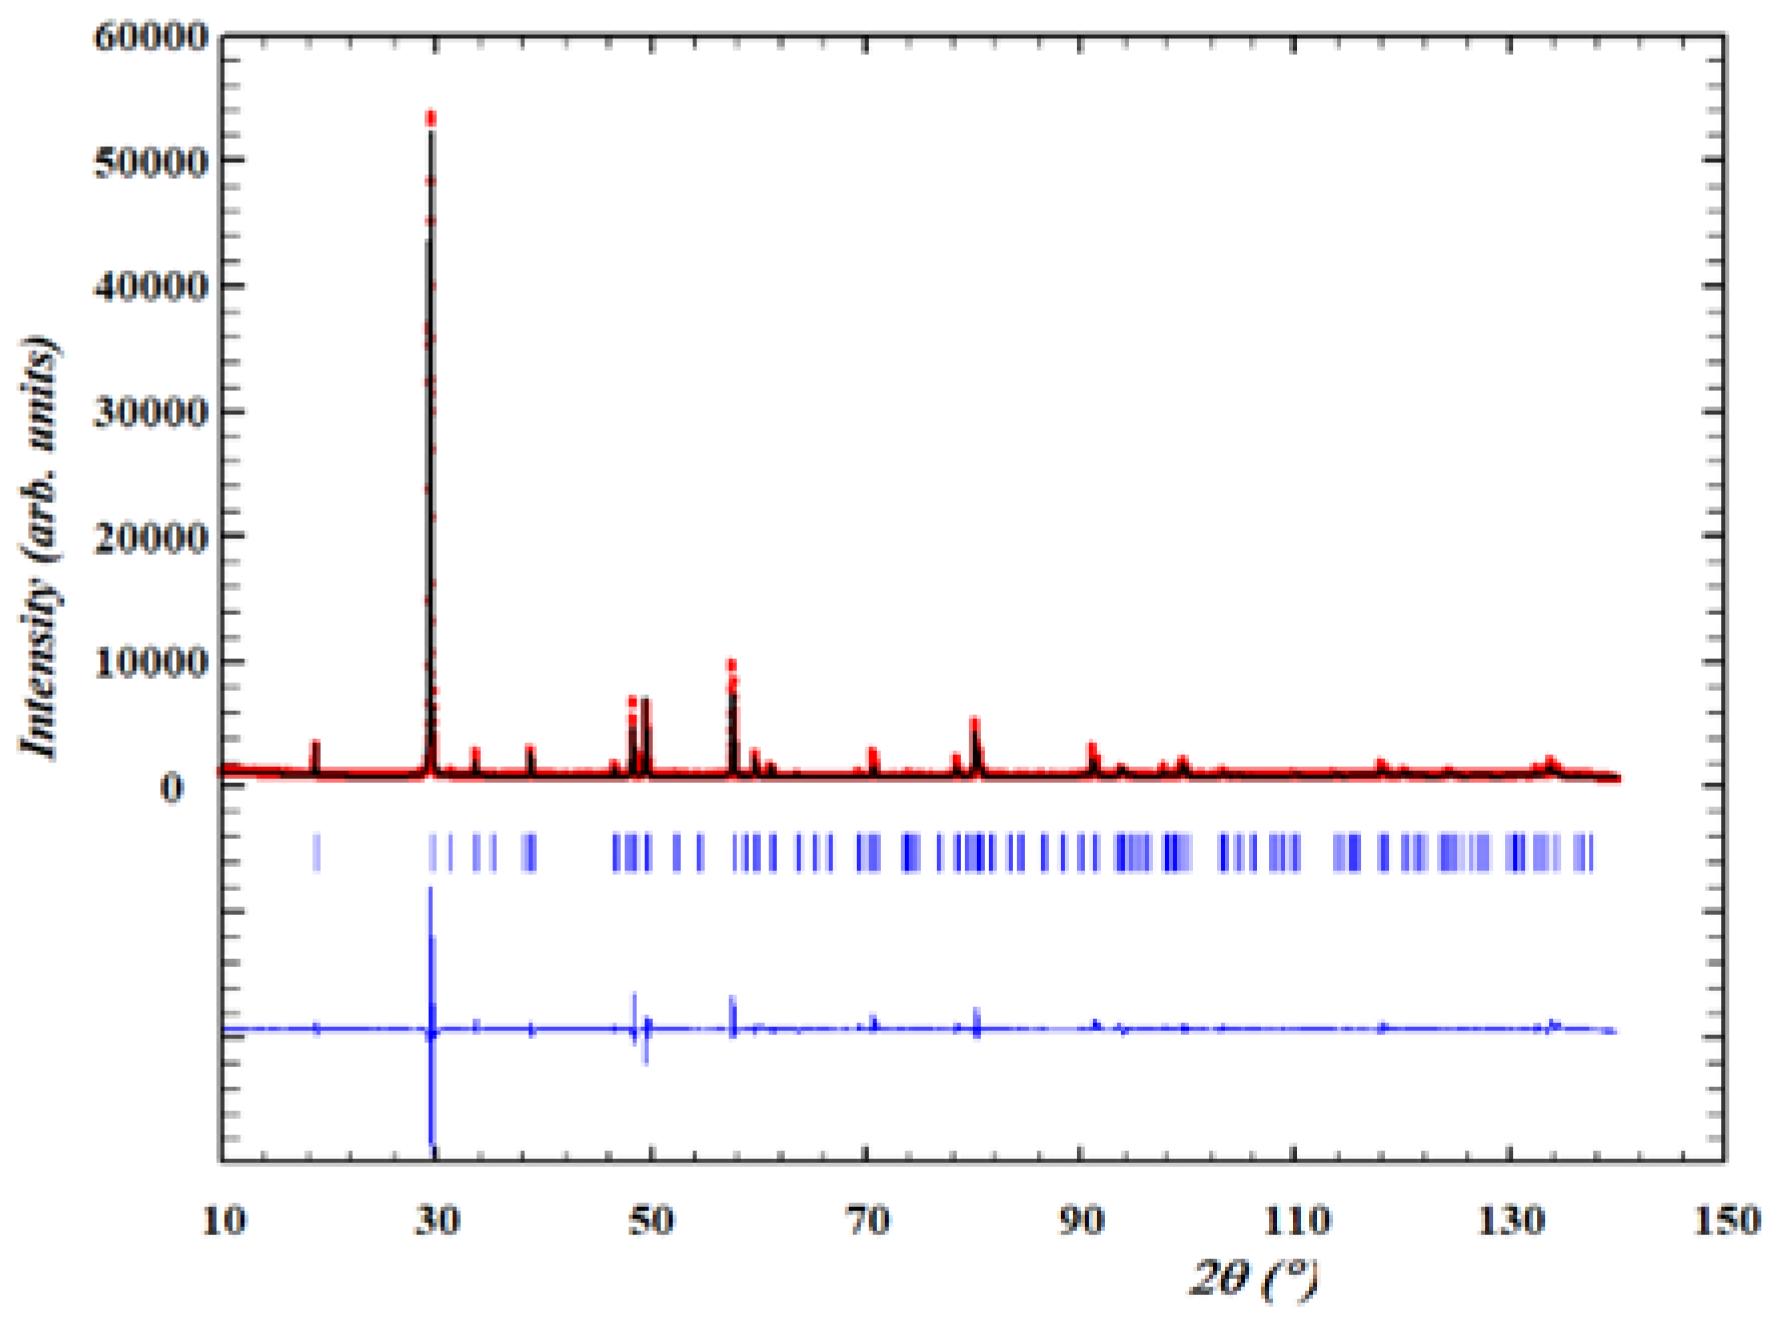
The X-ray diffraction data obtained on ground crystals have been analysed by the LeBail using the chalcopyrite-type structure as structure model. An exemplarily X-ray diffractogram and the according LeBail analysis for a Cu☐GaGeS4 single crystal (prepared as a powder) is presented in Figure 7.
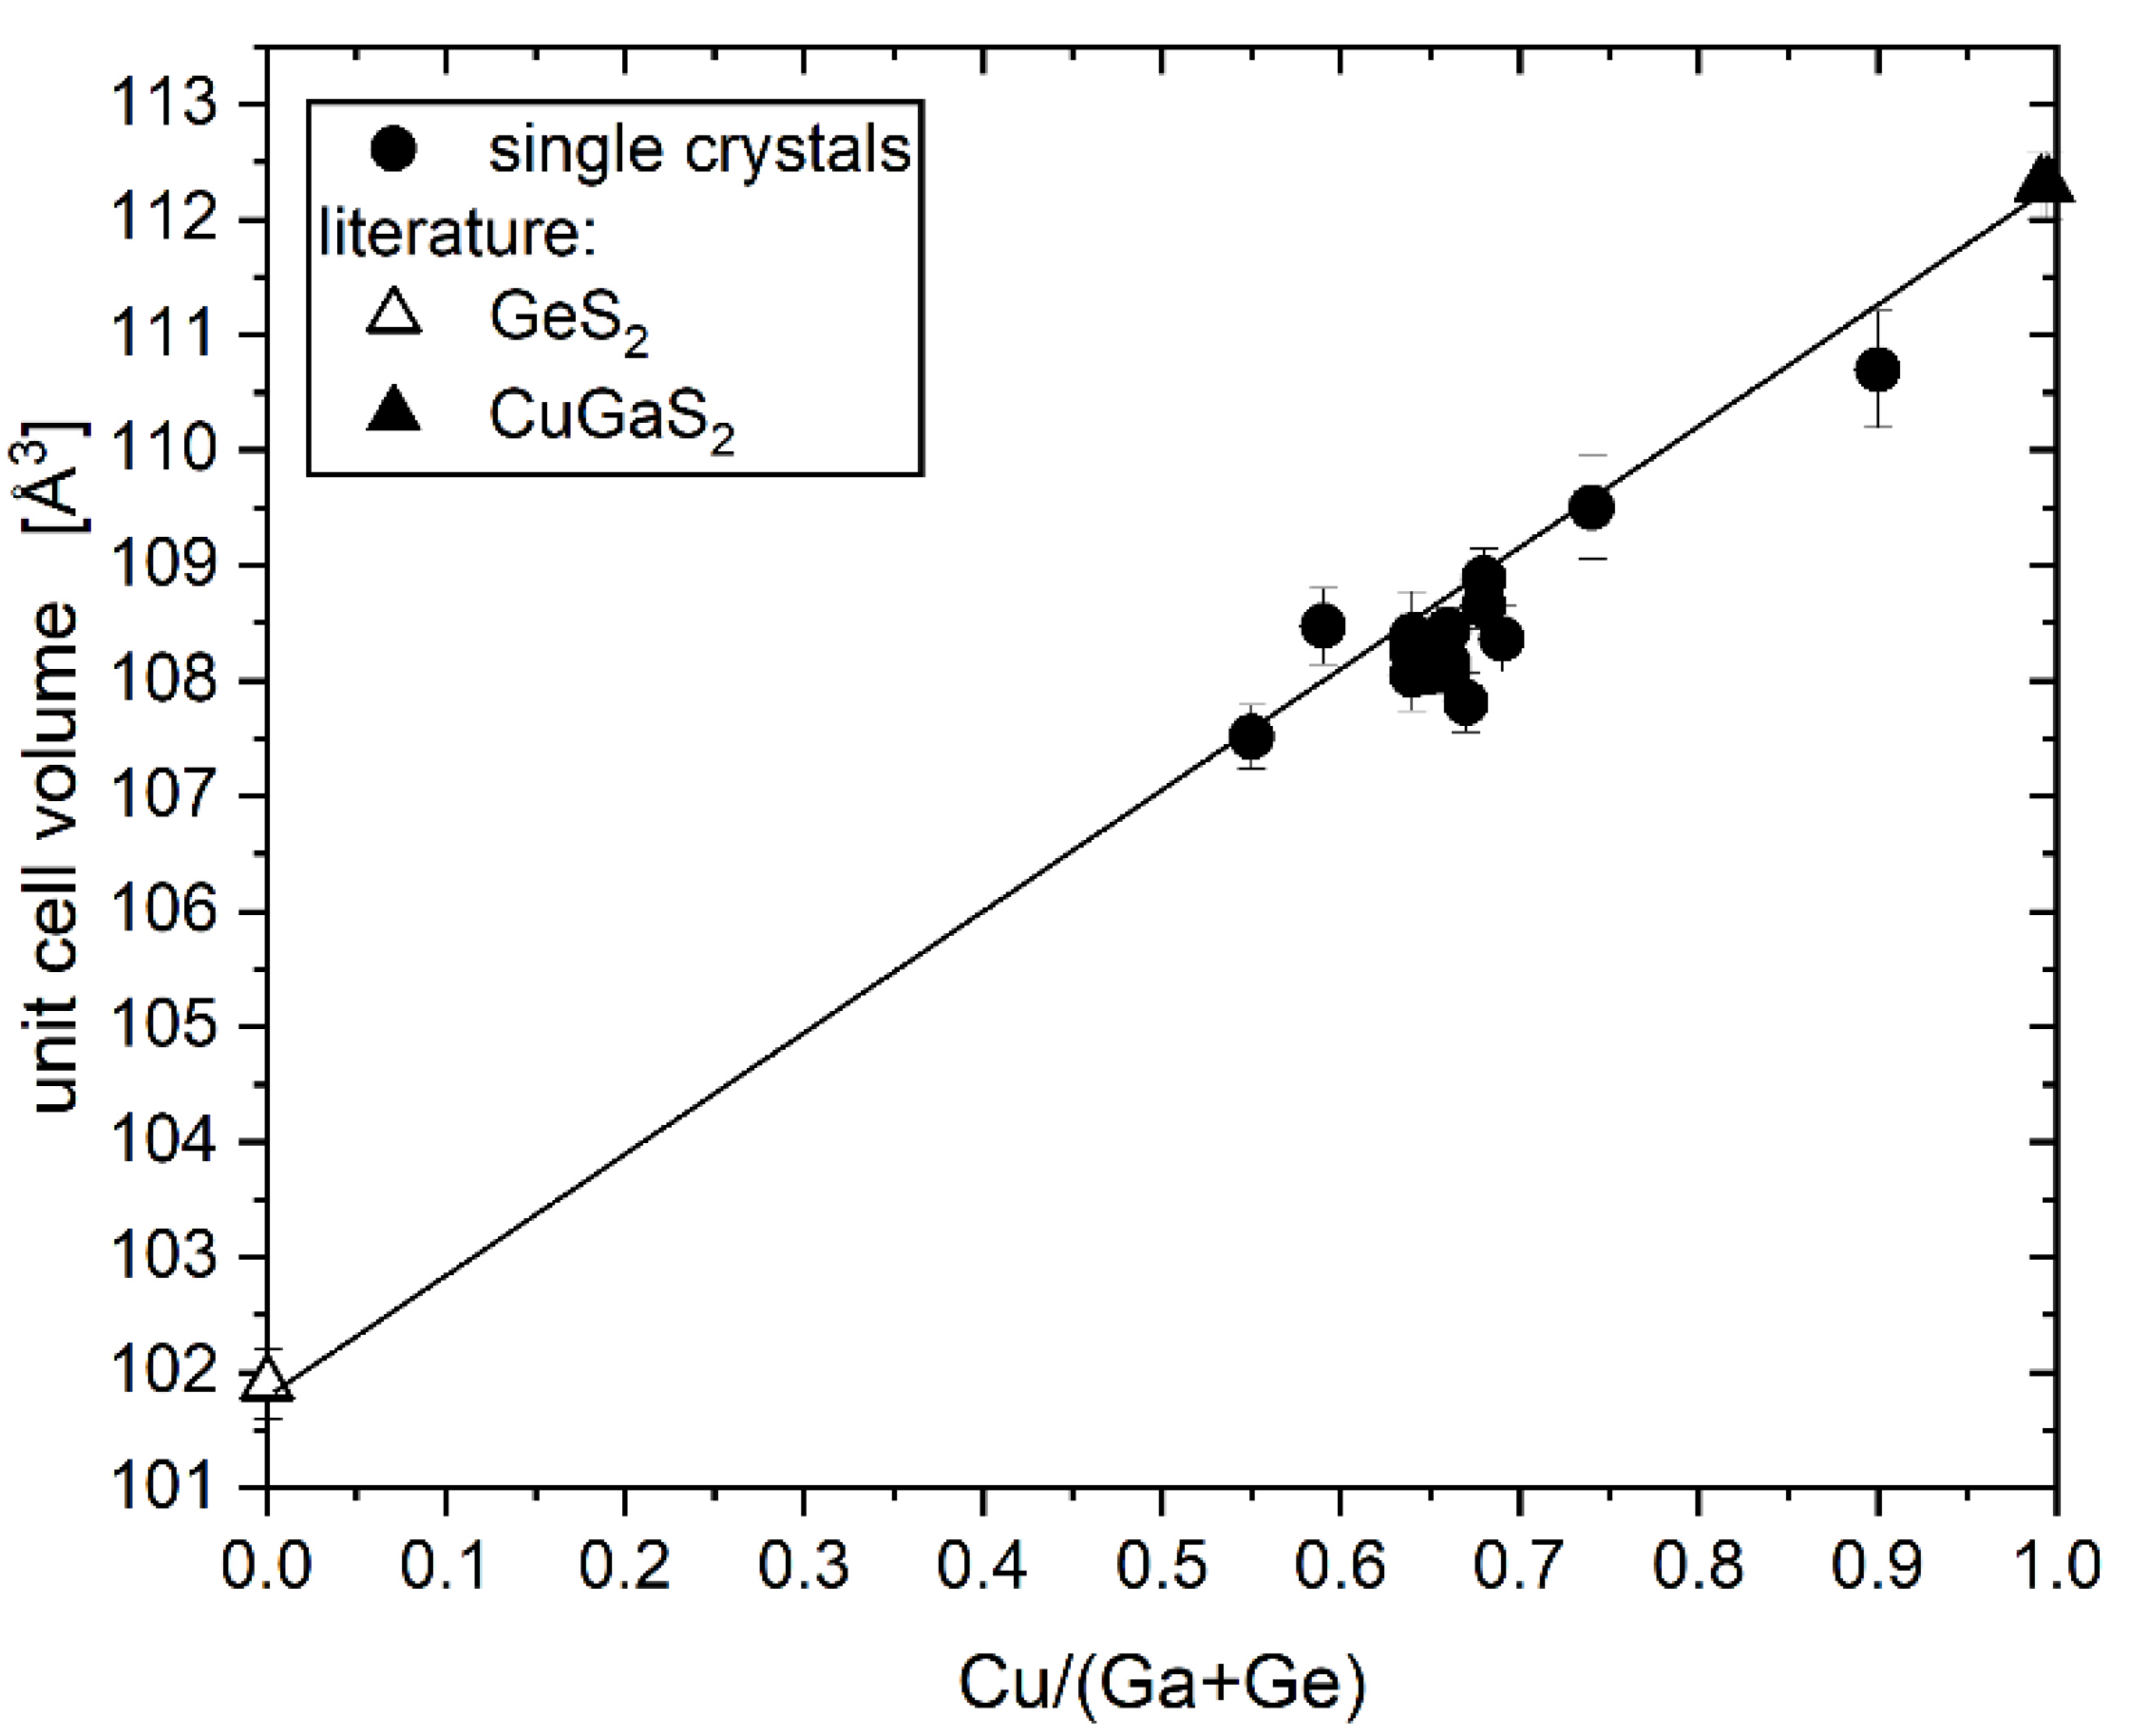
The tetragonal lattice parameters a and c of the different Cu2(1–x)2(1-x)Ga2(1-x)Ge2xS4 crystals have been determined by the LeBail analysis (see Table 2). For comparison, lattice constants of CuGaS2 and GeS2 from literature [18,19] are given in Table 2 as well. The unit cell volume correlates linearly with both, the Cu/(Ga+Ge) (see Figure 8) and Ge/(Ga+Ge) ratio. With increasing substitution C u + + G a 3 + G e 4 + +   ☐ in CuGaS2 the fraction of vacancies increases. In addition, the radius of the incorporated Ge4+ is smaller than the radius of Cu+ and Ga3+ (rCu1+ = 0.60 Å, rGa3+= 0.47 Å, rGe4+= 0.39 Å [21]). Thus, the unit cell volume decreases with increasing substitution.
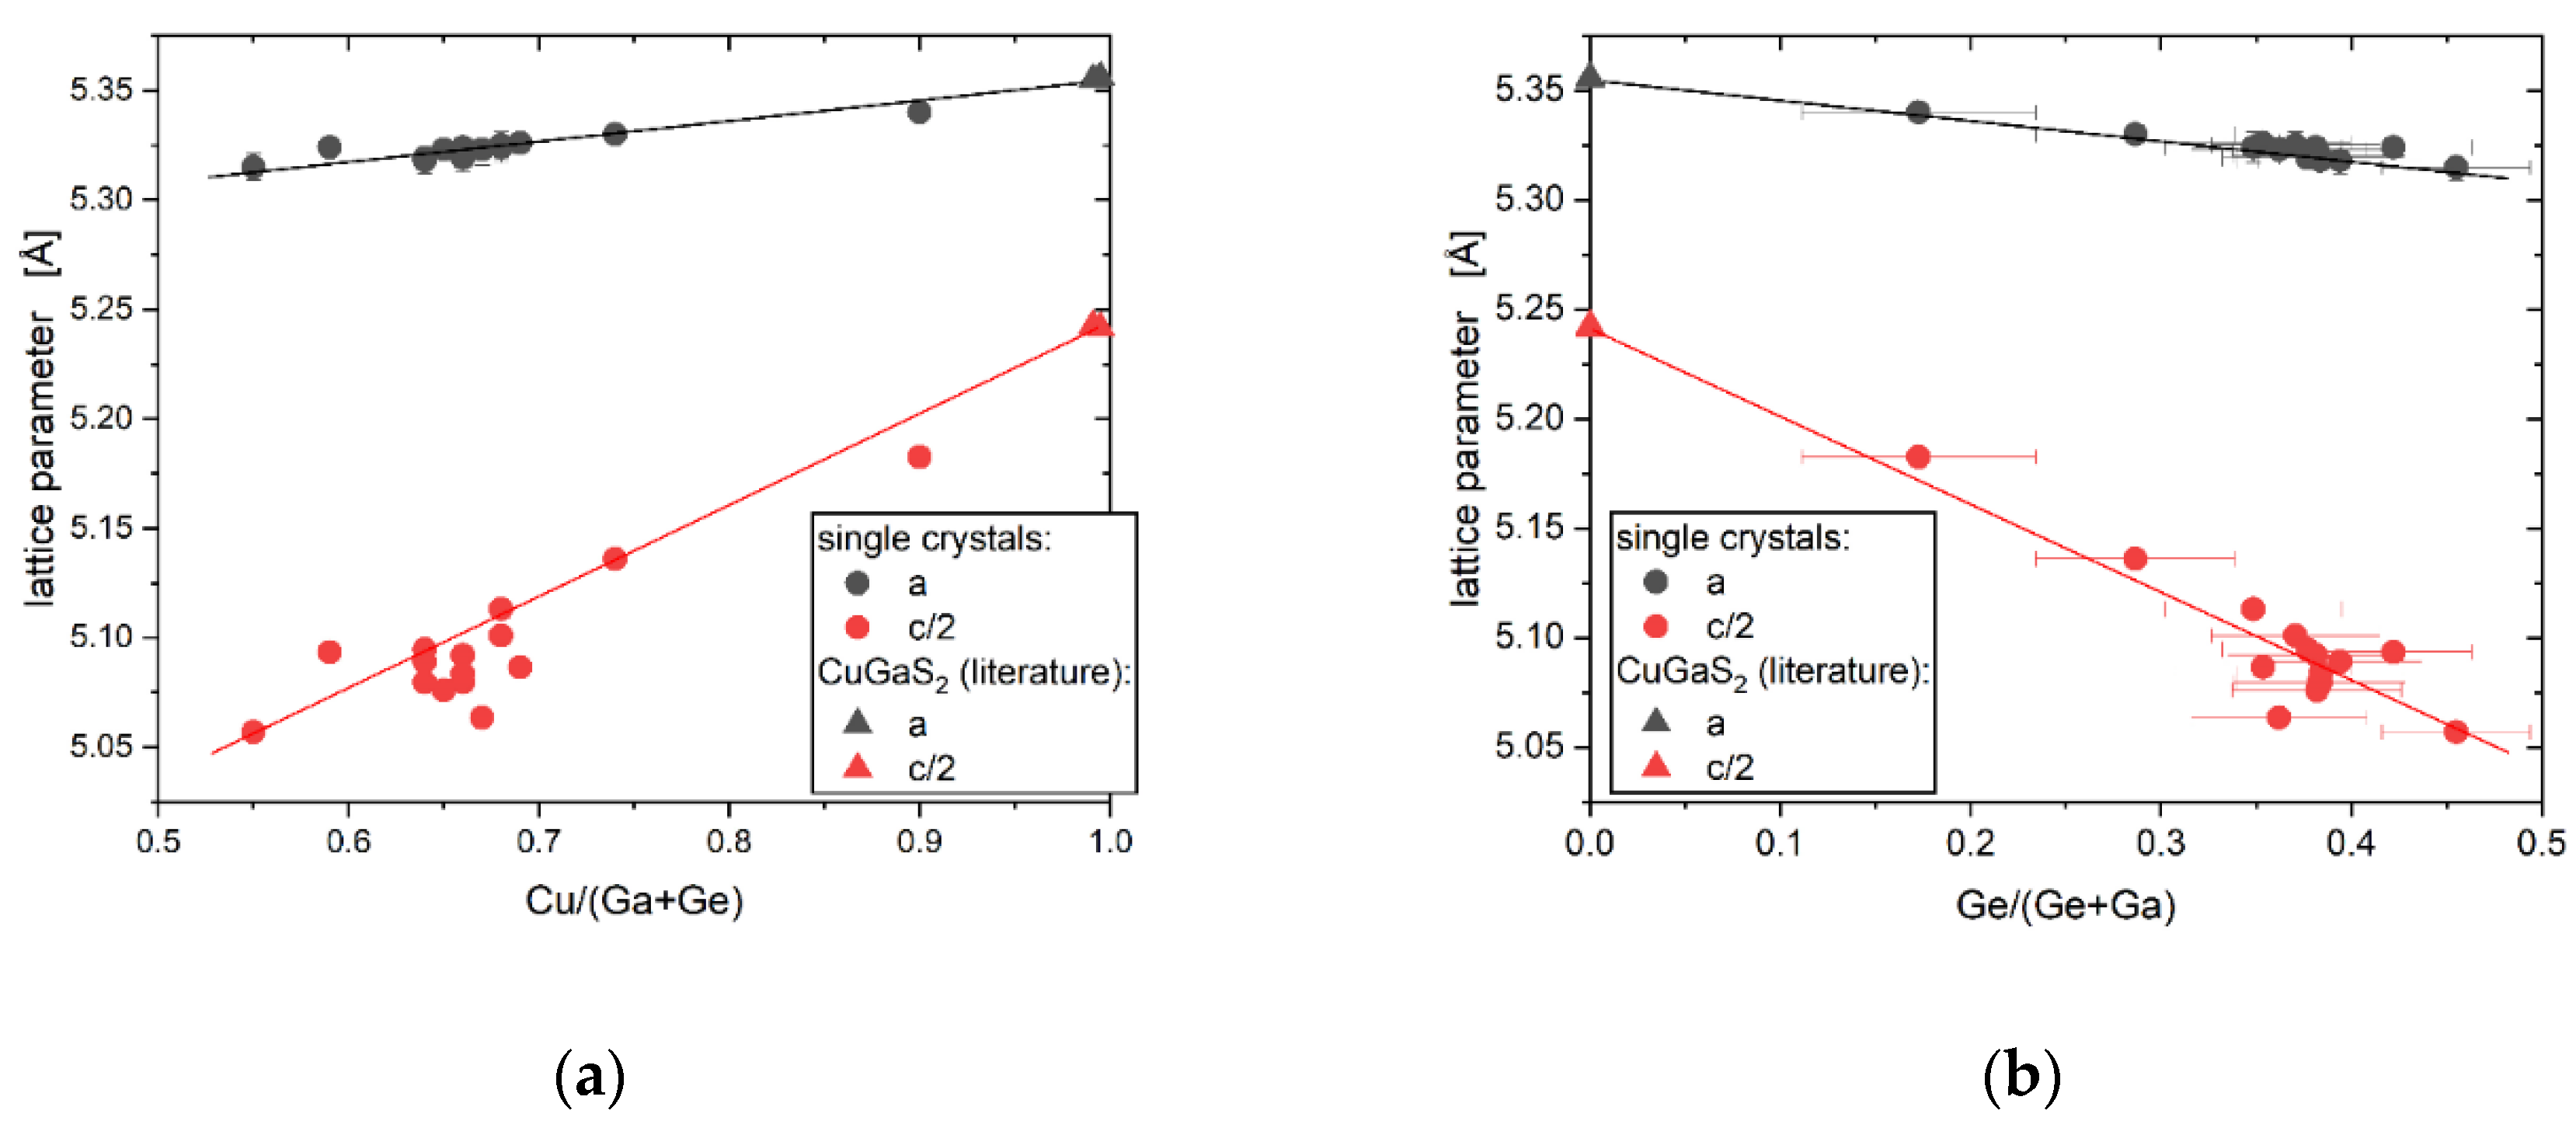
With increasing substitution C u + + G a 3 + G e 4 + +   ☐ in CuGaS2 the lattice parameters a and c change in an anisotropic fashion, i.e. the slope of their dependence on the cation ratios Cu/(Ga+Ge) and Ge/(Ge+Ga) is different (see Figure 9).
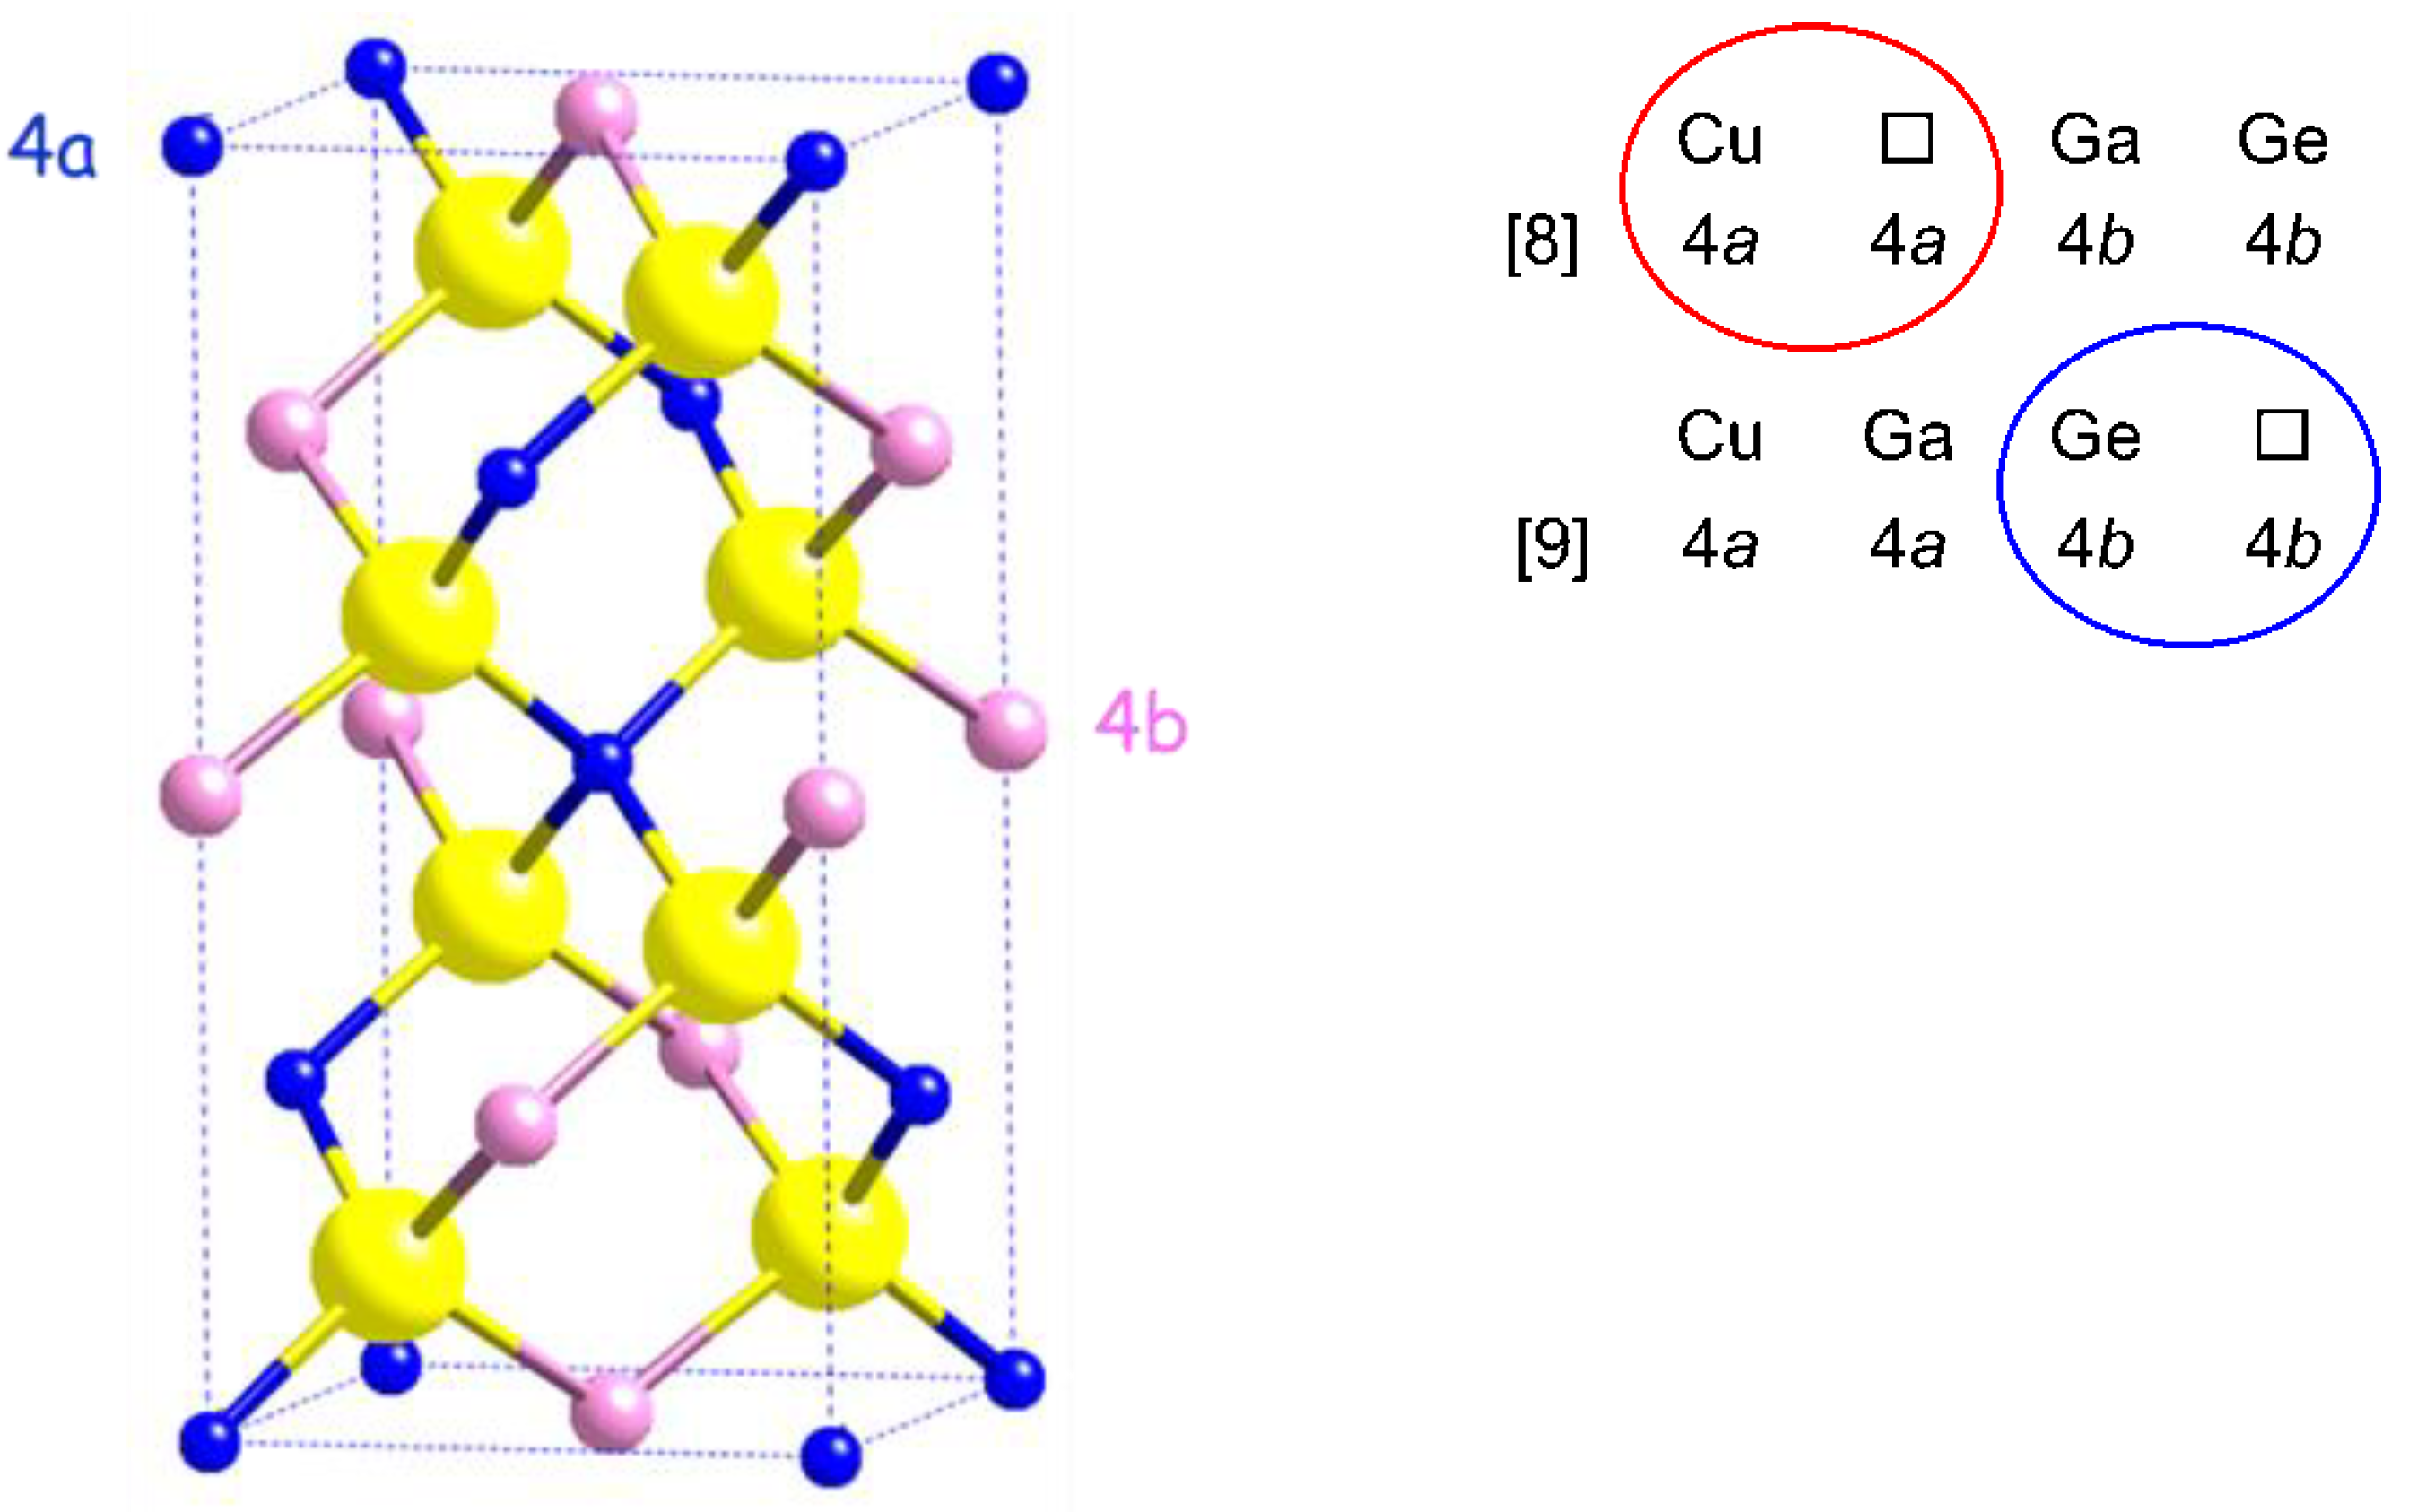
The chalcopyrite-type structure (space group I 4 ¯ 2 d ) has two different cation sites, the Wyckoff positions 4a and 4b (Figure 10), whereas the mono-valent cation occupies the 4a position and the three-valent cation is on the 4b position. As Cu+, Ga3+, and Ge4+ have the same number of electrons, their X-ray atomic form factors are very similar. Thus, the determination of the distribution of cations on the two structural sites of the chalcopyrite-type structure by conventional X-ray diffraction is not possible. Published results on the crystal structure of Cu☐GaGeSe4, which are based on investigations by X-ray diffraction, assume either Cu and vacancies on the 4a and Ga and Ge on the 4b position [8] or Cu and Ga on the 4a and Ge and vacancies on the 4b sites [9] (see Figure 10). However, it would also be possible for Cu and Ge to occupy 4b, as well as various degrees of cation disorder.
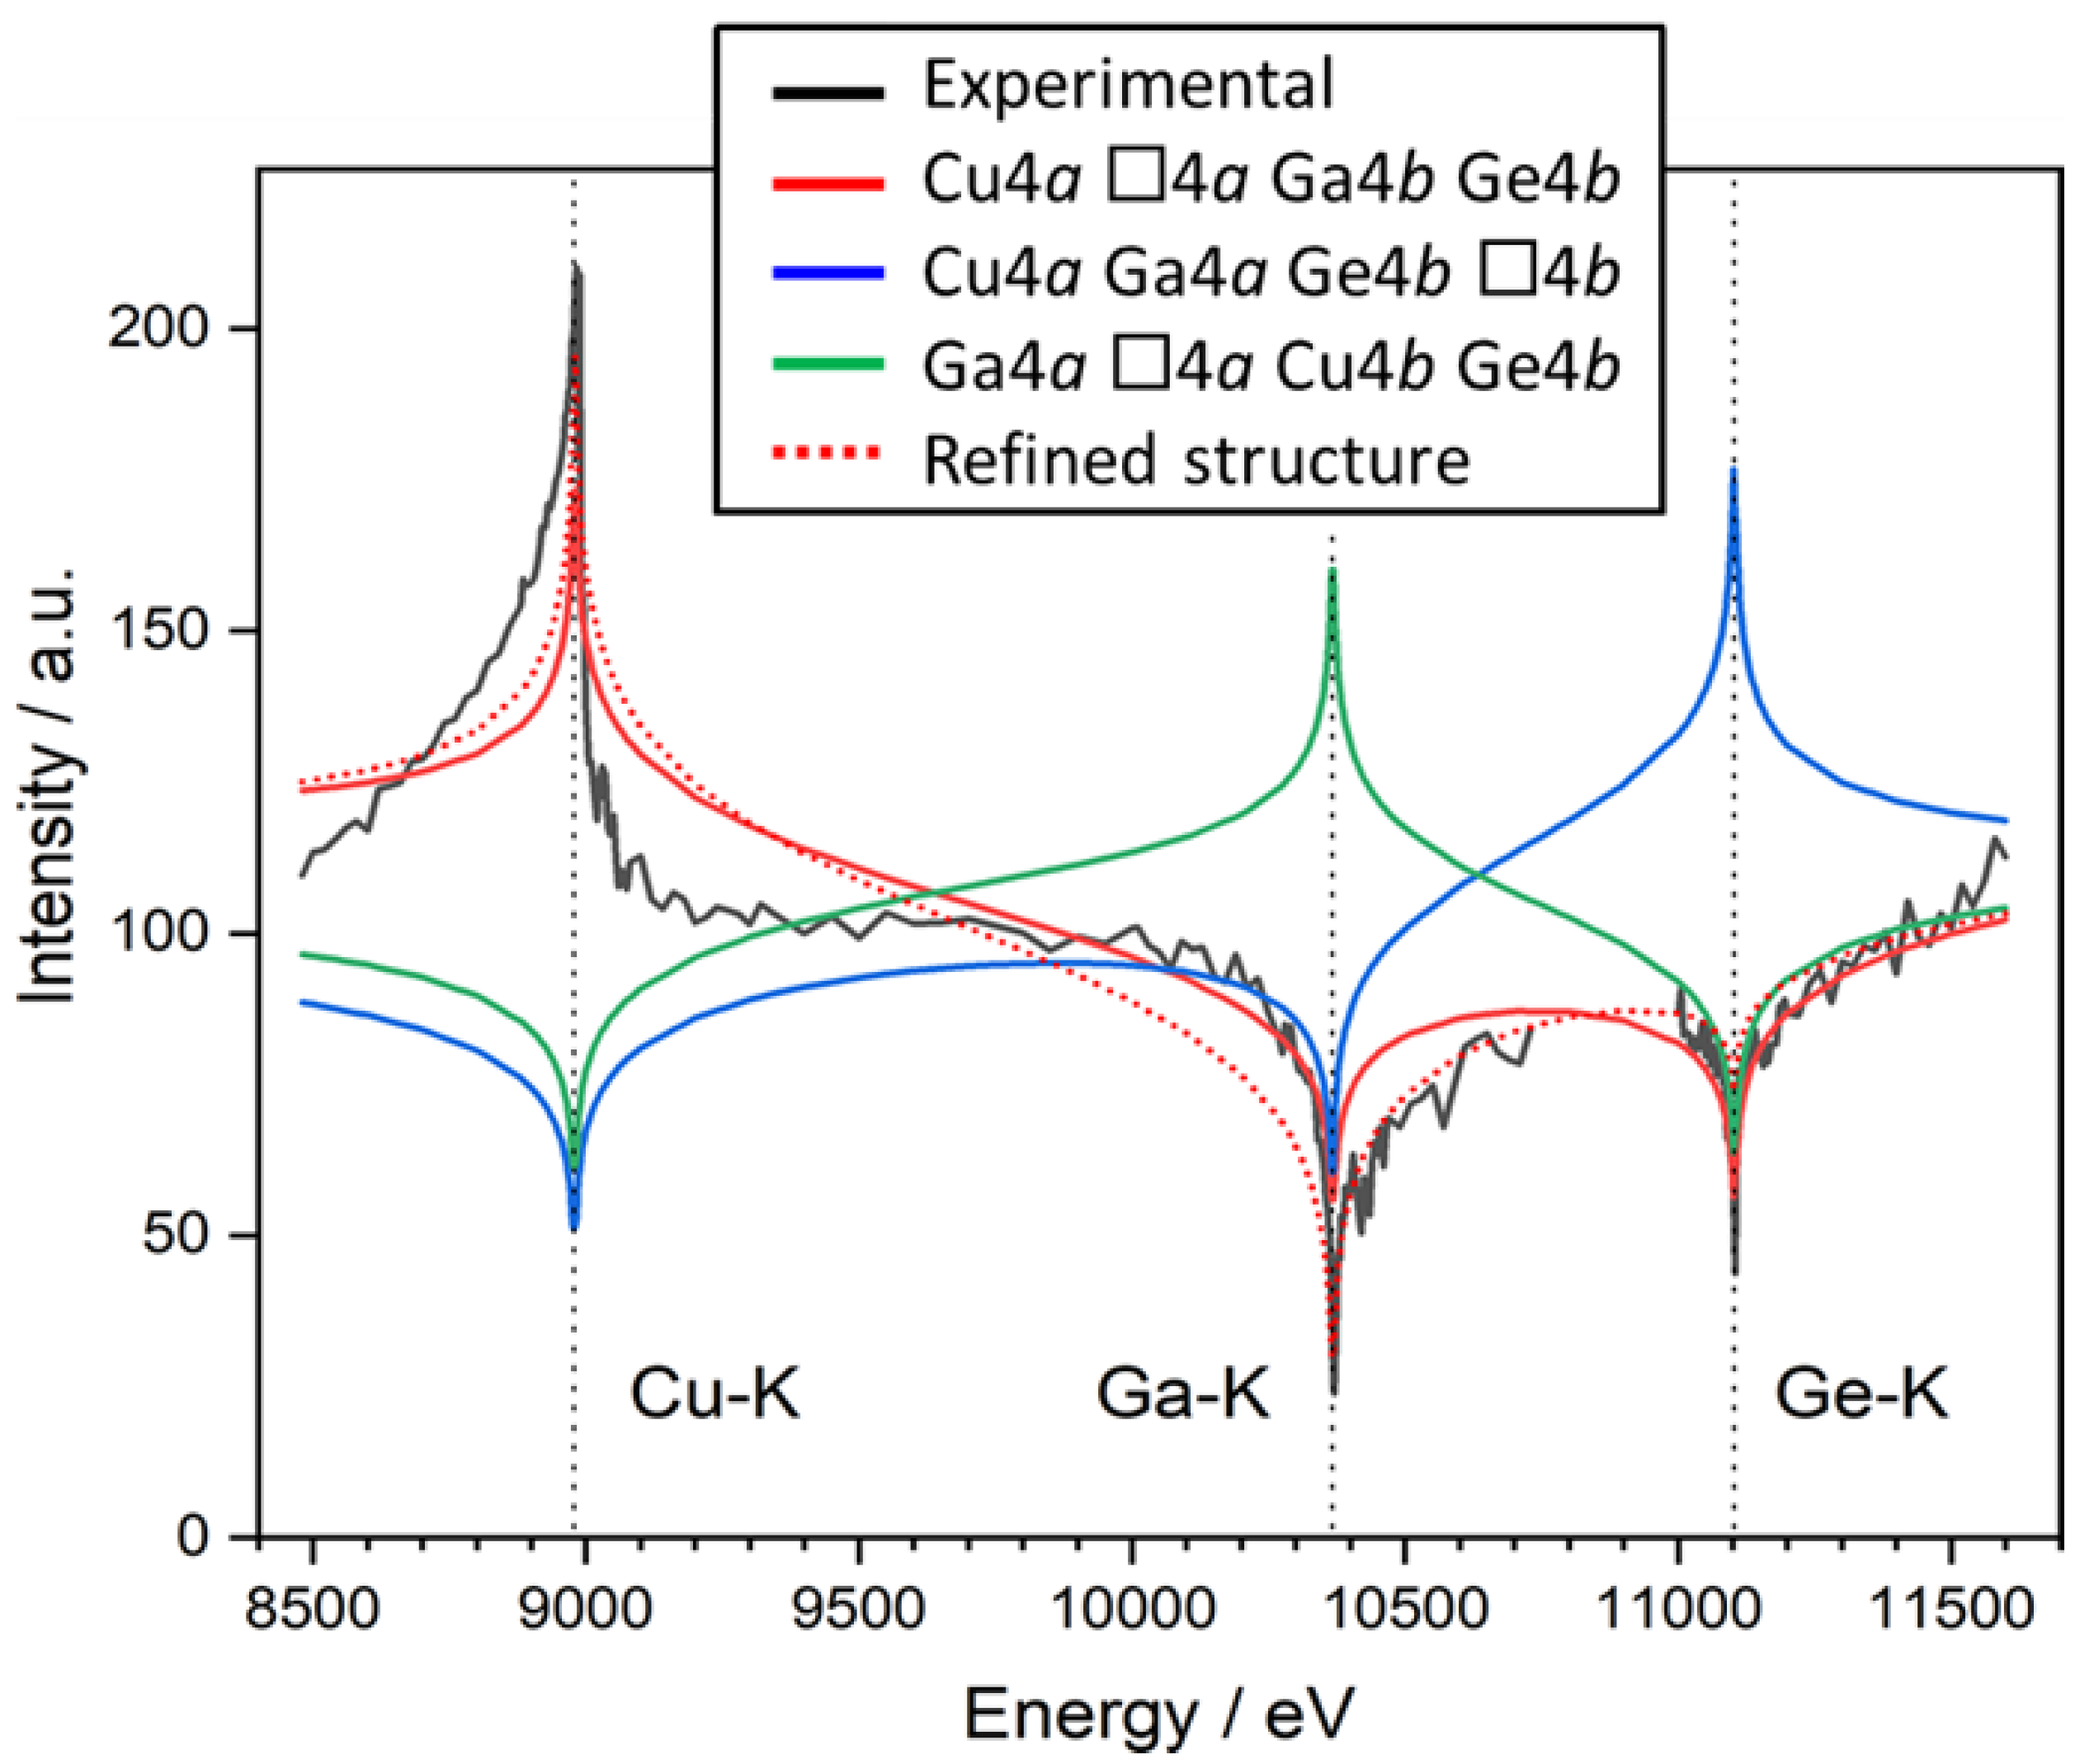
Multiple Edge Anomalous Diffraction (MEAD) using synchrotron X-rays is an established experimental method which allows to distinguish electronic similar elements in the data analysis [15]. The experimental MEAD spectrum is compared to calculated spectra (see Figure 11). As structural model in the calculated spectra the chalcopyrite-type structure has been used but with three different cation distributions. For the calculation, the structural parameters for Cu☐GaGeSe4 (from Woolley [8]) and ideal stoichiometric composition were assumed. In addition, a calculated spectrum based on the final refined crystal structure (Table 3) is also shown; the difference to the ideal model is negligible.
It is obvious that the real cation distribution shows that Cu and vacancies occupy the site 4a and Ga and Ge occupy the site 4b.
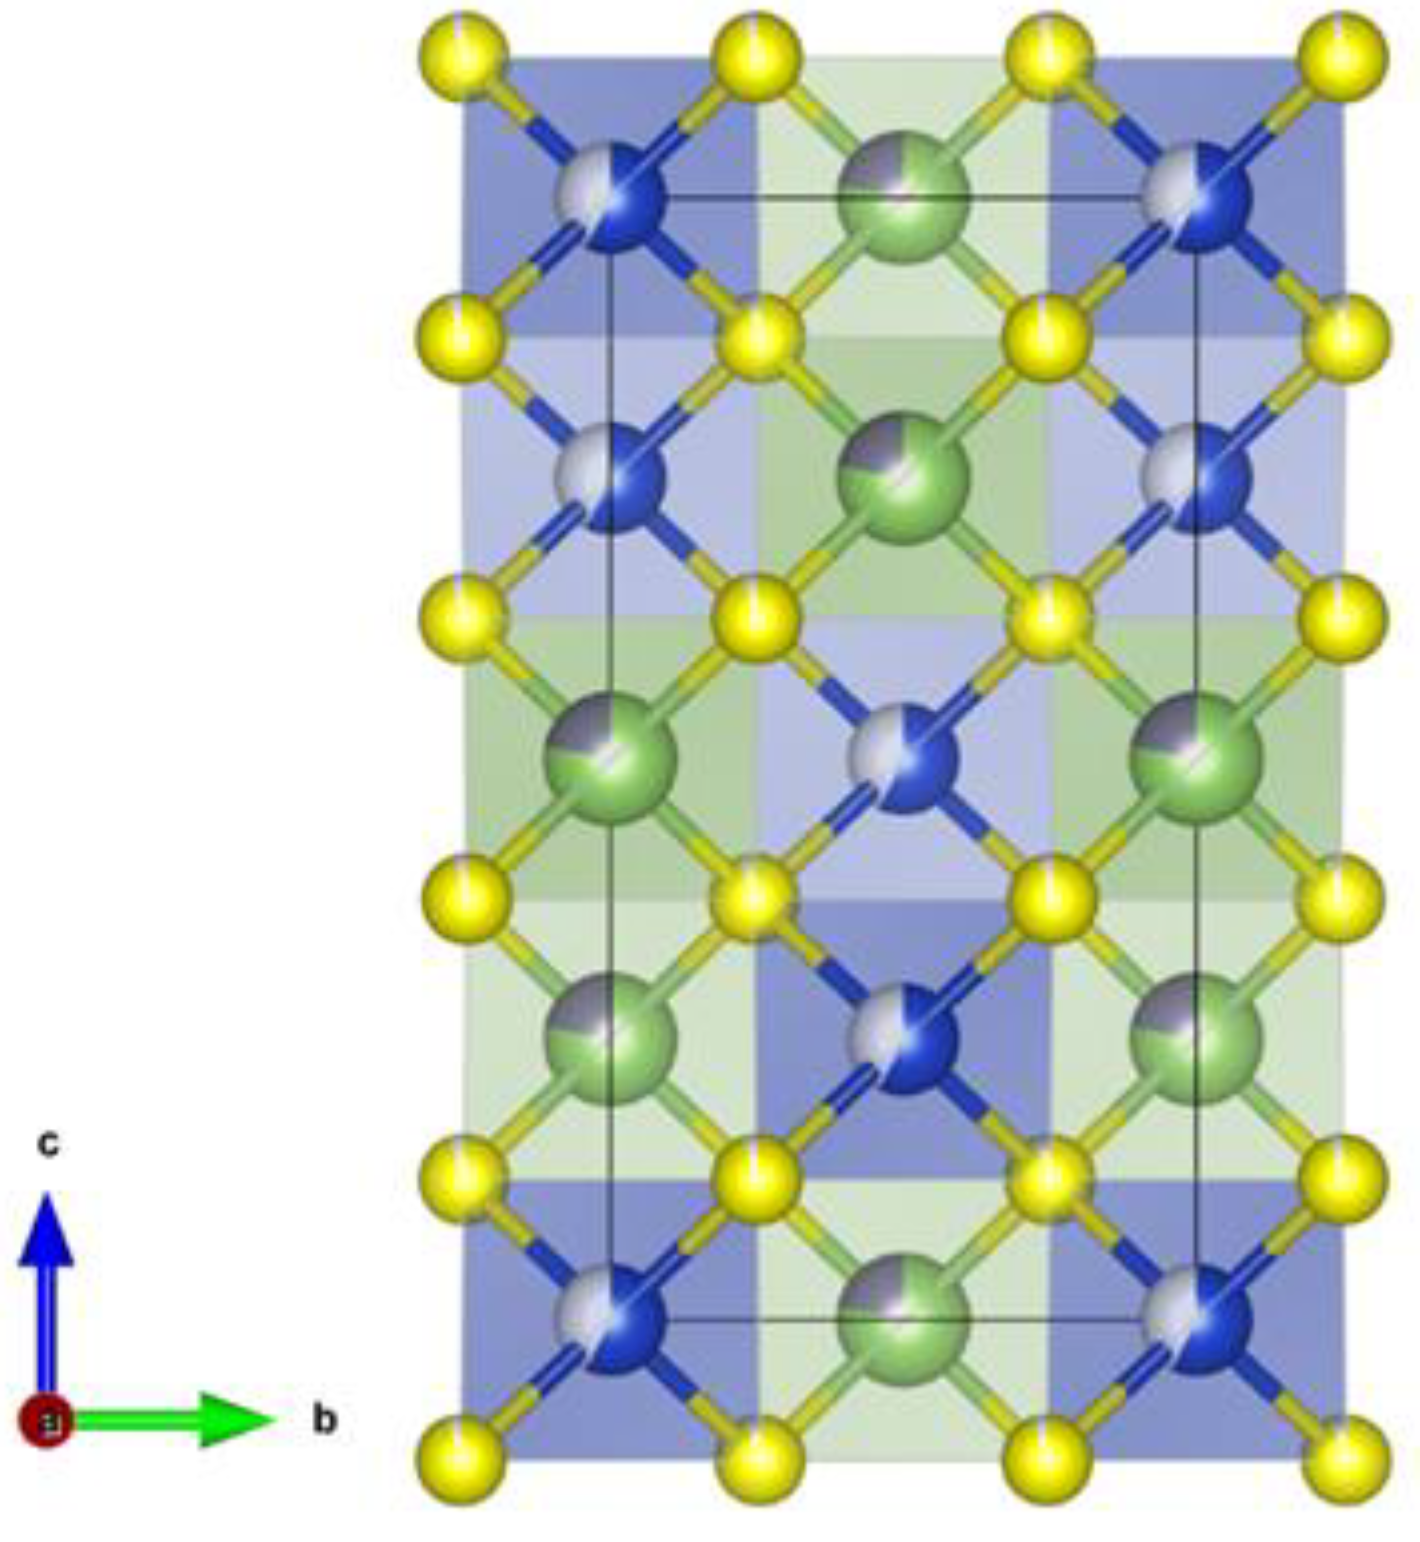
A subsequent joint Rietveld refinement of the structure using the diffraction pattern collected with four different X-ray energies confirmed this result. Due to anomalous scattering changing the scattering power of the chemical elements between the individual data sets, simultaneous independent refinement of all cation site occupation factors was possible. However, this resulted in rather high uncertainties, and the structural model was subsequently simplified by removing atoms with (unphysical) negative occupation factors and limiting the total occupation of the site to the full occupation. Note that this is not compulsive; interstitial cations cannot be excluded by methods presented here. The resulting model (Figure 12) is in full agreement with the results of the MEAD analysis, with only Copper on the 4a position and Gallium and Germanium, but no Copper, on the 4b position. Vacancies were found on the 4a and on the 8g anion site; the Wyckoff site 4b with the highest site occupation factor was assumed to be fully occupied. In a final step charge neutrality between Cu1+, Ga3+, Ge4+ and S2- was forced; this did not result in reduction of the fit quality and did not affect the refined values of site occupation factors significantly. Results of the refinement are shown in Table 3.

Band Gap Energy

The band gap energy has been determined from diffuse reflectance measured by UV-VIS spectroscopy. Using the Kubelka-Munk pseudo-absorption function [23,24]
F R = ( 1 R ) 2 2 R ,
the band gap energy Eg was determined from the linear slope of the function F R · h ν 2 assuming a direct band gap for the material studied.
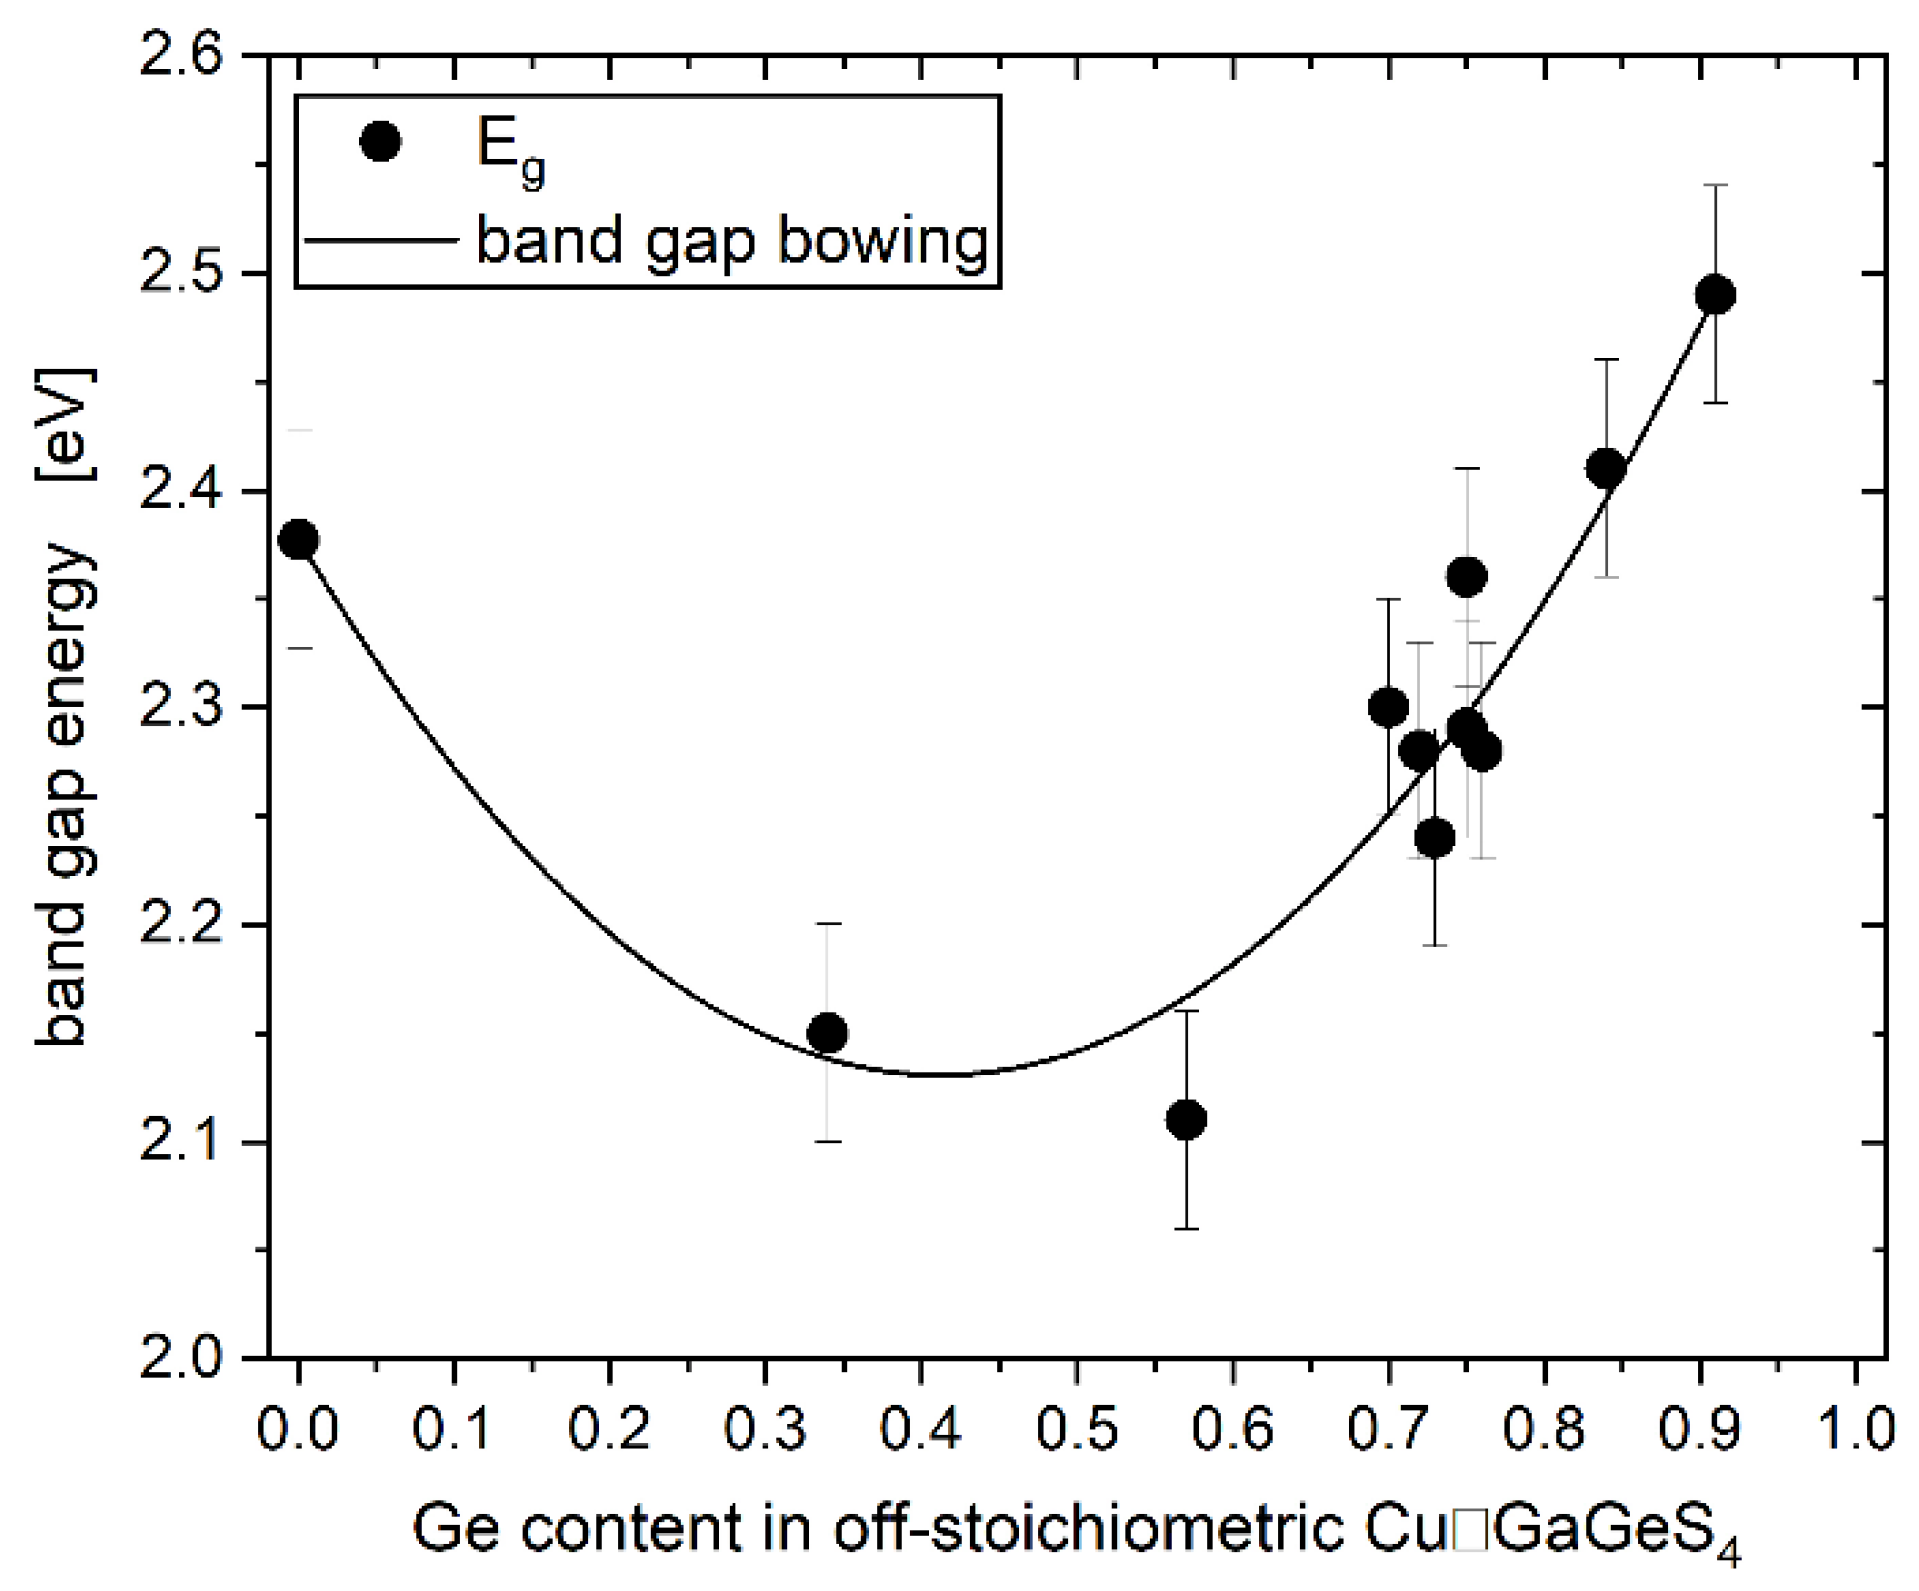
Table 4 summarizes the band gap energies of several off-stoichiometric Cu☐GaGeS4 crystals and their chemical composition. A nonlinear correlation was observed between the chemical composition and the band gap energy.
The band gap energy of semiconductor alloys is usually described by a quadratic polynomial as a function of the concentration of an alloy component; the quadratic coefficient being referred to as the "bowing parameter". Accordingly the band gap energy Eg of the alloy (2CuGaS2)1-x(Cu☐GaGeS4)x is described by
E g x = x E g C u G a G e S 4 + 1 x E g C u G a S 2 b x 1 x .
Here b is the bowing parameter. Figure 13 shows the experimentally determined band gap energy of the (2CuGaS2)1-x(Cu☐GaGeS4)x crystals as well as the band gap bowing accordingly to equation (3). In the respective fit the Ge content of the crystals was chosen to represent the x-value in eqn. (4). The bowing parameter was determined as b = -1.45(0.08) and describes the deviation from linearity.

5. Conclusions

Defect adamantines are interesting materials for photovoltaic applications. Quaternary adamantines can be derived directly from the ternary chalcopyrites AIBIIIXVI2. In the doubled chemical formula, one A1+ and one B3+ are replaced by one C4+ atom, resulting in cation vacancies containing quaternary compounds with the general formula AI☐BIIICIVXVI4 while maintaining the tetrahedral coordination.
Single crystals of Cu☐GaGeS4 were grown by chemical vapor transport. Their chemical composition was found to vary and deviate significantly from the stoichiometric composition. Therefore, the grown crystals were described as compounds of a solid solution between CuGaS2 and GeS2 forming (CuGaS2)1-x(GeS2)x alloys. The cation ratios Cu/(Ga+Ge) and Ge/(Ge+Ga) describe the deviation from the stoichiometric composition (Cu/(Ga+Ge) = Ge/(Ge+Ga) = 0.5). The structural and optoelectronic properties are considerably influenced by these cation ratios as well as the amount of vacancies.
It was shown that Cu☐GaGeS4 crystallizes in the chalcopyrite-type structure (space group I 4 ¯ 2 d ). The cation distribution in this structure was analyzed by MEAD and determined as Cu and vacancies on the Wyckoff position 4a, and Ga and Ge on the Wyckoff position 4b of the chalcopyrite-type structure.
The band gap energy Eg of the off-stoichiometric Cu☐GaGeS4 crystals varies between 2.1 and 2.4 eV. The non-linear correlation between Eg and the chemical composition (Ge content) can be described by the usual bowing behaviour of semiconductor alloys with a bowing parameter of b = -1.45(0.08).

Author Contributions

The manuscript was written through contributions of all authors. All authors have given approval to the final version of the manuscript.

Acknowledgements

AXRPD measurements were carried out at the Diffraction instrument at KMC-2 beamline at Helmholtz-Zentrum Berlin für Materialien und Energie GmbH, Germany. We thank HZB for the allocation of synchrotron radiation beamtime.

Conflicts of Interest

The authors declare no competing financial interest. There are no conflicts to declare.

References

  1. Pamplin, B. The Adamantine Family of Compounds. Prog. Cryst. Growth Charact. 1981, 3, 179-192. [CrossRef]
  2. Matsushita, H.; Katsui, A. Materials design for Cu-based quaternary compounds derived from chalcopyrite-rule. J. Phys. Chem. Solids 2005, 66, 1933-1936. [CrossRef]
  3. Maeda, T.; Matsushita, H.; Katsui, A. Crystal growth of Cu-III-Ge-Se4 Quaternary compounds (III = Ga, In) by vertical Bridgman methods. Jpn. J. Appl. Phys. 2000, 39, (39-1), 41-43. [CrossRef]
  4. Lopez-Rivera, S. A.; Pamplin, B. R.; Woolley, J. C. High-Temperature lattice parameters and DTA of the quaternary compound CuGaSn☐Se4. Il Nuovo Cimento 1983, 2, (6), 1728-1735. [CrossRef]
  5. Garbato, L.; Geddo-Lehmann, A.; Ledda, F. Growth and structural properties of quaternary copper thiostannates. J. Crystal Growth 1991, 114, 299-306. [CrossRef]
  6. Hahn, H.; Strick, G. Über quaternäre Chalkogenide zinkblendeähnlicher Struktur. Naturwiss. 1967, 54, (9), 225-226. [CrossRef]
  7. Pamplin, B. R.; Ohachi, T.; Maeda, S.; Negrete, P.; Elworthy, T. P.; Sanderson, R.; Whitlow, H. J. Solubility of the group IV chalcogenides in I-III-VI2 compounds. In Ternary Compounds Holah, G. D. Institute of Physics 1977, pp 35-42.
  8. Woolley, J. C.; Goodchild, R. G.; Hughes, O. H.; Lopez-Rivera, S. A.; Pamplin, B. R. Quaternary Defect Chalcopyrite Compounds I III IV VI4. Jpn. J. Appl. Phys. 1980, 19, (suppl. 19-3), 145-148. [CrossRef]
  9. Kistaiah, P.; Vishnuvardhan Reddy, C.; Satyanarayana Murthy, K, Thermal-expansion anisotropy in the quaternary semiconductor CuGaGe1-x(VGe)xSe4 at elevated temperatures. Phys. Rev. B 1990, 42, (11), 7186-7192. [CrossRef]
  10. Lopez Rivera, A. Quaternary defect adamantine compounds of the type I-III-IV-☐2-VI4. University of Bath, 1981.
  11. Panyutin, V. L.; Ponedelnikov, B. E.; Chizhikov, V. I. Energy band spectra of mercury selenogermanate and copper thiogermanogallate. Sov. Phys. Semicond. 1983, 17, (9), 1061-1062.
  12. Strok, O. M.; Olekseyuk, I. D.; Zmiy, O. F.; Ivashchenko, I. A.; Gulay, L. D. The Quasi-ternary system Cu2Se-Ga2Se3-GeSe2. Journal of Phase Equilibria and Diffusion 2013, 34, (2), 94-103. [CrossRef]
  13. 13. Nitsche, R, Kristallzucht aus der Gasphase durch chemische Transportreaktionen. Fortschr. Miner. 1967, 44, (2), 231-287.
  14. KMC-2, H.-Z. B. f. M. u. E., X-ray beamline with dedicated diffraction and XAS endstations at BESSY II. Journal of large-scale research facilities 2016, 2, A49.
  15. Többens, D. M.; Gurieva, G.; Niedenzu, S.; Schuck, G.; Zizak, I.; Schorr, S. Cation distribution in Cu2ZnSnSe4, Cu2FeSnS4 and Cu2ZnSiSe4 by multiple-edge anomalous diffraction. Acta Cryst. B 2020, B76, 1027-1035. [CrossRef]
  16. Merritt, E. A. X-ray Anomalous Scattering. Biomolecular Structure Center the University of Washington 2014.
  17. Tauc, J.; Grigorovici, R.; Vancu, A. Optical properties and electronic structure of amorphous Germanium. Phys. stat. sol. 1966, 15, 627-637. [CrossRef]
  18. Stephan, C. Structural trends in off-stoichiometric chalcopyrite type compound semiconductors. Freie Universität Berlin, Berlin, 2011.
  19. Materials Project (next-gen.materialsproject.org), mp-7582.
  20. Dittmar, G.; Schäfer, H. Die Kristallstruktur von L.T.-GeS2. Acta Crystallogr. 1976, B32, 1188-1192. [CrossRef]
  21. Shannon, R. D, Revised effective ionic radii and systematic studies of interatomic distances in halides and chalcogenides. Acta Cryst. A 1976, 32, (5), 751-767. [CrossRef]
  22. Bérar, J.-F.; Lelann, P. E.S.D.'s and estimated probable error obtained in Rietveld refinements with local correlations. J. Appl. Cryst. 1991, 24, (1), 1-5. [CrossRef]
  23. Kubelka, P.; Munk, F. Ein Beitrag zur Optik der Farbanstriche. Z.Techn.Physik 1931, 12, 593-601.
  24. Kubelka, P. New contributions to the optics of intensely light-scattering materials. Part I. J.Opt.Soc.Am. 1948, 38, 448-457. [CrossRef]
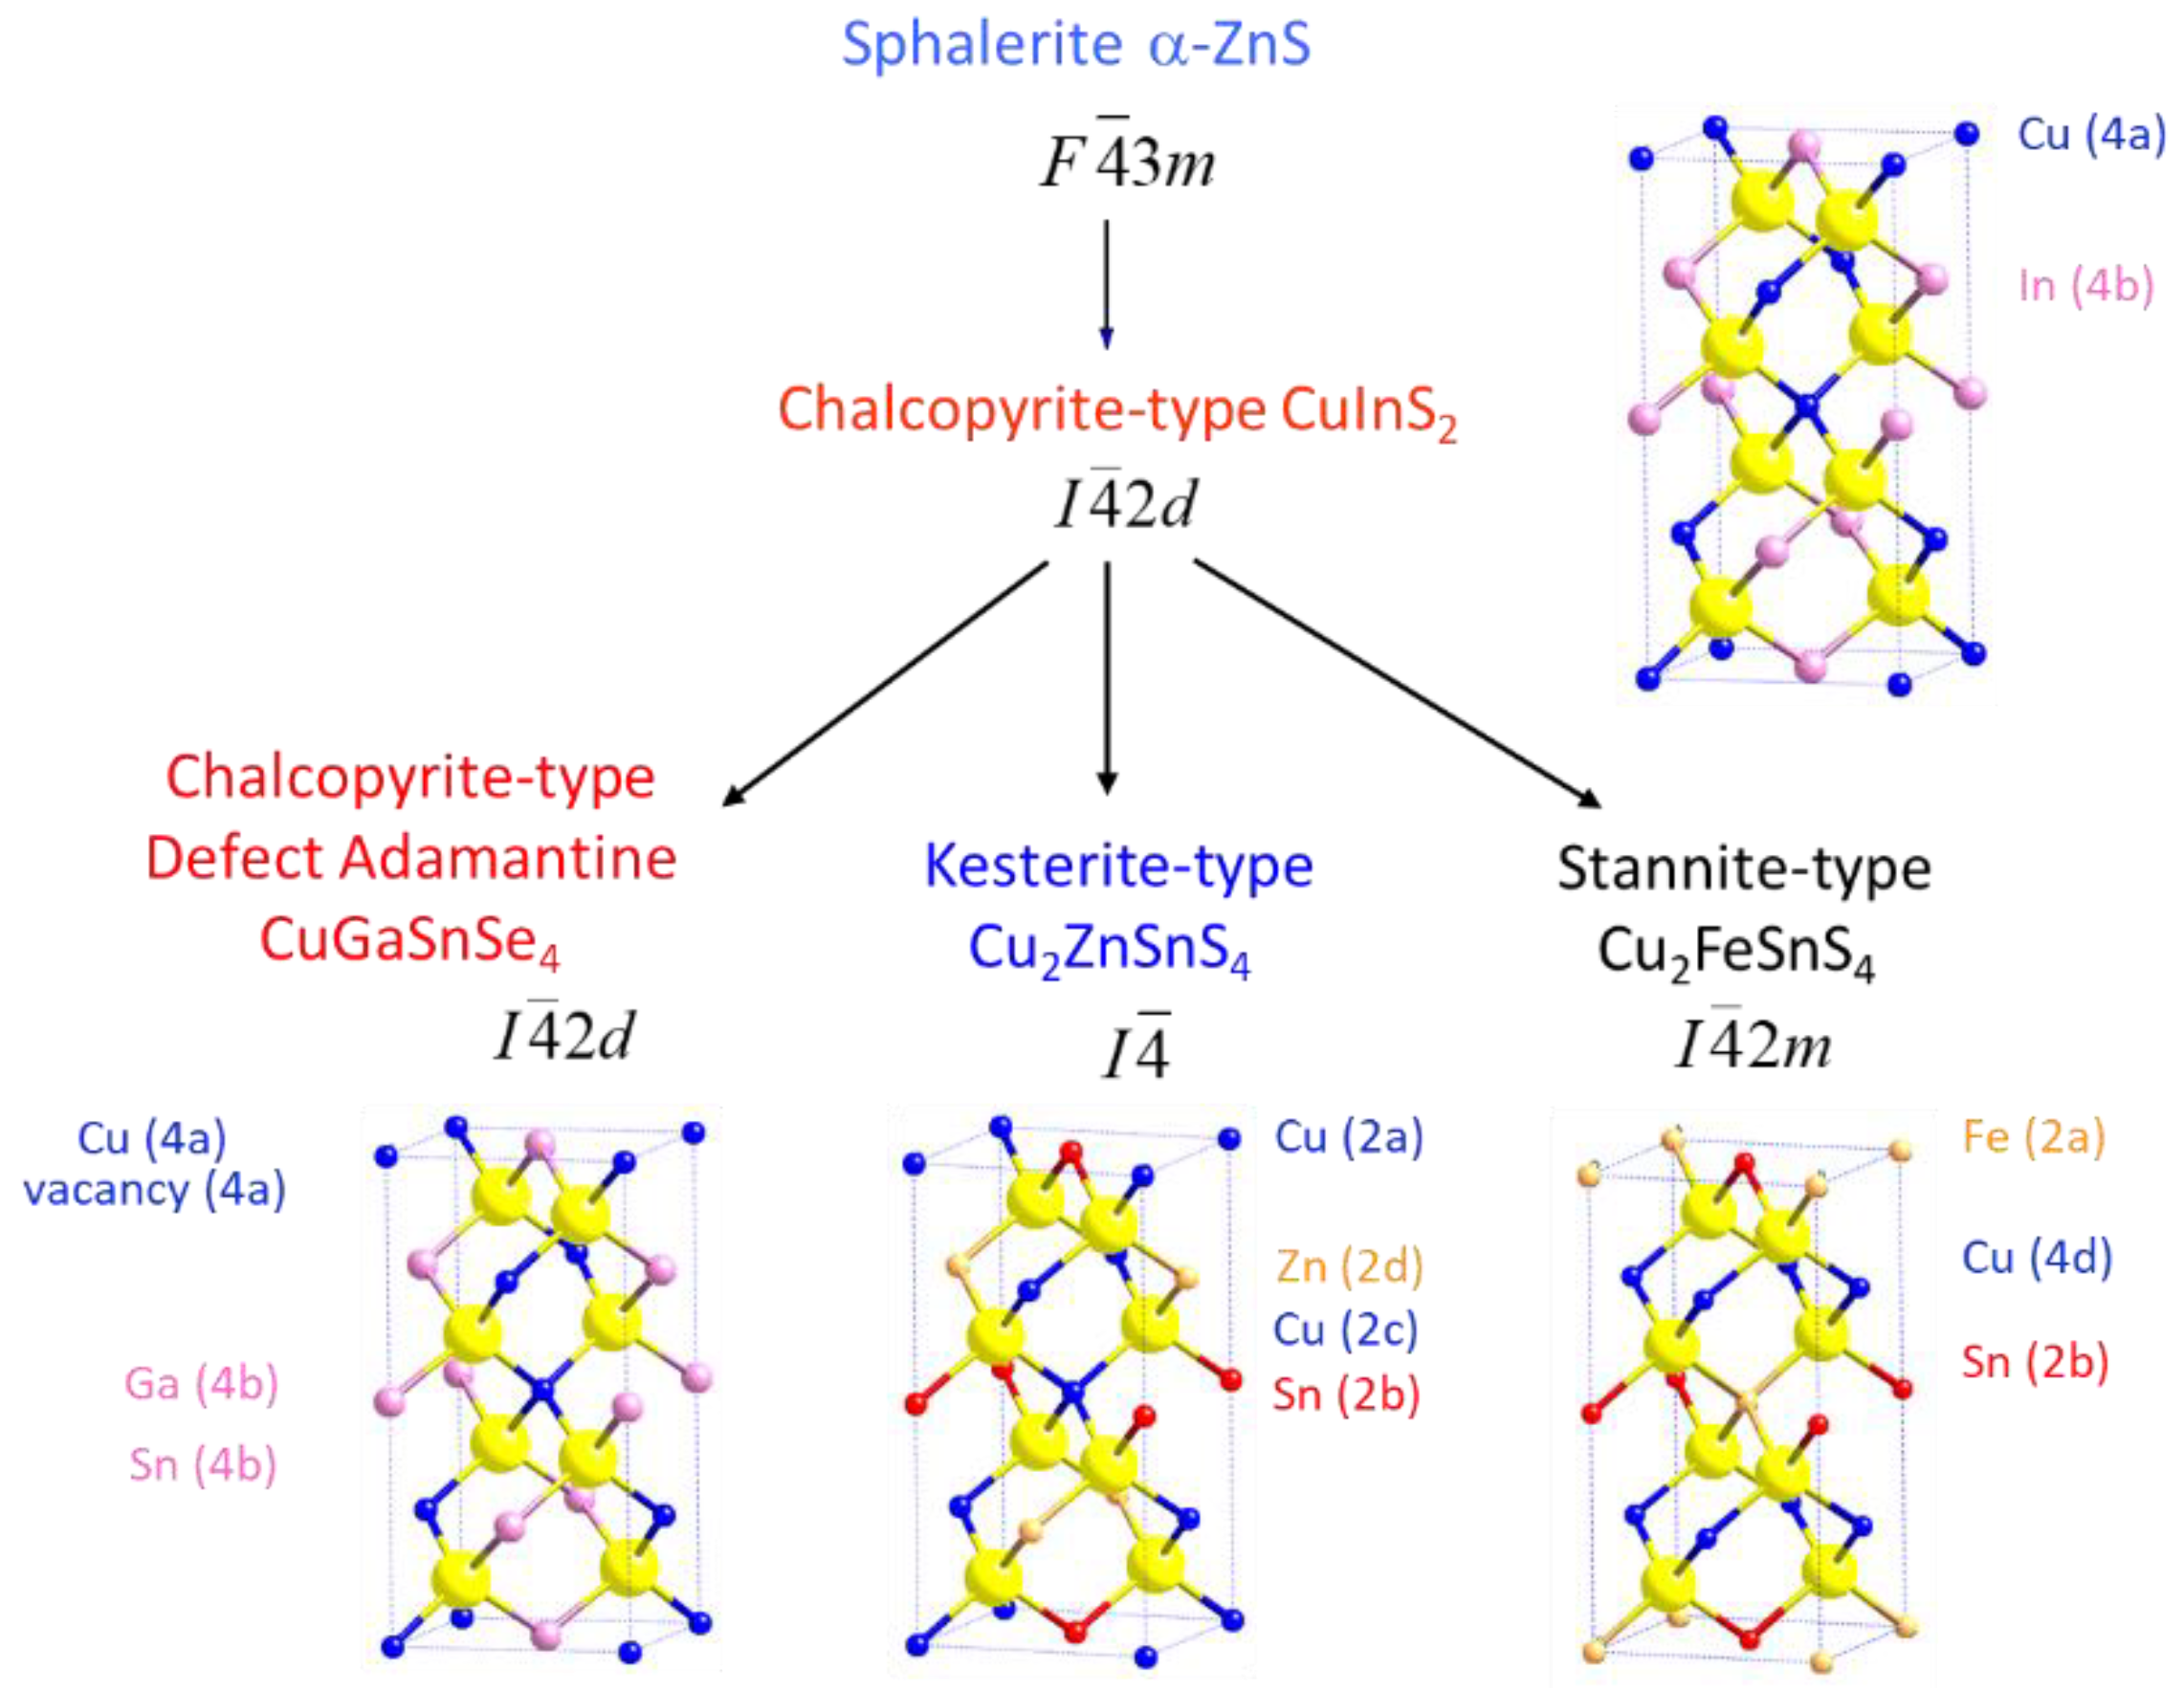
Figure 1. Adamantines - transition from tetragonal chalcopyrite-type compounds (like CuInS2) to quaternary chalcogenides. Shown is the arrangement of the cations and anions, the resulting crystal structure type as well as exemplarily compounds.
Preprints 87027 g001
Figure 2. Phase diagram Cu2GeSe3 - Ga2GeSe5, taken from Strok et al. [12]; the red line highlights the compound Cu☐GaGeSe4.
Preprints 87027 g002
Figure 3. As grown crystals of Cu☐GaGeS4; chemical vapor transport using iodine (5 mg/cm3) as transport agent, with ΔT = 900 °C–750 °C.
Preprints 87027 g003
Figure 4. Experimentally determined chemical composition of off-stoichiometric Cu☐GaGeS4 crystals, indicated in a cation ratio plot Cu/(Ga+Ge) vs. Ge/(Ga+Ge). The ideal stoichiometric composition is at Cu/(Ga+Ge) = Ge/(Ga+Ge) = 0.5. Calculation 1 represents the composition of Cu2(1-x)2(1-x)Ga2(1-x)Ge2xS4 crystals assuming a stoichiometric CuGaS2 end member. For calculation 2 an off-stoichiometric end member described by Cu2yGa2(1-y)S3-2y with y = 0.51 was assumed.
Preprints 87027 g004
Figure 5. Crystal structure of (a) GeS2, according to ref. [19] and (b) CuGaS2, according to ref. [18]. The CuS4, GaS4 and GeS4 cation tetrahedra are shown. The dotted line shows the unit cell.
Preprints 87027 g005
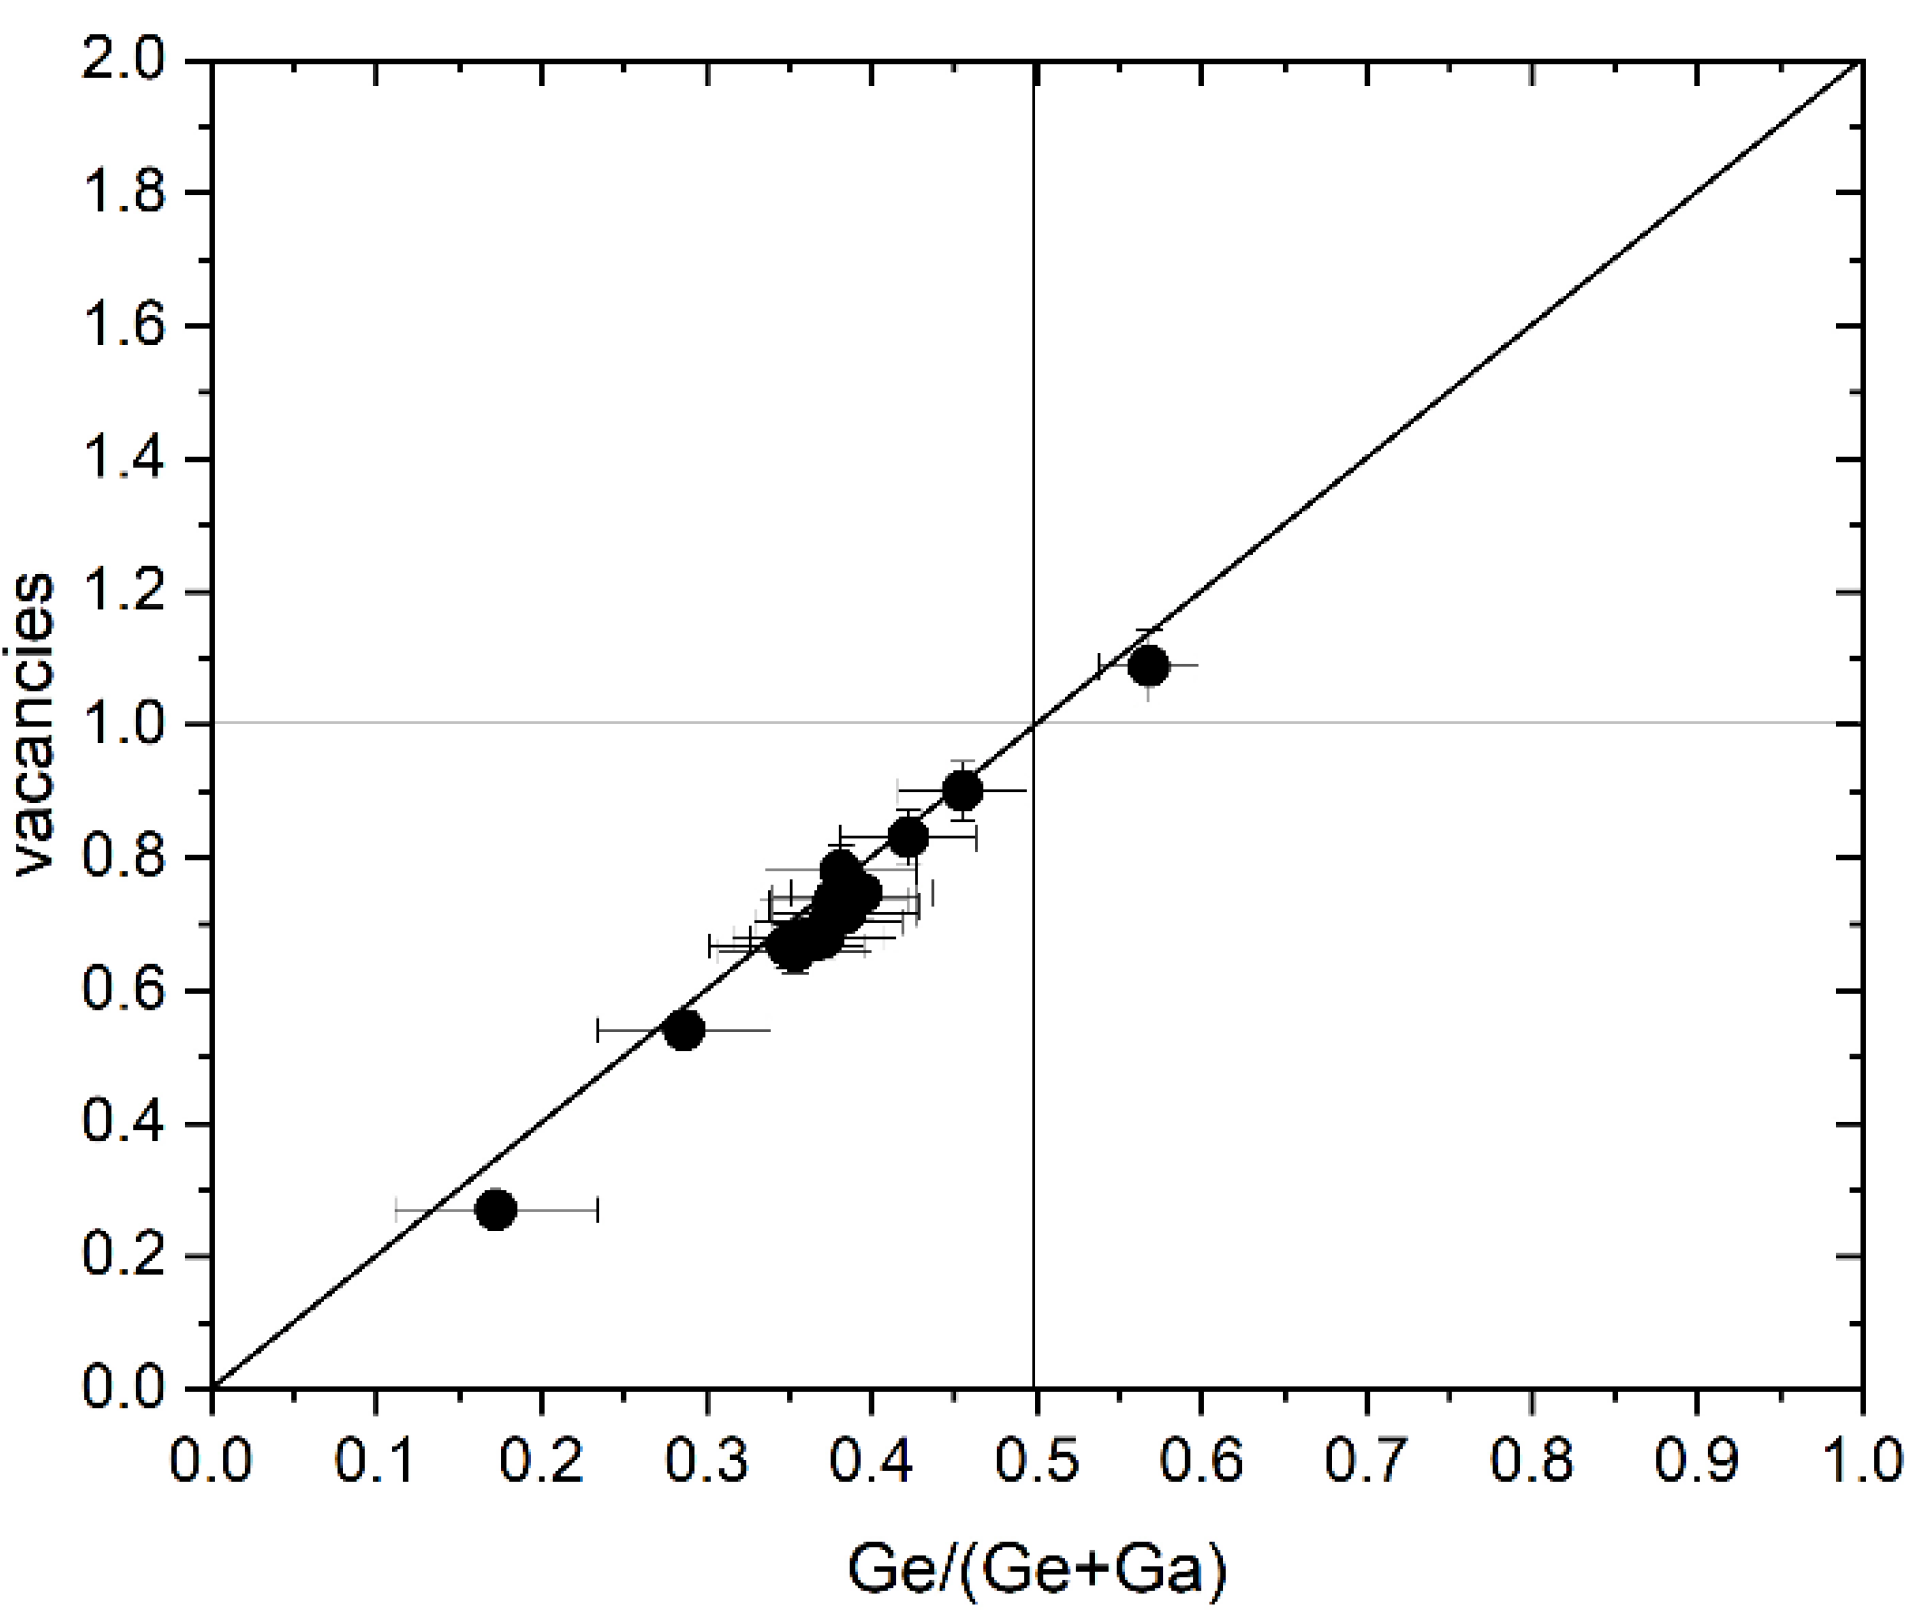
Figure 6. Fraction of vacancies in Cu2(1-x)2(1-x)Ga2(1-x)Ge2xS4 in dependence on the Ge content. The dots show the experimental values, the solid line corresponds to the nominal values according to the general chemical formulae above.
Preprints 87027 g006
Figure 7. Example of an X-ray diffractogram of Cu1.220.78Ga1.25Ge0.77S4 and LeBail analysis of the data. The red dots are the experimentally obtained data; the blue dashes are the Bragg peak positions of the chalcopyrite-type structure. The black line is the calculated fit between measured data and structure. The blue line is the difference between the experimentally obtained and the calculated intensities.
Preprints 87027 g007
Figure 8. Unit cell volume of off-stoichiometric Cu☐GaGeS4 crystals calculated from the lattice parameter determined by LeBail analysis of the XRD data in dependence on the Cu/(Ga+Ge) ratio. The line should guide the eye.
Preprints 87027 g008
Figure 9. Correlation between the lattice parameter a and c/2 of off-stoichiometric Cu☐GaGeS4 crystals with the cation ratios (a) Cu/(Ga+Ge) and (b) Ge/(Ge+Ga). The solid lines should guide the eye.
Preprints 87027 g009
Figure 10. Chalcopyrite-type structure and cation as well as vacancy distribution according to literature [8,9].
Preprints 87027 g010
Figure 11. MEAD analysis of the energy dependency of 101 Bragg peak intensity of Cu1.220.78Ga1.25Ge0.77S4. The curves are normalized to an average intensity of 100.
Preprints 87027 g011
Figure 12. Refined structure of Cu1.220.78Ga1.25Ge0.77S4 with site occupation indicated. Cu/vacancies blue/sky blue, Ge/Ga green/turquois.
Preprints 87027 g012
Figure 13. Band gap energies of different crystals within the (2CuGaS2)1-x(Cu☐GaGeS4)x alloy. CuGaS2 is the end member of the alloy for x = 0, the right end member is represented by the off-stoichiometric Cu☐GaGeS4 crystal with the highest Ge content. The solid line represents the fit of the experimental band gap energy values to eqn. (4) describing the bowing behaviour.
Preprints 87027 g013
Table 1. Material properties of the defect adamantines Cu☐GaGeS4 and Cu☐GaGeSe4.
Cu☐GaGeS4 Cu☐GaGeSe4
tetragonal [6] tetragonal
I 4 ¯ 2 d [7]
tetragonal
I 4 ¯ 2 d [8]
tetragonal
I 4 ¯ 2 d [9]
a (Å)
c (Å)
5.334 [6]
10.050
5.302 [7]
10.212
5.568 [8]
10.841
5.5617 [9]
10.9238
Tmelting (°C) 1000 [2] 1000 [10] 836 [2]
Tdecomposition (°C) 710 [10]
Eg (eV) 2.73 [11] 1.85 [8] 1.38 [3]
Table 2. Chemical composition of off-stoichiometric Cu☐GaGeS4 crystals determined by X-Ray fluorescence analysis and cation ratios. Iodine concentration used for crystal growth. Lattice parameters of the crystals determined by LeBail analysis of X-ray diffraction data.
Sample no. Chemical formular Cu/(Ga+Ge) Ge/(Ge+Ga) Iodine concentration
(mg/cm3)
a (Å) c (Å)
To589 Cu0.931.08Ga0.86Ge1.13S4 0.467 0.568 0* 5.330(5) 10.203(6)
To557 Cu1.100.90Ga1.09Ge0.91S4 0.550 0.455 4.9 5.315(6) 10.114(4)
To569 Cu1.180.83Ga1.15Ge0.84S4 0.593 0.422 5.0 5.324(1) 10.187(6)
To597 Cu1.270.74Ga1.24Ge0.75S4 0.638 0.377 4.7 5.319(3) 10.189(3)
To555 Cu1.270.75Ga1.22Ge0.76S4 0.641 0.384 4.9 5.318(2) 10.159(2)
To329 Cu1.270.75Ga1.20Ge0.78S4 0.641 0.394 5.0 5.318(6) 10.178(9)
To556 Cu1.300.69Ga1.24Ge0.77S4 0.647 0.383 4.9 5.320(4) 10.159(3)
To581 Cu1.290.72Ga1.23Ge0.76S4 0.648 0.382 5.0 5.323(3) 10.152(3)
To585 Cu1.300.72Ga1.23Ge0.75S4 0.656 0.384 8.1 5.324(3) 10.184(3)
To583 Cu1.300.72Ga1.22Ge0.76S4 0.657 0.384 5.0 5.319(6) 10.167(2)
To531 Cu1.330.68Ga1.27Ge0.72S4 0.668 0.379 5.0 5.323(7) 10.127(3)
To591 Cu1.350.67Ga1.29Ge0.69S4 0.682 0.348 1.1 5.324(7) 10.226(3)
To599 Cu1.350.68Ga1.24Ge0.73S4 0.685 0.371 3.1 5.330(3) 10.272(8)
To580 Cu1.360.66Ga1.28Ge0.70S4 0.687 0.353 5.0 5.362(3) 10.173(5)
To596 Cu1.470.54Ga1.42Ge0.57S4 0.739 0.286 4.7 5.330(3) 10.272(8)
To588 Cu1.760.27Ga1.63Ge0.34S4 0.893 0.213 1.1 5.340(3) 10.365(9)
literature
CuGaS2 [18] 0.991 0 5.355(1) 10.485(2)
CuGaS2 [18] 0.995 0 5.356(1) 10.483(2)
GeS2 [19] 0 1 5.68 8.97
* solid state reaction without iodine.
Table 3. Results of structural refinement of the MEAD data of Cu1.22Ga1.25Ge0.77S4.
Composition (refined): Cu1.152(3) Ga1.554(26) Ge0.446(26) S3.799(13)
Space group: I 4 ¯ 2 d
Atom Wyckoff x y z Biso [Å2] s.o.f.
Cu 4a 0 0 0 0.830(36) 0.576(2)
Ga 4b 0 0 0.5 0.909(15) 0.777(13)
Ge 4b 0 0 0.5 0.909(15) 0.223(13)
S 8g 0.25518(20) 0.25 0.125 0.804 0.950(3)
S
anisotropic
U11 = 0.010(2), U22 = 0.0029(19), U33 = 0.0179(7), U12 = 0, U13 = 0, U23 = 0.0041(7)
Lattice
parameter
a = 5.321383(10) Å c = 10.18642(3) Å V = 288.4500(12) Å3
overall fit indicators (referring to the combined four diffraction patterns):
Rwp = 0.067 Chi2 = 11.7 Bérar SCOR 822] = 4.42
Table 4. Results for off-stoichiometric Cu☐GaGeS4 crystals: chemical composition as well as their band gap energy, determined by UV-Vis spectroscopy.
Sample no. Composition Band gap energy Eg (eV)
To557 Cu1.100.90Ga1.09Ge0.91S4 2.49(5)
To569 Cu1.180.83Ga1.15Ge0.84S4 2.41(5)
To597 Cu1.270.74Ga1.24Ge0.75S4 2.29(5)
To581 Cu1.290.72Ga1.23Ge0.76S4 2.28(5)
To585 Cu1.300.72Ga1.23Ge0.75S4 2.36(5)
To531 Cu1.330.68Ga1.27Ge0.72S4 2.28(5)
To599 Cu1.350.68Ga1.24Ge0.73S4 2.24(5)
To580 Cu1.360.66Ga1.28Ge0.70S4 2.30(5)
To596 Cu1.470.54Ga1.42Ge0.57S4 2.11(5)
To588 Cu1.760.27Ga1.63Ge0.34S4 2.15(5)
Disclaimer/Publisher’s Note: The statements, opinions and data contained in all publications are solely those of the individual author(s) and contributor(s) and not of MDPI and/or the editor(s). MDPI and/or the editor(s) disclaim responsibility for any injury to people or property resulting from any ideas, methods, instructions or products referred to in the content.
Copyright: This open access article is published under a Creative Commons CC BY 4.0 license, which permit the free download, distribution, and reuse, provided that the author and preprint are cited in any reuse.
Prerpints.org logo

Preprints.org is a free preprint server supported by MDPI in Basel, Switzerland.

Subscribe

© 2024 MDPI (Basel, Switzerland) unless otherwise stated