
Submitted:
03 October 2023
Posted:
04 October 2023
You are already at the latest version
Abstract
In this study, we aimed to reveal the proinflammatory effects of serum 25-hydroxyvitamin D3 (Vit D) deficiency and insufficiency in new-onset type 2 diabetes mellitus (T2DM) and prediabe-tes. We recruited 84 prediabetes patients, 94 new-onset T2DM patients and 113 healthy partici-pants. Levels of C-reactive protein (CRP), fibrinogen, ferritin, interleukin-1β (IL-1β), interleu-kin-6 (IL-6), interleukin-8 (IL-8), tumour necrosis factor-α (TNF-α), nuclear factor kappa-B (NF-κB) and mitogen-activated protein kinase (MAPK) were measured in the serum of the par-ticipants. The ANOVA Bonferonni and Kruskal Wallis Dunn tests were used for the comparison of the inflammation markers and vitamin D levels between the groups. Upon covariance analy-sis with age, gender and BMI; Vit D levels of T2DM group were found to be significantly lower (p<0.003). Proinflammatory markers and CRP were found to be significantly higher in predia-betic and diabetic subjects. In the prediabetes group, IL-1β, IL-6, IL-8, TNF-α and MAPK were significantly higher in those with Vit D insufficiency and deficiency groups. In T2DM group, IL-1β, IL-6, IL-8, TNF-α, NF-κB, MAPK and CRP were significantly higher in those with Vit D insufficiency and deficiency. Our study emphasizes the proinflammatory effects of Vit D on the initiation of inflammation in both prediabetes and diabetes mellitus.
Keywords:
Prediabetes
; type 2 diabetes mellitus
; 25-hydroxyvitamin D3
; inflammation
; interleukins
; TNF-α
; NF-kB
; MAPK
1. Introduction
Inflammation is defined as a host-induced reaction, especially against infections and tissue damage, but recent studies revealed that it also plays a role in the pathophysiology of chronic diseases. In the last fifteen years, it has been reported that Type 2 Diabetes Mellitus (T2DM) is a chronic subclinical inflammation state and is associated with acute phase response [1]. Scientific studies have shown that increased proinflammatory biomarkers, such as Tumor Necrosis Factor-alpha (TNF-α), interferon-gamma, interleukin-1 beta (IL-1ß), interleukin-6 (IL-6), high-sensitivity C-reactive protein (hs-CRP), and Mitogen-Activated Protein Kinases (MAPK), were associated with T2DM [1,2].
Today, vitamin D (Vit D) deficiency is considered a global pandemic. Although its relationship with osteoporosis is very well known, Vit D deficiency is associated with many other diseases such as autoimmune diseases, various types of cancer, cardiovascular diseases and T2DM. It has been linked to the development of hyperglycemia by altering insulin secretion [3,4]. Hypovitaminosis D elevates intracellular calcium levels by increasing the secretion of parathyroid hormone, which in turn inhibits calcium-related insulin secretion and action [5]. In addition, the role of serum Vit D in the development of diabetes-related cardiovascular and renal complications has been demonstrated in many studies [6,7,8].
In vitro and in vivo studies have revealed that 1,25-dihydroxyvitamin D3 (1,25(OH)2D3), the biologically active form of Vit D, has many immunomodulatory functions. Some of these functions are the suppression of proinflammatory cytokines, regulation of cellular immunity, suppression of B-cell differentiation and maturation to plasma cell, decreasing the expression of nuclear factor kappa-B (NF-κB), and downregulation of MAPK [9,10,11]. Through all these positive effects on the immune system and inflammation, Vit D reduces insulin resistance and increases insulin secretion in patients with T2DM [1,2].
NF-κB is a transcription factor found in the cytoplasm of all cell types. When activated, it is transported to the nucleus and regulates the gene expression of cytokines and adhesion molecules, as well as controls cell apoptosis, adaptive immunity, cell growth and aging [12,13,14,15]. Because it is activated by proinflammatory cytokines such as IL-1β, and TNF-α and is involved in the synthesis of genes of cytokines, chemokines and adhesion molecules, NF-κB has been recognized as a marker of inflammation for a while [15]. The number of scientific studies emphasizing that Vit D suppresses the release of IL-6, IL-8 and TNF-α from mononuclear cells through NF-κB or MAPK has increased over time [9,11].
The present study aimed to show the proinflammatory effects of Vit D deficiency and insufficiency on the initiation of inflammation in new-onset type 2 diabetes mellitus (T2DM) and prediabetes. For this purpose, we assessed the relationship between serum Vit D levels and acute phase reactants such as CRP, fibrinogen and ferritin; proinflammatory markers such as IL-1β, IL-6, IL-8, TNF-α, NF-κB and MAPK in newly diagnosed prediabetes and type 2 DM patients.
2. Materials and Methods
2.1. Ethical Approval
All subjects who participated in the study signed a written informed consent before participating in the study. The Ethics Committee of Istanbul University-Cerrahpasa, Cerrahpasa Medical Faculty (approval date and number 16.04.2020-54969), approved the study. This study was conducted according to the Declaration of Helsinki.
2.2. Research Design
This is a cross-sectional study conducted in the outpatient clinics of the Endocrinology and Family Medicine Departments of Cerrahpaşa Medical Faculty, Istanbul University-Cerrahpaşa, between May 2020 and May 2022. A total of 291 participants aged 30-60 years were recruited for this study. The study groups consisted of 84 prediabetes (PreDM) patients and 94 T2DM patients who were newly diagnosed and had no diabetes complications. The control group consisted of 113 healthy participants without any chronic disease. According to the American Diabetes Association Prediabetes Diabetes Mellitus classification, participants whose fasting blood glucose (FBG) was between 100 mg/dl (5.6 mmol/l) and 126 mg/dl (7.0 mmol/l) were recruited in the prediabetes group; participants whose FBG level was > 126 mg/dl (7, 0 mmol/l) were recruited in the diabetes group; and participants with FBG level < 100mg/dl (5.6 mmol/l) were considered healthy.
The preDM and diabetes (DM) groups are further divided into the normal level Vit D group, Vit D insufficiency group and Vit D deficiency group. In line with the recommendations of the US Society of Endocrinology, Vit D levels below 20 nmol/l were considered deficient; between 20.01 nmol/l and 29.99 nmol/l were considered insufficient; and 30 nmol/l and above were considered normal vitamin D levels.
2.3. Study Participants
The subjects consisted of patients and healthy individuals who met the inclusion criteria and agreed to participate in the study. The study group consisted of DM and preDM patients recruited from outpatient clinics in the Endocrinology and Family Medicine Departments. The control group (nonDM group) consisted of healthy individuals who applied to the outpatient clinics of the Family Medicine Department for general health examinations. The nature of the research was explained to the participants, and a written informed consent was obtained from them after they agreed to participate in the study.
2.4. Inclusion Criteria
Individuals between 30-60 years of age who were mentally competent and who did not have a pregnancy, diabetes complications, infection, connective tissue disorder or malignancy were included in the study. Considering that aging increases inflammation, individuals over 60 years of age were not included in the study.
2.5. Exclusion Criteria
Considering their effects on the pro- and anti-inflammatory parameters, healthy participants with a history of any chronic disease, healthy and diabetic participants who used steroids, anti-inflammatory drugs, antiepileptic drugs, antioxidant drugs, and those who used vitamin D preparations, calcium preparations, or other vitamin preparations in the past three months, smoking, and alcohol dependent individuals were excluded from the study.
2.6. Study Design
Blood samples were obtained from patients by venipuncture after an overnight fast (≥8 hours). Serum samples were obtained after at least 30 min of clotting by centrifugation at 2,500g for 15 min and were stored at -80 C until assayed for determination of IL-1β, IL-6, IL-8, TNF-α, NF-κB, and MAPK. Routine biochemical parameters and Vit D3 were measured on the day of blood collection.
Biochemical parameters were measured using the spectrophotometric method by the auto-analyzer (Hitachi Modular System, Roche Diagnostic, Corporation, Hague Road, Indianapolis, IN). CRP values were measured with the turbidimetric method by the auto-analyzer (ADVIA 1800 Auto Analyzer, Siemens Medical Sol., Deerfield, IL). Using a Fibrintimer II coagulometer and Multifibren U Kit (Siemens Healthcare Diagnostics, Germany), the Clauss method was performed for measuring plasma fibrinogen. The 25-hydroxyvitamin D3 (25(OH)D3) levels were assessed using the immunoassay based on Electro Chemi Luminescence (ECL) technology.
Serum IL-1β, IL-6, IL-8, TNF-α, NF-κB, and MAPK levels were measured using the human ELISA Kits (R&D Systems, UK) according to the manufacturer's instructions. The coefficients of intra- and inter-assay variation were <8 % (n = 20) and <9% (n = 20), respectively.
2.7. Statistical Analysis
Epi Info™ StatCalc. program was used for the power analysis of our study. While determining the number of subjects, we used the frequency of Vit D deficiency/insufficiency. With an expected frequency of 20% of Vit D deficiency/insufficiency in the non-diabetes group and 40% of Vit D deficiency/insufficiency in the diabetes group, with a type 1 error of 0.05, a 95% confidence interval, and 80% power, the sample size was calculated to be 81 subjects in both groups. The sample size was increased by 15% to address the possibility that the participants might leave the study without giving blood. The data were analyzed using SPSS for Windows version 16.0 (SPSS Inc.; Chicago, IL, USA).
Continuous variables are presented as means ± standard deviation (SD). The differences in continuous and categorical variables between groups were separately evaluated using ANOVA Bonferroni, and Kruskal Wallis Dunn tests. Covariance analysis for gender, BMI, and age was done by pairwise comparisons. The Pearson and Spearman correlation tests were used to evaluate the relationship between parameters in the analyses. Logistic regression analysis was used to determine the relationships between anti-inflammatory markers and Vit D levels in the DM group.
3. Results
In our study, Vit D levels were found to be higher in non-DM group compared to DM group (p = 0.001), and in preDM group compared to DM group (p = 0.014) (Table 1). While there was no significant difference in serum calcium levels, the Parathormone (PTH) level was found to be higher in the DM group compared to the preDM group due to the difference in Vit D levels (p = 0.034). Covariance analysis with age, gender, and BMI revealed that the Vit D levels of the DM group were significantly lower than those of the preDM and nonDM groups (p<0.003). Serum IL-1β, IL-6, IL-8, TNF-α, NF-κB, MAPK levels, and acute phase reactants such as CRP, fibrinogen, and ferritin were found to be statistically significantly higher in DM group than in nonDM group. Serum IL-1β, IL-6, TNF-α, NF-κB, MAPK levels, and CRP were found to be statistically significantly higher in preDM group than in nonDM group (Table 1). When the preDM group was compared with the DM group, TNF-α, NF-κB, MAPK levels, CRP, fibrinogen, and ferritin were found to be statistically significantly higher in DM group than in preDM group (Table 1).
When the comparison of subjects was made by the Vit D levels, FBG levels were found to be lower in those with normal Vit D levels than in those with deficient Vit D levels (p=0.00). Serum IL-1β, IL-6, IL-8, TNF-α, MAPK levels, and CRP were found to be statistically significantly lower in patients with normal Vit D levels compared to those with insufficient Vit D levels. Serum IL-1β, IL-6, IL-8, TNF-α, NF-κB, MAPK, and CRP were found to be statistically significantly lower in patients with normal Vit D levels compared to those with deficient Vit D levels. When the Vit D deficient group was compared with the Vit D insufficient group, IL-1β, IL-6, IL-8, TNF-α, and NF-κB were found to be statistically significantly higher in the Vit D deficient group (Table 2).
In the preDM group, IL-1β, IL-6, IL-8, TNF-α, and MAPK were found to be statistically significantly higher in those with Vit D insufficiency and deficiency compared to those with normal Vit D levels (Table 3). In this group, covariance analysis with age, gender, and BMI revealed that IL-1β was statistically significantly higher in Vit D insufficiency and deficiency groups compared to the normal Vit D group (p=0.048 and p=0.00); IL-6 and IL-8 were statistically significantly higher in the Vit D deficiency group compared to the normal Vit D group (p=0.00 and p=0.00) (Figure 1); TNF-α was statistically significantly higher in Vit D insufficiency and deficiency groups compared to the normal Vit D group (p=0.019 and p=0.00), and MAPK was statistically significantly higher in the Vit D deficiency group compared to the normal Vit D group (p=0.00). Covariance analysis of acute phase reactants with age, gender, and BMI did not reveal any statistical significance in the preDM group.
In the DM group, IL-1β, IL-6, IL-8, TNF-α, NF-κB, MAPK, and CRP were found to be statistically significantly higher in those with Vit D insufficiency and deficiency compared to those with normal Vit D levels (Table 4). In this group, covariance analysis with age, gender, and BMI revealed that IL-1β and IL-8 were statistically significantly higher in the Vit D deficiency group compared to the normal Vit D group (p=0.00 and p=0.004); IL-6 was statistically significantly higher in Vit D deficiency and insufficiency groups compared to the normal Vit D group (p=0.00 and p=0.044) (Figure 1); TNF- α was statistically significantly higher in Vit D insufficiency and deficiency groups compared to the normal Vit D group (p=0.002 and p=0.00); NF-κB was statistically significantly higher in the Vit D deficiency group compared to the normal Vit D group (p=0.009); and MAPK was statistically significantly higher in the Vit D deficiency group compared to the normal Vit D group (p=0.005). Covariance analysis of acute phase reactants with age, gender, and BMI did not reveal any statistical significance in the DM group.
The correlation analyses between groups revealed a statistically significant negative correlation between IL-1β, IL-6, IL-8, NF-κB, MAPK levels, and Vit D levels in all groups (Table 5). In addition, a significant negative correlation between CRP and Vit D levels existed in the diabetes group (r=0.258) (Table 5).
The logistic regression analysis revealed a statistically significant relationship between diabetes and age, low Vit D levels, high TNF-α, and high MAPK levels (Table 6).
4. Discussion
This study revealed that IL1-β, IL-6 and IL-8, TNF-α, NF-κB, MAPK levels as proinflammatory markers and CRP, fibrinogen and ferritin as serum acute phase reactants were significantly increased in prediabetes and T2DM groups compared to non-diabetes group (Table 1). In addition, TNF-α, NF-κB, MAPK levels, and acute phase reactants were significantly higher in the diabetes group compared to the prediabetes group. In both groups, covariance analysis with age, gender, and BMI revealed that those with deficient and insufficient serum Vit D levels had higher levels of cytokines and inflammatory markers than those with normal serum Vit D levels. Thus, we showed the effects of Vit D on the development of inflammation in both prediabetes and diabetes.
There are Vit D receptors on the β-cells of the pancreas and animal studies showed that insulin secretion is increased after the addition of 1,25(OH)2D3 to the medium [16, 17]. Increasing intracellular calcium also increases insulin secretion from these cells. Studies have shown an increased calcium-binding protein in these cells as evidence of this mechanism. On the other hand, Vit D deficiency causes secondary hyperparathyroidism, which in turn inhibits calcium-related insulin secretion [5]. In patients with T2DM and the general population, lower Vit D levels are associated with higher FBG, insulin resistance, and metabolic syndrome as revealed in the Amsterdam Longitudinal Aging study [18]. Since Vit D deficiency is associated with increased proinflammatory markers another mechanism leading to insulin resistance and diabetes is increased inflammation [1,2,17]. In addition, genetic polymorphisms of the Vit D receptor or Vit D binding protein (DBP) may predispose to T2DM. DBP polymorphisms were associated with higher fasting plasma insulin in a study conducted in Japan [16].
In the Women's Health Initiative Calcium and Vitamin D study, 33,951 postmenopausal women were randomized to receive 400 IU/day vitamin D3 and 1000 mg/day calcium or a double placebo for 7 years, and it was found that the risk of developing T2DM was reduced [19]. The improvement in insulin resistance occurs mostly when the serum 25-hydroxyvitamin D3 (25(OH)D3) level is 80 nmol/l and above [20]. In the 3rd National Health and Nutrition Evaluation Study, (NHANES III) conducted on 6228 individuals, 25(OH)D3 was found to protect against the development of T2DM above 81 nmol/l [21]. In the study conducted by Al-Ghadeer et al. in Saudi Arabia, hemoglobin A1c (HbA1c) was above 5.9 in 71.9% of those with Vit D deficiency, this rate was 25% in those with Vit D insufficiency, and only 2.2% in those with normal Vit D levels [22]. In our study, the FBG, HbA1c and insulin levels were higher in Vit D deficiency group compared to the normal Vit D group (Table 2). On the other hand, serum Vit D levels were found to be lower in the DM group compared to the nonDM group and preDM group (Table 1). While no significant difference was found in serum calcium levels, serum PTH levels were higher in the DM group compared to the preDM group (Table 1) indicating the results of lower Vit D levels in DM group.
High glucose concentrations activate reactive oxygen species (ROS) and NFκB pathways, inducing secretion of the inflammatory cytokine monocyte chemotactic protein-1 (MCP-1) and leukocyte interleukin-8 (IL-8). High serum MCP-1 and IL-8 levels accelerate the progression of diabetes. The randomized controlled study by Gu et al. in China showed that serum MCP-1 and IL-8 levels decreased in diabetics who took 400 IU of Vit D daily [23]. NFκB is also involved in the synthesis of genes of cytokines and promotes B lymphocyte maturation [12,13,14,15]. In our study, the correlation analyses between groups revealed a statistically significant negative correlation between IL-1β, IL-6, IL-8, NF-κB, MAPK levels, and Vit D levels in both DM and preDM groups (Table 5).
T2DM patients usually have significantly elevated serum ferritin levels or iron status, and people with high ferritin levels have a higher risk of developing T2DM. Excess iron intake, especially heme iron from red meat increases the risk of developing T2DM through oxidative damage to beta cells, and impaired hepatic glucose production suppression. Pancreatic β-cell iron uptake was believed to be facilitated by divalent metal transporter 1 (DMT1) and the DMT1 expression was regulated by NF-κB activity. The study by Zhao et al. in diabetic rats showed that Vit D could improve islet morphology and β-cell function by attenuating iron accumulation. These effects were attributed to the suppression of the NF-κB-DMT1 pathway as a result of vitamin D supplementation [24]. In our study, ferritin and NFκB levels were found to be lower in the DM group with normal Vit D levels compared to those with deficient Vit D levels, but no statistically significant correlation was found for ferritin levels. While plasma ferritin levels reflect iron stores, they are also determined by many other genetic and environmental factors. Therefore, it is possible that the relationship between ferritin and diabetes does not reflect changes in iron stores.
In a randomized controlled study conducted by El Hajj et al. in Lebanon, 88 diabetic patients who were not obese and had vitamin D deficiency or insufficiency, were randomly divided into two groups, and the study group were given 30,000 IU of cholecalciferol per week for six weeks. In the Vit D-given group, CRP and TNF-α levels were found to be significantly lower than in the placebo group. However, the difference between IL-6 levels was not found to be statistically significant [25]. Although the clear mechanism is not well understood, several explanations can be made for reducing circulating CRP with Vit D supplementation. It is known that NF-kB activation participates in the induction of endogenous CRP by increasing the effects of the signal transducer and activator of transcription-3 (STAT3) [26]. The biologically active form of Vit D can inhibit NF-kB activation by upregulating NF-kB inhibitor (IκB-α). Vit D also inhibits STAT3 expressions [27]. As a result, it was concluded that Vit D supplementation could suppress CRP via NF-κB and STAT3 signalling. In our study, the CRP and TNF-α levels were significantly higher in the Vit D deficiency and the Vit D insufficiency groups compared to normal Vit D group (Table 2).
In a cross-sectional study conducted by Zhang et al., 199 prediabetes patients were compared with 259 normal patients. CRP levels were found to be higher in the prediabetes group with Vit D deficiency and insufficiency, but no statistically significant differences were found between IL-6 and TNF-α value [1]. In our study, TNF-α and IL-6 levels in both preDM and DM groups were found to be statistically significantly higher in patients with Vit D deficiency and insufficiency compared to normal ones (Table 3 and Table 4). CRP levels were significantly higher in the preDM and DM groups compared to nonDM group (Table 1).
The effects of Vit D may also be by targeting MAPK signalling pathways and signalling of proinflammatory mediators may result from the activation of MAPK. The study by Ding et al. investigated the effects of Vit D on macrophage-mediated inflammatory responses in cultured human adipocytes, particularly its signalling pathways [11]. Macrophage-conditioned (MC) medium (with 25% adipocyte medium) markedly inhibited the NFκB inhibitor kB-α (IkB-α) protein expression and increased the NFκB levels. The addition of 1,25(OH)2D3 to the medium increased IκB-α expression and decreased NFκB phosphorylation. Thus, macrophage-induced activation of NFκB signalling was inhibited. 1,25(OH)2D3 can also blunt MAPK signal by downregulation of phosphorylated p38 MAPK and phosphorylated ERK 1/2 which are the conventional MAPKs [11]. Several studies have suggested a positive regulatory role of the ERK1/2 signalling module in glucose stimulated insulin secretion in pancreatic β-cells [28]. In our study, serum MAPK levels were found to be statistically significantly higher in the Vit D deficient and insufficient groups compared to normal Vit D group in both preDM and DM groups (Table 3 and Table 4). The fact that Vit D exerts its effects on proinflammatory markers IL1-β, IL-6 and TNF-α targeting NF-κB and MAPK signalling pathways may be the reason for higher levels of NF-κB and MAPK in preDM and DM groups with deficient and insufficient Vit D levels in our study.
Limitations of the Study
The study has strengths as well as weaknesses. First, all participants in the study were selected from a single province and the population was underrepresented. Because this was a cross-sectional investigation, it was unable to conclude the logistic regression analysis revealed a relationship between diabetes and all inflammatory parameters. The study was based on a single blood measurement, which may not accurately represent the concentrations of circulating inflammatory parameters throughout time, and serum IL-1β, IL-6, IL-8, TNF-α, NF-κB and MAPK levels should be assessed at different stages to better understand its function in the pathogenesis of T2DM. As a result, a large-scale, prospective study with a high sample size might be done in the future to confirm the link between blood levels of proinflammatory parameters, and the initiation of prediabetes and T2DM.
5. Conclusions
In conclusion, Vit D levels affect the development of inflammation in both prediabetes and T2DM. Since it is known that chronic inflammation can lead to the development of diabetic complications, the role of Vit D supplements in preventing this is an important issue that needs to be investigated..
Author Contributions
Conceptualization: A.K.F., H.U., N.T.S., M.S.G., H.M.O. and P.A.; statistical analysis: A.K.F. and G.C.; investigation: A.K.F., M.S.G., N.T.S., E.T., Z.K. and H.M.O; methodology: A.K.F., M.S.G., H.U. G.C., N.T.S. and H.M.O.; project administration: A.K.F. and H.U.; supervision: A.K.F., M.S.G. and N.T.S.; writing original draft: A.K.F.; writing review and editing: H.U., and G.C. All authors have read and agreed to the published version of the manuscript.
Funding
This study was supported by The Research Fund of Istanbul University-Cerrahpasa (Project No. BAP, 34373).
Institutional Review Board Statement
The Ethics Committee of Istanbul University-Cerrahpasa, Cerrahpasa Medical Faculty (approval date and number 16.04.2020-54969), approved the study. This study was conducted according to the Declaration of Helsinki.
Informed Consent Statement
Written informed consent was obtained from all volunteers in this study.
Data Availability Statement
The datasets used and/or analyzed during the current study are available from the corresponding author upon reasonable request.
Acknowledgments
The authors thank the research volunteers for their participation in this study.
Conflicts of Interest
We declare that we have no competing interests or conflicts of interest.
References
- Zhang M, Gao Y, Tian L, Zheng L, Wang X, Liu W, Zhang Y, Huang G. Association of serum 25-hydroxyvitamin D3 with adipokines and inflammatory marker in persons with prediabetes mellitus. Clin Chim Acta. 2017;468:152-158. [CrossRef]
- Hoseini R, Rahim HA, Ahmed JK. Concurrent alteration in inflammatory biomarker gene expression and oxidative stress: how aerobic training and vitamin D improve T2DM. BMC Complementary Medicine and Therapies 2022;22:165. [CrossRef]
- Wang SY, Shen TT, Xi BL, Shen Z, Zhang X. Vitamin D affects the neutrophil-to-lymphocyte ratio in patients with type 2 diabetes mellitus. J Diabetes Investig. 2021;12(2):254–65. [CrossRef]
- Bhat MH, Mohd M, Dar IH, Bhat JA. Role of vitamin D deficiency in type 2 diabetes: association or coincidence? Clin Diabetol. 2021;10(2):188–94.
- Nachankar A, Kotwal N, Upreti V, Verma V, Kumar KH. Association of vitamin D and parathyroid hormone with insulin sensitivity, beta cell function and gestational diabetes in pregnancy: a cross-sectional, observational study. Diabetes Ther. 2018;9(5):2081–90. [CrossRef]
- Cigolini M, Iagulli MP, Miconi V, Galiotto M, Lombardı S, Targher G. Serum 25-hydroxyvitamin D3 concentrations and prevalence of cardiovascular disease among Type 2 diabetic patients. Diab Care. 2006;29(3):722-724.
- Gursoy G, Cimbek A, Kirnap NG, Acar Y, Evrin N, Gungor A, Alkan S. Relation of serum 25 hydroxy vitamin D3 levels with nephropathy in type 2 diabetic patients. Turkiye Klinikleri J Endocrin. 2013;8(2):47-51.
- Sugden JA, Davies JI, Witham MD, Morris AD, Struthers AD. Vitamin D improves endothelial function in patients with Type 2 diabetes mellitus and low vitamin D levels. Diabetic Medicine. 2008;25:320–325. [CrossRef]
- Roffe-Vazquez DN, Huerta-Delgado AS, Castillo EC, Villarreal-Calderón JR, Gonzalez-Gil AM, Enriquez C, Garcia-Rivas G, Elizondo-Montemayor L. Correlation of Vitamin D with Inflammatory Cytokines, Atherosclerotic Parameters, and Lifestyle Factors in the Setting of Heart Failure: A 12-Month Follow-Up Study. Int. J. Mol. Sci. 2019;20:5811. [CrossRef]
- Ao T, Kikuta J, Ishii M. The Effects of Vitamin D on Immune System and Inflammatory Diseases. Biomolecules 2021;11:1624. [CrossRef]
- Ding C, Wilding JP, Bing C. 1,25-dihydroxyvitamin D3 protects against macrophage-induced activation of NFkappaB and MAPK signalling and chemokine release in human adipocytes. PLoS One. 2013;8:e61707. [CrossRef]
- Serasanambati M, Chilakapati SR. Function of Nuclear Factor kappa B (NF-kB) in human diseases-A Review. South Indian Journal Of Biological Sciences. 2016;2(4);368-387.
- Zhang, L, Zhao, J, Gurkar, A, Niedernhofer, L.J, Robbins, P.D, Methods to quantify the NF-κB pathway during senescence, Methods in Molecular Biology, 2019;1896:231-250.
- Jimi, E, Fei, H, Nakatomi, C. NF-κB signalling regulates physiological and pathological chondrogenesis, International Journal of Molecular Science, 2019, 20(24), 6275.
- Guldenpfennig C, TeixeiroE, Daniels M. NF-kB’s contribution to B cell fate decisions. Front. Immunol. 2023;14:1214095.
- Takiishi T, Gysemans C, Bouillon R, Mathieu C. Vitamin D and diabetes, Endocrinol Metab Clin N Am. 2010;39:419–446.
- Lips P, Eekhoff M, Van Schoor N, Oosterwerff M, Jongh R, Krul-Poel Y, Simsek S. Vitamin D and type 2 diabetes. Journal of Steroid Biochemistry & Molecular Biology. 2017;173:280–285.
- Oosterwerff MM, Eekhoff EMW, Heymans MW, Lips P, Van Schoor NM. Serum 25-hydroxyvitamin D levels and the metabolic syndrome in older persons: a population-based study. Clin Endocrinol. 2011;75: 608–613. [CrossRef]
- Boer, IH. , Tinker L.F., Connelly S., Curb J.D., Howard BV, Kestenbaum B, Larson JC, Manson JE, Margolis KL, Sisdovick DS, Weiss NS. Calcium plus vitamin D supplementation and the risk of incident diabetes in the Women’s Health Initiative, Diab Care. 2016;31:701–707. [CrossRef]
- Von Hurst PR, Stonehouse W, Coad J. Vitamin D supplementation reduces insulin resistance in South Asian women living in New Zealand who are insulin resistant and vitamin D deficient – a randomized, placebo-controlled trial, Br J Nutr. 2010;103:549–555.
- Scragg R, Sowers MF, Bell C. Serum 25-hydroxyvitamin D, diabetes, and ethnicity in the third national health and nutrition examination survey, Diab Care. 2004;27:2813–2818. [CrossRef]
- Al Ghadeer HA, AlRamadan MS, Al Amer MM, Alshawaf MJ, Alali FJ, Bubshait AA, Alramadhan MA, Almurayhil Z, Aldandan NS, AlKhamis MA, AlHaddad HA, AlOmair A. Vitamin D Serum Levels in Type 2 Diabetic Patients: A Cross-Sectional Study. Cureus. 2022;14(2):e22558.
- Gu JC, Wu YG, Huang WG, Fan XJ, Chen XH, Zhou B, Lin ZJ, Feng XL. Effect of vitamin D on oxidative stress and serum inflammatory factors in the patients with type 2 diabetes. J Clin Lab Anal. 2022;36:e24430. [CrossRef]
- Zhao, Y. , Mei G., Zhou F., Kong B., Chen L, Chen H. Vitamin D decreases pancreatic iron overload in type 2 diabetes through the NF- κB-DMT1 pathway. Journal of Nutritional Biochemistry. 2022;99:108870.
- El Hajj C, Walrand S, Helou M, Yammine K. Effect of vitamin D supplementation on inflammatory markers in non-obese lebanese patients with type 2 diabetes: A randomized controlled trial. Nutrients. 2020;12:2033. [CrossRef]
- Agrawal A, Cha-Molstad H, Samols D, Kushner I. Overexpressed nuclear factor kappa B can participate in endogenous C-reactive protein induction, and enhances the effects of C/EBPbeta and signal transducer and activator of transcription-3, Immunology. 2003;108:539–547.
- Song Y, Hong J, Liu D, Lin Q, Lai G. 1,25-Dihydroxyvitamin D3 inhibits nuclear factor kappa B activation by stabilizing inhibitor IκBα via mRNA stability and reduced phosphorylation in passively sensitized human airway smooth muscle cells. Scand J Immunol. 2013;77:109–116. [CrossRef]
- Sidarala V, Kowluru A. The Regulatory Roles of Mitogen-Activated Protein Kinase (MAPK) Pathways in Health and Diabetes: Lessons Learned from the Pancreatic β-cell. Recent Patents on Endocrine, Metabolic & Immune Drug Discovery 2016;10:76-84. [CrossRef]
Figure 1.
Distribution of IL-6 values by Vit D levels in all groups.
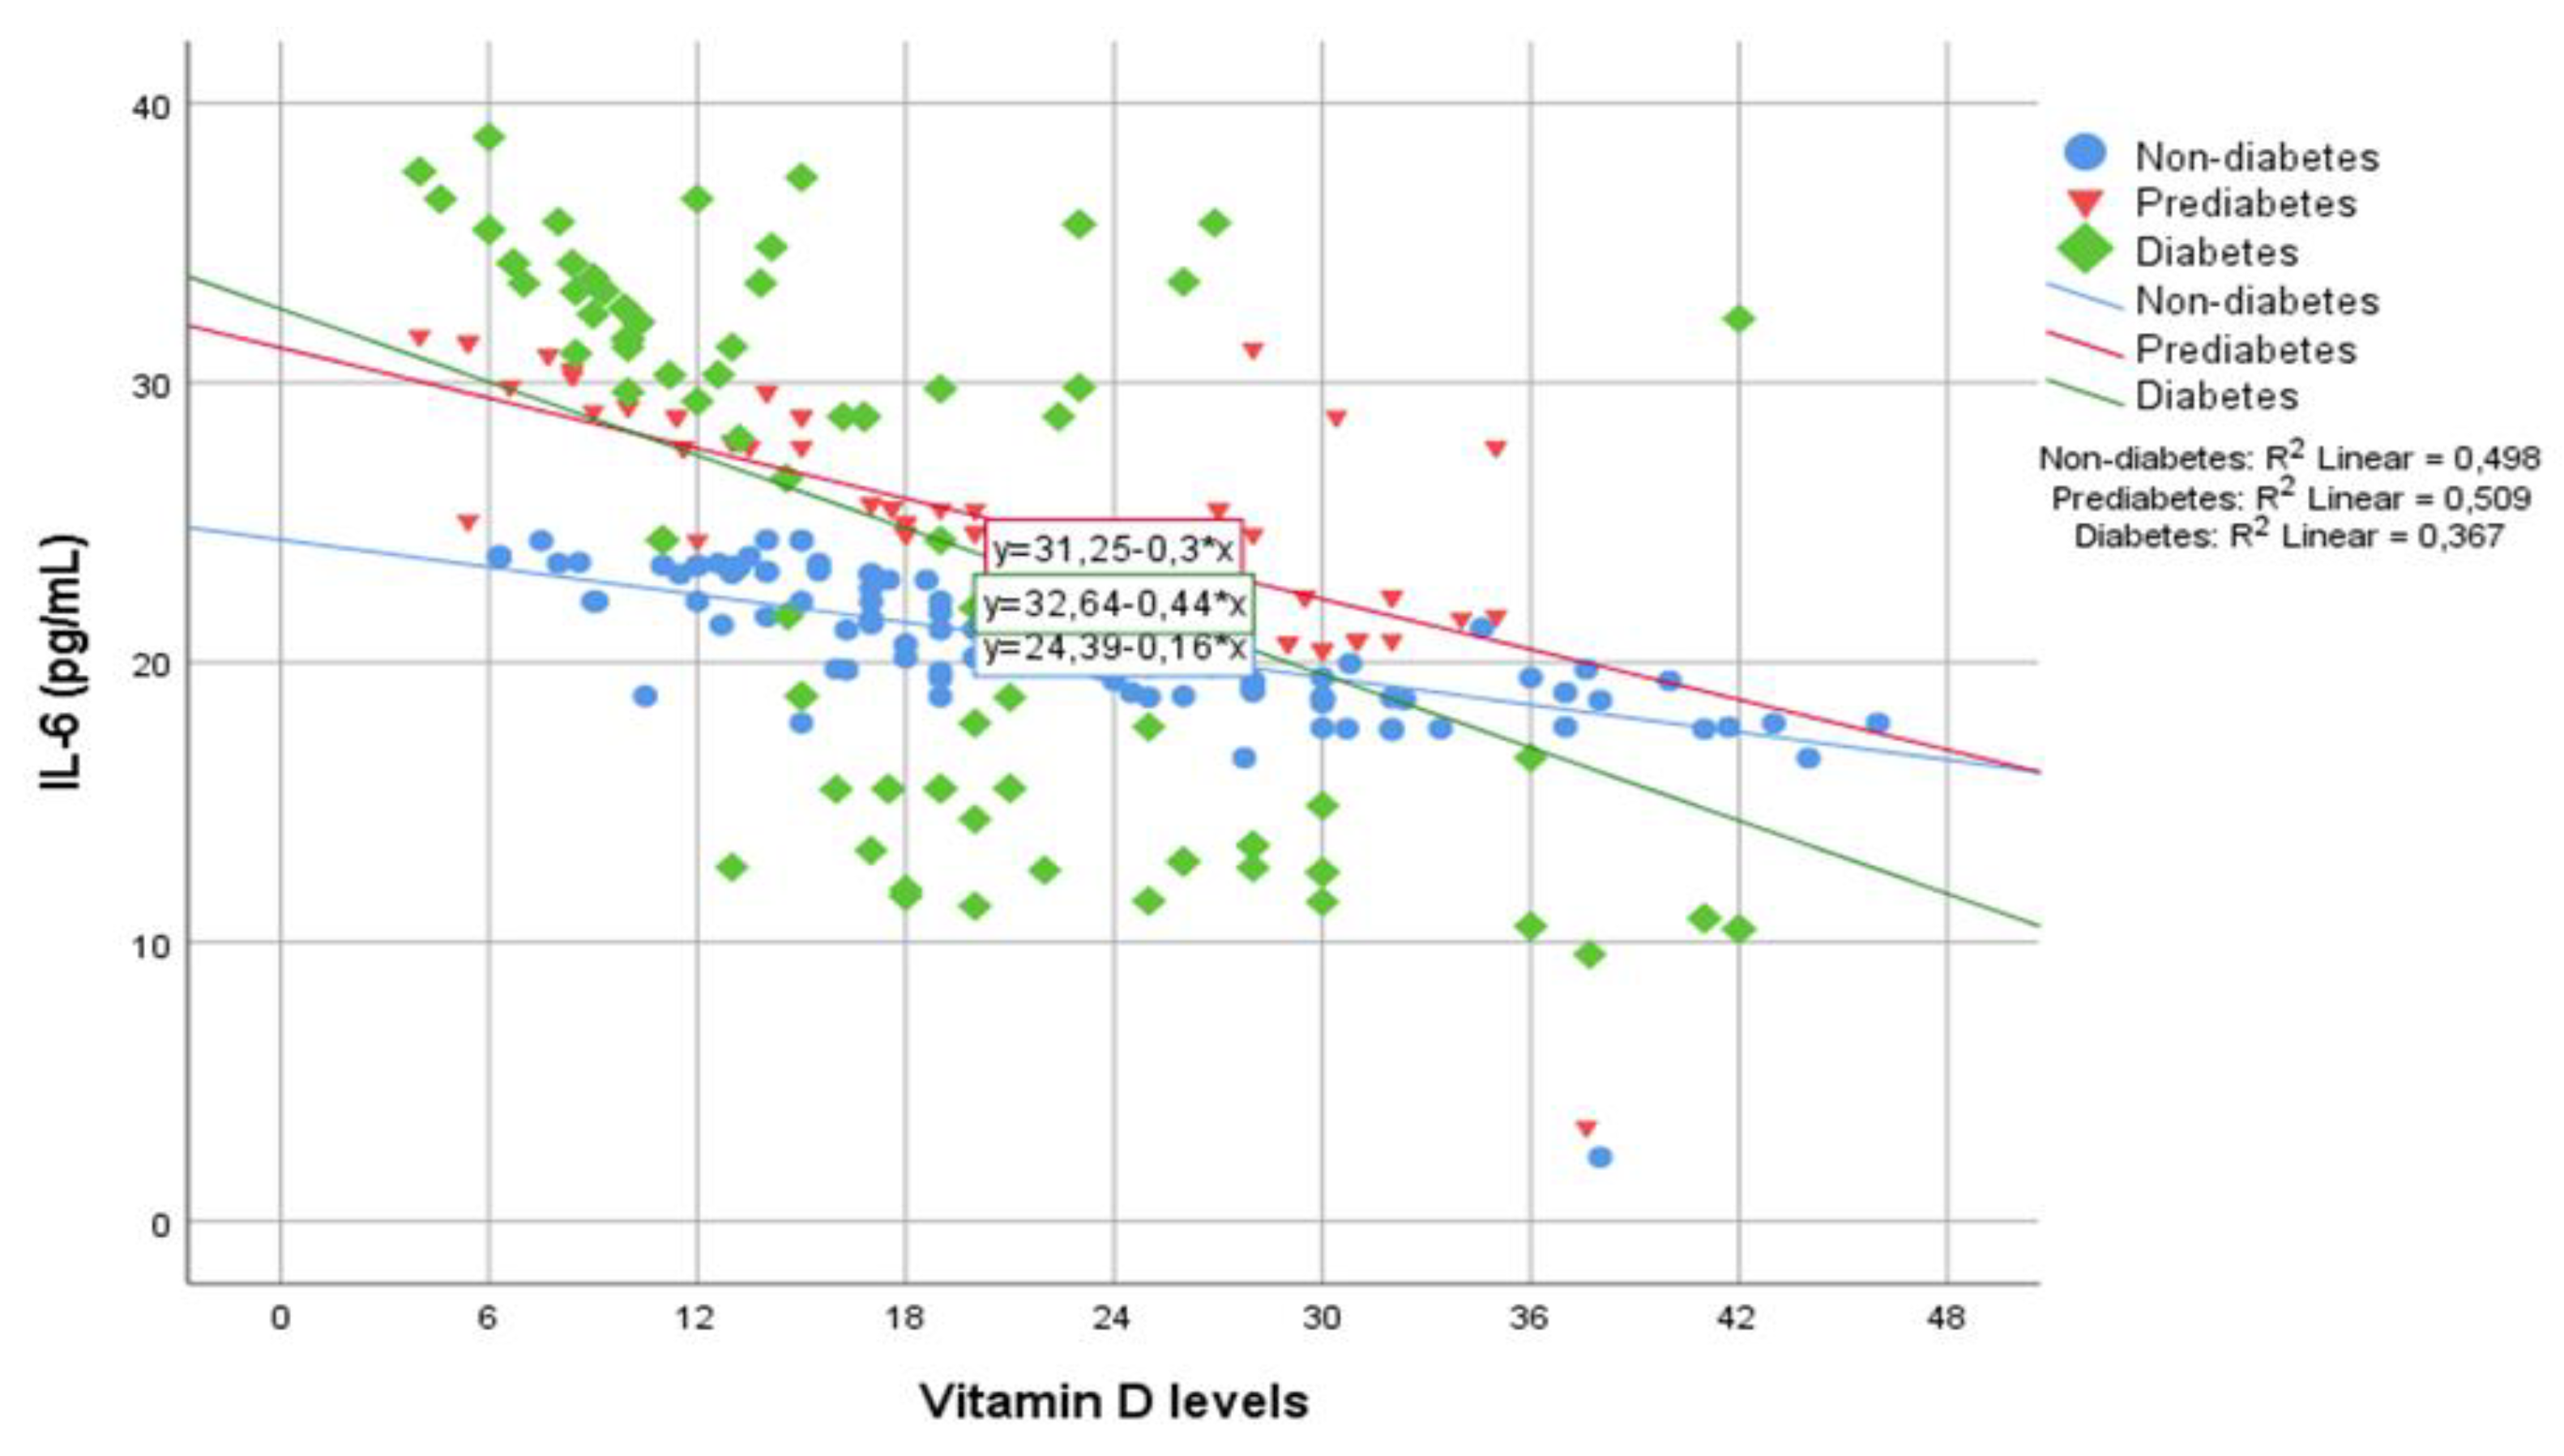

Table 1.
Distribution of Vit D levels, proinflammatory markers and other parameters between groups.
| Non-diabetes (NonDM) (n = 113) |
Prediabetes (PreDM) (n = 84) |
Diabetes (DM) (n = 94) |
P values | ||||||
|---|---|---|---|---|---|---|---|---|---|
| Mean | SD | Mean | SD | Mean | SD | NonDM vs PreDM | NonDM vs DM | PreDM vs DM | |
| Age (years) | 36.54 | 10.48 | 44.75 | 9.76 | 50.08 | 9.34 | <0.001 | <0.001 | 0.001 |
| BMI (kg/m2) | 25.85 | 5.52 | 28.88 | 5.55 | 29.34 | 4.82 | <0.001 | <0.001 | 1.00 |
| Waist circumference (cm) | 85.97 | 13.33 | 95.86 | 12.64 | 102.99 | 16.08 | <0.001 | <0.001 | 0.003 |
| 25(OH)D3 level (ng/mL) | 23.81 | 12.33 | 21.55 | 9.78 | 19.35 | 13.36 | 0.503 | 0.001 | 0.014 |
| Calcium (mg/dL) | 9.29 | 0.35 | 9.27 | 0.51 | 9.29 | 0.41 | 0.684 | 0.965 | 0.727 |
| PTH (pg/mL) | 36.91 | 15.28 | 35.64 | 16.39 | 47.66 | 38.07 | 0.534 | 0.111 | 0.034 |
| IL-1β (pg/mL) | 25.58 | 4.97 | 33.87 | 4.71 | 32.75 | 12.97 | <0.001 | <0.001 | 0.138 |
| IL-6 (pg/mL) | 20.48 | 2.86 | 24.79 | 4.10 | 24.20 | 9.62 | <0.001 | <0.001 | 0.096 |
| IL-8 (pg/mL) | 46.08 | 7.24 | 50.21 | 13.14 | 56.14 | 17.13 | 0.247 | <0.001 | 0.250 |
| TNF-α (pg/mL) | 29.68 | 3.78 | 37.98 | 5.01 | 44.24 | 7.55 | <0.001 | <0.001 | <0.001 |
| NFκB (ng/mL) | 0.48 | 0.08 | 0.54 | 0.11 | 0.70 | 0.22 | 0.011 | <0.001 | <0.001 |
| MAPK (pg/mL) |
160.53 | 22.20 | 194.60 | 27.70 | 230.88 | 30.99 | <0.001 | <0.001 | <0.001 |
| CRP (mg/L) | 1.89 | 1.96 | 3.28 | 4.14 | 5.37 | 6.35 | 0.007 | <0.001 | 0.007 |
| Fibrinogen (mg/dL) | 304.86 | 76.30 | 323.18 | 63.28 | 366.97 | 97.82 | 0.86 | <0.001 | 0.019 |
| Ferritin (ng/mL) | 76.21 | 71.73 | 78.66 | 79.04 | 116.74 | 99.91 | 0.912 | 0.003 | 0.005 |
NonDM: Non-diabetes mellitus, preDM: prediabetes, DM: Diabetes Mellitus, BMI: Body mass index, 25(OH)D3: 25-hydroxyvitamin D3, PTH: Parathyroid Hormone, IL-1β: interleukin-1β, IL-6: interleukin-6, IL-8: interleukin-8, TNF-α: tumour necrosis factor-α, NF-κB: nuclear factor kappa-B, MAPK: mitogen-activated protein kinase, CRP: C-reactive protein. P < 0.05 values are shown in bold. ANOVA Bonferroni, and Kruskal Wallis Dunn tests were used.
Table 2.
Distribution of proinflammatory markers and other biochemical parameters by Vit D levels.
| Vit D deficiency (<20 ng/mL) (n = 142) |
Vit D insufficiency (20-30 ng/mL) (n = 88) |
Normal Vit D (≥30 ng/mL) (n = 61) |
P values | ||||||
|---|---|---|---|---|---|---|---|---|---|
| Mean | SD | Mean | SD | Mean | SD | Normal vit D vs Vit D Ins. | Normal vit D vs Vit D Def. | Def vs Vit D Ins. | |
| FBG (mg/dL) | 128.24 | 75.64 | 106.32 | 58.17 | 94.83 | 34.20 | 0.066 | <0.001 | 0.195 |
| Hemoglobin A1c (%) | 6.94 | 2.27 | 7.35 | 9.88 | 6.18 | 1.53 | 0.268 | 0.046 | 0.383 |
| Insulin (µIU/mL) | 15.09 | 9.79 | 13.98 | 7.83 | 13.25 | 14.77 | 0.540 | 0.001 | 0.012 |
| IL-1β (pg/mL) | 34.94 | 8.49 | 27.86 | 6.58 | 22.57 | 7.47 | <0.001 | <0.001 | 0.002 |
| IL-6 (pg/mL) | 26.09 | 5.94 | 21.52 | 4.77 | 17.32 | 5.20 | <0.001 | <0.001 | <0.001 |
| IL-8 (pg/mL) | 57.11 | 13.01 | 46.67 | 10.05 | 40.23 | 10.15 | <0.001 | <0.001 | 0.002 |
| TNF-α (pg/mL) | 40.10 | 7.90 | 35.66 | 6.05 | 30.50 | 8.27 | <0.001 | <0.001 | 0.002 |
| NFκB (ng/mL) | 0.61 | 0.19 | 0.56 | 0.14 | 0.47 | 0.15 | 0.132 | <0.001 | 0.002 |
| MAPK (pg/mL) | 210.96 | 32.19 | 182.15 | 28.11 | 165.84 | 50.25 | <0.001 | <0.001 | 0.177 |
| CRP (mg/L) | 4.29 | 5.548 | 2.39 | 2.642 | 2.84 | 4.201 | 0.005 | 0.007 | 0.771 |
| Fibrinogen(mg/dL) | 344.66 | 91.78 | 316.26 | 73.15 | 315.93 | 77.79 | 0.055 | 0.105 | 0.959 |
| Ferritin(ng/mL) | 98.95 | 90.96 | 79.85 | 81.05 | 83.60 | 77.38 | 0.108 | 0.253 | 0.797 |
Vit D: vitamin D, Ins.: insufficiency, Def: deficiency, FBG: Fasting blood glucose, IL-1β: interleukin-1β, IL-6: interleukin-6, IL-8: interleukin-8, TNF-α: tumour necrosis factor-α, NF-κB: nuclear factor kappa-B, MAPK: mitogen-activated protein kinase, CRP: C-reactive protein. P < 0.05 values are shown in bold. Kruskal Wallis Dunn test was used.
Table 3.
Distribution of inflammation markers and acute phase reactants by Vit D levels in the prediabetes group.
Table 3.
Distribution of inflammation markers and acute phase reactants by Vit D levels in the prediabetes group.
| Vit D deficiency (<20 ng/mL) (n = 35) |
Vit D insufficiency (20-30 ng/mL) (n = 34) |
Normal Vit D (≥30 ng/mL) (n = 15) |
P values | ||||||
|---|---|---|---|---|---|---|---|---|---|
| Mean | SD | Mean | SD | Mean | SD | Normal Vit D vs Vit D Ins. | Normal Vit D vs Vit D def. | Vit D Def vs Vit D Ins. | |
| IL-1β (pg/mL) | 36.71 | 2.49 | 32.83 | 2.46 | 29.29 | 7.83 | <0.001 | <0.001 | 0.636 |
| IL-6 (pg/mL) | 27.88 | 2.31 | 23.24 | 2.09 | 20.83 | 5.69 | <0.001 | <0.001 | 0.503 |
| IL-8 (pg/mL) | 58.22 | 12.25 | 45.87 | 8.16 | 40.72 | 14.43 | <0.001 | <0.001 | 0.545 |
| TNF-α (pg/mL) | 40.80 | 2.40 | 37.20 | 1.63 | 32.83 | 9.23 | <0.001 | <0.001 | 0.396 |
| NFκB (ng/mL) | 0.56 | 0.09 | 0.55 | 0.08 | 0.48 | 0.19 | 0.970 | 0.085 | 0.115 |
| MAPK (pg/mL) | 212.05 | 15.76 | 185.35 | 11.76 | 173.42 | 48.11 | <0.001 | <0.001 | 0.849 |
| CRP (mg/L) | 3.66 | 3.44 | 2.86 | 3.37 | 3.36 | 6.90 | 0.432 | 0.825 | 0.706 |
| Fibrinogen (mg/dL) | 331.94 | 67.29 | 316.62 | 59.05 | 317.21 | 64.88 | 0.320 | 0.466 | 0.977 |
| Ferritin (ng/mL) | 96.92 | 87.22 | 52.74 | 60.10 | 96.76 | 86.26 | 0.028 | 0.988 | 0.14 |
Vit D: vitamin D, Ins.: insufficiency, Def: deficiency, IL-1β: interleukin-1β, IL-6: interleukin-6, IL-8: interleukin-8, TNF-α: tumour necrosis factor-α, NF-κB: nuclear factor kappa-B, MAPK: mitogen-activated protein kinase, CRP: C-reactive protein. P < 0.05 values are shown in bold. Kruskal Wallis Dunn test was used.
Table 4.
Distribution of inflammation markers and acute phase reactants by Vit D levels in the diabetes group.
Table 4.
Distribution of inflammation markers and acute phase reactants by Vit D levels in the diabetes group.
| Vit-D deficiency (<20 ng/mL) (n = 57) |
Vit-D insufficiency (20-30 ng/mL) (n = 22) |
Normal Vit-D (≥30 ng/mL) (n = 15) |
P values | ||||||
|---|---|---|---|---|---|---|---|---|---|
| Mean | SD | Mean | SD | Mean | SD | Normal vit D vs Ins. | Normal vit D vs def. | Def vs Ins. | |
| IL-1β (pg/mL) | 38.74 | 10.946 | 25.99 | 9.712 | 19.02 | 9.218 | <0.001 | <0.001 | 0.540 |
| IL-6 (pg/mL) | 28.33 | 7.958 | 20.41 | 8.760 | 13.37 | 5.785 | 0.014 | <0.001 | 0.033 |
| IL-8 (pg/mL) | 61.59 | 16.061 | 51.19 | 16.571 | 41.70 | 11.251 | 0.013 | <0.001 | 0.168 |
| TNF-α (pg/mL) | 47.26 | 5.203 | 42.54 | 5.179 | 34.64 | 9.998 | 0.002 | <0.001 | 0.047 |
| NFκB (ng/mL) | 0.76 | 0.215 | 0.67 | 0.197 | 0.52 | 0.212 | 0.139 | <0.001 | 0.011 |
| MAPK (pg/mL) | 241.21 | 16.278 | 218.95 | 16.491 | 207.58 | 62.651 | <0.001 | 0.007 | 0.602 |
| CRP (mg/L) | 6.79 | 7.446 | 2.60 | 1.816 | 3.93 | 4.217 | 0.01 | 0.095 | 0.786 |
| Fibrinogen (mg/dL) | 379.07 | 107.85 | 351.18 | 82.635 | 342.50 | 69.801 | 0.775 | 0.638 | 0.971 |
| Ferritin (ng/mL) | 117.41 | 101.36 | 130.42 | 109.02 | 93.64 | 80.777 | 0.616 | 0.432 | 0.291 |
Vit D: vitamin D, Ins.: insufficiency, Def: deficiency, IL-1β: interleukin-1β, IL-6: interleukin-6, IL-8: interleukin-8, TNF-α: tumour necrosis factor-α, NF-κB: nuclear factor kappa-B, MAPK: mitogen-activated protein kinase, CRP: C-reactive protein. P < 0.05 values are shown in bold. Kruskal Wallis Dunn test was used.
Table 5.
Intergroup correlation analysis of inflammation markers according to Vit D levels.
| Vitamin D levels | ||||||
|---|---|---|---|---|---|---|
| NonDM (n = 113) |
PreDM (n = 84) |
DM (n = 94) |
||||
| r | p value | r | p value | r | p value | |
| IL-1β (pg/mL) | -0.693*** | <0.001 | -0.589*** | <0.001 | -0.629*** | <0.001 |
| IL-6 (pg/mL) | -0.706*** | <0.001 | -0.714*** | <0.001 | -0.605*** | <0.001 |
| IL-8 (pg/mL) | -0.708*** | <0.001 | -0.669*** | <0.001 | -0.444*** | <0.001 |
| TNF-α (pg/mL) | -0.493*** | <0.001 | -0.620*** | <0.001 | -0.588*** | <0.001 |
| NFκB (ng/mL) | -0.198* | 0.036 | -0.230* | 0.036 | -0.379*** | <0.001 |
| MAPK (pg/mL) | -0.624*** | <0.001 | -0.551*** | <0.001 | -0.434*** | <0.001 |
| CRP (mg/L) |
0.000 | 0.997 | -0.100 | 0.368 | -0.258* | 0.012 |
| Fibrinogen(mg/dL) | -0.146 | 0.126 | -0.102 | 0.357 | -0.162 | 0.12 |
| Ferritin (ng/mL) |
0.064 | 0.510 | -0.104 | 0.359 | -0.057 | 0.596 |
*p<0.05 **p<0.01 ***p<0.001; Pearson and Spearman correlation tests were used. NonDM: Non-diabetes mellitus, preDM: prediabetes, DM: Diabetes Mellitus, IL-1β: interleukin-1β, IL-6: interleukin-6, IL-8: interleukin-8, TNF-α: tumour necrosis factor-α, NF-κB: nuclear factor kappa-B, MAPK: mitogen-activated protein kinase, CRP: C-reactive protein.
Table 6.
The regression analysis for diabetes group.
| 95% C.I | ||||
|---|---|---|---|---|
| Sig. | Exp(B) | Lower | Upper | |
| Age (years) | 0.005 | 1.144 | 1.041 | 1.258 |
| 25(OH)D3 level (ng/mL) | 0.049 | 1.081 | 1.000 | 1.169 |
| TNF-α (pg/mL) | 0.02 | 1.326 | 1.046 | 1.680 |
| MAPK (pg/mL) | 0.016 | 1.057 | 1.010 | 1.105 |
| Constant | <0.001 | <0.001 | ||
25(OH)D3: 25-hydroxyvitamin D, TNF-α: tumour necrosis factor-α, MAPK: mitogen-activated protein kinase.
Disclaimer/Publisher’s Note: The statements, opinions and data contained in all publications are solely those of the individual author(s) and contributor(s) and not of MDPI and/or the editor(s). MDPI and/or the editor(s) disclaim responsibility for any injury to people or property resulting from any ideas, methods, instructions or products referred to in the content. |
© 2023 by the authors. Licensee MDPI, Basel, Switzerland. This article is an open access article distributed under the terms and conditions of the Creative Commons Attribution (CC BY) license (http://creativecommons.org/licenses/by/4.0/).
Copyright: This open access article is published under a Creative Commons CC BY 4.0 license, which permit the free download, distribution, and reuse, provided that the author and preprint are cited in any reuse.


