Submitted:
03 October 2023
Posted:
04 October 2023
You are already at the latest version
Abstract
Smart grids are seeing an increase in renewable energy and an enormous introduction of advanced power electronics, increasing the number of disturbance sources. This requires improving the accuracy of measurement systems capable of acquiring data for use in power system monitoring applications. Rogowski Coils (RCs) and Merging Units (MUs) are being widely deployed in controlling, metering, and monitoring of digital power systems. Because the performance of digital measurement devices has a direct influence on power measurement accuracy, it is critical to perform a laboratory calibration of these measurement instruments before they are installed in any project. To determine the magnitude and phase displacement errors of the RC+MU under normal and abnormal operating conditions, this article presents a comprehensive laboratory digital calibration system constructed from precise, readily available commercial products such as a fluxgate current transducer and a National Instrument. In addition, the analysis of measurement chain is affected by sources of uncertainty is discussed. The tests yield findings that are consistent with the relevant standards.
Keywords:
Low-Power Current Transformer
; Rogowski Coil
; Merging Unit
; IEC 61850-9-2
; Precision Time Protocol
; Calibration procedure
1. Introduction
Advanced technologies such as digital technologies, communication systems, and standards have all laid the way for the upgrade of power systems to smart grids, which is playing a role in the development of fault detection, measurement, and control applications to meet the demands of the modern era [1]. Reliability and safety are increasingly dependent on the accuracy and speed of directly measuring electrical quantities (current, voltage, frequency, etc.).
To successfully manage and control power systems, smart grids create an integrated distribution control system based on smart sensors and electronic devices rather than traditional approaches based on iron core instrument transformers and electromechanical switches of copper wire [2].
Smart grid sensors provide accurate and reliable data to measure, monitor, protect, and manage the network in real time. These sensors have been employed in Medium Voltage (MV) smart substations to transform primary high voltage/high current to a few volts/mA. As a consequence of the relatively low output power of these sensors, Analogue-to-Digital Converter (ADC) based measurement and protection systems can directly acquire the voltage/current without the use of voltage dividers/current shunts, which are typically used to reduce the Voltage Transformer (VT)/Current Transformer (CT) output to a level suitable for the ADCs, which can complicate measurement setups and potentially lower overall accuracy. Furthermore, measuring and controlling the voltage/current supplied by these sensors is the basis for assessing power quality [3].
Low Power Current Transformers (LPCTs) are a novel type of smart sensor that is being widely implemented in the MV smart grid to transmit digital current data directly from cables to monitoring, protection, and management systems.
LPCTs vary according to their working principle, which includes but is not limited to Rogowski coils, fluxgates, and shunt resistors.
Due to its flexibility, high linearity, smaller size and weight, and higher bandwidth, the Rogowski coil is an excellent choice for power quality and smart grid applications. This makes it distinct from other types of LPCT that require opening the current circuit to install the sensor or that consume a lot of power for sensor feedback. RC is a sensor with good properties, such as strong electrical insulation, non-magnetic saturation, excellent linearity, and high bandwidth. At medium voltage, the RC located around the wire sends an analog signal to the processing unit located on the ground through an optical fiber/Ethernet cable [1].
The digital substation currently uses LPCT with digital output that has a communication interface or is incorporated with MU. Low Power Instrument Transformer (LPIT) is used in conjunction with MU as measuring tools in upgraded MV network monitoring systems because of its high flexibility and low cost.
The MU is an implementation of IEC 61850 at the process level; its primary purpose is to digitize the voltage/current output of transformers (LPCT/LPVT) and to deliver these outputs as time-stamped sampled values (SV) to the necessary protective and measuring equipment through an Ethernet network called the process bus [4]. The Ethernet network differs substantially from the copper network in that it can incorporate several independent SVs from all IEDs in a bay. A process bus, according to IEC 61850-9-2, is a means of communication for digital signals that have been accurately time-synchronized and encoded in packets of data with timestamps.
Although the RC is flexible, light, non-contact, and can measure small and large currents, its measurement accuracy is affected by ambient temperature, primary conductor centering, and the presence of high-frequency external disturbances. Therefore, it is necessary to calibrate the RC according to real measurement conditions. The calibration process seeks to identify sensor errors (e. g., ratios and phase errors) in various measurement settings to enhance sensor performance in measurement and protection operations, therefore avoiding operational delays, improper protective operation, and exposing facilities and people to risk.
Moreover, the calibration of the sensor with digital output needs to take into account an evaluation of the MU performance specifications [4]. For optimal performance, stability, and dependability, measuring equipment must be calibrated in regular intervals according to international/national standards [5]. To have a high-accuracy measurement chain performance monitoring system, the LPCTs calibration system must be correctly constructed before being put into operation.
First, the calibration of LPCT for current measurements and related instrumentation is extensively described in [1]. It is typically possible to determine the ratio error and phase error of the LPCT during the traditional calibration procedure by comparing the output of the transformer under test with that of the reference transformer after applying the same excitation current to the primaries of the two transformers. The calibration process is usually performed by various comparators.
References [6,7,8,9] present a calibration method based on the comparison between the two outputs of the two transformers using the Data Acquisition Board (DAB), which is a suitable tool for the direct collection of signals that will be subject to digital processing for the purpose of calibration.
The [10] presents a further development of the comparison method of the output of two transformer-resistor combinations using sampling digital voltmeters, which have the disadvantage of being falsely recordable when fluctuations or transitions occur.
Similarly, LPCT with digital outputs can be calibrated with some necessary modifications. The digital output of the LPCT is mathematically compared with the output of the reference transformer, which must be digitized in some way. The mathematical comparison is based on the conversion of the signals being compared into the frequency domain by Fast Fourier Transform (FFT). The ratio and displacement errors of the sensor under calibration are evaluated for the fundamental frequency or other frequencies. From this, calibration of a sensor with a digital output using a conventional CT is proposed in [11,12,13]. However, using a conventional RCT requires the addition of a current-to-voltage (I/V) converter to convert the signal from the RCT (5 or 1A) to a low level compatible with the input range of the digitization device; thus, the accuracy of the calibration system will decrease due to the use of additional devices. Therefore, conventional CTs are not a suitable choice for calibration of digital measurement sensors, especially for field calibration, because of their large size and weight.
Considering that RC is one of the most common types of LPCT, many studies have calibrated the RC with digital output using the aforementioned calibration method. RC calibration was introduced [12,14] using a reference shunt and 16 bit digital voltmeters to sample comparative signals. This calibration process is simple but costly, due to the use of two Digital Multimeters (DM) to digitize the output signals for both the RC and the reference shunt. Furthermore, the DM dealing with transient cases is difficult. Therefore, it is better to use a less expensive digitizer that has a digitization resolution greater than 16 bits.
In a smart grid that is based on the digital values of measurements after digitizing the analog values from the sensors using MUs, the accuracy of the MU has an important role in the field of time reception of SV, such as time delay and time jitter, which consequently has a significant impact on the quality of electrical parameters of measurement systems (current/ voltage). Therefore, it is necessary to ensure its precision to ensure traceability of measurement data in the smart grid. Therefore, it is necessary to calibrate it and evaluate its working performance.
The calibration of the independent MU is based on comparing its samples with those produced by a reference digitizing device with higher accuracy. Reference [4,15,16] provided a method for calibrating the MU by comparing each sample measurement sample delivered by the MU and the reference digitizer. This calibration method requires precise synchronization between devices. Timing synchronization was achieved using the NTP and PPS protocols, which can provide accuracy of the order of microseconds. The accuracy of timing synchronization can be improved by using other protocols, such as PTP.
To eliminate phase calibration errors caused by the failure of the reference digitizer to promptly synchronize the samples with the time signal, the researchers in [18] calibrated the MU independently of the synchronization signal using a phase shift approach based on least-square fitting. However, the test results show that the phase verification accuracy is inadequate.
Due to the widespread use of MU in substations to adapt to the trend of the digital interface, it has become necessary to calibrate the MU when combined with LPCT. The reference [17,18] gave an approach to MU calibration in vitro using a reference commercial digitizer capable of working with both PPS and PTP synchronization. The calibration procedure is based on a comparison of the MU data coupled to the current transducer and data from the reference digitizer data connected to a reference transformer. Evaluation of the time quality of the MU output data was done by assessing the frequency stability and the quality of the timing of SVs generated by a MU. As a result of using traditional Electromagnetic Transducers (ETs) as reference transducers, the bandwidth of the ETs differs greatly from the width of the reference transducer, necessitating the modification of the FFT algorithm used in the calibration using windowing technology to reduce the spectral leakage error caused by asynchronous sampling, which inevitably complicates the calibration algorithm.
To reduce the disadvantages of conventional transformers, reference [5] introduces a further development of the previous comparator method, which involves the use of a standard current sensor instead of using a standard transformer current sensor in the reference channel. Although the reference sensor with a magnetic core can measure the primary current without cutting it off, the calibration accuracy was insufficient because of magnetic saturation issues, which were overcome by adding another clamp-shaped sensor without a magnetic core, which increased the design complexity.
Every device used for digital LPCT calibration introduces uncertainty sources, the effects of which spread throughout the measurement chain and impact the estimation of both the ratio and phase errors. The uncertainty assessment to be performed is made in accordance with the recommendations of the guide.
Finally, it should be said that the accuracy of the calibration can be affected by sources of uncertainty related to the equipment used. In other words, the higher the accuracy of the devices included in the calibration system, the better the accuracy class in the calibration system. The uncertainty calculation can be performed using Monte Carlo simulation [19] or according to the ISO guide [20].
With the increasing use of both the RC and the MU in digital substation systems and a lack of literature on how to calibrate these two components when they work together, a developed calibration method was proposed considering the literature on the independent calibration of LPCTs and MUs. This paper presents a further development of previous comparative methods for evaluating the digital measurement of the current resulting from the connection of RC to MU. The calibration method is based on the use of a precision fluxgate current transducer paired to a high-resolution digitizer for the reference channel. Synchronization between devices was done using IEEE1588.
The aim of the paper is to present a simple calibration procedure, to be applied to a measurement chain of MV networks comprising both an RC and a MU used to upgrade the current network to a smart network. Calibration focuses on steady-state and abnormal situations. In this study, the reference measurement system for digital LPCTs is presented, along with an evaluation of the relevant uncertainty contribution of the calibration devices to the current measurements according to [19].
2. Digital LPCT in the MV substation
Substation automation systems have advanced significantly in recent years due to the total digitalization of all information collected, communicated, and processed at the substation.
The digital electrical signal acquisition technology based on an electronic transformer is no longer reliable or sufficient to satisfy the transition needs to smart substations of a widespread power system. Combining transformers and MUs is now a practical alternative for sampling currents/ voltages and sharing them within the smart substation.
The three-phase current of the distribution line in the MV substation was recently measured by LPCTs. The analog sensor and the signal digitizing unit (MU) are the primary components of the digital LPCT.
The accuracy class and prices are two elements that influence the criteria for selecting the kind of LPCT sensor for MV current measurements. MV sensors typically have an accuracy class limit of 1%, although occasionally 0,5% or even 0,2% is required for tariff metering purposes. The Instrument Transformer (IT), Rogowski coil (RC), and shunt resistance stand out as excellent options for usage in MV networks when compared to all other existing sensors when considering the trade-off between possible accuracy and costs. The non-linearity of CT and the constrained operating range caused by the magnetic saturation phenomenon are a big problem when used in MV. Shunt resistors also have the disadvantage of not providing adequate and reliable galvanic isolation. RC is the most popular type of LPCTs because of its beneficial characteristics, including simplicity of measurement and the absence of the necessity to open the MV connection while adding or removing the sensor. RC is an AC measuring transducer made up of uniformly wounded coils having a nonmagnetic core. The coil is used to measure current by wrapping it around the conductor that holds the current.
Since there is no saturation effect due to the absence of an iron core in the Rogowski coil, the relationship between the measured primary current and the secondary voltage is linear. The output voltage is proportional to the primary current derivative.
Since the RC output voltage is proportional to the turns area, RC inaccuracy may arise for several reasons, such as the following:
- The density of turns is never fully continuous and uniform due to the tiny dimensions of the wire used for making the coil,
- The coil cannot be completely closed to detect the output voltage Us,
- The turns regularity is severely interrupted very close to the coil end; and that is typically the primary cause of inaccuracy.
Due to all these restrictions, the RC sensitivity is not independent of the relative position and tilt with respect to the RC. In addition, the conductor-to-coil, turn-to-turn, and output cable-to-ground parasitic capacitance all influence on the RC frequency response, which can reduce the bandwidth of the RC sensor. Therefore, producers must calibrate these sensors before releasing them to the market to reduce the possibility of inaccuracies.
After the sensor associated with the MV connector measures the currents, the analog currents are collected, digitalized, and sent to the metering or protection systems via MU, which is the physical interface to connect process equipment (i.e., transformers, sensors) to bay level devices (i.e., monitoring/protection systems). According to IEC 61850-2, MU is meant to capture current and voltage signals from transformers/sensors and convert them into the standard digital output format. The merging units can be equipped with analog inputs for connection to conventional CT/VT, or with analogue inputs plus binary I/O for connection to sensors.
IEC 61869-13 defines the rated analog inputs as 1/5 A and 100-200 V for CTs and VT, respectively. Additionally, the standard defines the rated binary inputs as 22.5 mV, 150 mV, and 225 mV for LPCT and 3.25 V for LPVT.
IEC 61869-9 defines sample rates as 4,8 kHz for measuring and protective applications and 14,4 kHz for quality measurement applications.
MU supports process bus (IEC 61850-9-2 LE) by transferring sampled values of measured currents/voltages in the form of data packets over the Local Area Network (LAN). This allows the installation of metering systems in the control room and the use of the Ethernet network for advanced substation data transmission.
MU contains an inbuilt real-time clock that is used to time-stamped the measured data. The real-time clock may be free-running or synced from an external signal such as pulses per second (PPS), but the best is the Precision Time Protocol (PTP), also known as IEEE1588. Due to the time stamps included in each SV, the IED receiver can differentiate and chronologically list all SV packets that arrive from a single MU or many MUs before processing them.
It should be noted that the digital output often lags the input signal due to timestamp delay. Additionally, encapsulating the sampled value into Ethernet data may result in a delay known as MU process delay time.
Thus, incorrect MU data results in inaccurate shared information with simultaneous IEDs leading to inaccurate electrical power measurement and critical function failure of the protection system.
The IEC 61850-9-5 standard for smart grids outlined the time precision criteria for time tag of events and time synchronized measurements in five-time performance classes, T1 to T5, ranging from 1 ms to 1 μs as shown in Table 1.
According to the synchronization protocols employed, which synchronize the IED clock with the network and maintain it correct to a specific precision, the IEDs differ from each other.
Network-based synchronization protocols, such as the Network Time Protocol (NTP) and the Simple Network Time Protocol (SNTP), offer insufficient synchronization accuracies of 10–1 ms, making them unsuitable for synchronizing all IED substations.
The most demanding substation applications, such as IEC 61850-9-2 Process Bus, can be met by IEEE 1588 network-based time synchronization protocol that has sub-microsecond accuracy.
The benefit of PTP synchronization is that it eliminates the requirement for additional wires that are typically required with the IRIG-B or PPS and instead uses the Ethernet network to communicate with the synchronization signal. PTP able to automatically identify and correct the dynamic network time delays for each data packet that may have extra delay from network components like switches. Thanks to the transparent clock introduced by IEEE 1588, the time required to pass through the switch is measured, and the clock receiving the PTP message is informed of this time.
However, synchronization inaccuracy can occur for a few reasons, such as the synchronization signal being corrupted within the MU or not being able to reach the source (the GPS receiver). Thus, the MU digital output may lag the input signal due to a time-tamping delay. Additionally, encapsulating the sampled value into Ethernet data may result in a delay known as MU process delay time. Therefore, incorrect time of the MU data results in inaccurate shared information with simultaneous IEDs leading to inaccurate electrical power measurement and critical function failure of the protection system. Therefore, MU calibration is an essential procedure for estimating synchronization parameters to compensate for possible errors.
3. Digital LPCT Calibration
Given that a device reading for a given quantity will fluctuate or drift over time and will be impacted by a number of influencing factors (including temperature, humidity, power supply voltage, and a variety of electromagnetic interference), as well as the possibility that the instrument performance will be impacted by large instantaneous changes in the input quantity both during and after those changes, it is probable that the measured current will differ from a sine wave. Hence, the importance of the tracking process for the current measuring chain.
Traceability is defined as a continuous chain of permissible comparisons that tie the measuring device to national or international instrument standards. A comparison of a measuring device with a more accurate device is called calibration.
In general, comparing the LPCT with a standard current measuring instrument in a laboratory setting is critical to ensure the accuracy of the current measurement. The objective of routine LPCT accuracy calibration is to validate its reliability of its performance in terms of accuracy and bandwidth after a period of operation. The calculation of the ratio difference and phase difference is used to assess accuracy calibration.
Calibration of the LPCT is not a simple procedure. The performance of LPCT under the effect of one of the typical influence factors differs from that under the influence of other factors. Calibration becomes more difficult when the LPCT is under the influence of more than one influencing factor simultaneously [21].
3.1. Calibration Method
This work proposes a simple calibration method for LPCT with digital output that can be used in an academic or industrial environment. An appropriate calibration infrastructure has been established to assess the accuracy of the digital current produced by the RC + MU. The calibration structure diagram is shown in Figure 1, and comprises:
- Current generator (Omicron CMC 356): provides a sinusoidal analogue current signal, which represents the high current to be measured.
- Calibration channel: consisting of an RC and a MU. Commercial RC is an 80/150 mV (at 50 Hz) transducer, used for MV measurement purposes with accuracy class 0.5. MU generates SVs after receiving the analogue current measured by the RC sensor.
- Standard channel: consisting of a Reference Current Transducer (RCT) and a highly accurate reference digitizer 24-bit resolution ADC. The reference sensor is a commercial flux-gate transducer that features the following features: Nominal input current 600A, transformation ratio 1500:1. The digitizer consists of a NI PXI-4472 digitizing module and a NI PXI-6682 timing board. The NI PXI-4472 features: 24-bit architecture, ±10 V input, and sampling rate 102.4 kS/s.
- The calibration platform: Is a set of computer programs that capture and analyze digital output from channels, as well as an error calculation algorithm based on the differential method.
- GPS synchronization receiver: Generates the time synchronization signal for accurate synchronization between sampling equipment by tuning its own clock oscillator via PPS or PTP protocols.
- PTP network: Is a LAN configured with PTP and is used as a synchronization source as well as a sharing network to transmit the data of MU and PXI to the calibration platform for error calculation.
RC calibration is based on high current loop generation employing a coaxial bus bar with both RC and RCT to reduce uncertainties caused by conductor position. The RC output is connected to a MU that creates current SVs based on the IEC 61850-9-2 LE standard at a rate of 80 samples/second. MU sends current SVs to the PTP-LAN network with timestamps at the relevant sampling time. Similarly, the RCT output is digitized and acquired through the NI PXI-4472 Data Acquisition Board (DAB). The NI PXI-4472 ADC clock oscillator is also driven by PTP, allowing for improved signal digitization, and enhancing comparison validity.
On the calibration platform, there is a set of computer software that captures current samples of MU and DAB samples.
- The Sampled Value Analyzer (SVA) software was created and developed at the Brno University of Technology for high-accuracy capture of SV packets, decoding and recording them to a file, and providing real-time waveforms of measured current. The recording file contains the SV ID, MAC destination, MAC source, and sample timestamps. SVA can also show the status of data loss.
- The Lab View graphical program can acquire data, record data, and display the waveform of the RCT current. LabView may additionally capture the MU signal in synchronized mode. The recording file contains samples timestamps of the RCT digitized signal.
- The MATLAB program is used to create the essential analysis tool required to execute the LPCT error calculation algorithm.
3.2. Calibration Algorithm
The algorithm to estimate the composite error of LPCT with digital output is based on the variations between each measurement sample of the synchronized MU and RC. The composite error of the measuring chain can be expressed according to IEC61869-9 [22] as:
where iX(n) is the actual instantaneous value of the MU at the sampling time,
iR(n) is the actual instantaneous value of the RC at the sampling time,
N is the nominal sample rate (samples per second) divided by the fundamental frequency (Hz).
Moreover, the amplitude error is simply calculated using the ratio of the difference between the root mean square (RMS) of the current signal measured by MU and RC to the RMS of current measured by RC during each period. But the determination of the phase error is slightly more complex. Therefore, the Fast Fourier Transform (FFT) should be performed on MU and RC samples.
IEC61869-9 defined the ratio/phase error of the measuring chain using FFT on the samples as:
where ε ⃗(s) is the ratio error and the phase error of the measuring chain,
k is the number of harmonics being measured (k=1 for the fundamental).
The FFT algorithm starts by subdividing the original set of measurement data, which consists of data gathered synchronously from MU and RC at a sampling rate of 4 kHz, into n subwindows with 97.5% overlap containing 80 samples (each period contains 80 samples, so that each subsequent period has an overlap of 78 samples from the previous period).
The amplitude/ phase of the fundamental harmonic of each signal is obtained by performing (FFT) analysis at each subwindow. The amplitude/phase differences for each period are determined using the differentiation method between the two values that are given by the FFT at the signal frequency component (50Hz) of both MU and RC.
After calculating the differences for each period in the measurement windows, the differences are averaged over n windows, which gives the final values of the amplitude/phase errors.
where I1rms,X(n), I1rms,R(n) are the RMS of the the first harmonic of current signal of MU and RC, respectively at the nth sub-window,
φ1X(n), φ1R(n) are the phase of the first harmonic of current signal of MU and RC, respectively, at the nth sub-window,
N is the total number of subwindows.
Similarly, the algorithm is also capable of estimating type A measurement uncertainties, since the mean and standard deviations of the amplitude and phase errors can also be computed [16].
3.3. Target Uncertainty for LPCT Calibration
The error represents the variation between the measurement result and the true or reference measured value, while the reliability that the apparent measurement result represents the true measured value is expressed by uncertainty. Uncertainty is often described as a range or interval with a corresponding confidence level or probability. Indicates how certain the real value falls within that specified range. The uncertainty value consists of several elements that are estimated using various statistical distributions of the measurement data. These elements include systematic and random influences on the measurements.
According to [8], the level of uncertainty necessary for the calibration of LPCT is identified by the accuracy class of the calibrated transducer itself.
IEC 61869-6 defined that each accuracy class of the LPCT has limits that should not be exceeded by the ratio/phase error, without mentioning any target uncertainty of the error measurements [23].
Linearity, temperature and temporal stability, standard calibration, and other factors that have a significant impact on LPCT errors measurements mean that the probability distribution of the uncertainty that impacts the calculated ratio/ phase error can be considered normal [24].
The uncertainty sources originate from every device used for LPCT calibration, and these sources effects spread throughout the measurement chain, causing inaccuracies in the ratio/ phase error assessment. The following sources of uncertainty are the key factors that limit the accuracy of the measurement in our calibration setup.
- uncertainty induced by the RCT ratio and phase error: The RCT should have an accuracy class that is appropriately lower than that of the RC to be calibrated. The contribution of RCT is the amplitude error ±0.05% and the phase error 0.35 mrad.
- the uncertainty caused by the reference analog to digital converter of PXI gain and phase error. The contribution of PXI-4472 is the amplitude error ±0.025% and the phase error 0.4 mrad.
- the uncertainty caused by the digital values capture programs. The contribution of SVA is the amplitude error of 4.7 * 10%-6 % and the phase error of 0.1 mrad.
A Type-B evaluation can be used to estimate each of the above-mentioned elements.
3.4. Uncertainty Calculation
The uncertainty analysis in this work is calculated by linear error propagation according to the following equations.
with uc(y) being the standard uncertainty, ci sensitivity coefficients and u(xi) are the standard uncertainties of the input quantities Xi.
Therefore, the standard measurement uncertainties of the LPCT calibration uc for measurements at nominal current and 50 Hz are calculated by:
with u(RCT), u(PXI) and u(SVA) the individual standard uncertainties of uncertainty sources.
The expand uncertainty to the desired confidence level can be calculated as
with the k coverage factor that can be k=2 for the coverage probability of 95.45% or k=3 for the coverage probability of 99.73%.
4. Results
The linearity measurement of the LPCT made up of RC+ MU was performed under normal and abnormal operating conditions.
The previously mentioned procedure was used to compute the errors of measuring chain at primary current 16 A, 40 A, 80 A and 96 A with 50 Hz.
The MATLAB environment is used to calculate the errors between Fourier-transformed current signals.
The errors between the samples of the two current signals recorded for a period of 6 s are calculated according to equations (3) and (4).
The estimated Probability Density Function (PDF) for the ratio error ε% can be seen in Figure 2(a), and the estimated PDF for the phase error δ is shown in Figure 2(b). Briefly, the errors of this measuring chain are ratio error of -0.26%, phase error of 0.021 rad, and composite error of 2.2%.
Considering this calibration procedure, the results and the corresponding statistical calculations derived from Figure 2 are listed in Table 2.
According to the Central Limit Theorem, it may be inferred from such numbers that the PDFs are essentially normal assuming that the measurement procedure is linear.
It is worth noting that the range of the 95.5% confidence interval mentioned in Table 2 indicates that the total uncertainty is caused by the measuring devices and the measurement chain (RC+ MU).
For uncertainty calculation, the errors that could contribute to uncertainty, which were obtained from the manufacturer’s brochures for each device, were considered.
In order to calculate the uncertainty in the measurement process according to Equation (6). The extended standard uncertainty of measurement caused by measurement equipment is calculated as:
where εRCT, εPXI, εSVA are the maximum errors of the of RCT, PXI, and SVA respectively.
3 is a factor given by the probability of the statistical normal distribution of the error considered.
The results of the calculation of the uncertainty of the measurement equipment were a value of 0.134% for the error of the ratio error and a value of 0.18 mrad for the phase error (for k = 2).
The uncertainty resulting from the measurement chain (RC+MU) that is under calibration can be shown in Figure 3.
Based on the assumption that the uncertainty that affects measurement errors should be less than one fifth of the limitations given by the accuracy class [24], and based on the results obtained, the suggested setting can be adopted, which can be used to calibrate RCs with accuracy class 0.5.
Knowing the sources of uncertainty that most contribute to the above-mentioned calibration uncertainty levels is beneficial in improving the accuracy of the calibration system in subsequent experiments. In fact, the RCT contributed the most to the uncertainty in the amplitude error, while the DAB had the greatest effect on the uncertainty in the phase error measurement. This means that reference devices with higher accuracy classes can be used to decrease uncertainty.
5. Conclusions
LPCTs have obvious advantages in measuring current for measurement systems in smart grids. At the same time, together with the integrated modules, the measured electric current can be converted into digital values that can be transmitted to the control and monitoring center via a local Ethernet network, reducing the time and costs of current measurement.
As RCs and MUs have become increasingly important in the creation of smart networks in recent years, it was necessary to calibrate these two devices used together in the current digital measuring system.
In this paper, an algorithm is proposed to calibrate an RC with digital output to verify the accuracy of its current measurement. The calibration algorithm is based on the FFT of both the RC current and the reference current generated by a high-resolution current sensor and a high-resolution 24-bit reference digital converter. To achieve synchronization between the values of the samples of the two currents, we used the PTP was used, which has the highest accuracy compared to other synchronization protocols.
The calibration results of a current measurement chain for a 32 kV substation were presented during steady state and different working conditions. In fact, the tests offer results that are in line with the applicable standards. This calibration method will be used in future work to evaluate the frequency response with or without the transient state.
Furthermore, the important elements that impact calibration accuracy have been explored by identifying uncertainty and its sources to increase the stability and future development of the measurement chain.
Funding
“This research work has been carried out in the Center for Research and Utilization of Renewable Energy (CVVOZE)”. The authors acknowledge financial support from the Ministry of Education, Youth, and Sports of the Czech Republic under BUT specific research program (project No. FEKT-S-23-8403).
Conflicts of Interest
The authors declare no conflict of interest. The sponsors had no role in the design of the study, in the collection, analyses, and or interpretation of data, in the writing of the manuscript, and in the decision to publish the results.
References
- Bassan, F.R.; Rosolem, J.B.; Floridia, C.; Aires, B.N.; Peres, R.; Aprea, J.F.; Nascimento, C.A.M.; Fruett, F. Power-over-Fiber LPIT for Voltage and Current Measurements in the Medium Voltage Distribution Networks. Sensors 2021, 21, 547. [Google Scholar] [CrossRef]
- Zavoda F, Yakymyshyn C. Sensors for smart grids. In Proceedings of the Third International Conference on Smart Grids, Green Communications, and IT Energy-Aware Technologies (ENERGY 2013). Lisbon, Portugal (March 24-29, 2013) (pp. 83-88).
- Casais, J.L., Bierzychudek, M.E., Djokic, B., and Parks, H. Calibration of Weld Current Monitors at INTI Argentina. In 2020 Conference on Precision Electromagnetic Measurements (CPEM), IEEE, USA (August 2020); pp. 1-2. [CrossRef]
- Anombem, U., Li, H., Crossley, P., An, W., Zhang, R. and Mctaggart, C. Performance testing and assessment of merging units using IEC61850. In 2011 International Conference on Advanced Power System Automation and Protection, October 2011, IEEE; pp. 1252-1257. [CrossRef]
- Tong, Y., Liu, B., Abu-Siada, A., Li, Z., Li, C., and Zhu, B. Research on calibration technology for electronic current transformers. In 2018 Condition Monitoring and Diagnosis (CMD), September 2018, IEEE; (pp. 1-5). [CrossRef]
- Crotti, G., Gallo, D., Giordano, D., Landi, C., and Luiso, M. Non-conventional instrument current transformer test set for industrial applications. In 2014 IEEE International Workshop on Applied Measurements for Power Systems Proceedings (AMPS), September 2014, IEEE; pp. 1-5. [CrossRef]
- Mingotti, A., Peretto, L., Tinarelli, R., and Zhang, J. Use of COMTRADE fault current data to test inductive current transformers. In the 2019 II Workshop on Metrology for Industry 4.0 and IoT (MetroInd4. 0&IoT), June 2019, IEEE; pp. 103-107. [CrossRef]
- Brandolini, A., Faifer, M., and Ottoboni, R. A simple method for the calibration of traditional and electronic measurement current and voltage transformers. IEEE Transactions on Instrumentation and Measurement 2009, 5,1345-1353. [CrossRef]
- Chen, Y., Dubowik, A., and Mohns, E. Reference system for current sensor calibrations at power frequency and for wideband frequencies. In the 20th International Conference on Harmonics & Quality of Power (ICHQP), May 2022, IEEE; pp. 1-6. [CrossRef]
- Budovsky I. Calibration of precision current transformers and AC resistors by comparison using two sampling digital voltmeters. In 2020 Conference on Precision Electromagnetic Measurements (CPEM), 2020 Aug 24 (pp. 1-2). IEEE. [CrossRef]
- Pan F, Xu Y, Xiao X, Ren S. Calibration system for electronic instrument transformers with analogue and digital outputs. In the 9th International Conference on Electronic Measurement & Instruments, 16 August 2009 (pp. 1-650). IEEE. [CrossRef]
- Suomalainen EP, Hallstrom J. Experience with Current Transformer Calibration System Based on Rogowski Coil. In Conference on Precision Electromagnetic Measurements (CPEM 2018), 8 July 2018 (pp. 1-2). IEEE. [CrossRef]
- Paulus, S., Kammerer, JB, Pascal, J., Bona, C., and Hebrard, L. Continuous calibration of Rogowski coil current transducer. Analog Integrated Circuits and Signal Processing 2016, 89, 77-88. [CrossRef]
- Suomalainen, E.P. and Hallstrom, J.K. Onsite calibration of a current transformer using a Rogowski coil. IEEE Transactions on Instrumentation and Measurement 2008, 58, 1054-1058. [CrossRef]
- Gurbiel, M., Komarnicki, P., Styczynski, Z.A., Gatzen, F.W. and Dzienis, C. Merging unit accuracy testing. In IEEE Power & Energy Society General Meeting, Canada, July 2009 (pp. 1-6). IEEE. [CrossRef]
- Dutra, C.A., Cruz, I.H., Franzen, T.A., Matos, R.R., Neves, F.C., Oliveira, L.B., and Krefta, G. Comparison of analogue measurements between merging units and conventional acquisition systems. 2014. [CrossRef]
- Agustoni, M., and Mortara, A. A calibration setup for IEC 61850-9-2 devices. IEEE Transactions on Instrumentation and Measurement 2017, 66, 1124-1130. [CrossRef]
- Zhi, Z., and Li, H.B. An accurate system for onsite calibration of electronic transformers with digital output. Review of Scientific Instruments, 83(6). 2012. [CrossRef]
- Pasini, G., Peretto, L., Roccato, P., Sardi, A. and Tinarelli, R. Traceability of low-power voltage transformer for medium voltage application. IEEE Transactions on Instrumentation and Measurement 2014, 63(12), 2804-2812. [CrossRef]
- ISO / IEC98-3, ‘Uncertainty of measurement - Guide to the expression of uncertainty in measurement (GUM:1995)’, ISO / IEC Guid. 98-3, 2008.
- Mingotti, A., Costa, F., Peretto, L., and Tinarelli, R. Accuracy type test for Rogowski coils subjected to distorted signals, temperature, humidity, and position variations. Sensors 2022 ,22(4), 1397. [CrossRef]
- IEC 61869-9 Instrument transformers - Part 9: Digital interface for instrument transformers. Geneva, Switzerland. 2016 Apr 27.
- IEC 61869-6 Instrument transformers - Part 6: Additional general requirements for low-power instrument transformers. Geneva, Switzerland. 2016.
- Mingotti, A., Peretto, L., Tinarelli, R., and Ghaderi, A. Uncertainty analysis of a test bed for calibrating voltage transformers vs. temperature. Sensors 2019, 19(20), 4472.
Figure 1.
Structure of the measurement bench for the calibration of the test set.
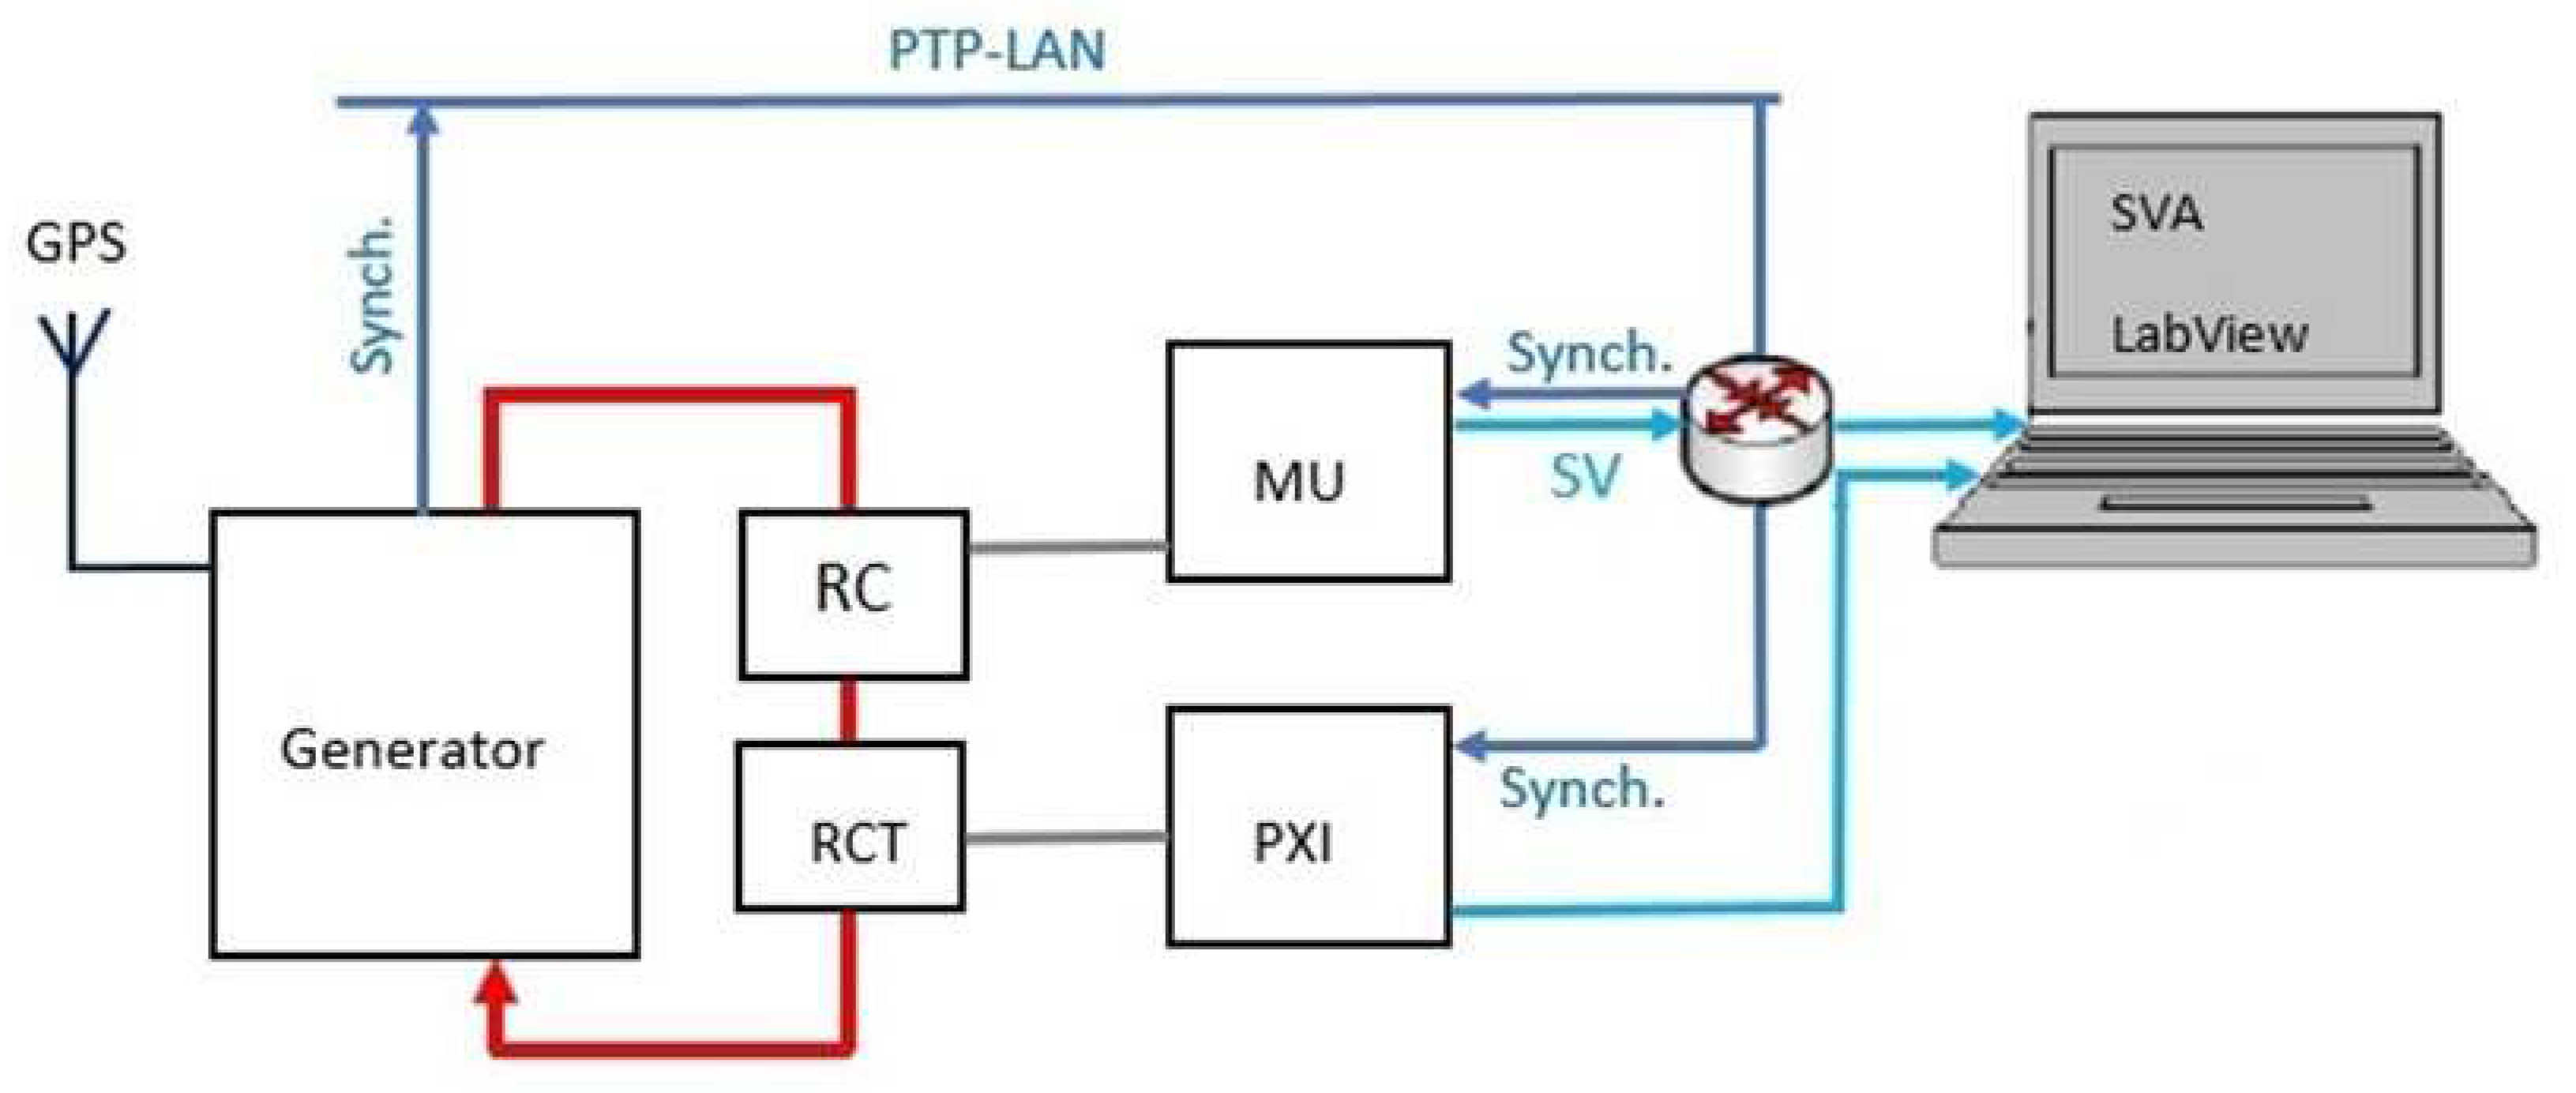
Figure 2.
Histogram of the errors (a) PDF of ratio error; (b) PDF of the phase error.
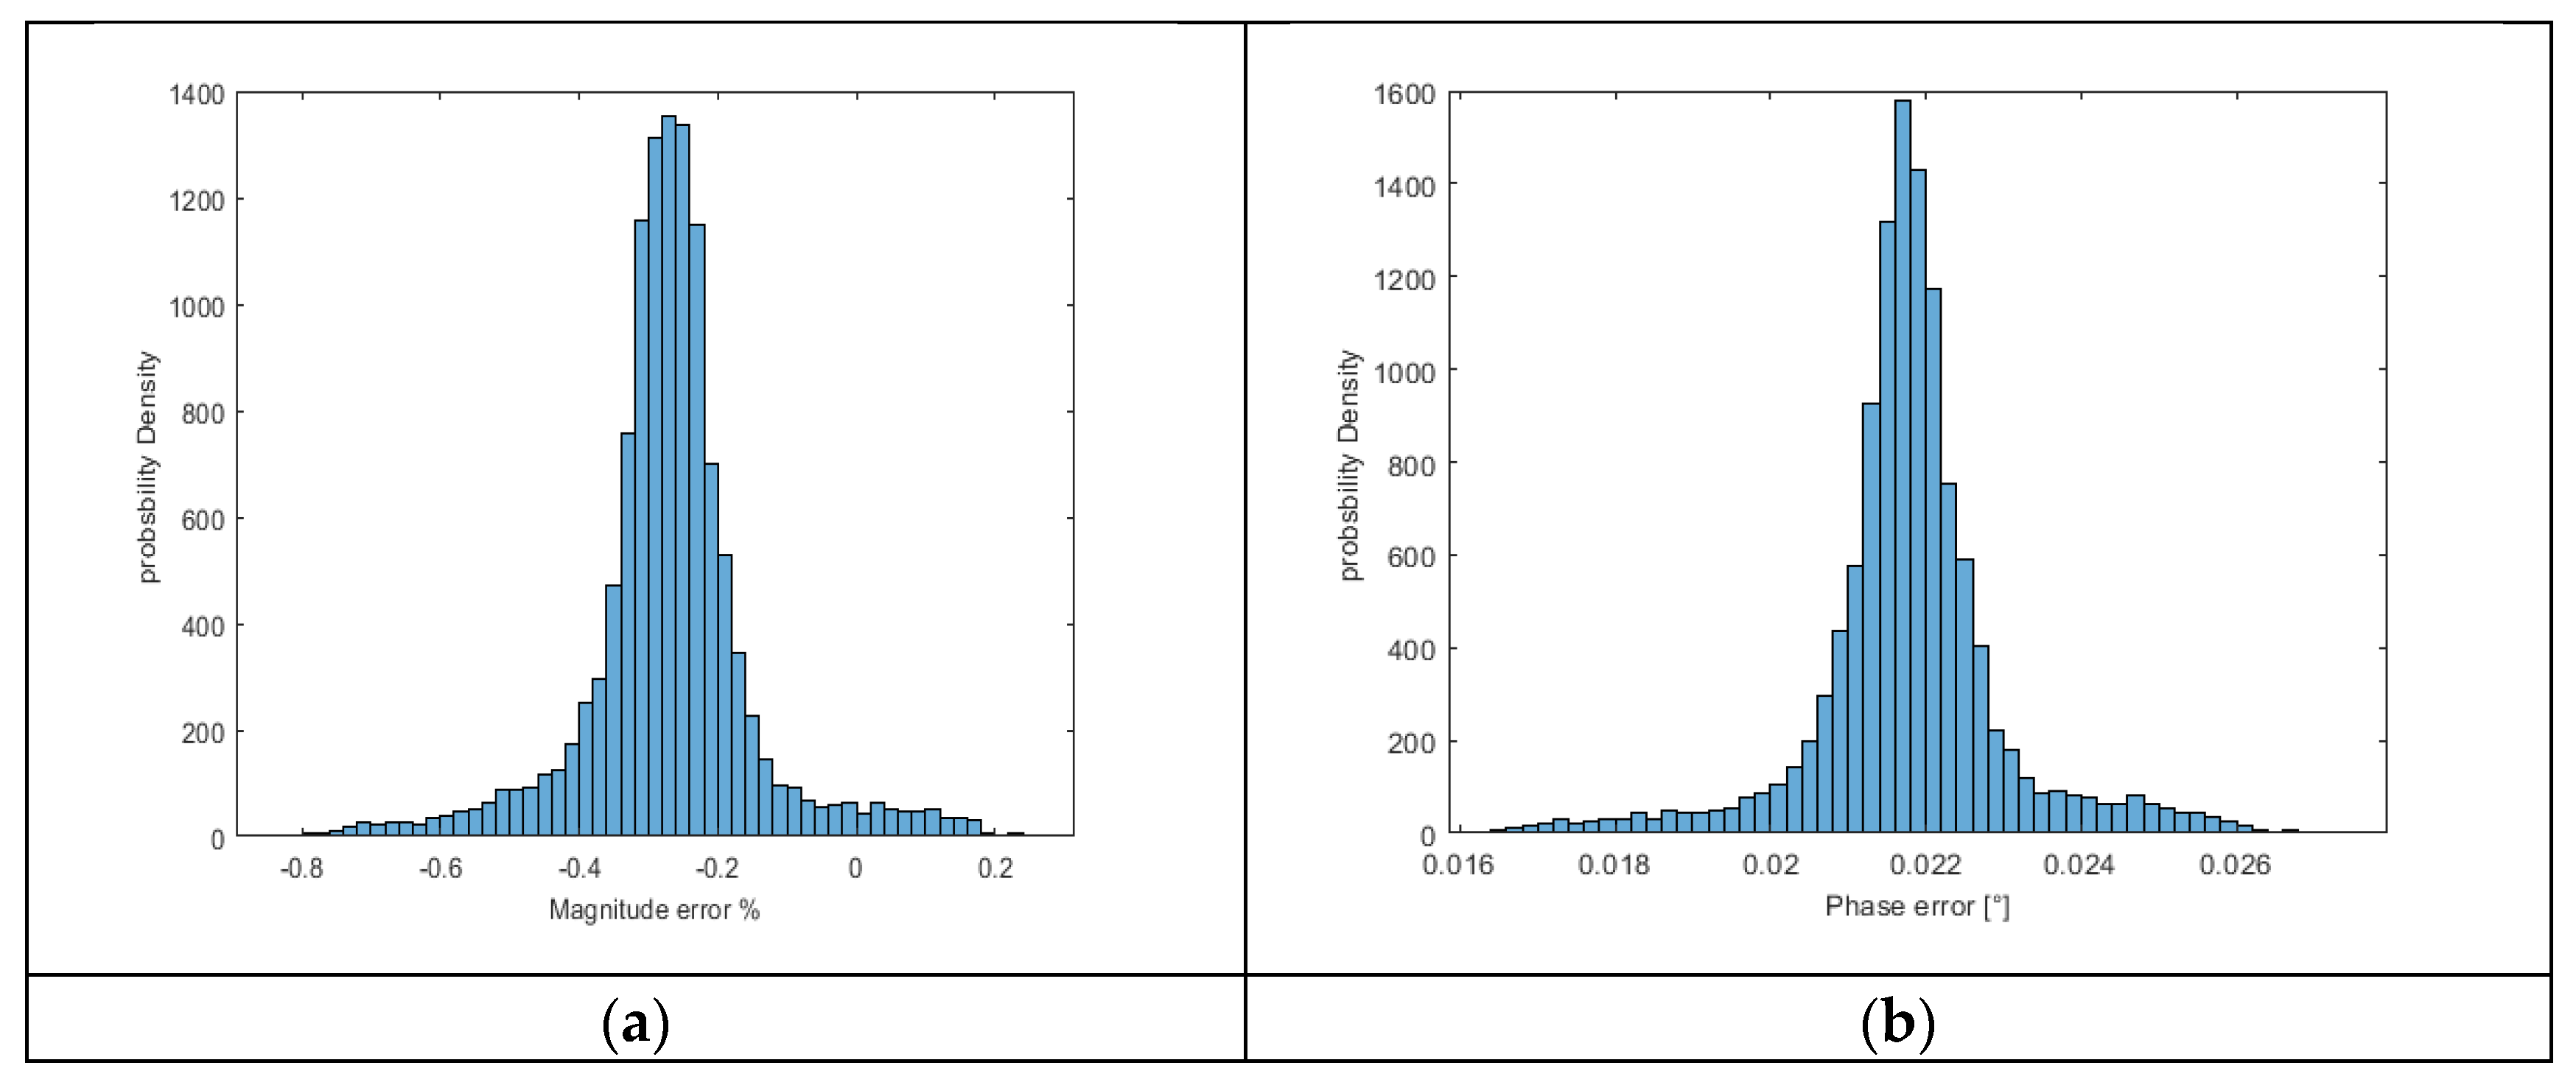
Figure 3.
Uncertainty of the errors (a) Uncertainty of the ratio error; (b) Uncertainty of the phase error.
Figure 3.
Uncertainty of the errors (a) Uncertainty of the ratio error; (b) Uncertainty of the phase error.
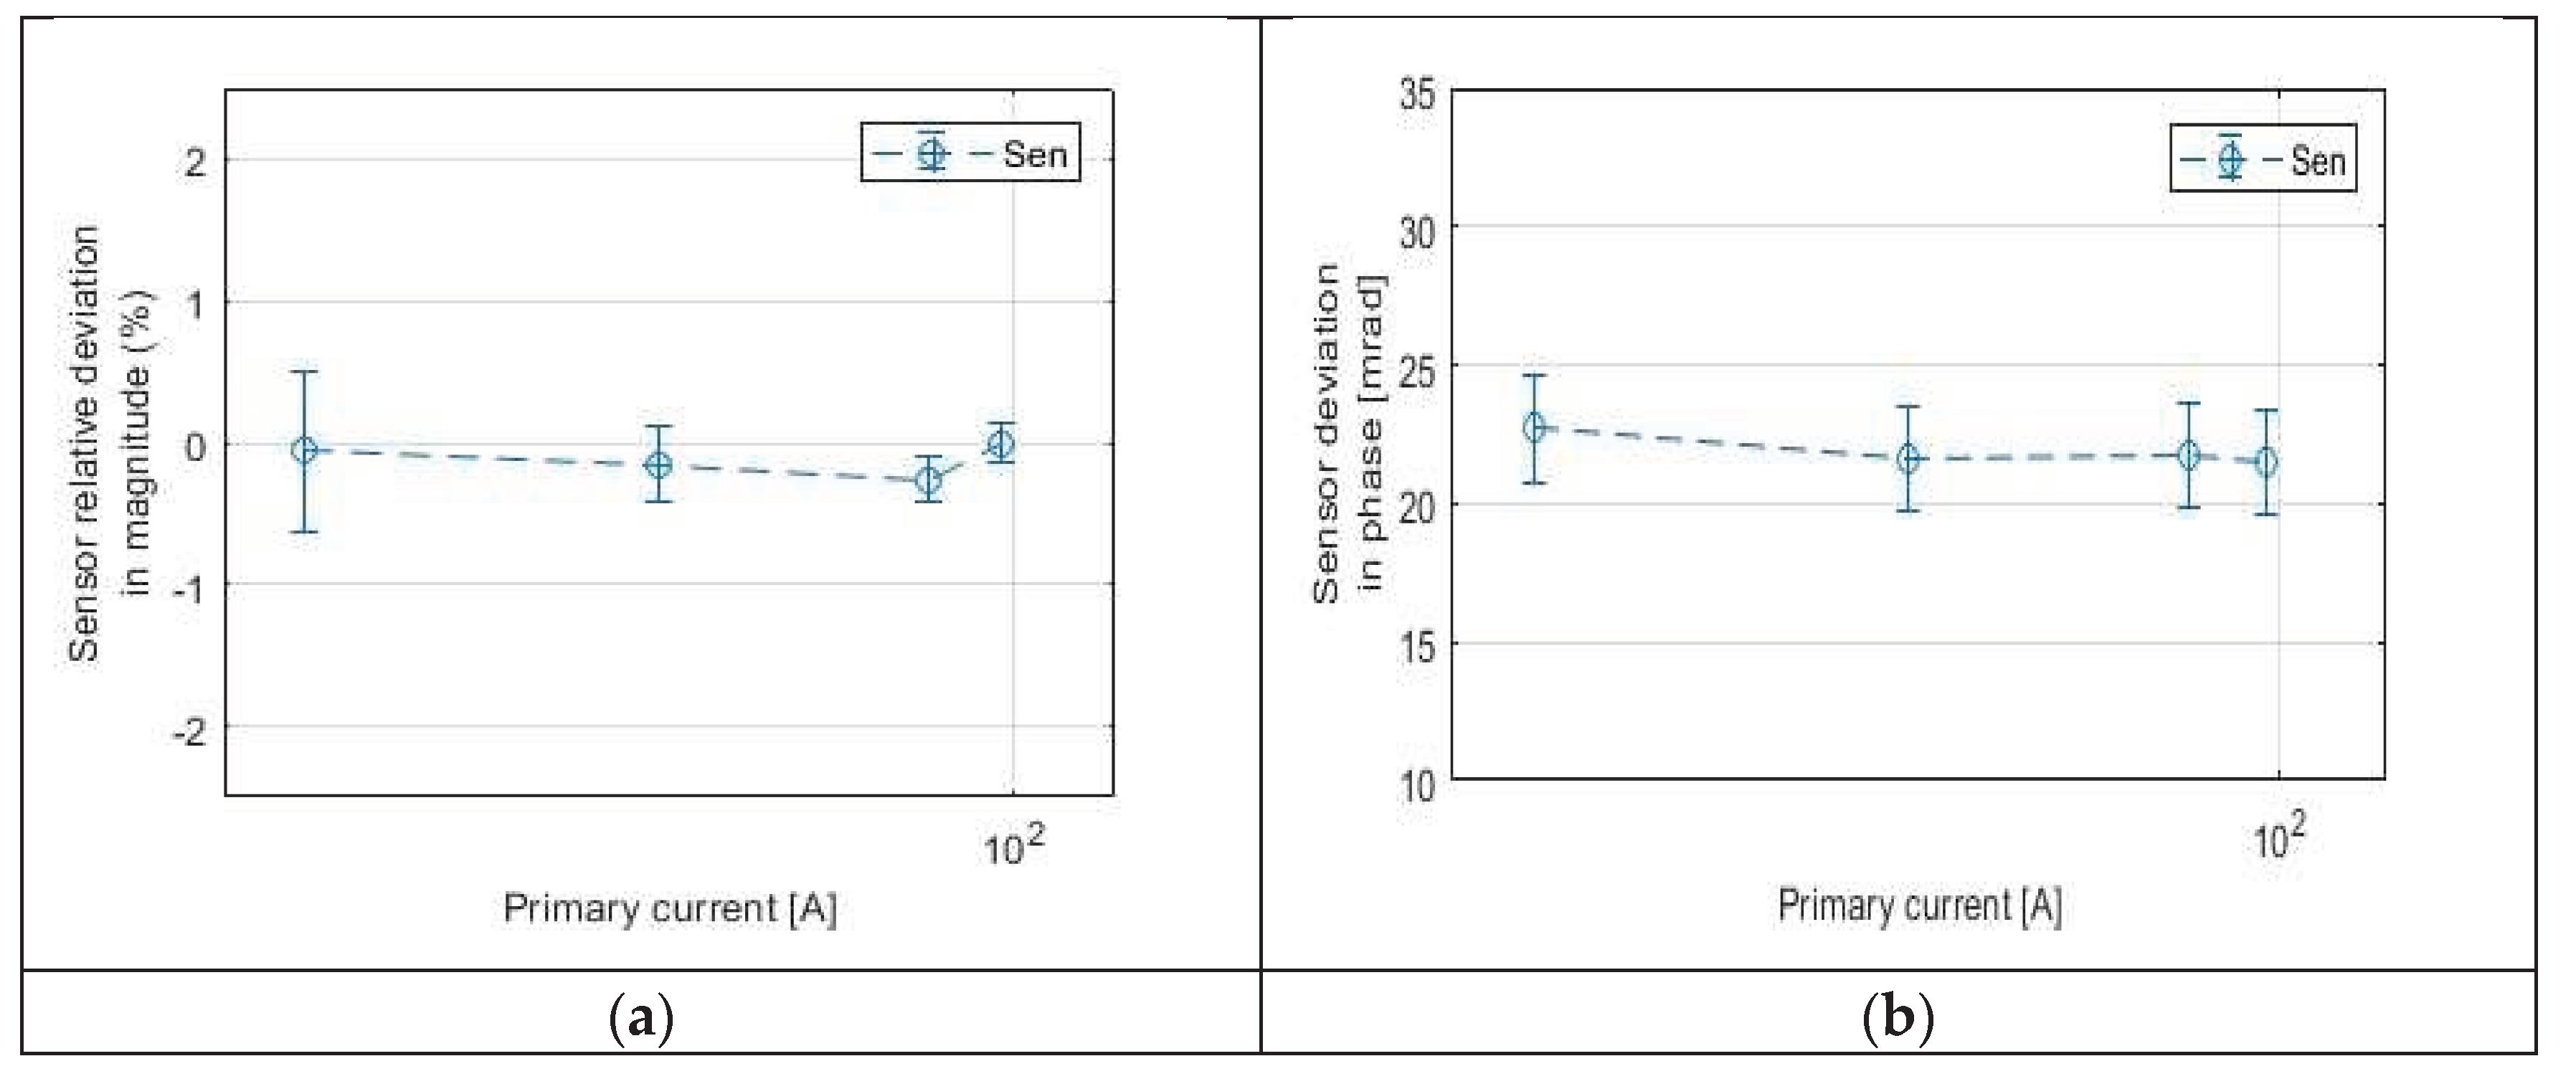

Table 1.
Time synchronization classes.
| Time class | Synchronization accuracy |
|---|---|
| T1 | 1ms |
| T2 | 0.1ms |
| T3 | ±25µs |
| T4 | ±4µs |
| T5 | ±1µs |
Table 2.
Results of measurement chain errors.
| Current | Quantity | Mean Value | Standard Deviation |
|---|---|---|---|
| 16A 50Hz |
ε % | -0.17 | 0.22 |
| Δ [rad] | 0.022 | 0.0021 | |
| 40A 50Hz |
ε % | -0.15 | 0.125 |
| Δ [rad] | 0.0216 | 0.00122 | |
| 80A 50Hz |
ε % | -0.26 | 0.12 |
| Δ [rad] | 0.021 | 0.0012 | |
| 96A 50Hz |
ε % | -0.18 | 0.08 |
| Δ [rad] | 0.021 | 0.0008 |
Disclaimer/Publisher’s Note: The statements, opinions and data contained in all publications are solely those of the individual author(s) and contributor(s) and not of MDPI and/or the editor(s). MDPI and/or the editor(s) disclaim responsibility for any injury to people or property resulting from any ideas, methods, instructions or products referred to in the content. |
© 2023 by the authors. Licensee MDPI, Basel, Switzerland. This article is an open access article distributed under the terms and conditions of the Creative Commons Attribution (CC BY) license (http://creativecommons.org/licenses/by/4.0/).
Copyright: This open access article is published under a Creative Commons CC BY 4.0 license, which permit the free download, distribution, and reuse, provided that the author and preprint are cited in any reuse.


