
Submitted:
02 October 2023
Posted:
03 October 2023
You are already at the latest version
Abstract
Individuals with autism often experience gastrointestinal issues but the cause is unknown. Many gene mutations that modify neuronal synapse function are associated with autism and therefore may impact the enteric nervous system that regulates gastrointestinal function. A missense mutation in the Nlgn3 gene encoding the cell adhesion protein, Neuroligin-3, was identified in two brothers with autism who both experienced severe gastrointestinal dysfunction. Mice expressing this mutation (Nlgn3R451C mice) are a well-studied preclinical model of autism and show autism-relevant characteristics, including impaired social interaction and communication, as well as repetitive behaviour. We previously showed colonic dysmotility in response to GABAergic inhibition and increased myenteric neuronal numbers in the small intestine in Nlgn3R451C mice bred on a mixed genetic background. Here we show that gut dysfunction is a persistent phenotype of the Nlgn3 R451C mutation in mice backcrossed onto a C57BL/6 background. We report that Nlgn3R451C mice show faster gastrointestinal transit in vivo and have longer small intestines compared to wild-types due to a reduction in smooth muscle tone. In Nlgn3R451C mice, we observed a decrease in resting jejunal diameter and neurally-regulated dysmotility as well as shorter durations of contractile complexes in the ileum. In Nlgn3R451C mouse colons, short contractions were inhibited to a greater extent by the GABAA antagonist, gabazine, compared to wild-type mice. Inhibition of nitric oxide synthesis decreased the frequency of contractile complexes in the jejunum, but not the ileum, in both wild-type and Nlgn3R451C mice. These findings demonstrate that changes in enteric nervous system function contribute to gastrointestinal dysmotility in mice expressing the autism-associated R451C missense mutation in the Neuroligin-3 protein.
Keywords:
autism
; gut dysfunction
; gut motility
; gut transit
; mouse model
; Neuroligin-3
; video-imaging
1. Introduction
Autism spectrum disorder (ASD; autism) is a neurodevelopmental disorder diagnosed based on repetitive or restricted activities and deficits in communication and social behaviour. Together with core diagnostic criteria, individuals with autism often experience a range of comorbidities such as increased anxiety, irritability, and gastrointestinal issues.
More than 1000 gene mutations contribute to ASD (Arpi & Simpson, 2022), and a substantial proportion of them affect neuronal synapse function. Mouse models of autism that express gene mutations impacting neuronal synapse function show abnormal brain activity (Etherton et al., 2011; Guo et al., 2019; Hosie et al., 2018; Peça et al., 2011; Rothwell et al., 2014; Schmeisser et al., 2012; Tabuchi et al., 2007). Several preclinical models of ASD also show altered gastrointestinal anatomy, shifts in the microbiome and gut dysfunction (Hosie et al., 2019; James et al., 2021; Lee et al., 2020; Qin Lee et al., 2022; Sauer et al., 2019; Sgritta et al., 2019; Sharna et al., 2020). We propose that mice expressing mutations impacting the neural circuitry of the brain also show changes in the enteric nervous system of the gastrointestinal tract. However, targeted studies that assess outputs of neural activity in multiple gut regions are needed to understand the role of these autism-associated mutations in the gut.
It is well established that the Neuroligin-3 cell adhesion protein is located at neuronal synapses in the brain (Baudouin et al., 2012; Budreck & Scheiffele, 2007; Uchigashima et al., 2020). The R451C missense mutation in the Nlgn3 gene encoding was first identified in two brothers diagnosed with ASD (Jamain et al., 2003). This mutation is well characterized and causes the substitution of an arginine residue to cysteine at position 451 in the Neuroligin-3 protein (Chubykin et al., 2005; Comoletti et al., 2004). Mice expressing this mutation show a range of autism-relevant traits, including impaired social communication (Burrows et al., 2015; Chadman et al., 2008; Hosie et al., 2018; Tabuchi et al., 2007) and repetitive behaviours (Burrows et al., 2015; Rothwell et al., 2014).
We initially identified a robust aggression phenotype in Nlgn3R451C mice bred on a mixed genetic background (Burrows et al., 2015). To verify if this trait is due to the R451C autism-associated mutation as opposed to confounding environmental factors, we backcrossed mice for more than 10 generations onto C57BL/6 mice and assessed for persistence of the heightened aggression alongside disruptions in brain synaptic activity in the amygdala (Hosie et al., 2018). We previously reported gastrointestinal dysfunction in both patients and mice (hybrid Sv129/C57BL/6 background) with the R451C missense mutation in the Nlgn3 gene (Hosie et al., 2019). Interestingly, we also established that the R451C missense mutation confers a reduction in caecal weight in mice bred on different genetic backgrounds and housed in different environmental conditions (Sharna et al., 2020). Our recent reports also demonstrate that this mutation causes dysmotility in the caecum (Qin Lee et al., 2022) and modifies microbial populations in the ileum (Herath et al., 2022). These findings suggest that the R451C mutation influences gut function across different environments. However, given that a comprehensive characterization of gut motility in Nlgn3R451C mice bred on a C57BL/6 genetic background has not yet been conducted, there has been limited capacity for comparison of these findings with a substantial proportion of the existing literature describing C57BL/6 intestinal physiology.
Here, we assess gastrointestinal motility patterns of wild-type (WT) and Nlgn3R451C mice. We demonstrate changes in intestinal transit in vivo as well as altered gastrointestinal motility patterns in isolated regions of both the small intestine and colon of C57BL/6 Nlgn3R451C mutant mice.
2. Results
2.1. Faster gastrointestinal transit in Nlgn3R451C mice
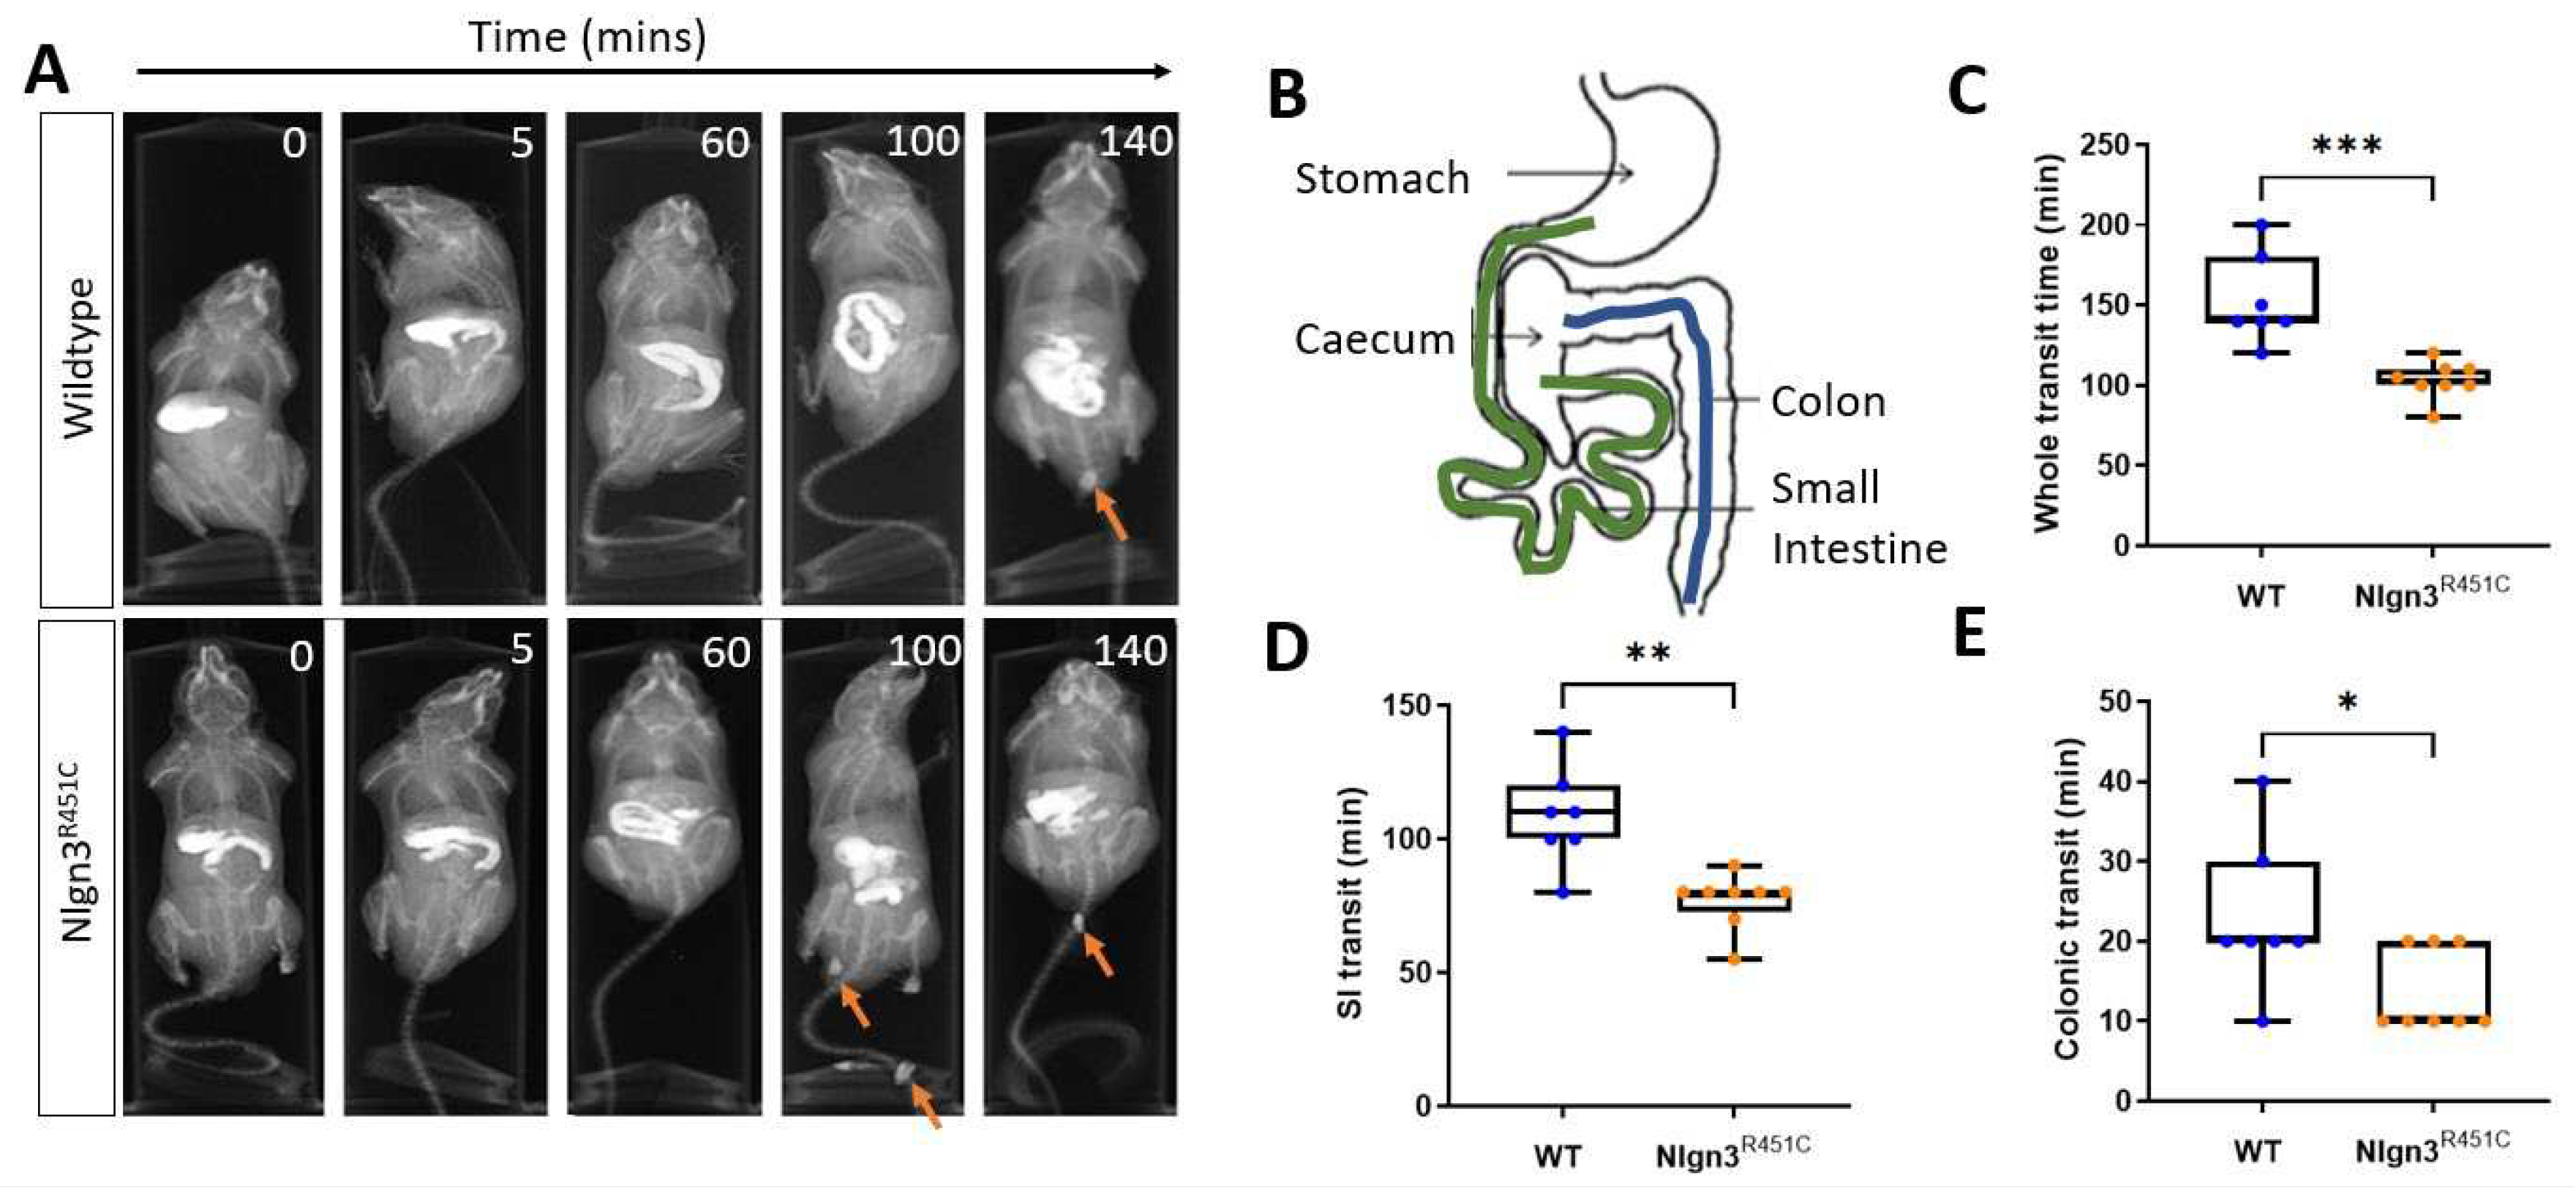
Gastrointestinal function was assessed in wild-type and Nlgn3R451C mice using in vivo x-ray imaging. Transit times were compared between Nlgn3R451C (n=8) and wild-type (WT) mice (n=7) by examining the time taken for BaSO4 to travel from the stomach to the anus (whole transit time; WTT), stomach to the caecum (small intestinal transit time; SITT), and the proximal colon to the anus (colonic transit time; CTT) (Figure 1A-B).
Transit of BaSO4 throughout the full length of the gastrointestinal tract was faster in Nlgn3R451C mice compared to wild-types (WT: 152.9 ± 10.4 min, Nlgn3R451C: 105.6 ± 4.58 min, p=0.0004; Figure 1C). Regional-specific comparisons indicated that transit times were decreased in both the small and large intestine in Nlgn3R451C compared to wild-type mice (SITT WT: 108.6 ± 7.05 min, Nlgn3R451C: 76.88 ± 3.65 min; p=0.0011;
Figure 1D) (CTT WT: 22.86 ± 3.60 min, Nlgn3R451C: 13.75 ± 1.83 min; p=0.0354, Figure 1E).
Figure 1.
Faster in vivo gastrointestinal transit in Nlgn3R451C mice. A) Representative x-ray images showing transit of barium sulphate in gastrointestinal tract and faecal pellets (arrows). B) Diagram of mouse full length gastrointestinal tract indicating regions measured for small intestinal (green) and colonic (blue) transit. Whole transit time (C), small intestinal transit time (D) and colonic transit time (E) were compared between WT (n=7) and Nlgn3R451C (n=8) mice. Data represented as boxplots of mean, 25th and 75th percentile, range, and individual data points. Student’s t-test *p<0.05, **p<0.01, ***p<0.001.
2.2. Reduced small intestinal smooth muscle tone in Nlgn3R451C mice
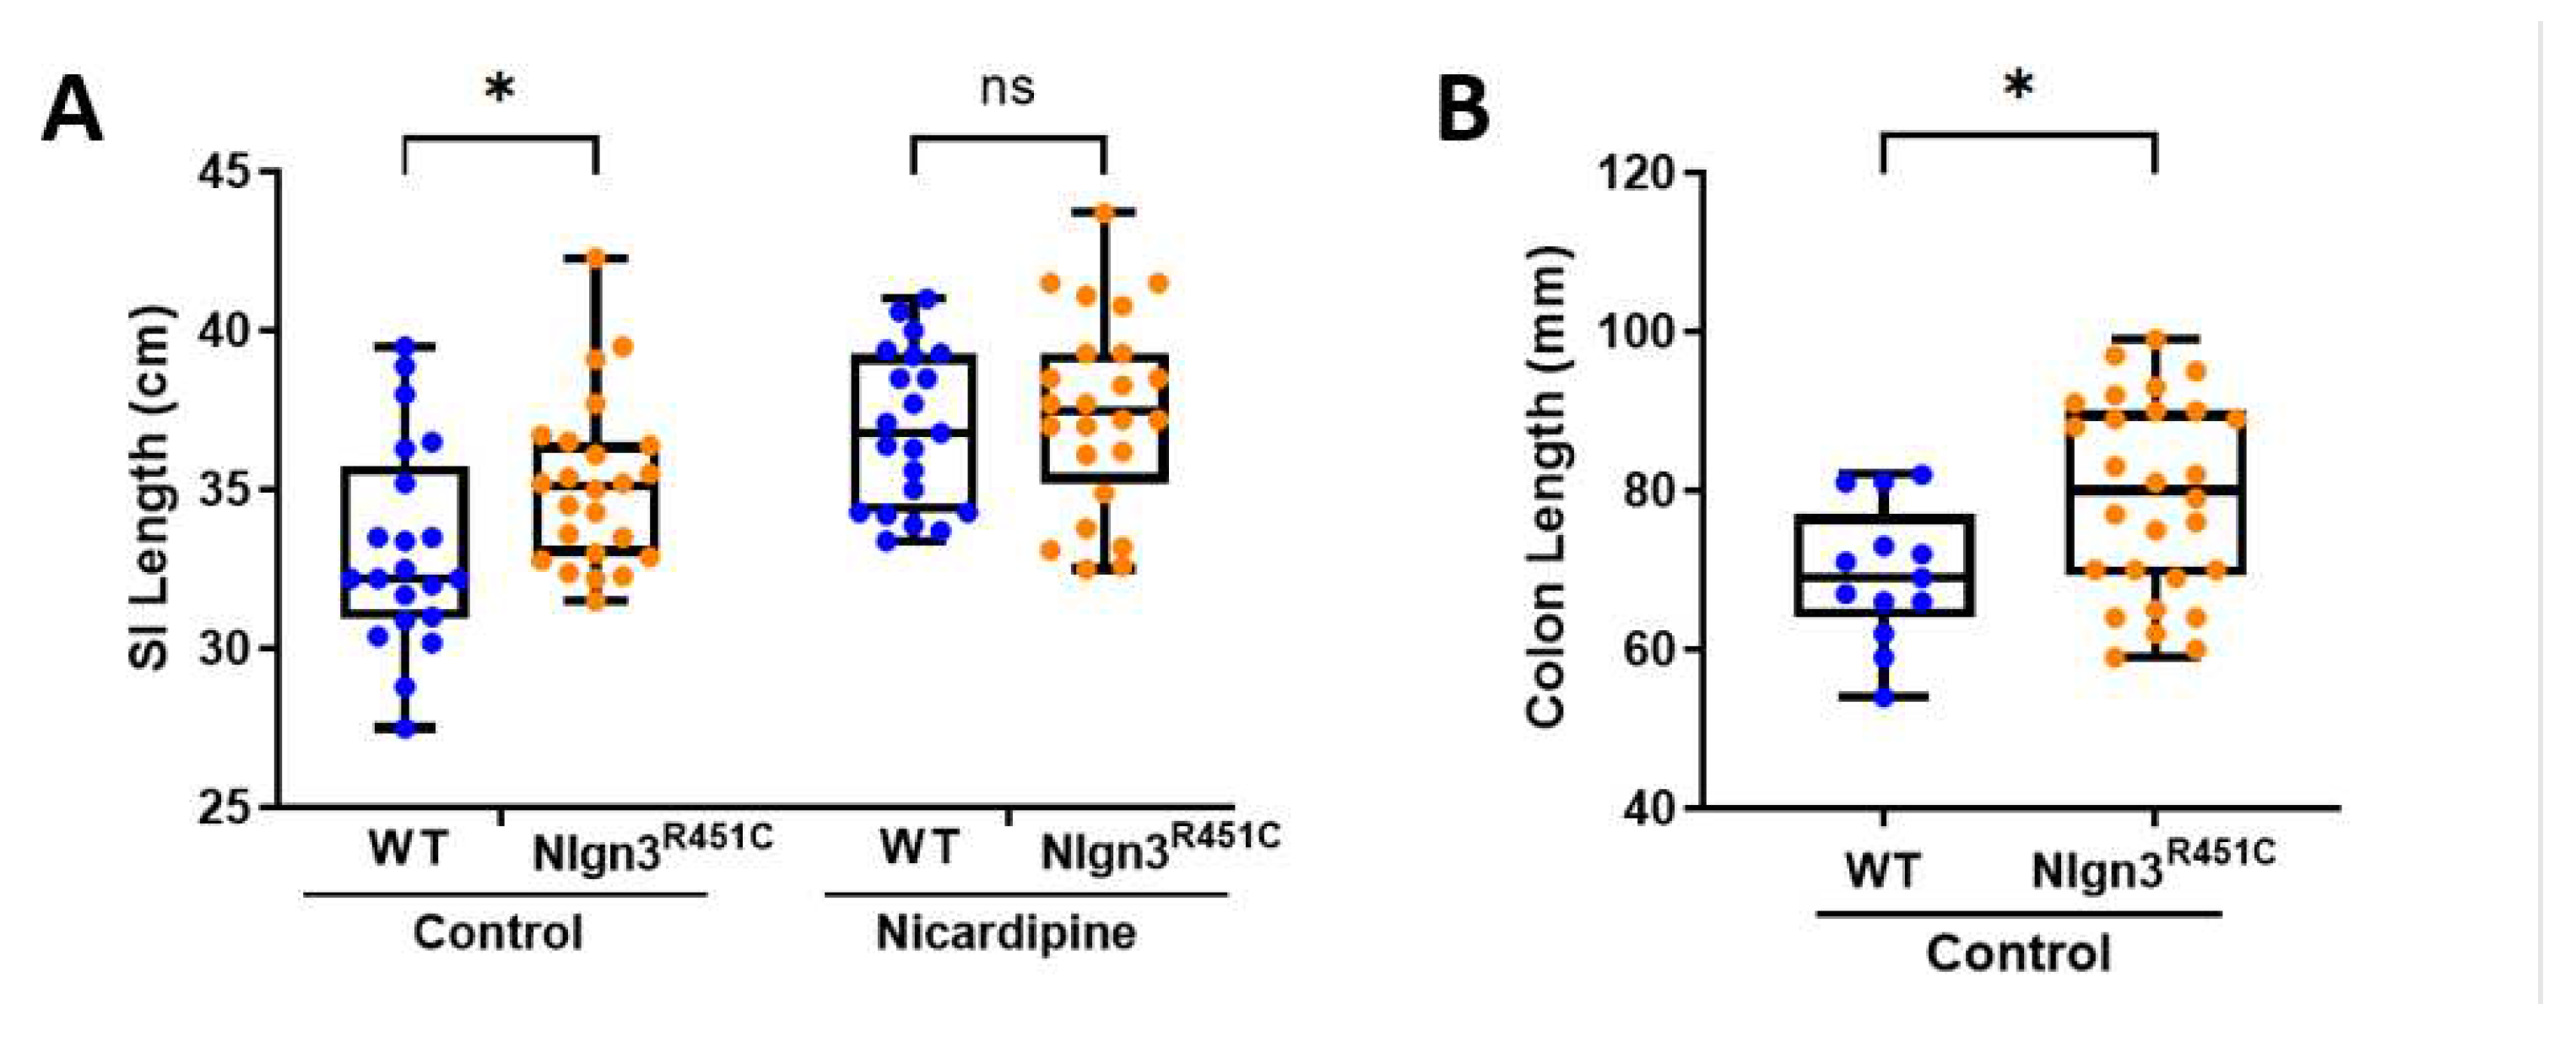
Small intestinal lengths were compared prior to and after incubation in the smooth muscle relaxant and calcium channel blocker, nicardipine, in 21 wild-type and 24 Nlgn3R451C mice. Initially, compared to wild-types, Nlgn3R451C mice had longer small intestines (WT: 33.16 ± 0.70 cm; Nlgn3R451C: 35.15 ± 0.53 cm p=0.044; 2-way ANOVA test, Sidak correction) (Figure 2A). However, following incubation in nicardipine, although the average length of the small intestine increased for both wild-type and Nlgn3R451C samples, there was no difference in the gut length between genotypes (WT: 36.91 ± 0.54 cm, Nlgn3R451C: 37.45 ± 0.62 cm; p=0.78; 2-way ANOVA test, Sidak correction). These findings suggest that Nlgn3R451C mice have reduced small intestinal smooth muscle tone compared to wild-types.
Colon lengths were measured from 21 wild-type and 28 Nlgn3R451C mice. Similar to the observations in the small intestine, Nlgn3R451C mice had longer colons compared to wild-types (WT: 69.48 ± 2.38 mm, Nlgn3R451C: 79.25 ± 2.33 mm; p=0.014; Student’s t-test) (Figure 2B).
Figure 2.
Longer small intestinal and colon length in Nlgn3R451C mice. A) Wild-type (WT) and Nlgn3R451C small intestinal (SI) gut length in the active state (Control) and after incubation in 100 µM of the muscle relaxant nicardipine (*P>0.05 2-way ANOVA test, Sidak correction). B) Increased colon length in Nlgn3R451C mice (Student’s t-test. *P>0.05).
2.3. Reduced small intestinal resting diameter and increased intra-PCC frequency in Nlgn3R451C mice
Although it is well established that the R451C mutation in Neuroligin-3 alters neuronal signalling in the brain, little is known about how this mutation impacts the nervous system of the gastrointestinal tract. To examine impacts on the enteric nervous system (ENS), ENS-regulated intestinal motility patterns were compared in mutant and wild-type mice. Given that different motility patterns, corresponding with known regional-specific physiological roles, occur along the length of the gut, regions of the mouse small intestine (i.e., the ileum and the jejunum) in addition to the colon were assessed to determine region-specific changes and allow a topographic assessment of the impact of the mutation along the gut.
Historically, much gastrointestinal motility research focused on the colon, partly due to the difficulty involved in recording the more complex and seemingly irregular motility patterns in the small intestine. Measurement of motility patterns in the small intestine was pioneered in the guinea pig (reviewed in Costa et al., 2022) using video imaging techniques (Hennig et al., 1999). These methods have been translated for utilization in mouse tissue preparations, allowing consistent motility patterns to be recorded and compared in the jejunum of BALB/c and C57BL/6 mice (Neal et al., 2009). Alternative methods, such as the utilization of pressure transducers to measure gut contractility, have also been used in the small intestine of mice and have enabled the comparison of motility patterns in the ileum, jejunum and along the entire gastrointestinal tract (Abdu et al., 2002; Costa et al., 2020; Seerden et al., 2005).
In this study, we have built on previous video imaging of the gut motility experiments to record from small intestinal regions of the mouse gastrointestinal tract. Specifically, we identified that increasing luminal pressure above our previously reported colonic recording settings (Balasuriya et al., 2016; Hosie et al., 2019) enabled consistent recordings of propagating contractile complexes (PCCs) in the mouse jejunum and ileum. In our experimental set up, a luminal pressure of 6-6.5 cm H2O provides increased consistency in the recorded contractile patterns compared to approximately 2-3 cm H2O as is standard for colon preparations (Balasuriya et al., 2021; Leembruggen et al., 2020; Swaminathan et al., 2016). We identified that the level of applied intraluminal pressure is a critical element for successful recordings of small intestinal motility patterns. This approach, combined with the development of enhanced edge detection software for analysis of the rodent gut contractions in ex vivo preparations (Abo-Shaban et al. 2023), enabled a more accurate comparison of motility parameters across experimental groups.
Figure 3.
Comparison of SI gut motility patterns in WT and Nlgn3R451C mice. Spatiotemporal maps from A, C) jejunum and B, D) ileum of WT and Nlgn3R451C mice.
Figure 3.
Comparison of SI gut motility patterns in WT and Nlgn3R451C mice. Spatiotemporal maps from A, C) jejunum and B, D) ileum of WT and Nlgn3R451C mice.
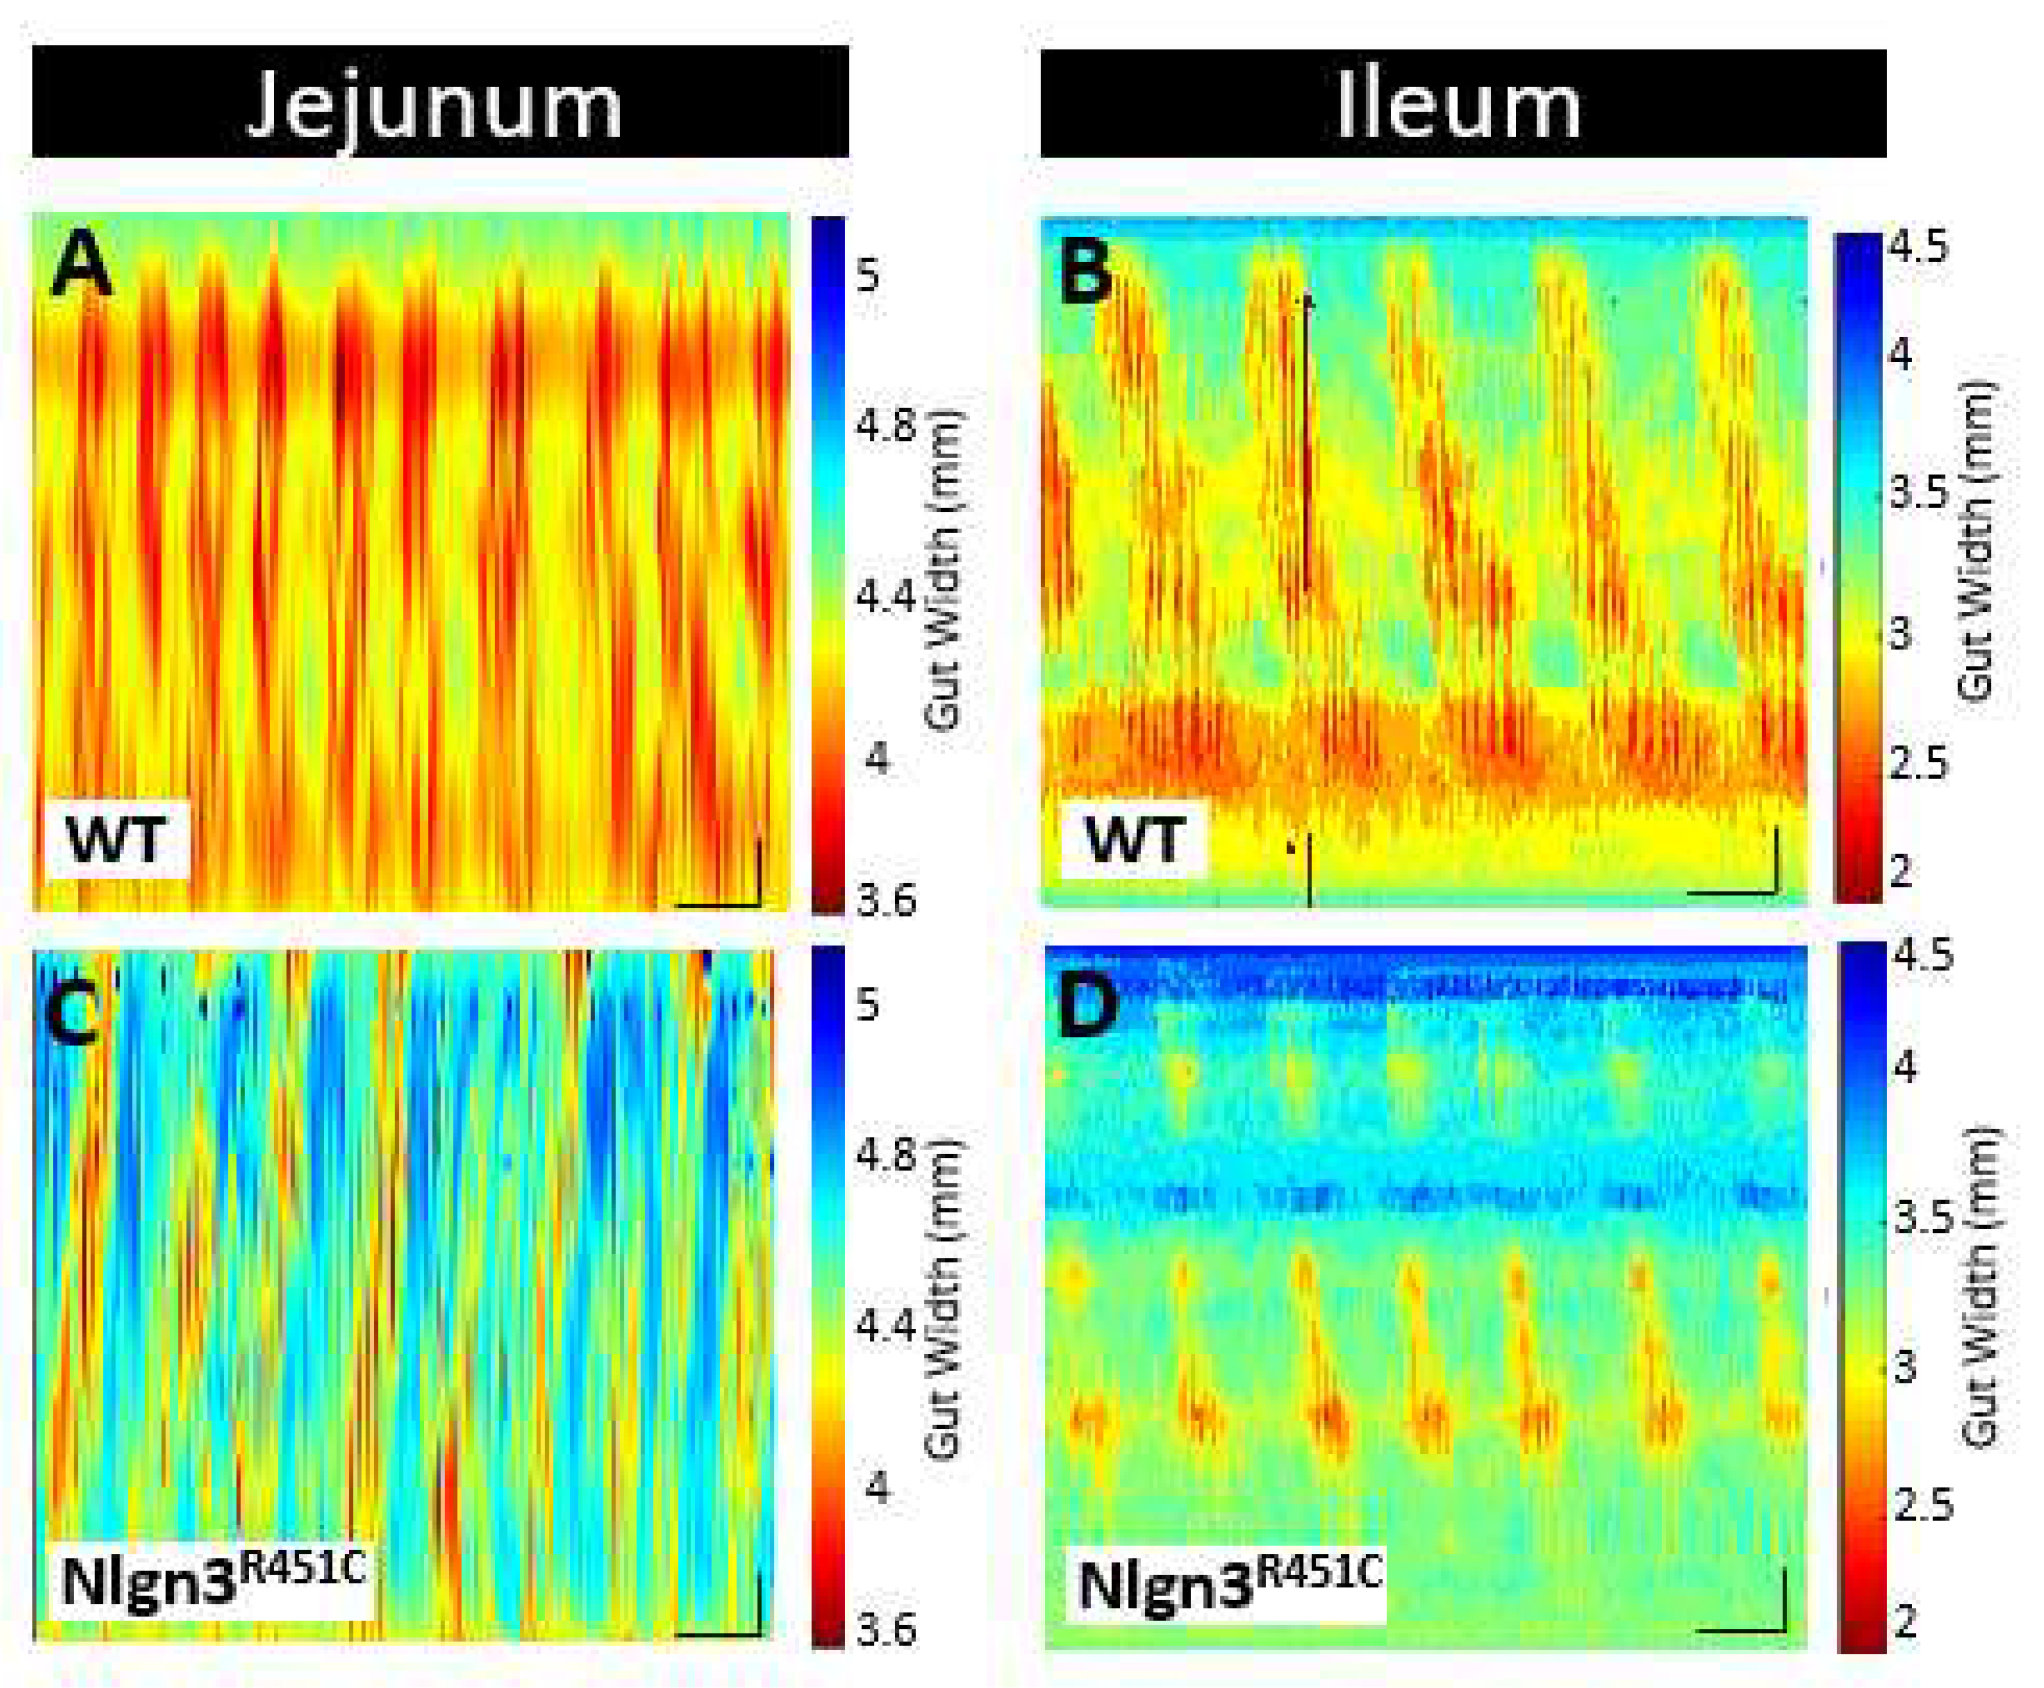
Here we used the ex vivo organ-bath video imaging technique (Swaminathan et al., 2016) to assess motility (i.e., PCCs) in the mouse jejunum and ileum (Figure 3). From the spatiotemporal maps generated, the frequency, quiescence, and velocity of PCCs along the gut segments were compared between wild-type and Nlgn3R451C mice. These comparisons revealed no differences in PCC frequency or velocity between the wild-type and Nlgn3R451C jejunum or the ileum. Measurement of PCC duration at proximal, mid and distal jejunal locations revealed no differences between genotypes (Figure 4A, B). In the ileum, however, PCC duration was shorter in Nlgn3 R451C mice and a corresponding increase in quiescence was also identified in mutant preparations (Figure 4E, F, Table 1).

Table 1.
Small intestinal motility parameters from the jejunum and ileum in wild-type and Nlgn3 R451C mice.
Table 1.
Small intestinal motility parameters from the jejunum and ileum in wild-type and Nlgn3 R451C mice.
| Small intestinal motility parameter | Jejunum | Ileum | ||
|
WT n=17 |
Nlgn3R451C n=16 |
WT n=16 |
Nlgn3R451C n=16 |
|
|
Full length PCC Frequency (No. of PCCs/15 min) |
6.25 ± 0.42 | 6.33 ± 0.37 | 7.17 ± 0.33 | 7.23 ± 0.32 |
| Full length PCC Quiescence (s) | 39.35 ± 5.26 | 37.57 ± 5.76 | 35.8 ± 2.66 | 54.3 ± 6.81* |
| Full length PCC Velocity (mm/s) | 0.47 ± 0.02 | 0.56 ± 0.06 | -0.30 ± 0.13 | -0.35 ± 0.20 |
| Proximal region PCC duration (s) | 30.88 ± 3.97 | 30.79 ± 4.53 | 74.1 ± 5.67 | 58.5 ± 3.98* |
| Mid region PCC duration (s) | 41.59 ± 4.27 | 39.42 ± 5.61 | 85.2 ± 5.59 | 63.4 ± 3.70† |
| Distal region PCC duration (s) | 34.48 ± 2.81 | 34.35 ± 7.84 | 88.3 ± 6.06 | 61.4 ± 6.52† |
Mean ± SEM, genotype comparisons; *P < 0.05 †P < 0.01.
To characterise motility patterns in small intestines from wild-type and Nlgn3R451C mice, we used the enhanced edge detection interface in MATLAB (GutMap, available on request Abo-Shaban et al., 2023). Specifically, we selected three anatomical locations (proximal, mid and distal) in each small intestinal preparation and measured changes in the gut width over a 15 min recording duration. In Nlgn3R451C mice, the jejunal resting diameter was consistently smaller than in wild-type mice (Table 2, Figure 4C). In contrast, when the jejunal constricted diameter was compared between wild-type and Nlgn3R451C mice, no difference was observed (Table 2). In the ileum, cross-sectional analysis revealed no genotype difference in either the resting or constricted diameter (Figure 4G, Table 2).
Table 2.
Regional small intestinal motility parameters from jejunum and ileum in wild-type and Nlgn3 R451C mice.
Table 2.
Regional small intestinal motility parameters from jejunum and ileum in wild-type and Nlgn3 R451C mice.
| Small intestinal motility parameters | Jejunum | Ileum | |||
|
WT n=17 |
Nlgn3R451C n=16 |
WT n=16 |
Nlgn3R451C n=16 |
||
| Resting diameter (mm) | Prox | 4.71 ± 0.12 | 4.21 ± 0.14* | 3.41 ± 0.08 | 3.60 ± 0.09 |
| Mid | 4.67 ± 0.13 | 4.21 ± 0.11* | 3.30 ± 0.08 | 3.42 ± 0.09 | |
| Distal | 4.88 ± 0.13 | 4.32 ± 0.14† | 3.24 ± 0.07 | 3.31 ± 0.08 | |
| Constricted diameter (mm) | Prox | 3.85 ± 0.12 | 3.51 ± 0.12 | 2.68 ± 0.09 | 2.92 ± 0.07 |
| Mid | 3.74 ± 0.12 | 3.45 ± 0.11 | 2.49 ± 0.08 | 2.73 ± 0.08 | |
| Distal | 4.02 ± 0.13 | 3.62 ± 0.13* | 2.50 ± 0.06 | 2.70 ± 0.07 | |
| Intra PCC frequency (Hz) | Prox | 0.58 ± 0.02 | 0.63 ± 0.01* | 0.49 ± 0.02 | 0.48 ± 0.01 |
| Mid | 0.59 ± 0.02 | 0.64 ± 0.01* | 0.49 ± 0.02 | 0.49 ± 0.01 | |
| Distal | 0.58 ± 0.01 | 0.63 ± 0.01* | 0.50 ± 0.01 | 0.49 ± 0.01 | |
Mean ± SEM, genotype comparisons; *P < 0.05 †P < 0.01.
Power spectrum analysis of the contraction diameter over time enabled the calculation of intra PCC frequency (i.e., the frequency of contractile activity within a PCC). In the jejunum, intra PCC frequencies measured at the proximal, mid and distal jejunal cross sections were higher in Nlgn3R451C mice compared to wild-types (Table 2, Figure 4D). We observed similar intra PCC frequencies in the ileum in Nlgn3R451C and wild-type mice (Table 2, Figure 4H).
Figure 4.
Small intestinal dysmotility in Nlgn3R451C mice. In the jejunum of Nlgn3R451C mice, no difference was identified in A) PCC quiescence or B) PCC duration, however the C) resting diameter was reduced and the D) intra PCC frequency was faster in all measured regions. In the ileum of the Nlgn3R451C mice, an increase in E) PCC quiescence and a reduction in F) PCC duration in all measured regions was identified. No difference in the resting diameter or intra PCC frequency was detected between wild-type and Nlgn3R451C mice.

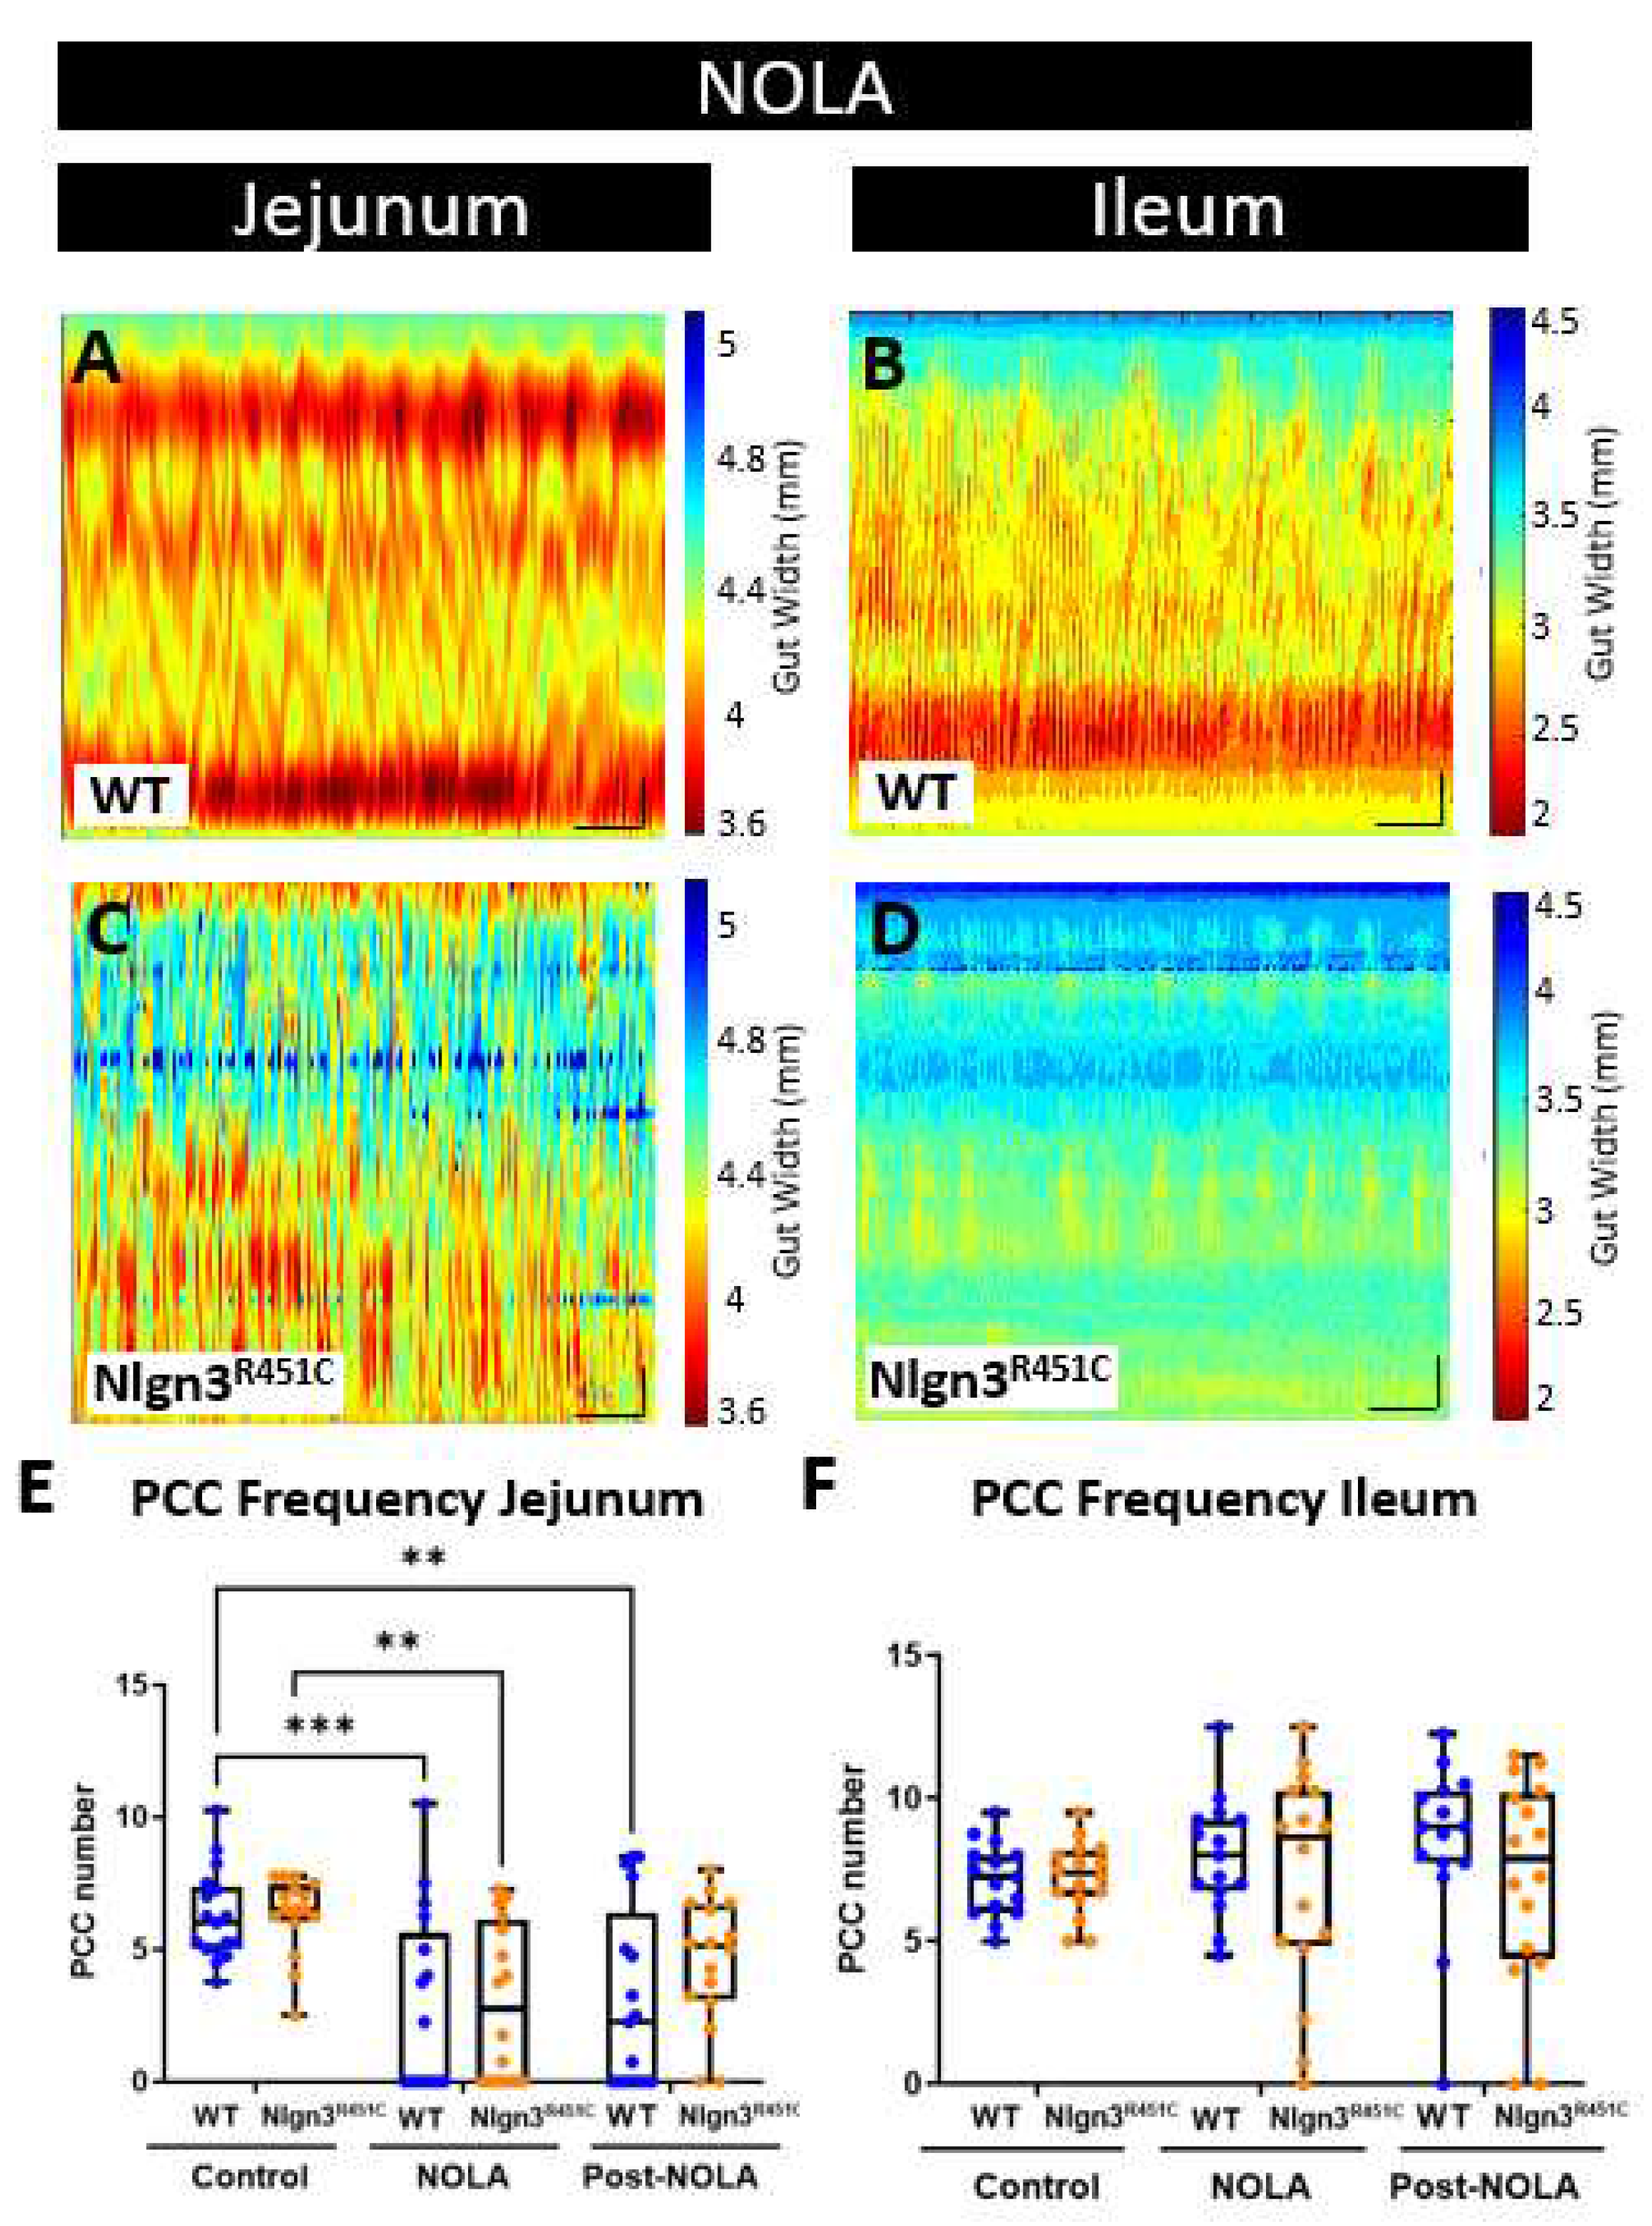
Several neurophysiological studies in mice expressing the R451C mutation have focused on GABA neurotransmission, given its major role as an inhibitory neurotransmitter in the brain. A common finding of these studies is that Nlgn3R451C mice have altered GABAergic neurotransmission in various brain regions (Etherton et al., 2011; Földy et al., 2013; Tabuchi et al., 2007). Therefore, we previously assessed for potential changes in the GABAergic system in the ENS and identified increased sensitivity of colonic activity to gabazine (a GABAA receptor inhibitor) in Nlgn3R451C compared to wild-type mice (Hosie et al., 2019). Within the mouse gastrointestinal tract, the colon expresses significant levels of GABA receptors, therefore, this experimental approach seemed appropriate for the colon. In the mouse small intestine, however, the contribution of GABAergic activity to gut function is relatively minor, the expression of GABA receptors is minimal and GABA acts as an excitatory neurotransmitter on enteric neurons (Koussoulas et al., 2018). In contrast with the CNS, inhibitory signalling in the intestine occurs at neuromuscular junctions, and is predominantly exerted via nitric oxide in the ENS. In this study, we therefore elected to modulate nitric oxide production and measure small intestinal activity using the video-imaging organ bath assay approach. To inhibit nitric oxide production, we incubated small intestinal segments in the nitric oxide synthase inhibitor, N-nitro-L-arginine (NOLA) and performed video imaging of motility patterns.
In the jejunum, PCC motility patterns were modified in the presence of NOLA (Figure 5A). Specifically, the increase in contractile activity resulted in PCCs being no longer distinguishable in 11 out of 17 of wild-type and 9 out of 16 of the Nlgn3R451C gut segments. On average, NOLA reduced the number of defined PCCs in the jejunum in both WT and Nlgn3R451C (WT (control): 6.25 ± 0.4, WT (NOLA): 2.71 ± 0.83; Nlgn3R451C (control): 6.33 ± 0.37, Nlgn3R451C (NOLA): 3.00 ± 0.74 PCCs; mean ± SEM; Figure 5A, C, E). Interestingly, in contrast, NOLA had no significant effect on PCC frequency, velocity, duration or length in the ileum (Figure 5B, D, F).
Figure 5.
Effect of NOLA on small intestinal motility patterns in wild-type and Nlgn3R451C mice. Spatiotemporal maps in WT and Nlgn3R451C mouse A) jejunum and B) ileum following incubation with NOLA. Average number of PCCs per 15 min before and after incubation with NOLA in C) jejunum and D) ileum in WT and Nlgn3R451C mice. 2way ANOVA test, Sidak correction *p<0.05, **p<0.01, ***p<0.001.
2.4. Increased short colonic contractions in Nlgn3R451C mice
Colonic motility was compared using the ex vivo organ-bath video imaging technique in 17 wild-type and 14 Nlgn3R451C mice. Previous findings examining colonic motility in Nlgn3R451C mice bred on a mixed background strain showed a decrease in the CMMC frequency in the presence of the GABAA receptor antagonists, gabazine and bicuculline (Hosie et al., 2019). Our previous study (Hosie et al., 2019) showed that the decrease in CMMC frequency was more pronounced in response to gabazine. Therefore, to tease out potential differences in motility patterns in WT and Nlgn3R451C C57BL/6 colons, we similarly applied gabazine to the organ-bath. For these experiments examining colonic motility, gabazine was utilised as opposed to NOLA to determine if findings in the brain are replicated to some extent in the ENS. In addition, as outlined previously, the mouse colon is a more suitable region to test GABAA receptor responses compared to the small intestine due to the greater expression of GABA receptors in the mouse colon compared to the small intestine (Sang and Young, 1990).
Figure 6.
Gabazine reduces the proportion of short colonic contractions in Nlgn3R451C mice. Representative spatiotemporal maps of WT and Nlgn3R451C colonic activity in A) control conditions and B) after administration of 10 µM gabazine to the organ bath. C) Effect of gabazine on CMMC frequency in WT and Nlgn3R451C mice. No changes were observed for D) resting colon diameter or E) CMMC length; WT n = 18; Nlgn3R451C n = 14. One-way ANOVA Holm-Sidak multiple comparisons test. *p<0.05, ** p<0.005, *** p<0.001.
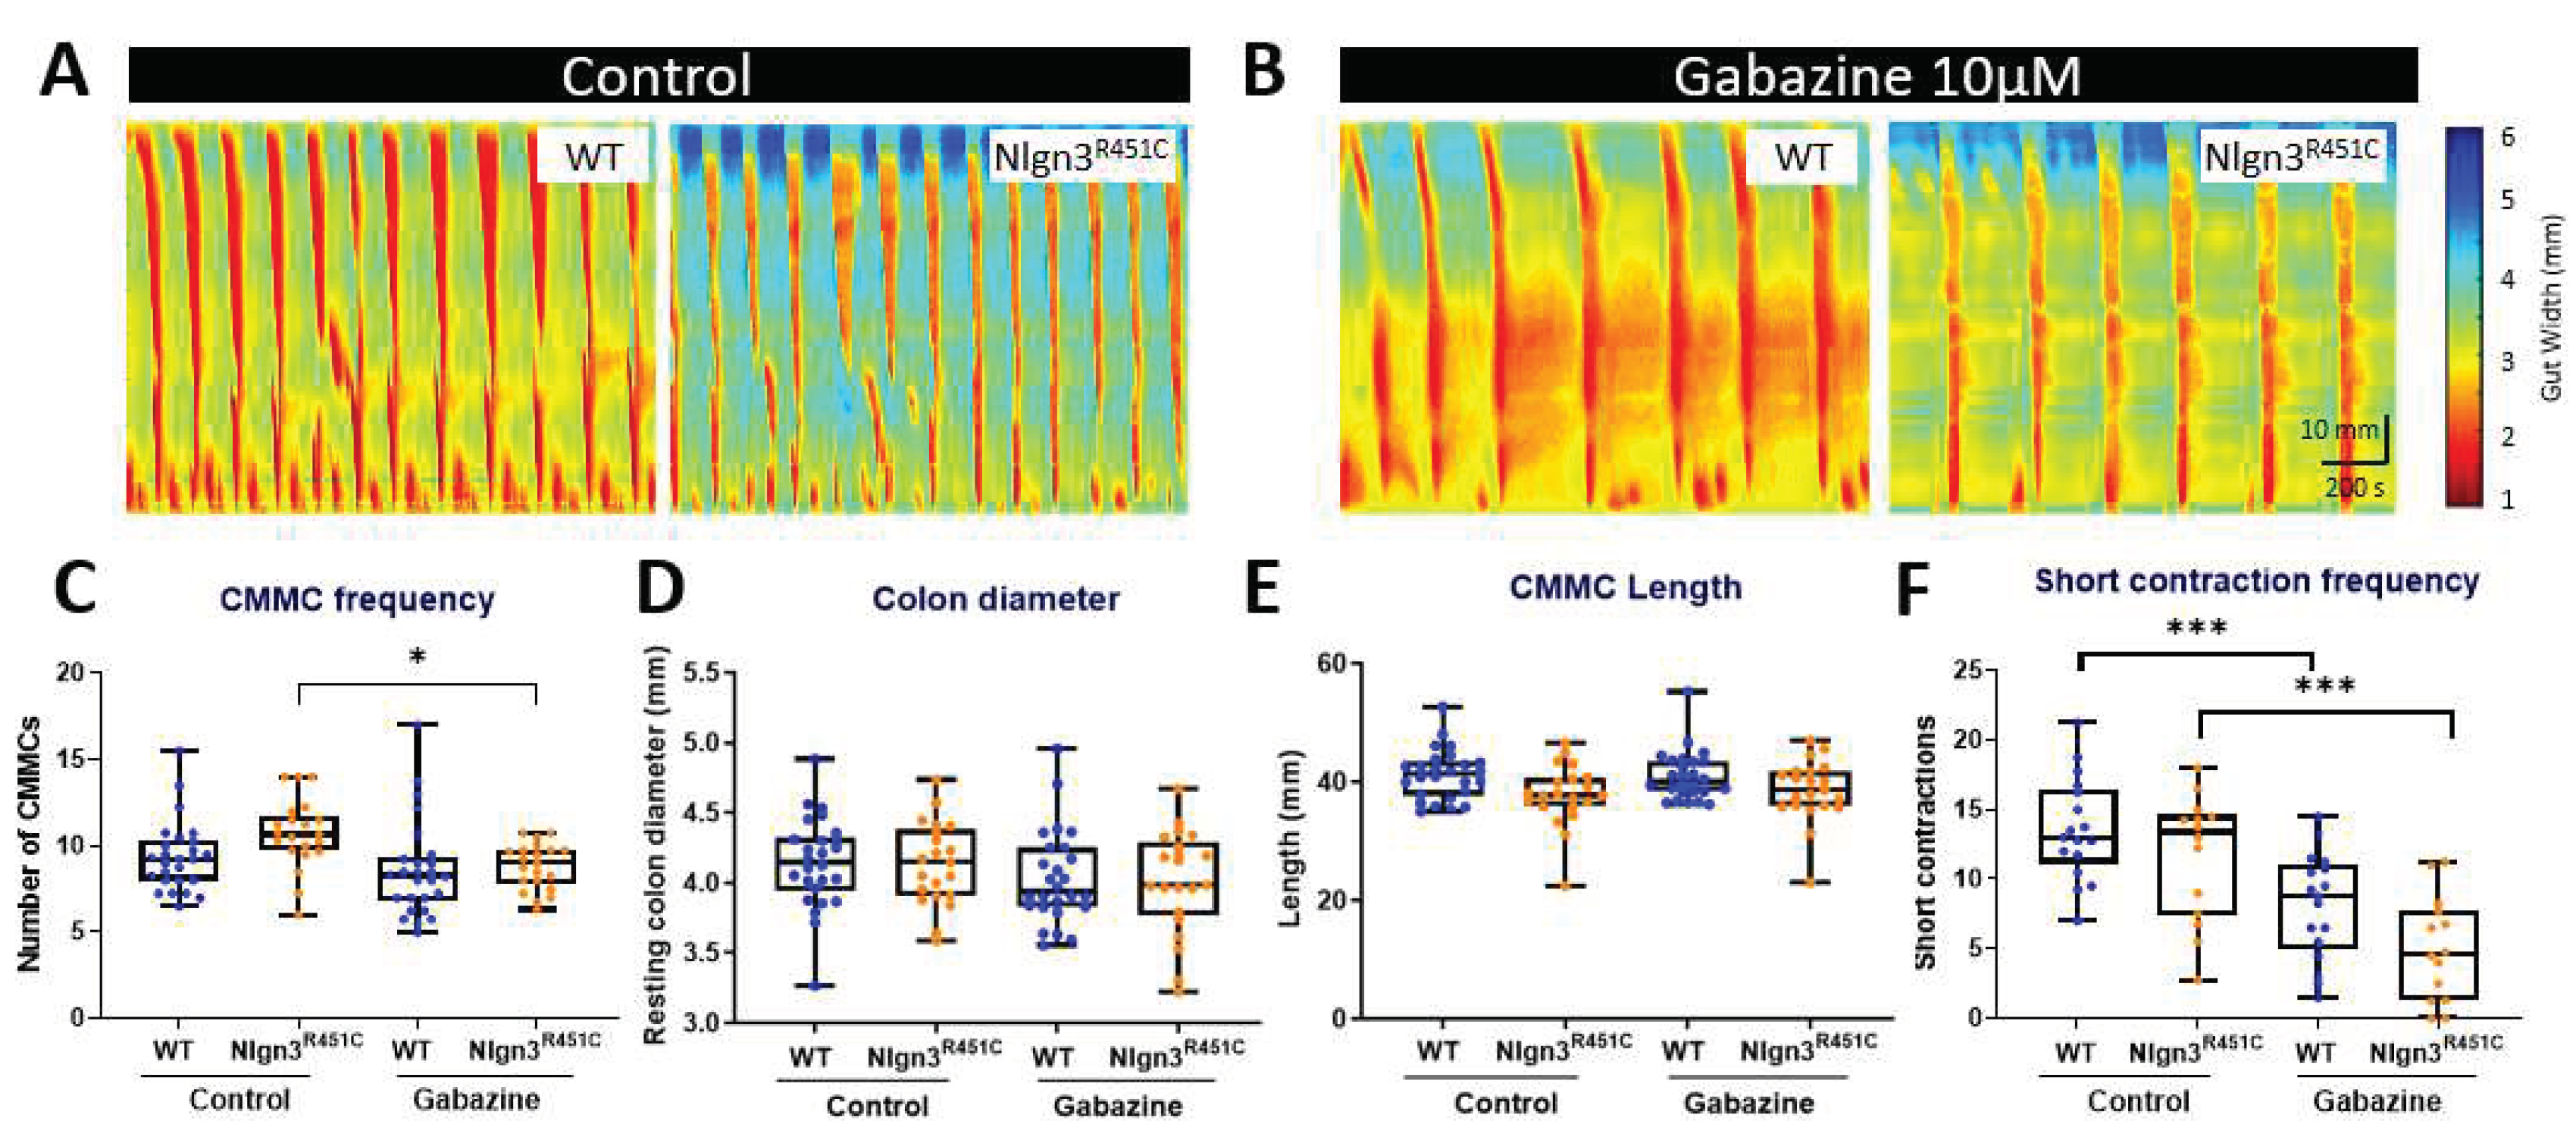
Colonic motility motor complexes (CMMCs) in WT and Nlgn3R451C were compared in control conditions and in the presence of the GABAA receptor antagonist gabazine (Figure 6A and B). Although the mean CMMC frequency was higher in Nlgn3R451C under control conditions, this did not reach statistical significance (WT control: 9.38 ± 0.4, Nlgn3R451C control: 10.71 ± 0.4, mean ± SE, p=0.07). Gabazine reduced CMMC frequency in both WT and Nlgn3R451C colons, however, this was statistically significant in Nlgn3R451C, but not WT colons (WT control: 9.38 ± 0.4, gabazine: 8.63 ± 0.5, mean ± SEM, p=0.51; Nlgn3R451C control: 10.71 ± 0.4, gabazine: 8.81 ± 0.3, mean ± SEM, p=0.03; Figure 6C). There were no differences in resting colon diameter (Figure 6D) or CMMC length (Figure 6E) in control conditions or in the presence of gabazine.
We also measured short anal contractions which are defined as contractions that extend less than 50% of the full length of the colon segment and appear in the distal region of the colon. Under control conditions, WT and Nlgn3R451C colons displayed similar anal short contraction frequencies (control WT: 13.62 ±0.9, Nlgn3R451C: 11.65 ±1.2, mean ± SEM, p=>0.99). In the presence of gabazine, the short contraction frequency was reduced in both WT and Nlgn3R451C colons. Although Nlgn3R451C mice had fewer short anal contractions compared to WT, this was not statistically different (gabazine WT: 8.09 ± 0.92, gabazine Nlgn3R451C: 4.98 ± 1.00, mean ± SEM, p=0.64; Figure 6F). When analysing the number of short contractions as a percentage of total colonic contractions, Nlgn3R451C mice had a lower percentage of short anal contractions compared to WT (gabazine WT: 48.18% ± 3.92, gabazine Nlgn3R451C: 32.13% ± 5.22, mean ± SEM, p=0.016).
3. Discussion
Here we confirm that C57BL/6 mice with the R451C mutation share a similar phenotype consisting of faster gastrointestinal transit and increased sensitivity to the GABAA receptor antagonist, gabazine, as previously reported in Nlgn3R451C mixed background mice. In this study, we additionally examined whole gut transit, smooth muscle tone and intestinal motility patterns in the ileum, jejunum and colon of wild-type and Nlgn3R451C mice.
We observed faster full-length gastrointestinal transit in Nlgn3R451C mice. Transit times were also reduced in the small intestine and colon, suggesting that the impact of the R451C mutation on gastrointestinal transit is not restricted to a specific gut region. Notably, children with ASD are seven times more likely to have diarrhoea than neurotypical children (Schieve et al., 2012), therefore a reduction in transit time in this mouse model may provide a clinically relevant tool for future mechanistic analyses. Our previous findings in Nlgn3R451C mice examined animals bred on a mixed genetic background and showed increased transit in the small intestine alongside elevated numbers of nNOS neurons in the jejunum (Hosie et al., 2019). Interestingly, these findings are in contrast with another report in mice with faster gastrointestinal transit at day 3 post treatment with anti-cancer agent, 5-fluorouracil (5-FU), associated with a reduction in myenteric nNOS neurons but slower gastrointestinal transit at day 14 post 5-FU treatment (McQuade et al., 2016). A slower gastrointestinal transit time associated with increased proportion of myenteric nNOS neurons was observed following 14 days of treatment with another chemotherapeutic drug, oxaliplatin (McQuade et al., 2018). Differential effects on gastrointestinal transit and enteric nNOS neurons might be due to the differences in the mechanisms of action of various compounds, with 5-FU causing intestinal inflammation and oxaliplatin causing direct toxicity. Moreover, morphological and functional changes in other types of enteric neurons could affect gastrointestinal transit, as was observed in irinotecan-treated mice, which had increased intestinal transit and acute secretory diarrhoea at day 3 post-treatment associated with an increased number of cholinergic neurons and fibres (McQuade et al., 2017). Chronic intestinal inflammation causes indiscriminate loss of enteric neurons and increased colonic transit time (Robinson et al., 2017; Sahakian et al., 2021). Alterations of intestinal transit might result from modulation of both extrinsic (sympathetic and parasympathetic) and intrinsic innervation of gastrointestinal tract, changes in intestinal smooth muscle tone, morphological and functional changes of interstitial cells of Cajal and neuromuscular transmission. Previous examples of inflammatory dysfunction that may impact gut motility in preclinical models of ASD include our previous report in which we identified changes in Iba-1 macrophage density and morphology in gut-associated lymphoid tissue in the caecum of Nlgn3R451C mice under control conditions (Sharna et al., 2020). Further exploration is needed to determine the mechanism underlying increased transit in Nlgn3R451C mice, but given that individuals with ASD often experience alternating constipation and diarrhea, the presence of this clinically relevant phenotype provides a strong rationale for the use of this model to investigate causes of gastrointestinal symptoms experienced in ASD.
Surprisingly, we found that Nlgn3R451C mice have longer small intestines and colons but that this was abolished in small intestinal preparations following incubation in the muscle relaxant, nicardipine. The identification of longer colons in Nlgn3R451C mice bred on a mixed genetic background under control conditions suggests that muscle tone is similarly reduced across different gut regions and genetic backgrounds. We, therefore, speculate that Nlgn3R451C mice have decreased small intestinal longitudinal and circular smooth muscle tone that may contribute to the increased colon length we observed in the mutants. Although the biological mechanism underlying this increased gut length is unknown, the R451C mutation might potentiate the inhibitory role of NO to reduce smooth muscle activity under baseline conditions. It is well-established that Neuroligin-3 interacts with the rate-limiting enzyme for NO production (neuronal nitric oxide synthase; NOS) (Brenman et al., 1996; Coley & Gao, 2018; Irie et al., 1997). Furthermore, we previously showed an increase in the number of nNOS neurons in the jejunal myenteric plexus of Nlgn3R451C mice (Hosie et al., 2019) which could boost the production of neuronal NO in these mice. To determine if this is the case, further analyses of wild-type and Nlgn3R451C gastrointestinal tissue at the gene and protein expression level are required.
Nlgn3R451C mice have altered small intestinal motility as assessed via ex vivo organ bath assays. We observed that the Nlgn3R451C jejunum was more constricted under resting conditions. Given that we showed an increase in small intestinal length in these mice, this elongation (presumably involving longitudinal smooth muscle relaxation) occurs simultaneously with an elevated contraction of the circular smooth muscle (Costa et al., 2013). Also in the jejunum, Nlgn3R451C mice showed an increase in intra PCC frequency. This high frequency component of the spatiotemporal map has previously been identified to oscillate at a similar frequency to slow waves in the jejunum (Neal et al., 2009; Seerden et al., 2005). Slow waves are a rhythmical depolarisation of the smooth muscle and are driven by the pacemaker activity of the interstitial cells of Cajal (ICCs)(Huizinga & Chen, 2014; Huizinga & Lammers, 2009). ICCs are located within the myenteric plexus and are electrically coupled to each other and to the smooth muscle (Sanders et al., 2006). In the small intestine, the amplitude of slow waves is not sufficient to trigger smooth muscle action potentials and muscle contraction, therefore an additional neurogenic component is required for typical motility patterning. In Nlgn3R451C mice, the observed increase in intra PCC frequency may be a result of altered synaptic activity in the enteric neuronal pathway that influences slow wave generation.
In the Nlgn3R451C mouse ileum, the motility phenotype differed from the jejunum. We found that the quiescent period between ileal PCCs was increased, along with corresponding shorter PCC durations in the proximal, mid and distal regions of the ileum. Potentially the reduction in overall PCC/churning time may cause the general flow of gut contents to be less inhibited and, therefore, have a reduced/faster transit time. In turn, less PCC/churning time could also subtly influence the rate of absorption of nutrients and water from the gastrointestinal content in these mice. This theory aligns with our data showing faster intestinal transit using X-ray imaging. How the R451C mutation influences the duration of PCCs is unclear, although this could involve an imbalance of neurogenic excitation and inhibition in this region of the gastrointestinal tract.
In this study, we compared regional gastrointestinal motility patterns using an enhanced software interface in MATLAB, including a novel edge detection algorithm for video imaging of gut contractile activity in fresh tissue preparations (Abo-Shaban et al., 2023). Although the development of the software interface and optimization of experimental conditions (including the level of applied pressure to the lumen of the gastrointestinal tissue sample) improved our ability to record and analyse motility patterns in the mouse jejunum and ileum, the interpretation of these complex motility patterns occurring in the small intestine continues to be developed. Further investigations are needed to understand how in vivo gastrointestinal transit data correlates with in vitro motility patterns. For example, some of our ex vivo findings (i.e., an increase in intra PCC frequency in the jejunum and a higher speed of PCC in the ileum) appear to correlate with faster transit seen in vivo in Nlgn3R451C mice via X-ray imaging, but potential correlations across preparations for other parameters, such as the observed increase in baseline jejunal constriction in Nlgn3R451C mice, are less straightforward in terms of our understanding of how they contribute to the physiological profiles for the intact animal.
We found reduced numbers of short contractions occurring in the distal colon of Nlgn3R451C mice in response to the GABAA receptor antagonist, gabazine, suggesting an increased sensitivity or potentially fewer functional GABAA receptors in the Nlgn3R451C mouse colon. Currently, the precise function of distal short contractions in the mouse colon is unknown. Future studies may assist in gaining further insights into their physiological role/s, however, until then they provide a useful comparison tool for colonic motility patterning across mouse models of a range of clinically relevant disorders (Swiderski et al., 2020). The results of the current study are similar to our previous findings in the Nlgn3R451C mouse model bred on a mixed background strain (Hosie et al., 2019) and provide further evidence for GABAA-mediated colonic dysmotility in mice expressing the R451C mutation in Neuroligin-3. Overall, these findings suggest that GABAA receptors may be involved in mediating the initiation of colonic short contractions.
In all, these findings suggest that the autism-associated R451C missense mutation in the Nlgn3 gene impacts the structure and function of the mouse gastrointestinal tract. The presence of the Neuroligin-3 cell adhesion protein in the brain is well established (Budreck & Scheiffele, 2007; Tabuchi et al., 2007), and Nlgn3 is also expressed in the mouse gastrointestinal tract (Herath, Bornstein, et al., 2022; Hosie et al., 2019; Leembruggen et al., 2020). In fact, we have recently detected Nlgn3 mRNA in most enteric neuronal and glial populations in the mouse ileum (Herath, Cho, et al., 2022). It is possible that the regional differences in motility we observed are caused by different expression levels of Nlgn3 in the jejunum, ileum and colon, however this remains to be determined. Characterising the expression profile of Nlgn3 within the enteric nervous system is crucial to understanding the impact of the R451C mutation on gut function and is an ongoing area of investigation.
4. Materials and Methods
Mice
Nlgn3R451C mice were initially obtained from The Jackson Laboratory (Bar Harbour, Maine, USA) on a mixed background (Sv129/ImJ/C57BL/6), subsequently backcrossed with C57BL/6 mice for more than 10 generations and maintained on the C57BL/6 genetic background.
Mice used for X-ray imaging experiments were 14 weeks old and imported from the Florey Institute (Parkville, Victoria, Australia) to the RMIT Animal Facility (RAF; Bundoora, Victoria, Australia). Mice used for measurements of gut length, intestinal motility and immunohistochemistry experiments were aged between 8-14 weeks and euthanized by cervical dislocation. All experimental procedures undertaken on the mice were approved by the RMIT University Animal Ethics Committee (AEC 1727).
Whole body X-ray imaging
The X-ray imaging technique was undertaken as detailed by McQuade et al., 2016 (McQuade et al., 2016). In brief, prior to X-ray imaging, mice underwent an acclimatization period of 1 week where they were conditioned to oral gavage by having a plastic gavage tip (Instech Laboratories Inc., Plymouth Meeting, PA, USA; 20 ga x 30 mm) inserted at least three times for each animal, with at least 24 hours between each conditioning session. Mice were also conditioned for restraint by placing a transparent plastic restraint tube (Terumo Corporation, Tokyo, Japan; 50 mL) into the mouse cages at least 24 hours prior to the X-ray experiment.
For the X-ray procedure, 0.2 mL of barium sulphate (BaSO4; X-OPAQUE-HD, 2.5 g/mL) was administered to mice via oral gavage. Mice were then immobilized in the prone position inside a restraint tube and X-ray imaged using Fujifilm cassettes (24 × 30 cm) and a HiRay Plus Porta610HF X-ray apparatus (JOC Corp, Kanagawa, Japan; 50 kV, 0.3 milliampere-second, 60 ms exposure time). X-rays were captured immediately after administration of BaSO4, every 5 min for the first hour, every 10 min for the second hour, then every 20 min afterwards, until the first faecal pellet containing BaSO4 was expelled. Animals were free to move between X-rays and closely monitored during and after all procedures. Images were developed via a Fujifilm FCR Capsula XLII and analysed using eFilm 4.0.2 software.
The rate of gastrointestinal transit was measured by inferring the time (in minutes) it took for BaSO4 to reach different regions of the gut. The transit times of interest were from the stomach to the caecum (small intestinal time; SITT), proximal colon to the anus (colonic transit time; CTT), and the stomach to the anus (whole transit time; WTT). Only mice that produced faecal pellets containing BaSO4 as visualised in the X-ray images were included in the study (out of 16 mice 1 Nlgn3R451C mouse was excluded for not producing pellets in the time frame).
Gut length measurement
The entire gastrointestinal tract was carefully separated from the mesentery and removed from culled adult male WT and Nlgn3R451C mice. Using dissecting scissors, the small intestine was detached from the stomach and caecum, laid onto a flat surface and measured using a tape measure. A digital image of the tissue was then acquired. To assess the maximal length of the tissue, a proportion of the small intestinal gut preparations were then placed in a glass beaker containing the L-type calcium channel blocker, nicardipine (3 mM) for 20 min. The small intestinal preparations were then removed from the nicardipine solution, re-measured and re-imaged for comparison.
Colons from WT and Nlgn3R451C mice were dissected, and the surrounding mesentery removed. Colon preparations were attached to an organ bath using a small insect pin (Australia Entomology supplies, AUS). Tissue preparations were positioned adjacent to a printed ruler located in the base of the organ bath and a digital image was acquired. Colon lengths were measured using Image J software and calibrated according to the ruler measurements.
Video imaging gut motility small intestine
Adult male WT and Nlgn3R451C mice (aged 8-14 weeks) were culled by cervical dislocation and the entire gastrointestinal tract was removed. Jejunal sections measuring approximately 6 cm in length were taken from a position located 5 cm anal from the stomach. Ileal tissue measuring approximately 5 cm in length was removed from a location directly anal from the caecum.
All intestinal motility experiments were carried out using our previously described video imaging technique approach for recording colonic motility in mice (Swaminathan et al., 2016). As previously reported (Swaminathan et al., 2016), we applied intraluminal pressure to gastrointestinal tissue preparations in the organ bath as measured via meniscus height on the organ bath apparatus. Meniscus height was determined by subtracting the height of the organ bath from the meniscus height of front pressure outlet tube and the meniscus height of the back pressure outlet tube.
For the duration of the experiment, tissue was continuously perfused with 1x Krebs solution (composition, mM: 118 NaCl, 4.76 KCl, 0.99 NaH2PO4.2H2O, 1.20 MgSO4.7H2O, 2.5 CaCl2.2H2O, 11.1 D-glucose, 25 NaHCO3). Krebs solution was bubbled with carbogen (95% O2 and 5% CO2), and the temperature of the organ bath was maintained between 33-35° C.
Experimental protocols consisted of an initial equilibration period (2 x 15 min) followed by control recordings (4 x 15 min) during which time, the tissue preparations were incubated in Krebs physiological solution. Subsequently, either 100 µM N-nitro-L-arginine (NOLA) or 10 µM gabazine (dissolved in 1x Krebs solution) was perfused into the tissue bath and recorded during 1 h (4 x 15 min). Finally, a washout period was conducted and recordings captured (4 x 15 min) during which the perfusion was replaced with 1x Krebs solution.
Measurement of PCC parameters: Frequency, duration, length and velocity
Gut contractile activity was recorded using a Logitech camera (Quickcam Pro 9000) mounted above the organ bath. Spatiotemporal heatmaps were generated using in-house software Scribble v2.10. The software performs edge detection, converting an image of the gut tissue into a silhouette from which the number of vertical pixels for each horizontal pixel is counted. A spatiotemporal heatmap is generated by plotting the diameter of the small intestine segment as a function of space and time.
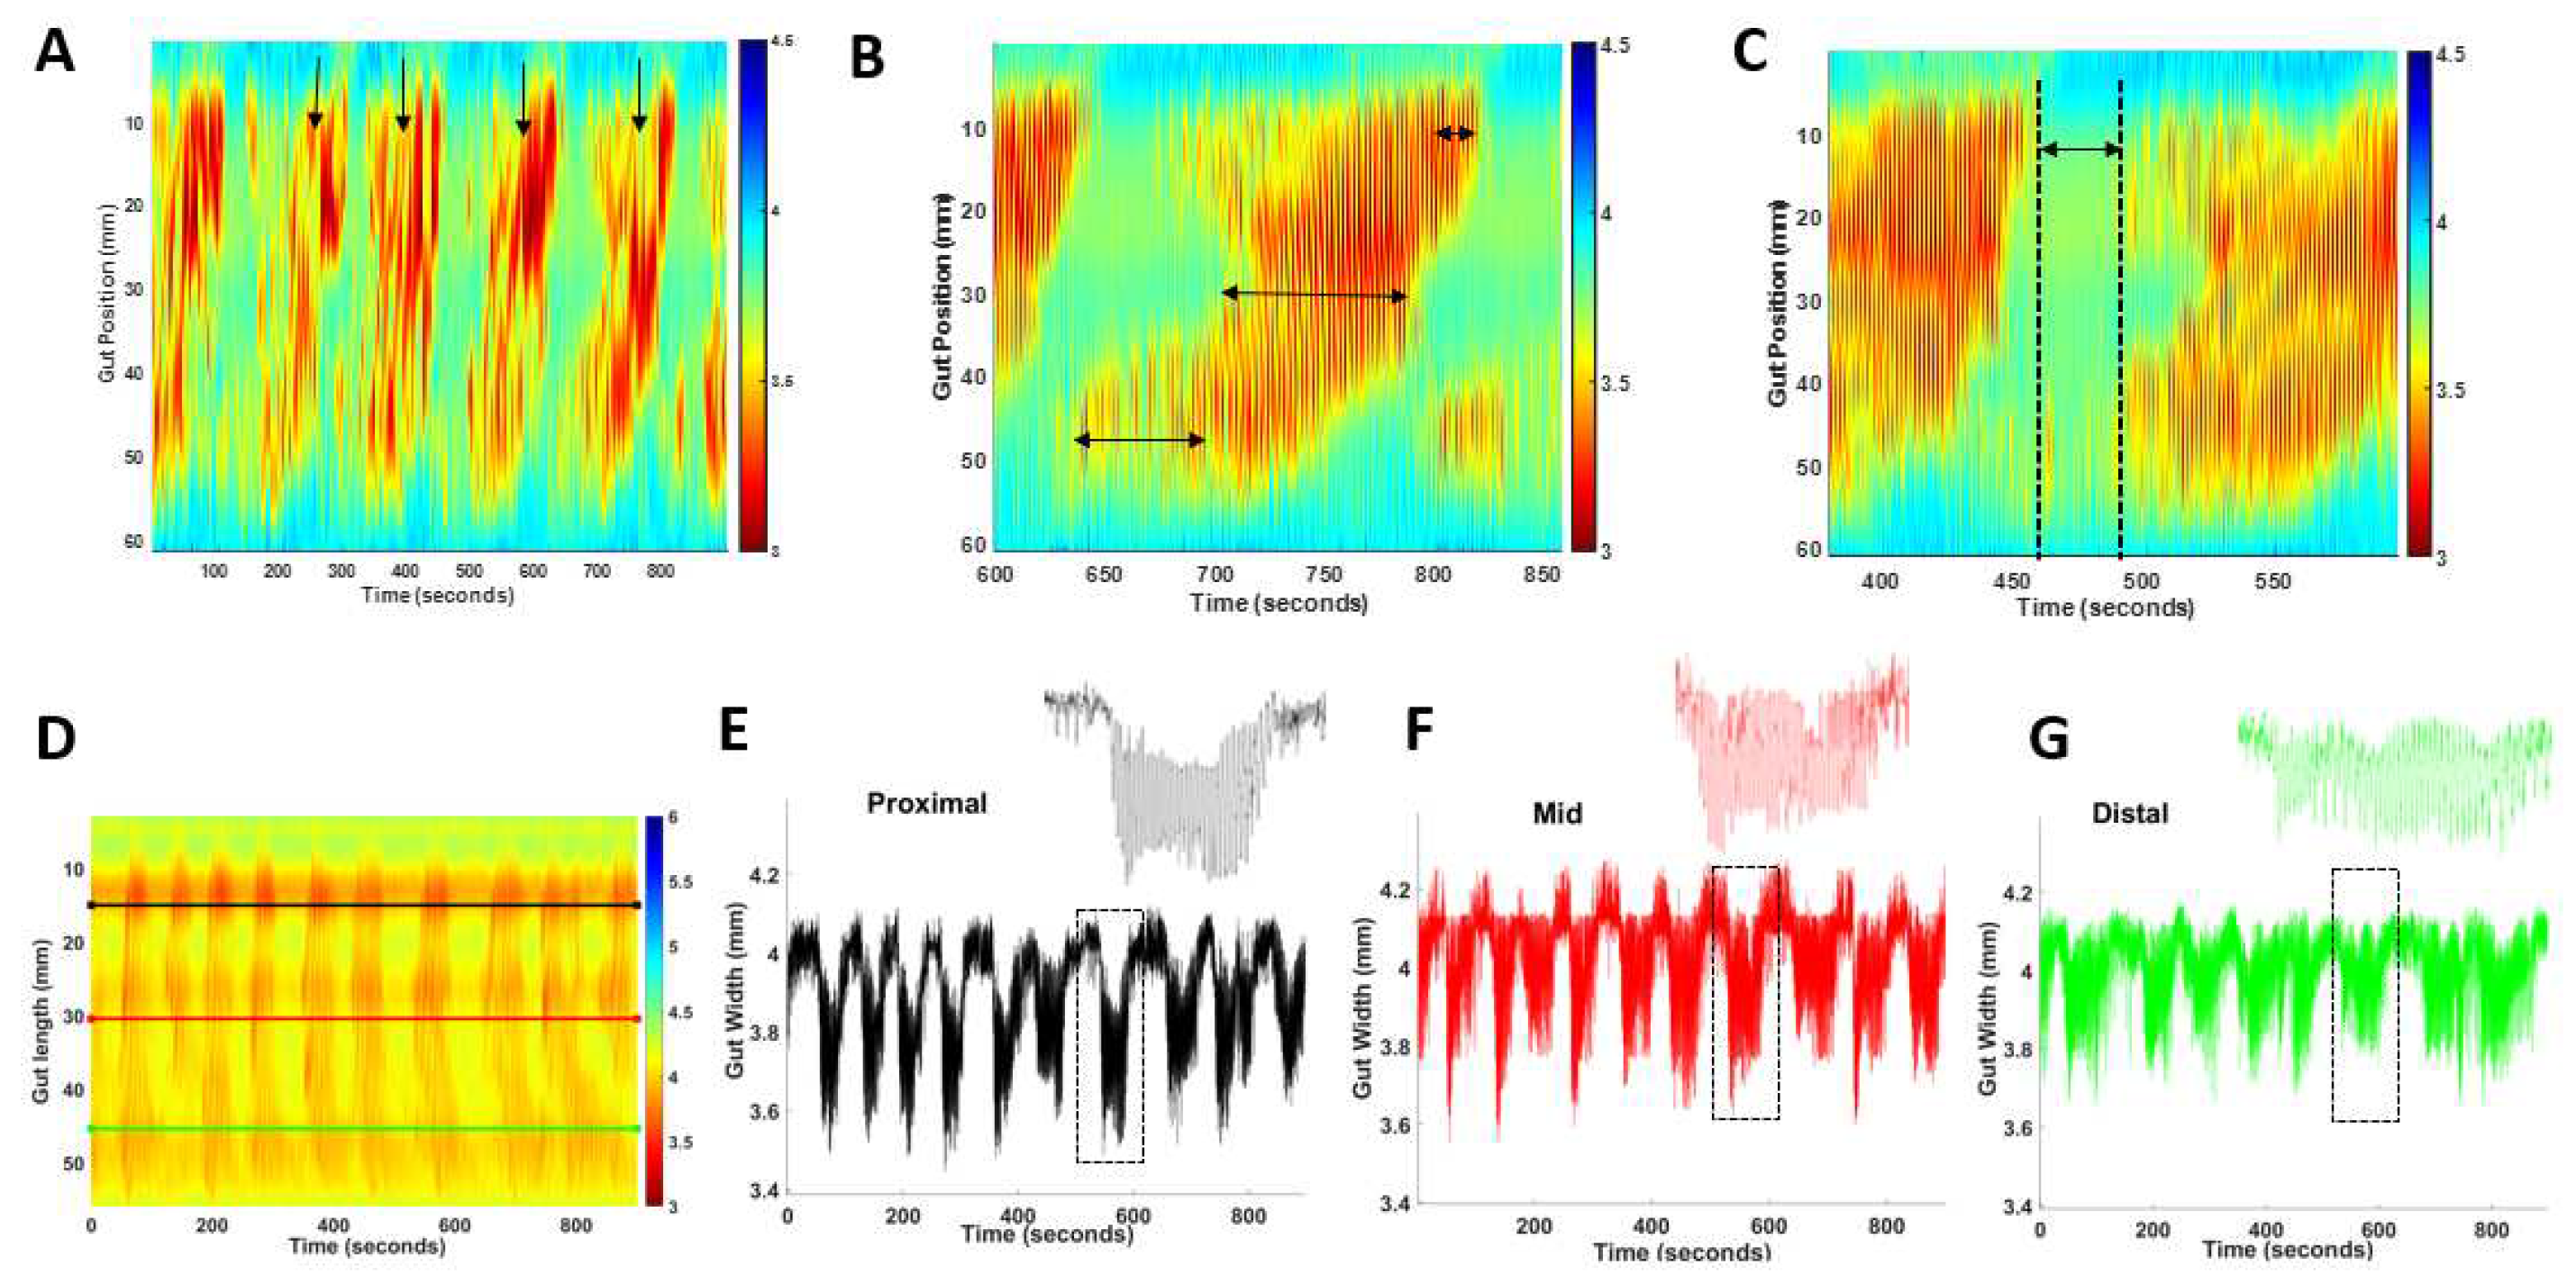
Small intestinal heatmaps were analysed in MATLAB R2021b using in-house software GutMap. The frequency of propagating contractile clusters (PCC) was determined by manually counting contractile clusters that propagated in a consistent direction for more than 50% of the gut length segment (Figure 7A). For each PCC the duration was determined by measuring the time at the start and end of the PCC and subtracting the difference. To ascertain the maximum length of the PCC, measurements were taken from the most proximal and distal regions of the PCC and the difference calculated (Figure 7B). The PCC velocity was calculated using GutMap software. To measure the rest period between the PCCs (i.e., quiescence), the time duration was measured between the end of the PCC contraction and at the start of the next PCC contraction (Figure 7C). Gut width was plotted against time for each of the selected regions and the average resting diameter and constricted diameter was compared for WT and Nlgn3R451C mice (Figure 7D–G).
Figure 7.
PCC analysis method A) Frequency was calculated by counting each PCC (arrows) that occurred during each 15 min recording. PCC duration was measured at the proximal, mid and distal location shown by arrows on map (B). C) quiescence was measured as the time interval between PCCs. D) Representative spatiotemporal map from a wild-type mouse indicating location of proximal (black), mid (red) and distal (green) gut width measurements. E-G) Gut width measurements against time for the anatomical locations indicated in A; inserts represent enlarged single PCCs (dashed boxes).
Regional PCC parameters
Within a single PCC, the duration of individual contractions varied along the length of the tissue; therefore, a single PCC was divided into three types of contractions for analysis. These were proximal short contractions which were defined as short contractions which contracted between the proximal and middle region of the small intestinal preparation. Full-length contractions were defined as contractions which propagated the full length of the gut tissue and lastly, distal short contractions (defined as contractions occurring between the mid region and distal end of the small intestinal preparation). Contraction velocity was measured using GutMap software as an average value calculated from the velocity of 6 randomly selected contractions.
Maximum and minimum gut diameter and Slow wave frequency
To measure the maximum and minimum diameter of the gut tissue, measurements of gut width were plotted from the spatiotemporal map against time at selected proximal, middle and distal locations (Figure 3A). The same gut measurements were analysed using the Fast Fourier Transform algorithm resulting in a histogram whereby the peak described the most common frequency between contractions. The frequency of the peak was measured to give the slow wave frequency (intra PCC frequency) for each of the selected gut regions. The average intra PCC frequency was calculated across tissue replicates.
Statistical analyses
Transit times from X-ray imaging experiments were compared using a Student’s unpaired t-test (Mean ± SEM). Gut length measurements were compared using a 2-way ANOVA test with Sidak correction (Mean ± SEM). Colon lengths were compared using a Student’s unpaired t-test (Mean ± SEM). PCC frequency, length, velocity, duration, resting diameter, inter PCC frequency and intra PCC frequency were compared using a 2-way ANOVA test with Sidak correction. CMMC frequency, colon diameter and colon length. Short anal contractions were compared using a One-way ANOVA Holm-Sidak multiple comparisons test.
5. Conclusions
Our findings indicate that mice expressing an autism-associated mutation in the gene encoding the Neuroligin-3 protein display gut dysfunction. We showed that gastrointestinal transit along the full length of the gut was faster in Nlgn3R451C mice compared to wild types. Additionally, when transit times were assessed for multiple gastrointestinal segments in these mice, we consistently found that transit in each gastrointestinal region was faster in mutant mice. Nlgn3R451C mice have longer small intestines and colons compared to wild-type mice which could indicate increased relaxation of smooth muscle, potentially resulting from enteric neural dysfunction. In Nlgn3R451C mice, the jejunal resting diameter was more constricted than in wildtypes. Nlgn3R451C mice had altered intestinal motility with faster intra PCC frequency in the proximal, mid and distal sections of the jejunum when compared to wild-type mice. In the ileum, PCC durations were shorter and there was a longer quiescence period between PCCs. Additionally, colons from Nlgn3R451C mice showed an increased sensitivity to the GABAA receptor antagonist gabazine. These experiments showed reduced numbers of short colonic contractions in Nlgn3R451C mice indicating GABAA receptor-mediated colonic dysmotility. Overall, Nlgn3R451C mice are a useful model for studying and designing therapies for treating gastrointestinal dysfunction.
Author Contributions
Conceptualization, KN, JCB, AEF, and ELH-Y.; methodology, KM, RTF, JCB, ELH-Y, GKB, MM.; software, TA.; formal analysis, SH, TA, KM.; investigation, KM, TA, MM.; resources, ELH, KN.; writing SH, TA, KM, JB, AEF, ELH-Y; supervision, ELH-Y, RTF, GB, SH; project administration, ELH-Y; funding acquisition, ELH-Y. All authors have read and agreed to the published version of the manuscript.
Institutional Review Board Statement
The animal study protocol was approved by the Ethics Committee of RMIT (AEC 1727).
Data Availability Statement
Data and the MATLAB analysis software interface are available on request.
Conflicts of Interest
ELH-Y is a scientific advisor for Vernx (no part of this study was funded by Vernx).
References
- Abdu, F., Hicks, G. A., Hennig, G., Allen, J. P., & Grundy, D. (2002). Somatostatin sst(2) receptors inhibit peristalsis in the rat and mouse jejunum. Am J Physiol Gastrointest Liver Physiol, 282(4), G624-633. [CrossRef]
- Abo-Shaban, T., Lee C. Y. Q., Hosie S., Balasuriya G. K., Mohsenipour M., Johnston L. A., & Hill-Yardin E. L. (2023). GutMap: A New Interface for Analysing Regional Motility Patterns in ex vivo Mouse Gastrointestinal Preparations. Bio-protocol 13(19): e4831. [CrossRef]
- Arpi, M. N. T., & Simpson, T. I. (2022). SFARI genes and where to find them; modelling Autism Spectrum Disorder specific gene expression dysregulation with RNA-seq data. Scientific Reports, 12(1), 10158. [CrossRef]
- Balasuriya, G. K., Nugapitiya, S. S., Hill-Yardin, E. L., & Bornstein, J. C. (2021). Nitric Oxide Regulates Estrus Cycle Dependent Colonic Motility in Mice. Front Neurosci, 15, 647555. [CrossRef]
- Baudouin, S. J., Gaudias, J., Gerharz, S., Hatstatt, L., Zhou, K., Punnakkal, P., Tanaka, K. F., Spooren, W., Hen, R., De Zeeuw, C. I., Vogt, K., & Scheiffele, P. (2012). Shared synaptic pathophysiology in syndromic and nonsyndromic rodent models of autism. science, 338(6103), 128-132. [CrossRef]
- Brenman, J. E., Chao, D. S., Gee, S. H., McGee, A. W., Craven, S. E., Santillano, D. R., Wu, Z., Huang, F., Xia, H., Peters, M. F., Froehner, S. C., & Bredt, D. S. (1996). Interaction of nitric oxide synthase with the postsynaptic density protein PSD-95 and alpha1-syntrophin mediated by PDZ domains. Cell, 84(5), 757-767. [CrossRef]
- Budreck, E. C., & Scheiffele, P. (2007). Neuroligin-3 is a neuronal adhesion protein at GABAergic and glutamatergic synapses. Eur J Neurosci, 26(7), 1738-1748. [CrossRef]
- Burrows, E. L., Laskaris, L., Koyama, L., Churilov, L., Bornstein, J. C., Hill-Yardin, E. L., & Hannan, A. J. (2015). A neuroligin-3 mutation implicated in autism causes abnormal aggression and increases repetitive behavior in mice. Molecular autism, 6(1), 1-11.
- Chadman, K. K., Gong, S., Scattoni, M. L., Boltuck, S. E., Gandhy, S. U., Heintz, N., & Crawley, J. N. (2008). Minimal aberrant behavioral phenotypes of neuroligin-3 R451C knockin mice. Autism Res, 1(3), 147-158. [CrossRef]
- Chubykin, A. A., Liu, X., Comoletti, D., Tsigelny, I., Taylor, P., & Südhof, T. C. (2005). Dissection of synapse induction by neuroligins: effect of a neuroligin mutation associated with autism. Journal of Biological Chemistry, 280(23), 22365-22374.
- Coley, A. A., & Gao, W. J. (2018). PSD95: A synaptic protein implicated in schizophrenia or autism? Prog Neuropsychopharmacol Biol Psychiatry, 82, 187-194. [CrossRef]
- Comoletti, D., De Jaco, A., Jennings, L. L., Flynn, R. E., Gaietta, G., Tsigelny, I., Ellisman, M. H., & Taylor, P. (2004). The Arg451Cys-neuroligin-3 mutation associated with autism reveals a defect in protein processing. Journal of Neuroscience, 24(20), 4889-4893.
- Costa, M., Hibberd, T. J., Keightley, L. J., Wiklendt, L., Arkwright, J. W., Dinning, P. G., Brookes, S. J. H., & Spencer, N. J. (2020). Neural motor complexes propagate continuously along the full length of mouse small intestine and colon. American Journal of Physiology-Gastrointestinal and Liver Physiology, 318(1), G99-G108. [CrossRef]
- Costa, M., Wiklendt, L., Arkwright, J., Spencer, N., Omari, T., Brookes, S. J., & Dinning, P. (2013). An experimental method to identify neurogenic and myogenic active mechanical states of intestinal motility [Hypothesis and Theory]. Frontiers in Systems Neuroscience, 7. [CrossRef]
- Etherton, M., Földy, C., Sharma, M., Tabuchi, K., Liu, X., Shamloo, M., Malenka, R. C., & Südhof, T. C. (2011). Autism-linked neuroligin-3 R451C mutation differentially alters hippocampal and cortical synaptic function. Proc Natl Acad Sci U S A, 108(33), 13764-13769. [CrossRef]
- Földy, C., Malenka, R. C., & Südhof, T. C. (2013). Autism-associated neuroligin-3 mutations commonly disrupt tonic endocannabinoid signaling. Neuron, 78(3), 498-509. [CrossRef]
- Guo, B., Chen, J., Chen, Q., Ren, K., Feng, D., Mao, H., Yao, H., Yang, J., Liu, H., & Liu, Y. (2019). Anterior cingulate cortex dysfunction underlies social deficits in Shank3 mutant mice. Nature neuroscience, 22(8), 1223-1234. [CrossRef]
- Hennig, G. W., Costa, M., Chen, B. N., & Brookes, S. J. (1999). Quantitative analysis of peristalsis in the guinea-pig small intestine using spatio-temporal maps. J Physiol, 517 ( Pt 2)(Pt 2), 575-590. [CrossRef]
- Herath, M., Bornstein, J. C., Hill-Yardin, E. L., & Franks, A. E. (2022). The autism-associated Neuroligin-3 R451C mutation alters mucus density and the spatial distribution of bacteria in the mouse gastrointestinal tract. bioRxiv, 2022.2006.2027.497808. [CrossRef]
- Herath, M., Cho, E., Franks, A. E., Bornstein, J. C., & Hill-Yardin, E. L. (2022). Quantitative analysis of neuroligin-3 expression in the enteric nervous system of the Neuroligin-3R451C mouse model of autism. bioRxiv, 2022.2005. 2002.490237.
- Hosie, S., Ellis, M., Swaminathan, M., Ramalhosa, F., Seger, G. O., Balasuriya, G. K., Gillberg, C., Rastam, M., Churilov, L., McKeown, S. J., Yalcinkaya, N., Urvil, P., Savidge, T., Bell, C. A., Bodin, O., Wood, J., Franks, A. E., Bornstein, J. C., & Hill-Yardin, E. L. (2019). Gastrointestinal dysfunction in patients and mice expressing the autism-associated R451C mutation in neuroligin-3. Autism Res, 12(7), 1043-1056. [CrossRef]
- Hosie, S., Malone, D. T., Liu, S., Glass, M., Adlard, P. A., Hannan, A. J., & Hill-Yardin, E. L. (2018). Altered Amygdala Excitation and CB1 Receptor Modulation of Aggressive Behavior in the Neuroligin-3(R451C) Mouse Model of Autism. Front Cell Neurosci, 12, 234. [CrossRef]
- Huizinga, J. D., & Chen, J.-H. (2014). Interstitial cells of Cajal: update on basic and clinical science. Current gastroenterology reports, 16, 1-11.
- Huizinga, J. D., & Lammers, W. J. E. P. (2009). Gut peristalsis is governed by a multitude of cooperating mechanisms. American Journal of Physiology-Gastrointestinal and Liver Physiology, 296(1), G1-G8. [CrossRef]
- Irie, M., Hata, Y., Takeuchi, M., Ichtchenko, K., Toyoda, A., Hirao, K., Takai, Y., Rosahl, T. W., & Südhof, T. C. (1997). Binding of neuroligins to PSD-95. science, 277(5331), 1511-1515. [CrossRef]
- Jamain, S., Quach, H., Betancur, C., Råstam, M., Colineaux, C., Gillberg, I. C., Soderstrom, H., Giros, B., Leboyer, M., & Gillberg, C. (2003). Mutations of the X-linked genes encoding neuroligins NLGN3 and NLGN4 are associated with autism. Nature genetics, 34(1), 27-29.
- James, D. M., Davidson, E. A., Yanes, J., Moshiree, B., & Dallman, J. E. (2021). The Gut-Brain-Microbiome Axis and Its Link to Autism: Emerging Insights and the Potential of Zebrafish Models. Front Cell Dev Biol, 9, 662916. [CrossRef]
- Koussoulas, K., Swaminathan, M., Fung, C., Bornstein, J. C., & Foong, J. P. P. (2018). Neurally Released GABA Acts via GABA(C) Receptors to Modulate Ca(2+) Transients Evoked by Trains of Synaptic Inputs, but Not Responses Evoked by Single Stimuli, in Myenteric Neurons of Mouse Ileum. Front Physiol, 9, 97. [CrossRef]
- Lee, C. Y. Q., Franks, A. E., & Hill-Yardin, E. L. (2020). Autism-associated synaptic mutations impact the gut-brain axis in mice. Brain, Behavior, and Immunity, 88, 275-282. [CrossRef]
- Leembruggen, A. J., Balasuriya, G. K., Zhang, J., Schokman, S., Swiderski, K., Bornstein, J. C., Nithianantharajah, J., & Hill-Yardin, E. L. (2020). Colonic dilation and altered ex vivo gastrointestinal motility in the Neuroligin-3 knockout mouse. Autism Research, 13(5), 691-701.
- McQuade, R. M., Stojanovska, V., Donald, E., Abalo, R., Bornstein, J. C., & Nurgali, K. (2016). Gastrointestinal dysfunction and enteric neurotoxicity following treatment with anticancer chemotherapeutic agent 5-fluorouracil. Neurogastroenterol Motil, 28(12), 1861-1875. [CrossRef]
- McQuade, R. M., Stojanovska, V., Donald, E. L., Rahman, A. A., Campelj, D. G., Abalo, R., Rybalka, E., Bornstein, J. C., & Nurgali, K. (2017). Irinotecan-Induced Gastrointestinal Dysfunction Is Associated with Enteric Neuropathy, but Increased Numbers of Cholinergic Myenteric Neurons. Frontiers in physiology, 8, 391. [CrossRef]
- McQuade, R. M., Stojanovska, V., Stavely, R., Timpani, C., Petersen, A, C., Abalo, R., Bornstein, J. C., Rybalka, E., & Nurgali, K. (2018). Oxaliplatin-induced enteric neuronal loss and intestinal dysfunction is prevented by co-treatment with BGP-15. Br J Pharmacol. 175(4), 656-677.
- Neal, K. B., Parry, L. J., & Bornstein, J. C. (2009). Strain-specific genetics, anatomy and function of enteric neural serotonergic pathways in inbred mice. J Physiol, 587(3), 567-586. [CrossRef]
- Peça, J., Feliciano, C., Ting, J. T., Wang, W., Wells, M. F., Venkatraman, T. N., Lascola, C. D., Fu, Z., & Feng, G. (2011). Shank3 mutant mice display autistic-like behaviours and striatal dysfunction. Nature, 472(7344), 437-442.
- Qin Lee, C. Y., Balasuriya, G. K., Herath, M., Franks, A. E., & Hill-Yardin, E. L. (2022). Caecal dysfunction in the NL3R451C mouse model of autism. bioRxiv, 2022.2006.2015.494637. [CrossRef]
- Robinson, A. M., Rahman, A. A., Carbone, S. E., Randall-Demllo, S., Filippone, R., Bornstein, J. C., Eri, R., & Nurgali, K. (2017). Alterations of colonic function in the Winnie mouse model of spontaneous chronic colitis. Am J Physiol Gastrointest Liver Physiol., 312, G85–G102.
- Rothwell, P. E., Fuccillo, M. V., Maxeiner, S., Hayton, S. J., Gokce, O., Lim, B. K., Fowler, S. C., Malenka, R. C., & Südhof, T. C. (2014). Autism-associated neuroligin-3 mutations commonly impair striatal circuits to boost repetitive behaviors. Cell, 158(1), 198-212. [CrossRef]
- Sahakian, L, Filippone, R. T., Stavely, R., Robinson, A. M., Yan, X. S., Abalo, R., Eri, R., Bornstein, J. C., Kelley, M. R., & Nurgali, K. (2021). Inhibition of APE1/Ref-1 Redox Signaling Alleviates Intestinal Dysfunction and Damage to Myenteric Neurons in a Mouse Model of Spontaneous Chronic Colitis. Inflamm Bowel Dis., 27(3), 388-406.
- Sanders, K. M., Koh, S. D., & Ward, S. M. (2006). Interstitial cells of Cajal as pacemakers in the gastrointestinal tract. Annu. Rev. Physiol., 68, 307-343.
- Sauer, A. K., Bockmann, J., Steinestel, K., Boeckers, T. M., & Grabrucker, A. M. (2019). Altered Intestinal Morphology and Microbiota Composition in the Autism Spectrum Disorders Associated SHANK3 Mouse Model. Int J Mol Sci, 20(9). [CrossRef]
- Schieve, L. A., Rice, C., Yeargin-Allsopp, M., Boyle, C. A., Kogan, M. D., Drews, C., & Devine, O. (2012). Parent-reported prevalence of autism spectrum disorders in US-born children: an assessment of changes within birth cohorts from the 2003 to the 2007 National Survey of Children's Health. Matern Child Health J, 16 Suppl 1, S151-157. [CrossRef]
- Schmeisser, M. J., Ey, E., Wegener, S., Bockmann, J., Stempel, A. V., Kuebler, A., Janssen, A.-L., Udvardi, P. T., Shiban, E., Spilker, C., Balschun, D., Skryabin, B. V., Dieck, S. t., Smalla, K.-H., Montag, D., Leblond, C. S., Faure, P., Torquet, N., Le Sourd, A.-M., . . . Boeckers, T. M. (2012). Autistic-like behaviours and hyperactivity in mice lacking ProSAP1/Shank2. Nature, 486(7402), 256-260. [CrossRef]
- Seerden, T. C., Lammers, W. J., De Winter, B. Y., De Man, J. G., & Pelckmans, P. A. (2005). Spatiotemporal electrical and motility mapping of distension-induced propagating oscillations in the murine small intestine. Am J Physiol Gastrointest Liver Physiol, 289(6), G1043-1051. [CrossRef]
- Sgritta, M., Dooling, S. W., Buffington, S. A., Momin, E. N., Francis, M. B., Britton, R. A., & Costa-Mattioli, M. (2019). Mechanisms Underlying Microbial-Mediated Changes in Social Behavior in Mouse Models of Autism Spectrum Disorder. Neuron, 101(2), 246-259.e246. [CrossRef]
- Sharna, S. S., Balasuriya, G. K., Hosie, S., Nithianantharajah, J., Franks, A. E., & Hill-Yardin, E. L. (2020). Altered Caecal Neuroimmune Interactions in the Neuroligin-3(R451C) Mouse Model of Autism. Front Cell Neurosci, 14, 85. [CrossRef]
- Swaminathan, M., Hill-Yardin, E., Ellis, M., Zygorodimos, M., Johnston, L. A., Gwynne, R. M., & Bornstein, J. C. (2016). Video Imaging and Spatiotemporal Maps to Analyze Gastrointestinal Motility in Mice. J Vis Exp(108), 53828. [CrossRef]
- Swiderski, K., Bindon, R., Trieu, J., Naim, T., Schokman, S., Swaminathan, M., Leembruggen, A. J. L., Hill-Yardin, E. L., Koopman, R., Bornstein, J. C., & Lynch, G. S. (2020). Spatiotemporal Mapping Reveals Regional Gastrointestinal Dysfunction in mdx Dystrophic Mice Ameliorated by Oral L-arginine Supplementation. J Neurogastroenterol Motil, 26(1), 133-146. [CrossRef]
- Tabuchi, K., Blundell, J., Etherton, M. R., Hammer, R. E., Liu, X., Powell, C. M., & Südhof, T. C. (2007). A neuroligin-3 mutation implicated in autism increases inhibitory synaptic transmission in mice. science, 318(5847), 71-76.
- Uchigashima, M., Leung, M., Watanabe, T., Cheung, A., Le, T., Pallat, S., Dinis, A. L. M., Watanabe, M., Kawasawa, Y. I., & Futai, K. (2020). Neuroligin3 splice isoforms shape inhibitory synaptic function in the mouse hippocampus. J Biol Chem, 295(25), 8589-8595. [CrossRef]
Disclaimer/Publisher’s Note: The statements, opinions and data contained in all publications are solely those of the individual author(s) and contributor(s) and not of MDPI and/or the editor(s). MDPI and/or the editor(s) disclaim responsibility for any injury to people or property resulting from any ideas, methods, instructions or products referred to in the content. |
© 2023 by the authors. Licensee MDPI, Basel, Switzerland. This article is an open access article distributed under the terms and conditions of the Creative Commons Attribution (CC BY) license (http://creativecommons.org/licenses/by/4.0/).
Copyright: This open access article is published under a Creative Commons CC BY 4.0 license, which permit the free download, distribution, and reuse, provided that the author and preprint are cited in any reuse.


