Submitted:
09 December 2023
Posted:
12 December 2023
You are already at the latest version
Abstract
Keywords:
1. Introduction
Post-traumatic stress disorder (PTSD) risk factors
"Guardian of the Walls" operation
2. Methodology
Questionnaires
Research population
Data Processing
3. Results
Exposure to Missile Alarms as a Measure of Missile Attacks and PTSD Symptoms
Socioeconomic Status and PTSD Symptoms
Conclusions
Declarations
Acknowledgment
| 1 | This research is part of a study focused on the effects of rocket attacks on the Israeli population during a specific military operation. The study was conducted by Dr. Yaakov Bayer from Ben Gurion University and Dr. Solon Solomon from Brunel University London School of Law. Comprising multiple perspectives and disciplines, the research aims to provide a comprehensive understanding of the issue. The legal conclusions extracted from the research are published in Solon Solomon & Yaakov Bayer (2023) Is All Mental Harm Equal? The Importance of Discussing Civilian War Trauma from a Socio-Economic Legal Framework's Perspective. Nordic Journal of International Law, Volume 93 (2023), Pages: 1-20. |
| 2 | It is important to note that the questionnaire is one of the diagnostic tools for people with PTSD. A complete diagnosis of PTSD includes a clinical diagnosis that was not included in our study. Therefore, this is not a clinical diagnosis but a general and partial evaluation and assessment according to the validated questionnaire. |
References
- American Psychiatric Association (1994). Diagnostic and statistical manual of mental disorders.
- American Psychiatric Association (2000) DSM-IV-TR, 4th ed.
- Amir, M., Kaplan, Z., & Kotler, M. (1996). Type of trauma, severity of posttraumatic stress disorder core symptoms, and associated features. The Journal of General Psychology, 123(4), 341-351. [CrossRef]
- Anderhub, V., Güth, W., Gneezy, U., & Sonsino, D. (2001). On the interaction of risk and time preferences: An experimental study. German Economic Review, 2(3), 239-253. [CrossRef]
- Bayer, Y.M. (2023) Challenges in Autonomous Financial Management Among Patients with Serious Mental Illness During Long-Term Hospitalization: Insights from Israel. Preprints 2023.
- Bayer, Y.M., Ruffle Bradely, Zultan Ro'i, Dwolazky Tzvi (2018) Time preferences in patients with mild cognitive impairment (MCI). Laurier Centre for Economic Research and Policy Analysis: Toronto.
- Bayer, Y.M. Shtudiner, Z., Suhorukov, O., & Grisaru, N. (2019). Time and risk preferences, and consumption decisions of patients with clinical depression. Journal of Behavioral and Experimental Economics, 78, 138-145. [CrossRef]
- Bayer Y.M., & Shtudiner, Z. Sirens of stress: Financial risk, time preferences, and post-traumatic stress disorder: Evidence from the Israel-Hamas Conflict. Journal of Health Psychology, 13591053231207693. [CrossRef]
- Benjet, C., Bromet, E., Karam, E. G., Kessler, R. C., McLaughlin, K. A., Ruscio, A. M., ... & Koenen, K. C. (2016). The epidemiology of traumatic event exposure worldwide: results from the World Mental Health Survey Consortium. Psychological medicine, 46(2), 327-343. [CrossRef]
- Blevins, C. A., Weathers, F. W., Davis, M. T., Witte, T. K., & Domino, J. L. (2015). The post-traumatic stress disorder checklist for DSM-5 (PCL-5): Development and initial psychometric evaluation. Journal of traumatic stress, 28(6), 489-498. [CrossRef]
- Bovin, M. J., Marx, B. P., Weathers, F. W., Gallagher, M. W., Rodriguez, P., Schnurr, P. P., & Keane, T. M. (2016). Psychometric properties of the PTSD checklist for diagnostic and statistical manual of mental disorders–fifth edition (PCL-5) in veterans. Psychological assessment, 28(11), 1379. [CrossRef]
- Brewin, C. R., Andrews, B., & Valentine, J. D. (2000). Meta-analysis of risk factors for posttraumatic stress disorder in trauma-exposed adults. Journal of consulting and clinical psychology, 68(5), 748. [CrossRef]
- Burri, A., & Maercker, A. (2014). Differences in prevalence rates of PTSD in various European countries explained by war exposure, other trauma and cultural value orientation. BMC research notes, 7, 1-11. [CrossRef]
- Cheng, Y., Wang, F., Wen, J., & Shi, Y. (2014). Risk factors of post-traumatic stress disorder (PTSD) after Wenchuan earthquake: a case control study. PLoS One, 9(5), e96644. [CrossRef]
- Contractor, A. A., Caldas, S. V., Dolan, M., Lagdon, S., & Armour, C. (2018). PTSD's factor structure and measurement invariance across subgroups with differing count of trauma types. Psychiatry Research, 264, 76-84. [CrossRef]
- Ehlers, A., & Clark, D. M. (2000). A cognitive model of posttraumatic stress disorder. Behavior research and therapy, 38(4), 319-345. [CrossRef]
- DiGrande, L., Perrin, M. A., Thorpe, L. E., Thalji, L., Murphy, J., Wu, D., ... & Brackbill, R. M. (2008). Posttraumatic stress symptoms, PTSD, and risk factors among lower Manhattan residents 2–3 years after the September 11, 2001 terrorist attacks. Journal of Traumatic Stress: Official Publication of The International Society for Traumatic Stress Studies, 21(3), 264-273. [CrossRef]
- Ford, J. D., Stockton, P., Kaltman, S., & Green, B. L. (2006). Disorders of extreme stress (DESNOS) symptoms are associated with type and severity of interpersonal trauma exposure in a sample of healthy young women. Journal of interpersonal violence, 21(11), 1399-1416. [CrossRef]
- Havenaar, J. M., Rumyantzeva, G. M., van den Brink, W., Poelijoe, N. W., Van den Bout, J., van Engeland, H., & Koeter, M. W. (1997). Long-term mental health effects of the Chernobyl disaster: an epidemiologic survey in two former Soviet regions. American Journal of Psychiatry, 154(11), 1605-1607. [CrossRef]
- Iversen, A. C., Fear, N. T., Ehlers, A., Hughes, J. H., Hull, L., Earnshaw, M., ... & Hotopf, M. (2008). Risk factors for post-traumatic stress disorder among UK Armed Forces personnel. Psychological medicine, 38(4), 511-522. [CrossRef]
- Israel Central Bureau of Statistics (2012), Financial Literacy Survey: Knowledge, Opinions, and Behavior in Financial Issues, Jerusalem: Central Bureau of Statistics [Hebrew].
- Johnson, S. D., North, C. S., & Smith, E. M. (2002). Psychiatric disorders among victims of a courthouse shooting spree: A three-year follow-up study. Community mental health journal, 38, 181-194. [CrossRef]
- Kessler, R. C., & Frank, R. G. (1997). The impact of psychiatric disorders on work loss days. Psychological medicine, 27(4), 861-873. [CrossRef]
- Kongshøj, I. L. L., & Berntsen, D. (2022). Is young age a risk factor for PTSD? Age differences in PTSD-symptoms after Hurricane Florence. Traumatology. [CrossRef]
- Langner, T. S., & Michael, S. T. (1963). Life stress and mental health: II. The midtown Manhattan study.
- Li, S., Guo, C., & Chan, S. S. (2022). ICD-11 posttraumatic stress disorder and complex PTSD among hospital medical workers in China: impacts of Wenchuan Earthquake exposure, workplaces, and sociodemographic factors. Frontiers in psychiatry, 12, 735861. [CrossRef]
- MacDermid Wadsworth, S. M. (2010). Family risk and resilience in the context of war and terrorism. Journal of Marriage and Family, 72(3), 537-556. [CrossRef]
- Mollica, R. F., Wyshak, G., & Lavelle, J. (1987). The psychosocial impact of war trauma and torture on Southeast Asian refugees. The American journal of psychiatry. [CrossRef]
- Murthy, R. S., & Lakshminarayana, R. (2006). Mental health consequences of war: a brief review of research findings. World psychiatry, 5(1), 25.
- Paryente, B. (2021). Parenting Experiences under Ongoing Life-threatening Conditions of Missile Attacks. Journal of Child and Family Studies, 30(7), 1685-1696. [CrossRef]
- Schnurr, P. P., Lunney, C. A., & Sengupta, A. (2004). Risk factors for the development versus maintenance of posttraumatic stress disorder. Journal of Traumatic Stress: Official Publication of The International Society for Traumatic Stress Studies, 17(2), 85-95. [CrossRef]
- Schlenger, W. E., Caddell, J. M., Ebert, L., Jordan, B. K., Rourke, K. M., Wilson, D., ... & Kulka, R. A. (2002). Psychological reactions to terrorist attacks: findings from the National Study of Americans' Reactions to September 11. Jama, 288(5), 581-588. [CrossRef]
- Smith, H. L., Summers, B. J., Dillon, K. H., & Cougle, J. R. (2016). Is worst-event trauma type related to PTSD symptom presentation and associated features?. Journal of Anxiety Disorders, 38, 55-61. [CrossRef]
- Solomon, S., & Bayer, Y. M. (2022). Reading mental harm through the lens of socio-economic rights: An empirical study of the impact of education, family, and income on the notion of civilian mental harm in warfare. Brunel University London, Ben Gurion University of the Negev.
- The Meir Amit Intelligence and Terrorism Information Center, https://www.terrorism-info.org.il/, Retrived:06/04/2022.
- Vinck, P., Pham, P. N., Stover, E., & Weinstein, H. M. (2007). Exposure to war crimes and implications for peace building in northern Uganda. Jama, 298(5), 543-554. [CrossRef]
- World Health Organization. (2001). The World Health Report 2001: Mental health: new understanding, new hope.
- Wortmann, J. H., Jordan, A. H., Weathers, F. W., Resick, P. A., Dondanville, K. A., Hall-Clark, B., ... & Litz, B. T. (2016). Psychometric analysis of the PTSD Checklist-5 (PCL-5) among treatment-seeking military service members. Psychological assessment, 28(11), 1392. [CrossRef]
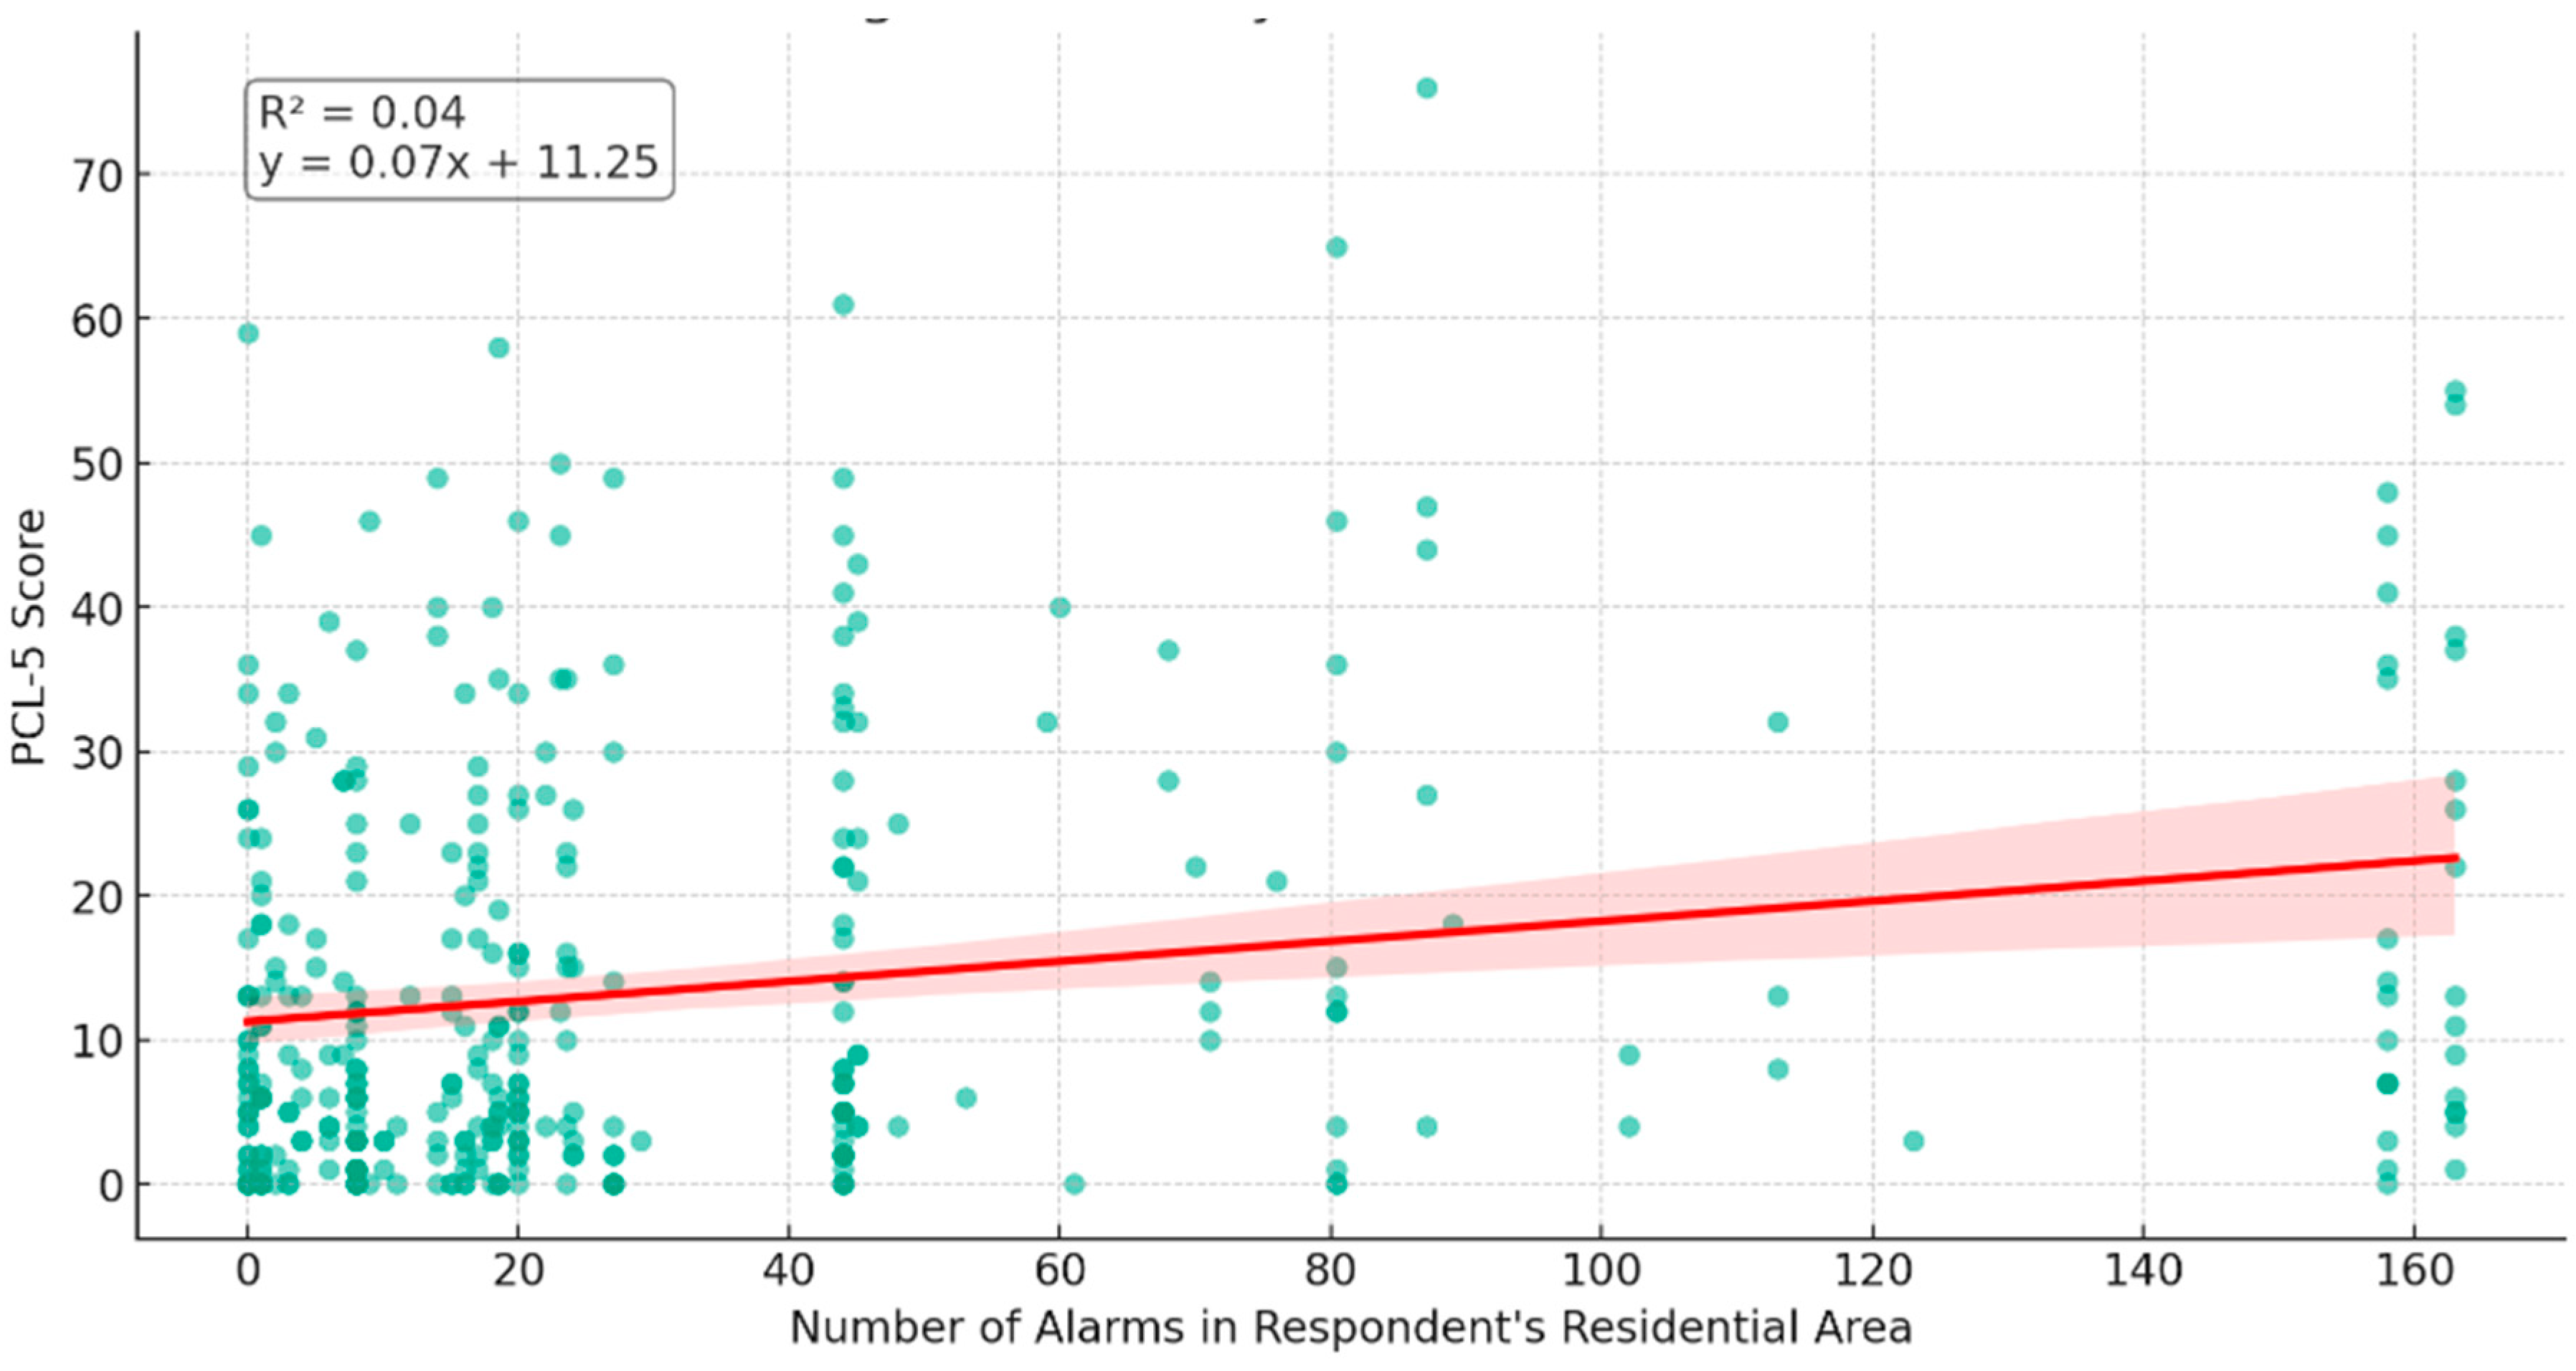
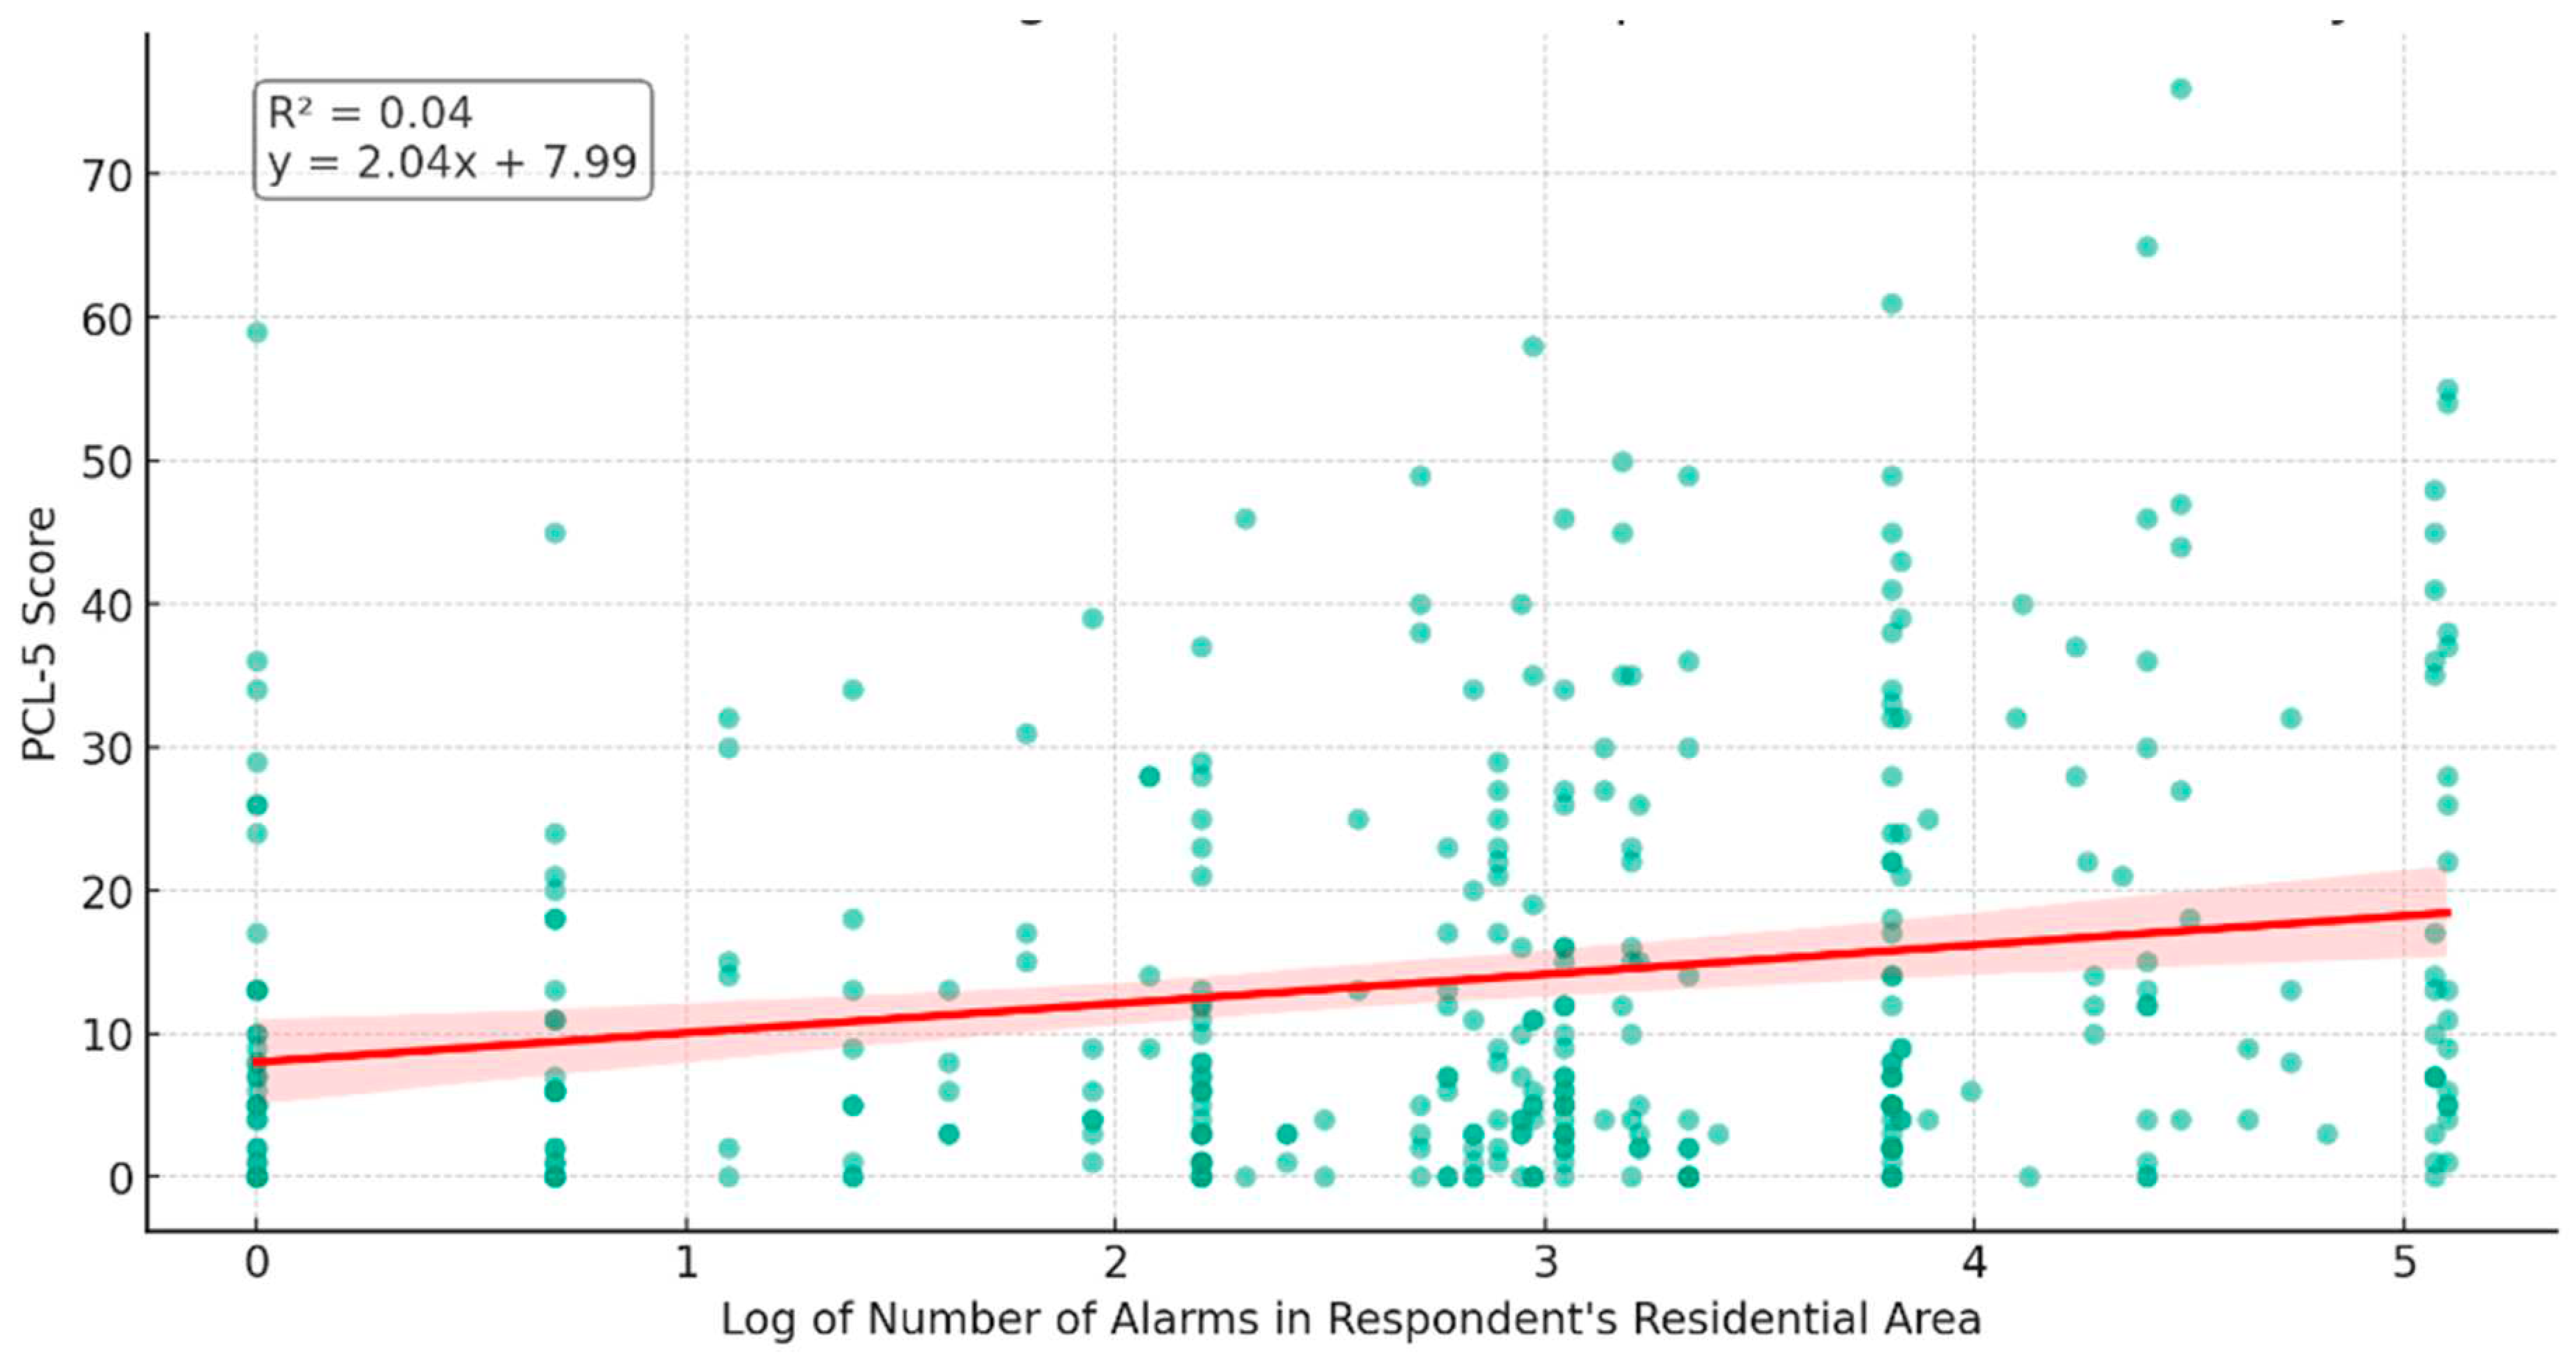
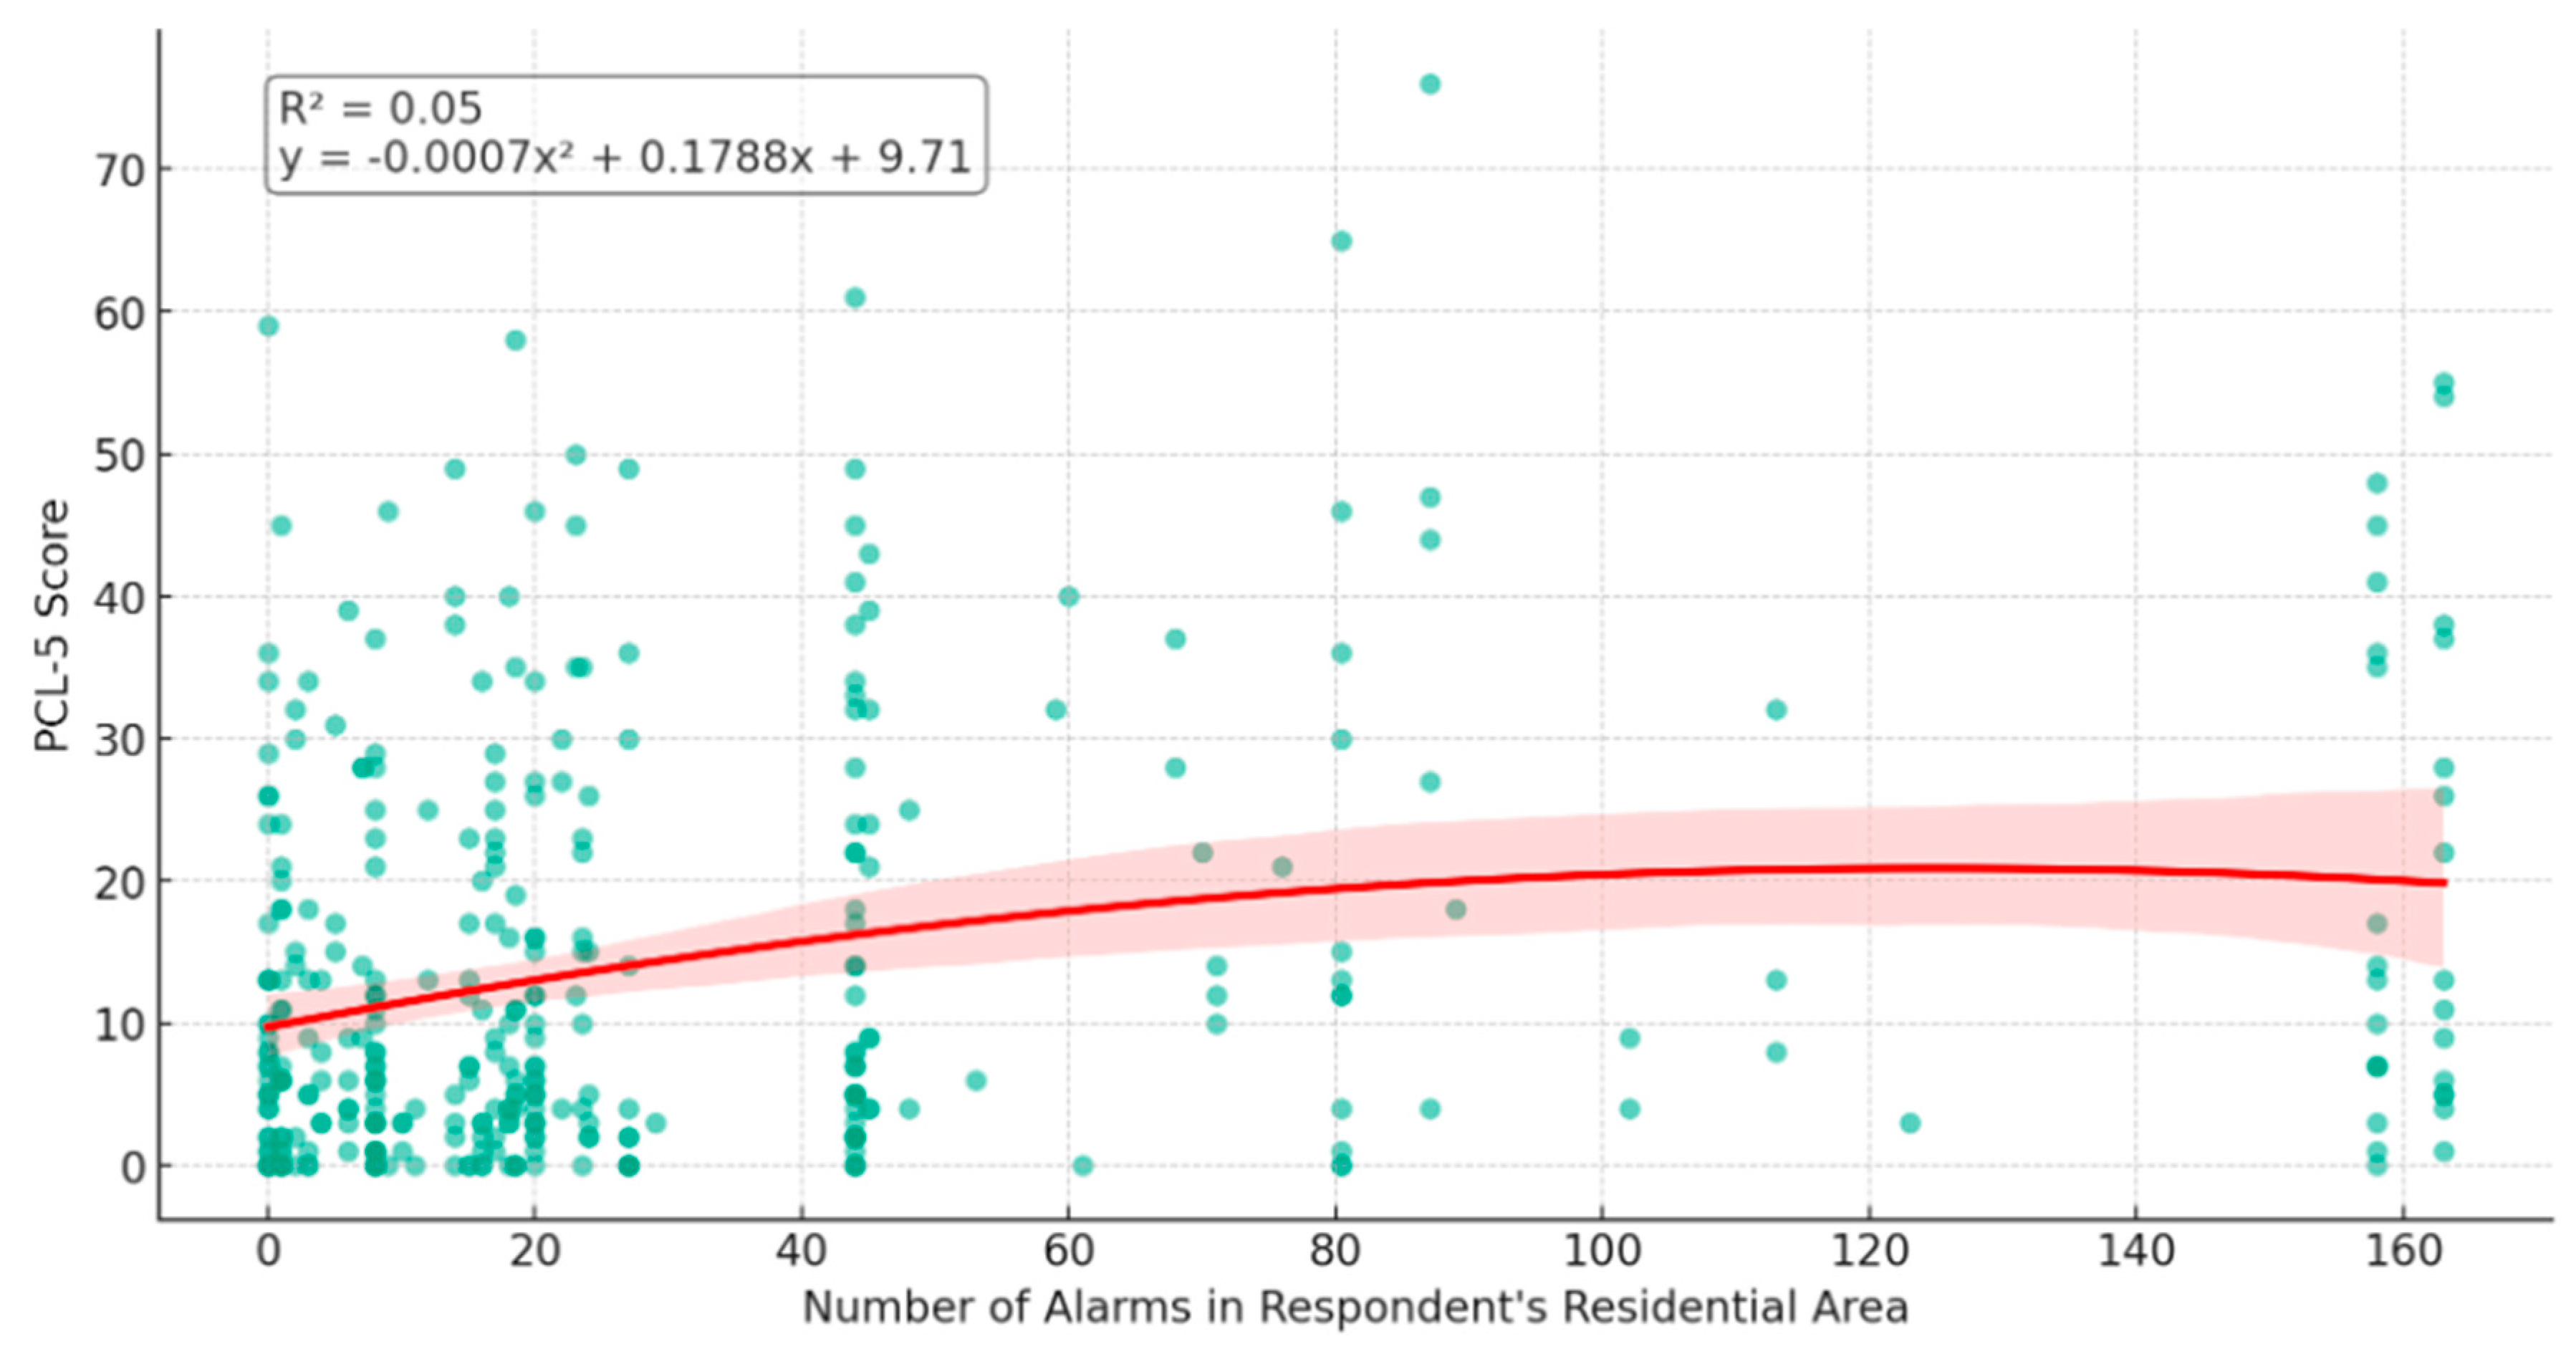
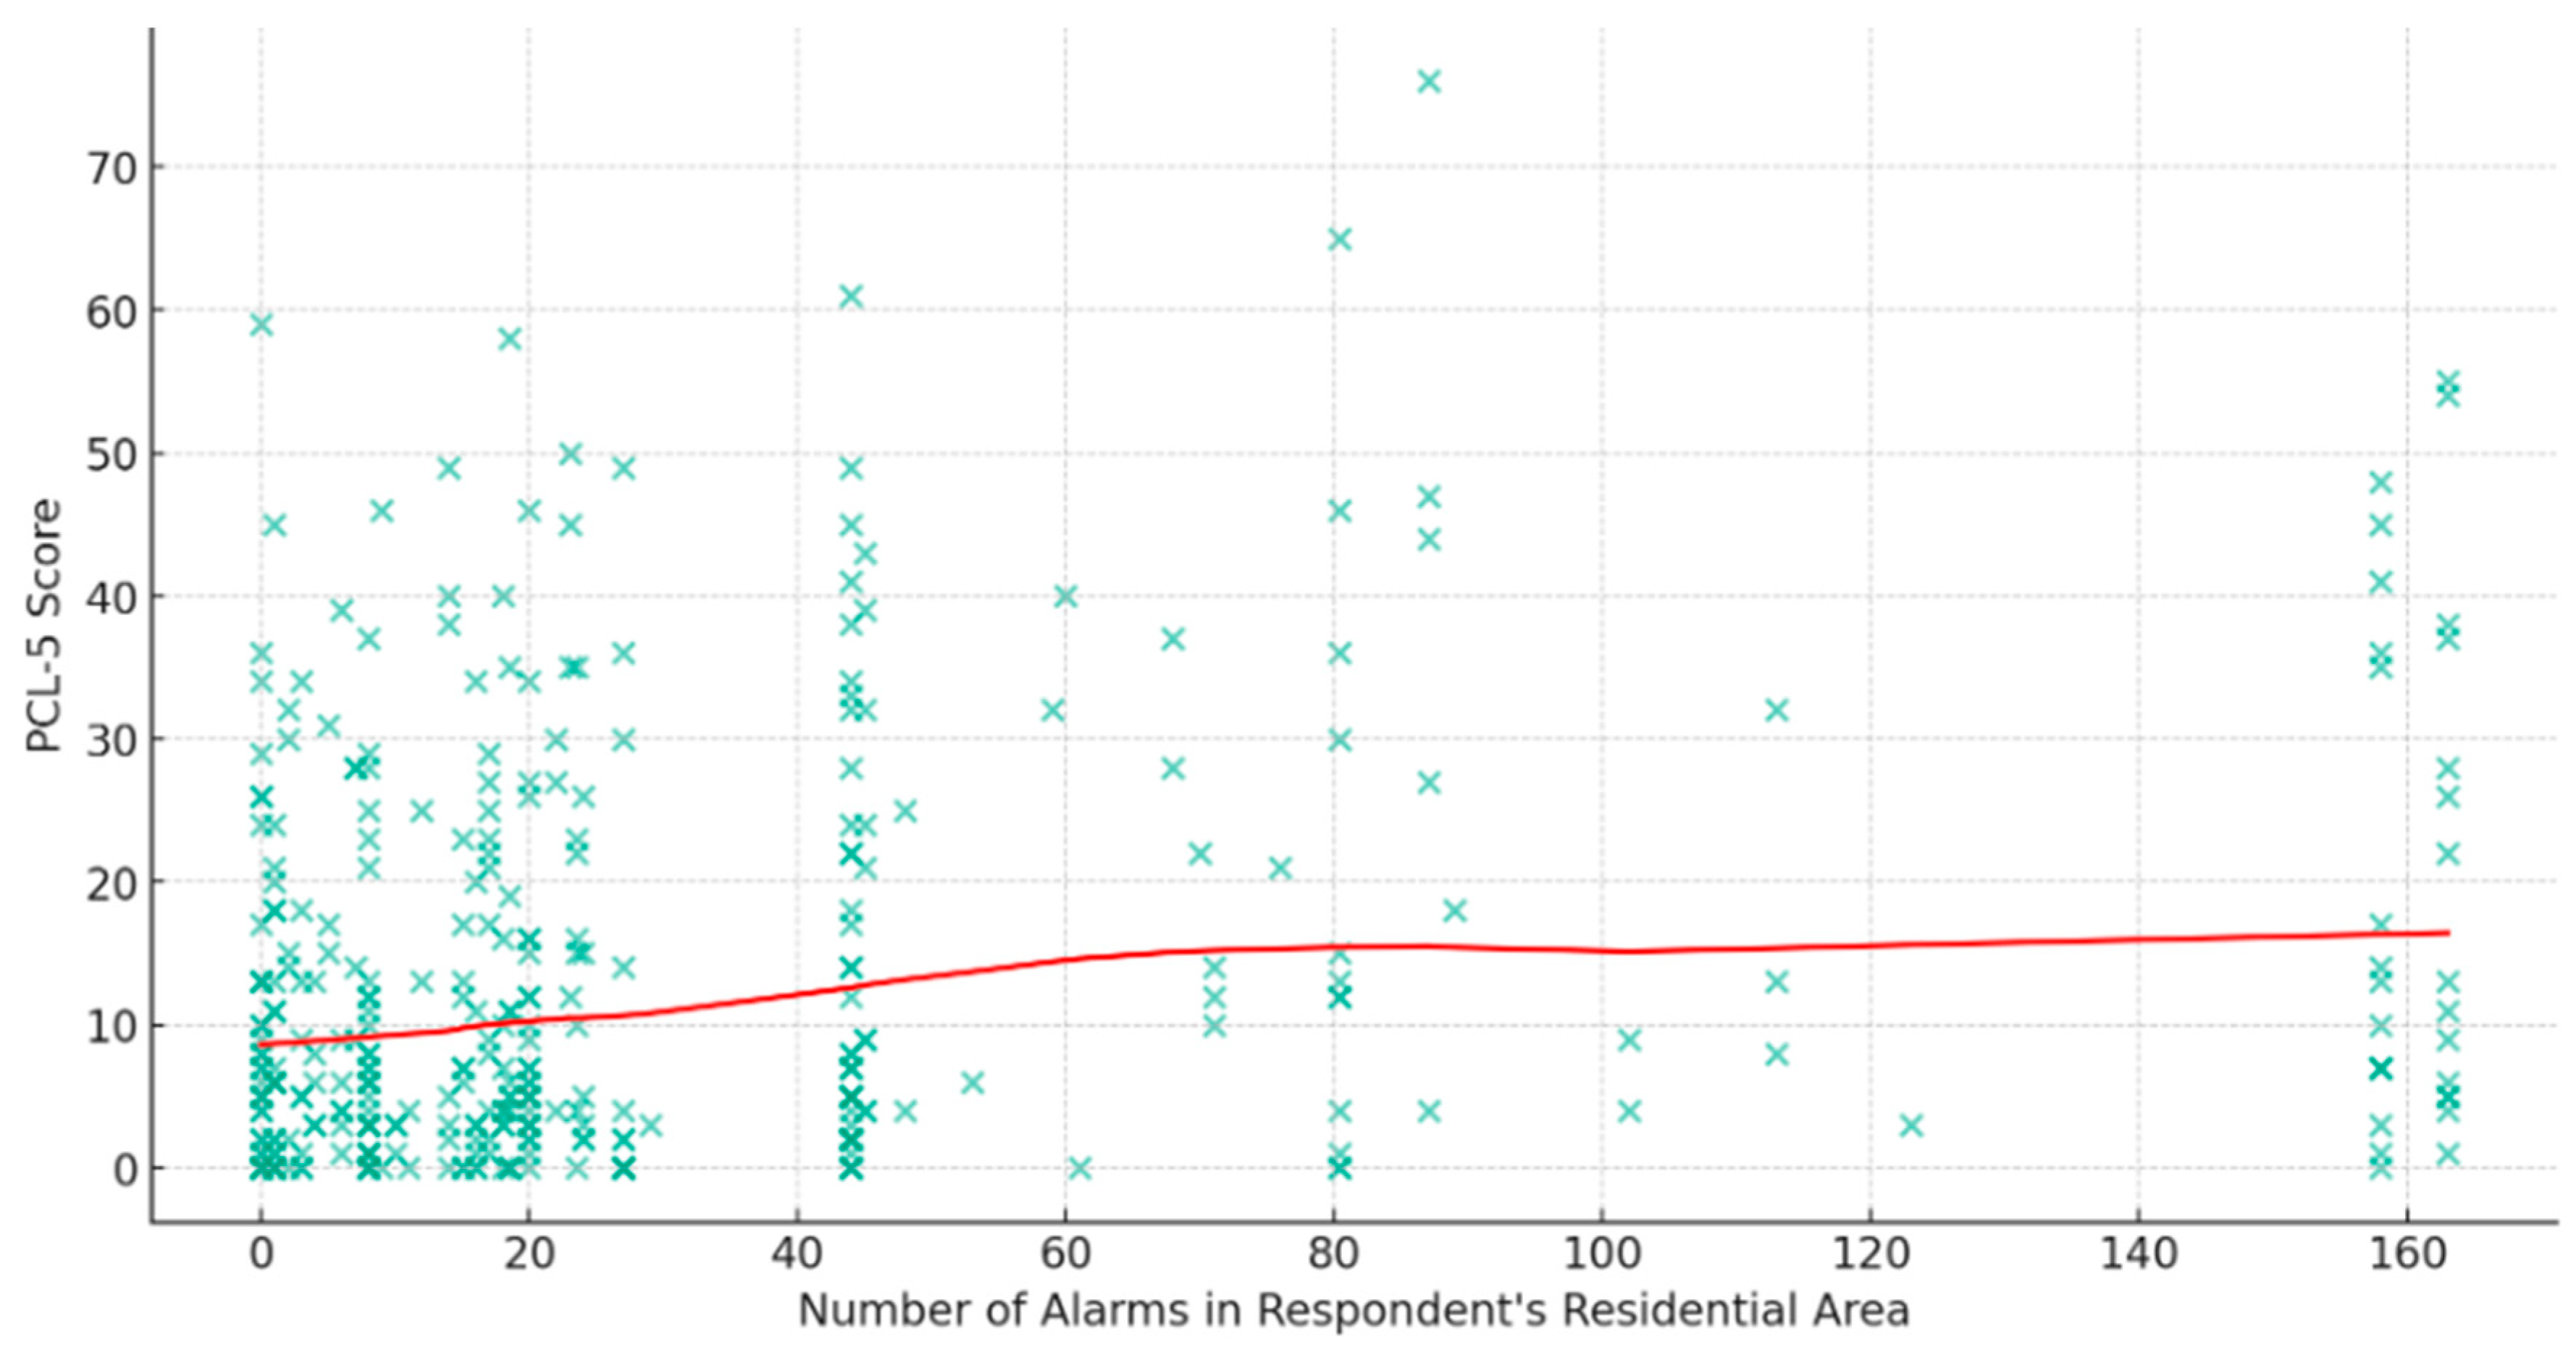
| PTSD | Healthy | T Test | |
| Age | 34.23 (12.36) |
39.81 (13.98) |
T=-2.900 p=0.004 |
| Male | 0.16 (0.37) |
0.22 (0.41) |
T=-0.995 p=0.321 |
| Income | 4.88 (3.15) |
6.27 (2.97) |
T=-2.914 p=0.005 |
| Education | 13.83 (3.11) |
15.61 (2.95) |
T=-4.274 P<0.001 |
| Children | 1.13 (1.45) |
2.01 (1.85) |
T=-3.525 P<0.001 |
| N | 62 | 320 |
 |
 |
 |
 |
Disclaimer/Publisher’s Note: The statements, opinions and data contained in all publications are solely those of the individual author(s) and contributor(s) and not of MDPI and/or the editor(s). MDPI and/or the editor(s) disclaim responsibility for any injury to people or property resulting from any ideas, methods, instructions or products referred to in the content. |
© 2023 by the authors. Licensee MDPI, Basel, Switzerland. This article is an open access article distributed under the terms and conditions of the Creative Commons Attribution (CC BY) license (http://creativecommons.org/licenses/by/4.0/).


