Submitted:
27 September 2023
Posted:
28 September 2023
You are already at the latest version
Abstract
Stock bubbles are characterized by unpredictable price surges and subsequent declines, causing significant losses for investors. The study aimed to detect mildly explosive patterns in S&P 500-listed stocks in real-time using the GSADF test. This study focused on the length, the normality of the stock bubble episode and compared the effectiveness of SADF and GSADF tests in bubble detection, consistently finding GSADF's superiority. The duration of breakouts exhibited non-normality, suggesting unusually long bubble durations.
Keywords:
Stock bubble
; Length
; Stationarity
; Augmented Dickey-Fuller Test
1. Introduction
A stock bubble, also known as an asset or speculative bubble, garners substantial attention from academia and practitioners. According to Karimov (2017), a stock bubble occurs when asset prices transiently accelerate upward over and above their fundamental or intrinsic value. This increase in prices is driven by new speculators seeking to profit from even higher prices, rather than the fundamental value of the asset itself (French, 1991). Various factors, such as increased investor enthusiasm and speculation, media hype, analyst recommendations, and other forms of positive sentiment, can contribute to the rapid surge in stock prices, leading to a self-fulfilling cycle of buying and selling. Furthermore, the formation of a stock bubble can also be influenced by low interest rates and favorable credit conditions. These conditions make it easier for investors to access credit, which can be invested in stocks, thereby augmenting the demand and driving up the price.
Asset price bubbles are often blamed for causing economic recessions. According to Aliber and Kindleberger (2015), such bubbles are linked to a state of economic optimism that can contribute to a subsequent decline in economic activity. They further suggest that the failure of financial institutions during these bubbles can disrupt the channels of credit, causing a slowdown in economic recovery (p. 134).
Stock market crashes and economic recessions share a positive relationship, creating a self-perpetuating cycle. When a stock bubble bursts, entrepreneurs' and investors' net worth declines, leading to reduced credit and investment. This, in turn, lowers labor demand, causing wage declines. Due to nominal wage rigidity, institutions may implement minimum working hours or rationing, resulting in involuntary unemployment. The rise in unemployment can disrupt the intertemporal allocation of resources, ultimately leading to a recessionary phase (Biswas et al., 2020). The relationship between unemployment and return on capital investment is contrastive, leading to a decline in the net worth of investors. Entrepreneurs' ability to invest depends on their net worth, and a net worth decline can reduce future capital stock. This, in turn, exacerbates the downward pressure on labor demand and perpetuates a self-reinforcing cycle, which continues until the capital stock falls sufficiently to reach a bubble-less steady-state equilibrium (Biswas et al., 2020). The complex interplay of these factors underscores the potential consequences of asset price bubbles and their deleterious effects on economic stability.
Retail investors who engage in stock trading during a speculative bubble face the peril of substantial financial losses when the bubble eventually bursts, resulting in a precipitous decline in stock prices. This risk is particularly pronounced for individual investors who may lack the requisite expertise to conduct thorough evaluations of stock fundamentals and accurately assess the risks inherent in bubble-related investments. Furthermore, investing in a stock bubble can result in opportunity costs for individual investors, as they may become overly focused on the stock market, neglecting other asset classes such as bonds or real estate. This oversight can hinder their ability to diversify their investment portfolio and explore alternative investment avenue options.
Due to the nature of it, stock prices often exhibit rapid and unpredictable fluctuations. When prices surge significantly beyond their actual value, resembling a bubble, this can typically be recognized and studied retrospectively after a price decline occurs. In such instances, both institutional and individual investors may experience substantial wealth losses.
Furthermore, when investors hold unrealistic expectations of perpetual demand and profitability in a specific stock, it fosters irrational exuberance, driving the price far above its intrinsic value and the company's actual potential. Positive sentiment about a stock's future profitability can lead to its current price exceeding its fundamental value. When this disparity arises, it suggests the presence of a stock bubble (Shiller, 2000 & Stiglitz, 1990). Unfortunately, retail investors, often unaware of these dynamics, may incur substantial losses when the bubble inevitably bursts.
Detecting and managing stock bubbles is challenging due to their unpredictability. Investors struggle to accurately estimate peak prices and bubble duration, often remaining invested, continuing to invest despite overvaluation. Unfortunately, once a stock enters a bubble zone, investors are unable to divest themselves of it before it collapses, leaving them exposed to significant financial losses. The lack of understanding of stock bubble formation and dynamics poses risks to both retail and hedge fund investors, potentially favoring short-term gains over long-term strategies.
The bursting of a stock bubble erodes investor confidence and trust in the stock market as a secure investment. Investors purchasing stocks at inflated prices often face significant declines, causing frustration and mistrust. For instance, retirees, reliant on stocks for retirement income, may suffer financial insecurity if a significant portion of their portfolio depreciates during a bubble, lacking the capacity for recovery through additional investments or employment.
Researchers have made significant attempts to develop the econometric technique to detect the indication of the existence of bubbles. The study of equity market bubbles, particularly in the United States, has garnered significant interest. However, existing methodologies for detecting bubbles are still insufficient in providing definitive evidence for the bubble hypothesis. During the earlier phase, Shiller (1981) examined stock price volatility and its relationship to dividend fluctuations. He found that stock prices exhibited excessive volatility due to the introduction of new information about future dividends. Shiller argued that this high volatility couldn't be solely attributed to dividend changes, even when accounting for uncertainty in dividend growth. His research provided evidence that stock prices moved excessively, suggesting market inefficiencies and potential bubbles (Shiller, 1981).
In his 1984 paper, Kenneth D. West utilized Shiller's data to detect stock market bubbles using a three-step test based on the Euler equation and AR representation (West, 1984). In a separate 1987 study, West employed a specification test to confirm the presence of a stock market bubble by linking dividend patterns to equilibrium stock prices (West, 1987). However, Camerer (1989) questioned West's use of a constant discount rate and suggested further investigation into discount rate predictability.
Diba and Grossman (1988) examined the presence of an explosive rational bubble in stock prices, using a model that considered market fundamentals as a combination of unobservable variables, including the present value of anticipated dividends at a constant discount rate. Their study found that stock prices and dividends were non-stationary before differencing but became stationary after the first differencing. However, they did not find evidence of cointegration between them, leading to the conclusion that there was no support for the existence of an explosive rational bubble in stock prices. They argued that if a bubble were to exist in the current market, it would have always existed, and once a bubble reaches zero, it cannot reappear.
Furthermore, Evan (1991) challenged the theory proposed by Diba and Grossman by introducing a novel model for periodically collapsible bubbles. Evan's model suggests that real stock price bubbles cannot have negative values and that, contrary to Diba and Grossman's argument, if a bubble were to reach zero, it could re-emerge. Similarly, Froot and Obstfeld (1991) contributed significantly to bubble theory with an intrinsic bubble model that refines the concept of the rational bubble. Their model distinguishes between exogenous fundamental determinants of asset prices and extraneous variables, which can influence the self-fulfilling expectations process of the bubble.
As far as time series-based models are concerned, time series-based analysis is a common approach for studying speculative bubbles in financial markets, but empirical findings have lacked consistency. Numerous formal methods exist to assess data stationarity, with the Dickey-Fuller test (Dickey & Fuller, 1979) being a prominent one. This test is noteworthy as it allows for the examination of non-stationarity, akin to detecting unit roots. Many studies have utilized the Dickey-Fuller test to identify speculative bubbles, and this summary provides an overview of these investigations. Crain (1993) introduced a time-series model and employed the standard Augmented Dickey-Fuller (ADF) test to evaluate the stationarity of the log dividend-price ratio using S&P 500 data from 1876 to 1988
Cunado et al. (2005) analyzed the NASDAQ stock market index from 1994 to 2003 for a rational bubble using fractional methodology. They found mixed results: no bubble with monthly data but evidence for a bubble with daily and weekly data. Similarly, Koustas and Serletis (2005) used the ARFIMA method to study the S&P 500 log dividend yield. Their results supported the presence of a rational bubble in stock prices, rejecting the null hypothesis of no bubble.
Phillips, Wu, and Yu (2011) have proposed a novel approach to detecting explosive bubbles using sequential unit root tests. Their method, called the sup augmented Dickey-Fuller (SADF) test, is designed to identify the start and end dates of a single explosive bubble and is considered superior to existing bubble detection tests. This approach builds upon previous work by Diba and Grossman (1988) who suggested that no bubbles exist in the S&P 500. Phillips and Yu (2011) introduced a new recursive regression methodology that overcomes this limitation and provides consistent dating of bubble origination and collapse.
However, the SADF test may have reduced statistical power and yield inconsistent results when dealing with multiple bubble formations and collapses in the sample period. To address this limitation, Phillips, Shi, and Yu (2015) introduced an extension called the generalized sup ADF (GSADF) method. This approach uses a recursive backward regression technique to precisely identify bubble origination and termination dates while accounting for multiple exuberance and collapse episodes. The GSADF method represents an improvement over the earlier approach, providing more robust and reliable bubble identification within the sample period.
The purpose of the study is to identify the presence of mildly explosive patterns and bubbles in individual stocks that are listed in the S&P 500 stock. The study aims to use real-time monitoring information on selected stocks to evaluate their behavior when they have a bubble component. This will involve identifying the beginning and end periods of the speculative bubble in the stock. To achieve this, the study intends to apply the Generalized Sup Augmented Dickey-Fuller unit root test (GSADF), which was introduced by Phillips et al. (2011) and Phillips et al. (2015), for individual stocks. To be specific, this research tries to address the following research questions.
RQ1- To what extent does the Generalized Supremum Augmented Dickey-Fuller (GSADF) test enable the detection of explosive patterns in individual stocks?
RQ2 – To what extent does the duration of a stock bubble follow a normal distribution in the selected sample?
2. Data and Methodology
This section provides the comprehensive overview of the sampling methodology, data collection, and analytical technologies adopted to execute the study.
2.1. Data and Sample
This quantitative study examines stock growth within the S&P 500 index by applying specific selection criteria. Stocks meeting the criteria include those with at least a 10% price increase on any trading day during the five-year and one-quarter period from January 1, 2018, to March 31, 2023. Such stocks are deemed to potentially exhibit explosive behavior.
Additionally, the study addresses the impact of trading volumes on stock prices. Low-volume stocks, characterized by limited liquidity due to fewer buyers and sellers, are subject to greater price volatility. To mitigate this effect, the study selects stocks with a minimum of one million trades per day, emphasizing higher liquidity and price stability. This approach aims to avoid distortions caused by low-volume stocks and focuses on identifying persistent price bubbles. The chosen five-year and one-quarter time frame provides insight into multiple market cycles, aiding in the detection of bubble patterns and trends. Daily data analysis is crucial as it allows for the identification of subtle trends and patterns that may be missed in weekly or monthly data.
A Python script was used to screen S&P 500 stocks, downloading data and identifying those meeting criteria (10% price change, ≥1 million daily trades). This approach identifies potential bubble candidates. Similarly, R software, known for its user-friendliness, employs the "exuber" package to analyze structural breaks and explosive behavior, as demonstrated in prior studies (Pavlidis et al., 2018) is being used to get the explosiveness of the selected samples.
2.2. Methodology
This study employed two methods to detect the explosive pattern in the individual stock. First, Supremum Augmented Dickey-Fuller (SADF) proposed by Phillips, Wu, and Yu (2011) and Generalized Supremum Augmented Dickey-Fuller (GSADF) proposed by Phillips, Shi and Yu (2015).
2.2.1. SADF Approach
The study by Philips et al. (2011) introduces a novel method that is capable of detecting the periodic collapsing bubbles identified in the work of Evan (1991). The researchers conduct extensive simulation studies and develop a right-tail Dickey-Fuller test, which has the ability to identify the originating and collapsing dates of a bubble with greater power than the cointegration methodology. The testing procedure involves the use of a sup Augmented Dickey-Fuller (SADF) method to identify the presence of explosive behavior in stock prices. Specifically, for each time series (), the ADF test for a unit root against the alternative of an explosive root (right-tailed) is employed. The autoregressive specification of is estimated by least square method as below;
Where k is the transient lag-order which denotes the first-difference operator and IID stands for independent and normally distributed. The objective is to test the unit-root null hypothesis versus the right-tailed alternative of explosiveness, . The above equation is employed repeatedly using a subset of the sample data with one additional observation at each pass in the forward recursive regression. The SADF test uses a rolling window approach to test for the presence of a unit root in a time series. At each step, a subset of the data within the rolling window is used to estimate the autoregressive process. The SADF test then computes a test statistic based on the residuals of the estimated model and compares it to a critical value to determine if the null hypothesis of a unit root can be rejected.
The number of lags in the autoregressive process can have a significant impact on the performance of the SADF test. Too few lags can lead to underfitting, while too many lags can lead to overfitting. To determine the optimal number of lags, forward recursive regression is used to select the lag length that maximizes the test statistic.
Let be the window size of the regression. The window size extends from to , where is the smallest sample window width fraction and 1 is the largest window fraction. The starting point is fixed at 0, and the ending point for each sample is equal to and changes from , Phillips et al. (2015a, p.1048). The ADF statistics for a sample that runs from to is denoted by . The SADF statistic is defined as the sup value of the ADF statistic sequence is,
The Philips et al. (2011) SADF test statistics is defined as a sup value of the sequence of . Under the I (1) null, the limit distribution of the statistic is given by,
Whenever, exceeds the corresponding right-tailed critical value from its limit distribution, the unit root hypothesis is rejected in favor of mildly explosive behavior.
The SADF test statistic cannot locate the beginning and end date of the bubble. In order to identify the beginning and collapse date, a recursive test statistic versus right-tailed critical value needs to be compared. It is the beginning date and is the collapse date, the estimate of these dates can be constructed as below:
2.2.2. Generalized Supremum Augmented Dickey-Fuller (GSADF) Test
Phillips et al. (2015a) proposed a novel approach to enhance the detection capability of multiple stock-price bubbles through a recursive (right-tailed) unit root test called the Generalized SADF (GSADF) test. The GSADF test is built on the same principles as the SADF test but employs more subsamples for estimation than the test, by allowing greater flexibility in the selection of starting points for subsamples . This added degree of flexibility in the estimation window of the GSADF test leads to increased statistical power, enabling it to identify multiple and periodically collapsing episodes of explosiveness, whereas the SADF test is limited to identifying only a single episode.
Phillips et al. (2015) derive the asymptotic null distribution of the SADF and GSADF tests statistics on the basis of the prototypical model with a weak (local to zero) intercept form.
Where d is a constant, the localizing coefficient is greater than ½ and T is a sample size. The alternative hypothesis for the mildly explosive process is
Where with c > 0 and . The following regression model is estimated:
Where is an intercept and k is optimum lag length. Under null I(1), the limit distribution of GSADF statistic is given by
Where is the size of the expanding window. Whenever exceeds the corresponding right-tailed critical value from its limit distribution, the unit root hypothesis is rejected in favor of mildly explosive behavior.
The GSADF statistic's limit distribution in the above equation is equivalent to the scenario where the regression model incorporates an intercept, and the null hypothesis is a random walk or a unit root process without drift. The standard limit distribution of the ADF statistic is a special case of (2.9) with In contrast, the limit distribution of the single recursive SADF statistic is a further specific with The distribution of the asymptotic GSADF test depends on the choice of the smallest window size, denoted as . In practical applications, must be carefully selected based on the total number of observations, T. If T is relatively small, it is important to set to a large enough value to ensure adequate initial estimation. Conversely, if T is large, can be set to a smaller value to maximize the ability to detect an early explosive episode.
However, it is important to note that the theoretical framework for break-test methodology requires to be bounded away from zero as T approaches infinity. To address this, extensive simulations and recommendations for a rule for selecting based on a lower bound of 1% of the full sample and a convenient functional form of = 0.01 + 1.8/√T are applied (Phillips et al., 2015b).
3. Characteristics of the Data
This research utilized data from Yahoo Finance, focusing on S&P 500 companies from January 2018 to March 2023. To narrow down the list, criteria were established: stocks had to show at least a 10% price increase on any day in this period and maintain a minimum daily trading volume of one million shares. A Python code is being used to automate this selection process, resulting in a "growth sample" of 104 companies for further analysis, distributed across sectors presented in the Figure 1.
Figure 1 illustrates the distribution of companies across various industry sectors. The Technology sector boasts the largest number of companies (19), followed by the Financial Services sector (16), and the Energy sector (15). Conversely the Real Estate, Basic Materials and Utilities each comprise only one, four, and six companies, respectively.

Table 1.
Number of Companies by Trading Volume Groups.
| Group | Number of Companies |
|---|---|
| Low Volume | 13 |
| Medium Volume | 67 |
| High Volume | 24 |
The data categorizes companies into three trading volume groups: Low Volume (13 companies, lowest 25%), Medium Volume (67 companies, middle 50%), and High Volume (24 companies, top 25%).
Market capitalization, another crucial metric, is the total value of a company's outstanding shares, calculated by multiplying outstanding shares by the market price as of March 31, 2023.
Table 2 displays the distribution of companies by market capitalization as of March 31, 2023, organized into distinct segments. The largest segment comprises 20 mega-cap companies with market values exceeding $200 billion. Following this, 82 large-cap companies are noted with market values ranging from $10 billion to $200 billion. There are only 2 companies in the mid-cap segment, possessing market values between $2 billion and $10 billion, while the small-cap segments contain no listed companies
Since this research examined 104 stocks, and due to the limited space availability, it showcases the top and bottom ten companies, selected based on their highest percentage change in stock prices during the sample periods. Importantly, even the companies with the lowest percentage increases in this segment still adhered to the study's requirement of a minimum 10% increase in stock prices.
Table 3 presents data on ten companies' stock prices, highlighting their minimum and maximum price points, highest percentage changes, and corresponding date. These companies are the top ten performers in terms of percentage increase during the sample period, with stock prices ranging from $3.800 to $9.04 (minimum) and $22.25 to $76.459 (maximum), and percentage changes ranging from 29.466% to 74.593%
The table showcases the ten lowest-performing stocks within a larger group of growth stocks. These stocks had the highest single-day percentage increases in stock prices, but their gains were comparatively smaller than those of other stocks in the growth sample. For instance, Altria Group, Inc. (MO) had a 10.022% increase on March 13, 2020, marking its highest single-day percentage gain during the chosen period, but it was the lowest among the listed stocks. Notably, eight of these ten companies experienced their highest daily percentage returns in 2020, while one achieved its highest return in 2019, and another in 2021.
Figure 2 illustrates the evolution in the number of stocks experiencing their highest single-day percentage growth from 2018 to 2023. There's a notable increase in such occurrences over the selected period. In 2018, only 3 stocks exhibited this level of growth, which expanded to 7 in 2019, and surged to 86 in 2020. However, the data for 2021 and 2022 shows a decline in the number of stocks with this level of growth. In 2021, only 3 stocks matched the 2018 count, and in 2022, there were just 4. By 2023, this trend further decreased to only one stock.
4. Results and Discussion
To determine the smallest window size () for the GSADF test, it's crucial to consider the total number of observations (T). For practical purposes, a rule of thumb, based on research by Phillips et al. (2015a), recommends setting to a lower bound of 1% of the full sample, using the formula .
In our study with 1320 observations spanning from January 01, 2018, to March 31, 2023 (1320 trading days), we followed this recommendation, resulting in an value of 0.059543. This corresponds to a minimum moving window of 6% or a minimum window size of 78 observations. The test began with the first observations in the time series.
Regarding bubble duration, Phillips et al. (2015b) found that it should exceed a parameter δ log (T), which grows proportionally with the dataset's size. For our dataset covering 1320 days, the optimal minimum duration for bubble identification is 7 days.
Table 5.
Dependent Variables for Recursive Test.
| Variable | Value |
|---|---|
| Number of Observation | 1320 |
| Minimum Window Size | 78 |
| Minimum Duration | 7 |
| Optimum Lag | 12 |
Note. The table presents the dominant variables for the test.
For the optimal lag size, we utilized the Akaike Information Criterion (AIC) method. Importantly, the optimal lag size for each of the 104 stocks, each with 1320 observations, was determined to be 12.
4.1. Effectiveness of GSADF Test (RQ1)
This study aims to assess the GSADF test's effectiveness in identifying explosive patterns, which are sudden and substantial price movements in individual stocks. By applying the GSADF test to a dataset of individual stock prices, the research evaluates its reliability in detecting these patterns.
The GSADF test calculates a test statistic measuring the maximum deviation of the time series from a unit root process across various possible breakpoints. Specifically, for each time series, the GSADF test analyzes overlapping windows of 78 observations with a lag size of 12. If the test statistic surpasses the critical value, the null hypothesis of a unit root is rejected.
In simpler terms, rejecting the null hypothesis in the GSADF test implies that the time series has undergone significant structural changes or breaks. In this context, it suggests that current stock prices may not be sustainable. The table below presents the results of the ADF, SADF, and GSADF test statistics for the selected stocks.
Table 6 provides test statistics for various methodologies applied to the initial ten companies. Nonetheless, a direct comparison of the test statistics alone is inadequate without considering the corresponding critical values for each of the stocks. To address this, the study employed a Monte Carlo simulation approach to generate these critical values for comparison. The Monte Carlo simulation technique involves generating numerous random time series with statistical properties resembling the original data. These simulated time series are then employed to estimate the distribution of the test statistic under the null hypothesis of a unit root, indicating that the time series data is non-stationary.
Table 6.
The Test Statistics of ADF, SADF, and GSADF Test.
| Stock | ADF | SADF | GSADF |
|---|---|---|---|
| AAL | -2.94385 | -0.693679 | 2.684* |
| AAPL | -0.70801 | 3.051488* | 3.08* |
| ABBV | 0.03585* | 2.053853* | 2.929* |
| ABT | -1.6824 | 0.855871 | 1.944 |
| AIG | -1.9419 | 0.354467 | 4.449* |
| AMAT | -0.75977 | 3.058316* | 3.074* |
| AMD | -1.37354 | 2.780965* | 2.801* |
| AMZN | -1.73249 | 1.657749* | 2.035 |
| APA | -1.99812 | -0.625699 | 1.707 |
| ATVI | -1.43785 | 0.074869 | 2.266 |
Note. The table demonstrates the test statistics of the first ten companies. * Denote the rejection of the null hypothesis in a 95% significance level.
To establish critical values for the GSADF test applied to 104 stocks, I initially estimated model parameters, as displayed in Table 6. Monte Carlo simulation is used to generate numerous synthetic time series mimicking the statistical properties of the chosen time series. For each synthetic series, we computed and documented GSADF test statistics. Subsequently, we derived critical values for the GSADF test at a 95 percent significance level from the distribution of these simulated test statistics.
Table 7.
The Critical Value of Monte Carlo Simulation of ADF, SADF, and GSADF.
| Significance Level | ADF | SADF | GSADF |
|---|---|---|---|
| 90 | -0.42022 | 1.302 | 2.157 |
| 95 | -0.07796 | 1.54 | 2.387 |
| 99 | 0.51359 | 2.157 | 2.813 |
The critical values for the ADF, SADF, and GSADF tests at different significance levels (90%, 95%, and 99%) were obtained through Monte Carlo simulation and are presented in the table.
4.1.2. Datestamp Result
Identifying the start and end dates of explosive behavior in stock prices depends on the minimum duration of exuberance. In this context, an origin date is established when the time series of recursive test statistics characterized by r values within the range of , surpasses the critical value associated with those statistics. Similarly, a termination date is designated when the critical value of with r values spanning exceeds the corresponding test statistics. Phillips & Shi (2020) noted that the origination of a bubble or crisis episode is determined as the point when the GSADF test statistic first surpasses its critical value, while the termination date corresponds to the point when the supremum test statistic subsequently falls below its critical value, establishing two distinct stopping times for the episode.
The data in Table 8 reveals several noteworthy observations. For example, Apple Inc. (AAPL) experienced a peak on November 11, 2019, following an upward trend that began on October 21, 2019. This peak persisted for a duration of 29 days, concluding on December 02, 2019. Similarly, AbbVie Inc. (ABBV) reached its highest point on November 15, 2019, after a period of upward movement starting on November 8, 2019. This peak lasted for 8 days, ending on November 20, 2019. Additionally, American International Group Inc. (AIG) and Applied Materials Inc. (AMAT) encountered peaks with varying durations. The table also indicates the presence of multiple episodes of bubbles within each stock, characterized by different duration dates.
Table 8.
Bubble Result of the Stocks Based on GSADF Test.
| Stock Name | Start Date | Peak Date | End Date | Duration (Days) |
|---|---|---|---|---|
| AAPL | 2019-10-21 | 2019-11-11 | 2019-12-02 | 29 |
| AAPL | 2019-12-26 | 2020-01-13 | 2020-01-31 | 24 |
| AAPL | 2020-08-03 | 2020-09-01 | 2020-09-08 | 25 |
| ABBV | 2019-11-08 | 2019-11-15 | 2019-11-20 | 8 |
| ABBV | 2022-03-15 | 2022-04-08 | 2022-04-13 | 21 |
| AIG | 2019-05-09 | 2019-05-20 | 2019-05-31 | 15 |
| AMAT | 2021-02-11 | 2021-02-24 | 2021-03-04 | 14 |
| AMAT | 2021-03-09 | 2021-03-17 | 2021-03-18 | 7 |
| AMAT | 2021-03-22 | 2021-04-05 | 2021-05-10 | 34 |
| AMAT | 2021-05-24 | 2021-06-14 | 2021-06-18 | 18 |
| AMAT | 2021-06-23 | 2021-06-29 | 2021-07-02 | 7 |
| AMD | 2018-08-23 | 2018-09-17 | 2018-09-28 | 25 |
| AMD | 2021-11-11 | 2021-11-29 | 2021-12-01 | 13 |
Note. The table presents the date stamping result of the first five stocks. Due to the limited space, only the first five stock results are presented in the table.
Figure 3.
Plotting of Date Stamp Result. Note. Figure 5 presents the dates tamp result visually for two stocks.
Figure 3.
Plotting of Date Stamp Result. Note. Figure 5 presents the dates tamp result visually for two stocks.
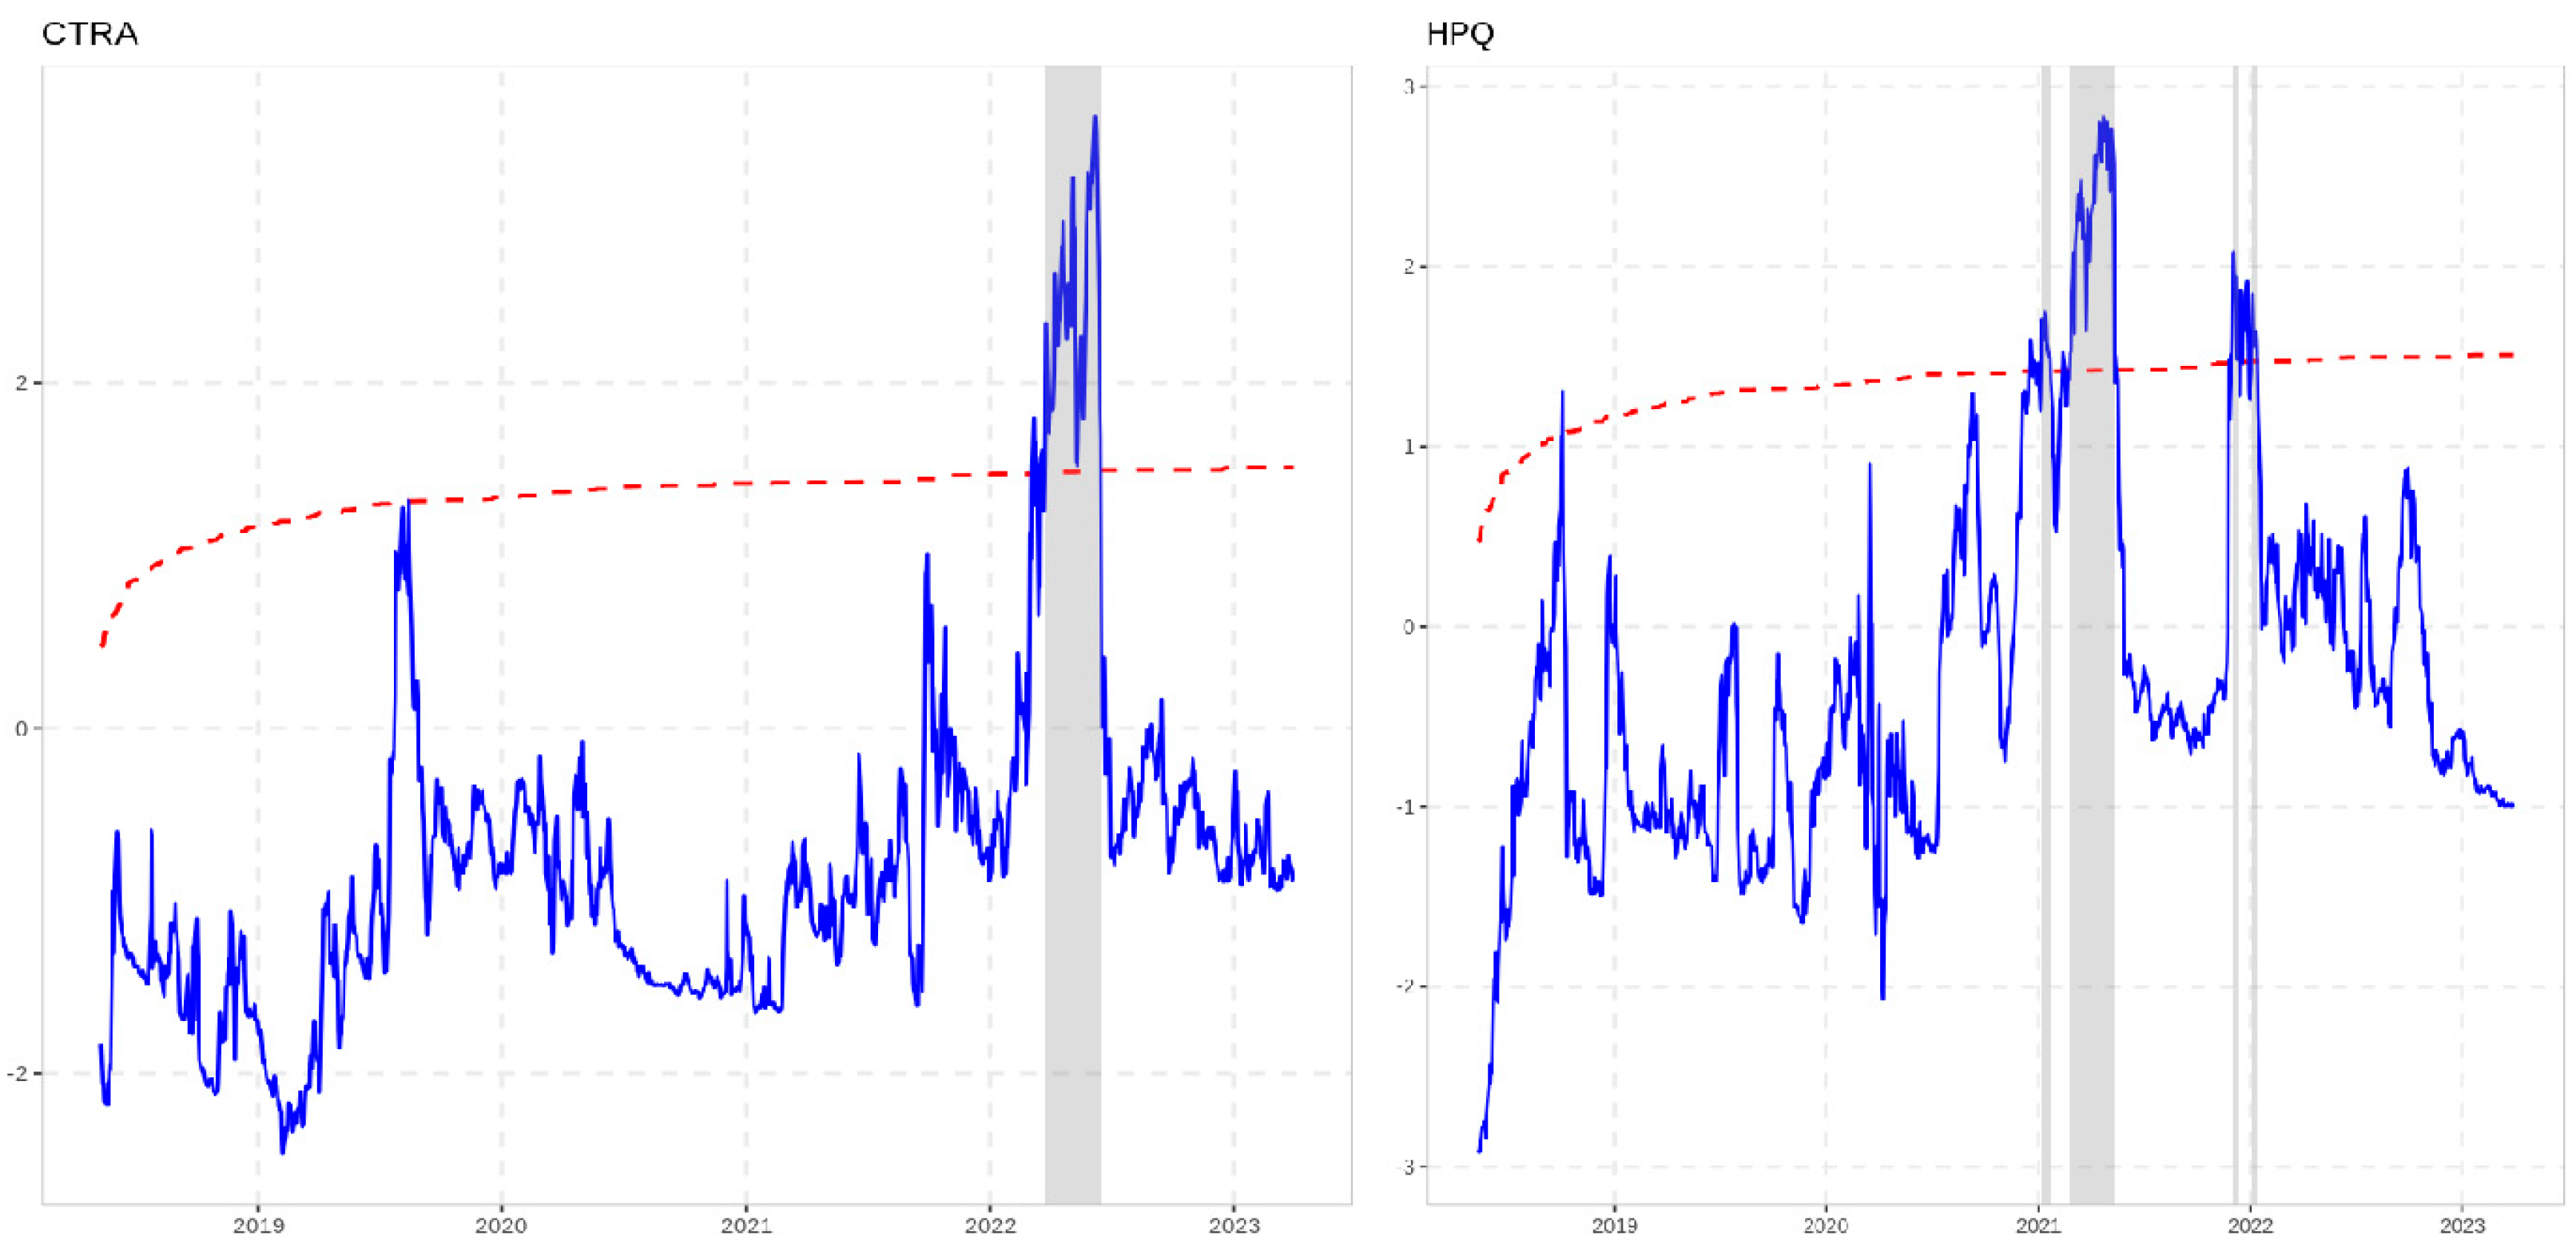
This figure shows the relationship between critical values from our Monte Carlo simulation and GSADF test statistics. The red line is the critical value, the blue line is the GSADF test statistics, and the shaded region indicates where they intersect, suggesting potential bubble-like behavior in analyzed stocks.
Figure 4.
Comparison of Number of Bubble Episodes by Year.
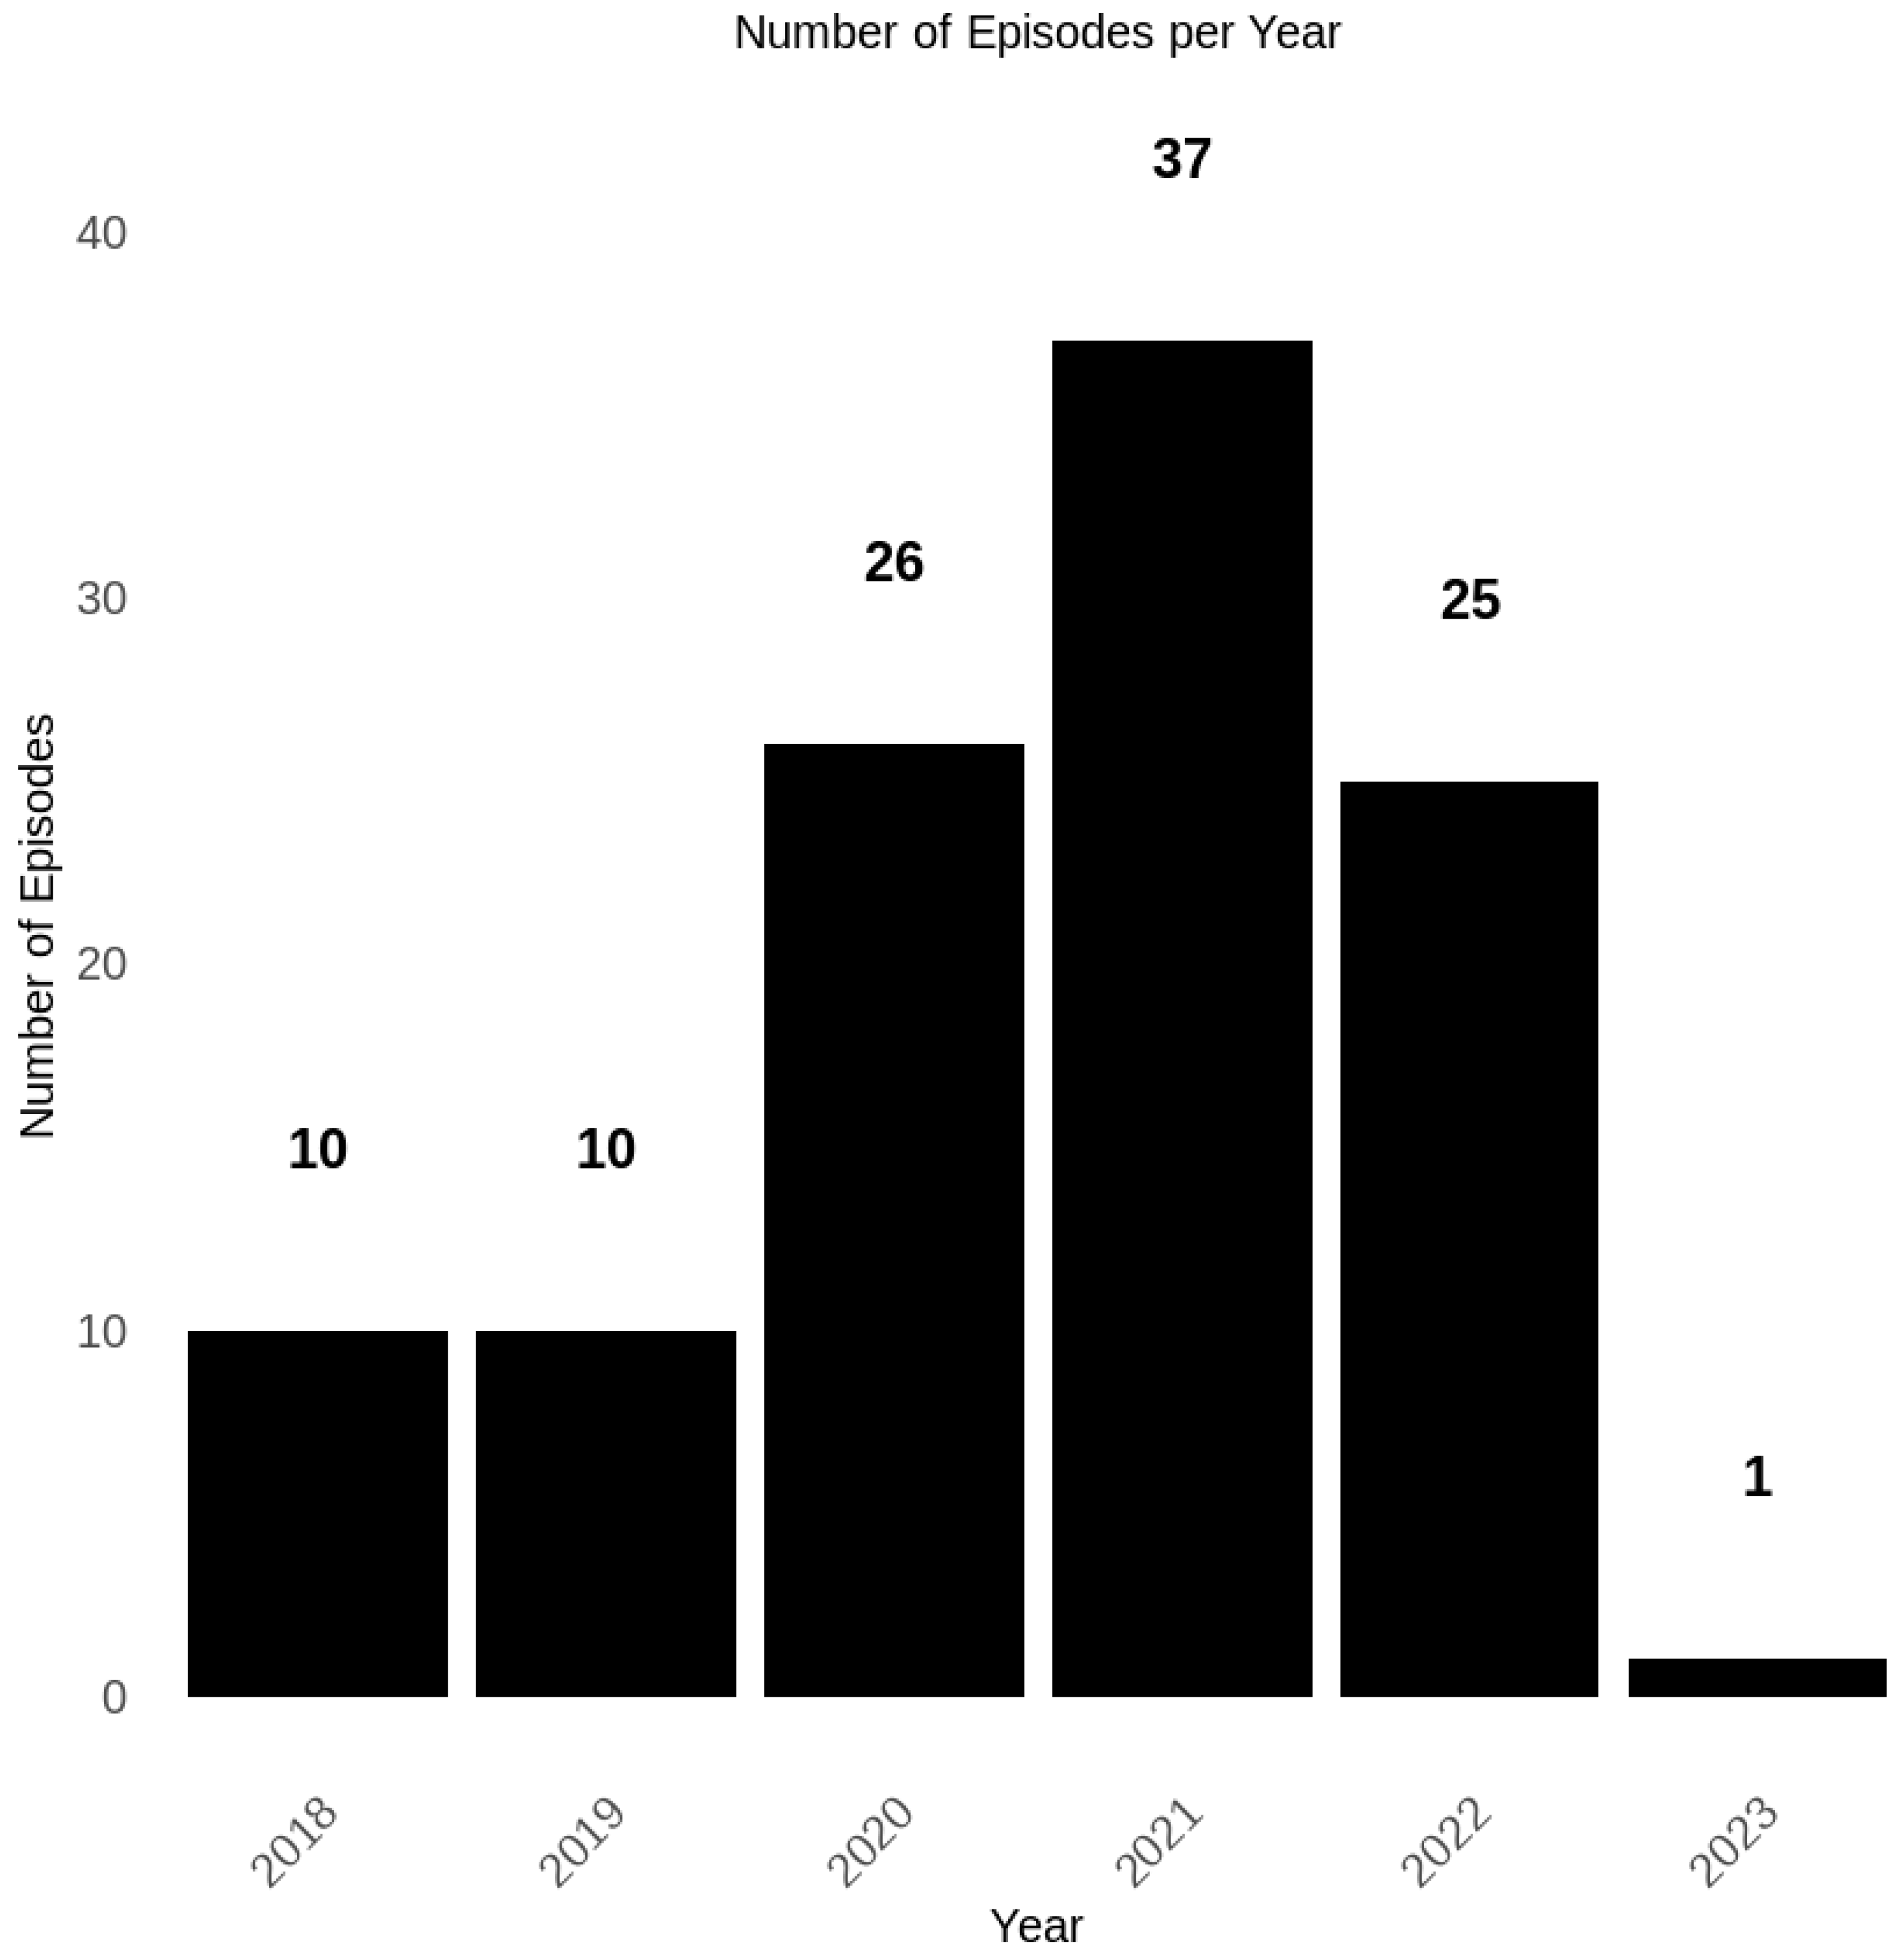
The data reveals a notable increase in bubble episodes among 104 selected stocks from 2018 to 2023. In 2018 and 2019, there were 10 episodes each. However, in 2020, this number surged to 26, and in 2021, it further increased to 37. In contrast, 2022 saw a decline to 25 episodes, and the first quarter of 2023 had only one. In total, there were 109 bubble episodes across these stocks.
Table 9.
Results of SADF and GSADF Test.
| Stock | SADF Result | GSADF Result |
|---|---|---|
| AAL | Cannot reject H0 | Rejects H0 at the 5% significance level |
| AAPL | Rejects H0 at the 1% significance level | Rejects H0 at the 1% significance level |
| ABBV | Rejects H0 at the 1% significance level | Rejects H0 at the 1% significance level |
| ABT | Cannot reject H0 | Cannot reject H0 |
| AIG | Cannot reject H0 | Rejects H0 at the 1% significance level |
The test statistics were compared to critical values obtained via SADF and GSADF approaches for each analyzed stock. For example, the first stock, AAL, yielded test statistics of -0.6937 for SADF and 2.687 for GSADF. The critical values for this stock were 1.54 (SADF) and 2.387 (GSADF). As a result, the SADF test did not reject the null hypothesis, while the GSADF test rejected it at a 5% significance level.
Figure 5 displays the results of both SADF and GSADF tests for selected stocks, indicating whether the null hypothesis (H0) is rejected at significance levels of 1%, 5%, and 10%. These tests assess whether there is a unit root, suggesting non-stationarity and a potential stock bubble. Typically, rejection at the 1% significance level includes stocks also rejected at the 5% and 10% levels, while rejection at the 5% level implies rejection at the 10% level. However, rejection at the 10% significance level does not necessarily extend to stocks rejected at the 1% and 5% levels. To maintain clarity in comparisons, this test does not aggregate stocks rejected at other significance levels.
In the "Cannot reject H0" category, 71 stocks were identified as non-rejecting using the SADF test, and 38 stocks using the GSADF test. This implies that the statistical tests failed to reject the null hypothesis at any significance level. It suggests the possibility of a unit root and non-stationarity in these stocks. These stocks do not exhibit characteristics associated with a stock bubble.
Furthermore, in the "Rejects H0 at the 1% significance level" category, 16 stocks were identified as rejecting the null hypothesis using the SADF test, while 34 stocks did so using the GSADF test. This indicates that these stocks provide strong statistical evidence against the presence of a stock bubble at the 1% significance level. Both tests strongly suggest that these stocks are unlikely to have a stock bubble and display characteristics of stationarity.
Moving to the "Rejects H0 at the 5% significance level" category, 8 stocks were identified by the SADF test and 14 stocks by the GSADF test as rejecting the null hypothesis at the 5% significance level. This implies a reduced likelihood of a stock bubble in these stocks. The results from both tests indicate that these stocks exhibit characteristics consistent with stationarity.
Finally, in the "Rejects H0 at the 10% significance level" category, 9 stocks were identified using the SADF test, and 18 stocks using the GSADF test as rejecting the null hypothesis at the 10% significance level. These stocks provide evidence against a stock bubble, though with a slightly lower level of confidence compared to the 1% and 5% significance levels.
In summary, the analysis of the outcomes reveals that the Generalized Supremum Augmented Dickey-Fuller (GSADF) test is notably effective in detecting explosive patterns in individual stocks, as evidenced by its consistently higher rejection rates of the null hypothesis at various significance levels compared to the SADF test. Specifically, the GSADF test outperforms the SADF test by rejecting the null hypothesis for 34 stocks at the 1% level, 18 stocks at the 5% level, and 14 stocks at the 10% level, indicating a superior ability to identify potential stock bubbles. Conversely, the SADF test exhibits lower rejection rates, implying reduced sensitivity to identifying stationarity and a potentially higher risk of overlooking stock bubble occurrences. The findings strongly support the GSADF test as a more robust approach for detecting stock bubbles in individual stocks.
4.2. Normality Test (RQ2)
This study aims to examine the distribution patterns of stock bubble durations in a selected sample. Two hypotheses were formulated: the null hypothesis positing that stock bubble durations adhere to a normal distribution and the alternative hypothesis suggesting non-conformance to a normal distribution. If the null hypothesis is supported, it implies that stock bubbles share statistical properties with other phenomena following a normal distribution. This knowledge can assist investors in estimating the probability and duration of future bubbles, aiding in more informed investment decisions.Conversely, support for the alternative hypothesis indicates unique and non-random properties of stock bubbles, differentiating them from typical normal distribution patterns.
To assess the normality of stock bubble duration data, the study employed the Shapiro–Wilk test. The duration being compared is the number of days between the start and end date of the explosiveness of the respective stocks. The study comprises two hypotheses. The null hypothesis posits that stock bubble durations, from initial breakout to end, adhere to a normal distribution, suggesting similarities with other phenomena following this pattern. On the other hand, the alternative hypothesis suggests that stock bubble durations do not conform to a normal distribution, implying unique and non-random properties that distinguish them from typical normal distribution phenomena.
Table 17.
Shapiro Wilk Test Outcome: Bubble Duration.
| Statistics | Values |
|---|---|
| Test Statistic (W) | 0.6903638243675232 |
| p-value | 7.629625555470587e-14 |
| Mean Duration | 19.6698 days |
| Skewness | 3.7681 |
| Kurtosis | 22.8357 |
The decision-making process based on the Shapiro-Wilk test involves comparing the computed p-value with a predefined significance level, denoted as α (typically set at 0.05). When the p-value is less than α, it indicates a rejection of the null hypothesis, suggesting that the dataset does not adhere to a normal distribution. Conversely, when the p-value is greater than or equal to α, the null hypothesis is retained due to insufficient evidence to assert non-normality. In this particular case, the p-value is significantly lower than the predetermined α level, leading to the rejection of the null hypothesis. This rejection supports the conclusion that the duration of the stock bubble, from its beginning to its collapse, does not exhibit a normal distribution.
Figure 6 depicts how deviations from a reference line reveal departures from normality in the dataset measuring the duration from start to peak in days. Points above the line indicate higher quantile values, suggesting positive skewness, while points below indicate lower values, indicating negative skewness.
The non-normal distribution of bubble durations in our analysis can be attributed to the unique characteristics and behaviors of individual stocks during bubble periods. Some stocks experience longer and more pronounced bubbles, while others have shorter, less intense ones, creating heterogeneity in the data. This variability, along with the presence of outliers, significantly influences the distribution. Out of the 104 stocks studied, only 52 stocks showed bubble phenomena with 109 episodes, leading to varied durations and deviating from normality assumptions.
5. Conclusion
This study assessed the GSADF test's effectiveness in identifying explosive patterns in individual stocks by assessing unit roots and stationarity. The GSADF test, which examines overlapping stock price data windows for deviations from a unit root process, consistently outperformed the SADF test in rejecting the null hypothesis. It detected explosive patterns in 34 stocks at a 1% significance level, compared to 16 stocks for the SADF test. Overall, the GSADF test demonstrated greater sensitivity and effectiveness in identifying stock bubbles, while the SADF test had lower sensitivity in this regard.
Several reasons account for the GSADF test's superiority over the SADF test. Firstly, the SADF test assumes a single structural break, limiting its usefulness when multiple structural breaks or regime shifts are present. In contrast, the GSADF test is designed to handle such scenarios more effectively, making it better at detecting and quantifying multiple structural breaks. Additionally, the SADF test can suffer from size distortions, causing the actual significance level to deviate from the desired level. This issue is addressed by the GSADF test through the use of Monte Carlo simulations, which accurately estimate significance levels, reducing size distortions and enhancing test accuracy.
This study assessed the normality of stock bubble durations, assuming that the time from bubble initiation to collapse follows a normal distribution. The Shapiro-Wilk test produced a very low p-value 7.629e-14, well below the 0.05 significance level. Therefore, it can be concluded that stock bubble durations, from initiation to deflate, do not conform to a normal distribution.
Funding
This research received no external funding.
Acknowledgements
I would acknowledge the support of editors and reviewers for extending me necessary support for this research.
Conflicts of Interest
There is no conflict of interest.
References
- Aliber, R.Z.; Kindleberger, C.P.; Solow, R.M. Manias, panics, and crashes: A history of financial crises (7th Ed.). Palgrave Macmillan: Basingstoke, 2015. https://www.doi.org/10.1007/978-1-137-52574-1.
- Biswas, S.; Hanson, A.; Phan, T. Bubbly recessions. American Economic Journal: Macroeconomics, 2020, 12, 33–70. [Google Scholar] [CrossRef]
- Camerer, C. Bubbles and fads in asset prices. Journal of Economic Surveys 1989, 3, 3–41. [Google Scholar] [CrossRef]
- Craine, R. Rational bubbles: A test. Journal of Economic Dynamics and Control 1993, 17, 829–846. [Google Scholar] [CrossRef]
- Cuñado, J.; Gil-Alana, L.A.; De Gracia, F.P. A test for rational bubbles in the NASDAQ stock index: A fractionally integrated approach. Journal of Banking & Finance 2005, 29, 2633–2654. [Google Scholar] [CrossRef]
- Diba, B.T.; Grossman, H.I. Explosive rational bubbles in stock prices? The American Economic Review 1988, 78, 520–530. [Google Scholar]
- Dickey, D.A.; Fuller, W.A. Distribution of the estimators for autoregressive time series with a unit root. Journal of the American statistical association 1979, 74, 427–431. [Google Scholar] [CrossRef]
- Evans, G.W. Pitfalls in testing for explosive bubbles in asset prices. The American Economic Review 1991, 81, 922–930. [Google Scholar]
- French, D.E. (1991). Early speculative bubbles and increases in the supply of money. [Master’s thesis, University of Nevada, Las Vegas]. UNLV Retrospective Theses & Dissertations. http://dx.doi.org/10.25669/h29l-bf64. [CrossRef]
- Froot, K.A.; Obstfeld, M. (1989). Intrinsic bubbles: The case of stock prices. https://www.jstor.org/stable/2006913.
- Karimov, A. (2017). Identifying Stock Market Bubbles. Contributions to Management Science. Springer. https://doi.org/10.1007/978-3-319-65009-8. [CrossRef]
- Koustas, Z.; Serletis, A. Rational bubbles or persistent deviations from market fundamentals? Journal of Banking & Finance 2005, 29, 2523–2539. [Google Scholar] [CrossRef]
- Pavlidis, E.; Martinez-Garcia, E.; Grossman, V. Detecting periods of exuberance: A look at the role of aggregation with an application to house prices. Economic Modelling 2019, 80, 87–102. [Google Scholar] [CrossRef]
- Phillips, P.C.; Shi, S. Real-time monitoring of asset markets: Bubbles and crises. In Handbook of Statistics; Elsevier: Amsterdam, The Netherlands, 2020; Volume 42, pp. 61–80. [Google Scholar] [CrossRef]
- Phillips, P.C.; Yu, J. Dating the timeline of financial bubbles during the subprime crisis. Quantitative Economics 2011, 2, 455–491. [Google Scholar] [CrossRef]
- Phillips, P.C.; Shi, S.; Yu, J. Specification sensitivity in right-tailed unit root testing for explosive behavior. Oxford Bulletin of Economics and Statistics 2014, 76, 315–333. [Google Scholar] [CrossRef]
- Phillips, P.C.; Shi, S.; Yu, J. Testing for multiple bubbles: Historical episodes of exuberance and collapse in the S&P 500. International economic review 2015, 56, 1043–1078. [Google Scholar] [CrossRef]
- Phillips, P.C.; Shi, S.; Yu, J. Testing for multiple bubbles: Limit theory of real-time detectors. International Economic Review 2015, 56, 1079–1134. [Google Scholar] [CrossRef]
- Do stock prices move too much to be justified by subsequent changes in dividends? (NBER Working Paper No. 0456). National Bureau of Economic Research. 1981. https://www.nber.org/papers/w0456.
- Shiller, R.J. Measuring bubble expectation and investor confidence. The Journal of Psychology and Financial Market 2000, 1, 49–60. [Google Scholar] [CrossRef]
- Stiglitz, J.E. Symposium on bubbles. Journal of economic perspectives 1990, 4, 13–18. [Google Scholar] [CrossRef]
- West, K.D. Speculative bubbles and stock price volatility. Department of Economics. Princeton University. 1984.
- West, K.D. A specification test for speculative bubbles. The Quarterly Journal of Economics 1987, 102, 553–580. [Google Scholar] [CrossRef]
Figure 1.
Sectors with the Number of Companies.
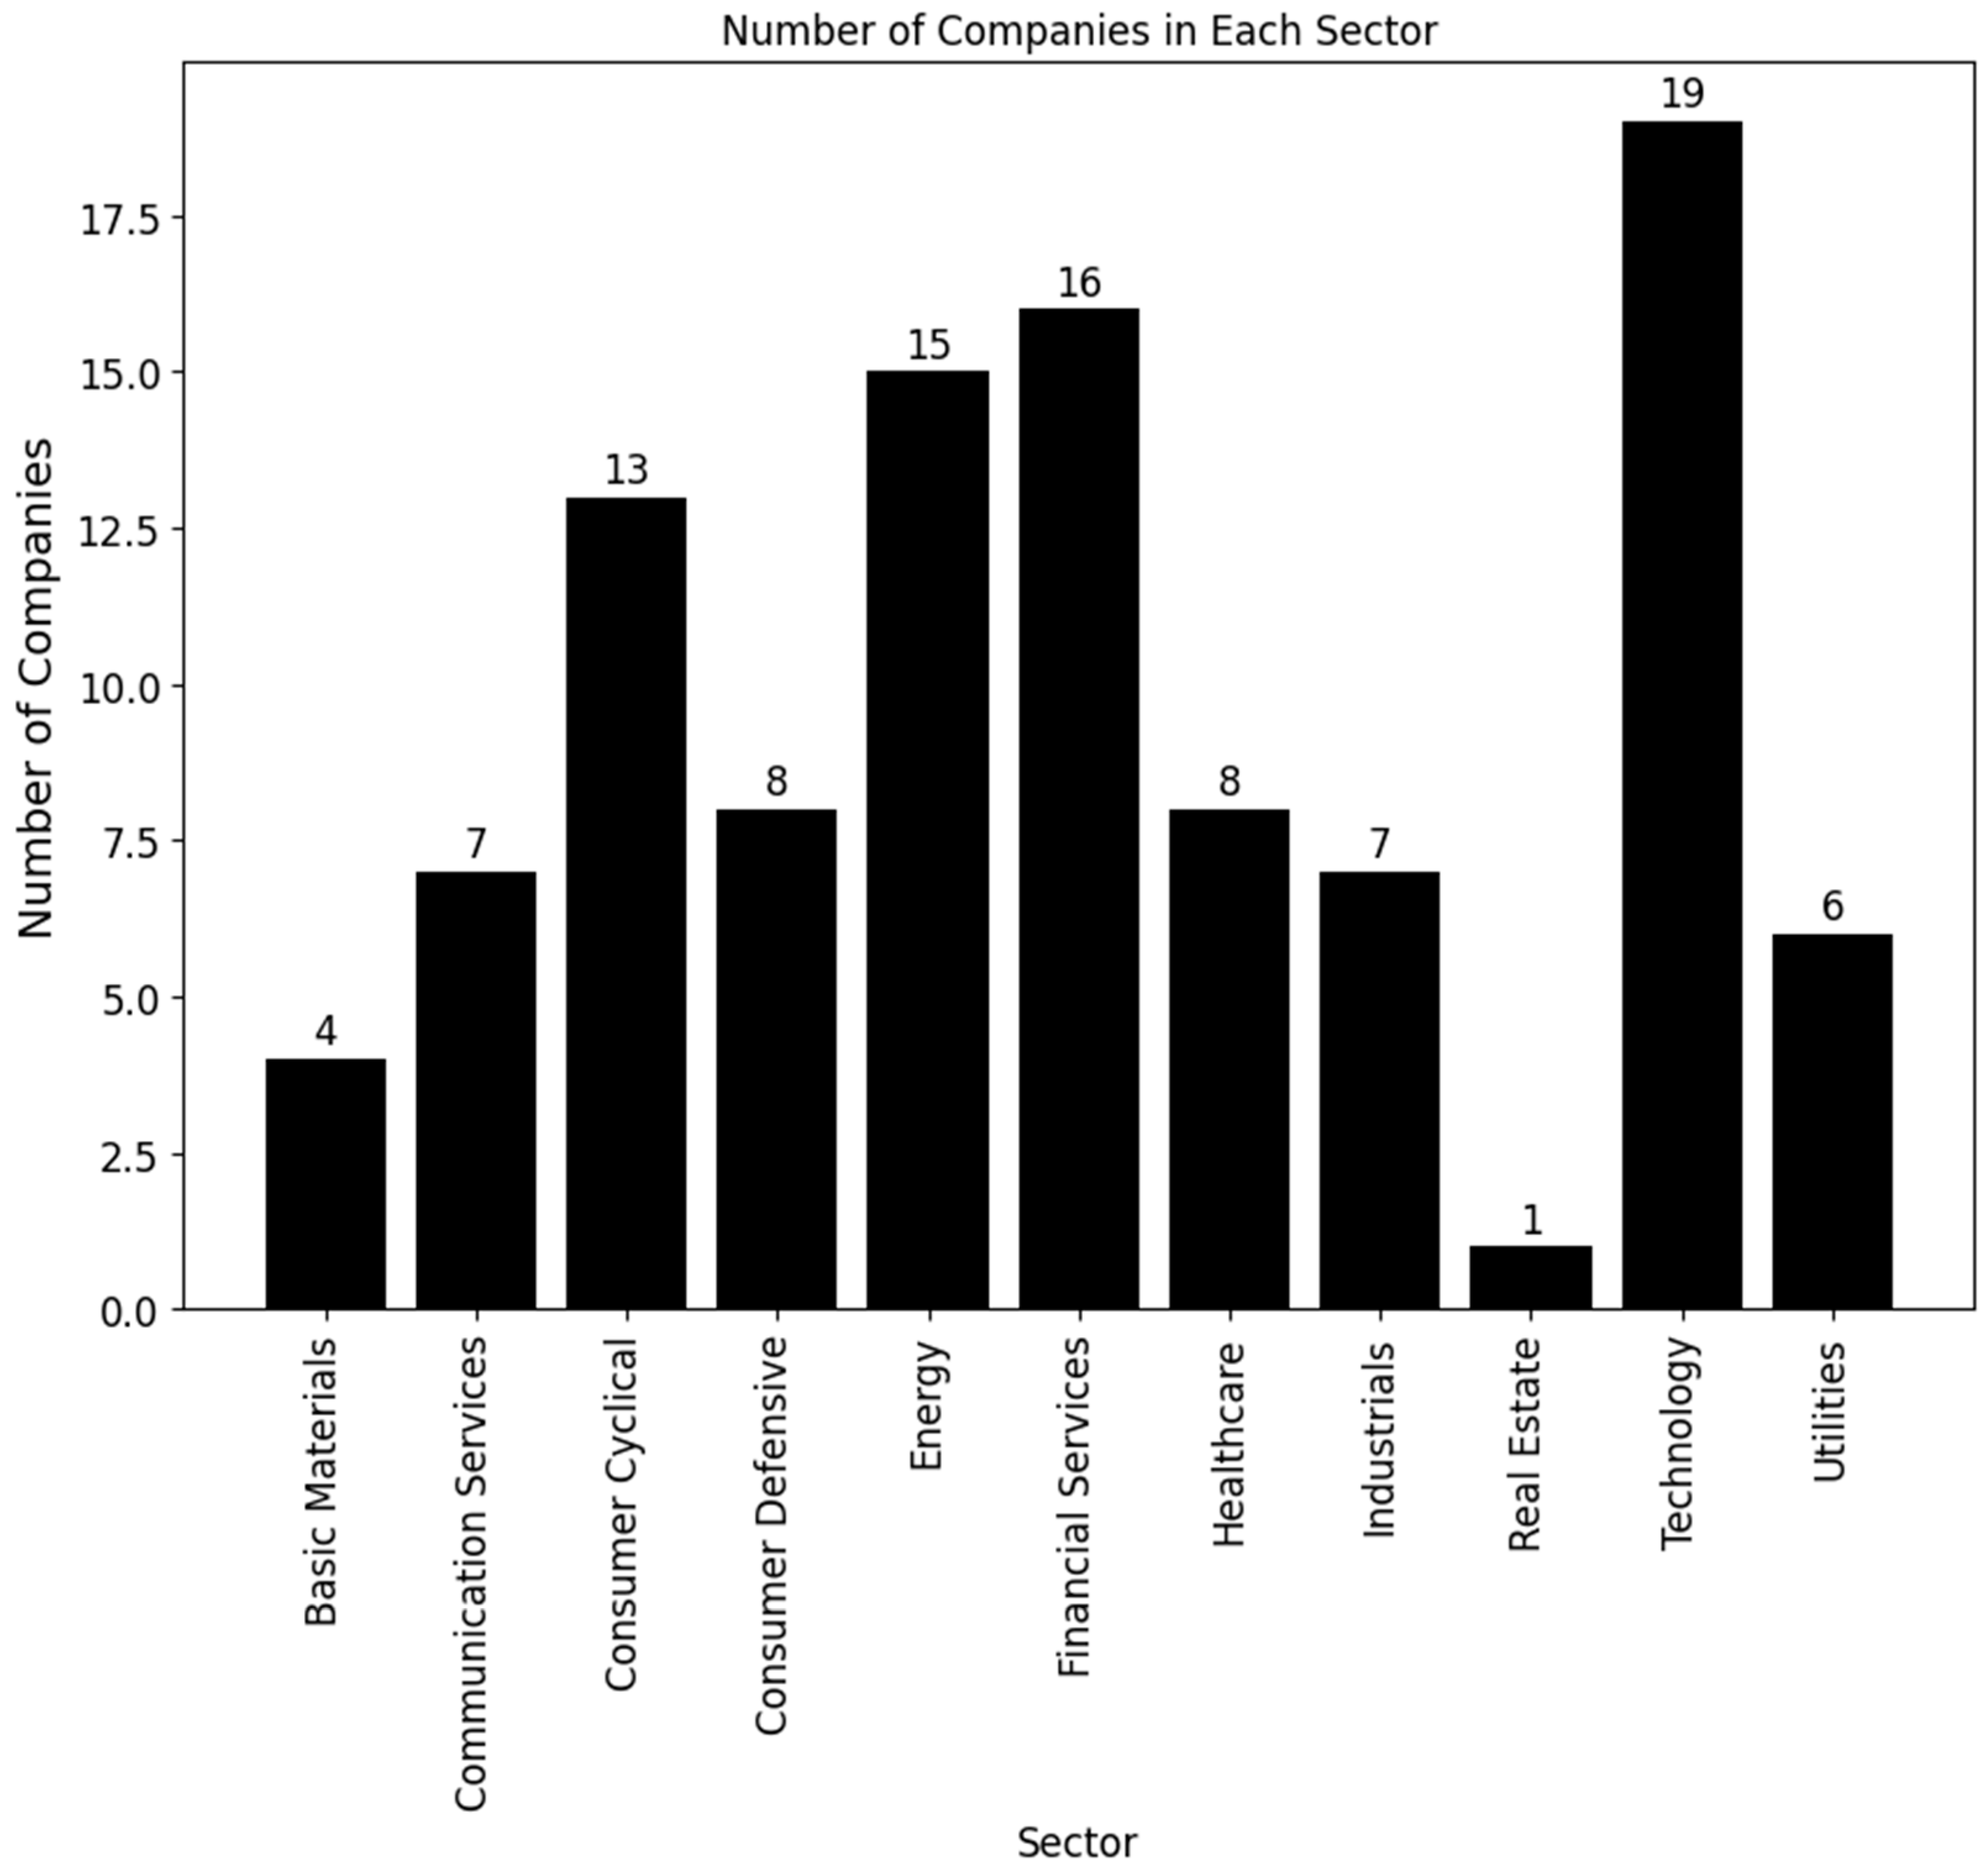
Figure 2.
Number of Stocks with Highest Price Increase by Year (2018-2023). Note: The figure shows the number of stocks in each year by their highest growth in a single day.
Figure 2.
Number of Stocks with Highest Price Increase by Year (2018-2023). Note: The figure shows the number of stocks in each year by their highest growth in a single day.
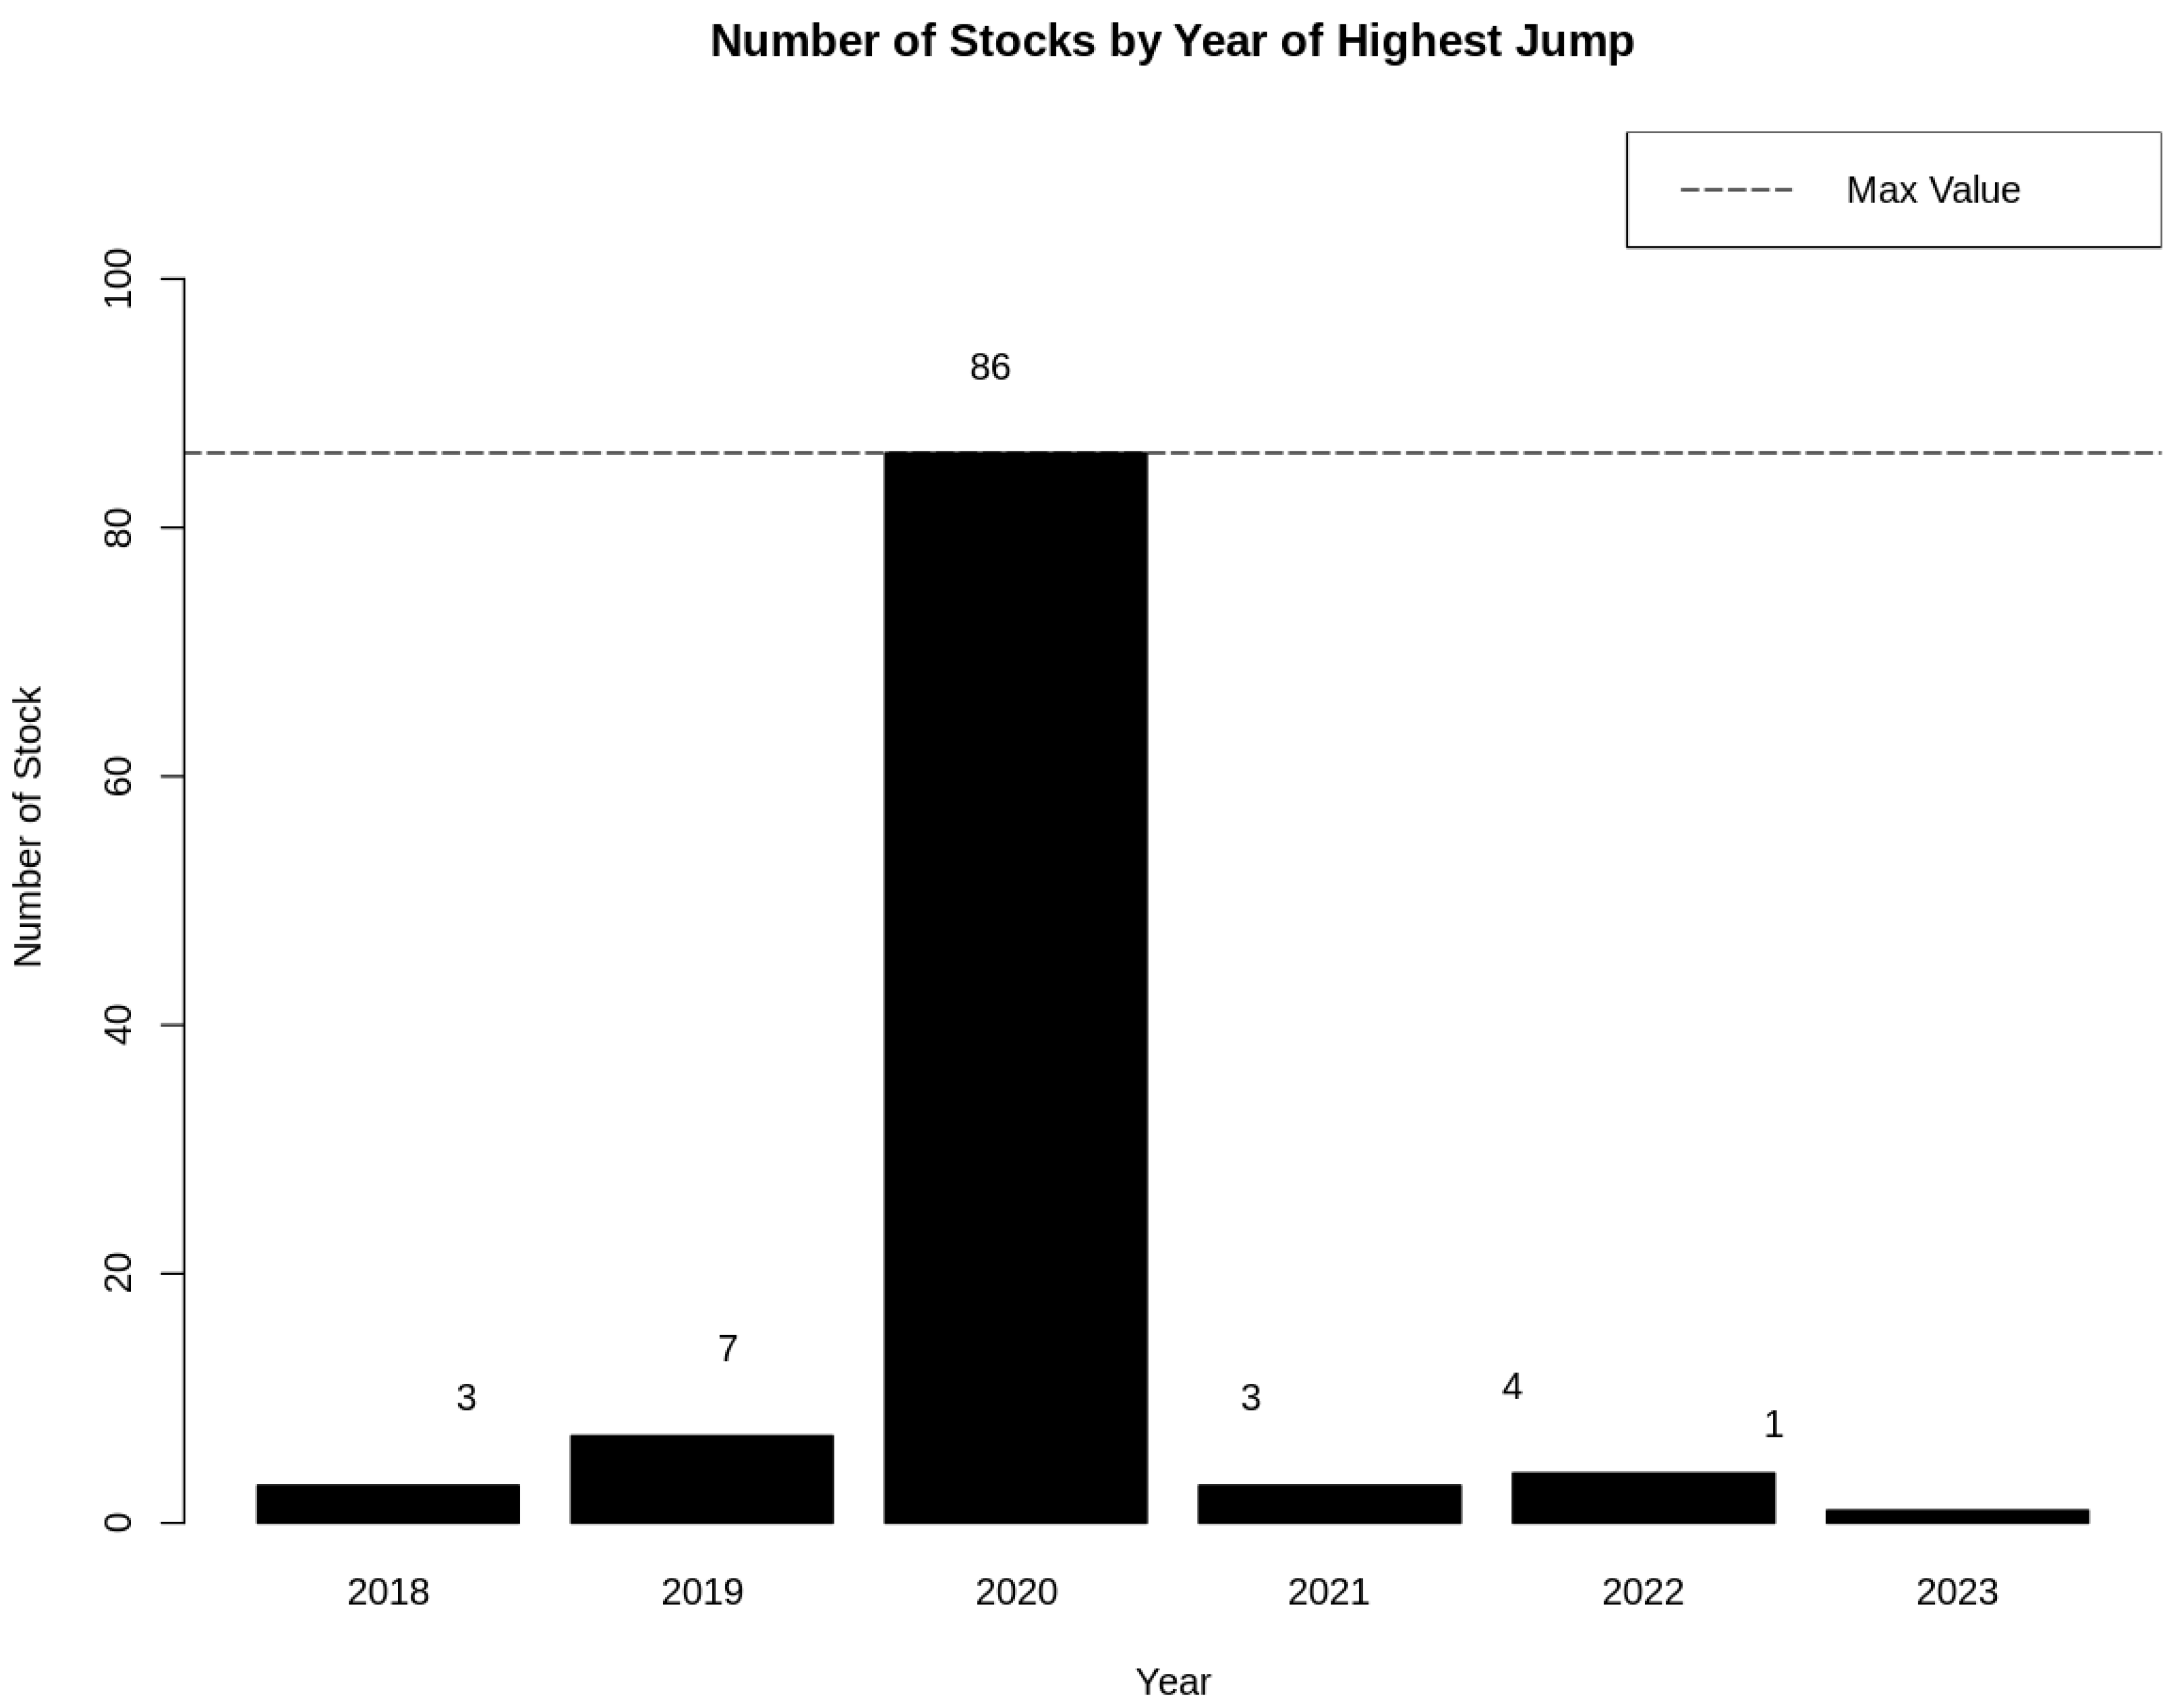
Figure 5.
Bar Graph of Non-stationarity by SADF and GSADF Test.
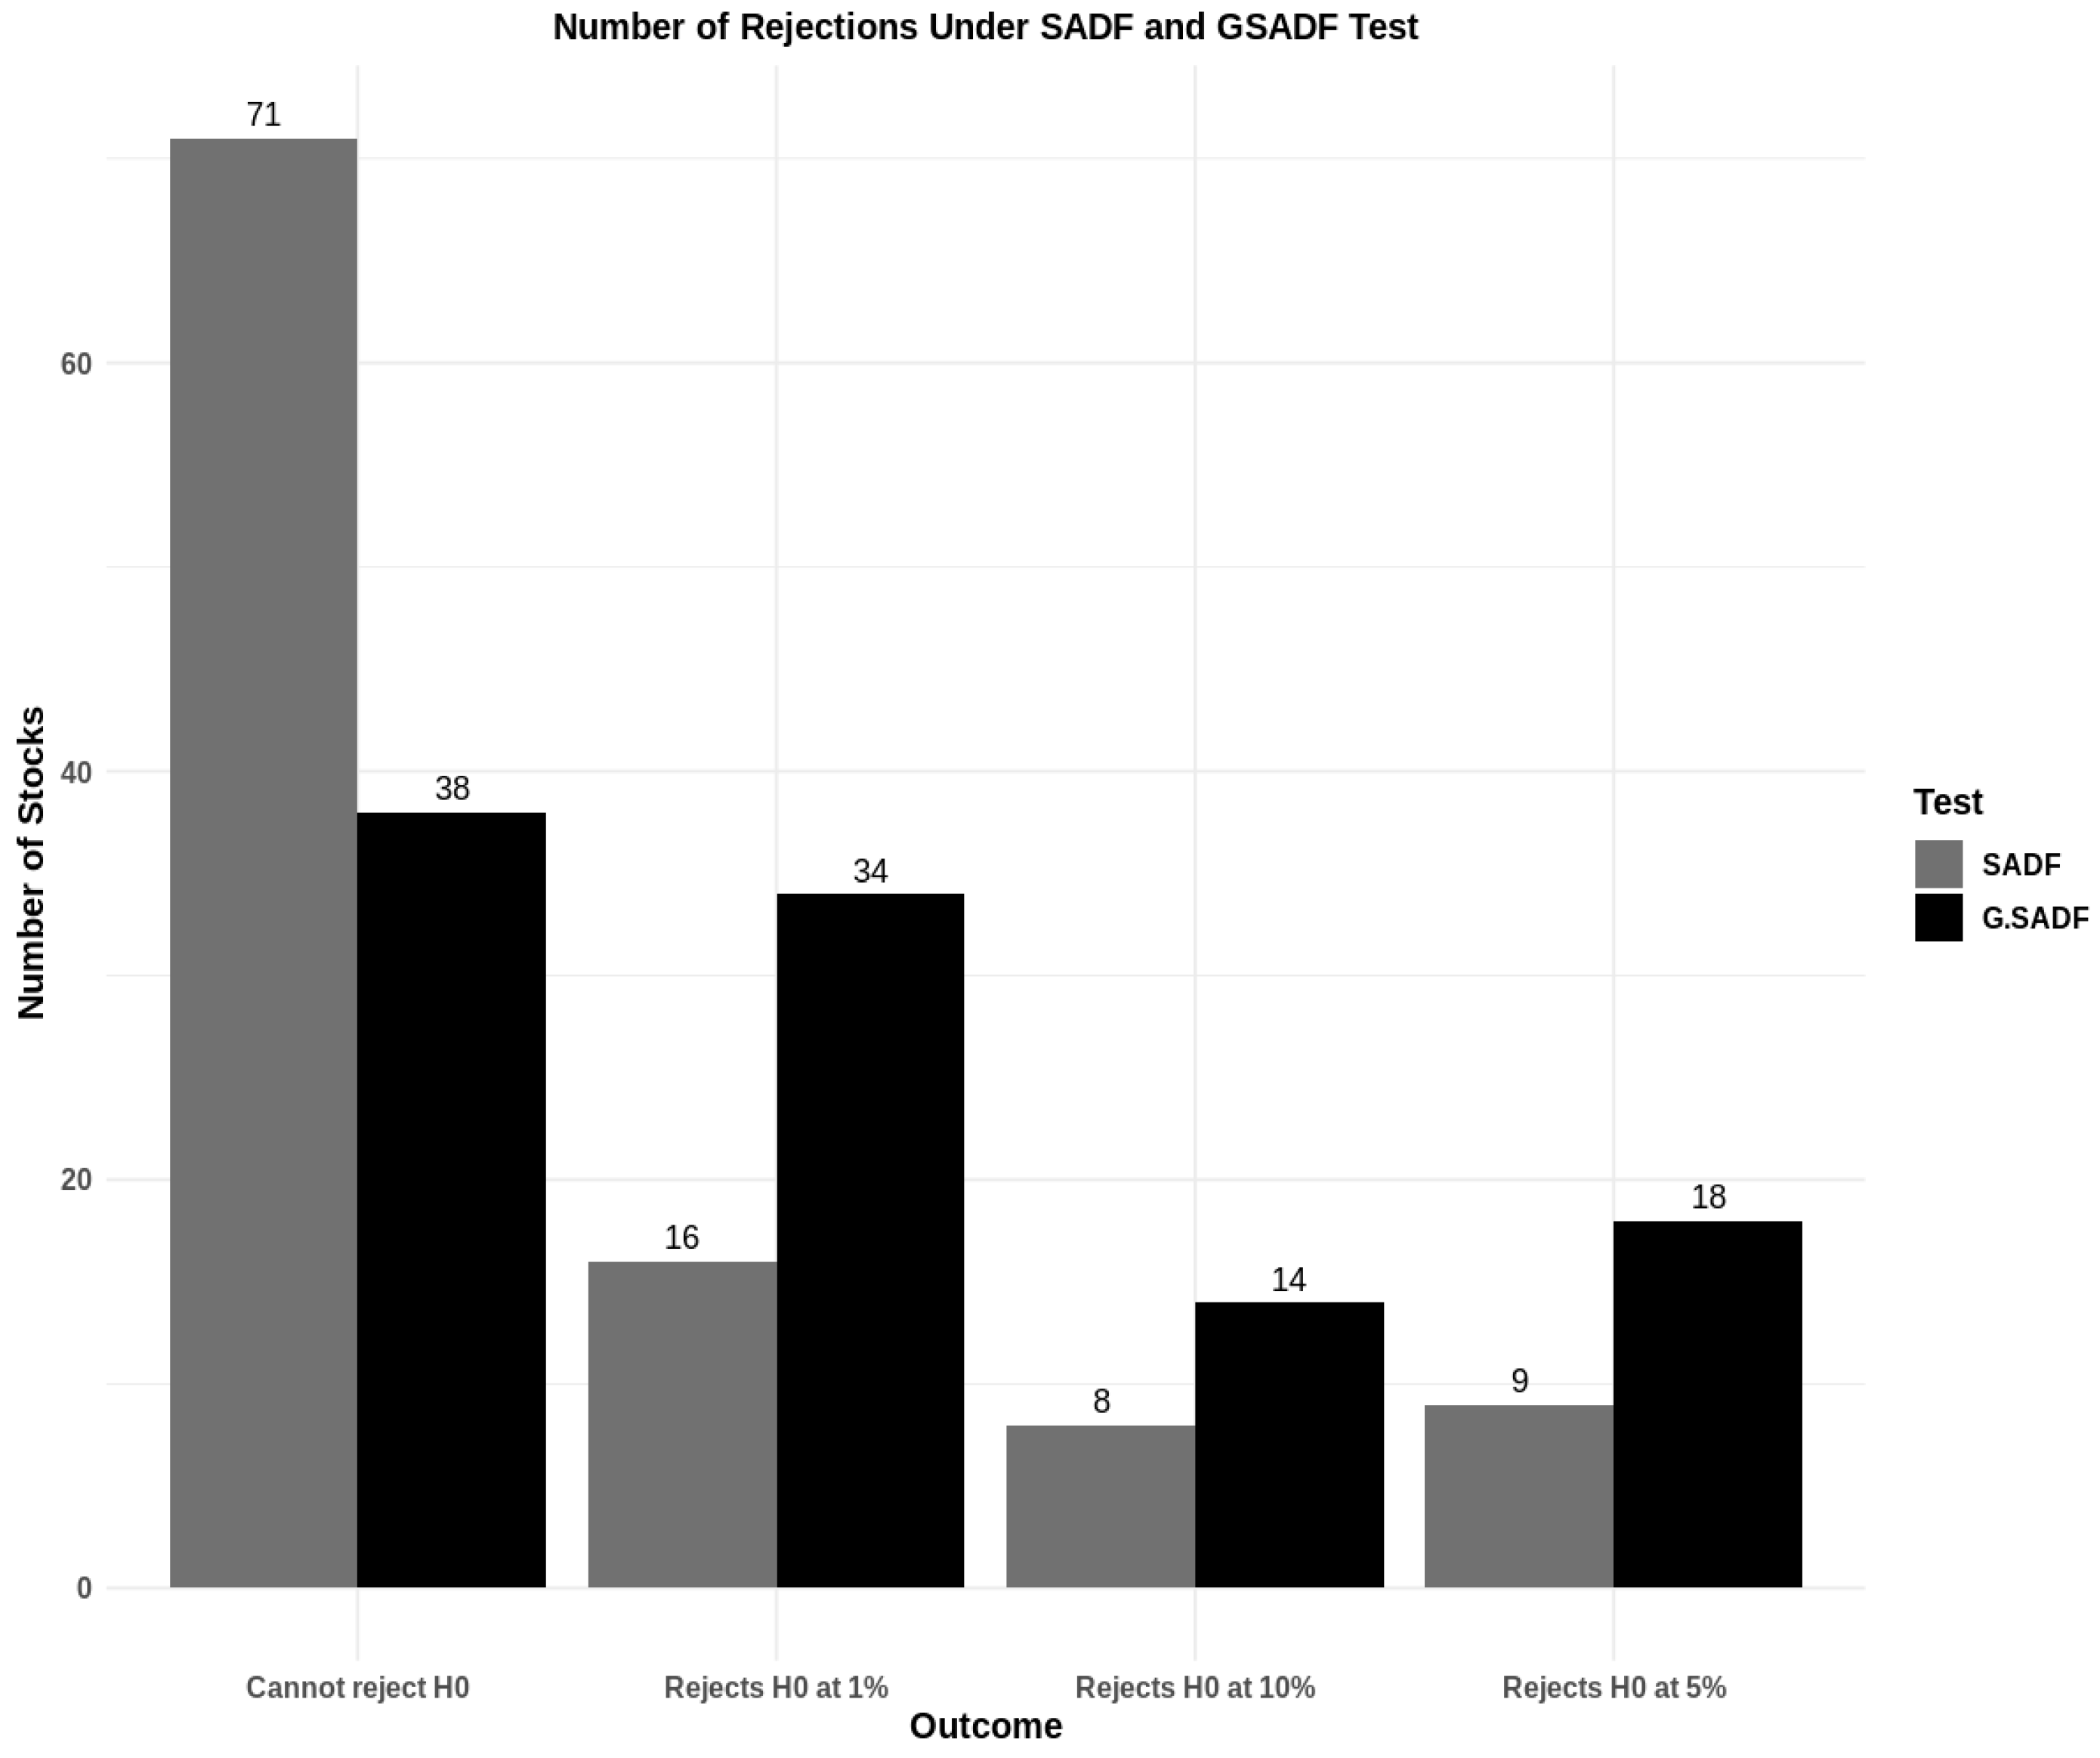
Figure 6.
QQ Plot of the Bubble Duration.
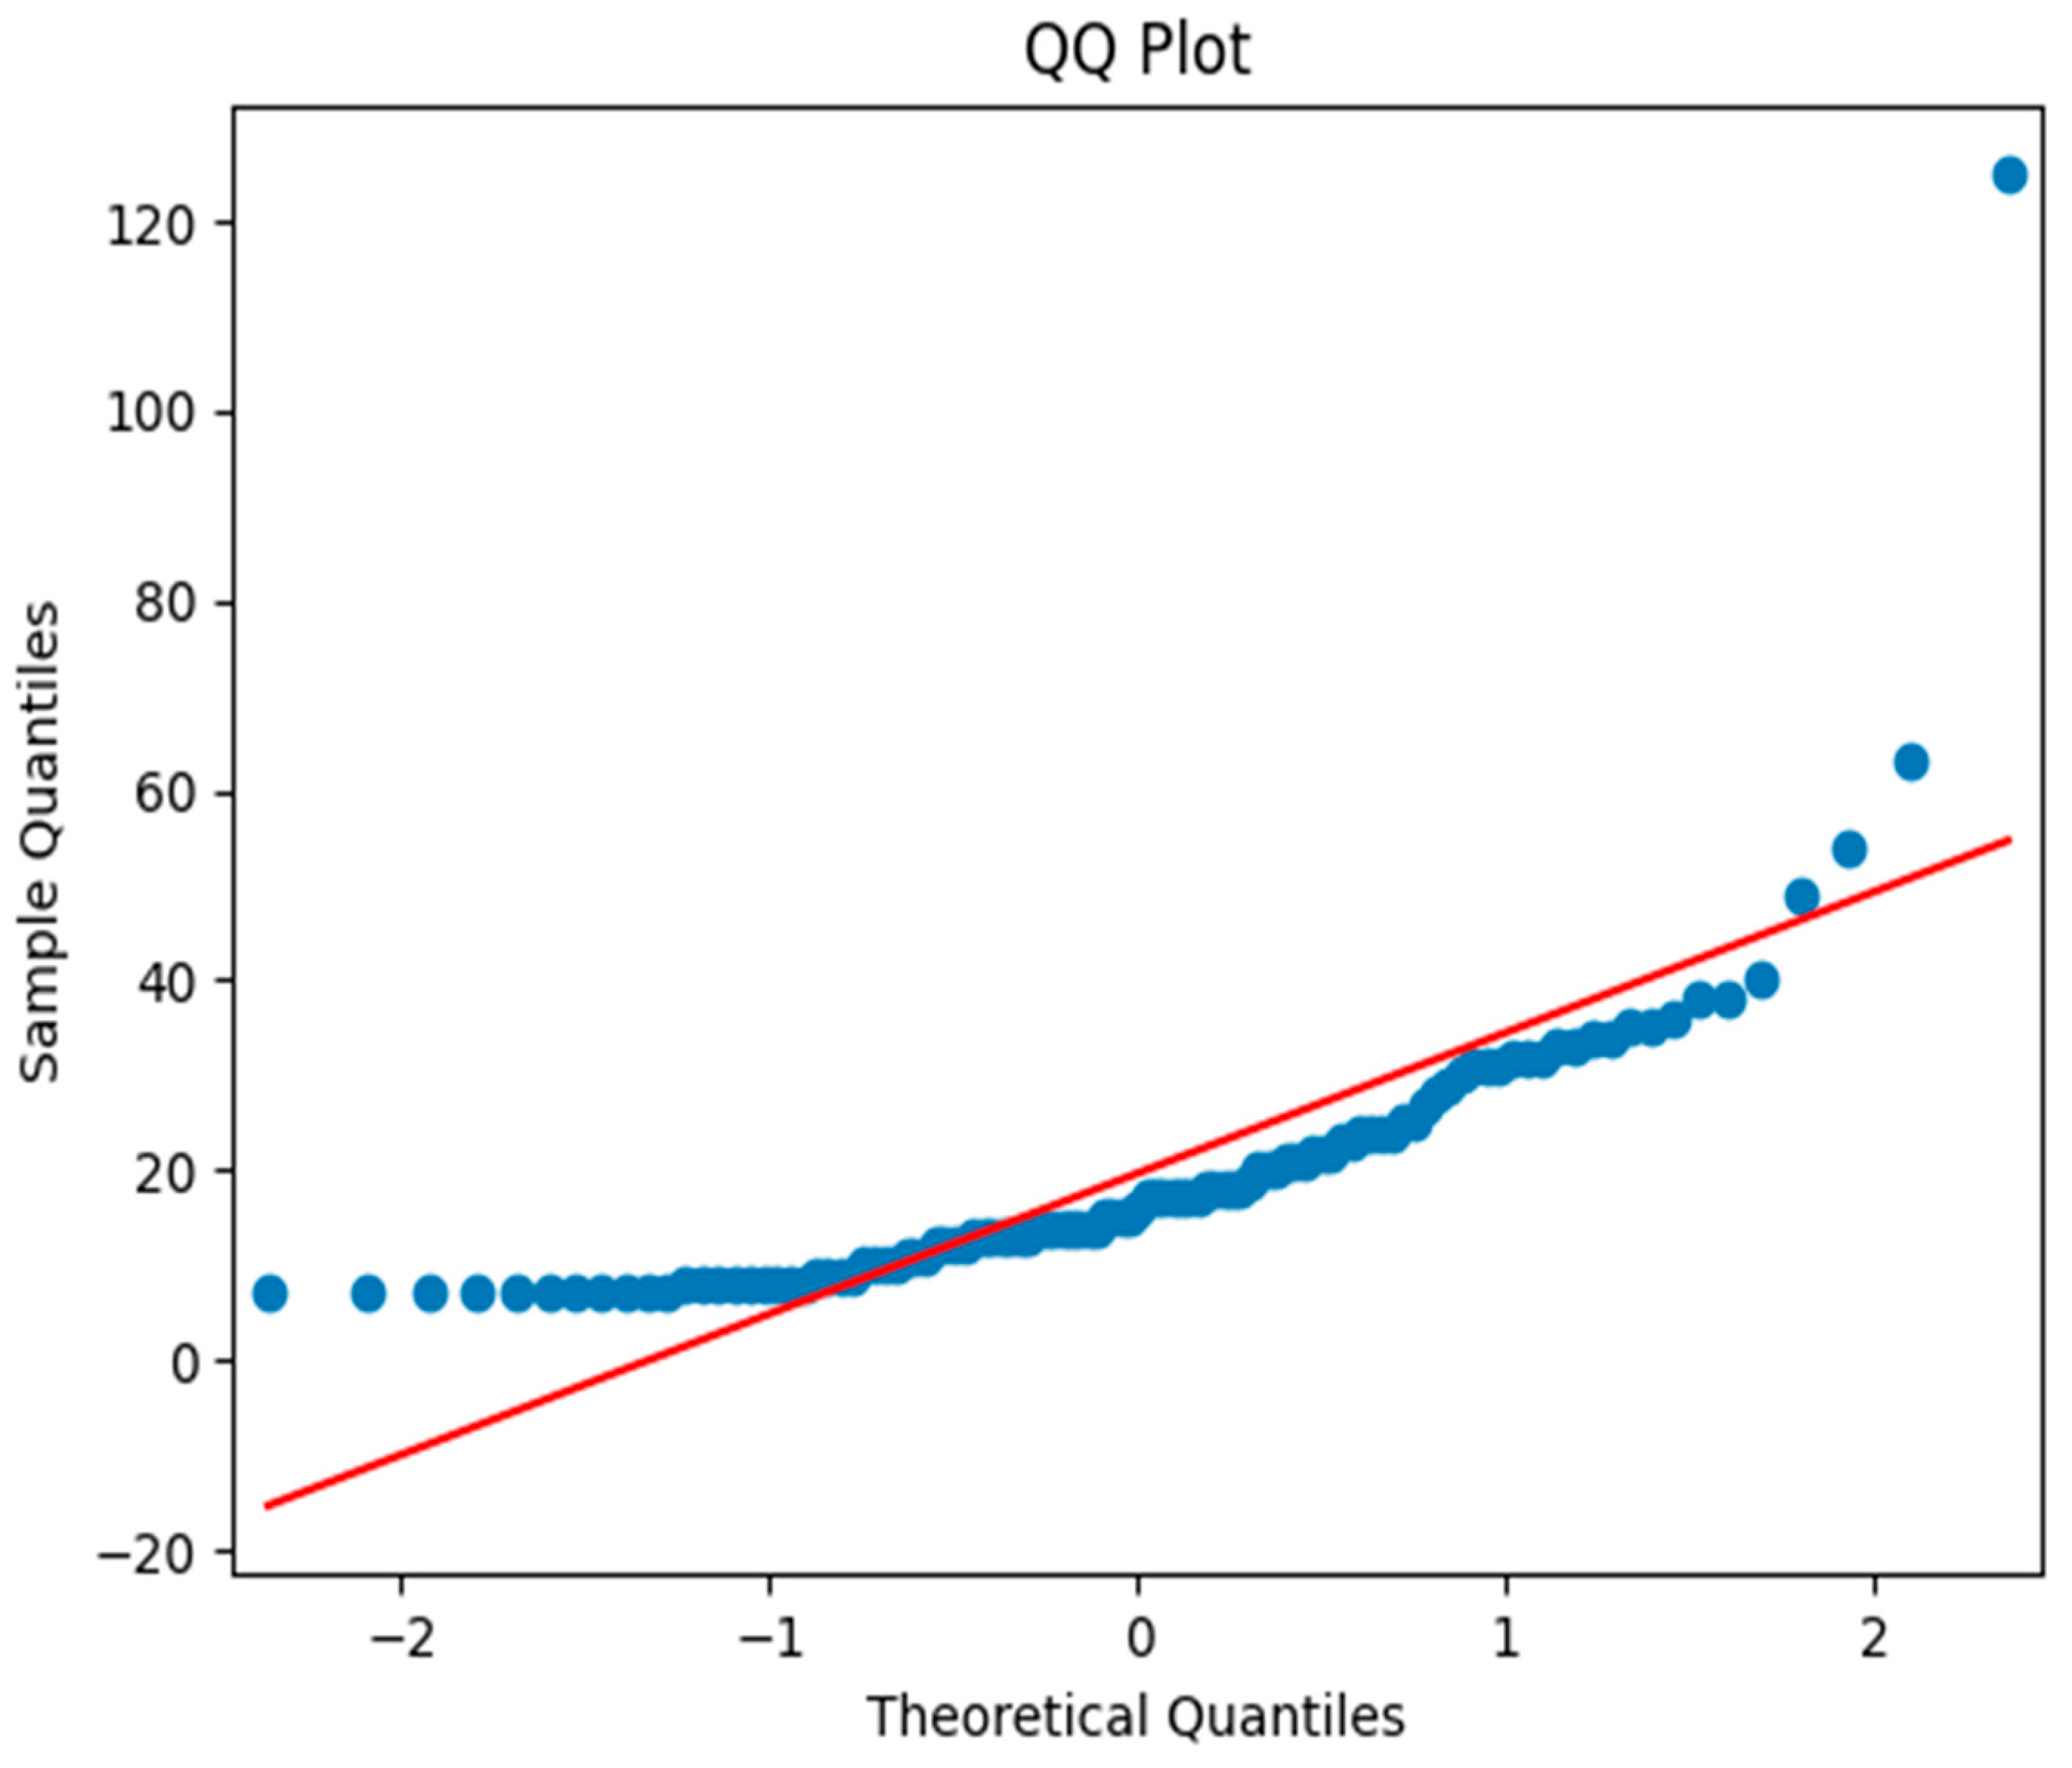
Table 2.
Number of Companies by Market Capital.
| Group | Number of Companies |
|---|---|
| Mega-cap companies | 20 |
| Large-cap companies | 82 |
| Mid-cap companies | 2 |
| Small-cap companies | 0 |
Table 3.
Top Ten Companies by Highest Growth.
| Stock | Minimum Price | Maximum Price | Highest Daily Jump (%) | Date Of Highest Change |
|---|---|---|---|---|
| PCG | 3.8 | 48.96 | 74.593 | 2019-01-23 |
| AAL | 9.04 | 56.989 | 41.097 | 2020-06-03 |
| CCL | 6.38 | 66.218 | 39.291 | 2020-11-06 |
| BBWI | 7.184 | 76.459 | 39.04 | 2020-03-23 |
| EQT | 4.835 | 49.957 | 37.32 | 2020-03-12 |
| OXY | 8.764 | 75.595 | 33.698 | 2020-06-04 |
| MGM | 7.133 | 50.35 | 33.115 | 2020-03-23 |
| HST | 8.7 | 20.426 | 30.029 | 2020-11-06 |
| FCX | 5.149 | 50.851 | 29.685 | 2020-03-23 |
| APA | 3.854 | 50.293 | 29.466 | 2020-03-23 |
Note. The data was collected by the author in May 2023.
Table 4.
Lowest Ten Companies by Lowest Growth.
| Stock | Minimum Price | Maximum Price | Highest Daily Jump (%) | Date Of Highest Daily Jump |
|---|---|---|---|---|
| MO | 24.18 | 52.071 | 10.022 | 2020-03-12 |
| T | 14.22 | 22.601 | 10.022 | 2020-03-12 |
| PM | 50.949 | 104.741 | 10.035 | 2020-03-12 |
| MDT | 67.067 | 128.55 | 10.189 | 2020-03-23 |
| GOOG | 48.811 | 150.709 | 10.449 | 2019-07-25 |
| PFE | 23.971 | 58.154 | 10.855 | 2021-11-04 |
| CVS | 46.248 | 107.334 | 10.899 | 2020-03-16 |
| ABT | 51.583 | 137.81 | 10.936 | 2020-03-23 |
| MDLZ | 33.605 | 69.985 | 11.281 | 2020-03-23 |
| IBM | 76.9 | 146.742 | 11.301 | 2020-03-23 |
Note. Author’s own calculation.
Disclaimer/Publisher’s Note: The statements, opinions and data contained in all publications are solely those of the individual author(s) and contributor(s) and not of MDPI and/or the editor(s). MDPI and/or the editor(s) disclaim responsibility for any injury to people or property resulting from any ideas, methods, instructions or products referred to in the content. |
© 2023 by the author. Licensee MDPI, Basel, Switzerland. This article is an open access article distributed under the terms and conditions of the Creative Commons Attribution (CC BY) license (https://creativecommons.org/licenses/by/4.0/).
Copyright: This open access article is published under a Creative Commons CC BY 4.0 license, which permit the free download, distribution, and reuse, provided that the author and preprint are cited in any reuse.


