
Submitted:
27 September 2023
Posted:
28 September 2023
You are already at the latest version
Abstract
Entangled metallic wire material (EMWM) can be utilized as a novel elastic element in vibration isolation devices for mechanical actuators. This paper presents a vibration experiment aimed at investigating the degradation behavior of mechanical performance in EMWM under cyclic compressive environment. An electric vibration testing system, coupled with an isolation structure, is employed to apply compressive loads to the EMWM specimens. Through visual observations and quasi-static compression tests, the variations in geometric morphology and mechanical properties are studied, considering different relative densities and stress amplitudes. The results incidate a significant reduction in the compressed dimension of the specimens as the number of cycles increases, without any wire fractures or wear. Moreover, the mechanical properties exhibit an increasing secant modulus and a decreasing loss factor. These variations ultimately lead to a gradual deviation of the vibration characteristics of the isolation structure from its design state. To predict the mechanical property degradation of EMWM, prediction models are proposed, incorporating dimension, modulus and damping by fitting the obtained results. This research provides valuable experimental data and presents an effective method to determine the operational lifetime of vibration isolators utilizing EMWM.
Keywords:
entangled metallic wire material
; vibration experiment
; cyclic compressive loads
; mechanical property degradation
; prediction model
1. Introduction
The external actuators of aerospace crafts and submersibles are subjected to continuous, severe fluid and mechanical excitations, where thinwalled components are prone to vibration fatigue failure [1,2]. To address this issue, it is common to design vibration isolation devices to reduce the stress and deformation of the actuators. In some demanding engineering vibration environments, traditional silicone rubber isolators exhibit drawbacks such as poor tolerance to high and low temperatures and susceptibility to aging [3]. Some researchers have developed elastic elements in isolators using entangled metallic wire material (EMWM) as a substitute for silicone rubber. Entangled metallic wire material is a functional porous material produced through winding, stretching, weaving, molding, and post-processing of metallic wires [4]. Within the material, numerous metallic wires interlock, connect, and mesh together, creating a significant volume of voids [5,6]. When subjected to loads, the metallic wires undergo bending deformation, resulting in compression and dry friction between the wires. This unique behavior imparts excellent elastic (Young's modulus between 0.1 to 50 MPa) and damping properties (loss factor between 12% and 26%) to EMWM [7,8,9] due to its relative density. With its notable advantages such as high and low-temperature resistance, corrosion resistance, radiation resistance, and the ability to tailor its mechanical properties through process parameters, EMWM offers a broader range of engineering applications compared to traditional rubber materials [10,11]. For instance, researchers have successfully utilized EMWM in areas such as vibration isolation and damping [2,12,13], energy absorption [14,15,16], sound absorption and noise reduction [17,18], and biomedical implants [19,20]. In these applications, EMWM is often employed as a replaceable component that requires periodic replacement [21]. However, the determination of EMWM's service lifetime lacks established design criteria, and currently, failure is typically recognized only when changes in its mechanical properties are observed through experiments [22].
To address the issues of damage, failure, and durability of EMWM in engineering applications, extensive research has been conducted [23,24]. For instance, under high-amplitude tensile and compressive cyclic loads, EMWM primarily experiences wire wear and fatigue failure, resulting in the generation of significant amounts of debris and broken wires observed after experiments. Scanning electron microscopy reveals evident abrasion marks and fracture surfaces on the internal surfaces of the metallic wires [25,26]. Under torsional loading, EMWM undergoes hardening, and the combined action of normal and shear stresses leads to 45-degree cracking in the specimens [27]. Under sustained static loads, the contact status of the internal metallic wires in EMWM undergoes changes, leading to alterations in macroscopic geometric dimensions and mechanical properties. If the strain values induced by the static load are small (less than 10% strain), EMWM does not experience mechanical failure [28].
The application of EMWM in the field of vibration isolation involves the design of various isolator configurations [29,30,31]. These isolators aim to significantly reduce vibration transmission rates by adjusting the natural frequency of the isolated system through the flexible support provided by elastic components. Due to the cold-press forming process, the tensile and shear strengths of EMWM are generally low, making it suitable for withstanding compressive cyclic loads [32,33]. Currently, the dynamic characteristics of EMWM isolators have been studied by many researchers [34,35,36]. However, there is limited literature on the degradation behavior of mechanical property and expected lifetime of EMWM.
This paper presents an investigation on the degradation behavior of mechanical properties in EMWM specimens under cyclic compressive loads using an electric vibration testing system. The specimens are mounted within a typical vibration isolaton structure, thereby allowing for an accurate replication of the vibration environment experienced during testing. The degradation behavior is analyzed based on dimension measures and quasi-static compression tests, and prediction models are developed. The organization of this paper comprises six sections. Section 1 is the introduction, providing an overview of the research. Section 2 briefly introduces the EMWM specimens employed in the experiment. Section 3 introduces the methods of vibration experiment and quasi-static compression test. Section 4 presents the experimental results and discussions, encompassing the variations in vibration characteristics of the isolation structure, geometries, secant modulus, and loss factor of the EMWM specimens. Section 5, prediction models for properties degradation, aimed at predicting operational lifetime, are presented. These models are developed through the fitting of experimental data. Section 6 concludes the paper, summarizing the degradation behavior of mechanical properties in EMWM under vibration environment.
2. Material and specimens
The metallic wires used in the production of EMWM were supplied by Anping Risheng Wire Mesh Ltd., in Hengshui, China. These wires are made of stainless steel, specifically the grade 0Cr18Ni9. The manufacturing process of EMWM specimens followed the procedures as illustrated in Figure 1. Initially, the metallic wires were tightly wound to form closely spaced helixes using a wire winding machine. Subsequently, the helixes were stretched into spiral coils according to the predetermined pitch parameter. These coils were then woven together manually to create a blank. Finally, the blank was cold-pressed into EMWM specimens of the desired shape using molds and a press machine.
To maintain the geometrical characteristics typically applied in vibration isolators, the EMWM specimens in the experiments were manufactured into a hollow cylindrical shape with an outer diameter of 37 mm, an inner diameter of 18 mm, and a height of 15 mm, as illustrated in Figure 2. These EMWM specimens were designed to be representative of the mechanical characteristics due to their nominal size being more than 10 times the helix diameter, as proposed in Reference [37]. The dimensions allow the specimens to accommodate a significant number of coiled wires and minimize the influence of boundary layers.
For the vibration experiment, the EMWM specimens were divided into two groups to investigate the influence of different relative densities and stress amplitudes on mechanical property degradation. The manufacturing parameters used for the EMWM specimens are presented in Table 1. A pair of specimens (labeled with pair number) was utilized in a single vibration experiment and three pairs of specimens were manufactured with the same set of parameters to minimize random errors. Group 1, consisting of specimens A1-3, B1-3, and C1-3, was employed to investigate the influence of relative density. Group 2, consisting of specimens B1-3, D1-3, and E1-3 with the same set of parameters, was used to investigate the influence of stress amplitude.
Relative density ρr is a critical design
parameter that significantly affects the mechanical properties of EMWM. It
quantifies the volume fraction of coiled wires within the entire specimen and
is defined by Equation (1). Some literature also uses the term “porosity”
to describe the porous characteristics of EMWM.
where, represents the actual density of EMWM. represents the density of the metallic wires material. and represent the mass and volume of the specimen, respectively. Stress amplitude , as described in the following Section 3.1, is a mechanical parameter utilized in the vibration experiment.
3. Experimental methods
3.1. Vibration experiment of the isolation structure
A vibration isolation structure was designed to replicate the working conditions of general isolators for subjecting the EMWM specimens to identical vibration environment, as illustrated in Figure 3a. A pair of EMWM specimens with the same parameter set were tested within the isolation structure. The components of the isolation structure, from top to bottom, included a mass block, threaded rod, upper plate, specimen 1, middle plate, specimen 2, lower plate, and base. The installation state of an EMWM specimen onto the threaded rod and plate is illustrated in Figure 3b. An auxiliary tool was used to align the central axis of the specimen with the threaded rod. During the installation process, the threaded rod and nut were tightened to achieve an initial compression deformation of the EMWM specimens, ensuring no loosening during the experiment. The initial deformation was set at 0.5 mm, controlled by the distance between the upper plate to the lower plate. The isolation structure maintained the EMWM specimens in a compressed state throughout the vibration experiment, consistent with the stress state in a general isolator. When the mass block induced a downward displacement relative to the threaded rod, the upper specimen (specimen 1) underwent compression. When the mass block induced an upward displacement, the lower specimen (specimen 2) underwent compression.
The vibration experiments were conducted using the DC-1000-15 /SV-0606 electric vibration testing system provided by Sushi Experimental Instrument Co., Ltd., Suzhou, China. The experimental setup for the vibration experiment is illustrated in Figure 4. The isolation structure was mounted on the vertical vibration platform using four bolts. Two accelerometers were employed to capture the vibration excitation signal and response signal of the isolation structure. Accelerometer 1 was attached to the vibration platform. Accelerometer 2 was attached to the top of the mass block. The platform generated vertical vibration, and the frequency and amplitude were controlled by a computer.
The isolation structure can be simplified as a single-degree-of-freedom vibration system, as illustrated in Figure 5a. The compression cycles in the vibration experiment were carried out using a stress-controlling method, with the compressive force exerted on the EMWM specimens was calculated as follows:
where, represents the mass of the
mass block. and represent the acceleration of the vibration platform and the mass block, respectively, as measured by the accelerometers. The stress amplitude was calculated using the following equation:
where, represents the compressive stress during the loading
cycles. represents the
cross-sectional area of the EMWM specimen. As specimen 1 and 2 were exclusively
designed to endure compressive forces in both the initial and operational
states, the EMWM specimens underwent semi-sinusoidal compression cycles, as
illustrated in Figure 5b.
Before the vibration experiment on the EMWM specimens, the frequency-response characteristics curve of the isolation structure was measured using accelerometers, as illustrated in Figure 6. The resonance frequencies for EMWM specimens with relative density of 0.10, 0.20, and 0.25 were determined to be 32 Hz, 42 Hz, and 48 Hz, respectively. In the vibration experiment, semi-sinusoidal compression cycles were applied to the EMWM specimens at the resonance region to accelerate the pace of the experiment. Three levels of excitation amplitude were applied to the isolation structure by controlling the electric vibration testing system. The compressive stress amplitudes of 0.3 MPa, 0.7 Mpa, and 1.0 Mpa were calculated using Equation (2) and (3). After a specified number of compression cycles, the isolation structure was disassembled. The dimensions of the EMWM specimes were then measured using a vernier caliper. The measurement of the mechanical properties, including secant modulus and loss factor, was conducted using quasi-static tests. The measurements of dimensions and mechanical properties were taken at intervals of compression cycles during the vibration experiment, until a total of cycles.
3.2. Quasi-static compression test
The quasi-static compression tests were conducted using the WDW3100 microcomputer-controlled electronic universal testing machine provided by Changchun Kexin Experimental Instrument Co., Ltd., Changchun, China. The experimental setup consisted of a force sensor, dial gauge, pressure plate and base, as illustrated in Figure 7. Prior to and following the vibration experiments of the isolation structure, quasi-static compression tests were performed with a maximum compressive force of 100 N to evaluate the variations in modulus and damping after a specified number of cyclic loads.
At low compressive forces (e.g., 100 N, as employed in this work), the compression strain is small and the stress-strain relationship of EMWM remains in the linear phase. The elastic property of EMWM is described using the secant modulus , which is defined as follows:
where, represents the stress variation. represents the strain variation. represents the maximum compressive force. represents the cross-sectional area of the specimen. represents the maximum compression deformation. represents the initial height of the specimen.
Due to the friction and irreversible deformation between the internal metallic wires, the stress-strain curves during loading and unloading of EMWM do not coincide, resulting in a hysteresis loop, as illustrated in Figure 8.
The damping property of a dynamic system with energy dissipation can be quantified using the loss factor , defined by Equation (5). It represents the damping performance of EMWM.
where, represents the dissipated energy, illustrated as the area
enclosed by the loading and unloading curves (red shaded region in Figure 8). U represents the maximum
elastic potential energy, illustrated as the projected area of the midline of
the loading and unloading curves (blue shaded region in Figure 8). π represents the mathematical
constant “Pi”. Since a pair of EMWM specimens were tested simultaneously in
each vibration experiment, the final results of secant modulus and loss factor
were averaged from the two specimens.
4. Results and discussion
4.1. Vibration characteristics of isolation structure
After a certain number of compression cycles, the resonant frequency and transmission rate at resonance of the isolation structure were measured through frequency sweep experiments. The transmission rate was calculated using the acceleration parameters illustrated in Figure 5a, according to the following equation:
where, and represent the acceleration
of the vibration platform and the mass block, respectively. The results
indicate that the resonant frequency and transmission rate of the isolation
structure decrease with an increasing number of compression cycles. These observations
are illustrated in Figure 9 and Figure 10,
respectively. It is noteworthy that EMWM specimens with lower relative density
exhibit a more rapid deviation of the isolation structure from its designed
mechanical performance, consequently shortening the operational lifetime.
4.2. Geometries and dimensions
Following the completion of compression cycles, the EMWM specimens were extracted from the isolation structure to visually inspect their geometric and morphological features. The appearance of the EMWM specimens with different relative densities, after 107 compression cycles, are shown in Figure 11. The specimens retained their cylindrical shape, with minimal alterations in cross-sectional dimensions. No fractures or significant wear of the metallic wires were observed on the surface of the EMWM specimens. However, a noticeable decrease in height along the compression direction was evident, accompanied by the occurrence of gaps within the isolation structure. This finding indicates that the vibration environment induces irreversible deformation in the compression direction of EMWM specimens.
Additionally, computed tomography (CT) scanning was performed on the specimens to generate a three-dimensional structure, as shown in Figure 12. The continuity of the metallic wires within the EMWM specimens was confirmed using the search algorithm described in Reference [38], and no wire fractures were detected. This finding suggests that the the primary failure mode of the EMWM was irreversible deformation in the compression direction rather than fracture, fatigue or wear of the metallic wires.
The influence of relative density and stress amplitude on the variation in specimen height is illustrated in Figure 13. It is evident that increasing the relative density leads to a decrease in height deformation, while increasing the stress amplitude results in an increase in specimen height reduction.
To facilitate the normalized description of the height variation in EMWM specimens, the height variation rate is defined as follows:
where, represents the initial height of the EMWM specimen. represents the height after compression cycles. The height variation rates for different relative densities and stress amplitudes are illustrated in Figure 14. The shape of these curves can be approximated as a bilinear function. Initially, the height variation rate exhibits a rapid increase with the number of compression cycles until it reaches a specific threshold value. Subsequently, the rate of increase in the height variation rate significantly slows down or remains nearly constant.
4.3. Quasi-static mechanical properties
Following the dimensional measurements, the quasi-static compression tests were conducted to determine the mechanical properties of the EMWM specimens, including the secant modulus and loss factor. The influence of relative density and compressive stress amplitude was also investigated.
4.3.1. Secant modulus
The secant modulus of the EMWM specimens, tested under a compressive force of 100 N, after a specified number of compression cycles is presented in Figure 15. The results indicate a significant increase in the secant modulus with an increasing number of compression cycles. However, once the cycle number reaches a threshold value of approximately , the secant modulus stabilizes at a relatively constant level. It is noteworthy that the EMWM specimens with different relative densities exhibit different initial secant modulus values. However, after undergoing a sufficient number of compression cycles, their secant modulus converge and become nearly equal. Furthermore, when subjected to higher compressive stress amplitudes, both the stabilizated secant modulus and its rate of change during the initial stage exhibit larger values.
Considering the differences in initial secant modulus, the variation of the secant modulus in EMWM specimens can be described using a normalized approach. The modulus variation rate is defined as follows:
where, represents the initial secant modulus of the EMWM specimen. represents the secant modulus after compression cycles. The modulus variation rates for different relative densities and stress amplitudes are presented in Figure 16. Compared to Figure 15a, the values of stabilized modulus variation rate in Figure 16a exhibit varying levels for the EMWM specimens with different relative densities. Additionally, an approximate bilinear function can also be observed from these figures.
4.3.2. Loss factor
The loss factors of EMWM specimens after a specified number of compression cycles are presented in Figure 17. The results indicate a significant decrease in the loss factor with an increasing number of compression cycles. However, once the cycle number reaches a threshold value of approximately , the rate of decrease slows down and eventually stabilizing within a range of 0.13-0.18. It is noteworthy that the EMWM specimens with higher relative density exhibit lower initial and stabilized loss factor. Furthermore, when subjected to higher compressive stress amplitudes, the loss factor decreases at a faster rate and reaches a smaller value after stabilization.
Similar to the secant modulus, the variation of the loss factor in EMWM specimens can be described using a normalized approach. The damping variation rate is defined as follows:
where, represents the initial loss factor of the EMWM specimen. represents the loss factor after compression cycles. The damping variation rates for different relative densities and stress amplitudes are presented in Figure 18. The increase speed of damping variation rate gradually decreases with the number of compression cycles, resulting in an approximate polynomial function shape of the curves.
5. Prediction models of properties degradation
For the design of vibration isolators, resonance frequency and transmission rate are critical dynamic parameters. If the deviation from their design values exceeds a certain threshold, the vibration isolator will fail. The experimental results in Section 4 demonstrate that the dimensions in the compression direction, secant modulus, and loss factor of EMWM undergo changes with the number of compression cycles. These changes can lead to gaps between components. Even after reassembly, the increased modulus can cause the natural frequency to deviate from the design frequency. The decrease in the loss factor can also result in increased vibration amplitudes of the isolated equipment. Therefore, monitoring the operational lifetime of EMWM is crucial when using it as an elastic element in vibration isolators. In this section, we present prediction models including dimension, modulus, and damping for the degradation of EMWM properties under compressive vibration environments. These models utilize the variation rates of the properties obtained from the vibration experiments and fit them to mathematical formulas.
5.1. Dimension prediction model
The experimental results present in Figure 14 incidate that the curves of height variation rate exhibit an approximately linear segment and a plateau segment with an increasing number of compression cycles. These observations can be effectively described by employing a bilinear mathematical model to predict the height of EMWM specimens. A threshold value is introduced as the pivotal point, with the corresponding number of compression cycles being approximately . Hence, the fundamental expression of the dimension prediction model can be formulated as follows:
where, represents the height variation rate of the specimen. represents the number of compression cycles. represents the slope of the linear segment. represents the threshold value. represents the number of compression cycles of the threshold value, close to .
When , a linear fitting method is employed to fit the experimental data of height variation rates. The slopes corresponding to different combinations of relative density and stress amplitude are obtained, as present in Table 2.
These data points are used to establish a functional expression for the slope . Based on the trends, we assume that the slope has a power function relationship with relative density and stress amplitude , expressed as follows:
where, , and are all fitting coefficients. The values of these fitting coefficients are obtained through the least squares fitting method, resulting in:
The threshold value can be calculated by averaging the height variation rates above compression cycles, as present in Table 3.
These data points are used to establish a functional expression for the threshold value . Based on the trends, we assume that the threshold value has a power function relationship with relative density and stress amplitude , expressed as follows:
where, , and are all fitting coefficients. The values of these fitting coefficients are obtained through the least squares fitting method, resulting in:
By combining Equation (10), (12) and (14), we obtain the final dimension prediction model for EMWM specimens:
where, the unit of is . The unit of is MPa.
The comparison between experimental and fitting results for different relative densities and stress amplitudes is shown in Figure 19. It indicates that the model curves match well with the experimental results, demonstrating that the dimension prediction model can accurately predict the height variation of EMWM under vibration environment.
5.2. Modulus prediction model
The experimental results present in Figure 16 indicate that the trend of secant modulus variation is similar to that of height. Therefore, the same bilinear mathematical model is used to formulate the modulus prediction model. The fundamental expression is as follows:
where, represents the modulus variation rate of the specimen. represents the number of compression cycles. represents the slope of the linear segment. represents the threshold value. represents the number of compression cycles of the threshold value, close to .
When , a linear fitting method is employed to fit the experimental data of modulus variation rate. The slopes corresponding to different combinations of relative density and stress amplitude are obtained, as present in Table 4.
These data points are used to establish a functional expression for the slope . Based on the trends, we assume that the slope has a power function relationship with relative density and stress amplitude , expressed as follows:
where, , and are all fitting coefficients. The values of these fitting coefficients are obtained through the least squares fitting method, resulting in:
The threshold value can be calculated by averaging the modulus variation rates above compression cycles, as present in Table 5.
These data points are used to establish a functional expression for the threshold value . Based on the trends, we assume that the threshold value has a power function relationship with relative density and stress amplitude , expressed as follows:
where, , and are all fitting coefficients. The values of these fitting coefficients are obtained through the least squares fitting method, resulting in:
By combining Equation (16), (18) and (20), we obtain the final dimension prediction model for EMWM specimens:
where, the unit of is . The unit of is MPa.
The comparison between experimental and fitting results for different relative densities and stress amplitudes is shown in Figure 20. It indicates that the model curves match well with the experimental results, demonstrating that the modulus prediction model can accurately predict the secant modulus variation of EMWM under vibration environment.
5.3. Damping prediction model
The experimental results shown in Figure 18 incidate that the curves of damping variation rate exhibit the charactistics of exponential characteristics with an increasing number of compression cycles. These observations can be effectively described by employing a exponential function model to predict the damping of EMWM specimens. Hence, the fundamental expression of the damping prediction model can be formulated as follows:
where, represents the damping variation rate of the specimen. represents the number of compression cycles. and represent the fitting coefficients. The fitting coefficient and corresponding to different combinations of relative density and stress amplitude are obtained, as present in Table 6.
These data points and are used to establish a functional expression for the fitting coefficients and . Based on the trends, we assume that the fitting coefficients and have a power function relationship with relative density and stress amplitude , expressed as follows:
where, , and are fitting coefficients for . , and are fitting coefficients for . The values of these fitting coefficients are obtained through the least squares fitting method, resulting in:
By combining Equation (22), (25) and (26), we obtain the final damping prediction model for EMWM specimens:
where, the unit of is . The unit of is MPa.
The comparison between experimental and fitting results for different relative densities and stress amplitudes is shown in Figure 21. It indicates that the model curves match well with the experimental results, demonstrating that the damping prediction model can accurately predict the loss factor variation of EMWM under vibration environment.
6. Conclusions
This paper focuses on investigating the degradation behavior of mechanical properties in entangled metallic wire materials (EMWM) under compressive vibration environment. A series of experiments were conducted using pairs of EMWM specimens installed in a vibration isolation structure, subjected to cyclic compression. The vibration characteristics of isolation structure is studied by spectral analysis. The geometric and morphological features of EMWM are examined by visual inspection and CT scanning. The mechanical properties of EMWM are examined by quasi-static compression tests. The main findings and conclusions of this work are listed as follows:
(1) The resonant frequency and transmission rate of the isolation structure showed a clear decrease as the number of compression cycles increased. The mechanical property degradation of EMWM resulted in a deviation from the intended performance of vibration isolators.
(2) The dimension in the compressed direction of EMWM experienced a noticeable decrease and stabilized when the cycle number reached a certain threshold, approximately . No wire fractures or significant wear were observed on the surface or inside the specimens. The reduction in dimension may be attributed to changes in the contact status and slight slipping between the internal wires.
(3) The secant modulus exhibited a significant increase, while the loss factor decreased as the number of compression cycles increased. Once the cycle number reaches a threshold value of approximately , these parameters stabilized at relatively constant values. The values of these properties were influenced by the relative density and stress amplitude.
(4) Prediction models for properties degradation, including the dimension, modulus, and damping, were developed based on fitting the experimental data. These models can accurately predict the variation of mechanical properties in EMWM specimens under vibration environment. They provide valuable insights for designing vibration isolators with EMWM and determining their operational lifetime.
Author Contributions
Conceptualization and methodology, Y.M.; methodology, formal analysis, validation and writing—original draft preparation, T.L.; writing—review and editing, Y.W.; software, investigation, formal analysis and data curation, Z.W.; supervision, project administration and funding acquisition, J.H. All authors have read and agreed to the published version of the manuscript.
Funding
This research was funded by the National Natural Science Foundation of China, grant numbers: 52175072 and 52075018.
Institutional Review Board Statement
Not applicable.
Informed Consent Statement
Not applicable.
Data Availability Statement
The data presented in this study are available on request from the corresponding author. The data are not publicly available due to privacy.
Conflicts of Interest
The authors declare no conflict of interest. The funders had no role in the design of the study.
Declaration of generative AI and AI-assisted technologies in the writing process
During the preparation of this work the authors used ChatGPT 3.5 in order to improve language and readability. After using this tool, the authors reviewed and edited the content as needed and take full responsibility for the content of the publication.
References
- Guo, H.; Yan, Y.; Xia, H.; Yu, L.; Lv, B., The Prediction and Correction Method of Aircraft Static Aeroelastic Effects: A Review of Recent Progress. Actuators 2022, 11, (11). [CrossRef]
- Cao, X.; Wei, C.; Liang, J.; Wang, L., Design and dynamic analysis of metal rubber isolators between satellite and carrier rocket system. Mechanical Sciences 2019, 10, (1), 71-78. [CrossRef]
- Fu, J.; Liu, G.; Fan, C.; Liu, Z.; Luo, H., Design and Experimental Study on Vibration Reduction of an UAV Lidar Using Rubber Material. Actuators 2022, 11, (12). [CrossRef]
- Zhang, D. X., Ying; Zhang, Qicheng; Ma, Yanhong; Hong, Jie, Researches on metal rubber mechanics properties in retrospect and prospect. Journal of Aerospace Power 2018, 33, (6), 1432-1445.
- Rodney, D.; Gadot, B.; Martinez, O. R.; du Roscoat, S. R.; Orgeas, L., Reversible dilatancy in entangled single-wire materials. Nat Mater 2016, 15, (1), 72-7. [CrossRef]
- Ma, Y. Z., Qicheng; Wang, Yongfeng; Hong, Jie; Scarpa, Fabrizio, Topology and mechanics of metal rubber via X-ray tomography. Materials & Design 2019, (181), 108067.
- Fengli, C.; Hongbai, B.; Dongwei, L.; Guoquan, R.; Guozhang, L., A Constitutive Model of Metal Rubber for Hysteresis Characteristics Based on a Meso-Mechanical Method. Rare Metal Materials and Engineering 2016, 45, (1), 1-6. [CrossRef]
- Ma, Y.; Zhang, Q.; Zhang, D.; Scarpa, F.; Liu, B.; Hong, J., The mechanics of shape memory alloy metal rubber. Acta Materialia 2015, 96, 89-100. [CrossRef]
- Zhang, D.; Scarpa, F.; Ma, Y.; Hong, J.; Mahadik, Y., Dynamic mechanical behavior of nickel-based superalloy metal rubber. Materials & Design (1980-2015) 2014, 56, 69-77. [CrossRef]
- Hu, J.; Du, Q.; Gao, J.; Kang, J.; Guo, B., Compressive mechanical behavior of multiple wire metal rubber. Materials & Design 2018, 140, 231-240. [CrossRef]
- Zhang, D.; Scarpa, F.; Ma, Y.; Boba, K.; Hong, J.; Lu, H., Compression mechanics of nickel-based superalloy metal rubber. Materials Science and Engineering: A 2013, 580, 305-312. [CrossRef]
- Ma, Y.; Zhang, Q.; Zhang, D.; Scarpa, F.; Liu, B.; Hong, J., Tuning the vibration of a rotor with shape memory alloy metal rubber supports. Journal of Sound and Vibration 2015, 351, 1-16. [CrossRef]
- Ma, Y.; Zhang, Q.; Zhang, D.; Scarpa, F.; Liu, B.; Hong, J., A novel smart rotor support with shape memory alloy metal rubber for high temperatures and variable amplitude vibrations. Smart Materials and Structures 2014, 23, (12). [CrossRef]
- Wu, Y.; Jiang, L.; Bai, H.; Lu, C.; Li, S., Mechanical Behavior of Entangled Metallic Wire Materials under Quasi-Static and Impact Loading. Materials (Basel) 2019, 12, (20). [CrossRef]
- Wu, Y.-W.; Tang, Y.; Li, S.-Z.; Cheng, H.; Chen, X.-C.; Bai, H.-B., Experimental study on the mechanical properties and impact behaviors of entangled metallic wire material under repeated low-velocity impacts. Mechanics of Advanced Materials and Structures 2022, 30, (12), 2506-2516. [CrossRef]
- Kashani, M. M.; Ahmadi, E.; Gonzalez-Buelga, A.; Zhang, D.; Scarpa, F., Layered composite entangled wire materials blocks as pre-tensioned vertebral rocking columns. Composite Structures 2019, 214, 153-163. [CrossRef]
- Bai, H. Z., Zhiqiang; Ren, Zhiying, Progress and prospect of acoustic properties of metal rubber. Journal of Vibration and Shock 2020, 39, (23).
- Ma, Y.; Liang, T.; Wang, Y.; Zhang, Q.; Hong, J., Experimental Investigation of Wave Propagation Characteristics in Entangled Metallic Wire Materials by Acoustic Emission. Materials (Basel) 2023, 16, (13). [CrossRef]
- He, G.; Liu, P.; Tan, Q., Porous titanium materials with entangled wire structure for load-bearing biomedical applications. J Mech Behav Biomed Mater 2012, 5, (1), 16-31. [CrossRef]
- Wang, Q.; Qiao, Y.; Cheng, M.; Jiang, G.; He, G.; Chen, Y.; Zhang, X.; Liu, X., Tantalum implanted entangled porous titanium promotes surface osseointegration and bone ingrowth. Sci Rep 2016, 6, 26248. [CrossRef]
- Tang, N.; Rongong, J. A., Feasibility study on the use of tangled metal wire particles as the adjustable elements in tuned mass dampers. Journal of Sound and Vibration 2019, 457, 1-14. [CrossRef]
- Zhang, B.; Lang, Z. Q.; Billings, S. A.; Tomlinson, G. R.; Rongong, J. A., System identification methods for metal rubber devices. Mechanical Systems and Signal Processing 2013, 39, (1-2), 207-226. [CrossRef]
- Zhao, Y.; Yan, H.; Wang, Y.; Jiang, T.; Jiang, H., Predicting Nonlinear and Anisotropic Mechanics of Metal Rubber Using a Combination of Constitutive Modeling, Machine Learning, and Finite Element Analysis. Materials (Basel) 2021, 14, (18). [CrossRef]
- Gadot, B.; Riu Martinez, O.; Rolland du Roscoat, S.; Bouvard, D.; Rodney, D.; Orgéas, L., Entangled single-wire NiTi material: A porous metal with tunable superelastic and shape memory properties. Acta Materialia 2015, 96, 311-323. [CrossRef]
- Yang, P.; Bai, H.; Xue, X.; Xiao, K.; Zhao, X., Vibration reliability characterization and damping capability of annular periodic metal rubber in the non-molding direction. Mechanical Systems and Signal Processing 2019, 132, 622-639. [CrossRef]
- Li, H.; Ren, Z.; Huang, J.; Zhong, S., Fretting wear evolution model of the metal filaments inside metal rubber. Wear 2022, 506-507. [CrossRef]
- Liu, P.; He, G.; Wu, L., Structure deformation and failure of sintered steel wire mesh under torsion loading. Materials & Design 2009, 30, (6), 2264-2268. [CrossRef]
- Ma, Y. Z., Qicheng; Zhang, Dayi; Zhu, Haixiong; Lu, Hongwei; Hong, Jie, Failure criterion and durability characteristics ofmetal rubber under static compression load. Journal of Beijing University of Aeronautics and Astronautics 2016, 42, (2), 227-235.
- Zhang, Q.; Zhang, D.; Dobah, Y.; Scarpa, F.; Fraternali, F.; Skelton, R. E., Tensegrity cell mechanical metamaterial with metal rubber. Applied Physics Letters 2018, 113, (3). [CrossRef]
- Ma, Y.; Tang, X.; Wang, Y.; Hong, J., Design of nonlinear metal rubber isolator subjected to random vibration. Mechanical Systems and Signal Processing 2023, 197. [CrossRef]
- Mezghani, F.; Del Rincon, A. F.; Ben Souf, M. A.; Fernandez, P. G.; Chaari, F.; Rueda, F. V.; Haddar, M., Experimental Investigation on the Influence of Relative Density on the Compressive Behaviour of Metal Mesh Isolator. In Design and Modeling of Mechanical Systems—III, 2018; pp 941-947.
- Xue, X.; Wei, Y.; Wu, F.; Bai, H.; Lu, C.; Liao, J., Fabrication technology and shear failure behaviours of elastic–porous sandwich structure with entangled metallic wire mesh. Thin-Walled Structures 2022, 170. [CrossRef]
- Wei, Y.; Wu, R.; Zou, L.; Liu, N.; Xue, X., Vacuum Brazing Effect on the Interlayer Failure Behaviors of Elastic-Porous Sandwich Structure with Entangled Metallic Wire Mesh. Symmetry 2022, 14, (5). [CrossRef]
- Zheng, X.; Wang, W.; Wu, Y.; Bai, H., Study of the Dynamic Model and Vibration Performance of Pot-Shaped Metal Rubber. Materials (Basel) 2022, 15, (17). [CrossRef]
- Xiao, K.; Bai, H.; Xue, X.; Wu, Y., Damping Characteristics of Metal Rubber in the Pipeline Coating System. Shock and Vibration 2018, 2018, 1-11. [CrossRef]
- Wu, K.; Bai, H.; Xue, X.; Li, T.; Li, M., Energy Dissipation Characteristics and Dynamic Modeling of the Coated Damping Structure for Metal Rubber of Bellows. Metals 2018, 8, (7). [CrossRef]
- Ma, Y.; Zhang, Q.; Zhang, D.; Scarpa, F.; Gao, D.; Hong, J., Size-dependent mechanical behavior and boundary layer effects in entangled metallic wire material systems. Journal of Materials Science 2016, 52, (7), 3741-3756. [CrossRef]
- Ren, Z.; Shen, L.; Huang, Z.; Bai, H.; Shen, D.; Shao, Y., Study on Multi-Point Random Contact Characteristics of Metal Rubber Spiral Mesh Structure. IEEE Access 2019, 7, 132694-132710. [CrossRef]
Figure 1.
The manufacturing procedures of EMWM.
Figure 2.
The geometric parameters of EMWM specimens.
Figure 3.
(a) The vibration isolation structure to install a pair of EMWM speciems; (b) Installation state of an EMWM specimen onto the threaded rod and plate.
Figure 3.
(a) The vibration isolation structure to install a pair of EMWM speciems; (b) Installation state of an EMWM specimen onto the threaded rod and plate.
Figure 4.
The vibration experiment setup, including the electric vibration testing system and the isolation structure of EMWM specimens.
Figure 4.
The vibration experiment setup, including the electric vibration testing system and the isolation structure of EMWM specimens.
Figure 5.
(a) Dynamic model of the vibration isolation structure; (b) the semi-sinusoidal compression cycles exerted on the EMWM specimens.
Figure 5.
(a) Dynamic model of the vibration isolation structure; (b) the semi-sinusoidal compression cycles exerted on the EMWM specimens.
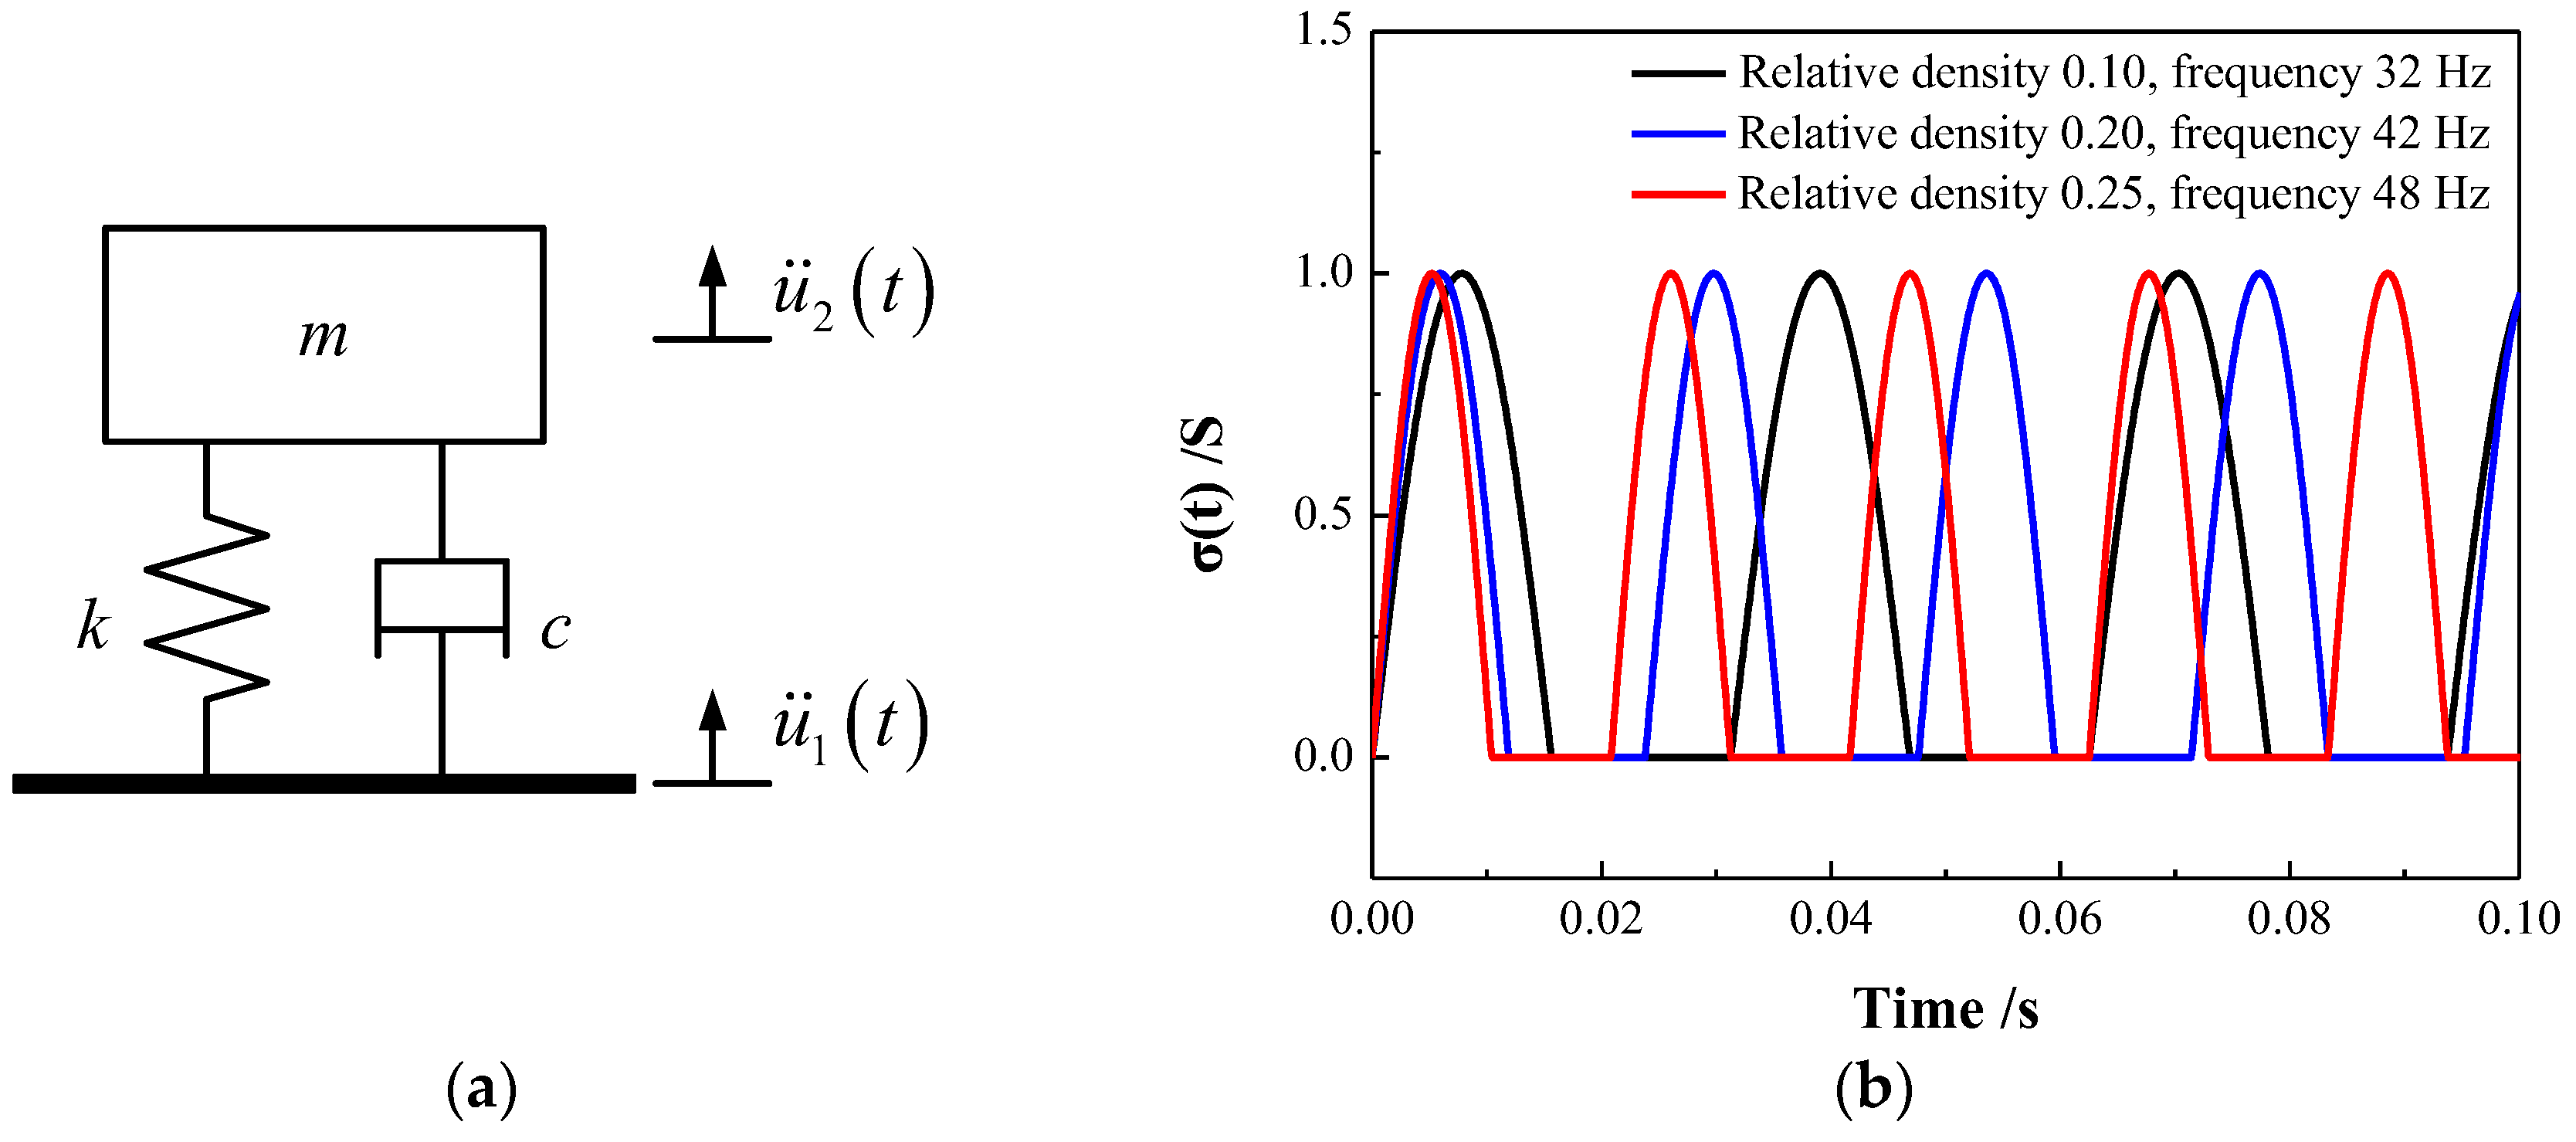
Figure 6.
The frequency-response characteristics curve of the vibration isolation structure.
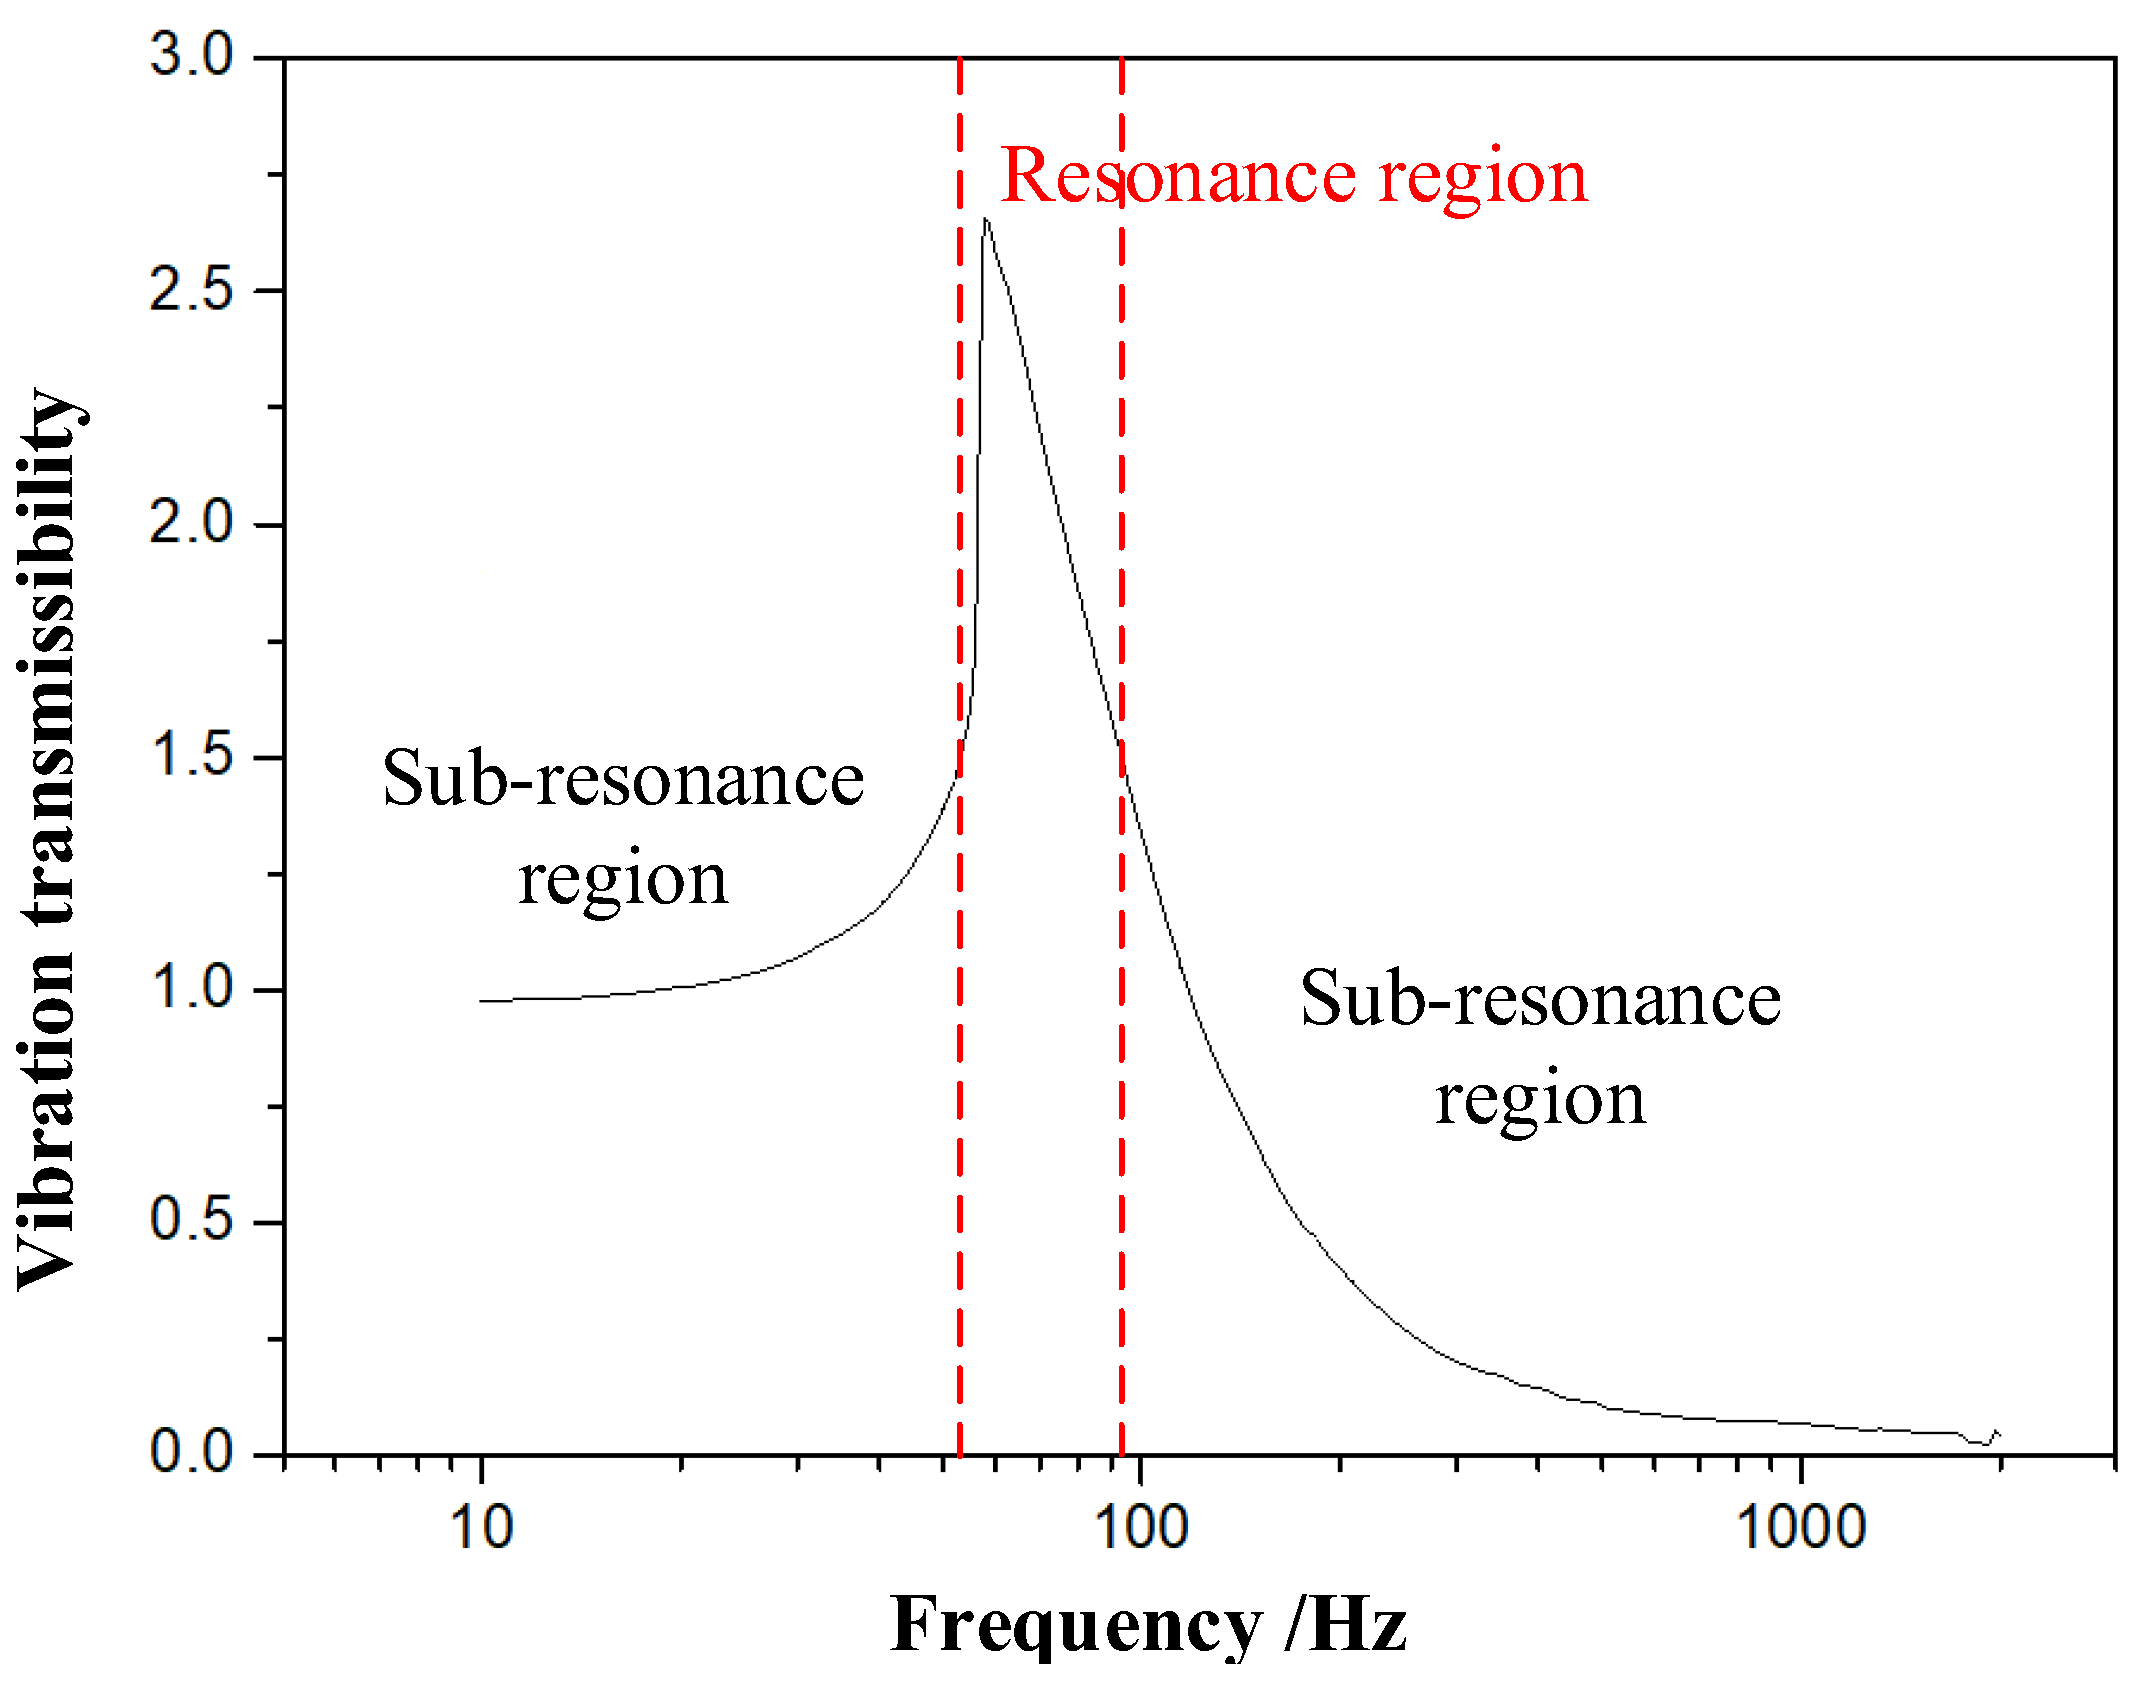
Figure 7.
The experimental setup of the quasi-static compression test.
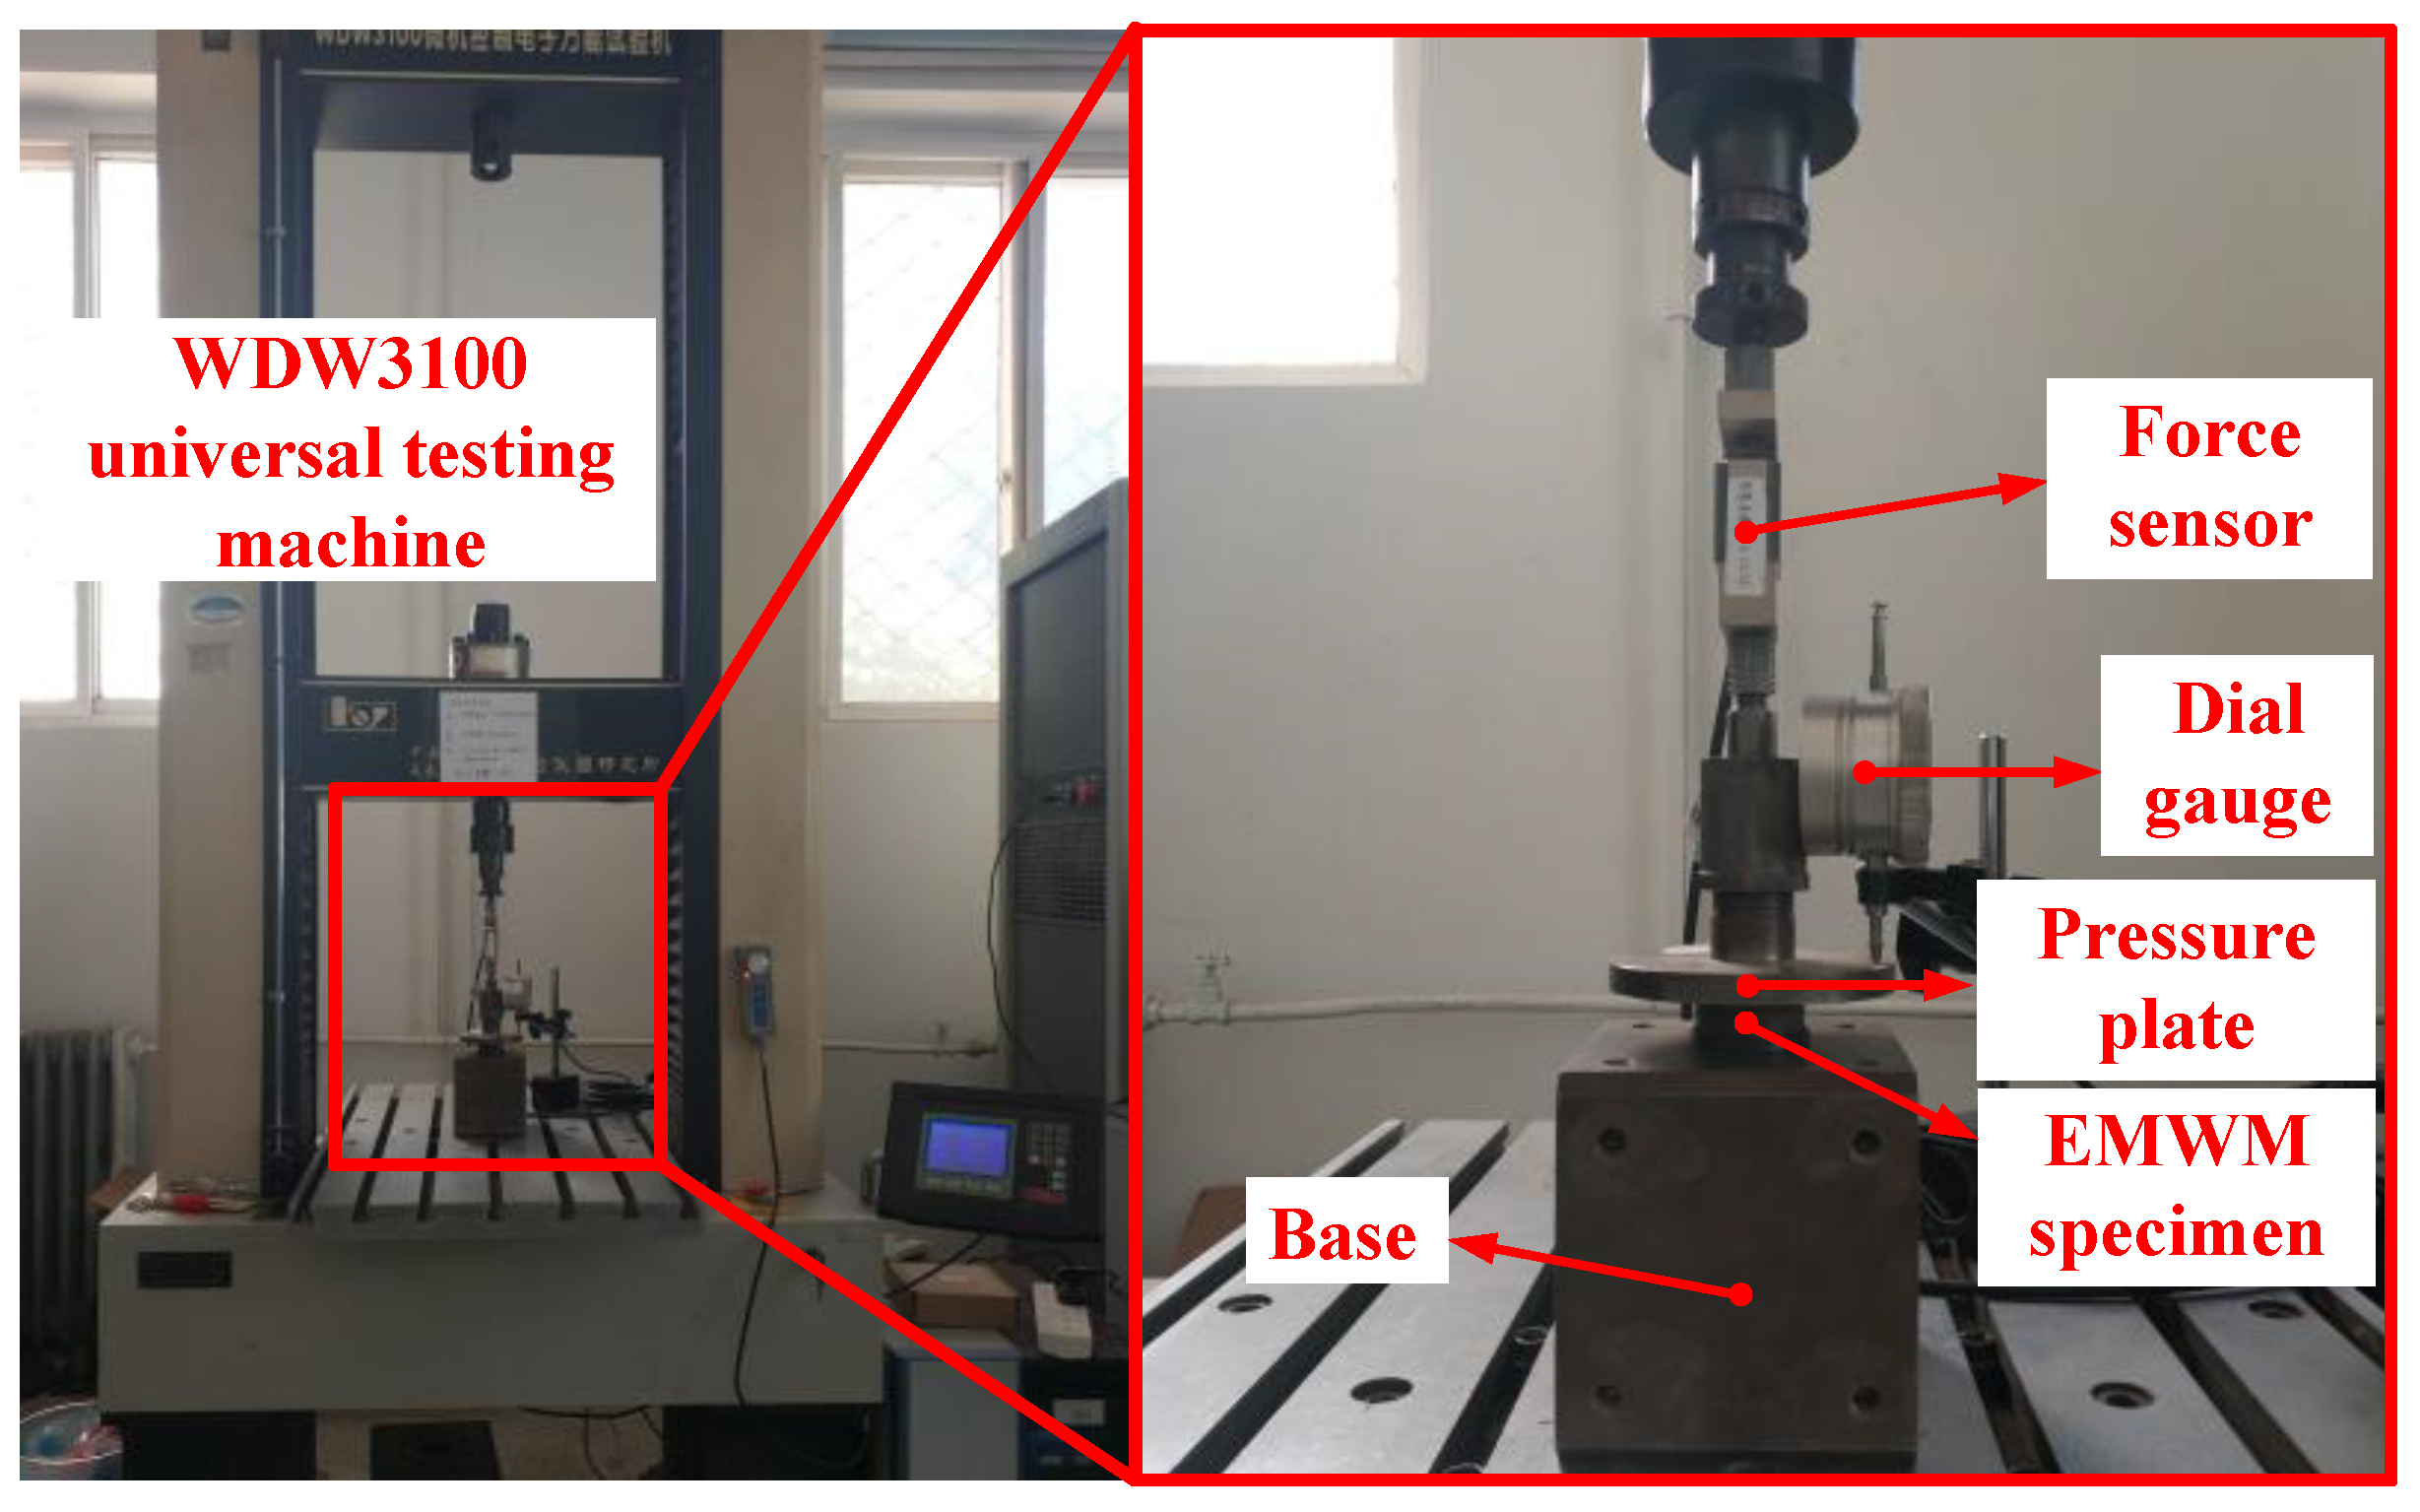
Figure 8.
Schematic stress-strain curves of quasi-static compression.
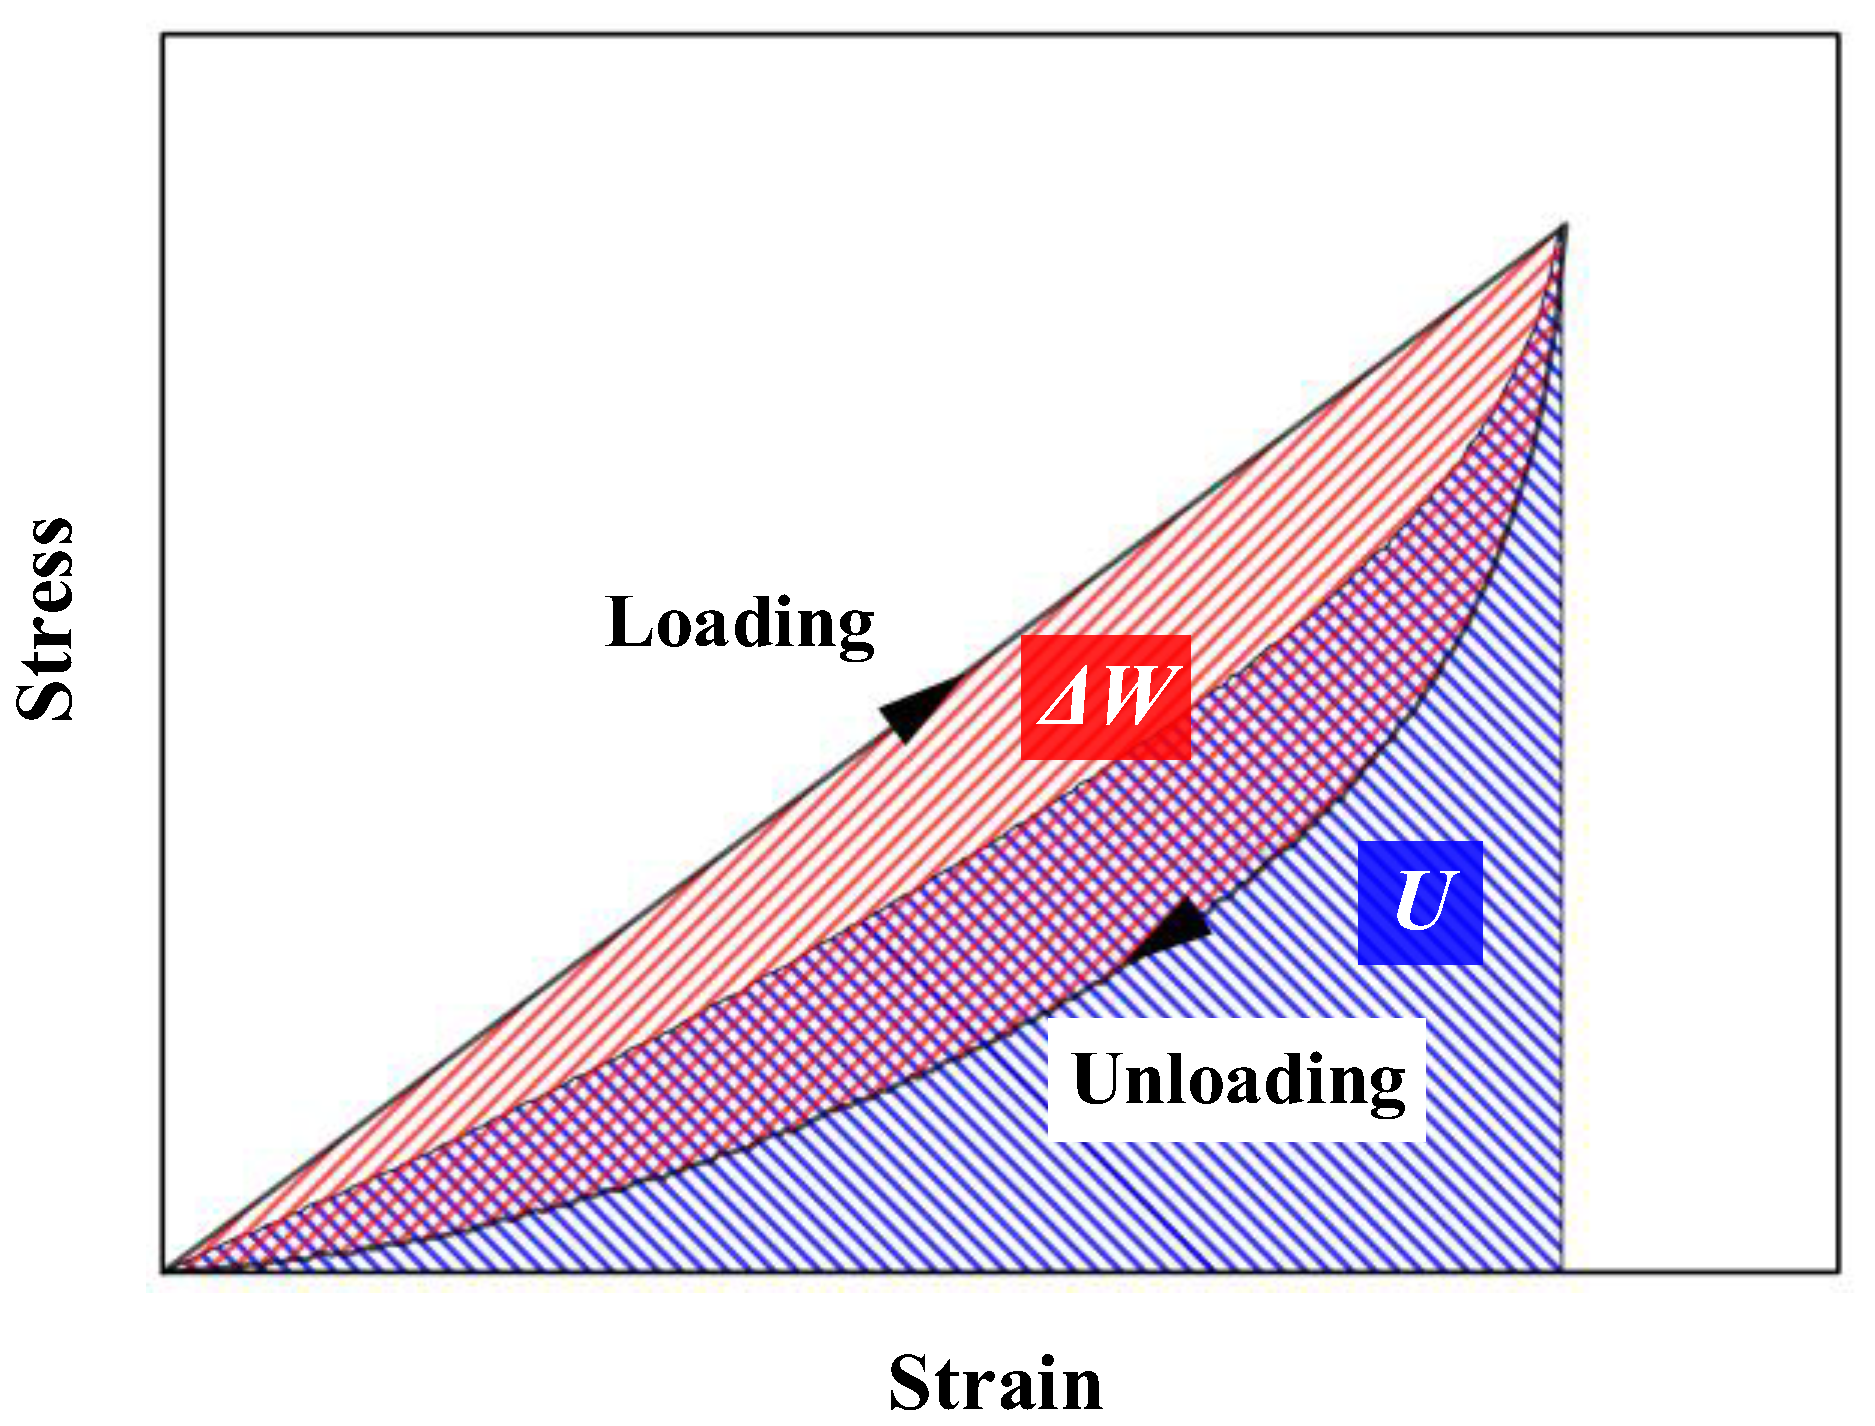
Figure 9.
Resonance frequency of isolation structure with specimens of different relative densities.
Figure 9.
Resonance frequency of isolation structure with specimens of different relative densities.
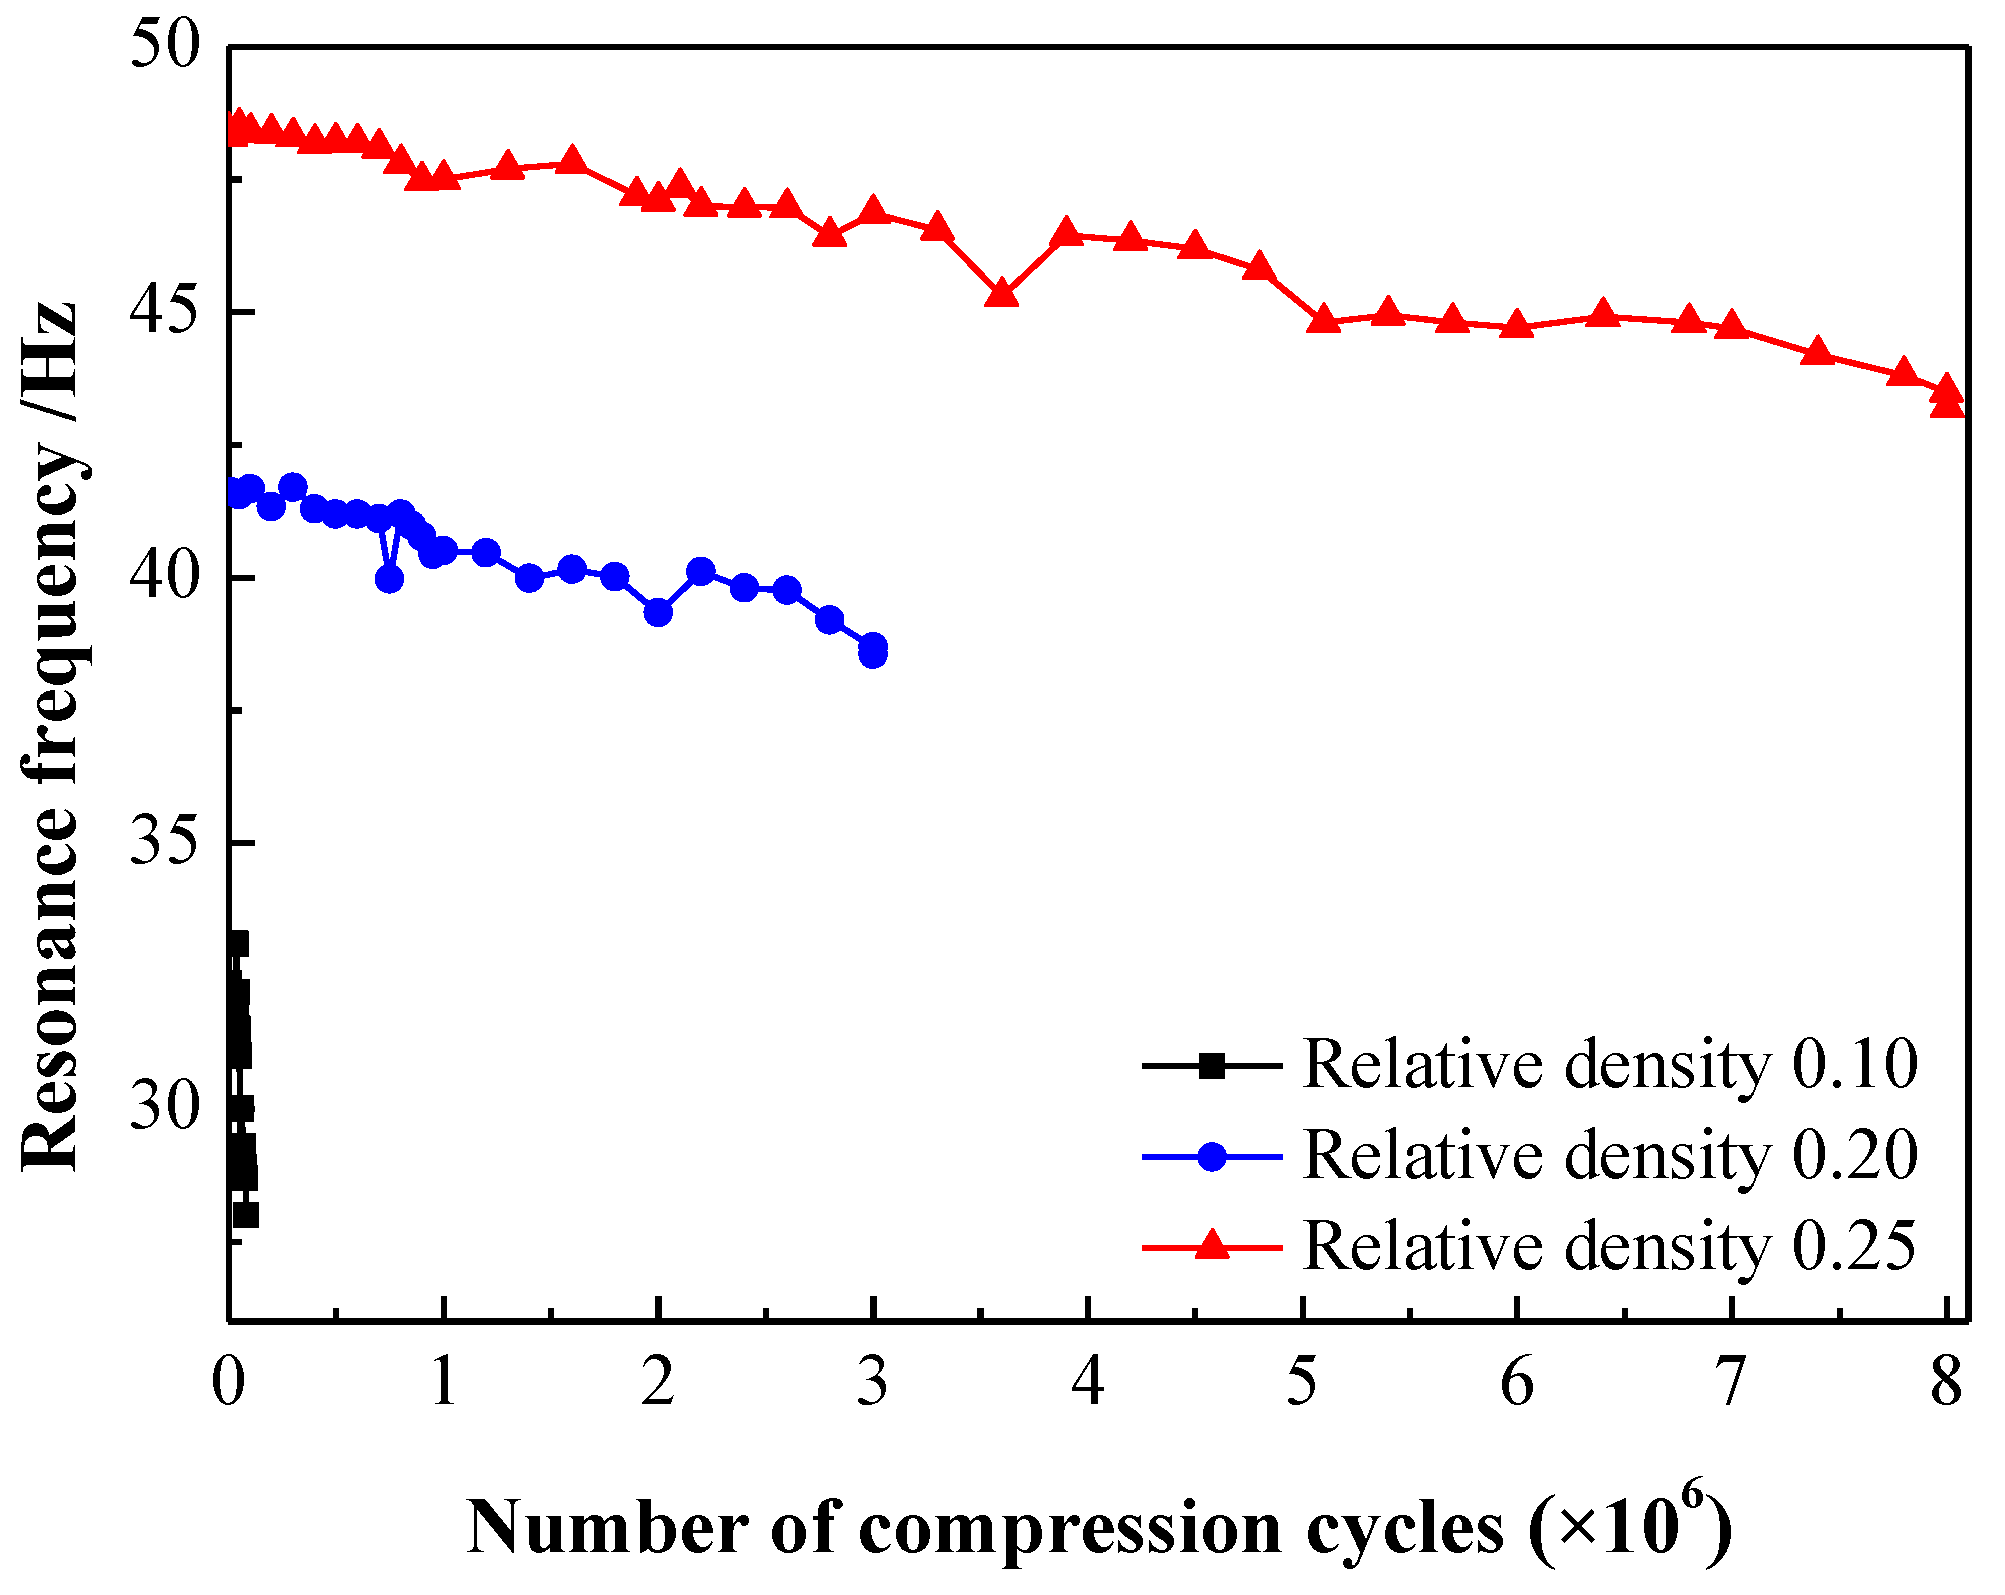
Figure 10.
Resonance transmission rate of isolation structure with specimens of different relative densities.
Figure 10.
Resonance transmission rate of isolation structure with specimens of different relative densities.
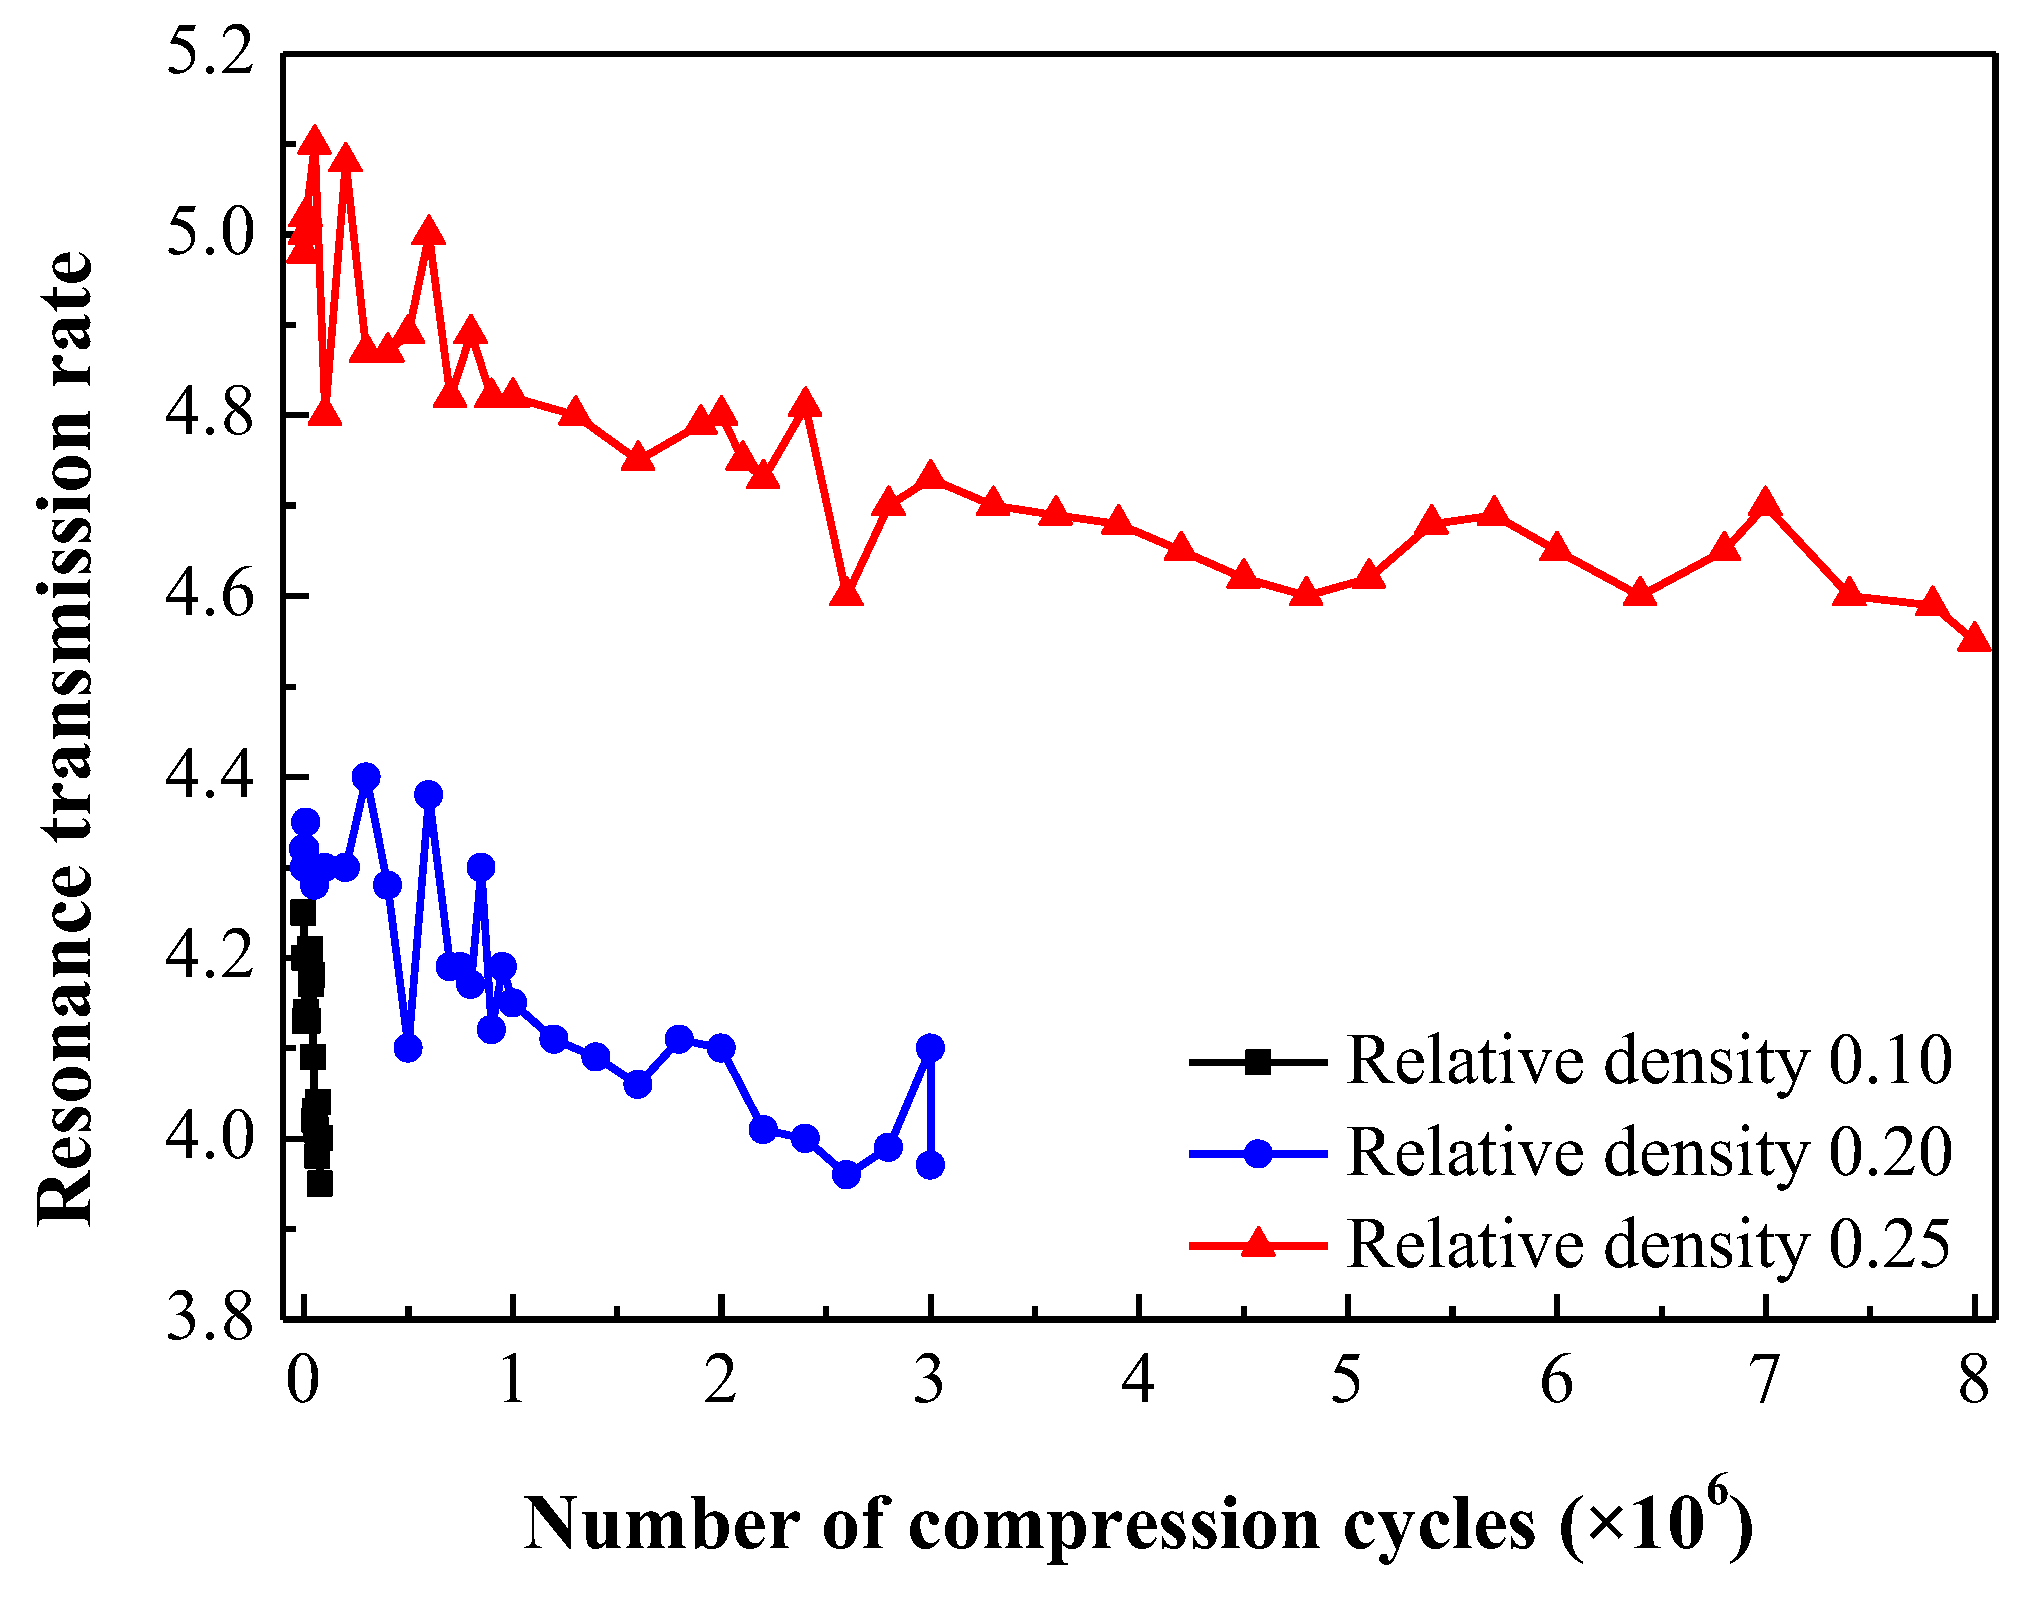
Figure 11.
Visual appearance of specimens after the vibration experiment: (a) specimen A3, (b) specimens with different relative densities.
Figure 11.
Visual appearance of specimens after the vibration experiment: (a) specimen A3, (b) specimens with different relative densities.
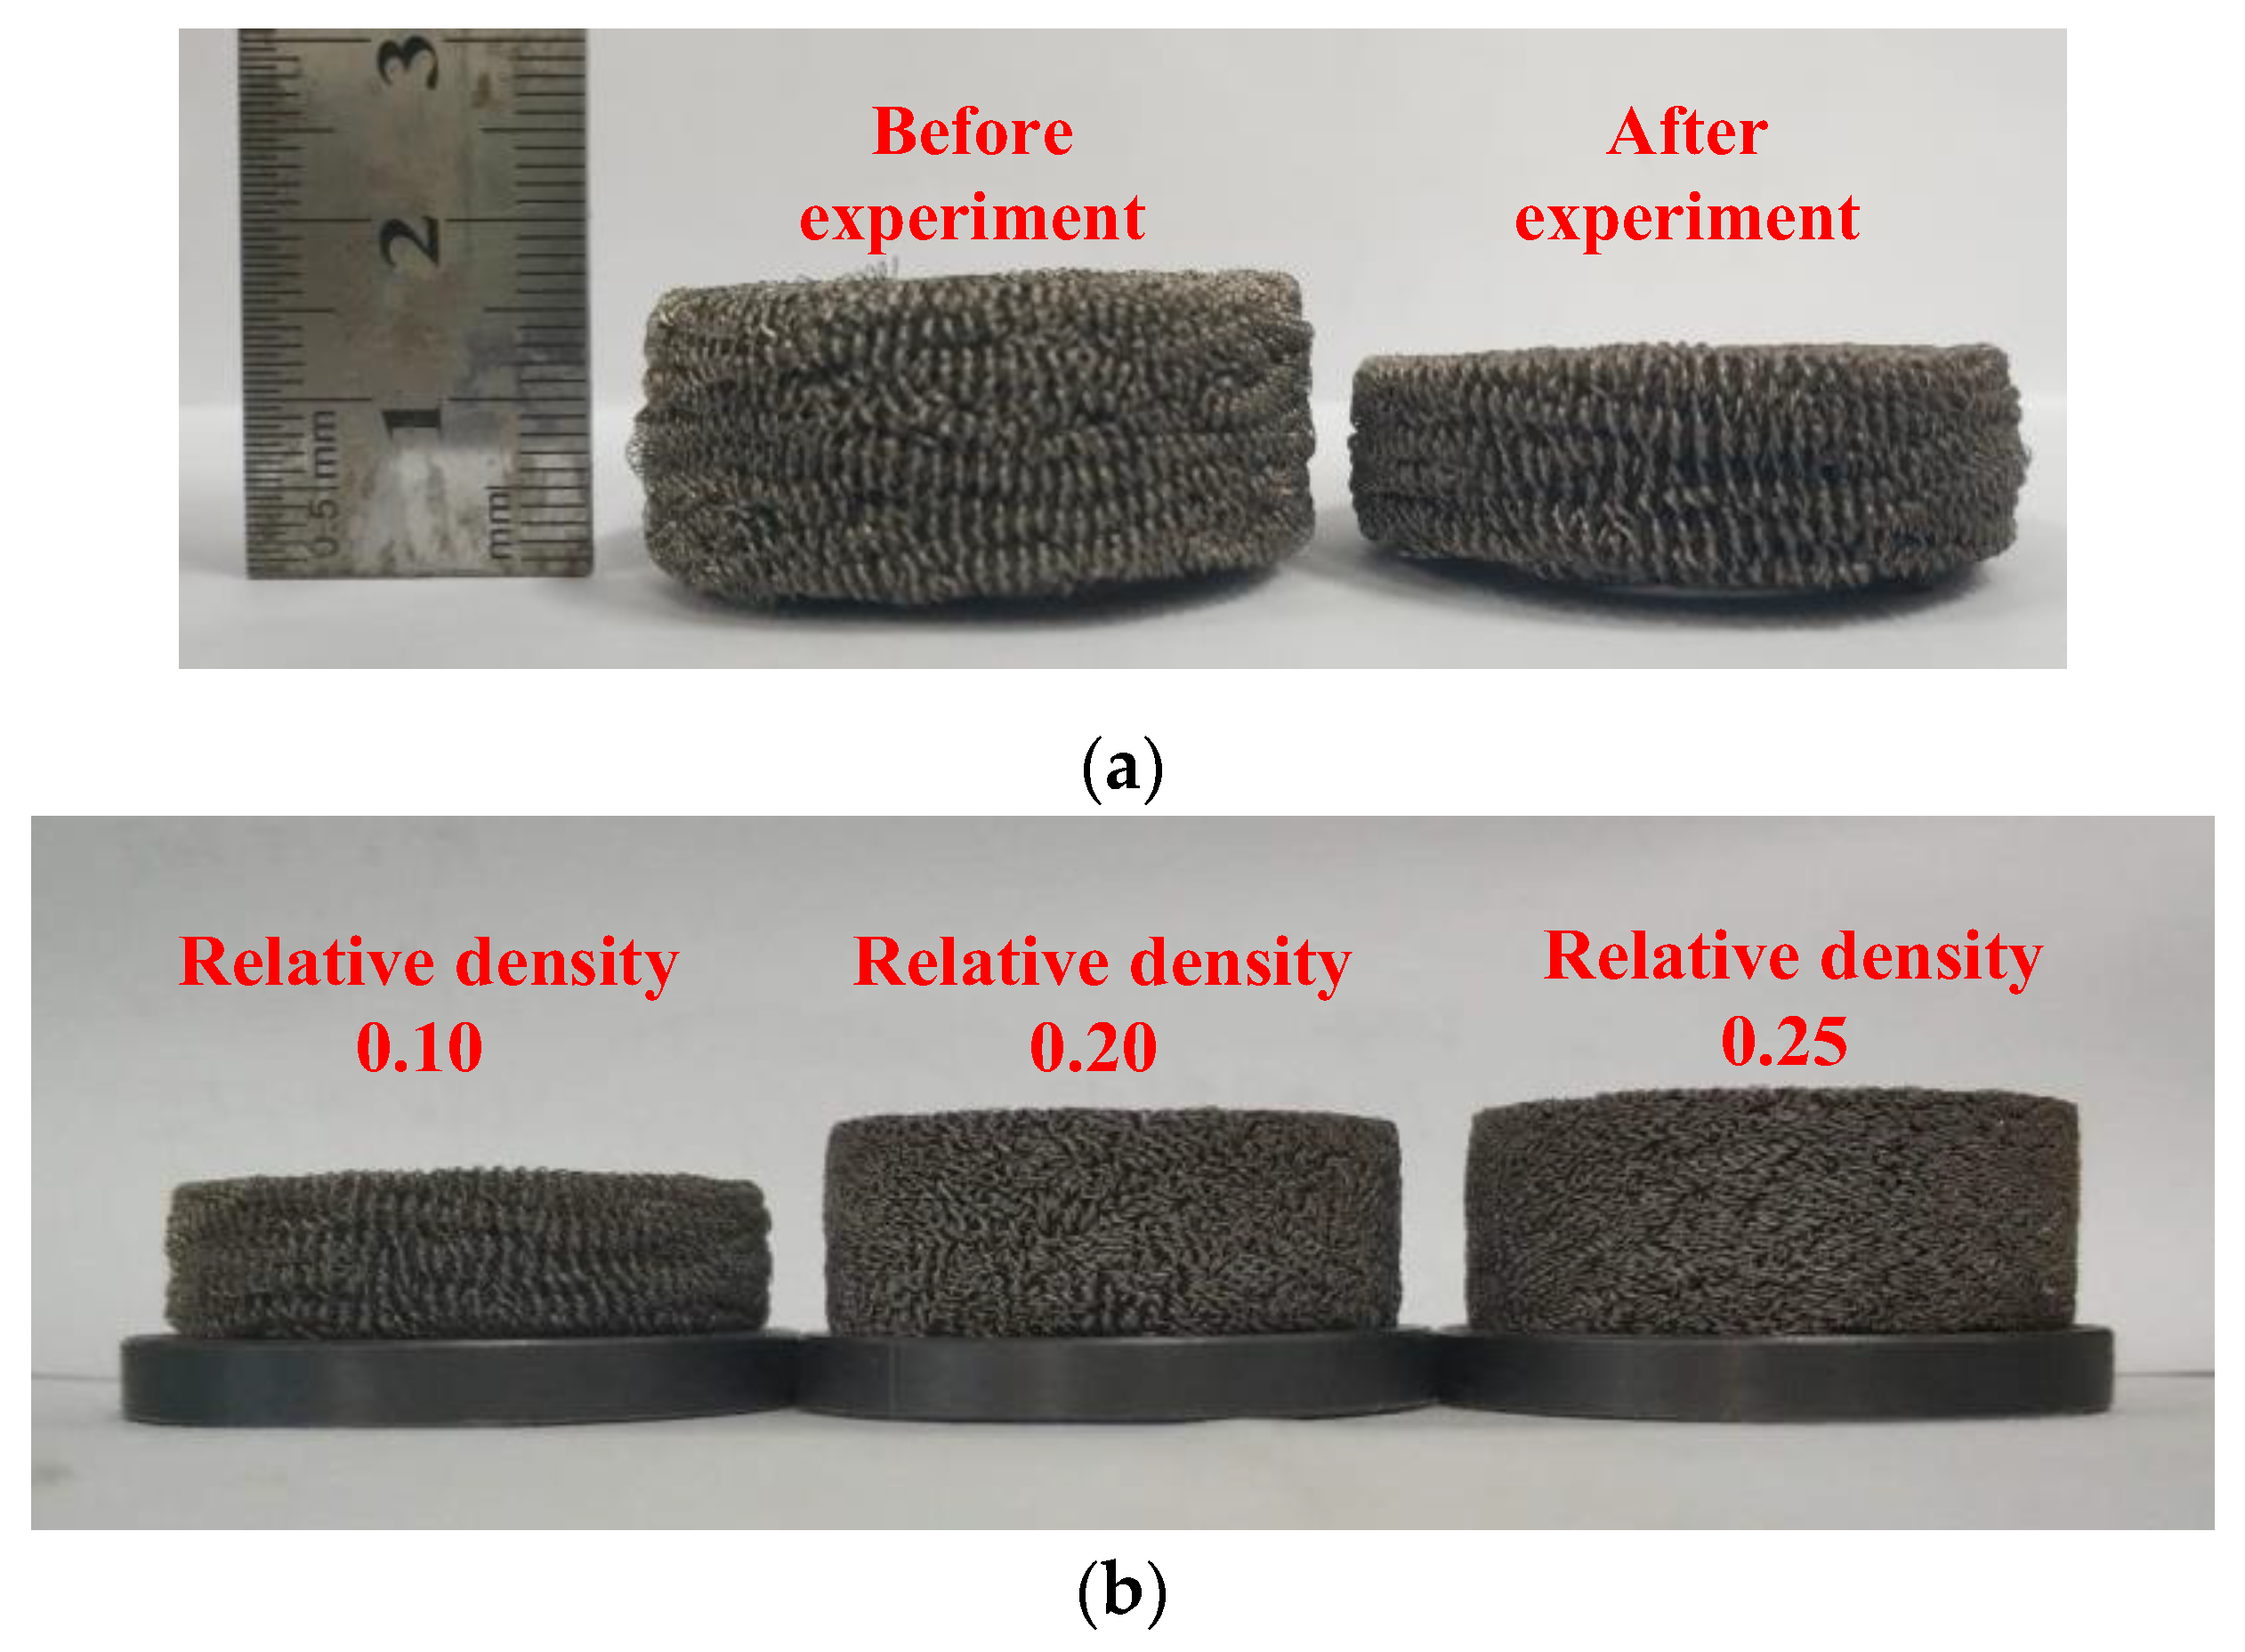
Figure 12.
The three-dimensional structure of specimen A3 obtained by CT scanning.
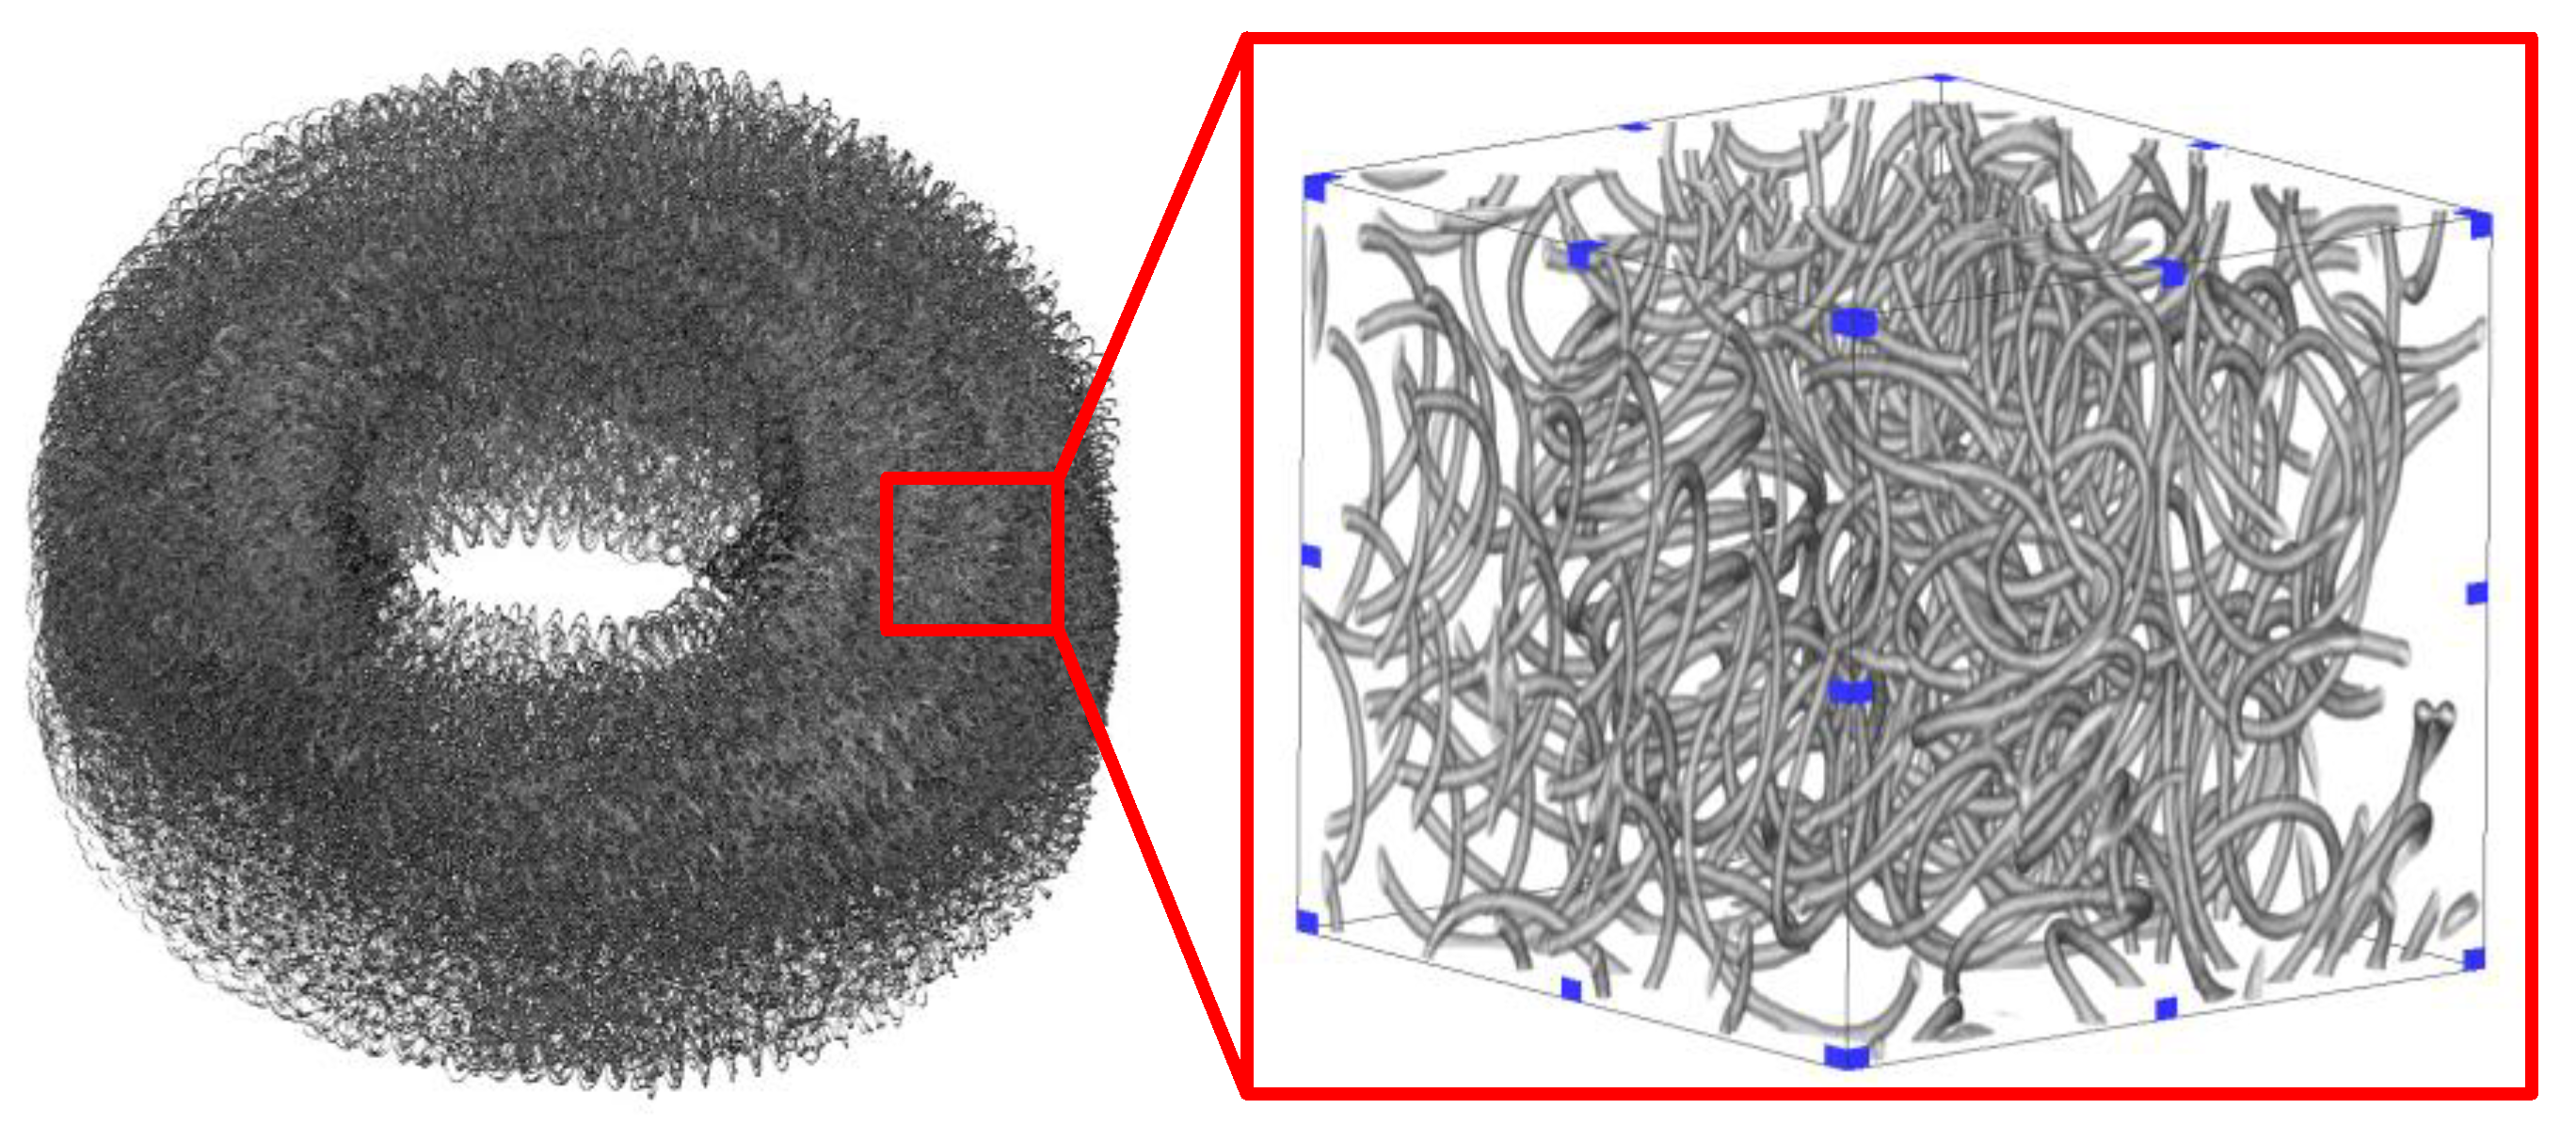
Figure 13.
The variation of specimen height: (a) for different relative densities, stress amplitude 0.3 MPa, (b) relative density 0.25, under different stress amplitudes.
Figure 13.
The variation of specimen height: (a) for different relative densities, stress amplitude 0.3 MPa, (b) relative density 0.25, under different stress amplitudes.
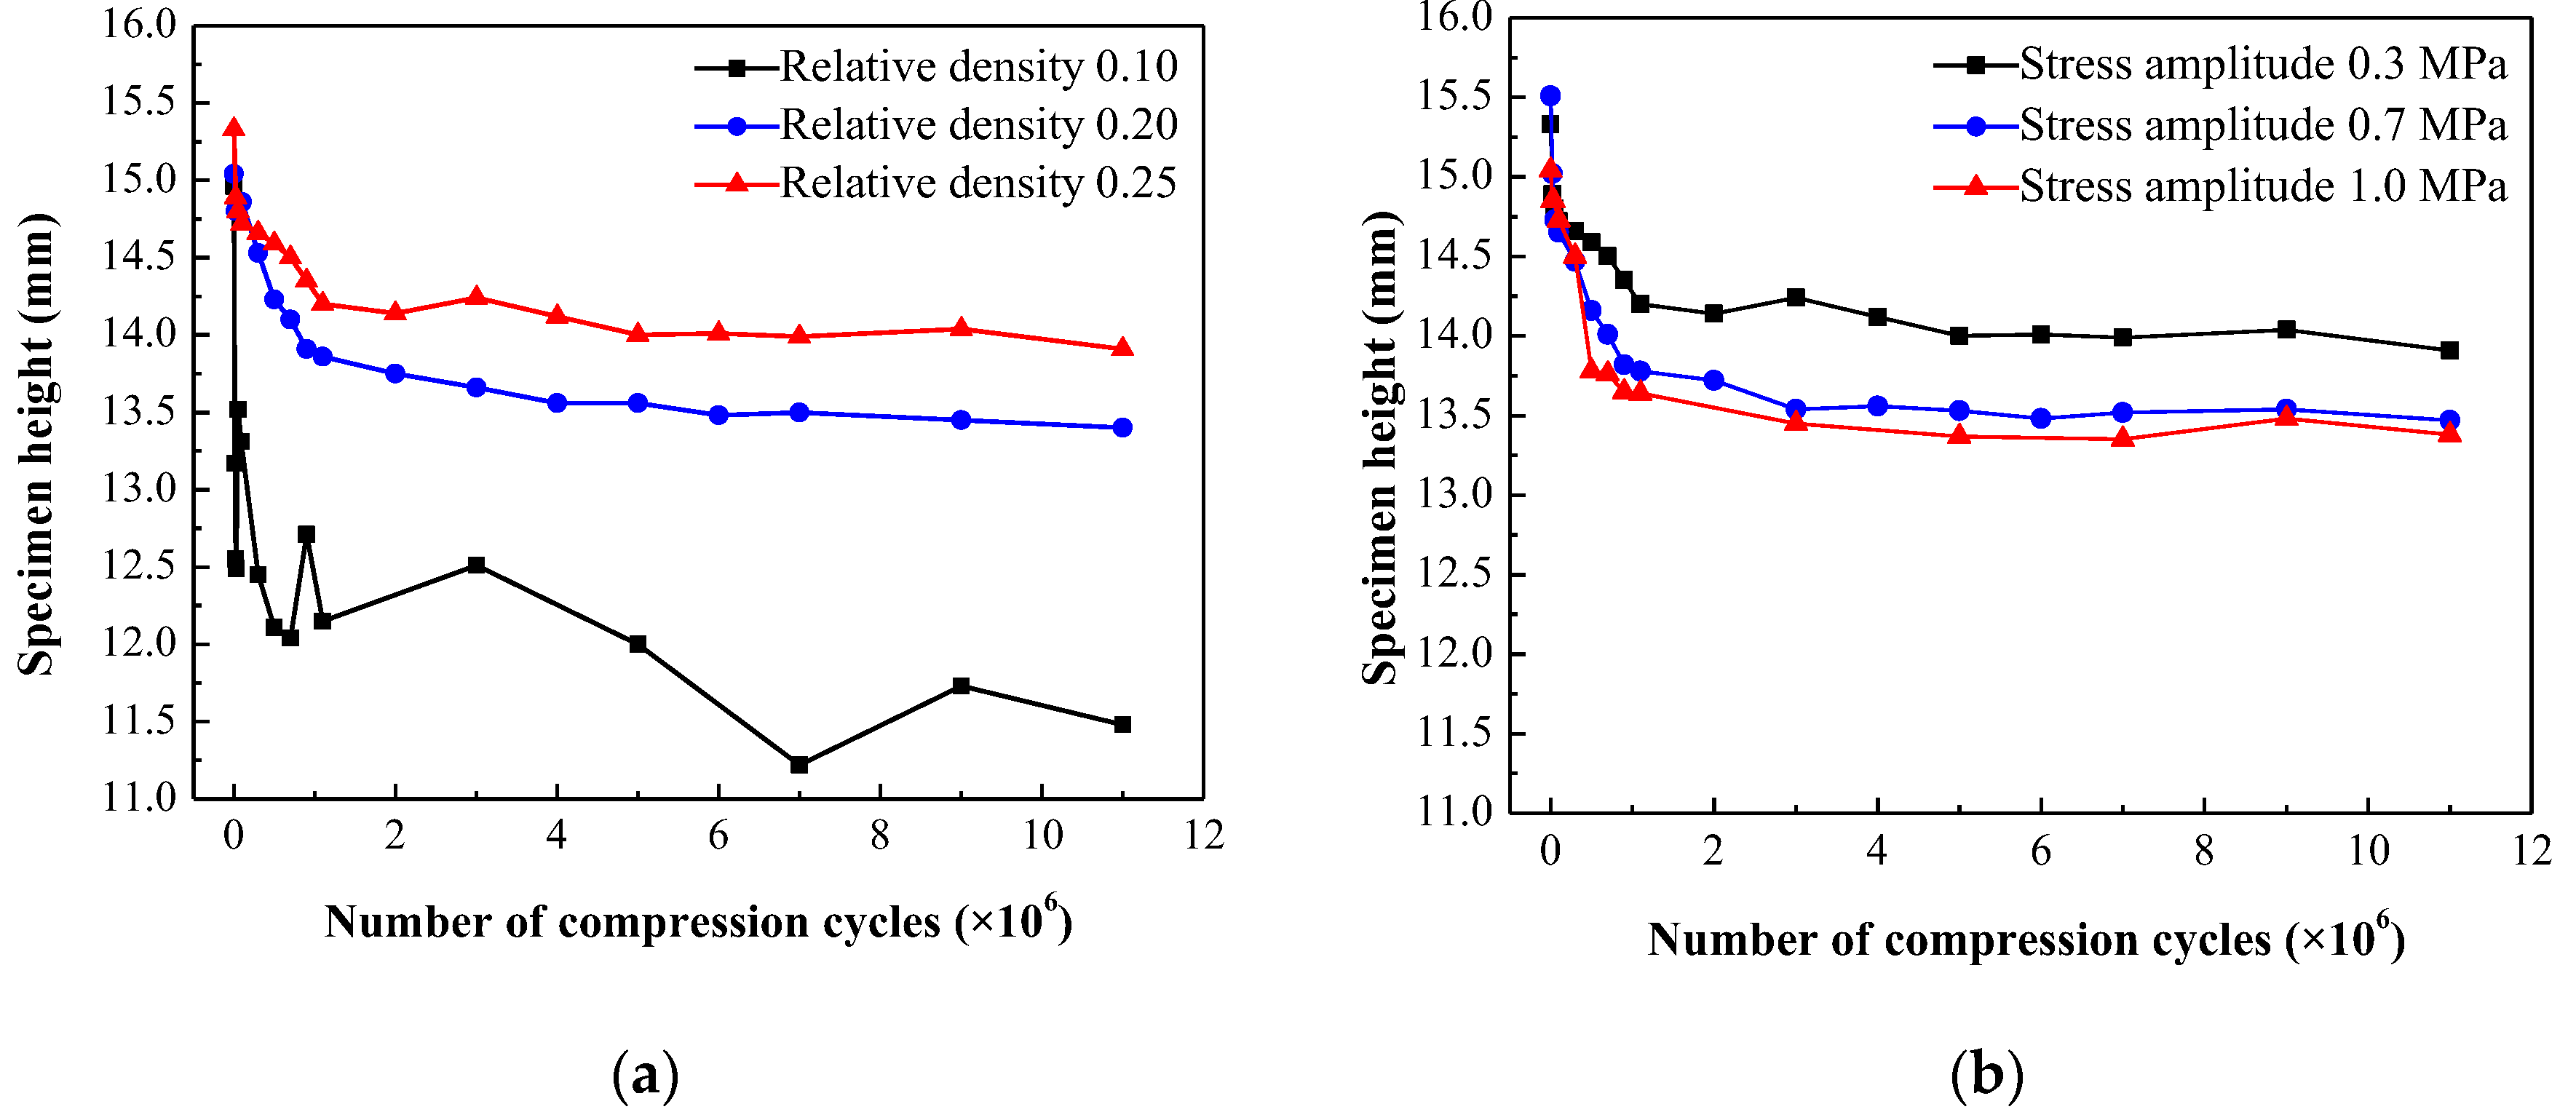
Figure 14.
The height variation rates of specimens: (a) for different relative densities, (b) under different compressive stress amplitudes.
Figure 14.
The height variation rates of specimens: (a) for different relative densities, (b) under different compressive stress amplitudes.
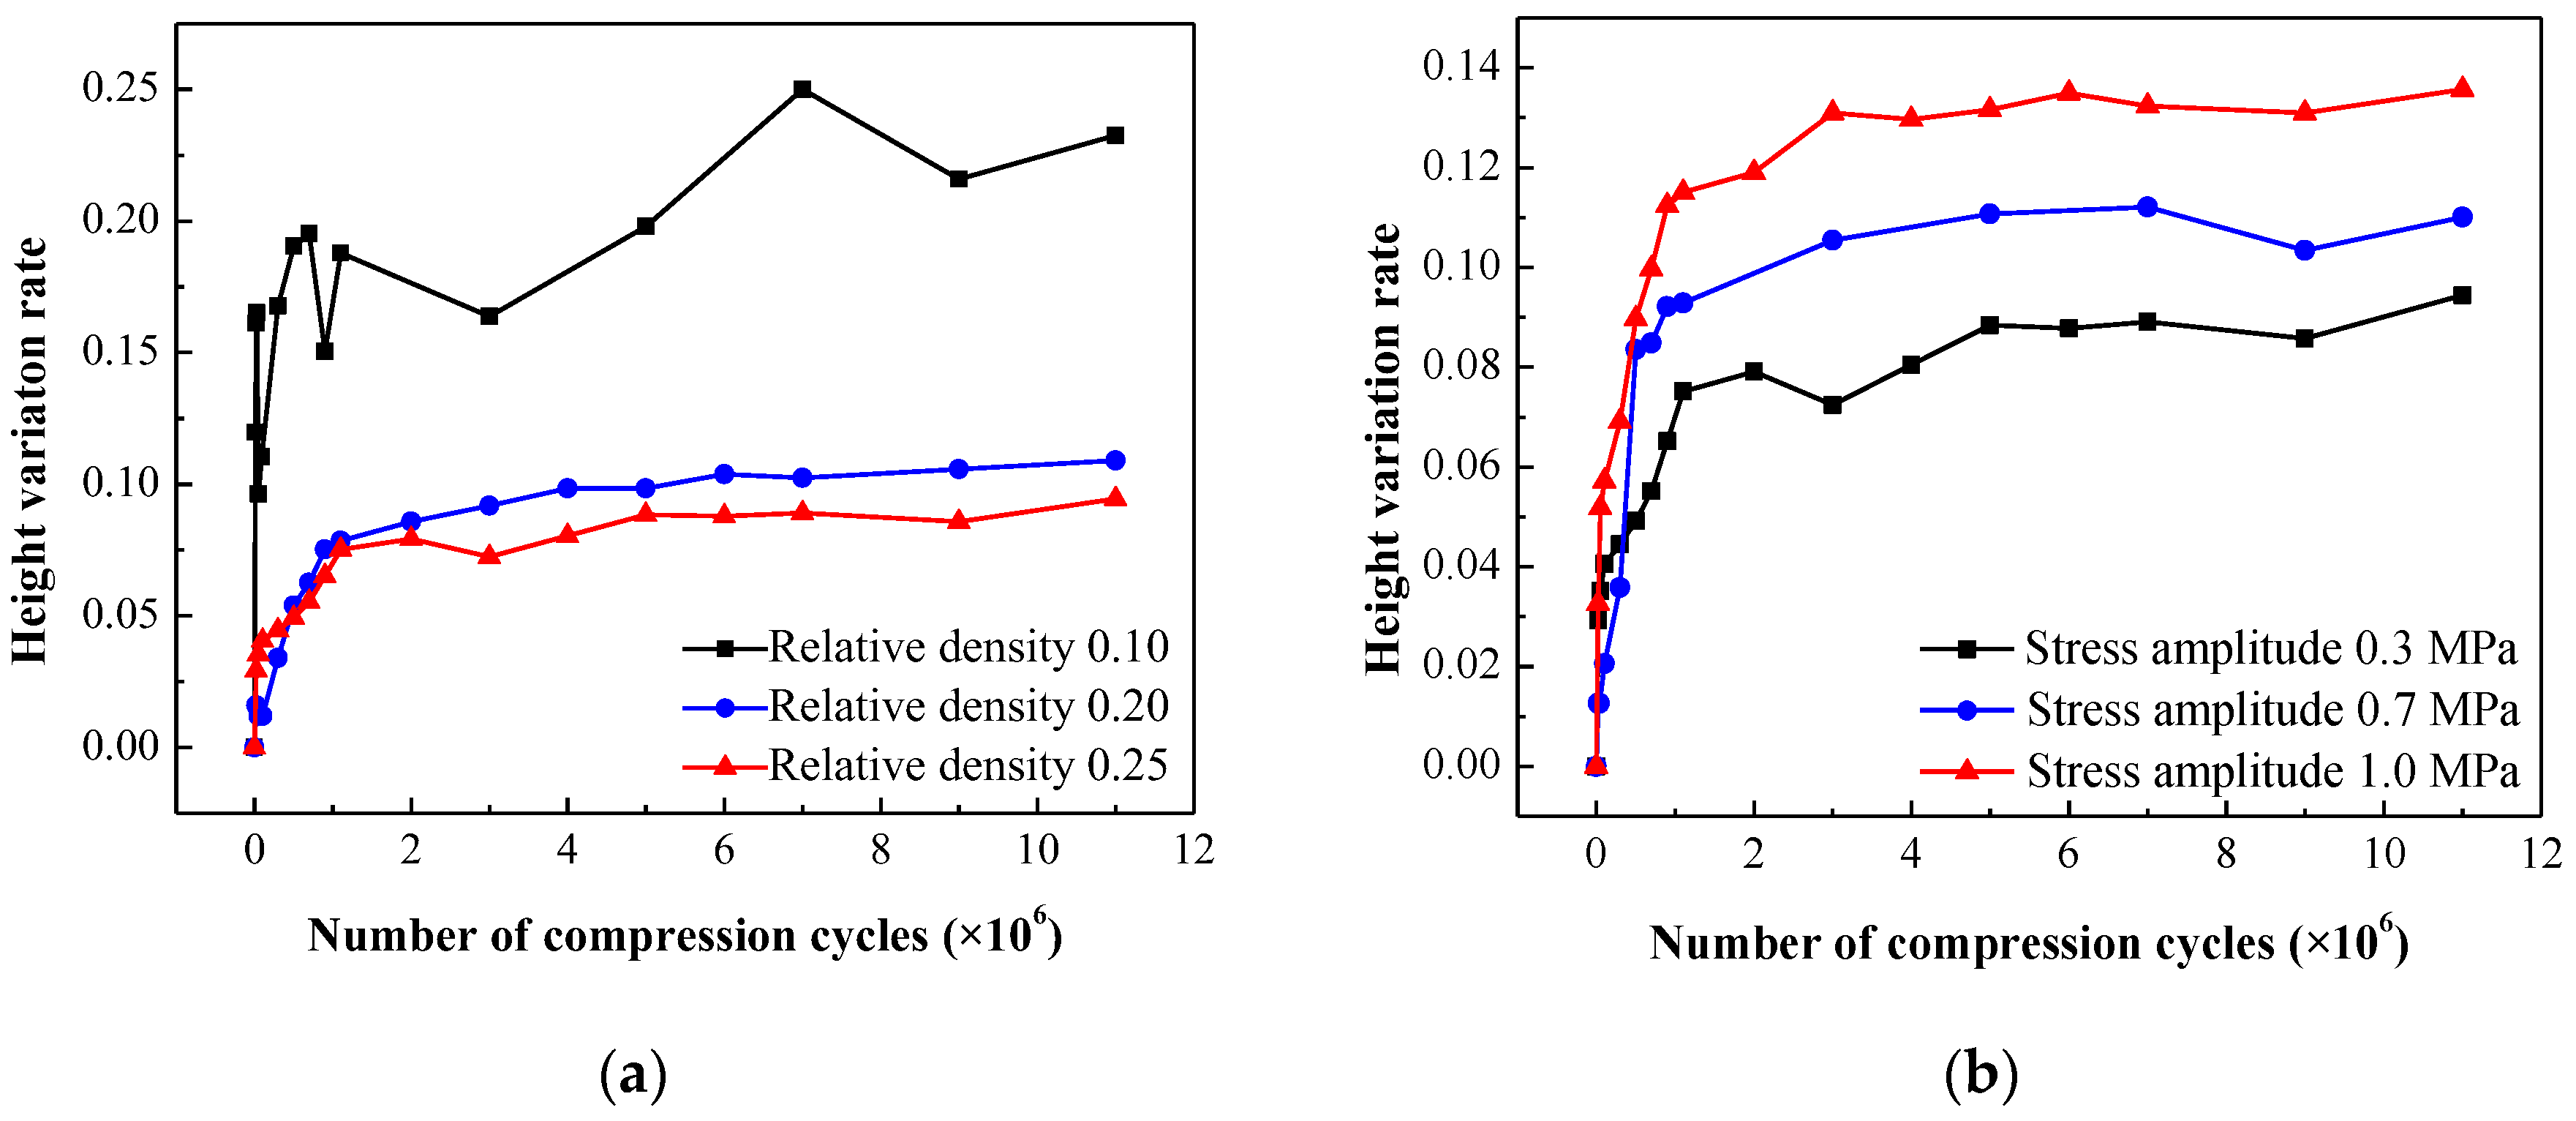
Figure 15.
The variation of secant modulus: (a) for different relative densities, stress amplitude 0.3 MPa, (b) relative density 0.25, under different stress amplitudes.
Figure 15.
The variation of secant modulus: (a) for different relative densities, stress amplitude 0.3 MPa, (b) relative density 0.25, under different stress amplitudes.
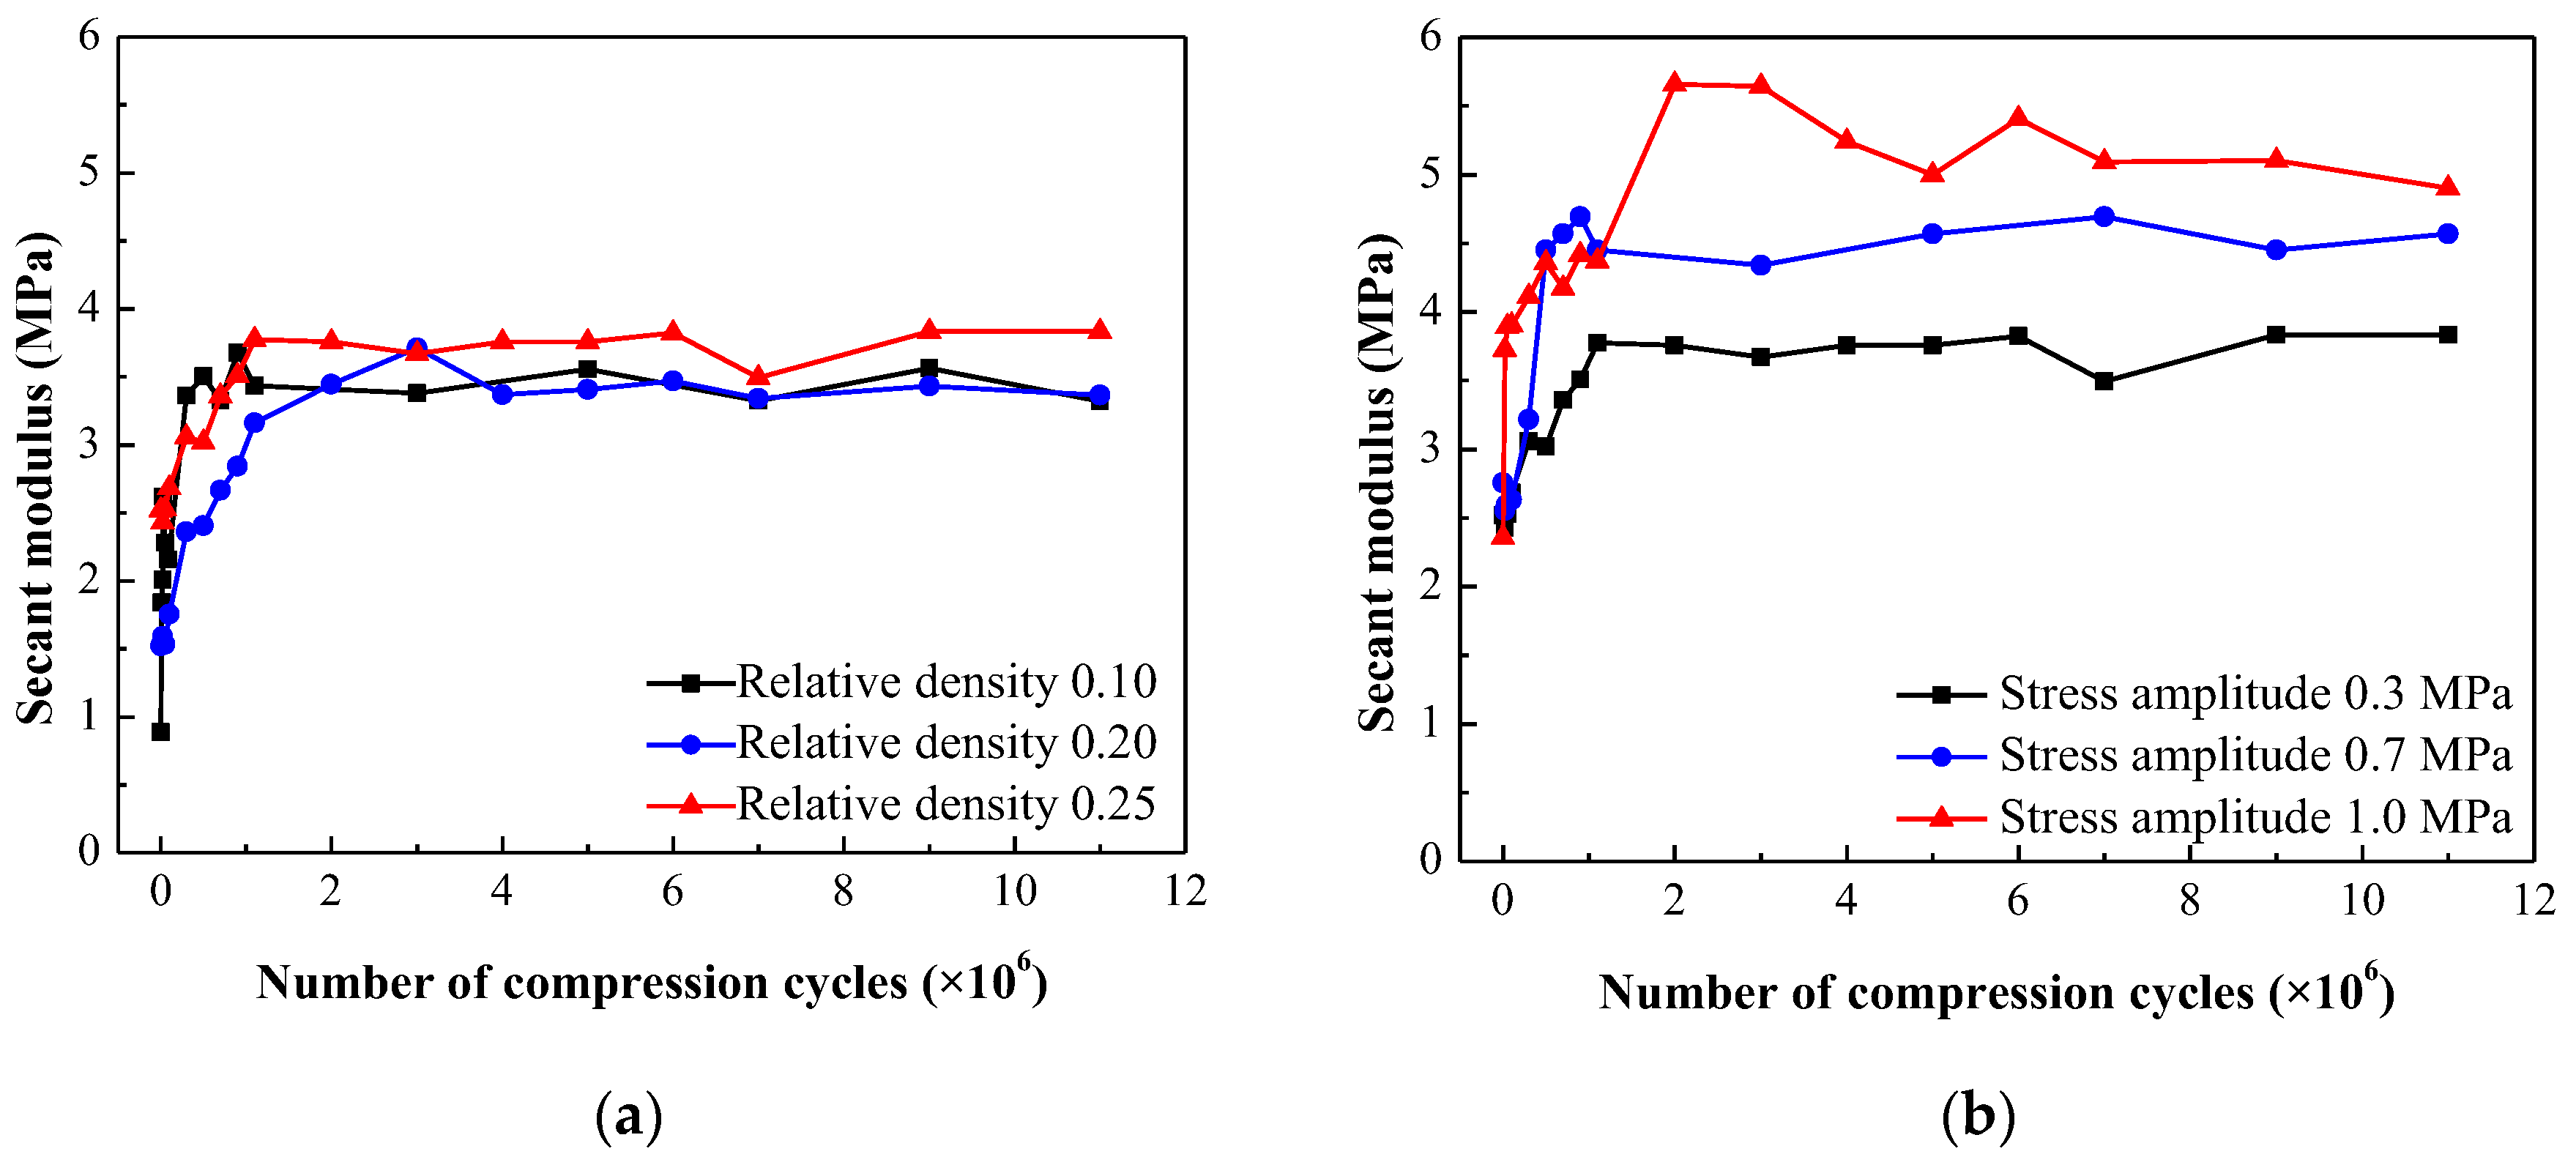
Figure 16.
The modulus variation rates of specimens: (a) for different relative densities, (b) under different compressive stress amplitudes.
Figure 16.
The modulus variation rates of specimens: (a) for different relative densities, (b) under different compressive stress amplitudes.
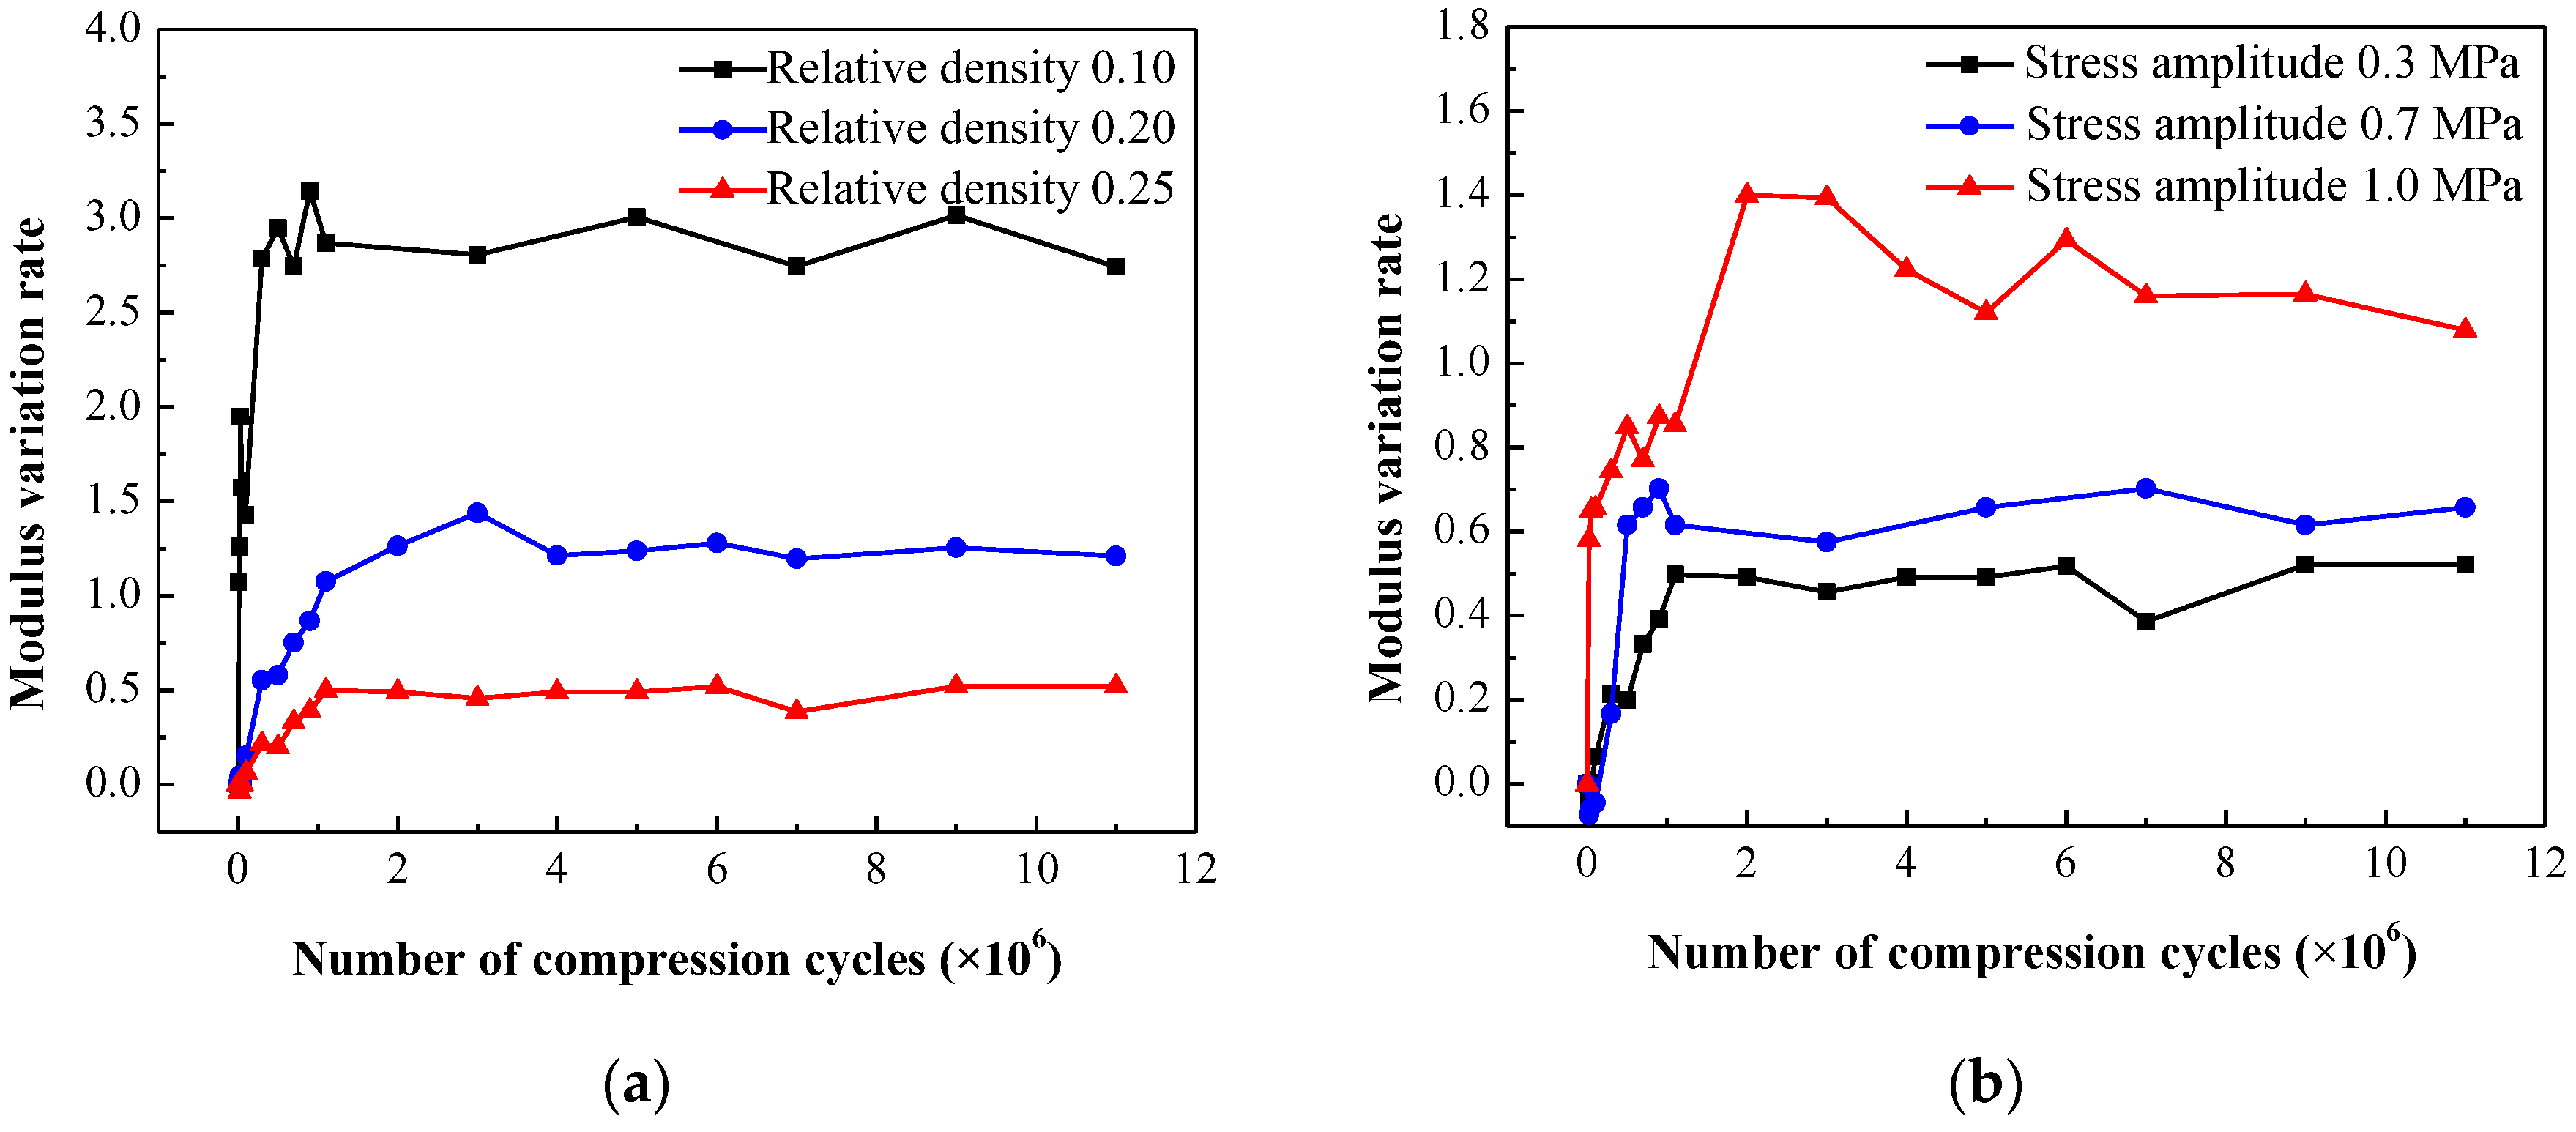
Figure 17.
The variation of loss factor: (a) for different relative densities, stress amplitude 0.3 MPa, (b) relative density 0.25, under different stress amplitudes.
Figure 17.
The variation of loss factor: (a) for different relative densities, stress amplitude 0.3 MPa, (b) relative density 0.25, under different stress amplitudes.
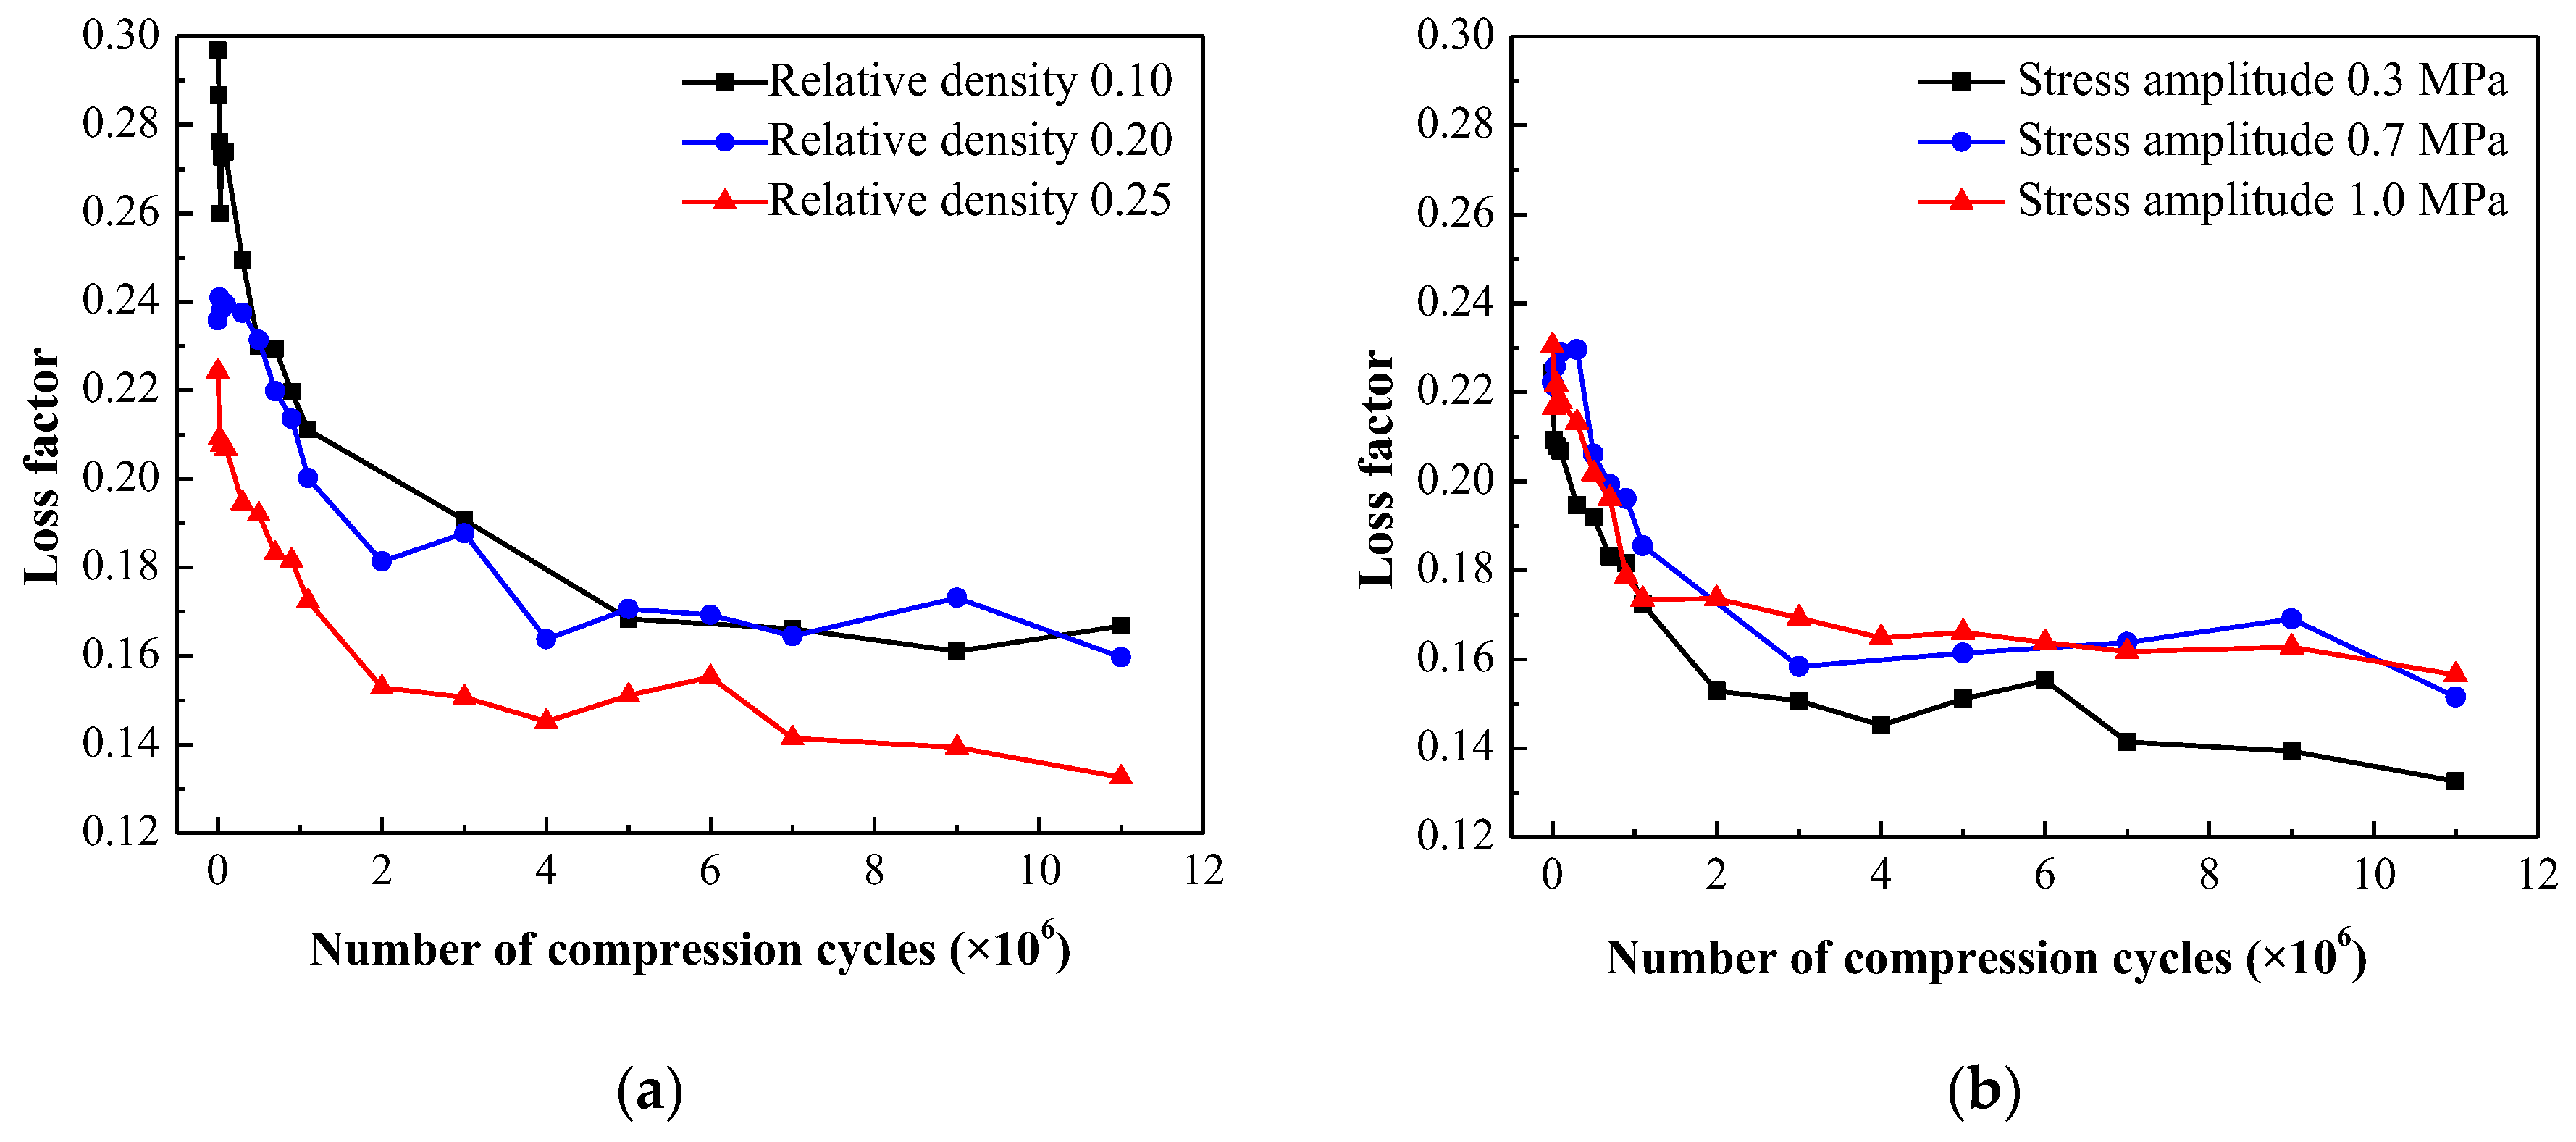
Figure 18.
The damping variation rate of the specimens, (a) for different relative densities, (b) under different compressive stress amplitudes.
Figure 18.
The damping variation rate of the specimens, (a) for different relative densities, (b) under different compressive stress amplitudes.
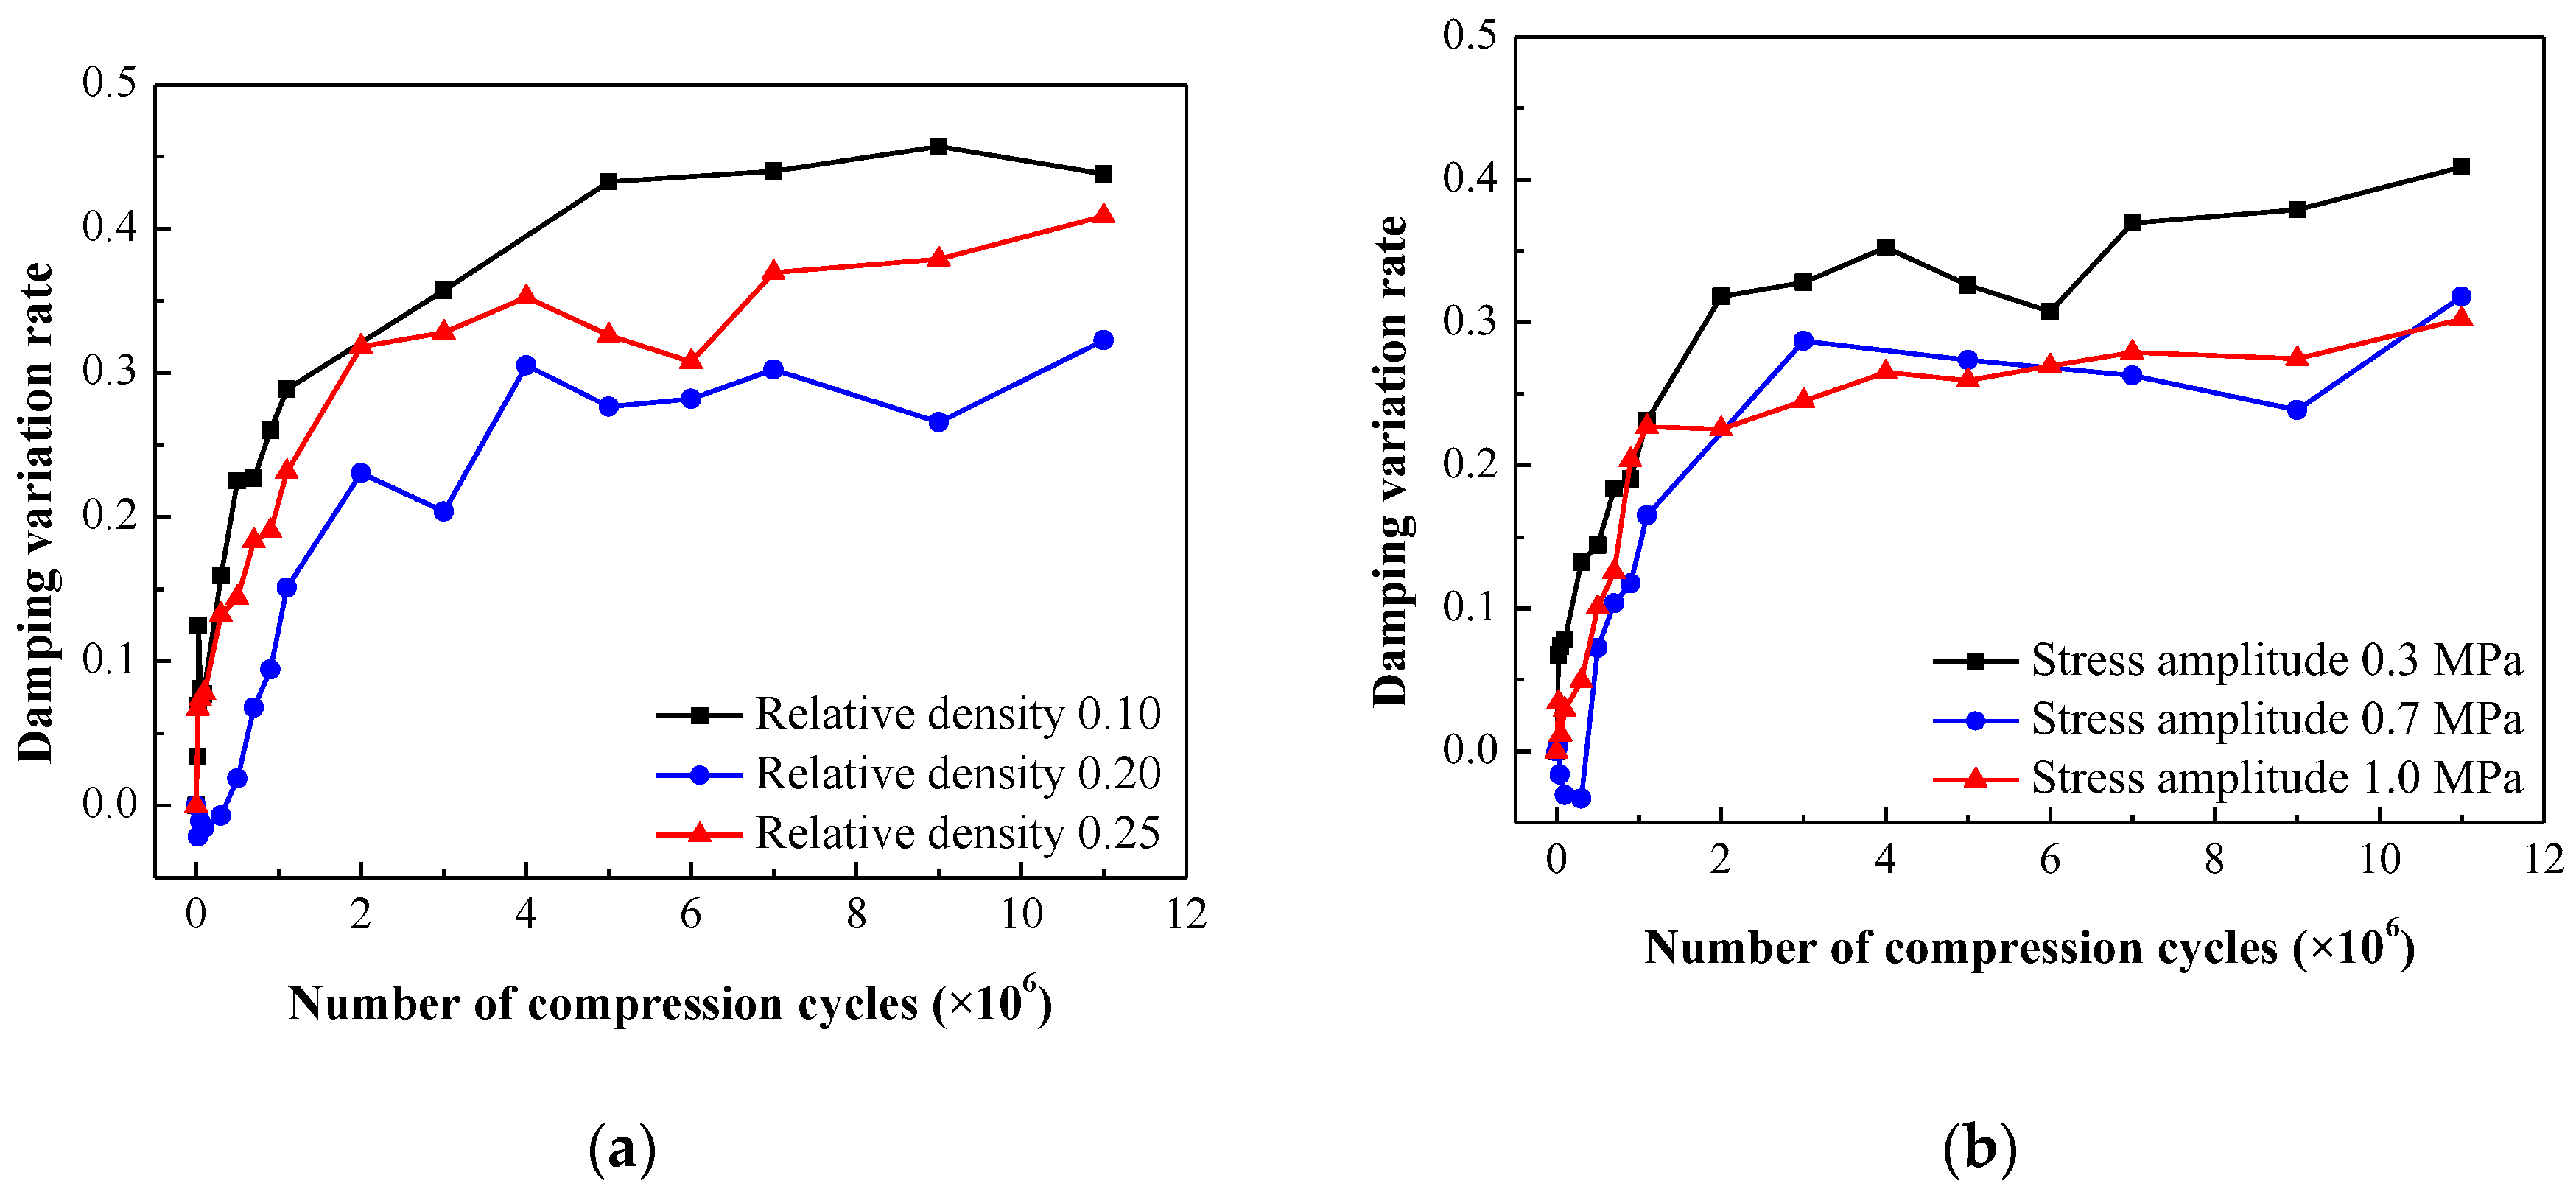
Figure 19.
Comparison between the dimension prediction model and experimental results: (a) for different relative densities, (b) under different compressive stress amplitudes.
Figure 19.
Comparison between the dimension prediction model and experimental results: (a) for different relative densities, (b) under different compressive stress amplitudes.
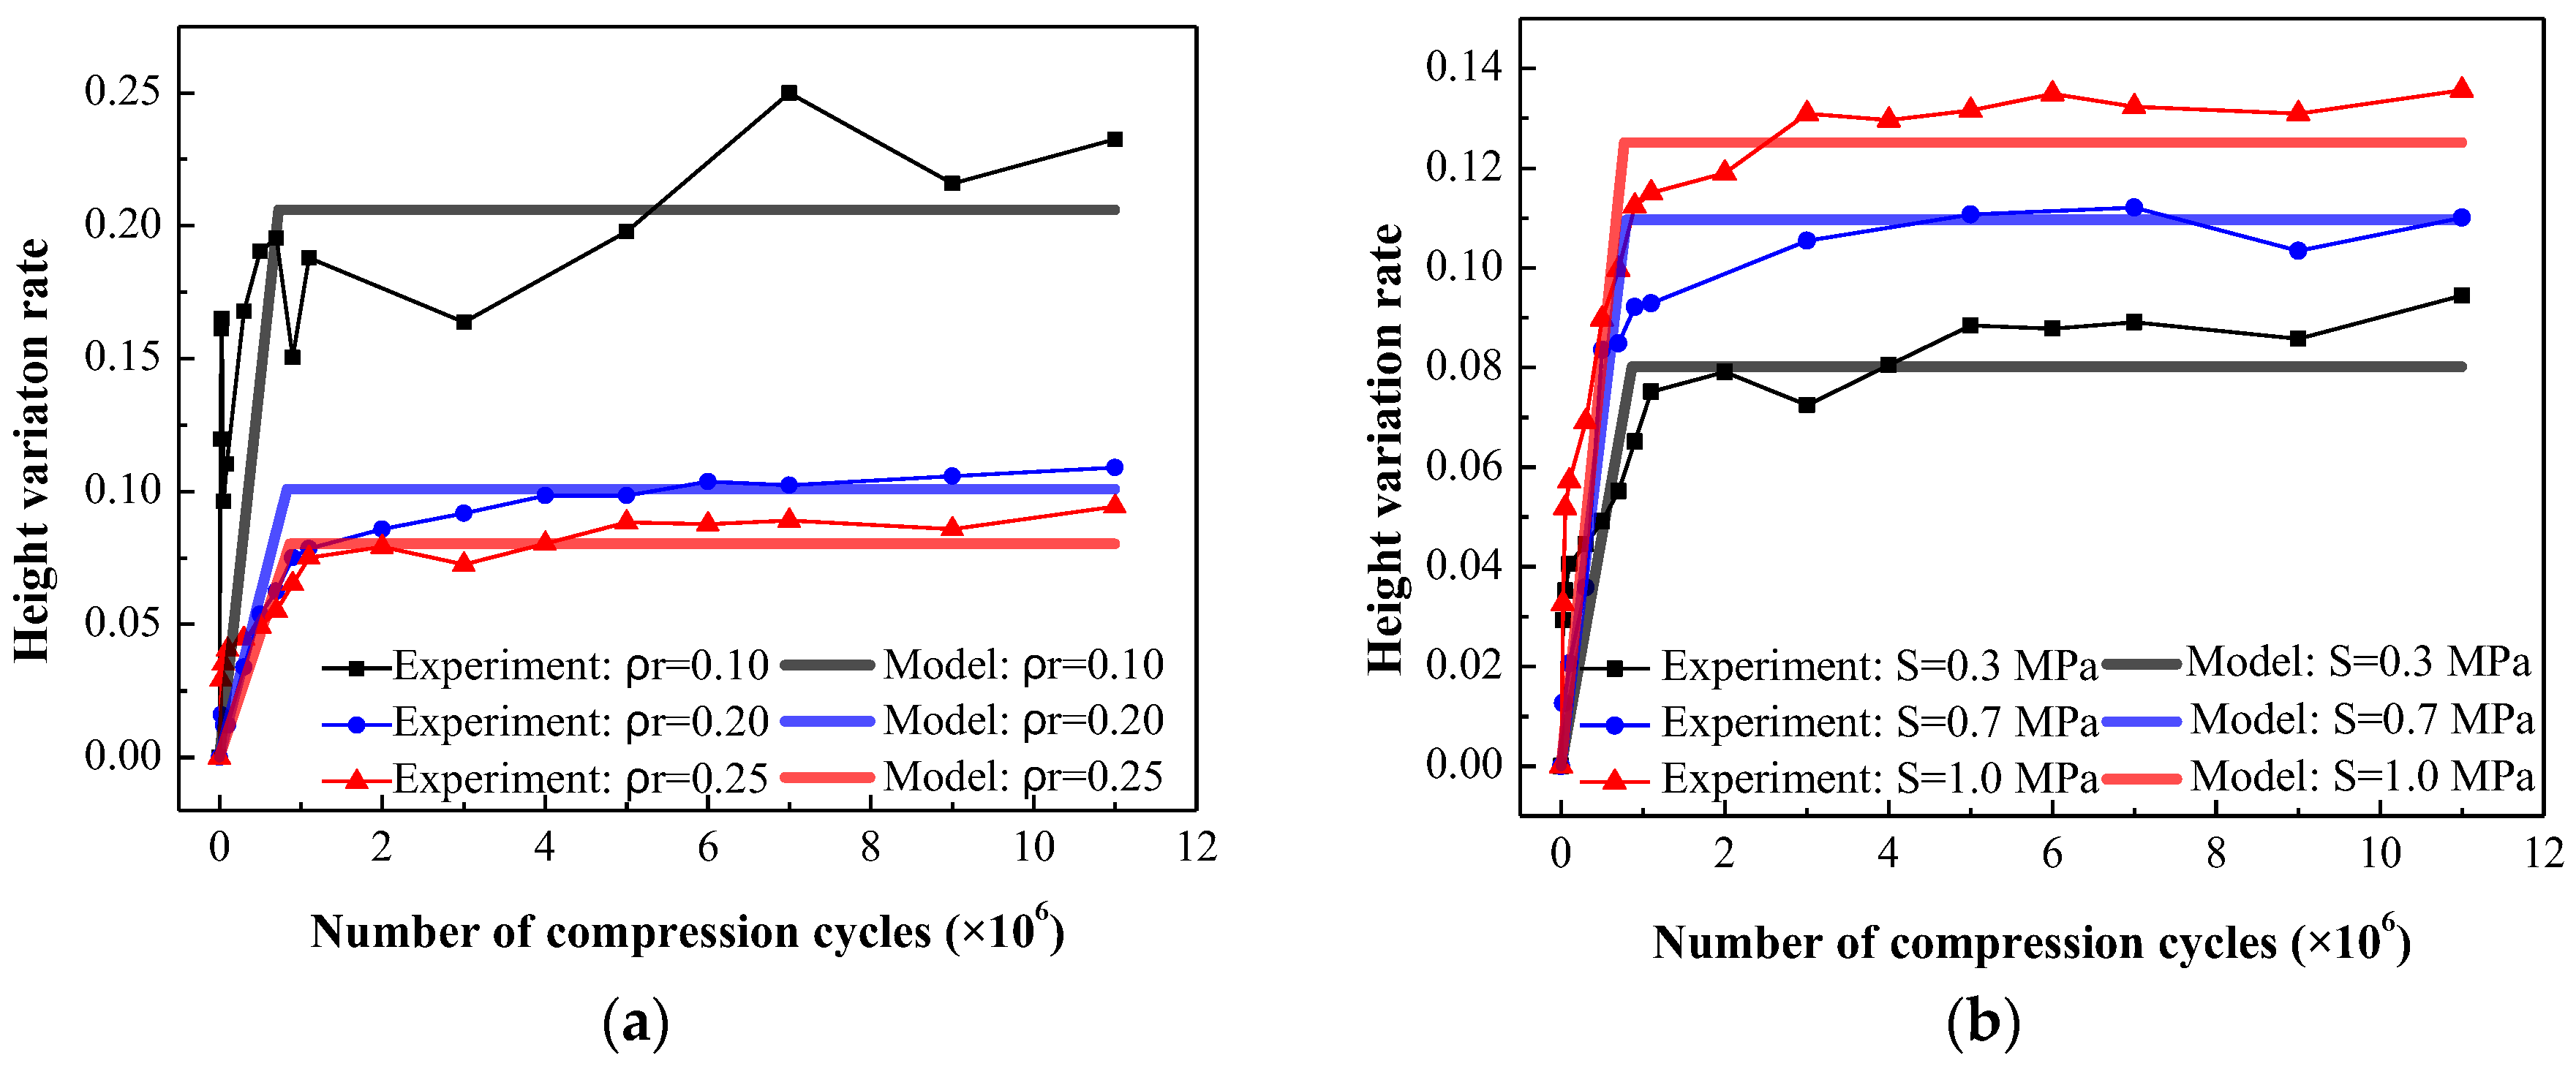
Figure 20.
Comparison between the modulus prediction model and experimental results: (a) for different relative densities, (b) under different compressive stress amplitudes.
Figure 20.
Comparison between the modulus prediction model and experimental results: (a) for different relative densities, (b) under different compressive stress amplitudes.
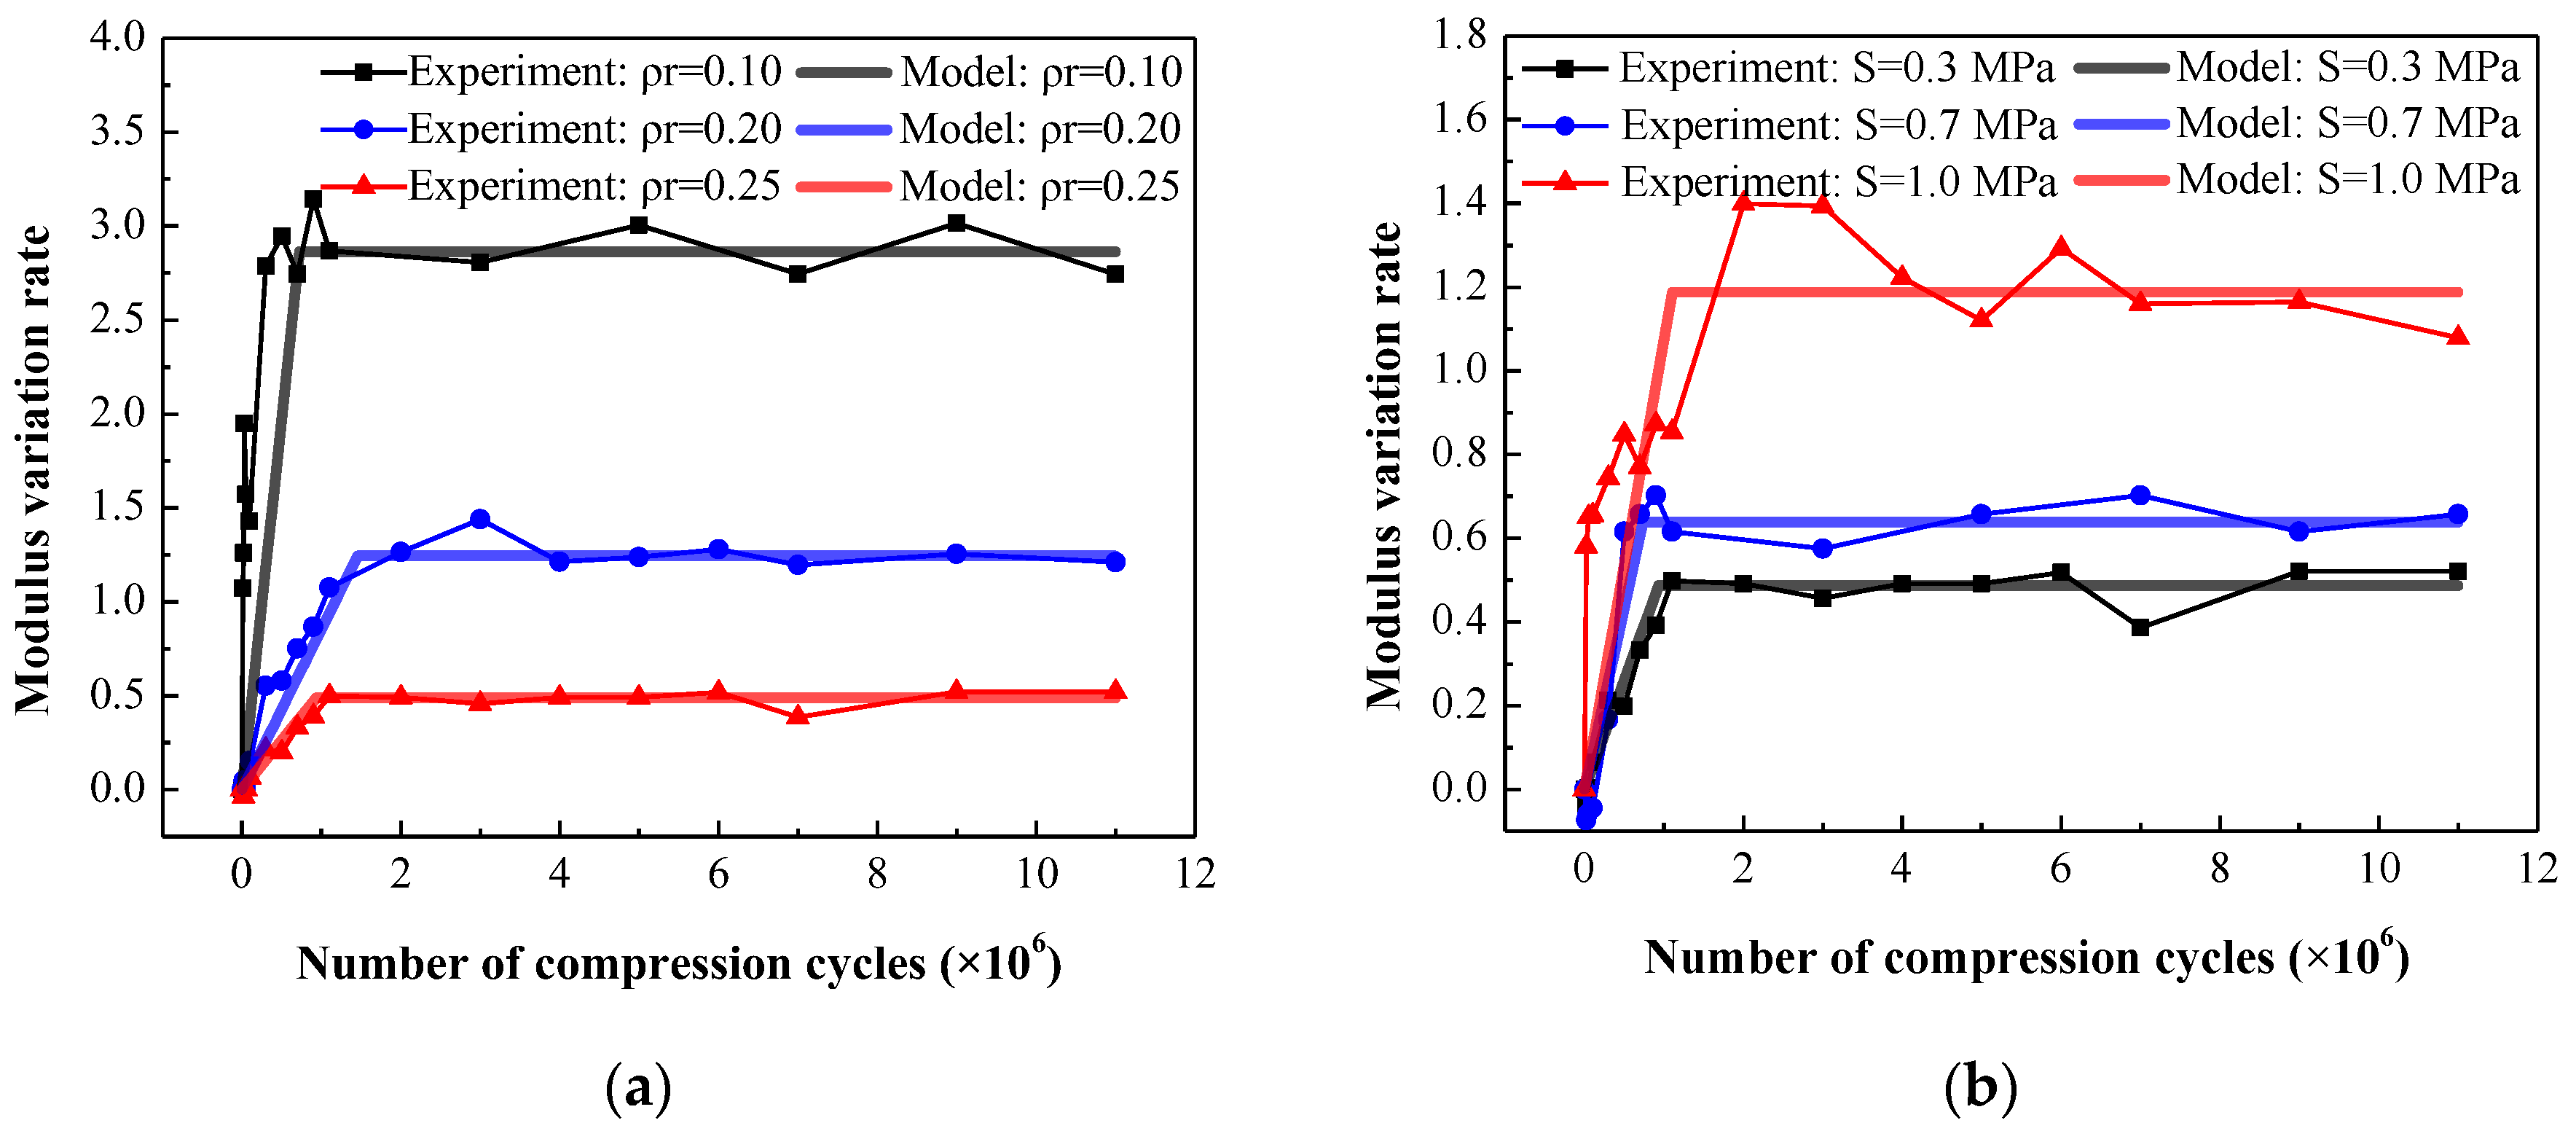
Figure 21.
Comparison between the damping prediction model and experimental results: (a) for different relative densities, (b) under different compressive stress amplitudes.
Figure 21.
Comparison between the damping prediction model and experimental results: (a) for different relative densities, (b) under different compressive stress amplitudes.
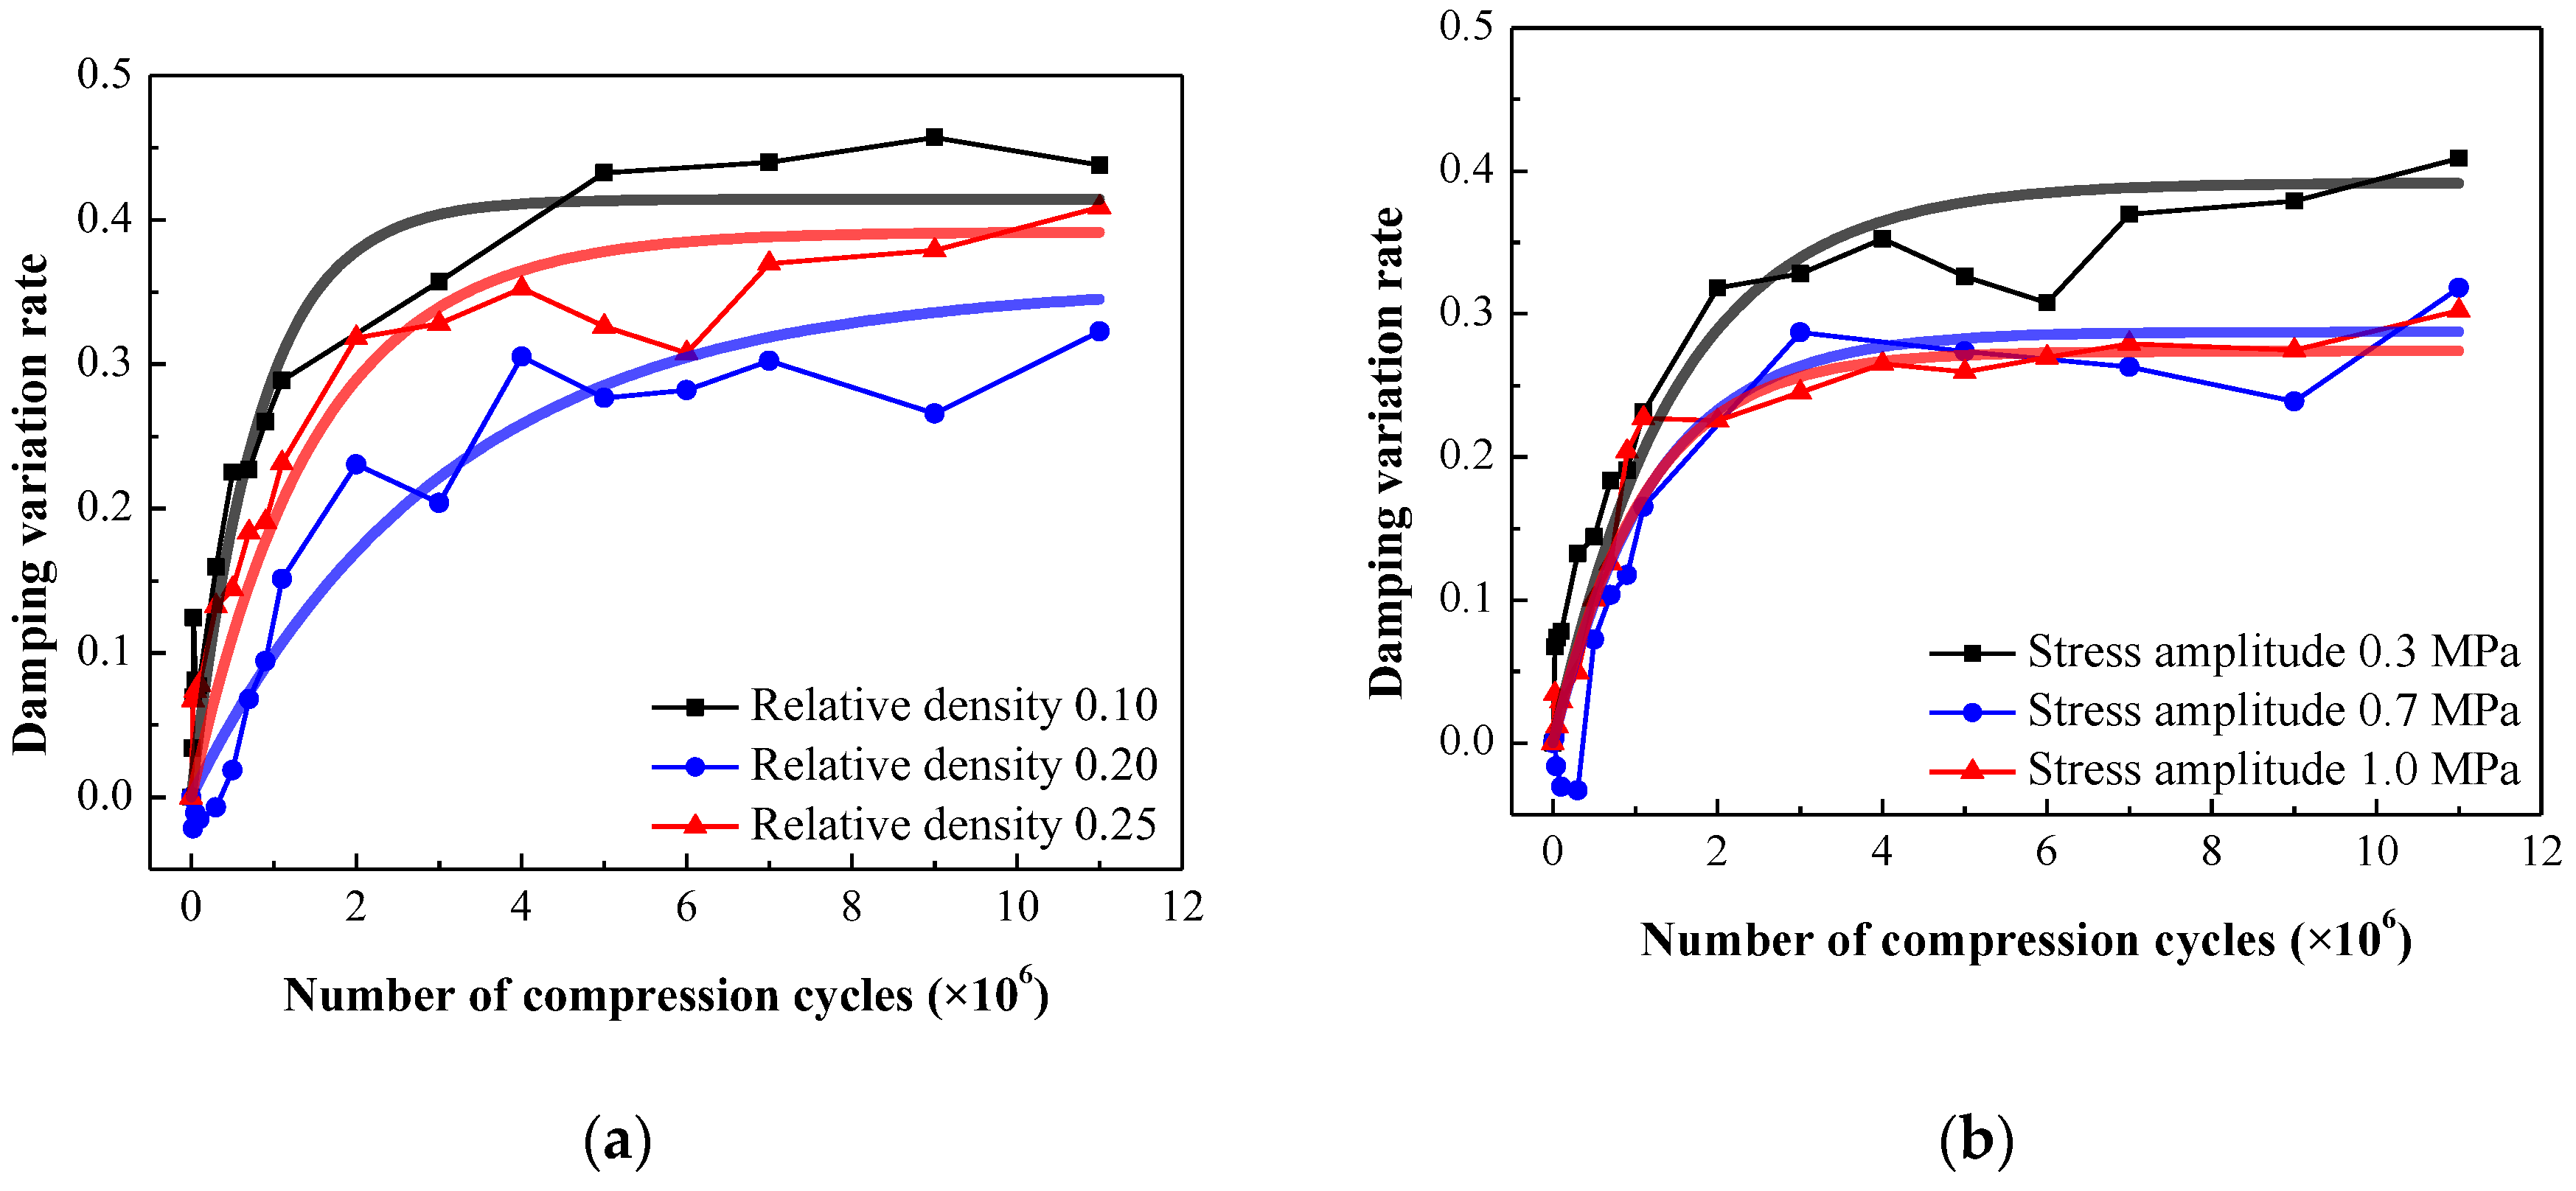

Table 1.
The manufacturing parameters of the EMWM specimens.
| Group | Pair number |
Wire diameter (mm) |
Helix diameter (mm) |
Pitch (mm) | Relative density |
Forming pressure (MPa) |
Inner diameter (mm) |
Outer diameter (mm) |
Height (mm) |
Mass (g) |
|---|---|---|---|---|---|---|---|---|---|---|
| 1 | A1 | 0.10 | 1.1 | 1.1 | 0.10 | 11.57 | 17.97 | 37.04 | 15.11 | 9.73 |
| A2 | 0.10 | 1.1 | 1.1 | 0.10 | 11.57 | 17.86 | 37.01 | 15.15 | 9.71 | |
| A3 | 0.10 | 1.1 | 1.1 | 0.10 | 11.57 | 17.93 | 37.05 | 15.20 | 9.71 | |
| B1 | 0.10 | 1.1 | 1.1 | 0.20 | 29.85 | 17.99 | 37.08 | 15.14 | 19.47 | |
| B2 | 0.10 | 1.1 | 1.1 | 0.20 | 29.85 | 18.00 | 37.08 | 15.05 | 19.47 | |
| B3 | 0.10 | 1.1 | 1.1 | 0.20 | 29.85 | 17.89 | 37.05 | 15.10 | 19.46 | |
| C1 | 0.10 | 1.1 | 1.1 | 0.25 | 48.74 | 17.92 | 37.06 | 15.13 | 24.30 | |
| C2 | 0.10 | 1.1 | 1.1 | 0.25 | 48.74 | 17.84 | 37.02 | 15.05 | 24.34 | |
| C3 | 0.10 | 1.1 | 1.1 | 0.25 | 48.74 | 17.92 | 37.02 | 15.25 | 24.31 | |
| 2 | D1 | 0.10 | 1.1 | 1.1 | 0.20 | 29.85 | 17.92 | 37.01 | 15.14 | 19.45 |
| D2 | 0.10 | 1.1 | 1.1 | 0.20 | 29.85 | 17.99 | 37.00 | 15.14 | 19.43 | |
| D3 | 0.10 | 1.1 | 1.1 | 0.20 | 29.85 | 17.87 | 37.04 | 15.22 | 19.45 | |
| E1 | 0.10 | 1.1 | 1.1 | 0.20 | 29.85 | 18.00 | 37.05 | 15.04 | 19.47 | |
| E2 | 0.10 | 1.1 | 1.1 | 0.20 | 29.85 | 17.94 | 37.05 | 15.12 | 19.43 | |
| E3 | 0.10 | 1.1 | 1.1 | 0.20 | 29.85 | 17.91 | 37.02 | 15.25 | 19.46 |
Table 2.
The slope for the linear segment of height variation rate.
| Number |
Relative density |
Stress amplitude (MPa) |
Slope |
|---|---|---|---|
| 1 | 0.10 | 0.3 | 0.2450 |
| 2 | 0.20 | 0.3 | 0.0934 |
| 3 | 0.25 | 0.3 | 0.0849 |
| 4 | 0.25 | 0.7 | 0.1144 |
| 5 | 0.25 | 1.0 | 0.1411 |
Table 3.
The threshold value of height variation rate.
| Number |
Relative density |
Stress amplitude (MPa) |
Threshold value |
|---|---|---|---|
| 1 | 0.10 | 0.3 | 0.2080 |
| 2 | 0.20 | 0.3 | 0.0971 |
| 3 | 0.25 | 0.3 | 0.0836 |
| 4 | 0.25 | 0.7 | 0.1058 |
| 5 | 0.25 | 1.0 | 0.1289 |
Table 4.
The slope for the linear segment of modulus variation rate.
| Number |
Relative density |
Stress amplitude (MPa) |
Slope |
|---|---|---|---|
| 1 | 0.10 | 0.3 | 3.8560 |
| 2 | 0.20 | 0.3 | 1.1385 |
| 3 | 0.25 | 0.3 | 0.4676 |
| 4 | 0.25 | 0.7 | 0.7842 |
| 5 | 0.25 | 1.0 | 1.2325 |
Table 5.
The threshold value of modulus variation rate.
| Number |
Relative density |
Stress amplitude (MPa) |
Threshold value |
|---|---|---|---|
| 1 | 0.10 | 0.3 | 2.8639 |
| 2 | 0.20 | 0.3 | 1.2417 |
| 3 | 0.25 | 0.3 | 0.4860 |
| 4 | 0.25 | 0.7 | 0.6374 |
| 5 | 0.25 | 1.0 | 1.1874 |
Table 6.
The coefficient and of the exponential function.
| Number |
Relative density |
Stress amplitude (MPa) |
Coefficient |
Coefficient |
|---|---|---|---|---|
| 1 | 0.10 | 0.3 | 0.4258 | -1.2213 |
| 2 | 0.20 | 0.3 | 0.3085 | -0.4680 |
| 3 | 0.25 | 0.3 | 0.3563 | -1.0453 |
| 4 | 0.25 | 0.7 | 0.2847 | -0.6333 |
| 5 | 0.25 | 1.0 | 0.2740 | -1.0896 |
Disclaimer/Publisher’s Note: The statements, opinions and data contained in all publications are solely those of the individual author(s) and contributor(s) and not of MDPI and/or the editor(s). MDPI and/or the editor(s) disclaim responsibility for any injury to people or property resulting from any ideas, methods, instructions or products referred to in the content. |
© 2023 by the authors. Licensee MDPI, Basel, Switzerland. This article is an open access article distributed under the terms and conditions of the Creative Commons Attribution (CC BY) license (http://creativecommons.org/licenses/by/4.0/).
Copyright: This open access article is published under a Creative Commons CC BY 4.0 license, which permit the free download, distribution, and reuse, provided that the author and preprint are cited in any reuse.


