Submitted:
22 September 2023
Posted:
28 September 2023
Read the latest preprint version here
Abstract
Ambitious biodiversity goals to protect 30% or more of the Earth’s surface by 2030 to prevent the most likely and imminent extinctions require strategic near-term targets. We propose Conservation Imperatives, spanning 164 Mha across 16,825 unprotected sites harboring rare and threatened species. These sites should be prioritized for conservation action over the next three to five years as part of a broader strategy to expand the global protected area network. The expansion of global protected areas between 2018–2023 incorporated only 7% of sites harboring range-limited and threatened species, highlighting a renewed urgency to conserve these habitats. Permanently protecting only 0.74% of land found in the tropics, where Conservation Imperatives sites are concentrated, at a cost of US$34 to $56 billion per year over the next 3-5 years, could prevent the majority of predicted near-term extinctions once adequately resourced. Multiple approaches could achieve this goal: providing rights and title to Indigenous Peoples and Local Communities (IPLCs) conserving traditional lands, government designation of new protected areas on federal and state lands; or land purchase and long-term leasing of privately held lands.
Keywords:
Conservation imperatives
; 30 by 30
; Protected area targets
; Rare species
; Land cover fraction mapping
; Geospatial analysis
; Land costs analysis
Introduction
In late December 2022, at the United Nations Convention on Biological Diversity’s 15th Conference of Parties (COP15), more than 190 parties adopted the 30×30 target—to protect at least 30% of the world’s lands, oceans, and inland waters by 2030 (Convention on Biological Diversity, 2022). While conservation biologists, Indigenous Peoples, science-based NGOs, corporate leaders, and other members of civil society have endorsed this target, many have advocated for accelerated action towards protecting half of the terrestrial realm to provide the best chance for humanity to reverse biodiversity loss, stabilize Earth’s climate, prevent ecosystem collapse, and avoid future pandemics (Locke, 2015; Pimm et al., 2018; Dinerstein et al., 2020; IUCN World Conservation Congress, 2021).
Either timeline must account for the urgency of preventing numerous species extinctions and extirpations of small populations that could occur before 2030 and beyond. The purpose of this paper is to: 1) make spatially explicit where to act first on a 3–5 year time horizon to reduce the probability of mass extinctions and extirpations; 2) estimate costs to put these unprotected lands under conservation stewardship; and 3) position these investments as the bulls-eye target in a global strategy to prioritize “the first one-percent” on the path to achieving at least 30% of lands and oceans conserved by 2030 (30×30). We refer to these areas as Conservation Imperatives sites, which if protected before 2028, offer an effective pathway to avoiding the sixth major extinction event in the history of life on Earth.
To prevent global extinctions, scientists have mapped endangered biodiversity and evaluated threats to many endemic taxa to predict where species loss is likely to be most swift and severe (Dinerstein et al., 2019, 2020). It has been estimated that unprotected lands harboring range-limited and threatened species cover 2.3% of the Earth’s terrestrial surface (Dinerstein et al., 2020). However, the expansion of the protected area network has failed to significantly increase coverage of threatened species ranges over the last decade (Maxwell et al., 2020). Irreplaceable biodiversity contained within unprotected lands should be prioritized for protection as ‘Conservation Imperatives’ and must be accounted for under the 30×30 target and other regional conservation initiatives (Spiliopoulou et al., 2023). Published range data for rare and threatened species contain varying amounts of agricultural, pastoral, and urban lands, making them less useful as a spatially explicit tool for target setting and protected area planning at regional scales. Recent advances in satellite imagery and classification (Gorelick et al., 2017) support more accurate land cover maps to identify developed and degraded lands contained within areas of particular importance for biodiversity at a global level.
Establishing accurate spatial delineation of Conservation Imperatives sites sets the stage for estimating the expected costs of protected area designation, while exploring various funding and protection mechanisms for specific sites. Previous assessments of costs for conservation at the global scale have relied on extrapolation of land values based on agricultural and pastoral potential (Naidoo and Iwamura, 2007; Strassburg et al., 2020). Despite recent calls for datasets reflecting the real costs of land for conservation (Coomes et al., 2018; White et al., 2022), comprehensive datasets remain unavailable. Complicating this estimation is that multiple stewardship mechanisms with different cost implications—such as private land purchase, leasing of community reserves and forests, re-establishing Indigenous land rights, and government redesignations—affect the true total costs to protect sites harboring rare species. Using actual data on costs to place land under conservation stewardship can provide a clearer approximation of the resources required to secure critical sites for biodiversity (Coomes et al., 2018).
Here we posed three questions to identify an accurate spatial representation and initial cost of the Conservation Imperatives sites while accounting for recent landscape changes affecting rare species globally. First, where are these sites located and how much natural habitat remain within them? To answer this question, we produce a new set of polygons harboring rare and threatened species and apply a fractional land cover analysis to spatially delineate the remaining areas of habitat blocks of unprotected rarity globally (UNEP-WCMC and IUCN, 2023). Second, do protected areas added during the past five years reflect an increased focus on preventing extinctions? By using recent extents from the World Database on Protected Areas (WDPA), we test the theory that newly protected lands should comprise a disproportionately large share of Conservation Imperatives sites if protected areas effectively targeted rare and threatened species. Third, how much is the cost of land required to secure the Conservation Imperatives over the next three to five years, and how do these costs differ, if at all, across biogeographic realms? We use empirical data on land purchase and lease from multiple conservation organizations and biogeographic and economic indicators to estimate land costs of the Conservation Imperatives sites for the pantropical region and within each of the seven biogeographical realms (Dinerstein et al., 2017). We then provide a starting point for ecoregion-based prioritizations within each realm, identify important caveats to our approach, and discuss mechanisms including restoration of Indigenous land rights, community forestry programs, and biodiversity credits.
Materials & Methods
Species rarity layer
We combined six widely used data layers employed in published global biodiversity assessments to identify sites holding rare and endangered species (Dinerstein et al., 2020). Using the latest dataset of global protected areas (April 2023) (UNEP-WCMC and IUCN, 2023) as our base map, we sequentially intersected polygons identified to hold rare and threatened species. These include: Alliance for Zero Extinction (AZE) sites, range-restricted rarity of forest species, the IUCN Red List, Key Biodiversity Areas (KBAs), a second estimator of range-restricted rarity among vertebrates, and range-restricted vascular plants. For more details on construction of the species rarity layer, see (Dinerstein et al., 2020)(SM Table 1). The overlap determines the remaining unprotected segment. These results were then refined using the fractional land cover analysis described below. It should be noted that governments and NGOs are periodically updating the extent and distribution of areas designated as particularly important for rare, range-limited, and threatened species, through the KBA Partnership and other efforts. This analysis uses 2018 as the reference year (Dinerstein et al., 2020).
Fractional land cover analysis
The uneven resolution of the most widely used global biodiversity layers coupled with rapid land-use change from conversion to agriculture and urbanization results in many species rarity sites now containing areas of non-habitat (i.e. some layers, such as AZE sites, are delineated at high resolution but of limited spatial extent; other layers, such as plant endemism that are much larger in area, are not). To identify and remove these non-habitat areas, we used Copernicus Global Land Cover Layers CGLS-LC100 Collection 3 at 100 m resolution (Buchhorn et al., 2020) (hereafter Copernicus data) and Google Earth Engine to generate a fractional land cover map that includes fractions of all land cover types occurring in a pixel at 100 m resolution. While higher resolution global products exist, fractional covers were used to rapidly establish an approximate extent of potential habitat outside protected areas at a global scale.
We used seven classes to create this map: Forest, Shrub, Grass, Crop, Urban, Bare ground, and Permanent Water (inland water bodies). We defined Forest using percent tree cover in the Copernicus data that varied by biome, and set cutoff levels based on expert knowledge in each biome and distinguishing ecological characteristics. Forest is defined as pixels with tree cover fraction > 80% for the Tropical forest biome, > 50% for the Temperate forest biome, and > 30% for the Boreal forest and Mangrove biomes. To differentiate desert habitat from bare ground in the Desert and Xeric shrub biome, desert is defined as > 70% bare soil and bare ground is defined as 50-69% bare soil in this biome. For all other cover types, we did not differentiate percent cover among biomes. Shrub cover is defined as pixels with shrub cover fraction ≥ 30%; Grass as grass cover fraction ≥ 50%; Bare ground as bare cover fraction ≥ 50%; Urban as urban cover fraction ≥ 10%; Permanent Water (inland) as permanent water cover fraction ≥ 30%; and Crop as cropland cover fraction >1% (to avoid any potential cultivated areas).
The species rarity layer and the fractional land cover map were overlaid to calculate the contribution by different cover types to unprotected polygons. To calculate the area of habitat (AOH) (Brooks et al., 2019) of remaining habitat in species rarity sites, we created a filter by masking all land in the Crop, Urban, and Bare ground cover types. We recognize that crops and bare ground can represent suitable habitat for a fraction of species that are threatened or have restricted ranges, but evaluating these individual species’ requirements is beyond the scope of a global assessment. In instances where the fractional land cover analysis resulted in small isolated fragments of rare species habitat surrounded by developed/cultivated land, fragments smaller than 1 ha were removed, as the potential for these lands to be converted in the near future would be quite high. Finally, we overlaid the resulting species rarity layer with the world’s 846 terrestrial ecoregion boundaries to identify Conservation Imperatives sites (Dinerstein et al., 2017)
The role of newly created protected areas in addressing area of habitat (AOH) for rare and threatened species and populations
We predicted that the increased focus on global extinction of species would result in many new sites where such species and populations occur to have their AOH placed under protection. Specifically, we expected new reserves created between 2018-2023 to cover > 50% of the rarity sites. To test this prediction, we intersected the Conservation Imperative site polygons with the most recent map of the WDPA (April 2023) (UNEP-WCMC and IUCN, 2023). This comparison gives us an estimate of whether the increases in the global protected area estate over the last five years has effectively addressed those rare and endemic species exposed to the greatest risks of extinction. We used IUCN protected area categories of 1-7. While there is debate in the conservation literature over inclusion of categories 5-7 for biodiversity conservation, our data can be further reanalyzed to restrict consideration of only categories 1-4. We chose a more inclusive approach for this global analysis.
Cost assessment
To estimate the cost of placing Conservation Imperative sites under conservation in the tropical belt, we collected empirical data from land protection projects occurring between 2008 and 2022, fit generalized linear regression models, and applied a simulation approach. Our dataset consisted of 1,016 projects compiled from IUCN Netherlands, the Quick Response Fund for Nature, and World Land Trust (Quick Response Fund for Nature, n.d.), supplemented by unpublished data from other NGOs focused on land purchase that met our criteria for inclusion. These organizations regularly fund land acquisition, designation and protection projects globally, and all with a higher concentration in the tropics. This portfolio includes a range of projects, including expansion of existing parks and community reserves, establishment of private conservation areas, and creation of community forest reserves. Acquisition costs cover the purchase price and legal and notary fees that comprised up to 10% of the total cost. For leased land projects of varying lengths, we calculated an annual value and then extrapolated the cost per hectare under a 10-year lease, equivalent to the median lease length in the dataset. This puts leases on the same scale as purchase values but assumes that a 10-year lease would be enough to secure the site while efforts are made for a more permanent solution. All costs were converted to 2022 US dollars, and we accounted for inflation in our calculations. We then extracted biogeographical information on the ecoregion, biome, and realm of each project (Dinerstein et al., 2017). We removed projects with incomplete information on location, purchase cost, purchase size, and lease length. After cleaning the dataset, the remaining locations contained 833 sites distributed across all 6 major realms and 14 biomes (SM Figure 1).
We next fit linear regression models to the empirical cost per hectare of land protection projects. We used a log transformation on cost per hectare values to reduce skew and create an approximately normal distribution. We hypothesized that land value could be influenced by biogeographical realm, region, the area of land being secured, type of land acquisition, and country-level economic factors (Tulloch et al., 2021). We used the following covariates as predictors: realm; size of acquisition; type of acquisition (categorized into purchase or lease); national per capita GDP; and country population size. All continuous covariates were scaled and centered for interpretation. While attributes such as accessibility and agricultural value can also drive pricing, these aspects require localized data that is unavailable globally. The mean per capita GDP and population was extracted based on the country in which the project began that fell between 2010 and 2020 (World Bank, 2022). A random effect for data source was added to account for possible variation between the different groups that supplied project data. We fit candidate models and used Akaike Information Criterion and conditional R2 values to select the most informative model for land value (Burnham and Anderson, 2004) (MuMin R Package).
To calculate the price to place Conservation Imperatives sites under conservation stewardship, we used Monte Carlo Simulations (Mooney, 1997) to estimate cost per hectare and total land value of all sites under simulated purchase scenarios. Each simulation used the land value model to predict the cost per hectare of each Conservation Imperatives site using random values for acquisition size (assuming multiple smaller purchases would be needed to secure large sites), acquisition type (assuming a mix of purchase and lease), and data source, and determined land value by multiplying the predicted cost per hectare by the known size of the site. We ran 10,000 simulations with random values drawn from distributions parameterized by realm. Total cost estimates were calculated as the mean across all simulations, and we used 90% probability distributions to measure uncertainty. We used this approach to determine the total cost to place all Conservation Imperative sites in the tropical belt under conservation stewardship. We then identified the top 10 ecoregions in each realm harboring the most Conservation Imperative sites and assessed the price to conserve unprotected lands in each ecoregion. We converted all results to US dollars per square kilometer to keep units comparable to the fractional analysis. Code used for model fitting and simulation can be found in the supplementary materials.
Results
After converted and heavily degraded lands were removed from the extent of potential habitat areas, we identified 16,825 sites harboring rare and threatened species, covering 164 Mha or 1.22% of the Earth’s land surface (Figure 1). This actual AOH represents a reduction of 46% versus earlier estimates based on published compilation of identified areas of importance for rare and threatened species (e.g. KBAs, Red List sites, etc.). Most of these reductions occurred in larger blocks of unprotected habitat rather than in smaller fragments. For example, the median area reduction per polygon for Alliance for Zero Extinction sites was only 27 km2, as these sites typically included only AOH. In contrast, the median area reduction per polygon for rare and endemic plant species from application of the fractional land cover analysis was 668 km2 as these were delineated at larger spatial scales and thus incorporated more non-habitat areas.
Reduction in total AOH harboring unprotected rarity also differed by latitude and by biome. In the four major tropical realms, we found a 45% reduction in total land area. In the non-tropical realms, we estimated a 49% reduction in area (Table 1). Within biomes that comprise the tropical realms, tropical and subtropical dry broadleaf forests underwent the largest reduction in target habitat (77%), followed by tropical and subtropical coniferous forests (58%). Tropical and subtropical moist broadleaf forests, which contained the highest concentration (75%) of Conservation Imperatives sites, had a 49% reduction in area (Figure 2; Table 2).

Table 1.
Extent of habitat by biogeographical realm after applying fractional land cover to species rarity sites and removing non-habitat area.
Table 1.
Extent of habitat by biogeographical realm after applying fractional land cover to species rarity sites and removing non-habitat area.
| Realm | Forested habitat (km2) | Non-forested habitat (km2) | Total habitat (km2) | % habitat reduction* |
|---|---|---|---|---|
| Afrotropic | 65,301 | 350,050 | 415,351 | 32% |
| Australasia | 180,550 | 37,066 | 217,616 | 36% |
| Indomalayan | 150,262 | 4,662 | 154,924 | 56% |
| Nearctic | 17,512 | 23,501 | 41,012 | 49% |
| Neotropic | 174,945 | 137,045 | 311,990 | 54% |
| Oceania | 1,766 | 241 | 2,007 | 84% |
| Palearctic | 73,220 | 423,791 | 497,010 | 49% |
| Total | 663,556 | 976,355 | 1,639,911 | 46% |
* Approximate reduction of unprotected rare and threatened species areas from 2019 levels, versus total area extent from newly compiled data sets.
Conservation Imperative sites are highly concentrated. We found a distinct skew in the distribution of the 16,825 sites harboring unprotected rarity across biogeographic realms and biomes (Figure 1; Table 3 and Table 4; SM Table 2): Eighty-nine percent of the unprotected sites occurred in the four main tropical realms, led by the Neotropics (36%), followed by the Indomalayan (27%), Australasian (15%), and Afrotropical (11%) realms. Among the tropical realms, the Afrotropics contained the most habitat by land area (25% of Conservation Imperatives habitat), while the Indomalayan realm had the least amount of habitat (9%). By biome, the vast majority of Conservation Imperatives sites occurred in the tropical and subtropical moist forests biome (75%) while the remaining 13 biomes ranged from 0–4%. Viewed through the intersection of biomes and realms, the majority of unprotected sites fall within the tropical and subtropical moist forests biome in the Neotropical realm (38% of all Conservation Imperatives sites), followed by the Indomalayan (34%), Australasian (18%), and Afrotropical (9%) realms. Sorted by ecoregion, the top ten ecoregions with the most Conservation Imperative sites within each of the four major tropical realms hold 57% of all sites globally (Figure 3, Table 5). The top five countries in the world with the highest number of Conservation Imperative sites include the Philippines, Brazil, Indonesia, Madagascar, and Colombia, together accounting for 59% of all sites globally. Over 87% of all Conservation Imperative sites occur in just 30 countries (Table 6).
Between 2018 and 2023, an estimate of 1.2 million km2 was added to the global protected area estate (UNEP-WCMC and IUCN, 2023). Of that, the largest extent was located in two ecoregions (#473 Japura-Solimões-Negro Moist Forests and #831 North Arabian Desert, totaling 192,000 km2), but based on our analysis these additions had very little overlap with areas harboring rare and threatened species. In fact, over that same period only 109,779 km2, or less than 7% of identified rare and threatened species sites, have been added to the World Database on Protected Areas (Figure 4), leaving the vast majority of these sites at risk of conversion and degradation.
The model of land acquisition costs per hectare included realm, purchase type, purchase size, per capita GDP, and population size performed best and had an R2 of 0.76 (SM Table 3). Among the variables we tested, acquisition size (-0.67, 95% CI [-0.71, -0.64]; larger acquisitions had lower per-ha costs), acquisition type (0.97, 95% CI [0.66, 1.28]; purchases were more expensive than leases), and realm were the most useful predictors, and explained much of the model variation on their own. We also found that higher per capita GDP (0.18, 95% CI [0.07, 0.28]) and human population density (0.03, 95% CI [0.02, 0.08]) increased land prices (SM Table 3).
In Monte Carlo Simulations of the cost of placing unprotected habitat under conservation, we found that total land costs of the Conservation Imperatives sites in the tropics are US$169 billion, with a 90% probability between US$146 and $228 billion, assuming variations in the size and type of land acquisitions (purchases and leases) (SM Figure 2). In terms of costs, land transfer was cheapest in Australasia and most expensive in Indomalaya, but somewhat similar in the other realms (Table 7, SM Figure 2b). The Afrotropical, Indomalayan, and Neotropical realms showed the largest variation in predicted total cost, which appeared to arise from larger cost differences between lease arrangements and purchases and the number of sites that were either leased or purchased in each simulation (SM Figure 2). Land costs for the top ten ecoregions—ranked by number of species rarity sites—from each of the four major tropical realms would be US$59.4 billion (90% probability of US$29–$108 billion) and safeguard 63% of all sites (Figure 4; Table 5). To cover Conservation Imperatives at all latitudes, the total cost increases to US$263 billion (90% probability of US$204–339 billion).
Discussion
Three key insights emerging from this study elevate the need to prioritize the conservation of rare and threatened species habitat as an urgent near-term target within a larger global biodiversity strategy: 1) Conservation Imperatives sites identified in this study represent a mere 1.2% of the Earth’s terrestrial surface but contain species likely to experience high extinction risk, and thus should be a central component of the 30×30 goals for all countries; 2) Efforts to establish new protected areas have failed to reduce the risks to unprotected rare species; and 3) Financial costs appear to be reasonable, especially in the Neotropics, where ecoregions contain the largest number of species rarity sites.
Why have sites harboring rarity and impending global extinction been overlooked? Numerous studies have shown that the goals of stabilizing Earth’s climate and reversing biodiversity loss are interdependent (Arneth et al., 2020; Dinerstein et al., 2020; Shin et al., 2022). Efforts and investments to address the climate crisis have overshadowed the attention governments and intergovernmental processes have paid to the biodiversity crisis. The recent Biodiversity COP held in Montreal, Canada in December 2022 (Convention on Biological Diversity, 2022) was an important milestone, helping spur more urgent and ambitious efforts to protect biodiversity. The COP also linked nature conservation with climate interventions that maintain the Earth’s forest cover and carbon sinks, sometimes referred to as nature-based climate solutions (IUCN, 2020). Major investments to prevent forest conversion in carbon-rich regions, such as the Amazon Basin, the Congo Basin, and boreal regions are certainly essential and must be given a high priority as some of the last remaining wilderness areas. However, many carbon-rich regions have relatively few narrow-range endemics and threatened species.
Targeted investments in preventing extinction in parallel with the conservation of carbon-rich regions are necessary. Given the limited extent of unprotected rare species areas, the two strategies are easily complementary as the world sets about to expand the protected area network from 17% today to 30% by 2030. Given the rapid trend of land conversion near Conservation Imperatives sites, we recommend an initial prioritization of these sites, where possible.
The performance of the global protected area network allocated to concentrations of rarity has come under some scrutiny. Several studies have pointed out that protected terrestrial areas recorded in the World’s Database on Protected Areas (WDPA) have performed well, at least on paper, for containing a large fraction of populations representing the Earth’s rare species (Pimm et al., 2014). Other analyses point to a pattern where the addition of new protected areas to the global coverage are largely attributable to areas characterized by low agricultural productivity (Venter et al., 2018), and have had limited success at protecting threatened species (Maxwell et al., 2020) .
Our results corroborate observations that conservation efforts are failing to target regions rich in rare species. Only 8.8% of the 1.2 million km2 added to the global protected area estate over the past five years covered unprotected species rarity sites. Between 2018 and 2023, moreover, only 7% of Conservation Imperatives sites had been added to the protected areas network. These findings are discouraging given the various analyses that point out conservation priorities and the combined efforts of international and local conservation NGOs, foundations, and government agencies to increase protected area coverage and avoid extinctions and extirpations of species represented by small populations.
Only 2.4% of newly created protected areas added to the WDPA were in the tropical and subtropical moist forest biome containing by far the highest numbers of Conservation Imperative areas. In contrast, 69% of protection occurred in the Temperate broadleaf and mixed forests biome, 14% in Boreal forest/taiga, and 6% in temperate conifer forests – none of which contain high numbers of Conservation Imperative areas. As a result, targeted effort is now required to secure the remaining fraction of rare unprotected species, before more land conversion occurs, and without leaving to chance the selection of new protected areas.
The analyses presented here suggest that a targeted global strategy aimed at preventing extinctions is affordable and achievable. This analysis reduces the previous total terrestrial land area containing irreplaceable species to 1.22% globally and 0.74% in the tropics. The modest extent of these areas should make the expected cost of Conservation Imperatives far more achievable over a short time period. If the next three to five years of biodiversity conservation strategy were focused on protecting the Conservation Imperatives, the worst of all possible outcomes for extinction would be averted or blunted. Unfortunately, by narrowing the amount of remaining unprotected habitat for species rarity in the tropical belt to 0.74% of Earth’s terrestrial surface, we have greatly diminished opportunities to protect these species. This further demonstrates the urgency of rapid designation of Conservation Imperatives sites.
Using the unprotected sites of rarity identified in this analysis, a starting strategy that targets the ten ecoregions within each of the four tropical realms that contain the highest number of sites could add 57% of all identified sites under conservation stewardship and represent 12 different biomes. With the geographic concentration of Conservation Imperative sites, this approach will retain representation across distinct biomes and realms. The land value for those sites is estimated at US$59 billion. Focusing more narrowly on the ten Neotropical ecoregions containing the largest number of Conservation Imperatives sites would represent 23% of all identified sites, which involve a land acquisition cost of US$2.4 billion/year for three years in this realm. Several studies have suggested that up to US$224 billion per year for 10 years would be needed to protect nature globally (Waldron et al., 2020). The Conservation Imperatives could help focus these investments in the next two to five years to protect sites where irreplaceable biodiversity is concentrated while allowing individual nation states to formulate longer-term strategies to address less threatened taxa, habitats, and ecological processes.
While land purchase or leasing values provide a starting point for costs, a diversity of approaches will be needed to secure protection of Conservation Imperatives. Whereas traditional land trust models focus on purchase of land for private management, options such as community reserves, government re-designations, private sector commitments, and other effective conservation measures (OECMs) may be more effective, less costly, and more sustainable. Of course, where national governments incorporate creation of new protected areas into their sovereign biodiversity strategies as a unique contribution, the global cost of initial protection of the Conservation Imperatives sites would drop dramatically.
The available data on land prices at a global level created some limitations in cost estimates. Namely, localized factors such as road densities, soil fertility, and existing infrastructure can affect prices, but this high-resolution data was not available globally and many of the projects in our database lacked detailed location information. An expanded cost database on land protection projects could help address this information gap, as others have called for (Coomes et al., 2018). Immediate and ongoing protected area implementation and management costs are also a major factor when considering the total expenditure of protecting sites, but these costs depend heavily on site-level factors such as restoration needs, site security and law enforcement, and the type of conservation stewardship. There have been attempts at the regional level to establish ongoing conservation management costs (da Silva et al., 2022), but future efforts need to bring together records of annual expenditures across a range of conservation measures by region in order to create global-scale cost model. For this reason, we chose to focus on land acquisition costs as a first step to expanding the protection of lands harboring rare and threatened species.
Land acquisitions to create protected areas have been successful across a range of countries, which is realized in the dataset collected for this paper. Our dataset spans 938 projects representing 1 million hectares of land acquired to create new protected areas or expand existing ones. Projects can also leverage additional funding to extend impact; For example, the Quick Response Biodiversity Fund unlocked US$14 of additional funding for every US$1 raised. These projects also ranged in the type of protection, including private reserves, community conservancies, and community forests. These projects were also relatively small purchases, with a median purchase size of 67.5 hectares. These smaller purchases, generally with a single landowner or small set of landowners, are well-suited for many Conservation Imperatives (median size of 87.6 hectares), where large protected areas and land redesignations may be difficult to achieve without uprooting people and are not necessarily required. It should be noted that geographic coverage of the project database was concentrated in Latin America and Africa. According to the organizations that shared data, this is partly because restrictions on land ownership laws and higher land costs limit project opportunities in other regions of the tropics.
As the best conservation strategy will depend on site conditions and land tenure, much of the work to secure Conservation Imperatives will depend on close collaboration with local groups, communities, and governments. For example, 17% of Conservation Imperatives sites are located within current and historical Indigenous lands. Indigenous Peoples and local communities have been among the most effective stewards of biodiversity and recognition of land rights can play an outsized role in protecting people and biodiversity (Ban et al., 2018; Dinerstein et al., 2020; Dawson et al., 2021; Duarte et al., 2023). Resource management by local communities can further secure the protection of millions of hectares of critical habitat within sustainable-use forest reserves, such as Amazonian floodplains (Campos-Silva and Peres, 2016), with the added bonus of raising thousands of local households above the poverty line (Campos-Silva et al., 2021). Where this strategy is appropriate, funding through conservation payments could provide a viable means to pay for site protection and restoration (Börner et al., 2010; Zander and Garnett, 2011).
Corporate and government stated financial commitments to address biodiversity and ecosystem loss have also become increasingly popular, and large-scale commitments were made at CBD-COP15 to reach 30% protection by 2030 (Naik and Rueedi, 2022; The Nature Conservancy, 2022). Many companies have recently announced pledges to protect, conserve and restore large land areas. However, these commitments must translate into meaningful commitments for sustainable financing and investment in land protection among corporate sectors. In response to these commitments, the conservation community must be prepared to offer scientifically robust and spatially explicit strategies that protect biodiversity and account for rarity and urgency. As Conservation Imperatives sites represent the most biologically important and threatened places to protect within the 30×30 framework, they can serve as a starting point to guide biodiversity protection commitments from the public and private sector. They can also act as “anchor points” or connectivity nodes in comprehensive conservation planning efforts. Multicriteria analysis and decision-making platforms can utilize Conservation Imperative sites to optimize broader strategies for designing compact and connected protected area networks at the national, ecoregional or subnational levels (Zhang et al., 2021).
Efforts to reach the 30×30 goal will incur long-term costs for protection and restoration. The Conservation Imperatives can support the proper valuation of conservation-related payments through mechanisms such as REDD+ carbon credits, Payments for Ecosystem Services (PES), and Voluntary Biodiversity Credits (VBCs or “biocredits”), allowing such regimes to have a positive impact on rare and threatened species. Biocredits are relatively new, and there are numerous approaches to attributing specific biodiversity values to defined spatial extents. Regardless of the approach, a greater value could be assigned to VBCs that overlap with Conservation Imperatives sites, as these sites, by definition, remain unprotected and harbor rare and threatened biota. Using the Conservation Imperatives map to inform credit issuances could also help to address the problem of additionality. Credits issuances could correspond to habitats that face a threat of conversion leading to the loss of the endemic and rare species that inhabit them. Credits could also incentivize habitat restoration in locations adjacent to Conservation Imperatives sites, thereby reducing the risk of extinction that species may face from habitat loss. High-resolution, high-frequency satellite monitoring could assess the validity of these biodiversity credits, as could low-cost, real-time AI-embedded camera-alert systems incorporated into community-based monitoring protocols.
Conservation Imperatives can contribute towards a science-based approach to prioritizing specific sites as part of the process of expanding the global protected area network to at least 30% by 2030, in line with ambitious targets set forth in the Kunming-Montreal Global Biodiversity Framework. They also respond to the urgency of the extinction crisis we now face. The Earth’s threatened terrestrial biota cannot endure another five years like they have in the previous half-decade. Acquiring and financing Conservation Imperatives sites will keep the focus on what we need to do first to save thousands of species from extinction.
Supplementary Materials
The following supporting information can be downloaded at the website of this paper posted on Preprints.org.
Acknowledgements
This paper is dedicated to a visionary in biodiversity conservation, Dr. Thomas Lovejoy, friend of wild nature, colleague, mentor, inspiration to us all. We would like to thank R. Naidoo, S. Butchart, and S. Pimm, for helpful comments on the manuscript. We thank N. D. Burgess and A. Arnell at UNEP-WCMC for providing support and verification to the use of World Database of Protected Area data in the analysis and valuable editorial comments. The findings and perspectives in this paper do not necessarily reflect the position of Planet Labs PBC.
References
- Arneth, A., Shin, Y.-J., Leadley, P., Rondinini, C., Bukvareva, E., Kolb, M., et al. Post-2020 biodiversity targets need to embrace climate change. Proc. Natl. Acad. Sci. 2020, 117, 30882–30891. [CrossRef] [PubMed]
- Ban, N. C., Frid, A., Reid, M., Edgar, B., Shaw, D., and Siwallace, P. Incorporate Indigenous perspectives for impactful research and effective management. Nat. Ecol. Evol. 2018, 2, 1680–1683. [CrossRef]
- Birdlife International (2018). Digital boundaries of Key Biodiversity Areas from the World Database of Key Biodiversity Areas.
- Börner, J., Wunder, S., Wertz-Kanounnikoff, S., Tito, M. R., Pereira, L., and Nascimento, N. (2010). Direct conservation payments in the Brazilian Amazon: Scope and equity implications. Ecol. Econ. 69, 1272–1282.
- Brooks, T. M., Pimm, S. L., Akçakaya, H. R., Buchanan, G. M., Butchart, S. H. M., Foden, W., et al. Measuring terrestrial area of habitat (AOH) and its utility for the IUCN Red List. Trends Ecol. Evol. 2019, 34, 977–986. [CrossRef] [PubMed]
- Buchhorn, M., Smets, B., Bertels, L., De Roo, B., Lesiv, M., Tsendbazar, N.-E., et al. (2020). Copernicus global land service: Land cover 100m: collection 3: epoch 2019: Globe. Version V3. 0.1.
- Burnham, K. P., and Anderson, D. R. (2004). Multimodel inference: understanding AIC and BIC in model selection. Sociol. Methods Res. 33, 261–304.
- Campos-Silva, J. V., and Peres, C. A. (2016). Community-based management induces rapid recovery of a high-value tropical freshwater fishery. Sci. Rep. 6, 34745.
- Campos-Silva, J. V, Peres, C. A., Hawes, J. E., Haugaasen, T., Freitas, C. T., Ladle, R. J., et al. Sustainable-use protected areas catalyze enhanced livelihoods in rural Amazonia. Proc. Natl. Acad. Sci. 2021, 118, e2105480118. [CrossRef]
- Convention on Biological Diversity (2022). COP15: Nations adopt four goals, 23 targets for 2030 in landmark UN biodiversity agreement. Off. CBD Press Release. Available online: https://www.cbd.int/article/cop15-cbd-press-release-final-19dec2022.
- Coomes, O. T., MacDonald, G. K., and de Waroux, Y. le P. (2018). Geospatial land price data: A public good for global change science and policy. Bioscience 68, 481–484.
- da Silva, J. M. C., Barbosa, L. C. F., Topf, J., Vieira, I. C. G., and Scarano, F. R. Minimum costs to conserve 80% of the Brazilian Amazon. Perspect. Ecol. Conserv. 2022, 20, 216–222.
- Dawson, N. M., Coolsaet, B., Sterling, E. J., Loveridge, R., Gross-Camp, N. D., Wongbusarakum, S., et al. (2021). The role of Indigenous peoples and local communities in effective and equitable conservation.
- Dinerstein, E., Joshi, A. R., Vynne, C., Lee, A. T. L., Pharand-Deschênes, F., França, M., et al. A “Global Safety Net” to reverse biodiversity loss and stabilize Earth’s climate. Sci. Adv. 2020, 6, eabb2824. [CrossRef]
- Dinerstein, E., Olson, D., Joshi, A., Vynne, C., Burgess, N. D., Wikramanayake, E., et al. An ecoregion-based approach to protecting half the terrestrial realm. Bioscience 2017, 67, 534–545. [CrossRef]
- Dinerstein, E., Vynne, C., Sala, E., Joshi, A. R., Fernando, S., Lovejoy, T. E., et al. (2019). A global deal for nature: guiding principles, milestones, and targets. Sci. Adv. 5, eaaw2869.
- Duarte, D. P., Peres, C. A., Perdomo, E. F. C., Guizar-Coutiño, A., and Nelson, B. W. Reducing natural vegetation loss in Amazonia critically depends on the formal recognition of indigenous lands. Biol. Conserv. 2023, 279, 109936. [CrossRef]
- Ellis, E. C., Klein Goldewijk, K., Siebert, S., Lightman, D., and Ramankutty, N. Anthropogenic transformation of the biomes, 1700 to 2000. Glob. Ecol. Biogeogr. 2010, 19, 589–606. [CrossRef]
- Enquist, B. J., Feng, X., Boyle, B., Maitner, B., Newman, E. A., Jørgensen, P. M., et al. (2019). The commonness of rarity: Global and future distribution of rarity across land plants. Sci. Adv. 5, eaaz0414.
- Gorelick, N., Hancher, M., Dixon, M., Ilyushchenko, S., Thau, D., and Moore, R. Google Earth Engine: Planetary-scale geospatial analysis for everyone. Remote Sens. Environ. 2017, 202, 18–27. [CrossRef]
- Hansen, M. C., Potapov, P. V, Moore, R., Hancher, M., Turubanova, S. A., Tyukavina, A., et al. High-resolution global maps of 21st-century forest cover change. Science 2013, 342, 850–853. [CrossRef]
- Hill, S. L. L., Arnell, A., Maney, C., Butchart, S. H. M., Hilton-Taylor, C., Ciciarelli, C., et al. Measuring forest biodiversity status and changes globally. Front. For. Glob. Chang. 2019, 2, 70.
- IUCN (2020). Global Standard for Nature-based Solutions. A user-friendly framework for the verification, design and scaling up of NbS. Gland, Switzerland.
- IUCN World Conservation Congress (2021). 101 - Setting area-based conservation targets based on evidence of what nature and people need to thrive. in (Marseille). Available online: https://www.iucncongress2020.org/motion/101.
- Locke, H. (2015). Nature needs (at least) half: a necessary new agenda for protected areas. Prot. wild Park. wilderness, Found. Conserv., 3–15.
- Maxwell, S. L., Cazalis, V., Dudley, N., Hoffmann, M., Rodrigues, A. S. L., Stolton, S., et al. Area-based conservation in the twenty-first century. Nature 2020, 586, 217–227.
- Mooney, C. Z. (1997). Monte carlo simulation, Sage.
- Naidoo, R., and Iwamura, T. (2007). Global-scale mapping of economic benefits from agricultural lands: Implications for conservation priorities. Biol. Conserv. 140, 40–49.
- Naik, G., and Rueedi, J. (2022). Nature is climbing the agenda, but corporate biodiversity commitments remain rare. Sustain. Yearb. Available online: https://www.spglobal.com/esg/csa/yearbook/articles/nature-is-climbing-the-agenda-but-corporate-biodiversity-commitments-remain-rare (accessed on 9 May 2023).
- Pimm, S. L., Jenkins, C. N., Abell, R., Brooks, T. M., Gittleman, J. L., Joppa, L. N., et al. (2014). The biodiversity of species and their rates of extinction, distribution, and protection. Science (80-. ). 2014, 344, 1246752. [CrossRef] [PubMed]
- Pimm, S. L., Jenkins, C. N., and Li, B. V. How to protect half of Earth to ensure it protects sufficient biodiversity. Sci. Adv. 2018, 4, eaat2616. [CrossRef]
- Quick Response Fund for Nature (n.d.). Available online: www.quickrespondfund.org.
- Shin, Y., Midgley, G. F., Archer, E. R. M., Arneth, A., Barnes, D. K. A., Chan, L., et al. Actions to halt biodiversity loss generally benefit the climate. Glob. 2022, 28, 2846–2874.
- Spiliopoulou, K., Brooks, T. M., Dimitrakopoulos, P. G., Oikonomou, A., Karavatsou, F., Stoumboudi, M. T., et al. Protected areas and the ranges of threatened species: Towards the EU Biodiversity Strategy 2030. Biol. Conserv. 2023, 284, 110166. [CrossRef]
- Strassburg, B. B. N., Iribarrem, A., Beyer, H. L., Cordeiro, C. L., Crouzeilles, R., Jakovac, C. C., et al. Global priority areas for ecosystem restoration. Nature 2020, 586, 724–729.
- The Nature Conservancy (2022). New biodiversity commitments announced as world leaders declare CBD-COP15 nature summit a priority. Available online: https://www.nature.org/en-us/newsroom/new-biodiversity-commitments-world-leaders-declare-un-biodiversity-summit-priority/.
- Tsendbazar, N.-E., Tarko, A. J., Li, L., Herold, M., Lesiv, M., Fritz, S., et al. (2020). Copernicus global land service: Land cover 100m: Version 3 globe 2015-2019: Validation report.
- Tulloch, V. J. D., Atkinson, S., Possingham, H. P., Peterson, N., Linke, S., Allan, J. R., et al. (2021). Minimizing cross-realm threats from land-use change: a national-scale conservation framework connecting land, freshwater and marine systems. Biol. Conserv. 254, 108954.
- UNEP-WCMC and IUCN (2018). Protected Planet: The World Database on Protected Areas (WDPA) and World Database on Other Effective Area-based Conservation Measures (WD-OECM). Available online: www.protectedplanet.net.
- UNEP-WCMC and IUCN (2023). Protected Planet: The World Database on Protected Areas (WDPA) and World Database on Other Effective Area-based Conservation Measures (WD-OECM). Available online: www.protectedplanet.net (accessed on 6 April 2023).
- Venter, O., Magrach, A., Outram, N., Klein, C. J., Possingham, H. P., Di Marco, M., et al. Bias in protected-area location and its effects on long-term aspirations of biodiversity conventions. Conserv. Biol. 2018, 32, 127–134. [CrossRef] [PubMed]
- Waldron, A., Adams, V., Allan, J., Arnell, A., Asner, G., Atkinson, S., et al. (2020). Protecting 30% of the planet for nature: costs, benefits and economic implications.
- White, T. B., Petrovan, S. O., Christie, A. P., Martin, P. A., and Sutherland, W. J. What is the price of conservation? A review of the status quo and recommendations for improving cost reporting. Bioscience 2022, 72, 461–471. [CrossRef] [PubMed]
- World Bank (2022). World Databank. World Development Indicators.
- Zander, K. K., and Garnett, S. T. The economic value of environmental services on indigenous-held lands in Australia. PLoS One 2011, 6, e23154. [CrossRef]
- Zhang, R., Lu, Y., Adams, K., Sefair, J. A., Mellin, H., Acevedo, M. A., et al. A visual analytics framework for conservation planning optimization. Environ. Model. Softw. 2021, 145, 105178. [CrossRef]
Figure 1.
Map of global unprotected species rarity site. Global distribution of the unprotected species rarity sites (magenta area) across predominantly forested habitat (green) and non-forested habitat (yellow), with non-habitat areas (grey) removed from previously designated species rarity sites, covering 1.22%. Non-habitat areas include land classified as urban, agricultural, and degraded.
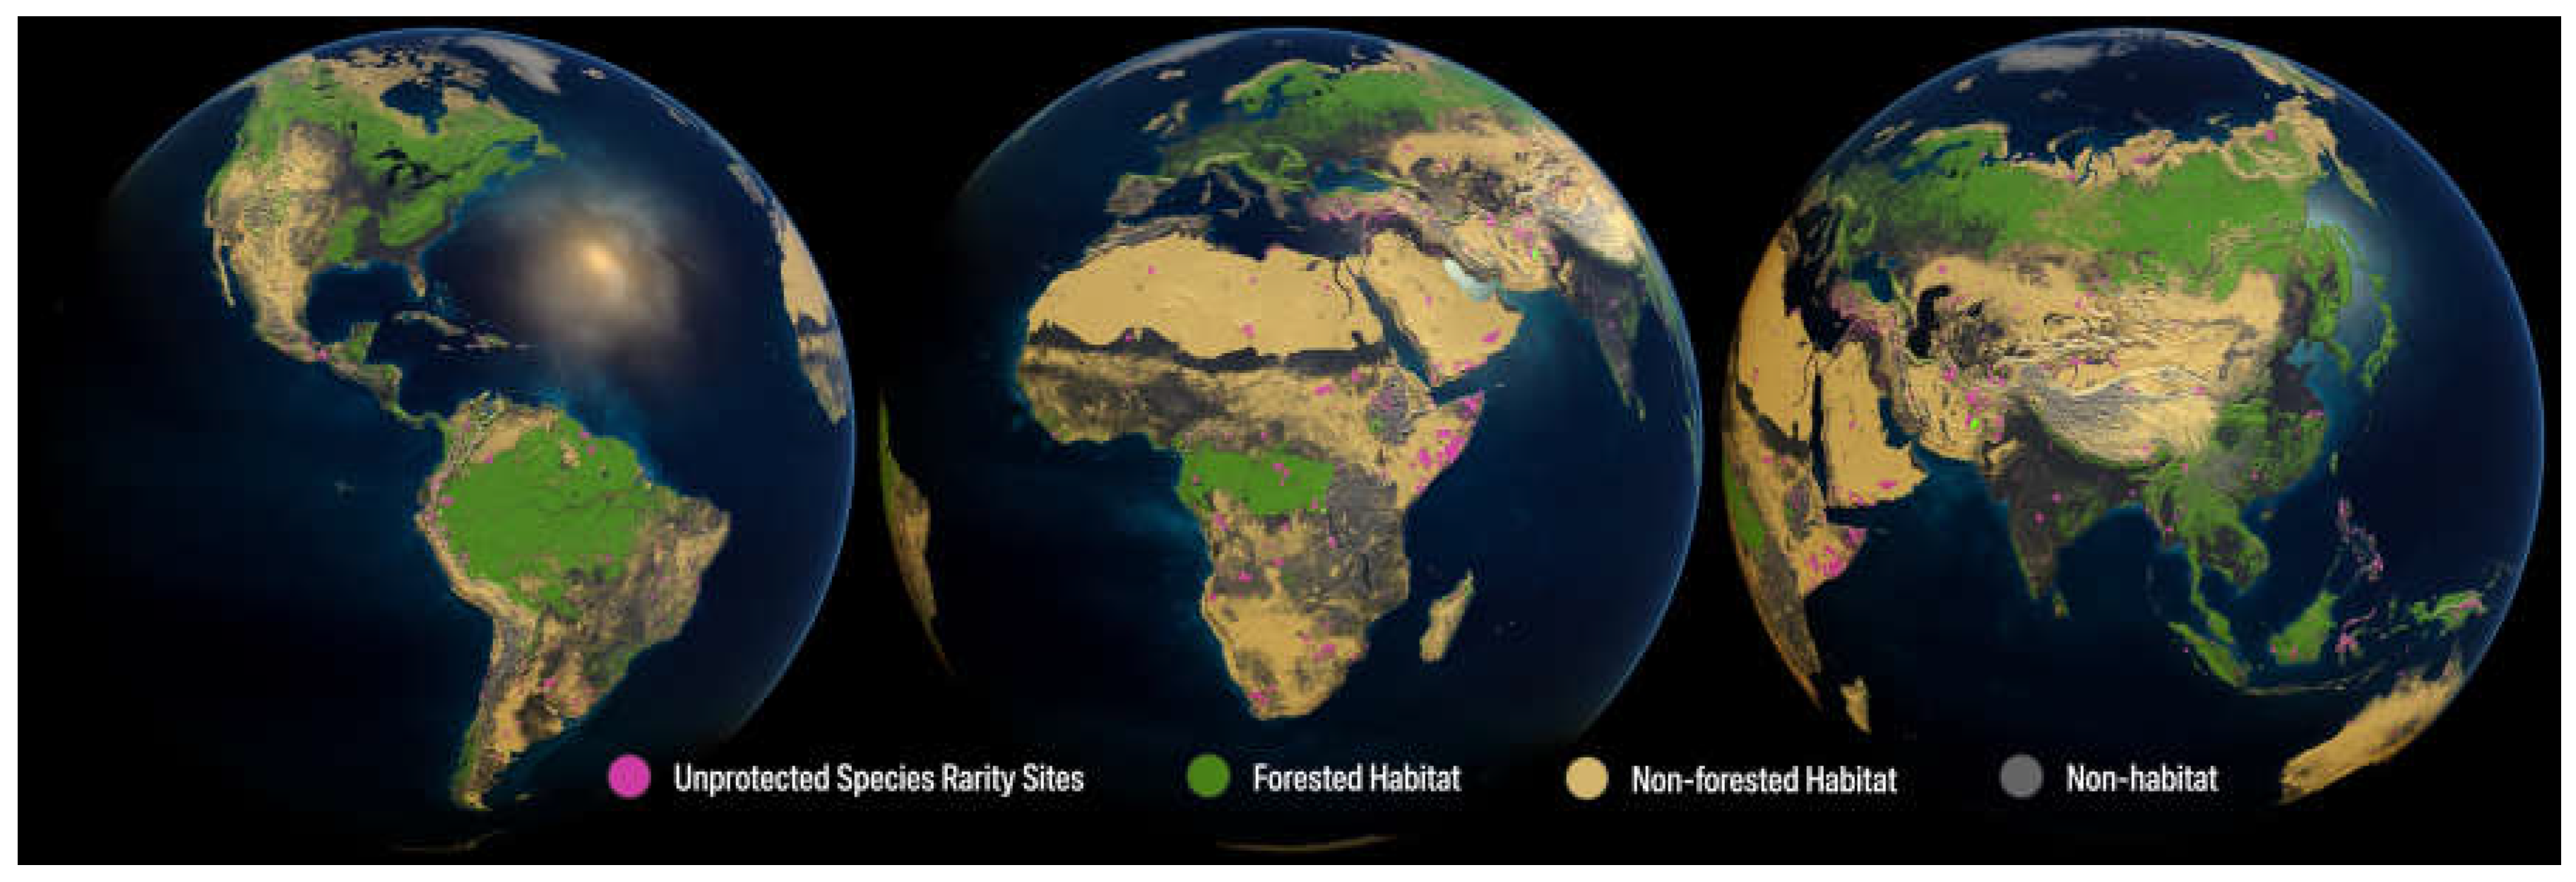
Figure 2.
Effect of fractional analysis in identifying and removing non-habitat (Other) areas from species rarity polygons in several regions with high species rarity. Forested and non-forested habitat are retained. A) Sierra Nevada de Santa Marta, Colombia; B) West African coastal forests; and C) Madagascar dry forests.
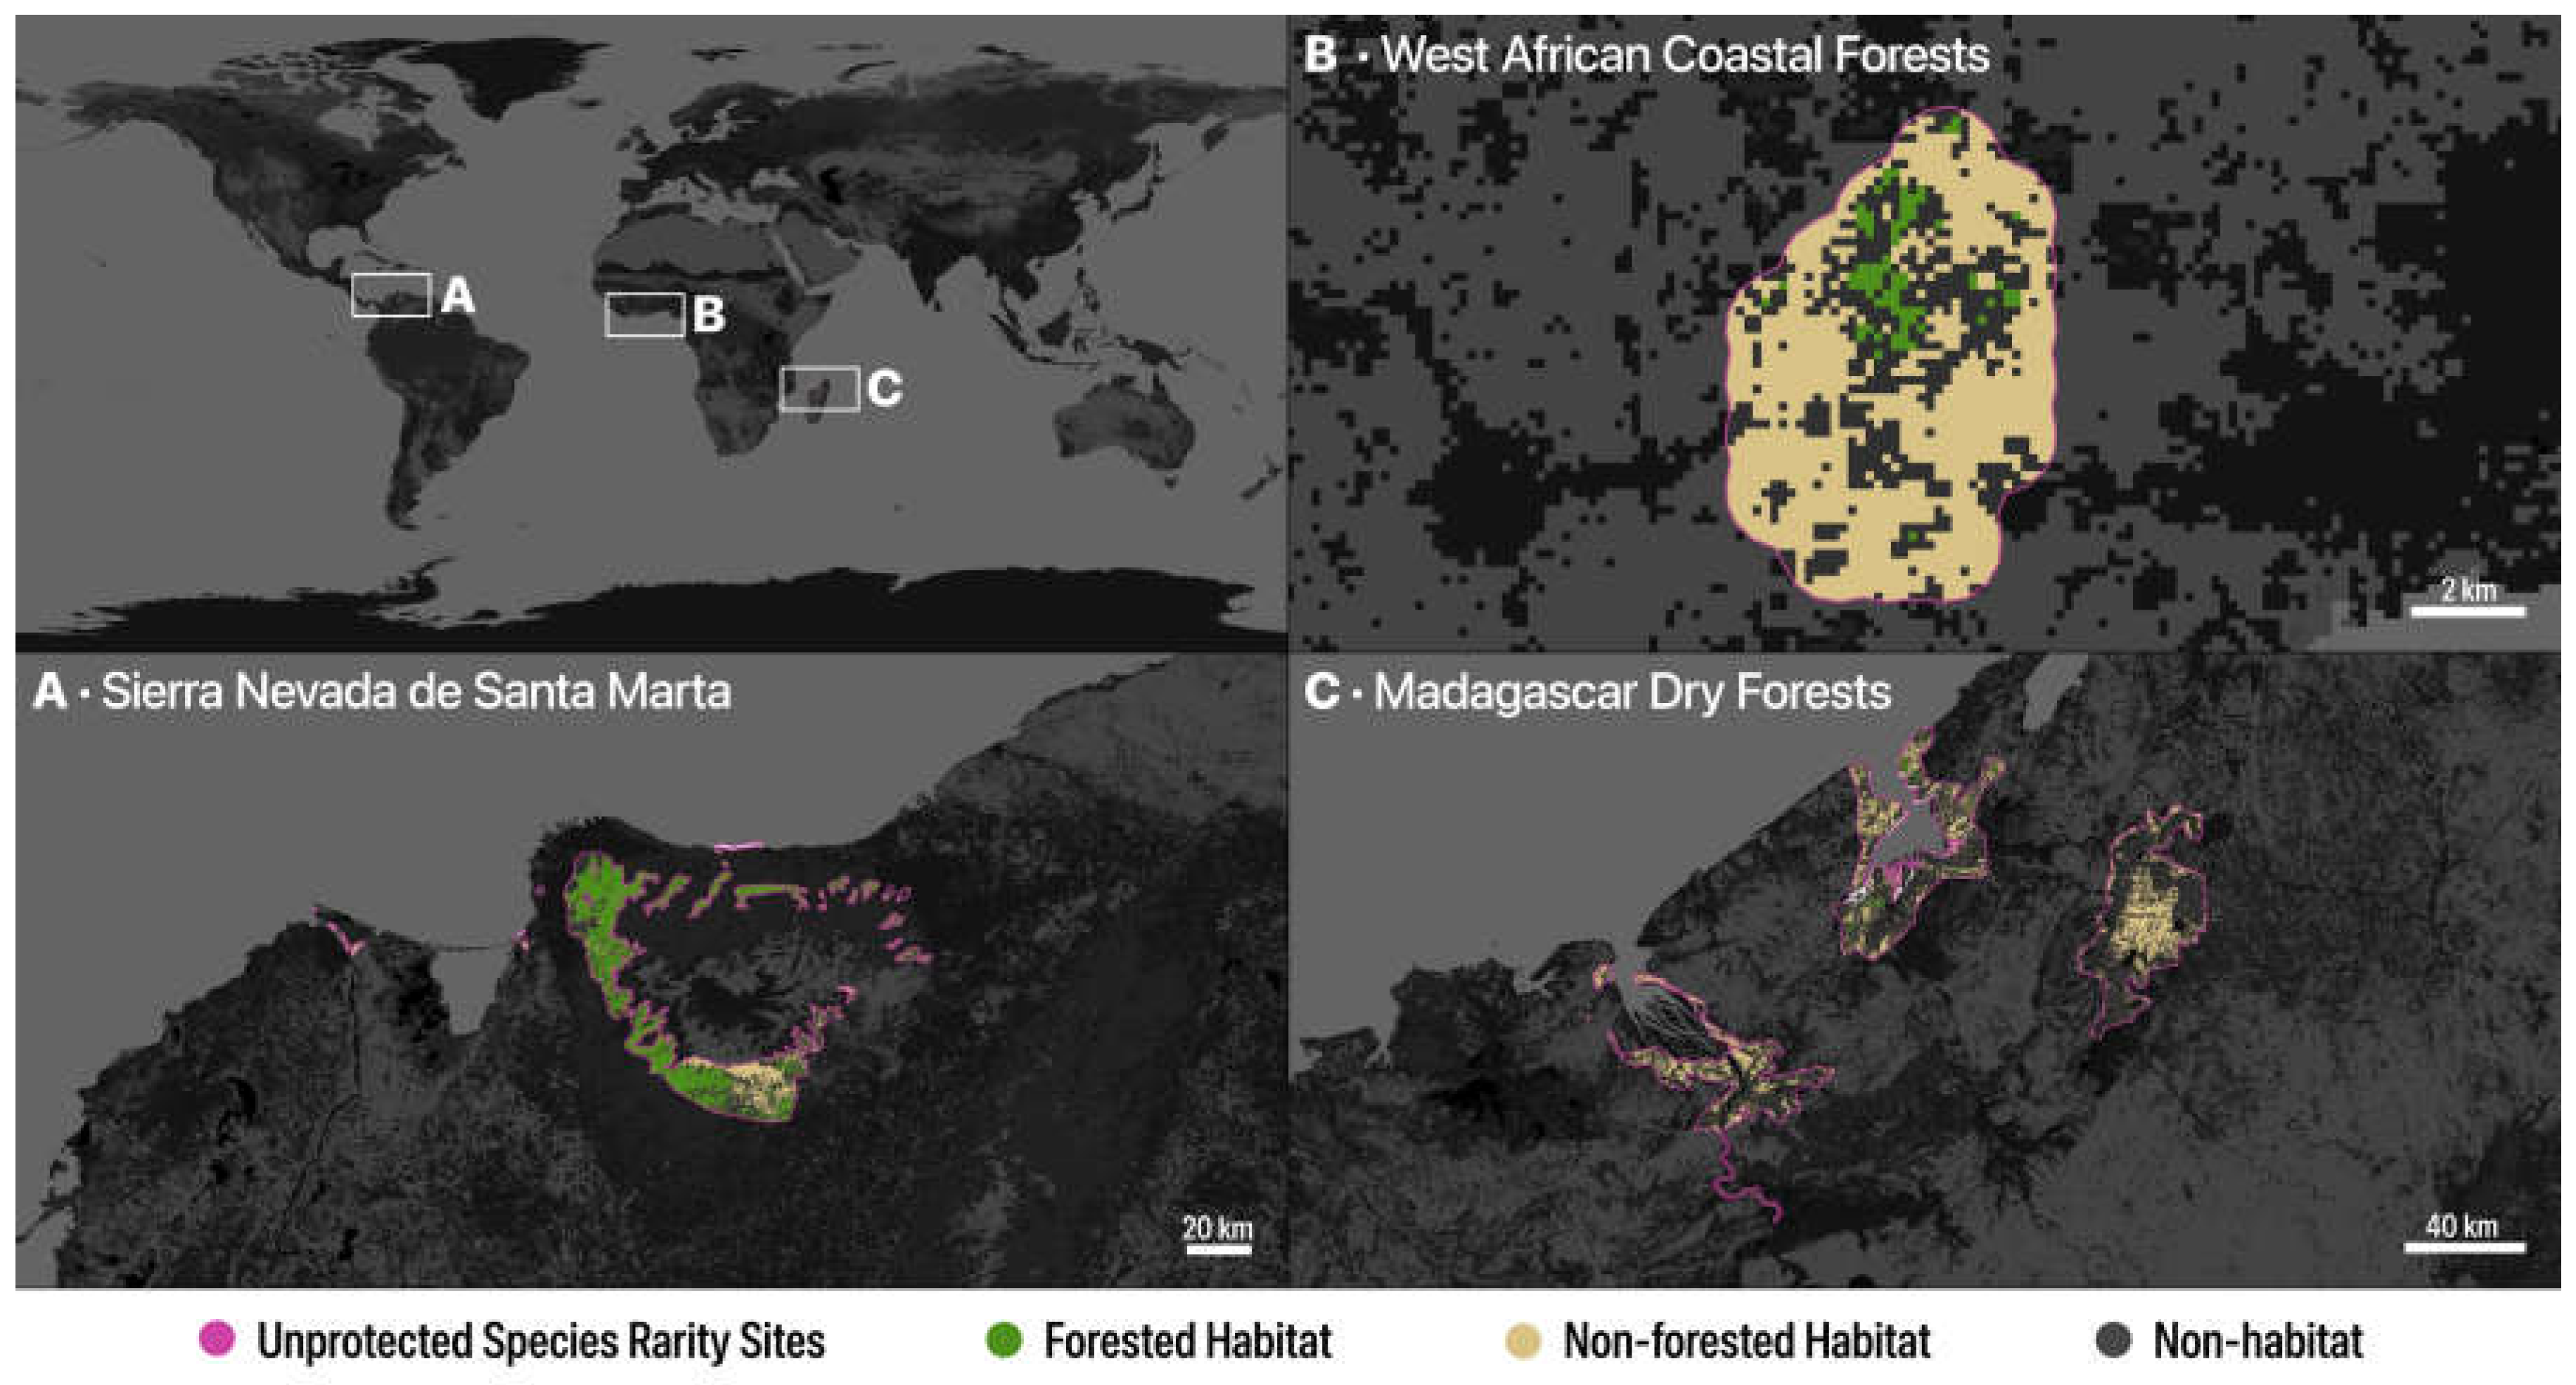
Figure 3.
The ten ecoregions in each realm containing the highest number of Conservation Imperatives sites.
Figure 3.
The ten ecoregions in each realm containing the highest number of Conservation Imperatives sites.
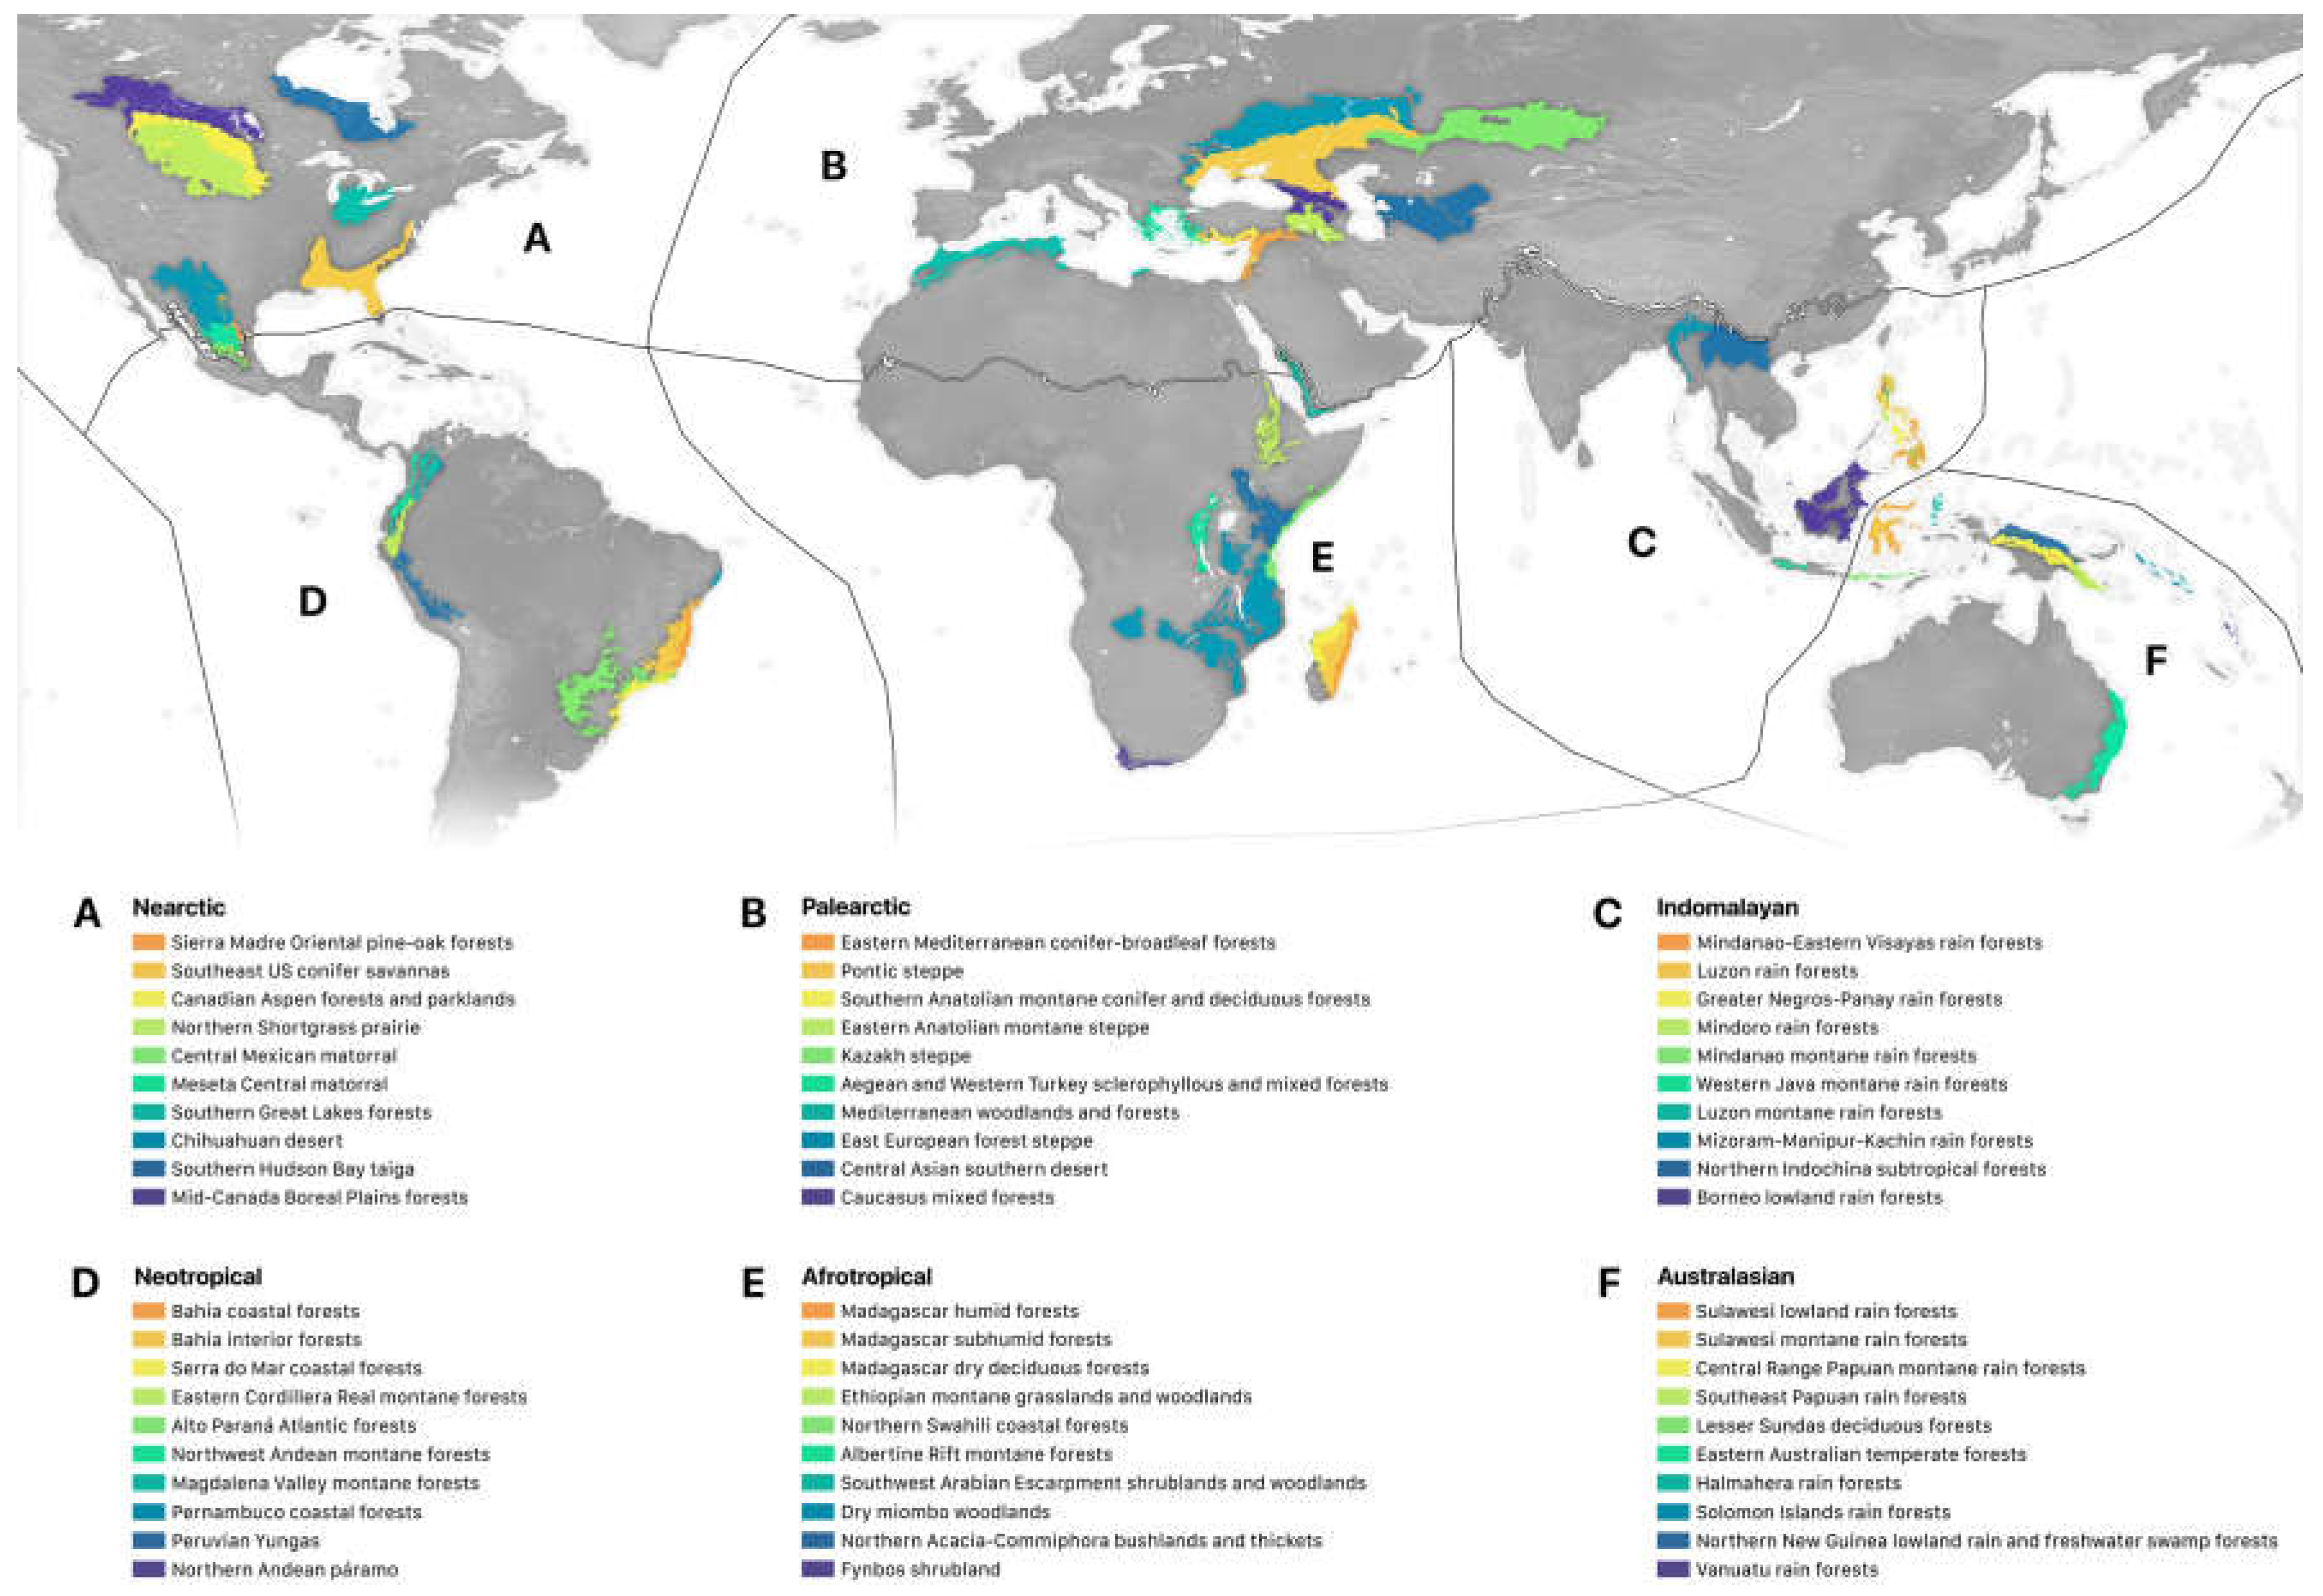
Figure 4.
Expansion of protection in Species Rarity Sites under World Database on Protected Areas (WDPA) between 2018 and 2023, after overlaying fractional land cover. Green polygons represent unprotected species rarity sites that have gained protection between 2018 and 2023, representing only 7% of the global increase in protection coverage. Magenta polygons represent sites that remain unprotected in 2023.
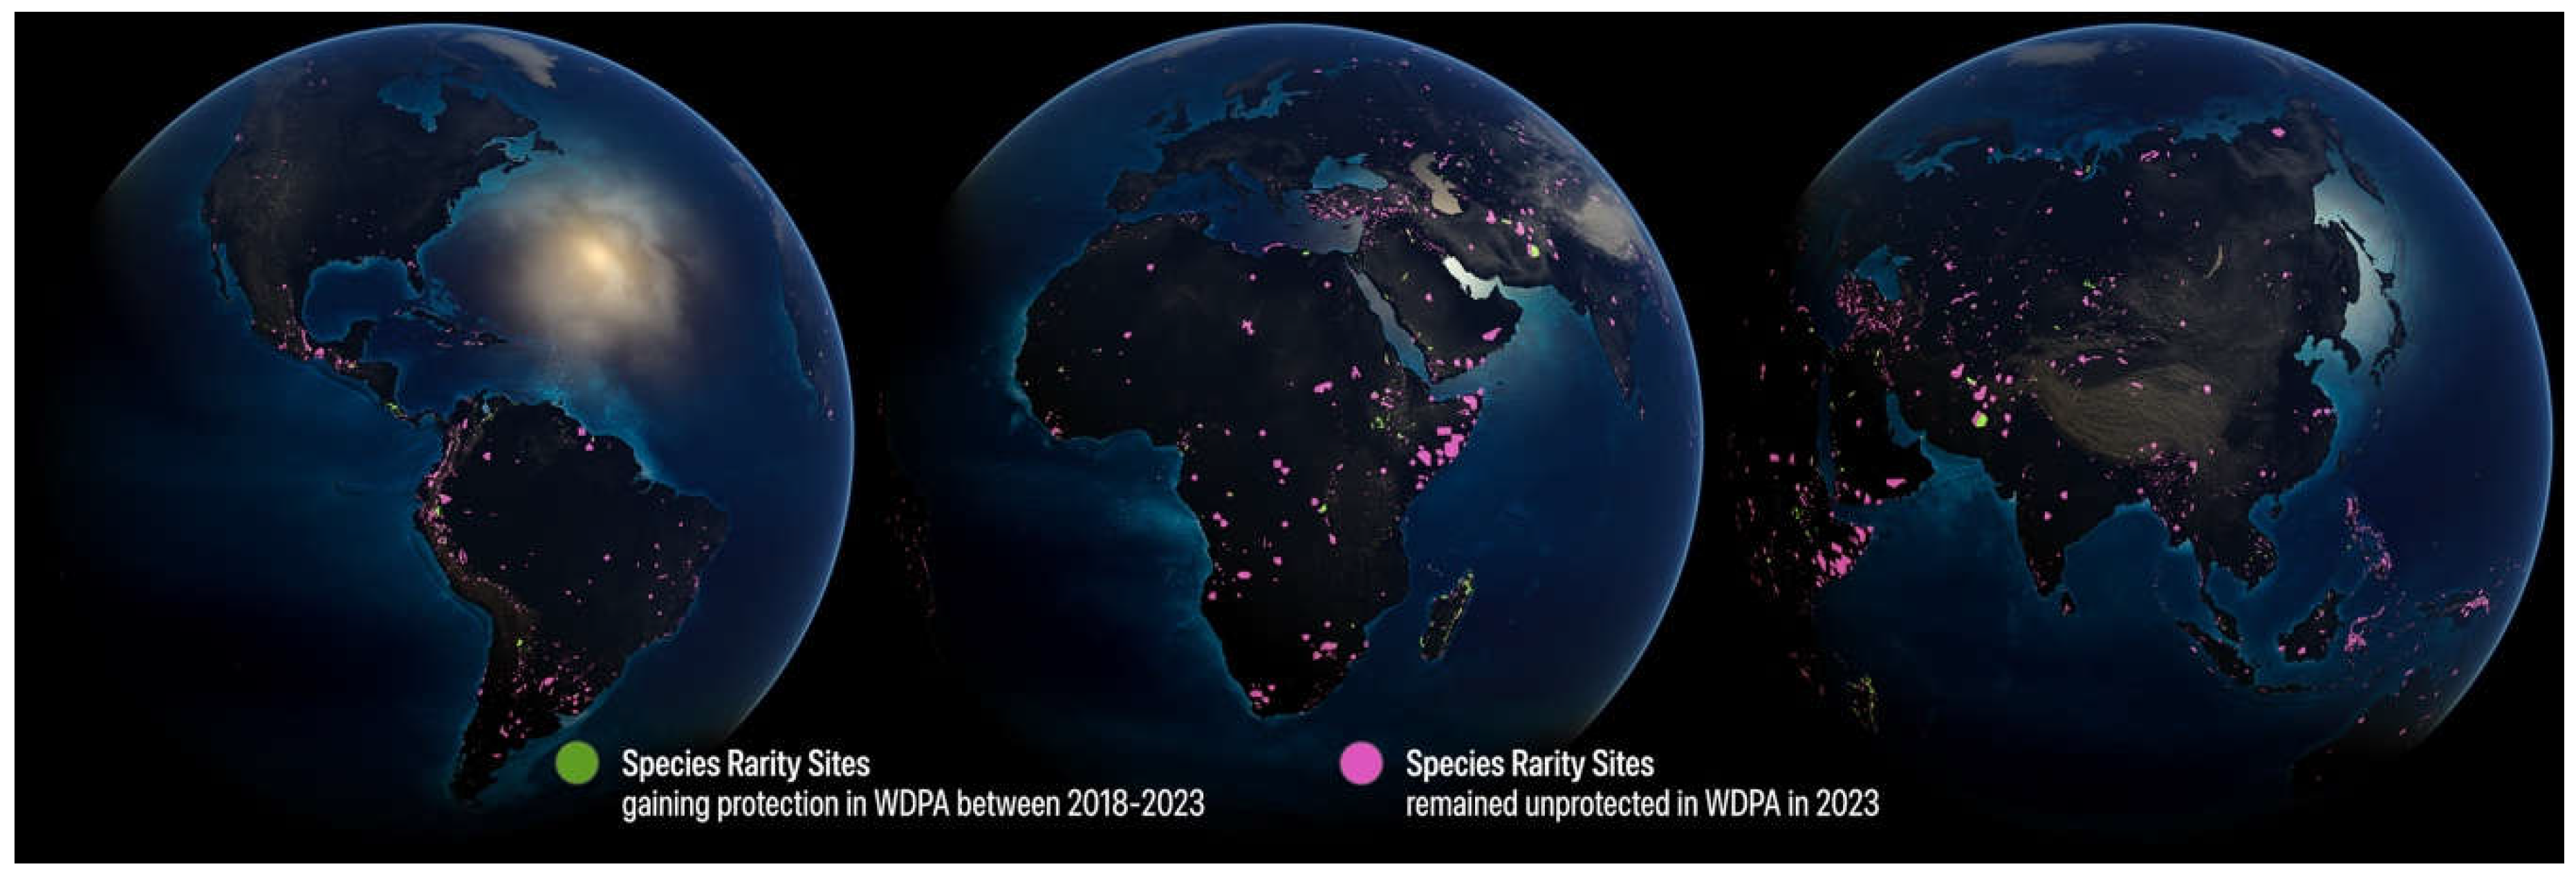
Table 2.
Extent of habitat by biome after applying fractional land cover to species rarity sites and removing non-habitat area.
Table 2.
Extent of habitat by biome after applying fractional land cover to species rarity sites and removing non-habitat area.
| No. | Biome Name | Forested habitat (km2) | Non-forested habitat (km2) | Total habitat (km2) | % habitat reduction* |
|---|---|---|---|---|---|
| 1 | Tropical & Subtropical Moist Broadleaf Forests | 536,606 | 55,436 | 592,043 | 49% |
| 2 | Tropical & Subtropical Dry Broadleaf Forests | 7,903 | 13,248 | 21,152 | 77% |
| 3 | Tropical & Subtropical Coniferous Forests | 13,152 | 3,073 | 16,225 | 58% |
| 4 | Temperate Broadleaf & Mixed Forests | 28,563 | 25,156 | 53,719 | 68% |
| 5 | Temperate Conifer Forests | 19,777 | 8,481 | 28,257 | 33% |
| 6 | Boreal Forests/Taiga | 51,147 | 35,018 | 86,165 | 22% |
| 7 | Tropical & Subtropical Grasslands, Savannas & Shrublands | 17 | 370,057 | 370,075 | 14% |
| 8 | Temperate Grasslands, Savannas & Shrublands | 5 | 82,146 | 82,151 | 53% |
| 9 | Flooded Grasslands & Savannas | 2 | 8,794 | 8,796 | 65% |
| 10 | Montane Grasslands & Shrublands | 41 | 32,775 | 32,816 | 62% |
| 11 | Tundra | 1 | 45,632 | 45,633 | 35% |
| 12 | Mediterranean Forests, Woodlands & Scrub | 5 | 36,162 | 36,167 | 78% |
| 13 | Deserts & Xeric Shrublands | 7 | 259,015 | 259,022 | 46% |
| 14 | Mangroves | 6,329 | 1,361 | 7,690 | 44% |
| Total | 663,556 | 976,355 | 1,639,911 | 46% |
* Approximate reduction of unprotected rare and threatened species areas from 2019 levels, versus total area extent from newly compiled data sets.
Table 3.
Distribution of Conservation Imperatives sites (2023) by realm. The four tropical realms account for 89% of all sites globally.
Table 3.
Distribution of Conservation Imperatives sites (2023) by realm. The four tropical realms account for 89% of all sites globally.
| Biogeographic Realm | Forest (km2) | Grass (km2) | Shrub (km2) | Desert (km2) | Total (km2) | Number of Sites | % Total Sites |
|---|---|---|---|---|---|---|---|
| Afrotropic | 65,301 | 124,904 | 224,425 | 722 | 415,351 | 1,870 | 11.1% |
| Australasia | 180,550 | 30,538 | 6,210 | 318 | 217,616 | 2,526 | 15.0% |
| Indomalayan | 150,262 | 2,681 | 1,963 | 18 | 154,924 | 4,569 | 27.2% |
| Nearctic | 17,512 | 11,355 | 11,914 | 233 | 41,012 | 184 | 1.1% |
| Neotropic | 174,945 | 89,346 | 47,455 | 244 | 311,990 | 5,972 | 35.5% |
| Oceania | 1,766 | 149 | 92 | - | 2,007 | 52 | 0.3% |
| Palearctic | 73,220 | 262,573 | 20,868 | 140,349 | 497,010 | 1,652 | 9.8% |
| Total | 663,556 | 521,545 | 312,927 | 141,883 | 1,639,911 | 16,825 | 100% |
Table 4.
Distribution of Conservation Imperatives sites (2023) in each biome. The Tropical and Subtropical Moist Broadleaf Forests biome alone account for three-quarters of all sites globally.
Table 4.
Distribution of Conservation Imperatives sites (2023) in each biome. The Tropical and Subtropical Moist Broadleaf Forests biome alone account for three-quarters of all sites globally.
| No. | Biome Name | Forest (km2) | Grass (km2) | Shrub (km2) | Desert (km2) | Total (km2) | Number of Sites | % Total Sites |
|---|---|---|---|---|---|---|---|---|
| 1 | Tropical & Subtropical Moist Broadleaf Forests | 536,606 | 27,081 | 28,355 | - | 592,043 | 12,580 | 74.8% |
| 2 | Tropical & Subtropical Dry Broadleaf Forests | 7,903 | 5,925 | 7,323 | - | 21,152 | 554 | 3.3% |
| 3 | Tropical & Subtropical Coniferous Forests | 13,152 | 552 | 2,521 | - | 16,225 | 170 | 1.0% |
| 4 | Temperate Broadleaf & Mixed Forests | 28,563 | 24,055 | 1,101 | - | 53,719 | 503 | 3.0% |
| 5 | Temperate Conifer Forests | 19,777 | 7,860 | 620 | - | 28,257 | 125 | 0.7% |
| 6 | Boreal Forests/Taiga | 51,147 | 25,828 | 9,191 | - | 86,165 | 88 | 0.5% |
| 7 | Tropical & Subtropical Grasslands, Savannas & Shrublands | 17 | 165,980 | 204,077 | - | 370,075 | 562 | 3.3% |
| 8 | Temperate Grasslands, Savannas & Shrublands | 5 | 63,503 | 18,643 | - | 82,151 | 439 | 2.6% |
| 9 | Flooded Grasslands & Savannas | 2 | 8,435 | 358 | - | 8,796 | 57 | 0.3% |
| 10 | Montane Grasslands & Shrublands | 41 | 29,993 | 2,782 | - | 32,816 | 428 | 2.5% |
| 11 | Tundra | 1 | 43,136 | 2,497 | - | 45,633 | 37 | 0.2% |
| 12 | Mediterranean Forests, Woodlands & Scrub | 5 | 21,619 | 14,543 | - | 36,167 | 436 | 2.6% |
| 13 | Deserts & Xeric Shrublands | 7 | 96,743 | 20,389 | 141,883 | 259,022 | 619 | 3.7% |
| 14 | Mangroves | 6,329 | 835 | 526 | - | 7,690 | 227 | 1.3% |
| Total | 663,556 | 521,545 | 312,927 | 141,883 | 1,639,911 | 16,825 | 100% |
Table 5.
The top 10 ecoregions in each realm with the highest number of Conservation Imperatives sites (2023), and the total remaining natural habitat and estimated cost to place under conservation stewardship. This includes tropical and non-tropical ecoregions.
Table 5.
The top 10 ecoregions in each realm with the highest number of Conservation Imperatives sites (2023), and the total remaining natural habitat and estimated cost to place under conservation stewardship. This includes tropical and non-tropical ecoregions.
| ID | Ecoregion Name | Total Habitat Area (km2) | Number of Sites | % of Sites in Realm | Estimated Cost (Million USD) |
|---|---|---|---|---|---|
| Afrotropic | |||||
| 17 | Madagascar humid forests | 4,295 | 614 | 32% | $337 |
| 18 | Madagascar subhumid forests | 3,836 | 250 | 13% | $302 |
| 32 | Madagascar dry deciduous forests | 3,025 | 59 | 3% | $241 |
| 79 | Ethiopian montane grasslands and woodlands | 725 | 49 | 3% | $56 |
| 25 | Northern Swahili coastal forests | 16,190 | 48 | 3% | $1,201 |
| 1 | Albertine Rift montane forests | 5,200 | 43 | 2% | $352 |
| 108 | Southwest Arabian Escarpment shrublands and woodlands | 2,407 | 38 | 2% | $272 |
| 42 | Dry miombo woodlands | 376 | 35 | 2% | $26 |
| 51 | Northern Acacia-Commiphora bushlands and thickets | 10,976 | 32 | 2% | $710 |
| 89 | Fynbos shrubland | 2,049 | 29 | 2% | $221 |
| Total Cost of Top 10 Ecoregions (% of Total Realm Cost) | $3.72 Billion (9.2%) | ||||
| Australasia | |||||
| 156 | Sulawesi lowland rain forests | 25,417 | 1,090 | 45% | $197 |
| 157 | Sulawesi montane rain forests | 36,785 | 421 | 18% | $270 |
| 139 | Central Range Papuan montane rain forests | 39,150 | 379 | 16% | $231 |
| 153 | Southeast Papuan rain forests | 15,727 | 46 | 2% | $98 |
| 163 | Lesser Sundas deciduous forests | 1,916 | 41 | 2% | $15 |
| 168 | Eastern Australian temperate forests | 2,192 | 39 | 2% | $31 |
| 140 | Halmahera rain forests | 3,147 | 32 | 1% | $24 |
| 152 | Solomon Islands rain forests | 10,456 | 25 | 1% | $69 |
| 148 | Northern New Guinea lowland rain and freshwater swamp forests | 6,101 | 22 | 1% | $39 |
| 159 | Vanuatu rain forests | 992 | 18 | 1% | $7 |
| Total Cost of Top 10 Ecoregions (% of Total Realm Cost) | $0.98 Billion (52.4%) | ||||
| Indomalayan | |||||
| 247 | Mindanao-Eastern Visayas rain forests | 22,648 | 1,561 | 36% | $14,948 |
| 241 | Luzon rain forests | 15,139 | 1,123 | 26% | $9,912 |
| 231 | Greater Negros-Panay rain forests | 1,813 | 190 | 4% | $1,184 |
| 248 | Mindoro rain forests | 1,663 | 178 | 4% | $971 |
| 246 | Mindanao montane rain forests | 7,517 | 139 | 3% | $4,880 |
| 288 | Western Java montane rain forests | 709 | 100 | 2% | $467 |
| 240 | Luzon montane rain forests | 2,644 | 57 | 1% | $1,732 |
| 249 | Mizoram-Manipur-Kachin rain forests | 5,395 | 52 | 1% | $3,037 |
| 256 | Northern Indochina subtropical forests | 3,171 | 44 | 1% | $2,097 |
| 219 | Borneo lowland rain forests | 13,993 | 43 | 1% | $8,399 |
| Total Cost of Top 10 Ecoregions (% of Total Realm Cost) | $47.6 Billion (46.3%) | ||||
| Nearctic | |||||
| 327 | Sierra Madre Oriental pine-oak forests | 1,828 | 16 | 9% | $76 |
| 399 | Southeast US conifer savannas | 1,149 | 15 | 8% | $66 |
| 386 | Canadian Aspen forests and parklands | 121 | 9 | 5% | $7 |
| 396 | Northern Shortgrass prairie | 672 | 9 | 5% | $40 |
| 427 | Central Mexican matorral | 603 | 8 | 4% | $21 |
| 432 | Meseta Central matorral | 819 | 8 | 4% | $31 |
| 342 | Southern Great Lakes forests | 222 | 7 | 4% | $11 |
| 428 | Chihuahuan desert | 3,490 | 7 | 4% | $131 |
| 382 | Southern Hudson Bay taiga | 1,782 | 6 | 3% | $99 |
| 376 | Mid-Canada Boreal Plains forests | 561 | 5 | 3% | $30 |
| Total Cost of Top 10 Ecoregions (% of Total Realm Cost) | $0.51 Billion (21.5%) | ||||
| Neotropical | |||||
| 442 | Bahia coastal forests | 3,563 | 1,635 | 27% | $410 |
| 443 | Bahia interior forests | 1,161 | 579 | 10% | $138 |
| 500 | Serra do Mar coastal forests | 3,134 | 434 | 7% | $372 |
| 460 | Eastern Cordillera Real montane forests | 18,176 | 279 | 5% | $1,796 |
| 439 | Alto Paraná Atlantic forests | 2,177 | 192 | 3% | $241 |
| 486 | Northwest Andean montane forests | 18,454 | 192 | 3% | $1,888 |
| 477 | Magdalena Valley montane forests | 9,685 | 156 | 3% | $927 |
| 491 | Pernambuco coastal forests | 160 | 150 | 2% | $19 |
| 493 | Peruvian Yungas | 11,658 | 142 | 2% | $1,191 |
| 593 | Northern Andean páramo | 892 | 121 | 2% | $92 |
| Total Cost of Top 10 Ecoregions (% of Total Realm Cost) | $7.07 Billion (20.3%) | ||||
| Palearctic | |||||
| 791 | Eastern Mediterranean conifer-broadleaf forests | 6,900 | 114 | 7% | $1,092 |
| 735 | Pontic steppe | 9,506 | 101 | 6% | $1,675 |
| 804 | Southern Anatolian montane conifer and deciduous forests | 12,680 | 70 | 4% | $2,255 |
| 727 | Eastern Anatolian montane steppe | 9,761 | 57 | 3% | $1,501 |
| 732 | Kazakh steppe | 9,220 | 53 | 3% | $1,504 |
| 785 | Aegean and Western Turkey sclerophyllous and mixed forests | 1,577 | 43 | 2% | $270 |
| 798 | Mediterranean woodlands and forests | 2,221 | 40 | 2% | $295 |
| 661 | East European forest steppe | 2,191 | 39 | 2% | $382 |
| 819 | Central Asian southern desert | 3,436 | 37 | 2% | $486 |
| 650 | Caucasus mixed forests | 5,851 | 36 | 2% | $901 |
| Total Cost of Top 10 Ecoregions (% of Total Realm Cost) | $10.4 Billion (12.9%) | ||||
Table 6.
Top 30 countries with the highest number of Conservatives Imperative sites, their percentage total, and median area of sites (km2).
Table 6.
Top 30 countries with the highest number of Conservatives Imperative sites, their percentage total, and median area of sites (km2).
| Country | Number of Conservation Imperative Sites | % Total sites | Median area of sites (km2) | Total area of sites (km2) |
|---|---|---|---|---|
| Philippines | 3,355 | 19.5% | 0.46 | 53,816 |
| Brazil | 3,342 | 19.4% | 0.31 | 35,632 |
| Indonesia | 1,893 | 11.0% | 0.50 | 116,773 |
| Madagascar | 968 | 5.6% | 0.37 | 14,585 |
| Colombia | 761 | 4.4% | 0.93 | 39,827 |
| Ecuador | 653 | 3.8% | 0.38 | 35,026 |
| Papua New Guinea | 527 | 3.1% | 0.36 | 81,800 |
| India | 437 | 2.5% | 5.23 | 20,861 |
| Peru | 342 | 2.0% | 13.42 | 43,590 |
| Turkey | 304 | 1.8% | 28.53 | 50,166 |
| Russia | 291 | 1.7% | 54.48 | 138,436 |
| China | 276 | 1.6% | 22.68 | 41,276 |
| Mexico | 230 | 1.3% | 17.22 | 33,441 |
| Argentina | 187 | 1.1% | 40.87 | 61,285 |
| Australia | 137 | 0.8% | 2.31 | 35,705 |
| United Republic of Tanzania | 127 | 0.7% | 0.24 | 1,041 |
| South Africa | 116 | 0.7% | 9.74 | 40,648 |
| Myanmar | 114 | 0.7% | 16.78 | 22,883 |
| Ethiopia | 109 | 0.6% | 0.86 | 40,513 |
| Kazakhstan | 104 | 0.6% | 85.39 | 58,230 |
| United States of America | 102 | 0.6% | 17.78 | 10,636 |
| Venezuela | 93 | 0.5% | 1.77 | 2,793 |
| Kenya | 92 | 0.5% | 0.69 | 16,297 |
| Vietnam | 85 | 0.5% | 5.47 | 3,274 |
| Bolivia | 81 | 0.5% | 16.31 | 8,612 |
| Yemen | 78 | 0.5% | 27.00 | 6,111 |
| Malaysia | 76 | 0.4% | 7.88 | 9,141 |
| Democratic Republic of the Congo | 73 | 0.4% | 13.46 | 49,350 |
| Syria | 70 | 0.4% | 5.16 | 2,360 |
| Chile | 66 | 0.4% | 3.49 | 2,652 |
| Total of Top 30 Countries | 15,089 | 87.6% | 1,076,759 |
Table 7.
Predicted cost/km2 and total purchase cost for securing Conservation Imperatives sites (2023) within tropical latitudes by realm. All costs are in 2022 $US dollars. The mean total cost and 90% range are reported in billions of dollars.
Table 7.
Predicted cost/km2 and total purchase cost for securing Conservation Imperatives sites (2023) within tropical latitudes by realm. All costs are in 2022 $US dollars. The mean total cost and 90% range are reported in billions of dollars.
| Realm | Mean cost/km2 (USD) | Mean acquisition size (km2) | Mean total cost (Billions USD) | 90% probability (Billions USD) |
|---|---|---|---|---|
| Afrotropic | $32,548 | 21,811 | $38.53 | $24.39–59.70 |
| Australasia | $5,800 | 131,750 | $1.59 | $1.19–2.11 |
| Indomalayan | $361,840 | 1,840 | $90.39 | $72.36–112.49 |
| Nearctic | $29,545 | 14,911 | $0.14 | $0.08–0.22 |
| Neotropic | $75,010 | 11,025 | $28.39 | $23.84–34.02 |
| Palearctic | $61,082 | 7,441 | $9.50 | $3.58–19.70 |
Disclaimer/Publisher’s Note: The statements, opinions and data contained in all publications are solely those of the individual author(s) and contributor(s) and not of MDPI and/or the editor(s). MDPI and/or the editor(s) disclaim responsibility for any injury to people or property resulting from any ideas, methods, instructions or products referred to in the content. |
© 2023 by the authors. Licensee MDPI, Basel, Switzerland. This article is an open access article distributed under the terms and conditions of the Creative Commons Attribution (CC BY) license (http://creativecommons.org/licenses/by/4.0/).
Copyright: This open access article is published under a Creative Commons CC BY 4.0 license, which permit the free download, distribution, and reuse, provided that the author and preprint are cited in any reuse.


