
Submitted:
26 September 2023
Posted:
27 September 2023
You are already at the latest version
Abstract
Micro-nanoparticles' characteristics in geothermal fluids can be applied to detect of deep hidden geothermal resources. Observations using a nanoparticle tracking analyzer (NTA) indicated that the karst geothermal water collected in the central area of Shandong Province (Jinan and Zibo) contains many natural micro-nanoparticles with sizes primarily ranging between 100 nm and 5 μm. The micro-nanoparticles’ type, shape, crystal form, and chemical composition in the samples were analyzed using transmission electron microscopy (TEM). TEM images and energy dispersive spectroscopy showed that the micro-nanoparticles in geothermal water samples were mostly amorphous, irregular, or nearly spherical, with rough edges. The micro-nanoparticles were mainly carbonates, sulfates, and chlorine-containing Fe, Ca, Na, and Mg. The characteristics of the particles can reveal the properties of the deep, hot reservoirs and aquifers from where they originate. Therefore, we believe that natural micro-nanoparticles can be essential to detecting and studying deep, hidden geothermal resources, which is a novel approach to exploring deep, hidden geothermal resources.
Keywords:
geothermal fluids
; micro-nanoparticles
; TEM
; NTA
; deep hidden geothermal resources
; central area of Shandong Province
1. Introduction
The Earth's interior holds a substantial amount of thermal energy [1,2,3]. When this thermal energy interacts with a well-developed geothermal reservoir (comprising rock or fluid), it heats the reservoir, forming exploitable geothermal resources [4,5,6,7]. These geothermal resources come in various types, boasting vast reserves and a wide distribution [8,9,10]. Moreover, geothermal resources play a pivotal role in achieving carbon neutrality and carbon peaking, as they represent renewable, clean, stable, and non-carbon-based energy sources [11]. This makes them essential for both economic and social development and environmental protection. Currently, research on geothermal resources is still in its early stages, and the exploration of deep geothermal resources remains a complex and insufficiently explored domain. China, however, is endowed with abundant and widely distributed geothermal resources, primarily concentrated within tectonically active zones and large sedimentary basins. These resources exhibit distinct regularity and zoning [12,13,14]. Geothermal resources are commonly found in Shandong Province, with geothermal outcrops and exposures prevalent in the central, western, and northern regions. However, there remains room for higher degrees of exploration, development, and overall utilization of these resources. Furthermore, research and exploration of geothermal resources are currently insufficient, and this is particularly true for deep-seated, concealed geothermal resources. In the past, exploration of deeply concealed mineral resources relied on geophysical [15,16], geochemical [17], and other methods. Hydrogeochemical techniques, for example, identify concealed mineral resource deposits based on the elemental composition of water bodies [18]. However, traditional hydrogeochemical research methods have their limitations in uncovering deeply concealed minerals and understanding the biological processes taking place in the environment [19]. The approach of prospecting for concealed ore bodies based on the characteristics of natural nanoparticles was initially introduced by Cao et al. [20]. Natural nanoparticles originate from geochemical and biological processes and are abundant in soil and groundwater [21]. Due to their distinct physicochemical properties, nanoparticles can provide unique insights into their surroundings [22,23]. They have the ability to persist for extended periods and often transport elements [24]. Natural nanoparticles can convey valuable information about geological formations deep within the Earth [25]. As a result, characterizing nanoparticles is considered an indispensable tool for mineral exploration.
Geothermal energy serves as one of the driving forces behind the migration of nanoscale materials [26]. Regions with substantial geothermal gradients often witness pronounced material migration [27]. Experimental simulations have illustrated that the greater the temperature disparity between the geological structure and the surface, the more accelerated the material migration rate within the geological body [28]. Prior research has also established a strong connection between nanomaterials and deep-seated geological formations. Hence, the utilization of nanominerals present in geothermal fluids for the study of geothermal resources proves to be advantageous.
In this study, we employed transmission electron microscopy (TEM) to examine micro-nanoparticles in geothermal fluid samples collected from the central region of Shandong Province, specifically Jinan and Zibo. The investigation delves into the relationship between nanoparticles in geothermal fluids and the deeper geothermal formations. This exploration is conducted through an analysis of micro-nanoparticle characteristics, including morphology, size, crystallization state, polymerization state, chemical composition, and elemental distribution. The anticipated outcome of this study is to provide new avenues and methodologies for the exploration of concealed deep geothermal resources.
2. Geological Setting
The geographical features in the central region of Shandong Province encompass a diverse landscape comprising mountains, plains, hills, and river valleys. The topography is elevated in the southern part and gradually descends towards the north. For the purposes of this study, the study areas selected for examination were the regions of Jinan and Zibo.
Jinan is situated at the northern periphery of the Luzhong Mountains, bordered by Mount Taishan to the south and the Yellow River to the north. The exposed geological strata in the region span from ancient to more recent formations. The development of fault structures in Jinan is predominantly influenced by the Qihe-Guangrao Fault, resulting in the presence of abundant geothermal resources. The area bears a wealth of evidence of magmatic activity, primarily occurring during the late Indochina-Yanshan orogeny. The existence of magmatic rock formations has played a pivotal role in the creation of geothermal resources in Jinan. These geothermal resources are primarily concentrated in the northern part of Jinan. The thermal reservoirs mainly consist of aquifers developed within Ordovician limestone fracture karst zones, overlaid by Quaternary, Neogene, Permian, and Carboniferous strata. Li et al. [29] determined that the origin of geothermal fluids in Jinan is primarily from atmospheric precipitation, driven by deep circulation and subsequent heating by surrounding rocks, ultimately forming geothermal reservoirs. The level of mineralization in these geothermal fluids demonstrates a declining pattern from east to west, with a sequential change in hydrochemical composition from Cl·SO4—Na·Ca to SO4·Cl—Ca·Na, followed by SO4—Ca. The geothermal fluids in Jinan exhibit varying degrees of enrichment in numerous trace elements and components known to be beneficial for human health, including fluorine, strontium, and metasilicic acid.
Zibo is situated within the Luzhong rupture area, which slopes backward, at the northern edge of the North China Platform Luxi platform. It is surrounded by mountainous terrain to the east, west, and south, creating an elevation that decreases from south to north, influenced by the local geological structure. The southern end of the Zibo syncline is closed and uplifted, while the eastern and western regions exhibit higher elevations. The central region, in contrast, is characterized by low and flat topography, opening northward and resembling a dustpan. The area features surface exposures of Neoarchean, Paleozoic, Mesozoic, and Cenozoic strata. The fault structure in this region is notably well-developed, with extension fractures being the primary fault type. These faults primarily formed during the later stages of the Indochina-Yanshan movement. The extensive development of fault structures enhances the occurrence and migration of geothermal fluids. The area also displays substantial evidence of magmatic activity, with widely distributed magmatic rocks showcasing characteristics of multiphase activity. The geographical and geological characteristics of the area define it as a relatively self-contained hydrogeological unit. The primary source of geothermal fluids in this region is atmospheric precipitation, driven by deep circulation and subsequent heating by surrounding rocks to create geothermal reservoirs. The thermal reservoirs predominantly consist of aquifers within Ordovician limestone, and the hydrochemical composition of the geothermal fluids can be categorized as SO4·Cl—Na·Ca.
3. Sampling and Analytical Methods
3.1. Sampling Sites
Six geothermal fluid samples were collected, with five samples originating from Jinan and one from Zibo. The exact sampling points are depicted in Figure 1. The samples were collected using 50 mL volumetric flasks. These flasks were initially rinsed with a small quantity of water, then filled with the water samples (each exceeding 30 mL). The flasks were securely sealed and stored until they were ready for analysis.
3.2. Analytical Methods
The sizes and concentrations of particles in the groundwater samples were determined through nanoparticle tracking analysis (NTA) using a ZetaView PMX 110 instrument manufactured by Particle Metrix, based in Meerbusch, Germany. The corresponding ZetaView 8.04.02 software was utilized for data analysis. NTA measurements were recorded and analyzed at eleven different positions. To maintain the desired temperatures of approximately 23°C and 30°C, the ZetaView system was calibrated using 110 nm polystyrene particles.
Transmission electron microscopy (TEM) was employed for nanoparticle analysis. The maximum acceleration voltage for TEM was set at 200 kV. TEM foils were prepared by extracting nanoparticles and attaching them to Cu grids through Pt welding, followed by thinning to achieve thicknesses ranging from 50 to 70 nm. High-angle annular dark-field scanning transmission electron microscopy (HAADF-STEM) imaging was carried out using a high-resolution, probe-corrected FEI Titan Themis TEM. Post-processing of high-resolution transmission electron microscopy (HRTEM) images, including fast Fourier transform (FFT) processing, was conducted using DigitalMicrograph software (version 3.7.4, Gatan). Furthermore, the elemental distribution was determined via energy-dispersive X-ray spectrometry (EDS). All analyses, including TEM and EDS, were conducted at the Sinoma Institute of Materials Research (Guangzhou) Co., Ltd.
4. Results
The results from the NTA test (see Table 1) revealed that the geothermal fluids collected in both regions contained a substantial number of micro-nanoparticles. In the geothermal fluids from Jinan, the particle sizes were primarily concentrated within the range of 150–500 nm, and particle concentrations were predominantly found within the range of 0.5–4 × 10⁵ particles per liter. On the other hand, in the geothermal fluids from Zibo, the particle sizes were mainly concentrated in the range of 196–232 nm, with particle concentrations primarily falling within the range of 0.7–3.2 × 10⁵ particles per liter. This study involved the analysis of 22 characteristic micro-nanoparticles from the geothermal fluids, and the EDS results are presented in Table 2. The EDS results for the geothermal fluid samples from Jinan exhibited elevated concentrations of Cu and C. This outcome can be attributed to the sample carrier used during the scanning electron microscopy analysis of the Jinan geothermal fluid samples, which was a copper mesh coated with a carbon film.
4.1. Micro-Nanoparticles in Geothermal Fluids in Jinan
A total of 12 particles were analyzed from the geothermal fluids in Jinan. TEM and EDS results suggested that these micro-nanoparticles displayed low crystallinity. These particles predominantly consisted of common chemical elements found in groundwater, including C, O, Ca, Cu, Fe, Na, Cl, and others. Notably, some anomalous elements, such as Sr, Te, In, and Pd, were detected, primarily in carbonates, sulfates, and chlorides.
Figure 2a presents an image of a particle from the JN-1 sample. The particle exhibits a nearly spherical shape, and the selected area electron diffraction (SAED) pattern within the dotted circle (Figure 2b) reveals the amorphous nature of the micro-nanoparticle. EDS analysis indicated that the particle was primarily composed of O (15.88%), C (54.83%), Cu (18.57%), and Ca (9.81%). Consequently, it was inferred that the particle depicted in Figure 2a was composed of calcium carbonate.
Figure 3 showcases the particle from the JN-2 sample, which appears to be substantial. EDS analysis revealed that the particle was predominantly composed of O (8.74%), C (7.51%), Cu (20.54%), and Ca (62.23%). Therefore, it was inferred that the particle depicted in Figure 3 consisted of carbonates and sulfates containing calcium.
Figure 4a portrays the particle from the JN-3 sample, which exhibits a granular morphology. The selected area electron diffraction (SAED) pattern within the dotted circle (Figure 4b) indicates the amorphous nature of the micro-nanoparticle. EDS analysis revealed that the particle was primarily composed of O (20.31%), C (5.38%), Cu (12.20%), Ca (58.06%), S (2.35%), and Cl (1.11%). As a result, it was inferred that the particle depicted in Figure 4a consisted of carbonates, sulfates, and chlorine, with a calcium component.
Figure 5a showcases the particle from the JN-4 sample, which exhibits a nearly spherical shape. The selected area electron diffraction (SAED) pattern within the dotted circle (Figure 5b) reveals the relatively well-ordered structure of the micro-nanoparticle. The d-spacing values in the (2 0 0) and (2 2 0) planes were measured at 2.820 Å and 1.991 Å, respectively. EDS analysis indicated that the particle was predominantly composed of O (2.48%), C (8.87%), Cu (12.96%), Cl (40.33%), and Na (35.01%). The composition of the particle aligned with the data found in the PDF card 05-0628. Consequently, it was inferred that the particle depicted in Figure 5a was halite.
Figure 6a displays the particle from the JN-5 sample, characterized by an irregular shape. The selected area electron diffraction (SAED) pattern within the dotted circle (Figure 6b) indicates a relatively well-ordered structure of the micro-nanoparticle. The d-spacing values in the (0 1 2), (2 0 2), (1 0 4), and (0 0 6) planes were measured at 3.860 Å, 2.094 Å, 3.044 Å, and 2.850 Å, respectively. EDS analysis revealed that the particle primarily consisted of O (32.02%), C (14.99%), Cu (15.61%), Ca (33.77%), and Sr (1.42%). The composition of the particle corresponded to the data found in the PDF card 05-0586. As a result, it was inferred that the particle depicted in Figure 6a was composed of calcite.
Figure 7a presents the particle from the JN-6 sample, consisting of a polymer chain structure. The selected area electron diffraction (SAED) pattern within the dotted circle (Figure 7b) confirms the amorphous nature of the micro-nanoparticle. EDS analysis indicated that the particle primarily contained O (33.00%), C (7.72%), Cu (9.27%), Ca (1.66%), Si (3.65%), and Fe (44.99%). Therefore, it was inferred that the particle depicted in Figure 7a was composed of carbonates containing Fe, Si, and Ca.
Figure 8a illustrates the particle from the JN-7 sample, characterized by an irregular shape. The selected area electron diffraction (SAED) pattern within the dotted circle (Figure 8b) confirms the amorphous nature of the micro-nanoparticle. EDS analysis indicated that the particle primarily consisted of O (15.78%), C (9.52%), Cu (16.47%), Ca (56.10%), and S (1.97%). Consequently, it was inferred that the particle depicted in Figure 8a was composed of a mixture of carbonate and sulfate, both containing calcium.
Figure 9a presents the particle from the JN-8 sample, displaying a substantial size. The selected area electron diffraction (SAED) pattern within the dotted circle (Figure 9b) confirms the amorphous nature of the micro-nanoparticle. EDS analysis indicated that the particle primarily contained O (30.78%), C (17.38%), Cu (13.07%), Ca (30.00%), S (1.63%), and Te (5.79%). Therefore, it was inferred that the particle depicted in Figure 9a consisted of a combination of carbonates and sulfates containing calcium and tellurium.
Figure 10a displays the particle from the JN-9 sample, which takes on an approximately oval shape. The selected area electron diffraction (SAED) pattern within the dotted circle (Figure 10b) confirms the amorphous nature of the micro-nanoparticle. EDS analysis determined that the particle primarily contained O (42.49%), C (21.55%), Cu (8.96%), Ca (10.62%), S (12.05%), and Na (2.55%). As such, it was inferred that the particle depicted in Figure 10a was composed of a mixture of carbonate and sulfate, both containing calcium and sodium.
Figure 11a features the particle from the JN-10 sample, characterized by its substantial size. The selected area electron diffraction (SAED) pattern within the dotted circle (Figure 11b) confirms the amorphous nature of the micro-nanoparticle. EDS analysis indicated that the particle primarily contained O (1.82%), C (18.68%), Cu (12.57%), Cl (34.23%), and Na (32.12%). Hence, it was inferred that the particle depicted in Figure 11a primarily consisted of NaCl and carbonate.
Figure 12a portrays the particle from the JN-11 sample, characterized by a granular appearance. The selected area electron diffraction (SAED) pattern within the dotted circle (Figure 12b) confirms the amorphous nature of the micro-nanoparticle. EDS analysis indicated that the particle primarily contained O (36.02%), C (12.20%), Cu (9.79%), Ca (11.28%), S (10.60%), Cl (1.19%), K (1.49%), Te (11.4%), and In (1.60%). Consequently, it was inferred that the particle depicted in Figure 12a consisted of a combination of carbonates, sulfates, and chlorine, containing calcium, potassium, indium, and tellurium.
Figure 13a showcases the particle from the JN-12 sample, which exhibits an irregular shape. The selected area electron diffraction (SAED) pattern within the dotted circle (Figure 13b) confirms the amorphous nature of the micro-nanoparticle. EDS analysis indicated that the particle primarily contained O (4.09%), C (14.10%), Cu (15.92%), Cl (32.92%), and Na (23.60%). As a result, it was inferred that the particle depicted in Figure 13a consisted mainly of NaCl, Na2CO3, and a small quantity of sulfate.
4.2. Micro-Nanoparticles in Geothermal Fluids in Zibo
Altogether, we analyzed nine particles from geothermal fluid samples obtained in Zibo. TEM and EDS results suggested that these micro-nanoparticles exhibited low crystallinity. They were primarily composed of common chemical elements typically found in groundwater, including C, O, Ca, Fe, S, Na, Cl, and a few anomalous elements like Ba. These elements were predominantly present in the form of carbonates and chlorides.
Figure 14a illustrates the particle from the ZB-1 sample, which appears as irregular aggregates. The selected area electron diffraction (SAED) pattern within the dotted circle (Figure 14b) shows the micro-nanoparticles transitioning from an amorphous to a crystalline state. EDS analysis indicated that the particle primarily contained O (27.36%), C (51.16%), Ca (1.15%), Cl (18.18%), and Si (2.14%). Consequently, it was inferred that the particle depicted in Figure 14a consisted mainly of carbonates containing calcium and sulfur.
Figure 15a showcases the particle from the ZB-2 sample, characterized by its irregular shape. The selected area electron diffraction (SAED) pattern within the dotted circle (Figure 15b) confirms the amorphous nature of the micro-nanoparticle. EDS analysis determined that the particle primarily contained O (53.38%), C (7.76%), Ca (3.56%), Cl (31.07%), and Si (4.21%). As a result, it was inferred that the particle depicted in Figure 15a was composed mainly of carbonates and chlorine, with calcium and silicon components.
Figure 16a presents the particle from the ZB-3 sample, characterized by its irregular shape. The selected area electron diffraction (SAED) pattern within the dotted circle (Figure 16b) confirms the amorphous nature of the micro-nanoparticle. EDS analysis determined that the particle primarily contained O (21.29%), C (13.55%), Ca (1.93%), Cl (17.48%), Na (33.26%), and Si (12.47%). Consequently, it was inferred that the particle depicted in Figure 16a was composed mainly of carbonates and chlorine, with calcium, sodium, and silicon components.
Figure 17a portrays the particle from the ZB-4 sample, displaying an irregular shape. The selected area electron diffraction (SAED) pattern within the dotted circle (Figure 17b) confirms the amorphous nature of the micro-nanoparticle. EDS analysis determined that the particle primarily contained O (46.58%), C (17.95%), Ca (1.56%), Fe (22.75%), and Si (11.14%). As a result, it was inferred that the particle depicted in Figure 17a consisted primarily of carbonates, containing calcium, iron, and silicon.
Figure 18a displays the particle from the ZB-5 sample, characterized by its irregular shape. The selected area electron diffraction (SAED) pattern within the dotted circle (Figure 18b) reveals a relatively well-ordered structure of the micro-nanoparticles. The d-spacing values in the (0 2 0), (0 2 1), and (1 0 2) planes were measured at 4.447 Å, 3.656 Å, and 2.753 Å, respectively. EDS analysis indicated that the particle primarily consisted of O (18.72%), C (42.87%), Ca (1.35%), Si (2.82%), S (7.50%), and Ba (26.71%). The composition of the particle matched the data found in the PDF card 05-0378. Therefore, it was inferred that the particle depicted in Figure 18a was composed of either witherite.
Figure 19a portrays the particle from the ZB-6 sample, presenting a granular appearance. The selected area electron diffraction (SAED) pattern within the dotted circle (Figure 19b) confirms the amorphous nature of the micro-nanoparticle. EDS analysis indicated that the particle primarily contained O (46.15%), C (32.55%), Ca (20.41), and Si (0.87%). As a result, it was inferred that the particle depicted in Figure 19a consisted mainly of carbonates, containing calcium and silicon.
Figure 19.
Particle morphology and diffraction pattern of ZB-6 sample.
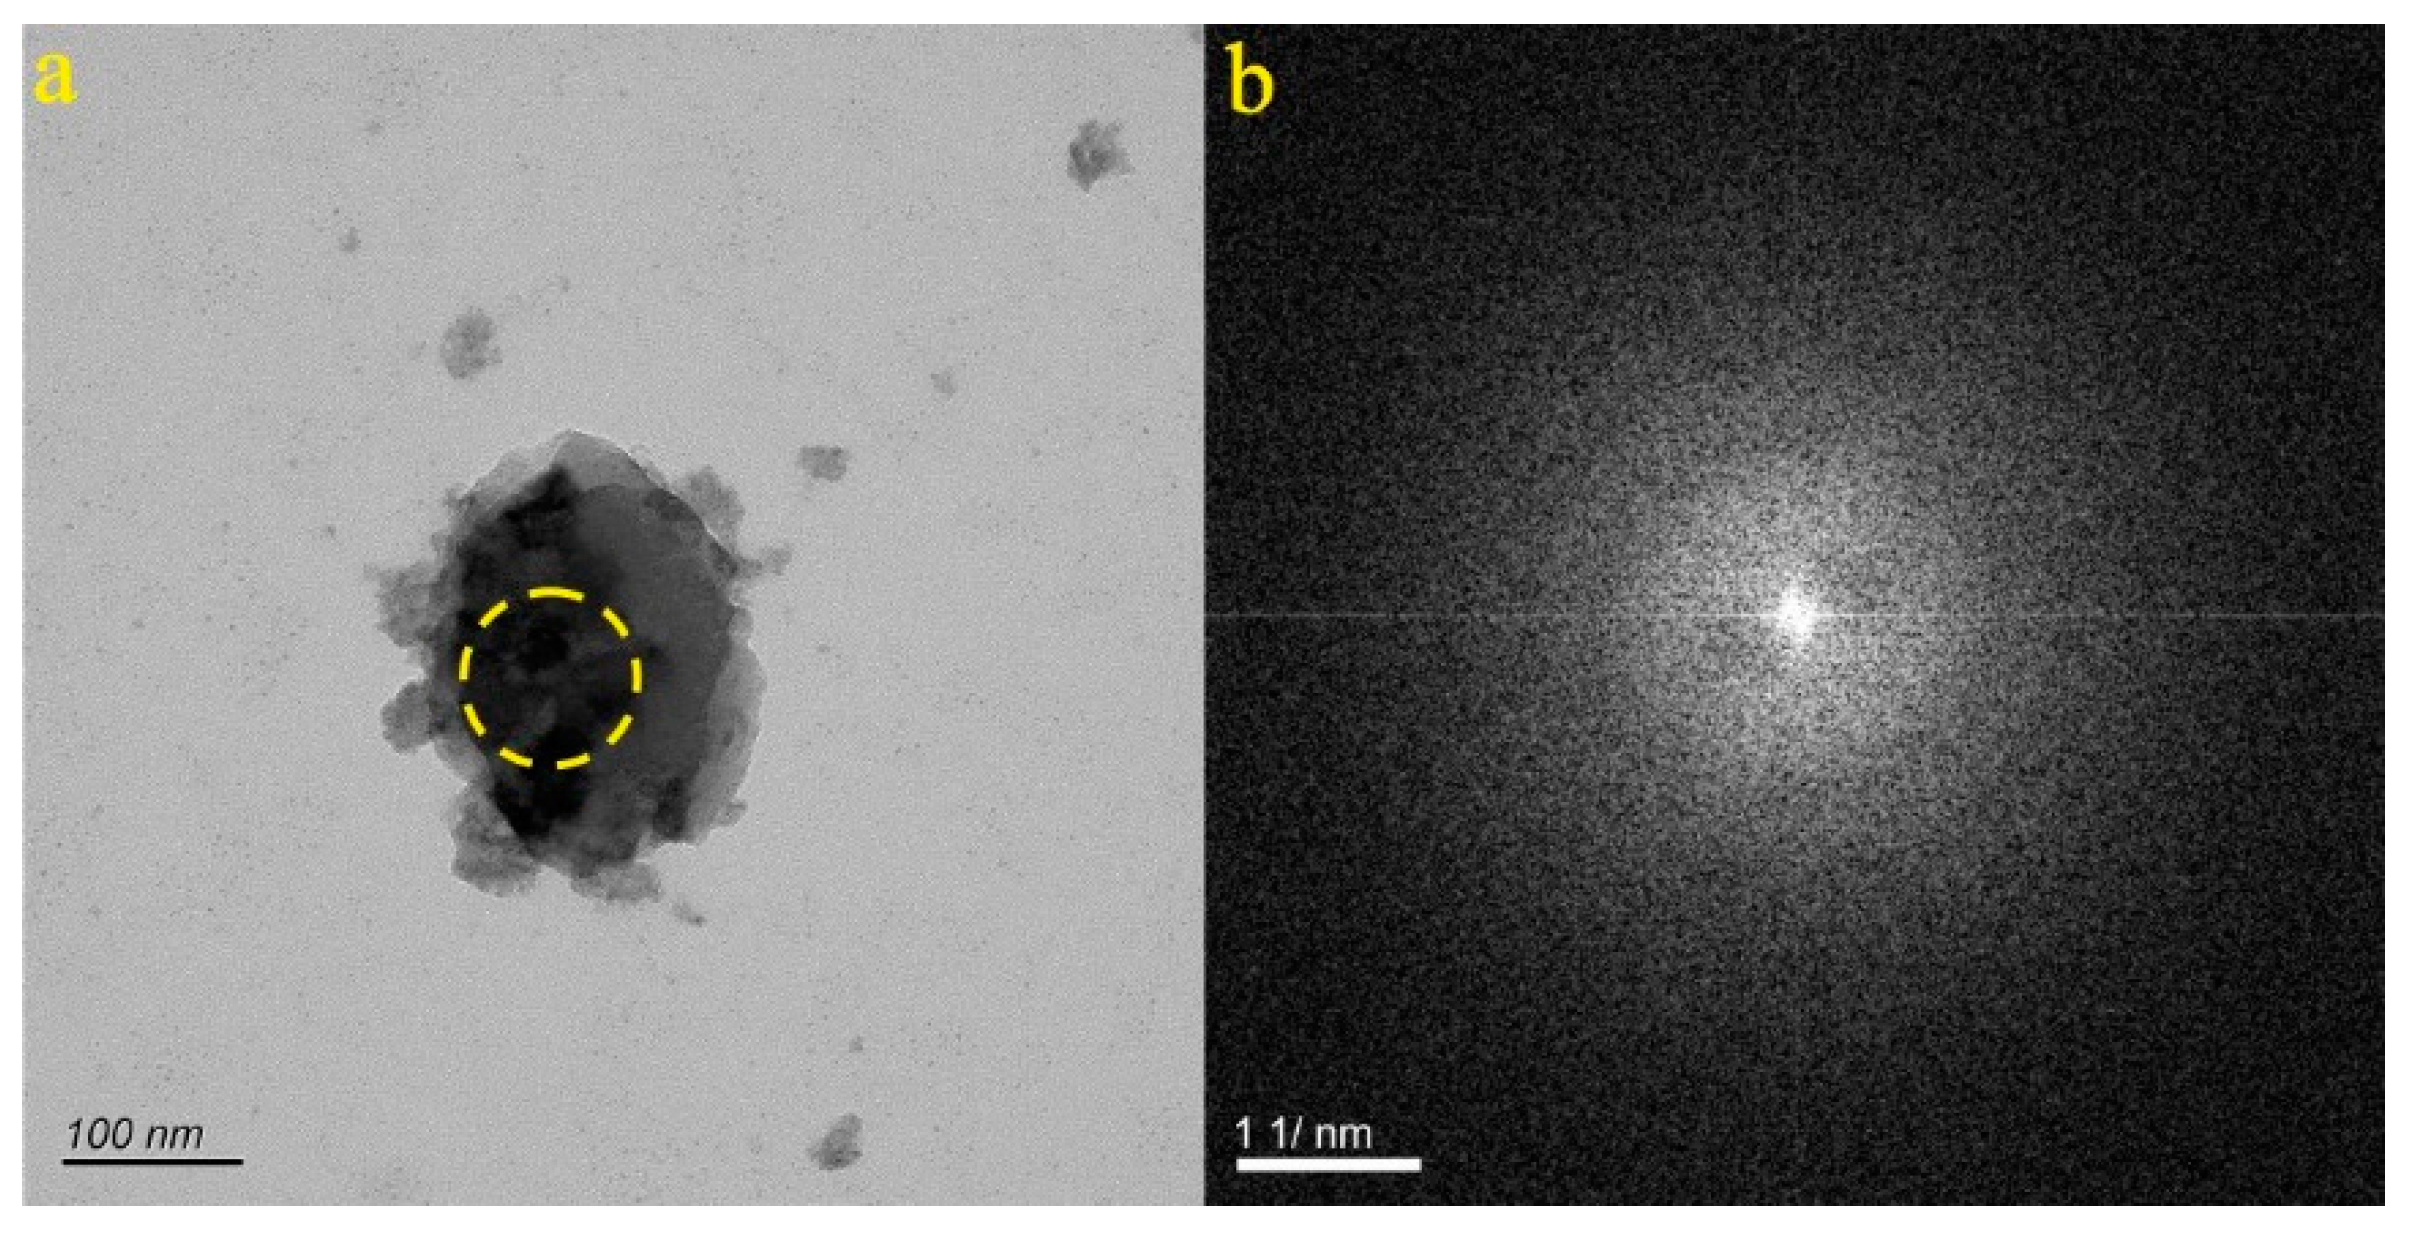
Figure 20a features the particle from the ZB-7 sample, which takes on an irregular shape. The selected area electron diffraction (SAED) pattern within the dotted circle (Figure 20b) confirms the amorphous nature of the micro-nanoparticle. EDS analysis indicated that the particle primarily contained O (29.62%), C (32.42%), Ca (1.56%), Si (9.70%), S (5.47%), Ca (2.02%), and Ba (20.74%). Consequently, it was inferred that the particle depicted in Figure 20a consisted mainly of a combination of carbonates and sulfates, containing calcium, silicon, and barium.
Figure 21a presents the particle from the ZB-8 sample, characterized by its irregular shape. The selected area electron diffraction (SAED) pattern within the dotted circle (Figure 21b) confirms the amorphous nature of the micro-nanoparticle. EDS analysis determined that the particle primarily contained O (31.92%), C (24.61%), Si (14.58%), Fe (19.87%), and Ca (8.99%). As a result, it was inferred that the particle depicted in Figure 21a consisted mainly of carbonates, containing calcium, silicon, and iron.
Figure 22a illustrates the particle from the ZB-9 sample, characterized by its irregular shape. The selected area electron diffraction (SAED) pattern within the dotted circle (Figure 22b) confirms the amorphous nature of the micro-nanoparticle. EDS analysis determined that the particle primarily contained O (31.95%), C (32.96%), Ca (30.77%), and Si (4.31%). Consequently, it was inferred that the particle depicted in Figure 22a primarily consisted of carbonates, containing calcium and sulfur.
5. Discussion
5.1. Characteristics of Micro-Nanoparticles in Geothermal Samples in the Central Area of Shandong Province
This study involved the collection of geothermal fluid samples from both Jinan and Zibo, allowing for a comparative analysis. Within these geothermal fluids from the central area of Shandong Province, a multitude of micro-nanoparticles were identified using nanoparticle tracking and examined via transmission electron microscopy (TEM). This examination encompassed an evaluation of their type, size, shape, lattice parameters, and chemical composition. The geothermal samples contained various micro-nanoparticles, including monocrystalline, polycrystalline, and amorphous particles. These particles predominantly existed in the form of aggregates, such as chains and irregular clusters, although some were individually dispersed. Their shapes exhibited a high degree of irregularity, and their sizes ranged from 100 nm to 5 μm, with significant variability. The energy-dispersive X-ray spectroscopy (EDS) results for the particles within the geothermal fluid samples revealed the presence of common elements often found in groundwater, such as O, C, Ca, Na, Cl, Mg, K, and S. Additionally, trace elements like Fe, Sr, Te, In, Pd, and Ba were detected. Carbon and oxygen were consistently identified in all particles, often making up a substantial proportion, owing to the carbonate nature of the aquifer. Furthermore, Ca, Fe, and Na were frequently observed in the samples, with mass fractions reaching as high as 62.23%, 44.99%, and 35.01%, respectively. Through a comprehensive analysis of the elements, lattice spacing, and atomic ratio relationships in these particles, it was determined that the particles primarily existed in the forms of carbonates, sulfates, and compounds containing chlorine, including Ca, Na, Fe, Mg, and K.
5.2. Characteristics and Significance of Micro-Nanoparticles in Geothermal Samples in Different Regions of the Central Area of Shandong Province
The analysis of the chemical composition of micro-nanoparticles in the geothermal fluid samples from Jinan and Zibo unveiled the presence of trace elements, revealing notable distinctions in the elemental composition between particles from these two regions. Specifically, micro-nanoparticles in the geothermal fluids from Jinan contained trace elements such as Sr, Te, In, and Pd. For instance, JN-5 exhibited a Sr content of 1.42%, while the Te content in micro-nanoparticles from JN-8 and JN-11 was 5.79% and 11.40%, respectively. The In content in JN-11 was 1.6%, and Pd content in JN-12 was 7.60% (Table 2). Conversely, the micro-nanoparticles in the geothermal fluids from Zibo displayed high levels of Ba content. For instance, the Ba content in ZB-5 and ZB-7 was 26.71% and 20.74%, respectively (Table 2). The EDS data in Table 2 illuminated that both regions' geothermal fluids contained a wealth of micro-nanoparticles, but variations in their chemical compositions and elemental concentrations were evident. These distinctions may be attributed to differences in the geological and hydrogeological backgrounds, as well as the surrounding environments of the two sampling areas.
Prior research on the geothermal resources in Jinan highlighted the significant role of a gabbro-diorite intrusion into the Ordovician Majiagou Formation limestone in shaping Jinan's geothermal resources. These studies identified the Jinan gabbro as rich in elements such as strontium and lead [30], with carbonate formations proving to be ideal environments for strontium enrichment [31]. When magma intrudes, it brings along various soluble chemical components, including trace elements like strontium and fluorine in geothermal fluids [29]. These elements are valuable for medicinal baths. Notably, tellurium ores are primarily of the dolomite-telluride type, indicating that dolomite serves as a crucial host for tellurium minerals. The primary aquifer in the area is situated within a carbonate formation, primarily composed of minerals like dolomite (CaMg(CO3)2), calcite (CaCO3), and gypsum (CaSO4) [32]. Therefore, the presence of tellurium in Jinan's geothermal fluids can be attributed to the dolomite within the aquifer rock. Indium, while abundant in Earth's crust, is also found in common hornblende. Thus, the presence of indium may be linked to the gabbro-diorite intrusion. In previous research on geothermal resources in Zibo, it was revealed that geothermal fluids are found within a fracture system, and their hydrochemical type is primarily SO4·Cl—Na·Ca. Alongside conventional elements, these geothermal fluids contain numerous trace elements such as silicon and barium [33,34,35]. Furthermore, as geothermal fluids undergo deep circulation, their temperature increases, enhancing dissolution and filtration processes. This leads to the dissolution of trace elements from the surrounding rock into the geothermal fluids, a consequence of alternating geothermal fluid circulation and favorable geochemical conditions [36].
5.3. Source and Significance of the Micro-Nanoparticles in the Geothermal Fluids
Micro-nanoparticles primarily originate through processes such as mineralization, taphrogenesis, and oxidation [34]. In the geothermal fluids of the central area of Shandong Province, these micro-nanoparticles are predominantly present in the form of carbonates, sulphates, and chlorides, suggesting that they exist within a relatively oxidized environment. Some micro-nanoparticles in the geothermal fluids are in the form of sulphates, which we believe are a result of the oxidation of sulfides. The analysis of trace elements indicates a strong connection between the formation of these micro-nanoparticles and magmatic activity. Furthermore, the central area of Shandong Province is characterized by the presence of numerous fault zones. These fault zones serve as pathways for oxygen to penetrate deep into the subsurface layers, thereby enhancing the overall oxygen fugacity between the different rock layers. This increased oxygen content in the subsurface environment contributes to the formation of various types of micro-nanoparticles in the geothermal fluids.
Indeed, fault activity plays a crucial role in the generation of micro-nanoparticles. It often leads to the mechanical disintegration, milling, and oxidation of the adjacent rocks, which fosters the formation of oxide particles [37]. Studies have indicated that there is a significant material exchange between ore bodies and aqueous environments [38]. Micro-nanoparticles can serve as carriers of evidence for deep mineral resources and provide insights into deep geothermal resources [39]. Importantly, they are relatively resilient to the influences of the surrounding biological environment. Furthermore, the hydraulic connections established through fault systems play a key role. Geothermal fluids are influenced not only by the pressure gradients along geological formations but also by the structural features dictated by faults. In many cases, these fluids flow along or across geological structures, and hydraulic connectivity can be established between different aquifers [36]. Therefore, the utilization of the characteristics of micro-nanoparticles in these fluids can be both feasible and essential for the detection of deep hidden geothermal resources. The temperature, chemical composition and content of karst water formed in different geothermal regions are different, which also proves that the recharge, circulation depth and circulation path of karst water in different regions are different. In addition, the geothermal fluids of carbonate thermal storage in the Luzhong geothermal area are in the non-equilibrium zone, and both of them belong to unsaturated, that is, the water-rock action has not yet reached the equilibrium state, and the dissolution is still in progress. Therefore, the differences in the types and contents of trace elements in geothermal fluids in the two regions can also be inferred to be different between the two aquifers.
5.4. Application Prospects of Nanomaterials in Fluids in Deep Geothermal Resource Exploration
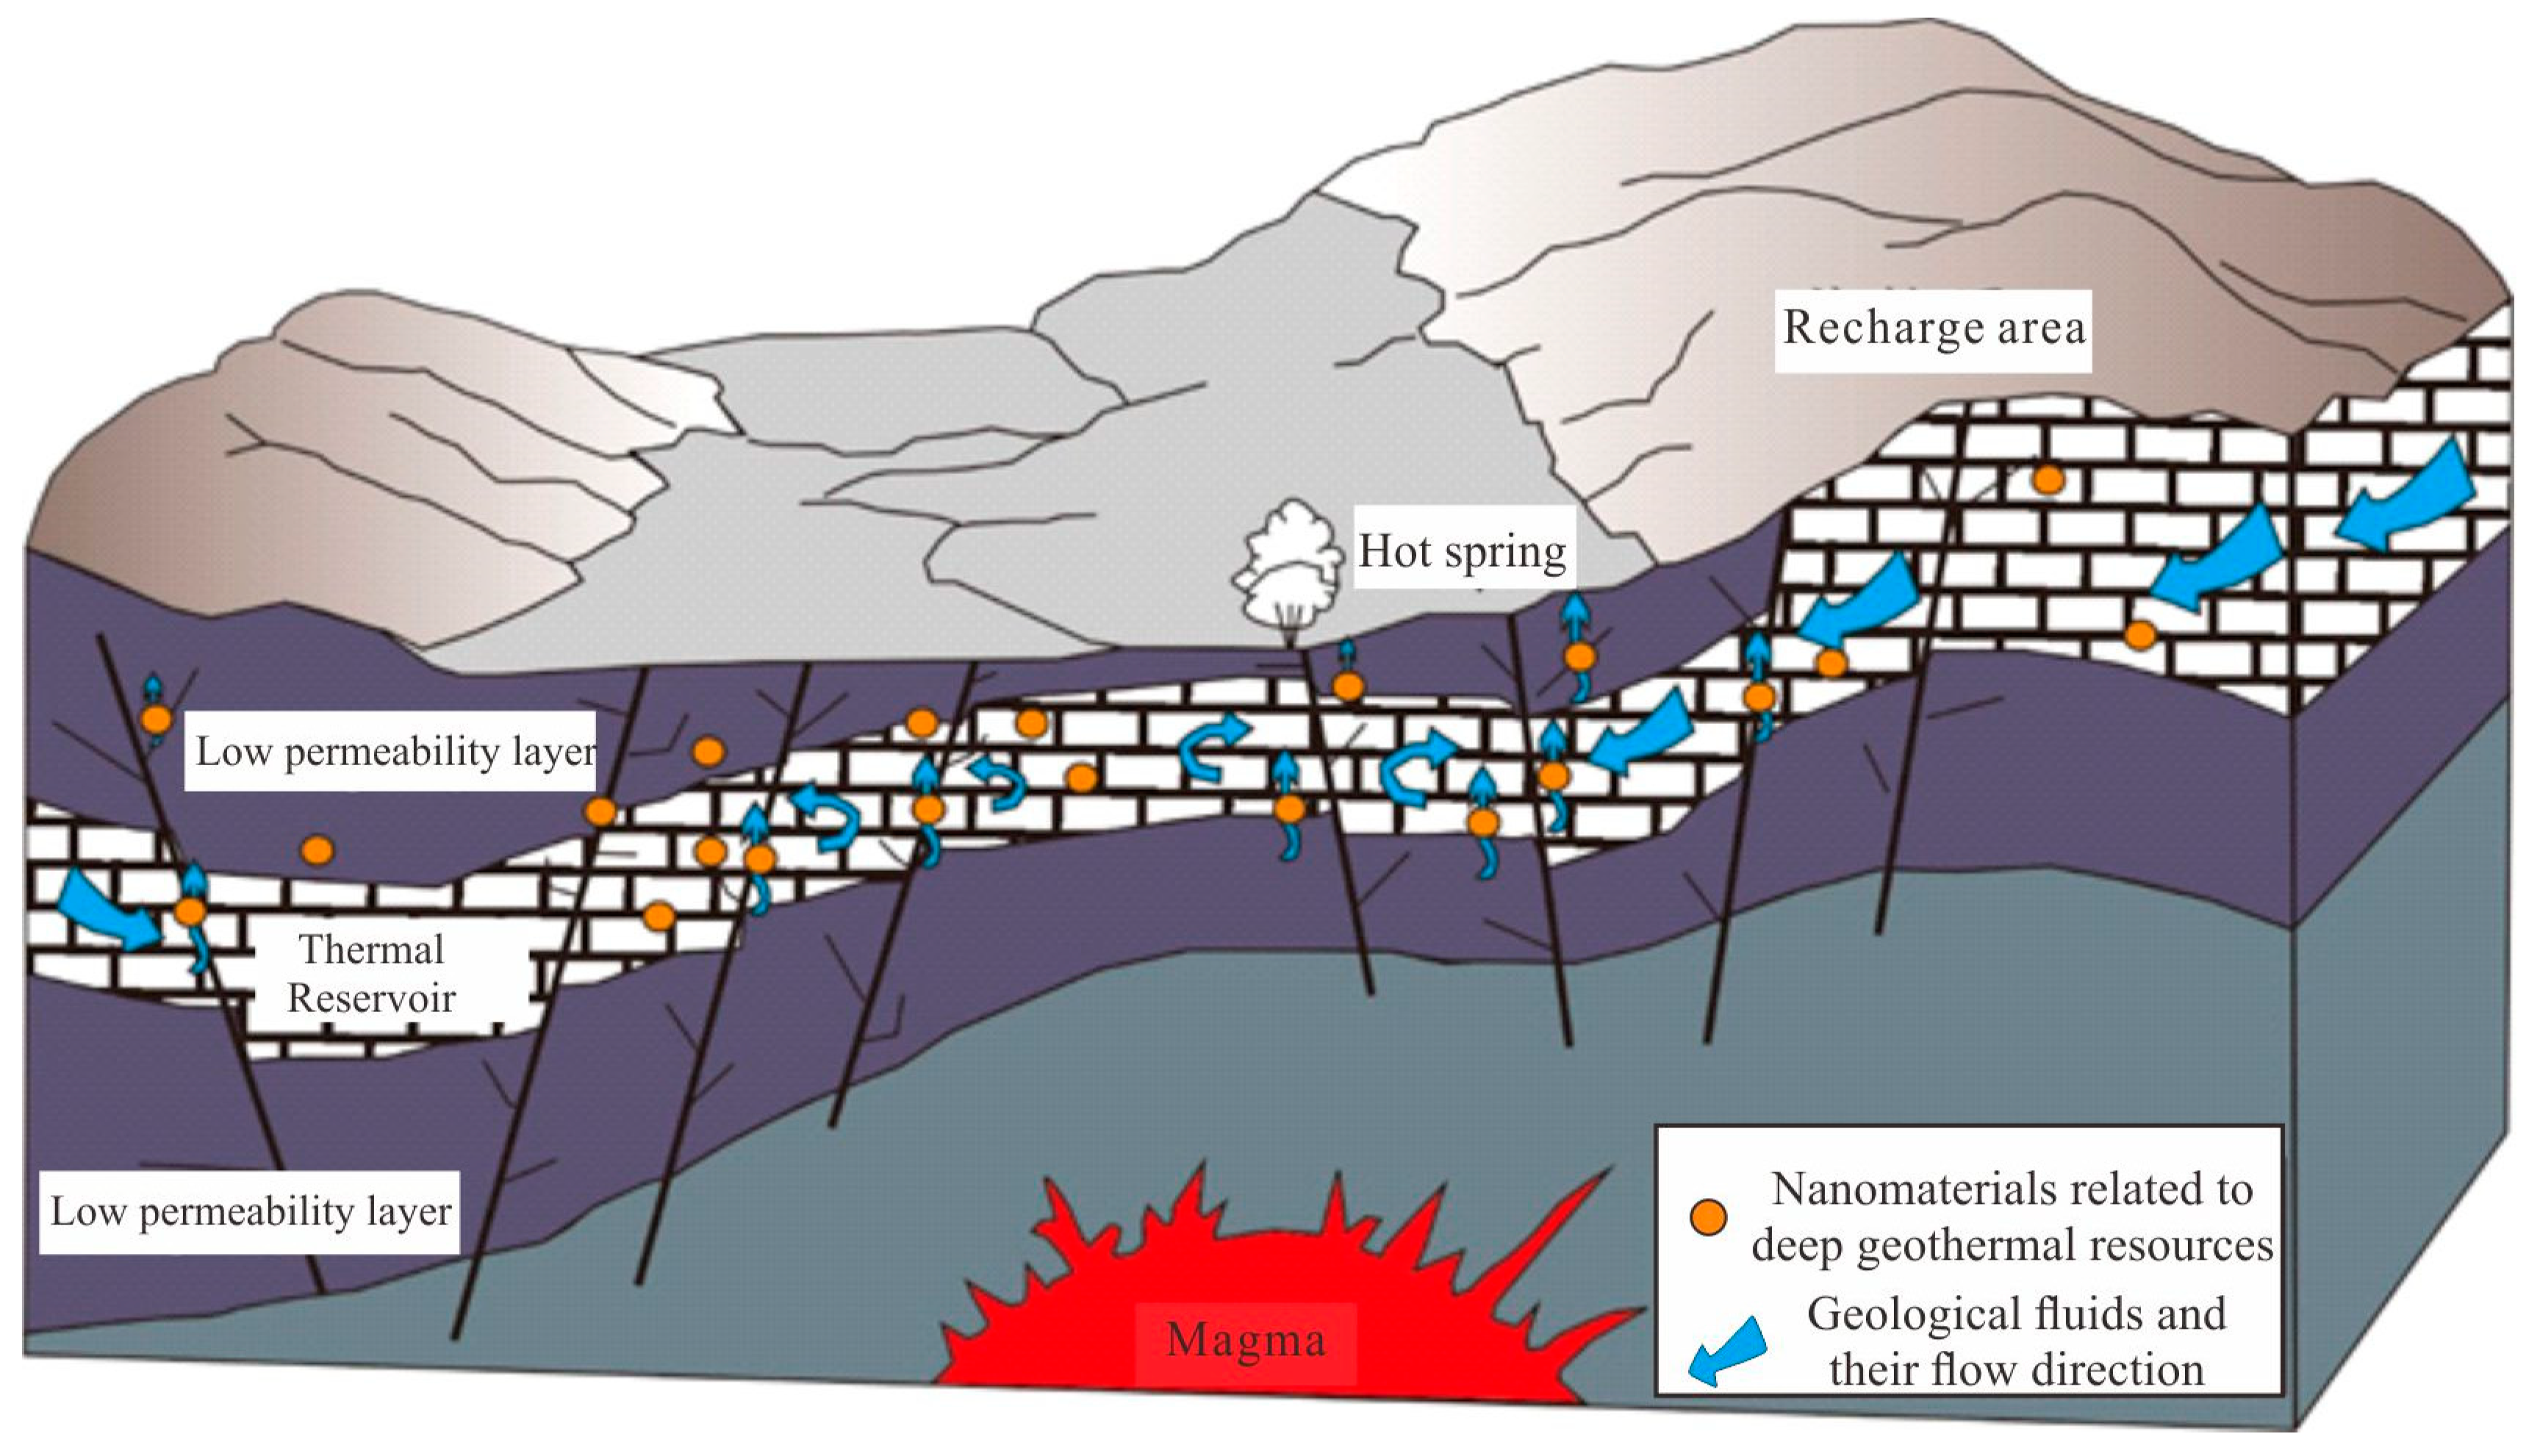
Geothermal resources represent a sustainable and eco-friendly energy source [40,41]. They not only provide a valuable supply of water and serve as tourist attractions but are also harnessed for medical treatments. As the depletion of fossil fuels persists, the quest for additional geothermal resources has become a paramount objective for researchers. While shallow geothermal resources have been extensively investigated and exploited, the focus has now shifted towards the Earth's deeper layers [42]. Deep geothermal resources are frequently linked to thermal reservoirs, which are distinctive geological formations. Fluids from the Earth's interior transport micro-nanoparticles associated with these thermal reservoirs, as depicted in Figure 19. The inherent characteristics of these nanomaterials, including their morphology, elemental composition, and polymerization state, provide valuable insights into the deep thermal reservoirs' properties. Therefore, it is entirely viable to employ nanomaterial analysis in geothermal fluids as a means to explore deep geothermal resources. Moreover, in comparison to traditional exploration techniques, employing nanomaterials in fluid analysis for deep geothermal resource research offers distinct advantages: (1) Penetrative Capability: Nanomaterials present in the fluid exhibit exceptional penetration, enabling detection at significant depths. (2) Diverse and Intuitive Anomalies: Anomalies within nanomaterials in fluids are multifaceted, intuitive, and dependable. Traditional geothermal fluid tests are typically restricted to identifying anomalies in fluid composition and content [43]. In contrast, nanomaterial anomalies in geological fluids encompass factors like type, size, morphology, structure, polymerization state, crystallization state, and element content of the particles, among other parameters. By considering multiple anomalies, analytical results become more comprehensive and scientifically sound [44,45]. For instance, the physical anomalies observed in nanomaterials within fluids enhance the clarity of analytical findings. Furthermore, the nanomaterials in geothermal fluids originate from their passage through the thermal reservoir. As these particles are directly linked to the thermal reservoir, they provide highly reliable information about deep geothermal energy. (3) Simplified and Versatile Sampling: Procedures for assessing nanomaterials in fluid to explore deep geothermal resources are straightforward, efficient, and largely impervious to terrain and geomorphology. The likelihood of contamination during nanomaterial collection is minimal, and the collection process is straightforward. Additionally, surface conditions, rock types, humidity, and temperature have minimal impact on the methodology. This approach can be effectively employed in diverse environments, including deserts, arid regions, and forests, where conventional exploration methods may encounter limitations [46]. In summary, the exploration of deep geothermal resources through the analysis of nanomaterials in fluids is not only theoretically and technically feasible but also holds immense practical potential.
Figure 19.
Generalized map of nanomaterial transport associated with deep geothermal resources in geothermal fields.
Figure 19.
Generalized map of nanomaterial transport associated with deep geothermal resources in geothermal fields.
6. Conclusions
Through analysis of micro-nanoparticles in geothermal fluids from the central area of Shandong Province, we found that the micro-nanoparticles in the geothermal fluids consist mainly of Fe, Na, Ga, Si, Mg, and K, with mostly carbonates, sulphates, and chlorine forms. The particles mainly exist as single particles and aggregates, and their sizes range from 100 nm to 5 μm. The particles are primarily irregular, massive, granular, or nearly spherical. EDS results showed that the chemical composition and element content of micro-nanoparticles in two areas are different, which suggested that there are some differences in the hydrogeological background. The micro-nanoparticles in the geothermal fluids in Jinan are affected mainly by the soluble chemical components originating from intrusive magma and the aquifer ore body. The micro-nanoparticles in the geothermal fluids in Zibo are affected mainly by fracture systems and aquifers. The differences in the types and contents of trace elements in geothermal fluids in the two regions can also be inferred to be different between the two aquifers. Analysis of the geological profile of the study area revealed that these micro-nanoparticles formed in close relationship with magmatic activity and fault activity and are in a relatively oxidizing environment. Traditional exploration techniques have certain drawbacks in exploring of deep geothermal resources, so new exploration theories and methods can yield breakthroughs in the prospecting of deep geothermal resources. This study provides a new concept for the detection of deep hidden geothermal resources—prospecting for deep hidden geothermal resources based on the characteristics of micro-nanoparticles in the geothermal fluids and obtaining information about these particles in the process of deep spatial migration. Moreover, the study of micro-nanoparticles can detect pollution in groundwater systems by analyzing the type, structure, element content, and other parameters of micro-nanoparticles and whether the anomaly is affected by deep geothermal resources or human factors.
Acknowledgments
This work was supported by the National Natural Science Foundation of China [grant numbers 42102076]; and the Natural Science Foundation of Shandong Province [grant number ZR2021QD037].
References
- Chen, M.X.; Wang, J.Y. Review and prospect on geothermal studies in China. Acta Geophysica sinica. 1994, 37, 320–338. [Google Scholar]
- Hu, S.B.; He, L.J.; Wang, J.Y. Compilation of heat flow data in the China continental area (3rd edition). Chinese Journal of geophysics. 2001, 611–626. [Google Scholar] [CrossRef]
- Gong, Y.L.; Wang, L.S.; Liu, S.W.; Li, C.; Han, Y.B.; Li, H.; Liu, B.; Cai, J.G. Distribution characteristics of terrestrial heat flow in Jiyang depression. Science in China (Series D). 2003, 33, 384–391. [Google Scholar]
- Hu, S.B.; Zhu, C.Q.; Xu, M.; Shan, J.N.; Tian, Y.T.; Rao, S.; Wang, J.Y. Thermal history reconstruction of sedimentary basin and its application. Geophysics in China. 2009, 785. [Google Scholar]
- Xu, S.G.; Guo, Y.S. Heat Foundation. Beijing Science Press. 2009.
- Li, Y.Y.; Duo, J.; Zhang, C.J.; Chi, G.X.; Wang, G.L.; Zhang, F.F.; Xing, Y.F.; Zhang, B.J. Genetic relationship between geothermal energy and hydrothermal uranium deposits: research progress and method. Geological Review. 2020, 66, 1361–1375. [Google Scholar]
- Zhang, J.; Dong, M.; Wang, B.Y.; Ai, Y.F.; Fang, G. Geophysical analysis of geothermal resources and temperature structure of crust and upper mantle beneath Guanzhong Basin of Shaanxi, China. J. Earth Sci. Environ. 2021, 43, 150–163. [Google Scholar] [CrossRef]
- Liao, Z.J.; Zhao, P. Yunnan-Tibet geothermal zone: geothermal resources and typical geothermal systems. Beijing Science Press. 1999.
- Wang, G.L.; Zhang, W.; Liang, J.Y.; Lin, W.J.; Liu, Z.M.; Wang, W.L. Evaluation of geothermal resources potential in China. Acta Geoscientica Sinica. 2017, 38, 449–459. [Google Scholar]
- Wang, S.; Lu, C.; Nan, G.; et al. Geothermal resources in Tibet of China: current status and prospective development. Environ. Earth Sci. 2017, 76, 1–31. [Google Scholar] [CrossRef]
- Wang, G.L.; Lu, C. Stimulation technology development of hot day rock and enhanced geothermal system driven by carbon neutrality target. Geol. Resour. 2023, 32, 85–95+126. [Google Scholar] [CrossRef]
- Wang, G.L.; Liu, Y.G.; Zhu, X.; Zhang, W. The status and development trend of geothermal resources in China. Earth Sci. Front. 2020, 27, 001–009. [Google Scholar] [CrossRef]
- Wang, G.; Lin, W.; Liu, F.; Gan, H.; Wang, S.; Yue, G.; Long, X.; Liu, Y. Theory and survey practice of deep heat accumulation in geothermal system and exploration practice. Acta Geologica Sinica 2023, 97, 639–660. [Google Scholar] [CrossRef]
- Wenjing Lin, Guiling Wang, Haonan Gan, Shengsheng Zhang, Zhen Zhao, Gaofan Yue, Xiting Long, 2022. Heat source model for Enhanced Geothermal Systems (EGS) under different geological conditions in China, Gondwana Research. [CrossRef]
- Yuan, G.Q.; Li, F.; Zheng, H.S.; Ding, Z.Q. Geophysical technologies and their application effects for exploration of deep metallic mineral. Comput. Tech. Geophys. Geochem. Exploration. 2010, 32, 495–499. [Google Scholar]
- Li, X.; Wang, F.; Luo, D.F.; et al. The effects of applying integrated geophysical method to the prospecting for the Jiangcheng concealed lead Yunnan Province. Geophys. Geochem. Exploration. 2015, 39, 1119–1123. [Google Scholar] [CrossRef]
- Zhang, S.; Li, F.L.; Gong, J.J.; Bao, Z.Y.; Xie, S.Y.; Cui, F.; Su, Z.W.; Zeng, Y.H. Application of hydrocarbons in concealed tungsten ore prediction in Weijia, Nanling Area. Earth Sci. —J. China Univ. Geosci. 2012, 37, 1149–1159. [Google Scholar] [CrossRef]
- Chen, K.; Jiao, J.J.; Huang, J.; Huang, R. Multivariate statistical evaluation of trace elements in groundwater in a coastal area in Shenzhen, China. Environ. Pollut. 2007, 147, 771–780. [Google Scholar] [CrossRef]
- Zhou, F.; Zhu, J.; Zhang, P.; Yuan, S.H. Effect of groundwater components on hydroxyl radical production by Fe (Ⅱ) oxygenation. Earth Sci. 2017, 42, 1039–1044. [Google Scholar] [CrossRef]
- Cao, J.J. A technique for detecting concealed deposits by combining geogas particle characteristics with element concentrations. Metal mine 2009, 2, 1–4. [Google Scholar]
- Frimmel, F.H.; Niessner, R. Nanoparticles in the water cycle. (No Title). 2010.
- Banfield, J.F.; Zhang, H. Nanoparticles in the environment. Rev. Mineral. Geochem. 2001, 44, 1–58. [Google Scholar] [CrossRef]
- Bakshi, S.; He, Z.L.; Harris, W.G. Natural nanoparticles: implications for environment and human health. Crit. Rev. Environ. Sci. Technol. 2015, 45, 861–904. [Google Scholar] [CrossRef]
- Consani, S.; Carbone, C.; Dinelli, E.; Balić-Žunić, T.; Cutroneo, L.; Capello, M.; Salviulo, G.; Lucchetti, G. Metal transport and remobilisation in a basin affected by acid mine drainage: the role of ochreous amorphous precipitates. Environ. Sci. Pollut. Res. 2017, 24, 15735–15747. [Google Scholar] [CrossRef] [PubMed]
- Tan, X.; Bo, B.; Zhang, P.; et al. Carbonaceous nanoparticles in Zibo hot springs: Implications for the cycling of carbon and associated elements. Environ. Chem. Lett. 2021, 19, 4009–4014. [Google Scholar] [CrossRef]
- Wang, L.S.; Li, C.; Liu, S.W.; Li, H.; Xu, M.J.; Yu, D.Y.; Jia, C.Z.; Wei, G.Q. Terrestrial heat flow distribution in Kuqa foreland basin, Tarim, NW China. Pet. Explor. Dev. 2005, (04), 79–83. [Google Scholar]
- Zhou, S.C. Study on buried geologic body and fractured atmospheric field. Final report of the project funded by the National Natural Science Foundation. 2013.
- Liu, X.H.; Tong, C.H. Preliminary study on elements transportation in underground vitrification form. Nucl. Phys. Rev. 2009, 26, 64–68. [Google Scholar]
- Li, C.S.; Zhao, Y.X.; Wang, S.J.; Zhang, H.L. Analysis of the rules of water enrichment in the geothermal field, northern Jinan, Shandong Province. Earth Environ. 2008, (02), 155–160. [Google Scholar] [CrossRef]
- Meng, F.C.; Xue, H.M.; Li, T.F.; Yang, H.R.; Liu, L.F. Enriched characteristics of late Mesozoic mantle under the Sulu orogenic belt: geochemical evidence from gabbro in Rushan. Atca Petrologica Sinica 2005, 21, 1583–1592. [Google Scholar]
- Liu, Q.X.; Wang, G.L.; Zhang, F.W. Geochemical environment of trace element strontium (Sr) enriched in mineral waters. Hydrogeol. Eng. Geol. 2004, 19–23. [Google Scholar]
- Xu, H.Z.; Duan, X.M.; Gao, Z.D.; Wang, Q.B.; Li, W.P.; Yin, X.L. Hydrochemical study of karst groundwater in the Jinan spring catchment. Hydrogeol. Eng. Geol. 2007, 15–19. [Google Scholar]
- Liu, K.; Cao, X.H. Preliminary study on geothermal resources in Nanding, Zibo. Professional Committee of China Energy Research Society. Selected papers of the third National Geothermal Academic Conference. Beijing Science Press. 1989, 91-99.
- Yang, S.; Zhang, H.D.; Li, W.Z.; Wu, L. Genesis of geothermal anomaly in Southern Zhangdian district of Zibo City. Hydrogeol. Eng. Geol. 2005, 32, 59–62. [Google Scholar]
- Xiang, Q.K.; Han, J.J.; Li, C.L.; Zhang, L.X. Research on forming condition of geothermal resource in Zhangdian region of Zibo City. Shandong Land Resour. 2009, 25, 33–36. [Google Scholar]
- Jiang, L.L.; Sui, H.B.; Kang, F.X.; Li, C.S.; Wei, S.M.; Yu, L.Q.; Li, Y. Hydrogeochemical characteristics and formation mechanism of the karst thermal reservoir in the northern edge of the Luzhong Uplift. Carsologica Sinica. 2023, 42, 1–23. [Google Scholar] [CrossRef]
- Li, Y.K.; Cao, J.J.; Chen, J.; Yi, J. The research of particles carried by ascending gas flow from Qingmingshan Cu-Ni sulfide deposit in Guangxi Province. Acta Petrologica Sinica. 2017, 33, 831–842. [Google Scholar]
- Edmunds, W.M.; Smedley, P.L. Residence time indicators in groundwater: the East Midlands Triassic sandstone aquifer. Appl. Geochem. 2000, 15, 737–752. [Google Scholar] [CrossRef]
- Lu, Q.M.; Cao, J.J.; Mi, Y.B.; Liu, X.; Hu, G. Study of nanoparticles in groundwater of Yagongtang Cu-Pb-Zn-S polymetallic deposit, Hunan Province. Metal Mine. 2020, 143–153. [Google Scholar] [CrossRef]
- Duo, J. The basic characteristics of the Yangbajing geothermal field-A typical high temperature geothermal system. Eng. Sci. 2003, 5, 42–47. [Google Scholar]
- Zhu, C.Q.; Qiu, N.S.; Chang, J.; Rao, S. Current situation of geothermal resource industry and the future development of geothermal education. Chin. Geol. Educ. 2016, 3. [Google Scholar] [CrossRef]
- Lin, W.J.; Liu, Z.M.; Wang, W.L.; Wang, G.L. The assessment of geothermal resource potential of China. Geol. China 2013, 40, 312–321. [Google Scholar]
- Tong, C.H.; Li, J.C.; Ge, L.Q. A new form of elemental migration and its influence on geochemical environments. J. Chengdu Univ. Technol. 2002, 29, 567–570. [Google Scholar] [CrossRef]
- Liu, X.; Cao, J.; Li, Y.; et al. A study of metal-bearing nanoparticles from the Kangjiawan Pb-Zn deposit and their prospecting significance. Ore Geol. Rev. 2019, 105, 375–386. [Google Scholar] [CrossRef]
- Cao, J.; Cheng, S.; Luo, S.; et al. Study of particles in the ascending gas of ruptures caused by the 2008 Wenchuan earthquake. Applied Geochemistry. 2017, 82, 38–46. [Google Scholar] [CrossRef]
- Xu, X.H. Present situation and trending of geochemical prospecting techniques for metal mineral resources. Contrib. Geol. Miner. Resour. Res. 2000, 15, 17–23. [Google Scholar]
Figure 1.
Locations of the sampling points.
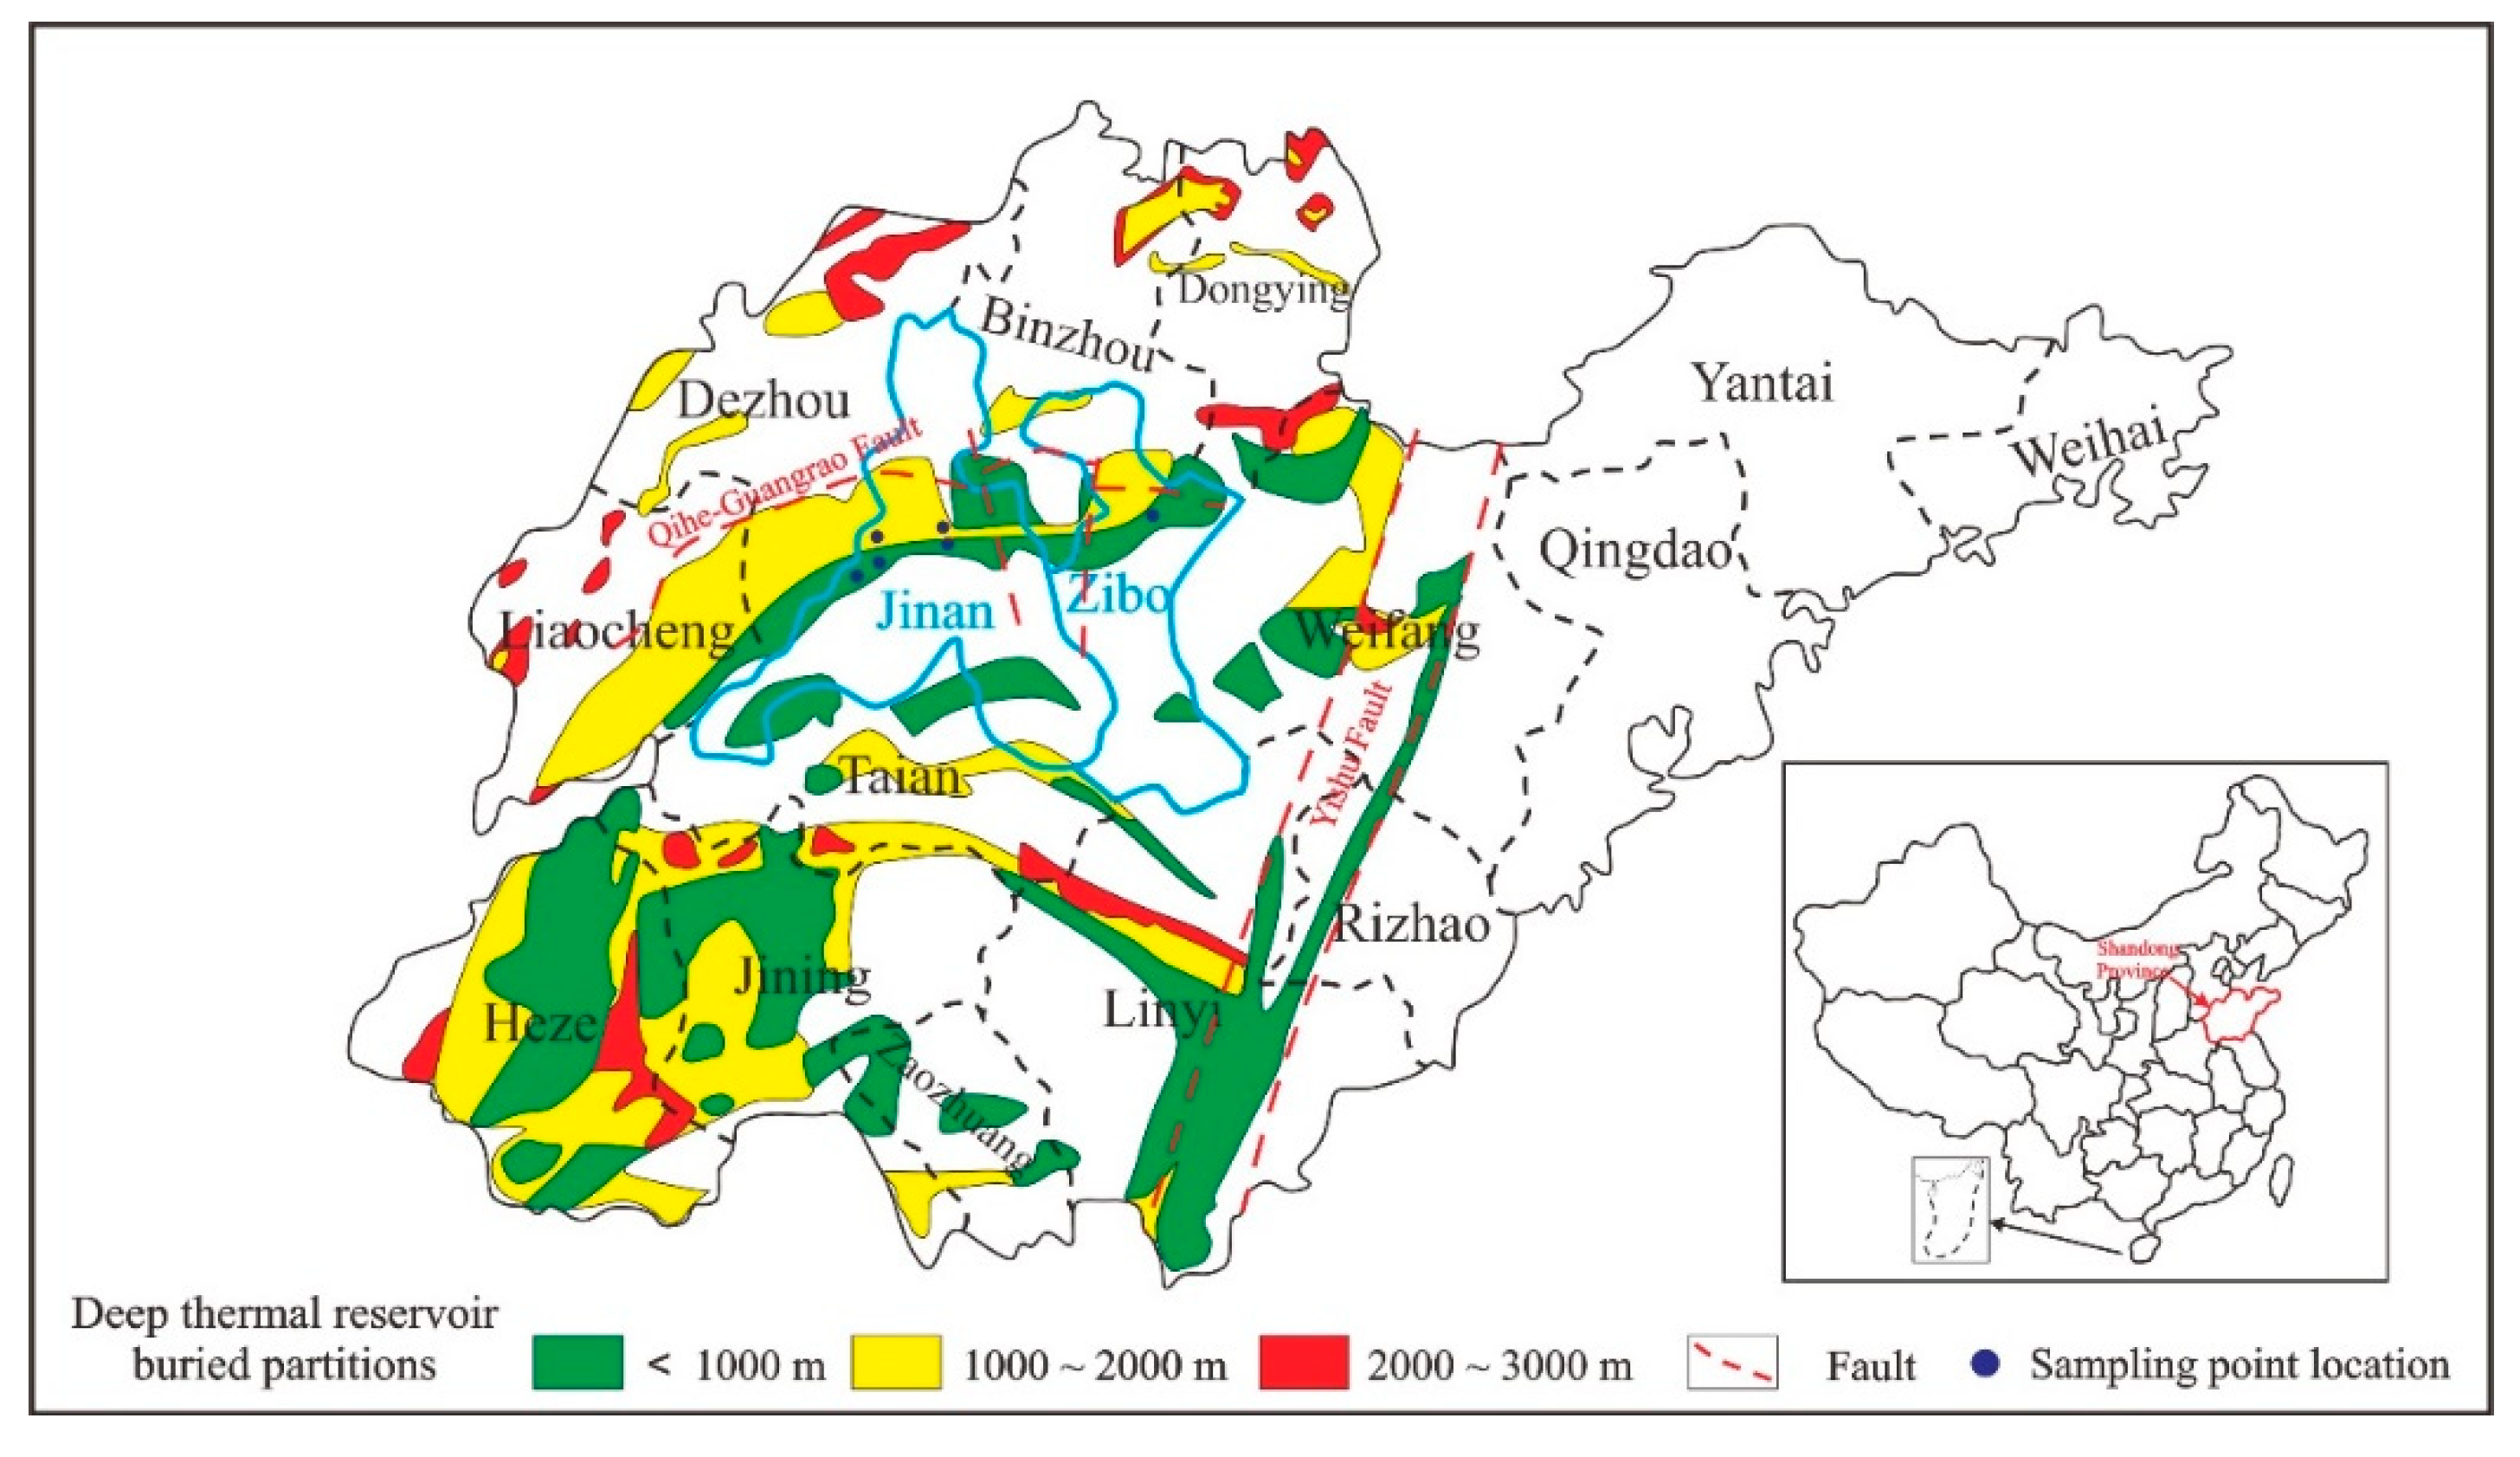
Figure 2.
Particle morphology and diffraction pattern of JN-1 sample.
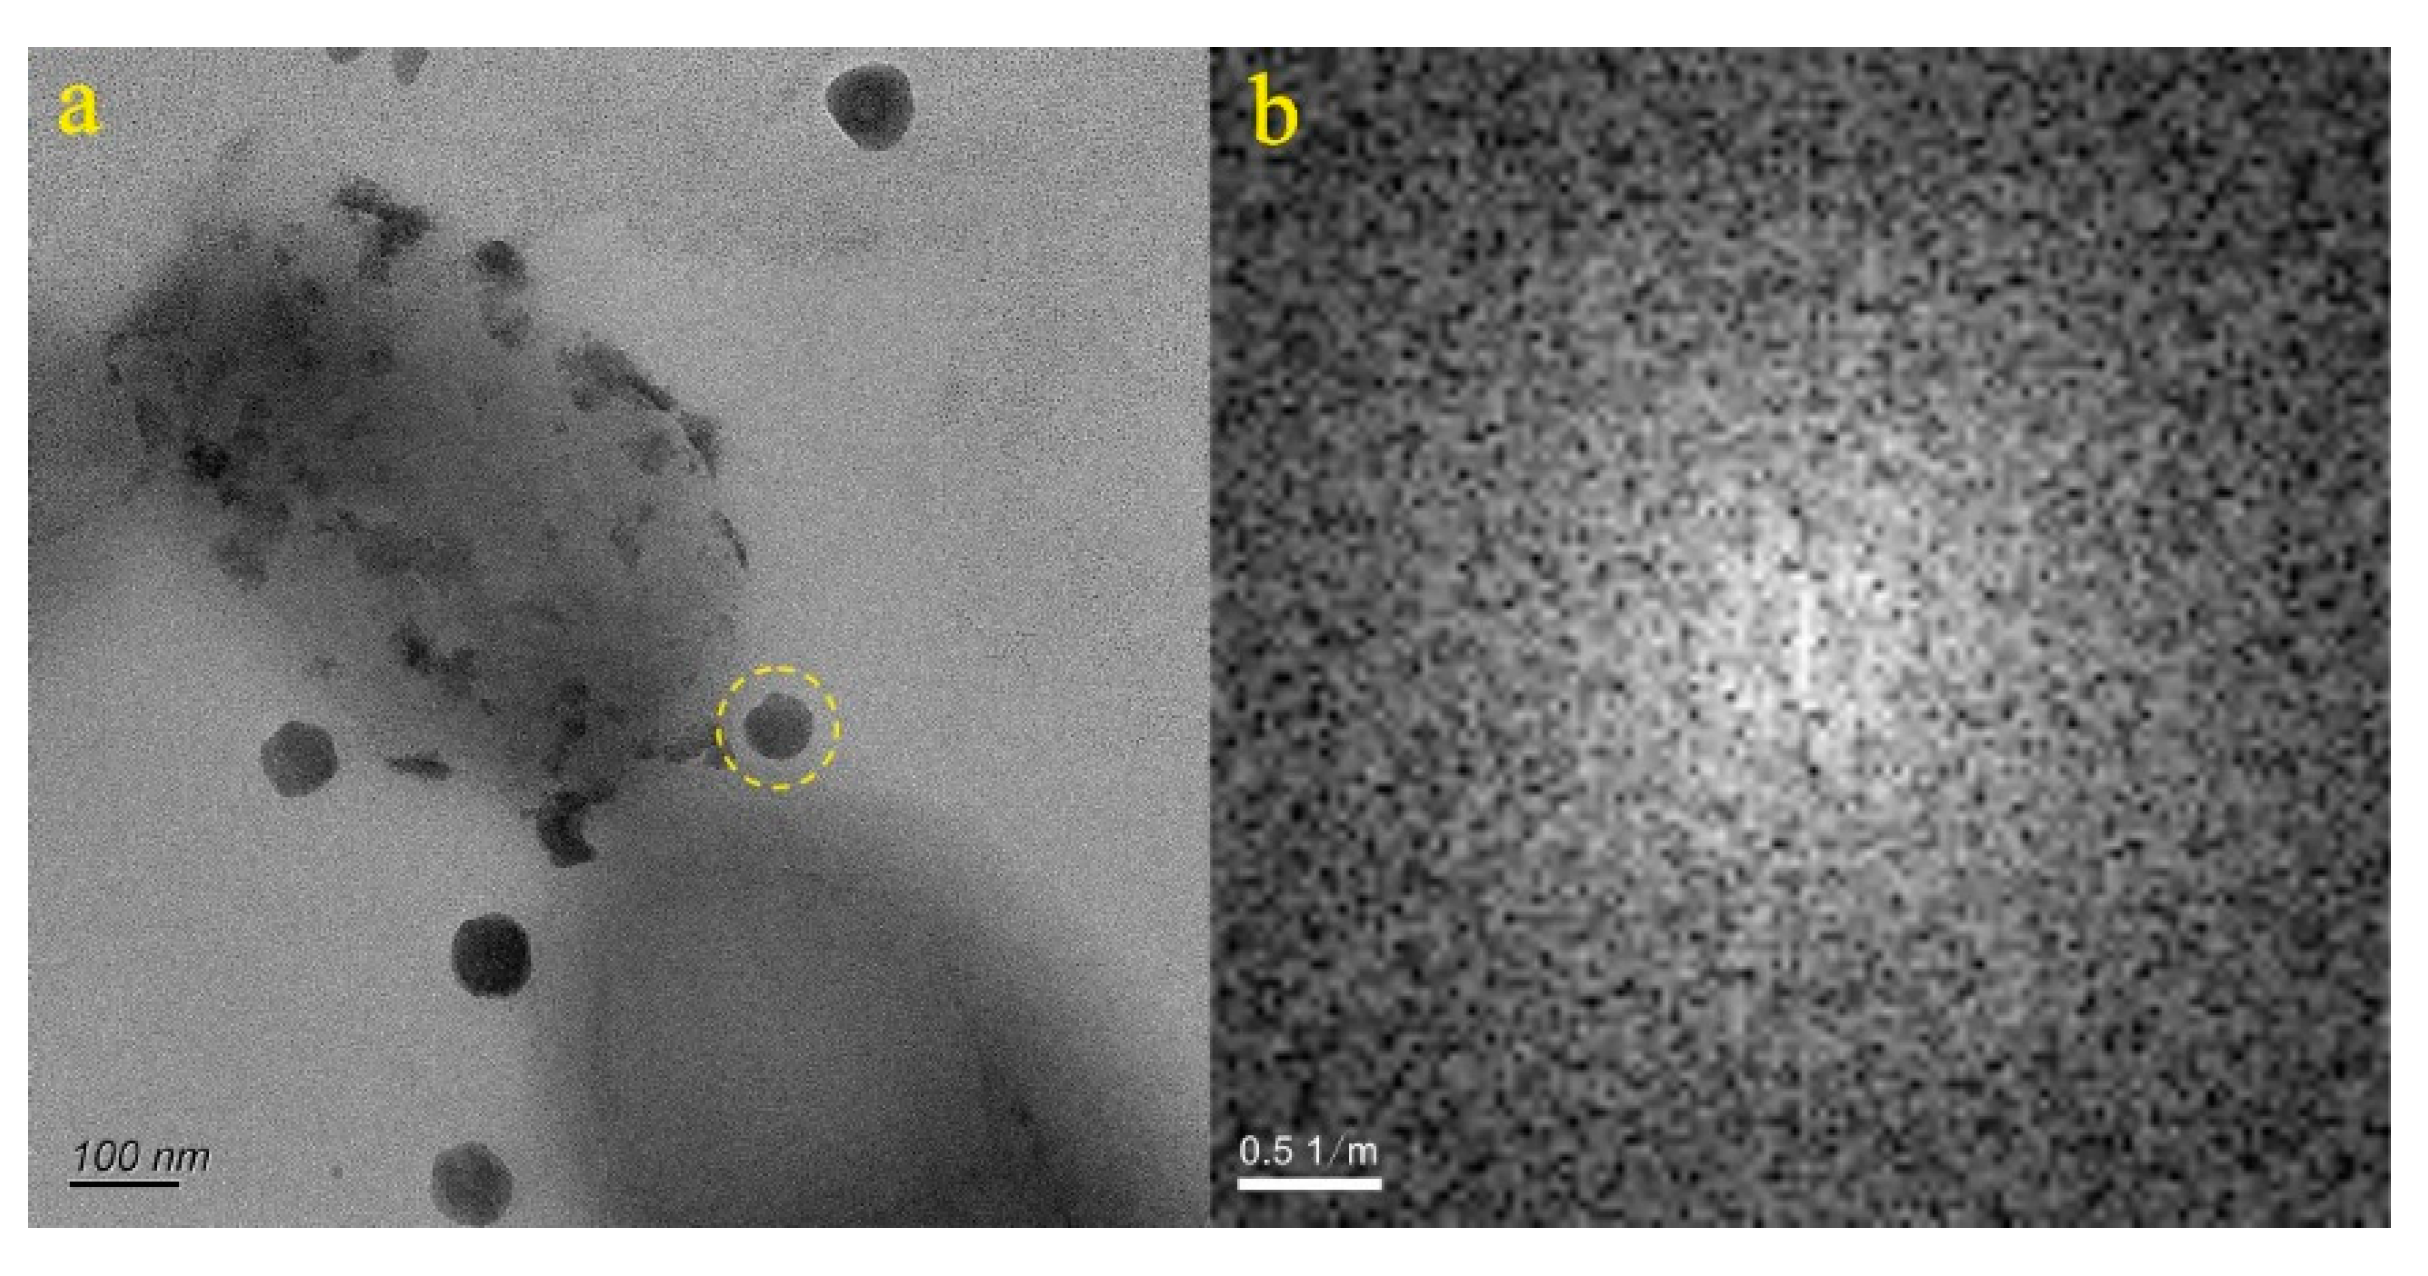
Figure 3.
Particle morphology of JN-2 sample.
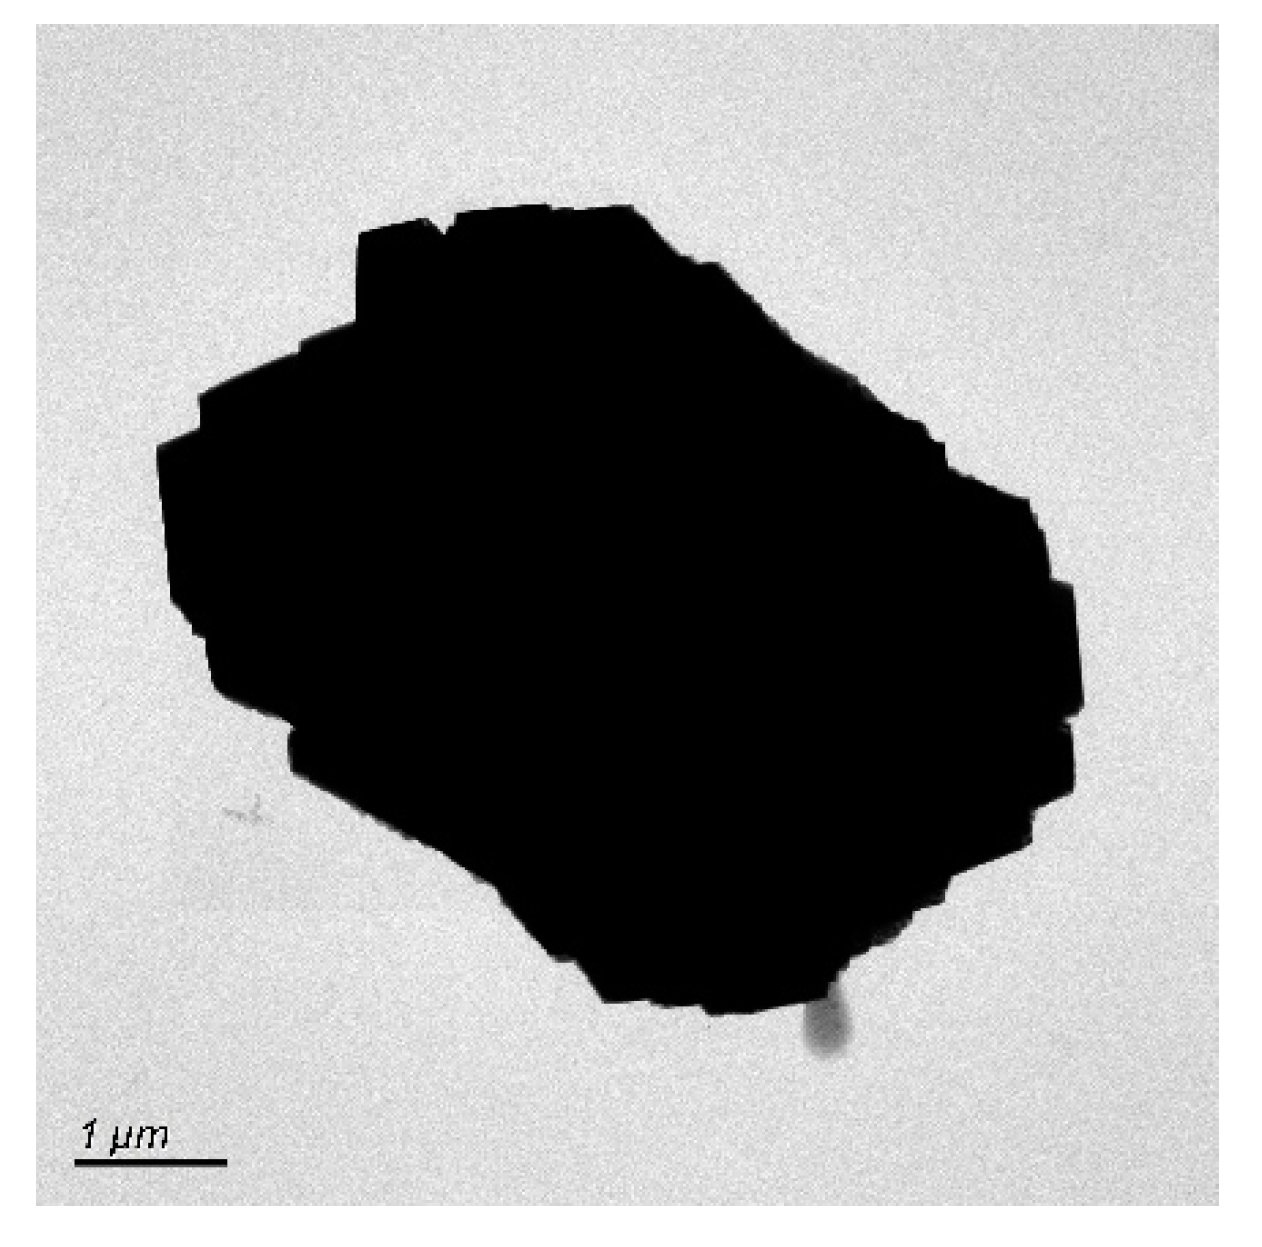
Figure 4.
Particle morphology and diffraction pattern of JN-3 sample.
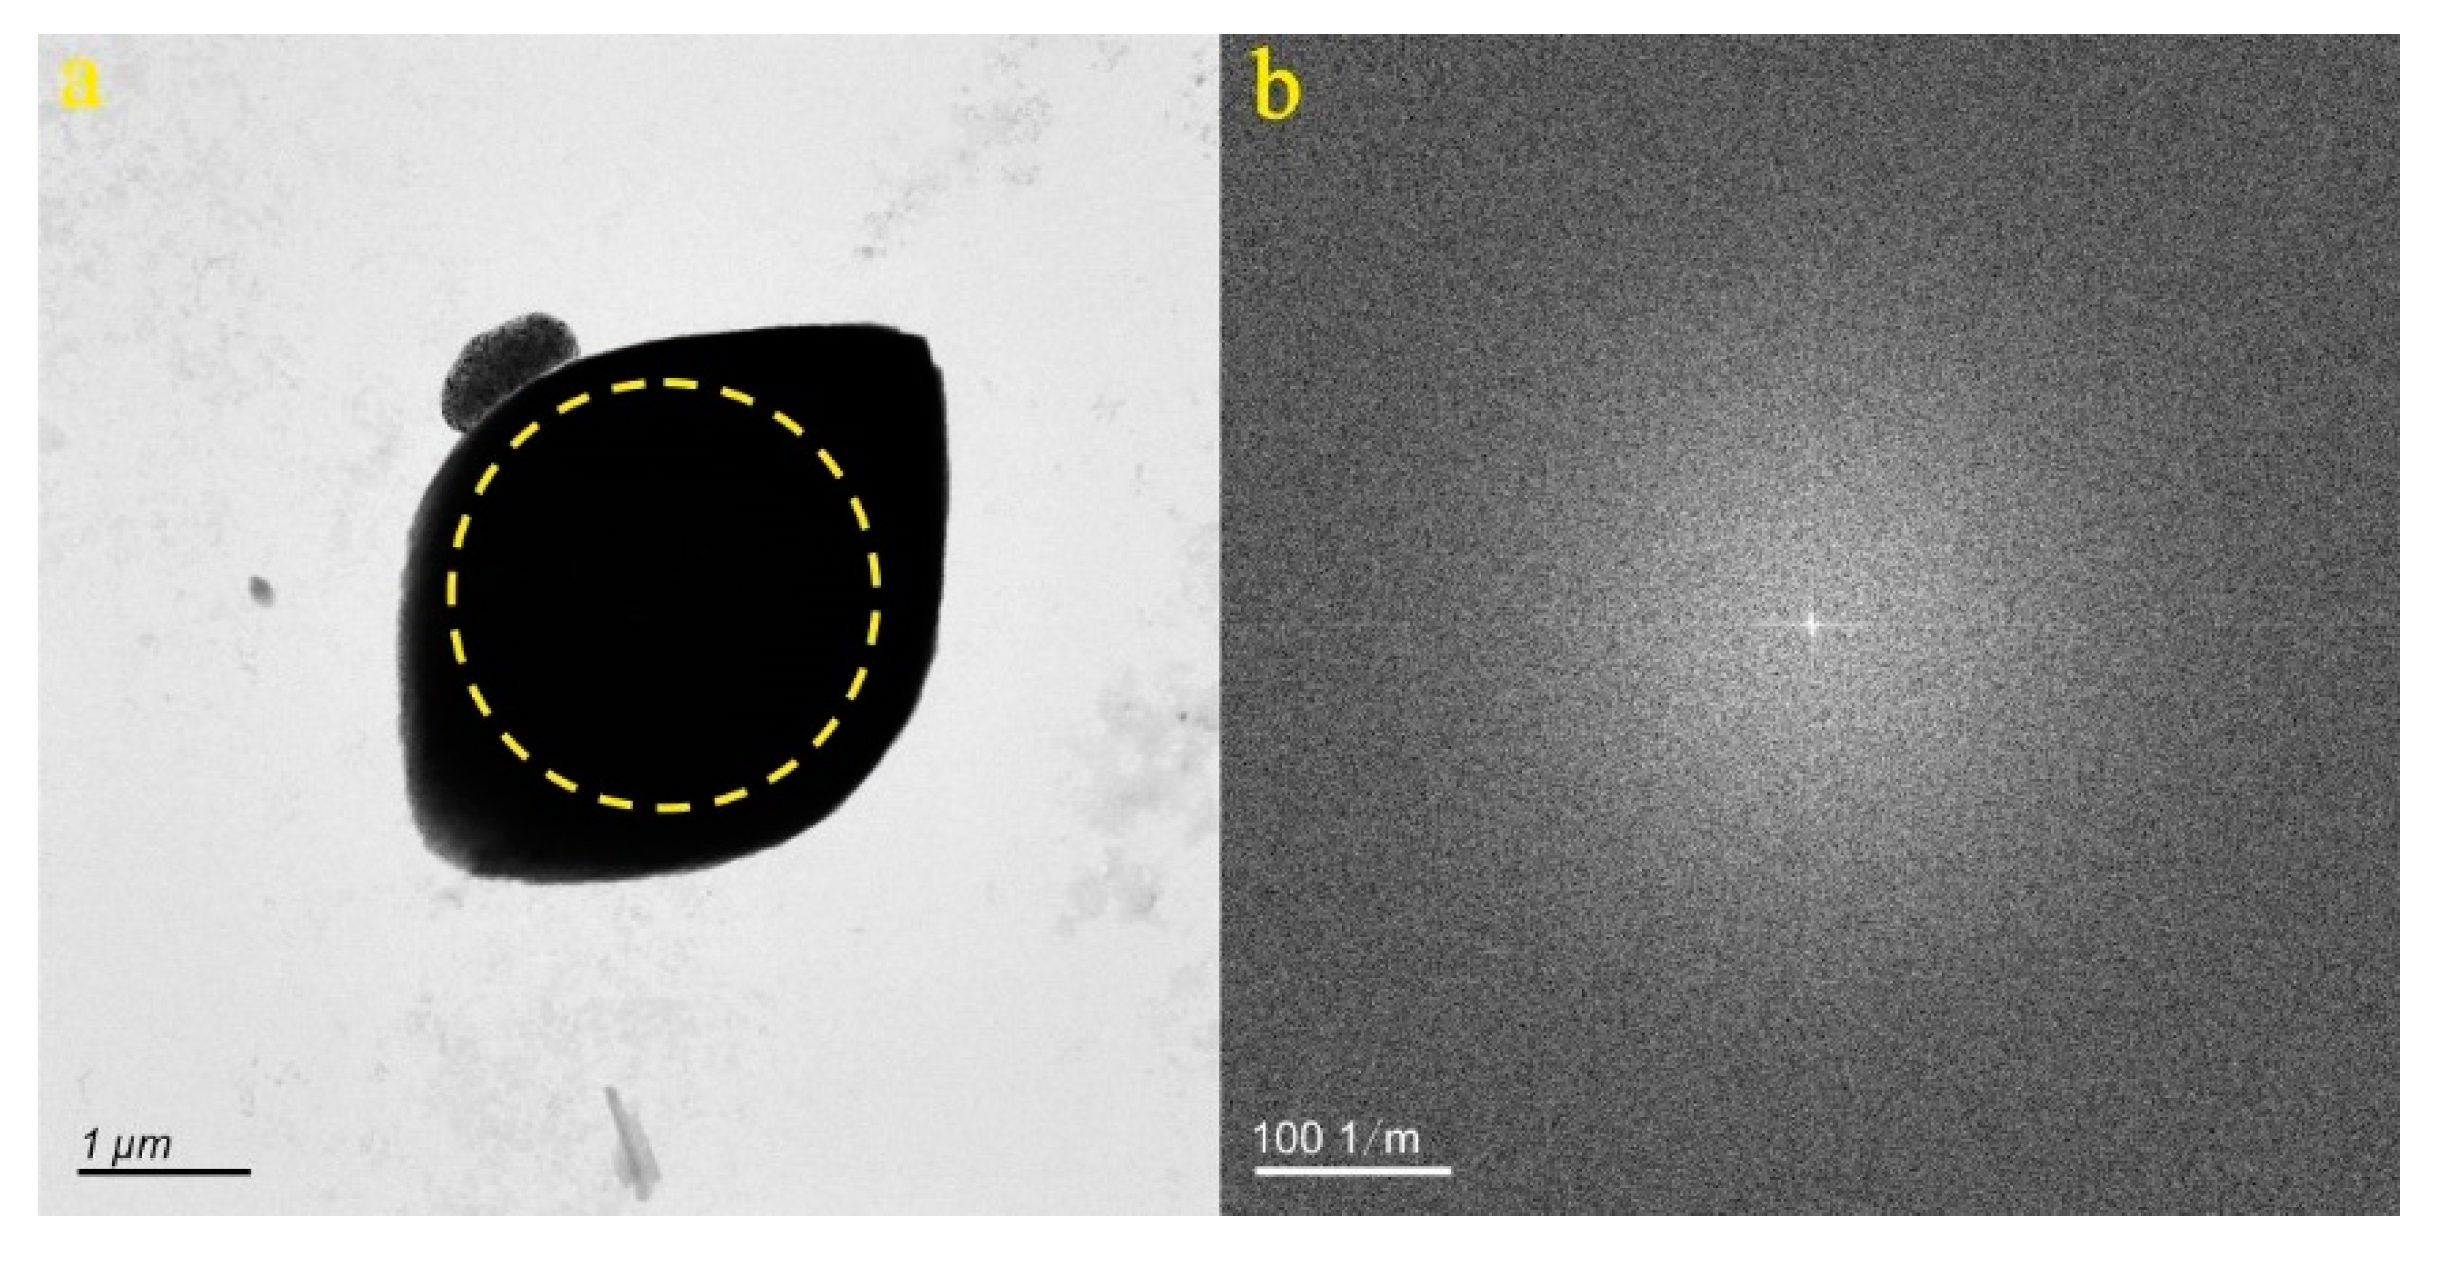
Figure 5.
Particle morphology and diffraction pattern of JN-4 sample.
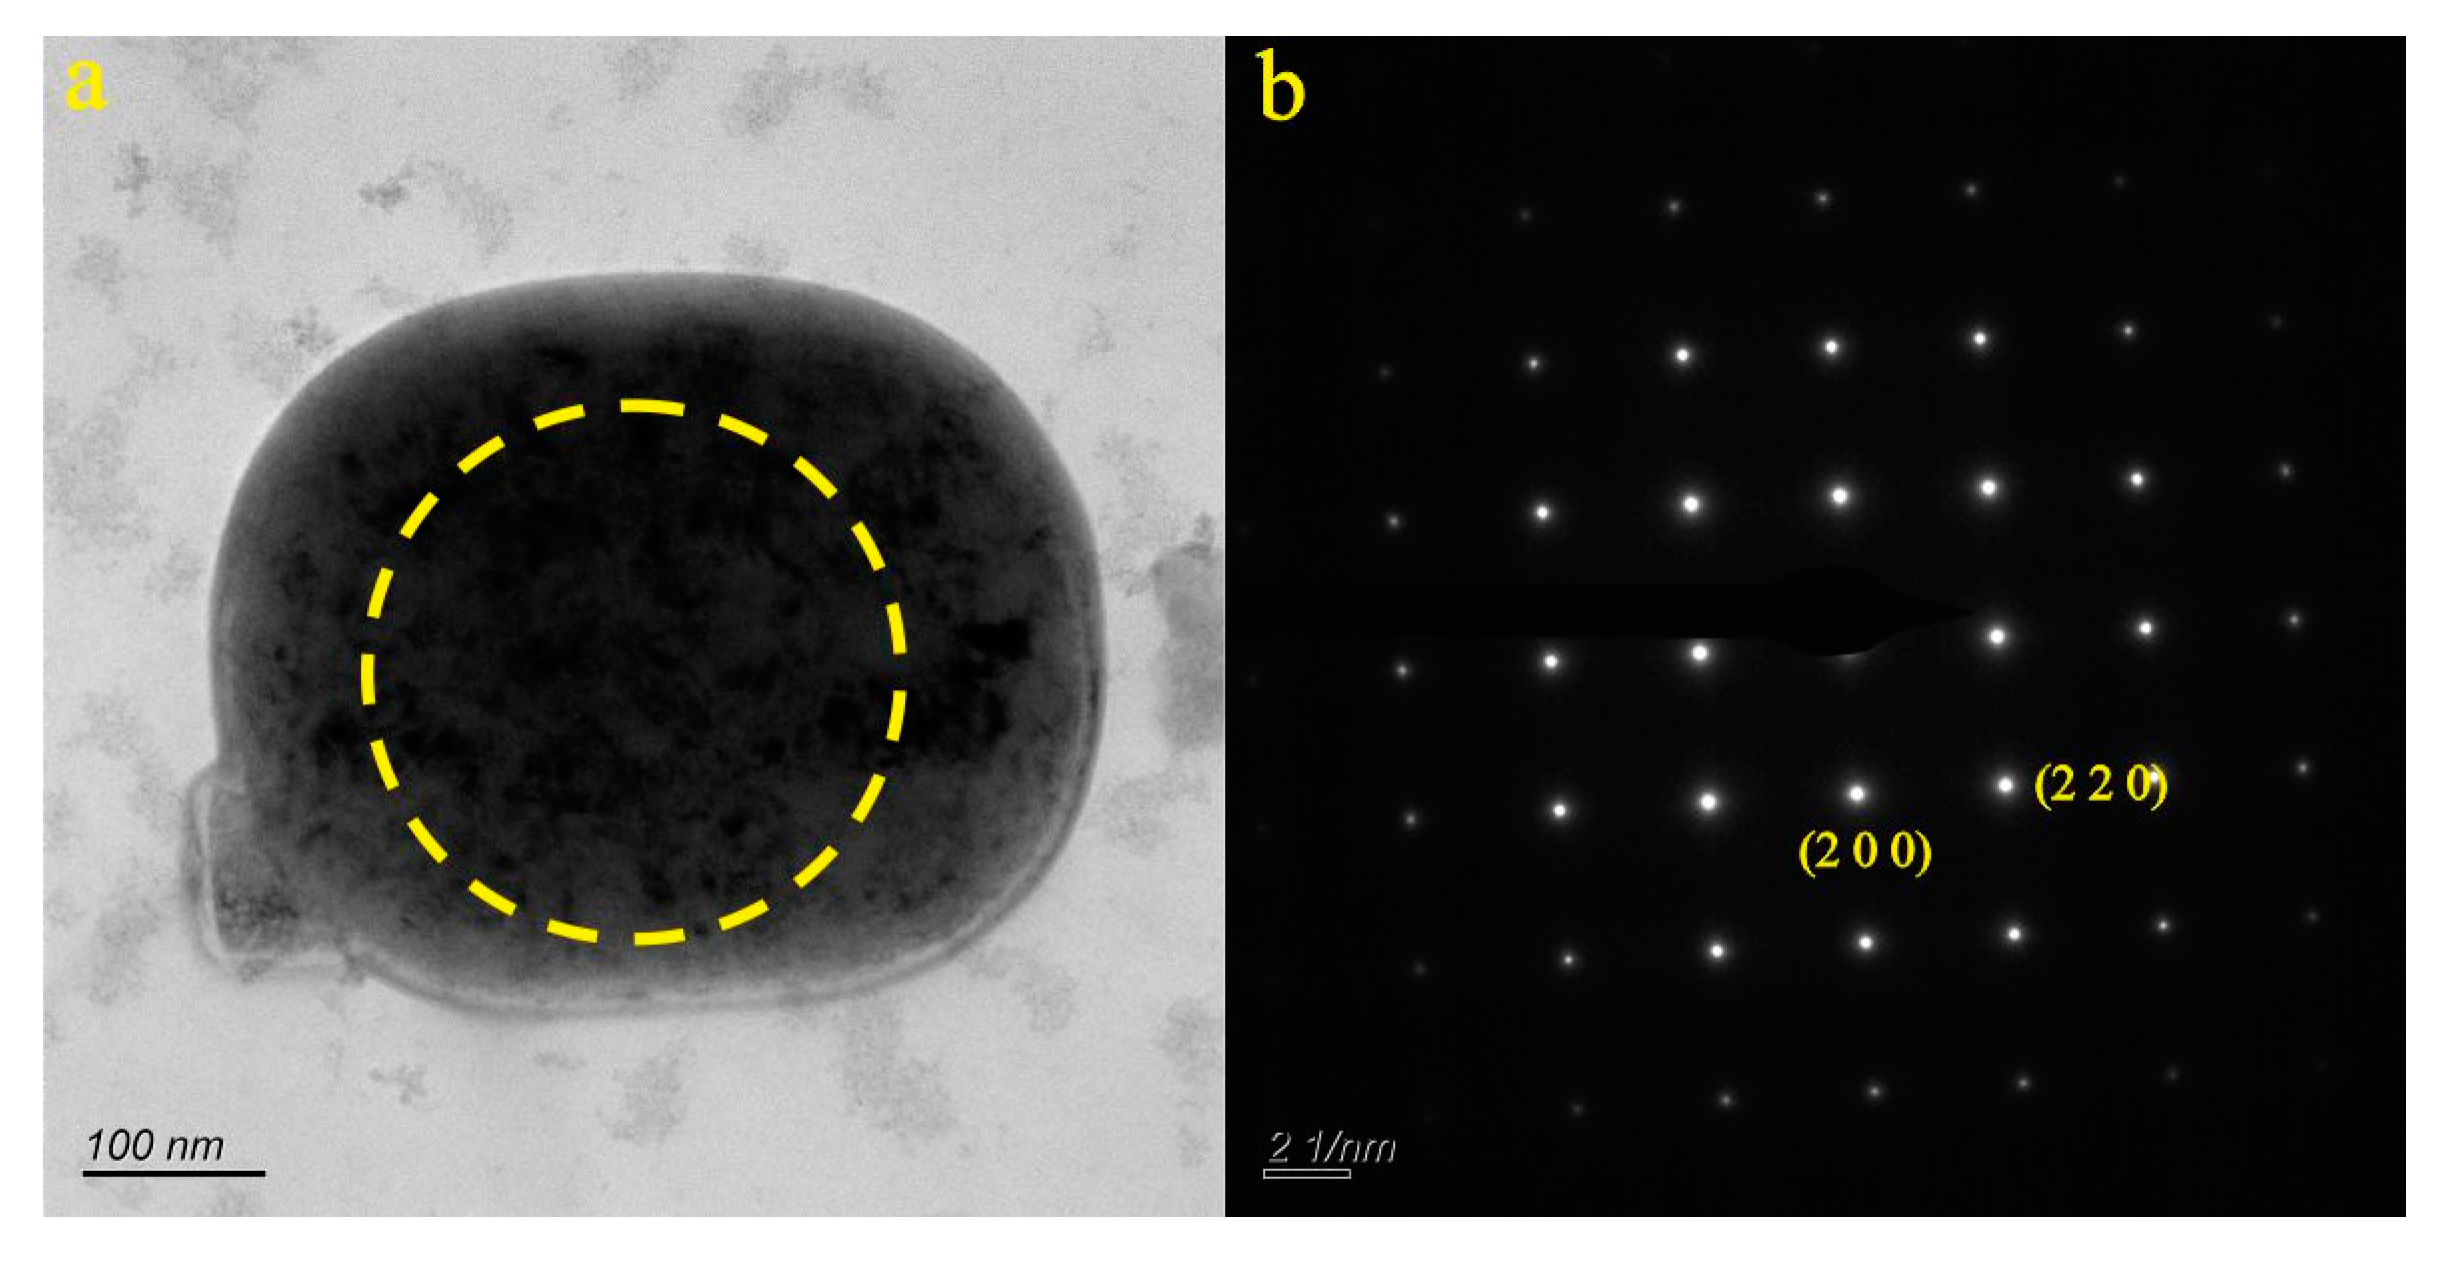
Figure 6.
Particle morphology and diffraction pattern of JN-5 sample.
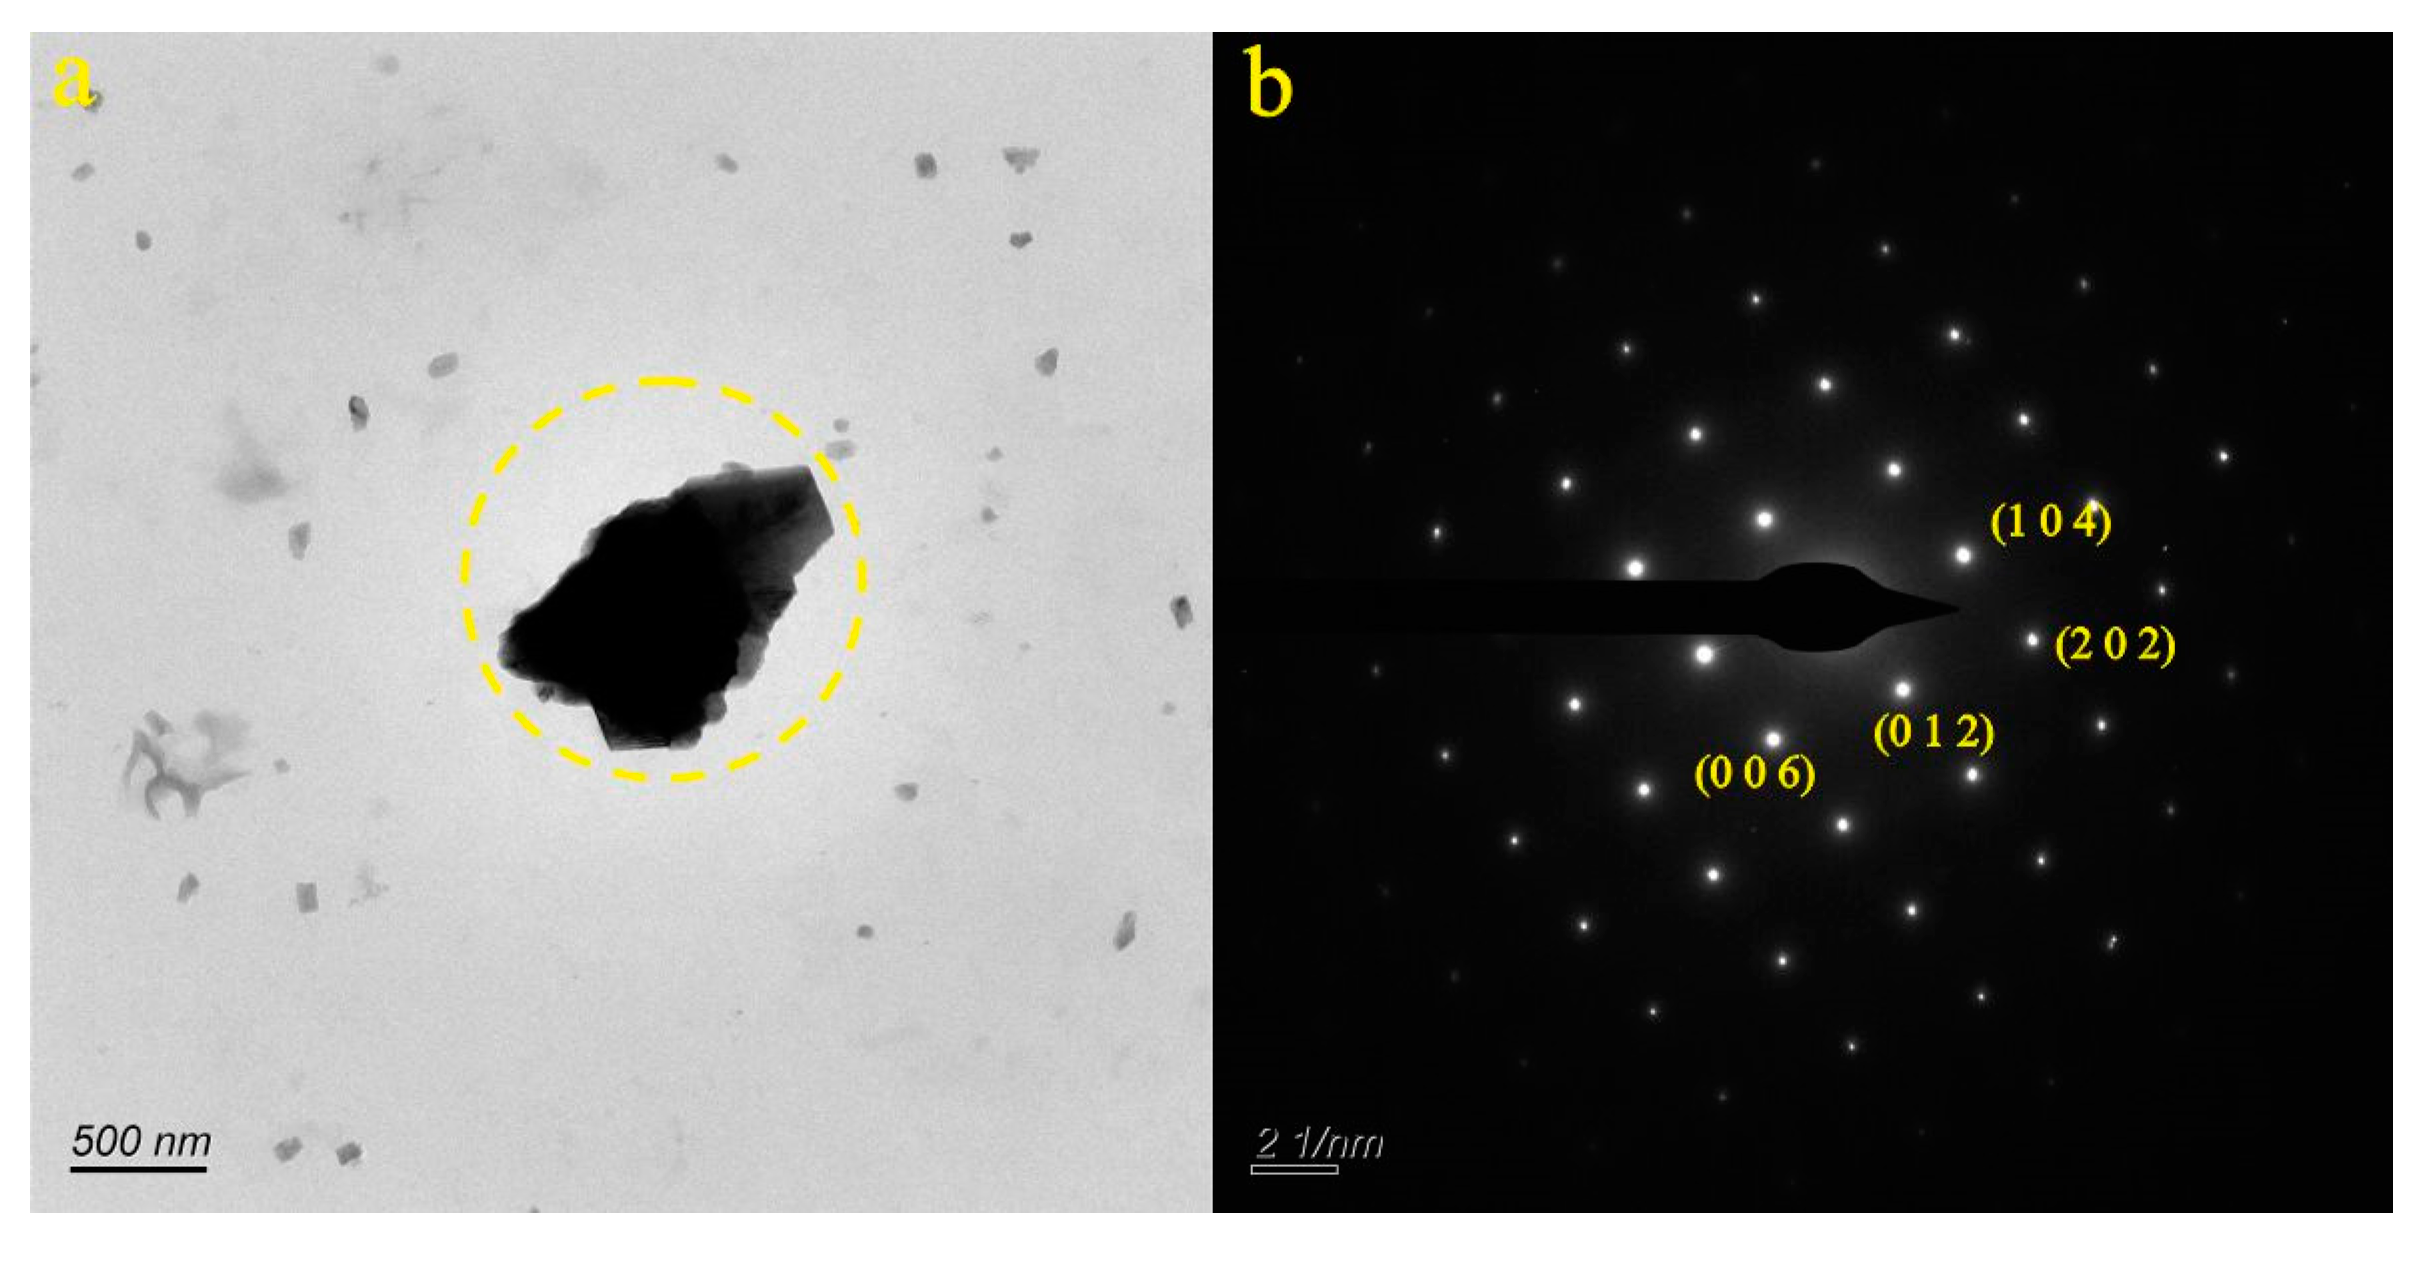
Figure 7.
Particle morphology and diffraction pattern of JN-6 sample.
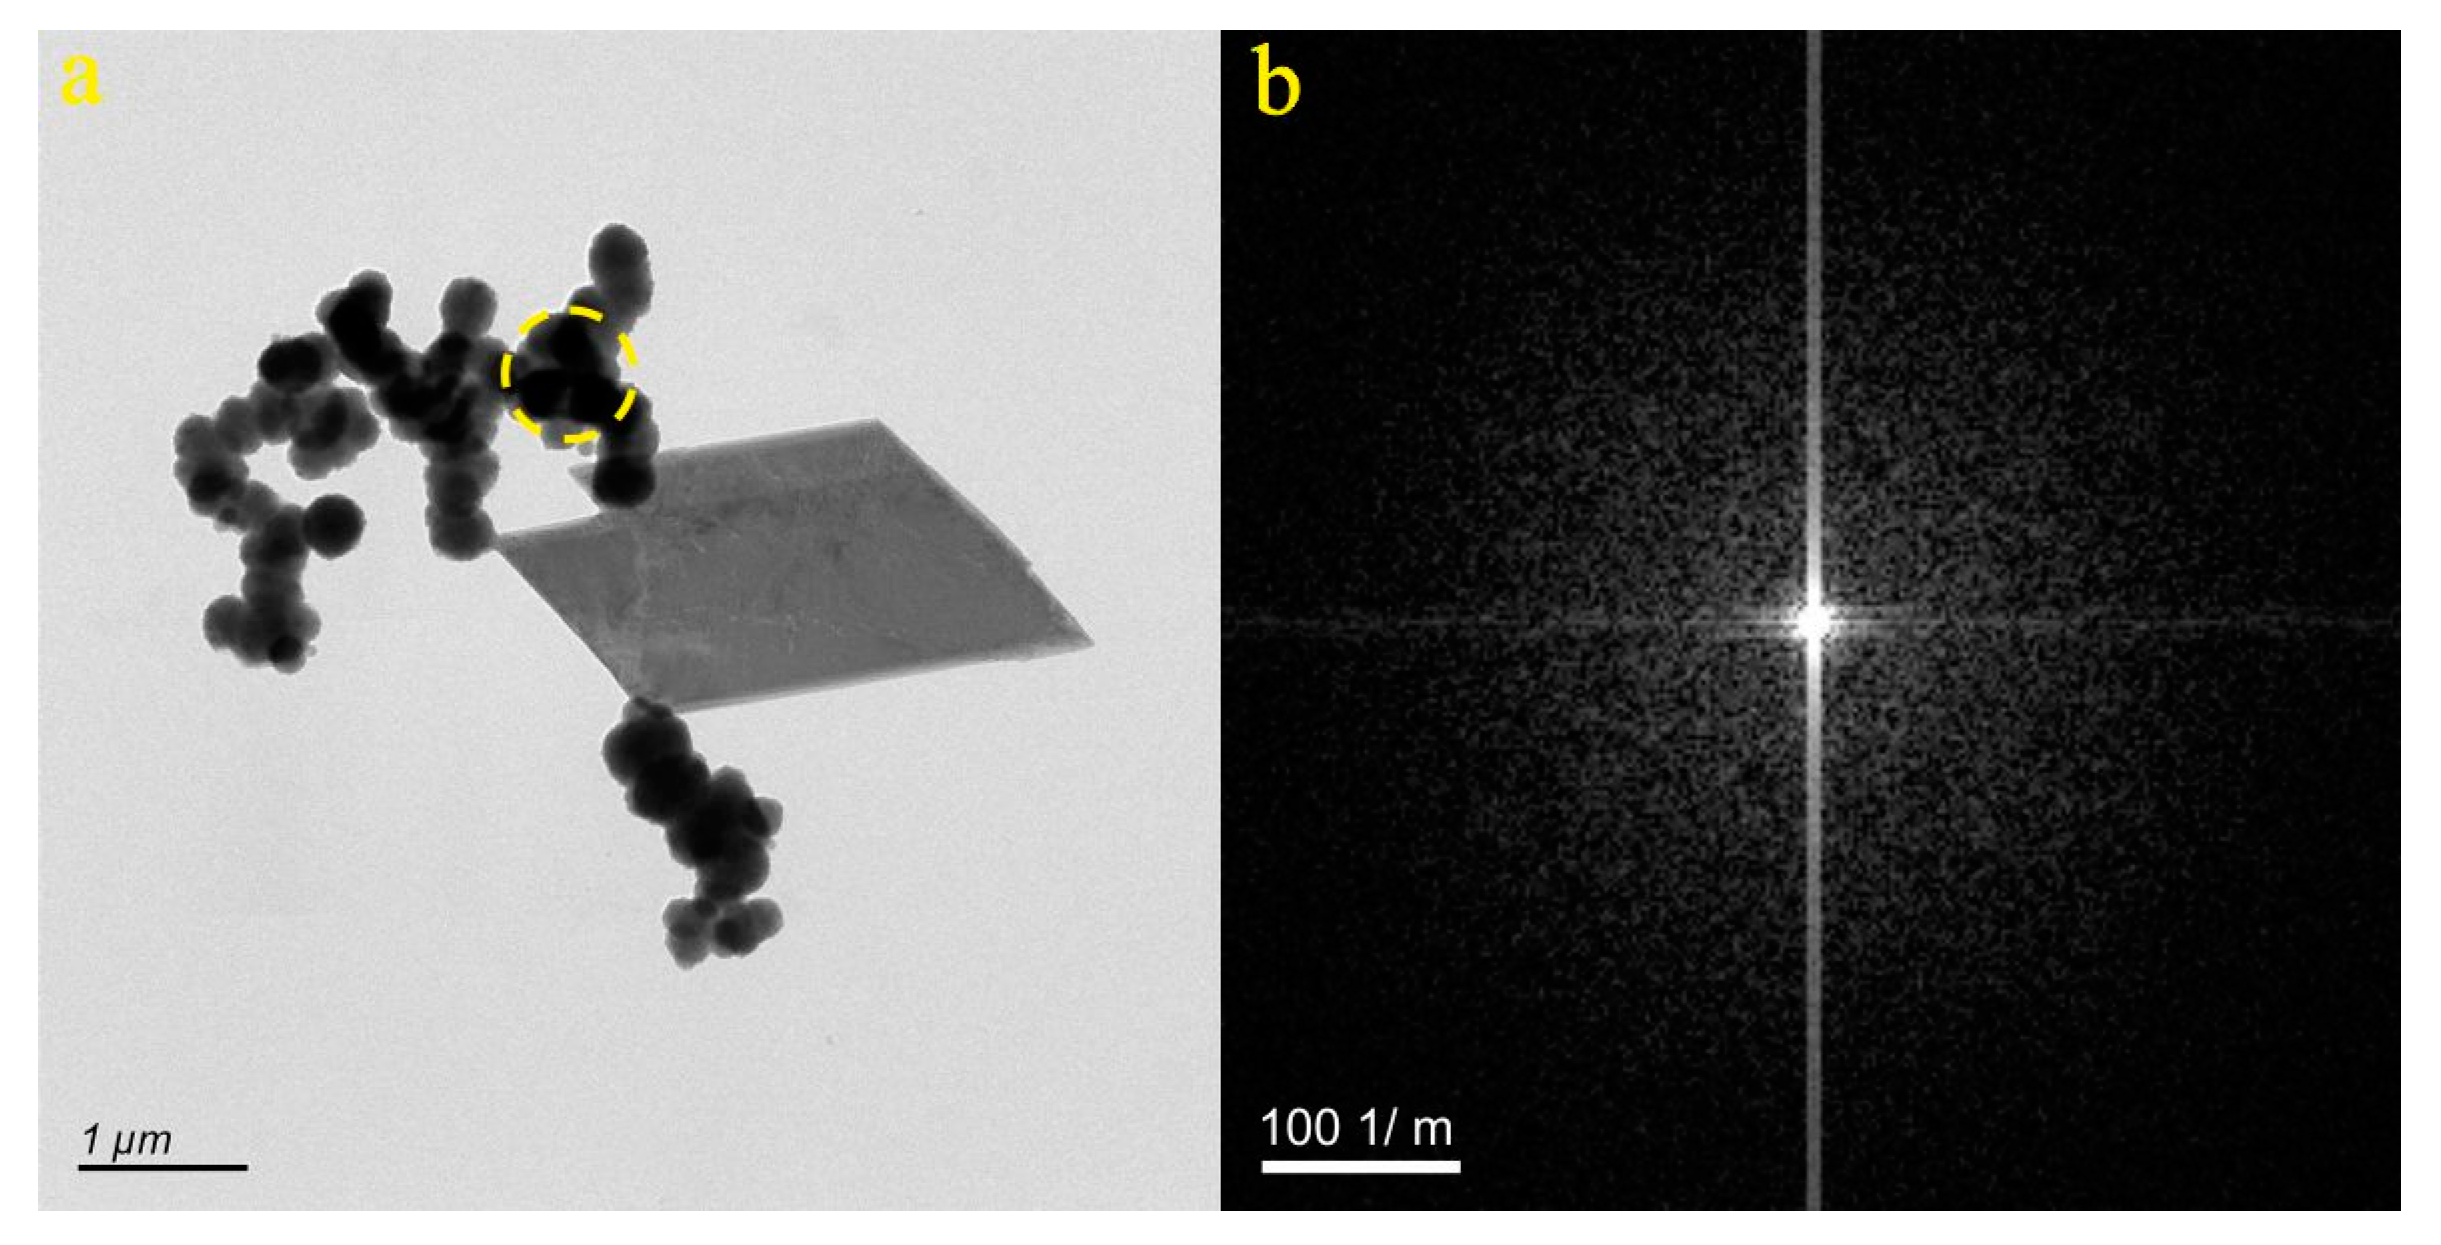
Figure 8.
Particle morphology and diffraction pattern of JN-7 sample.
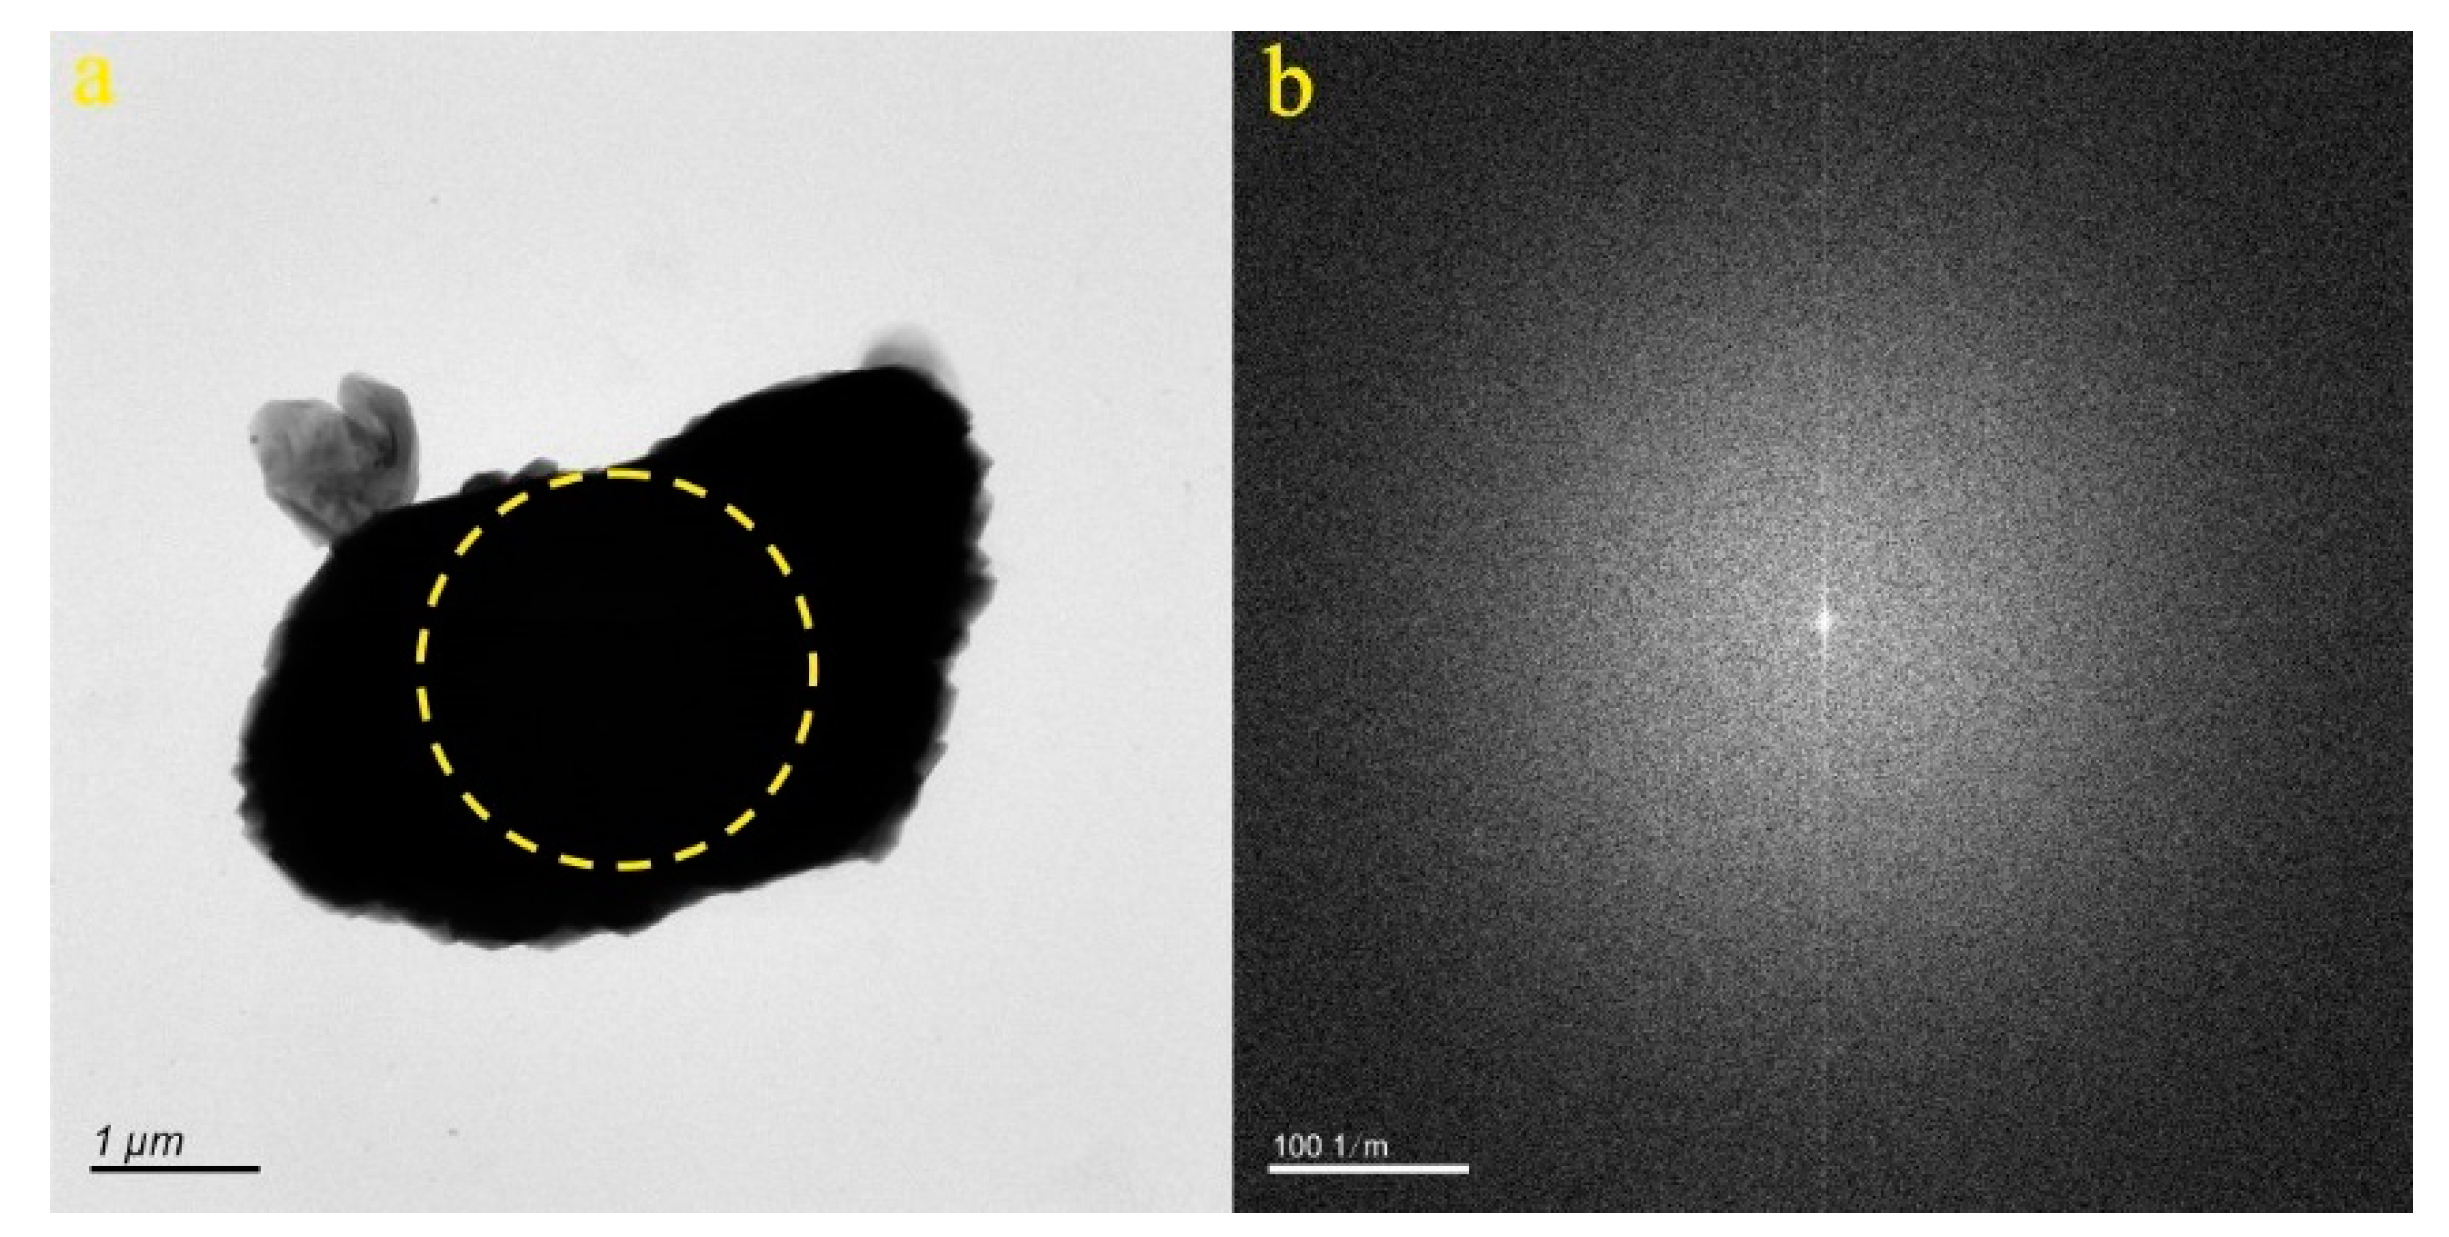
Figure 9.
Particle morphology and diffraction pattern of JN-8 sample.
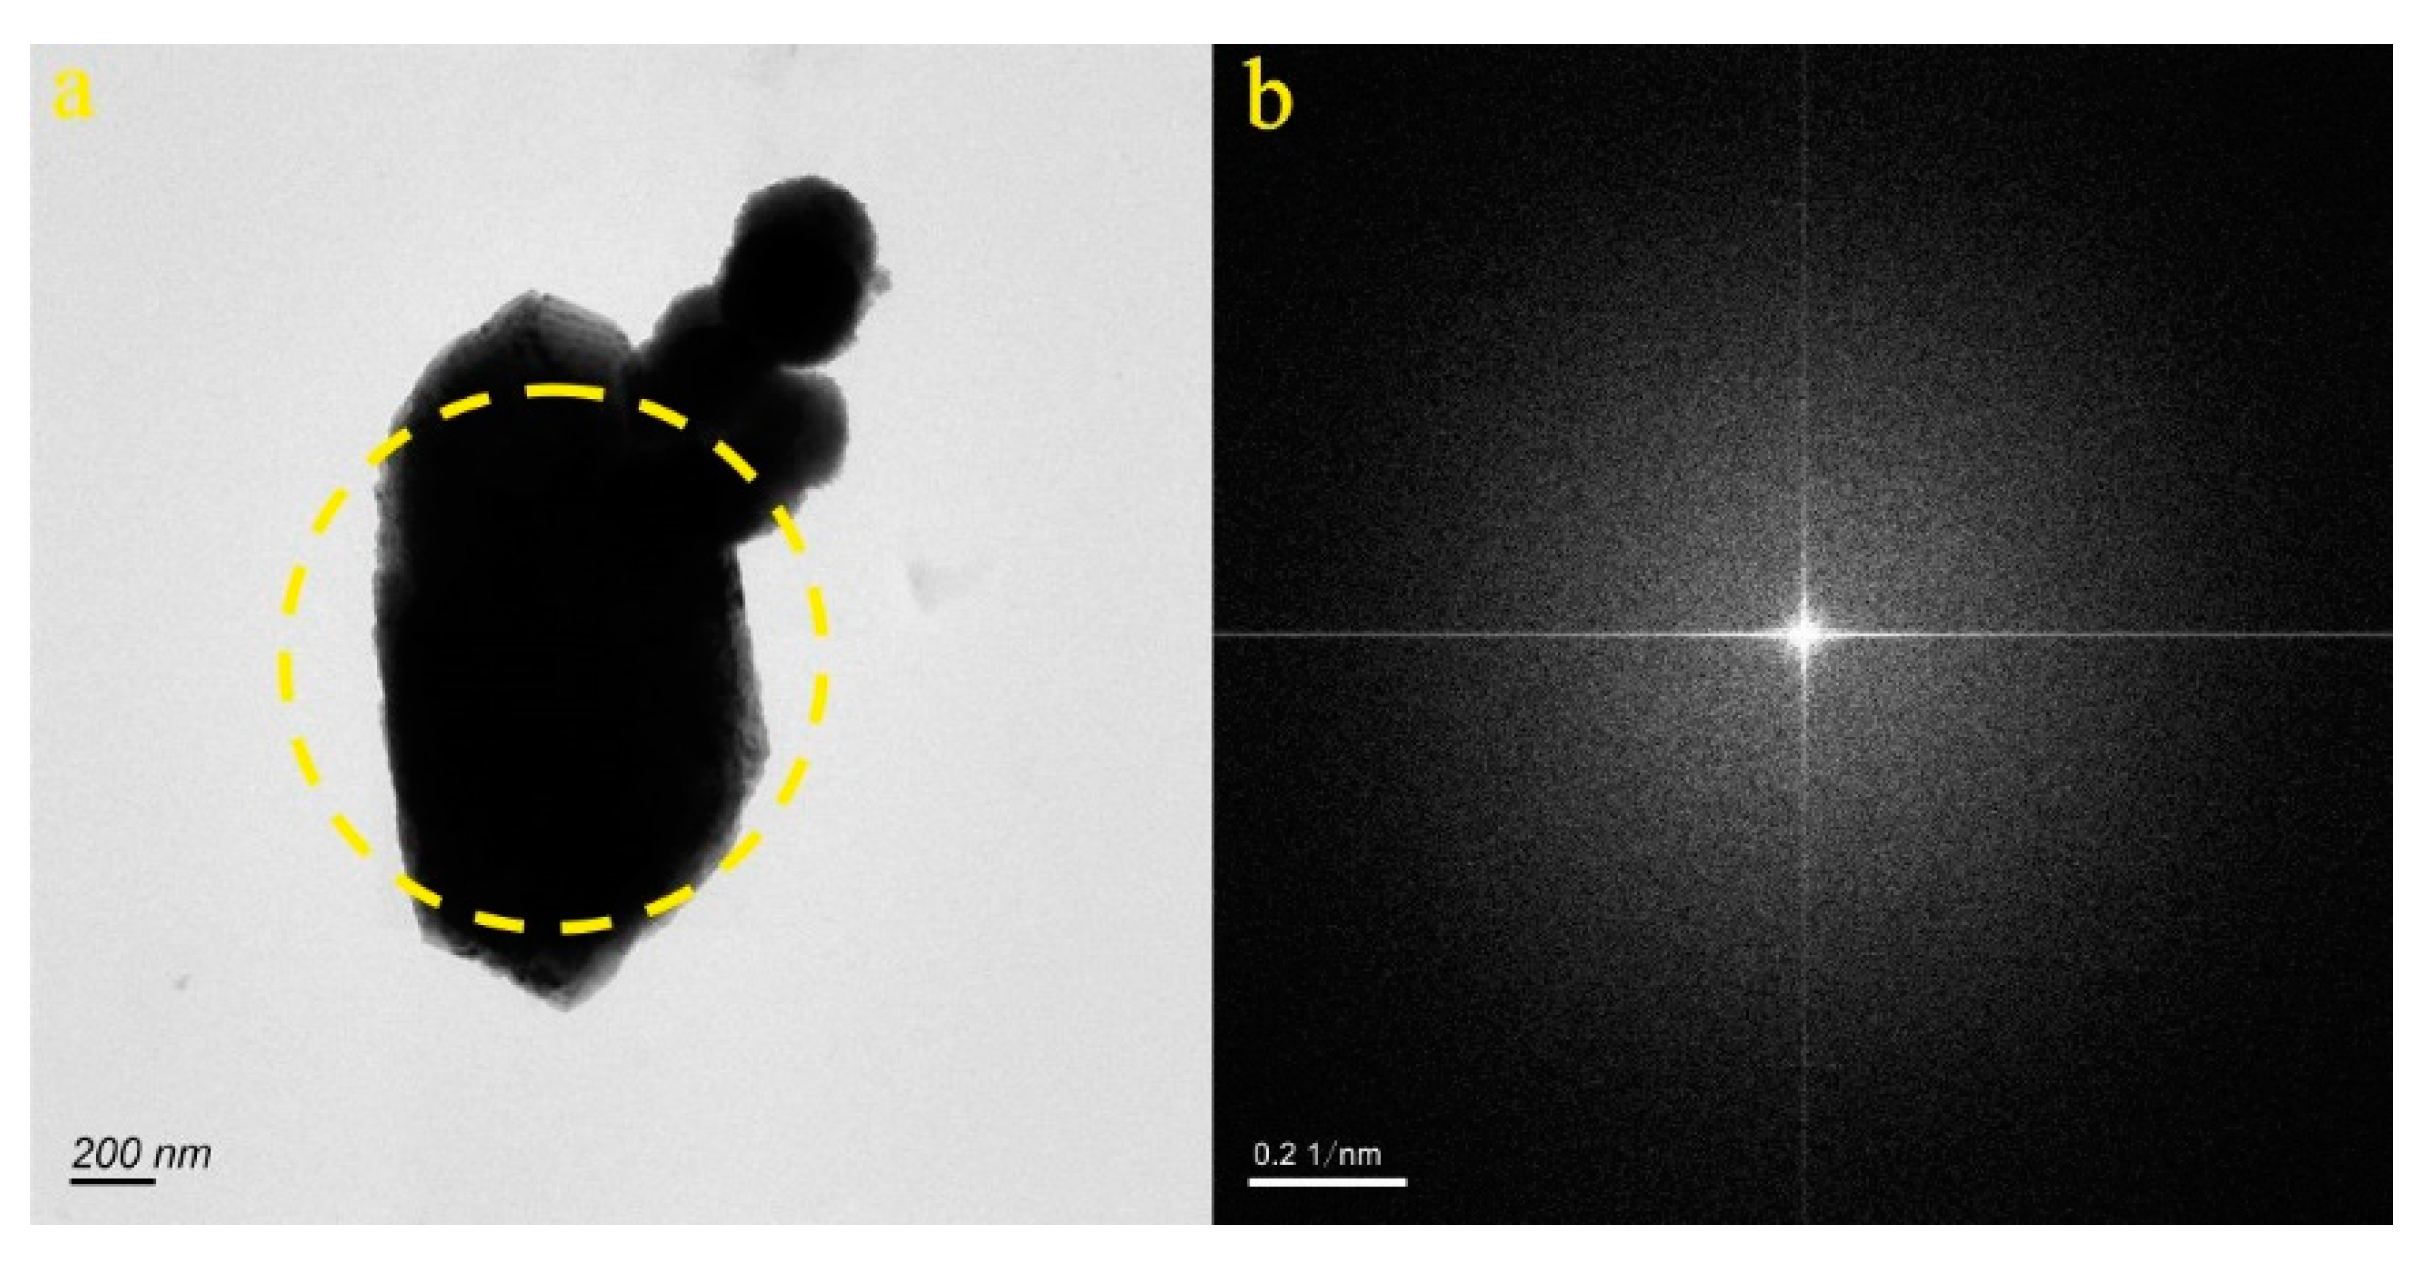
Figure 10.
Particle morphology and diffraction pattern of JN-9 sample.
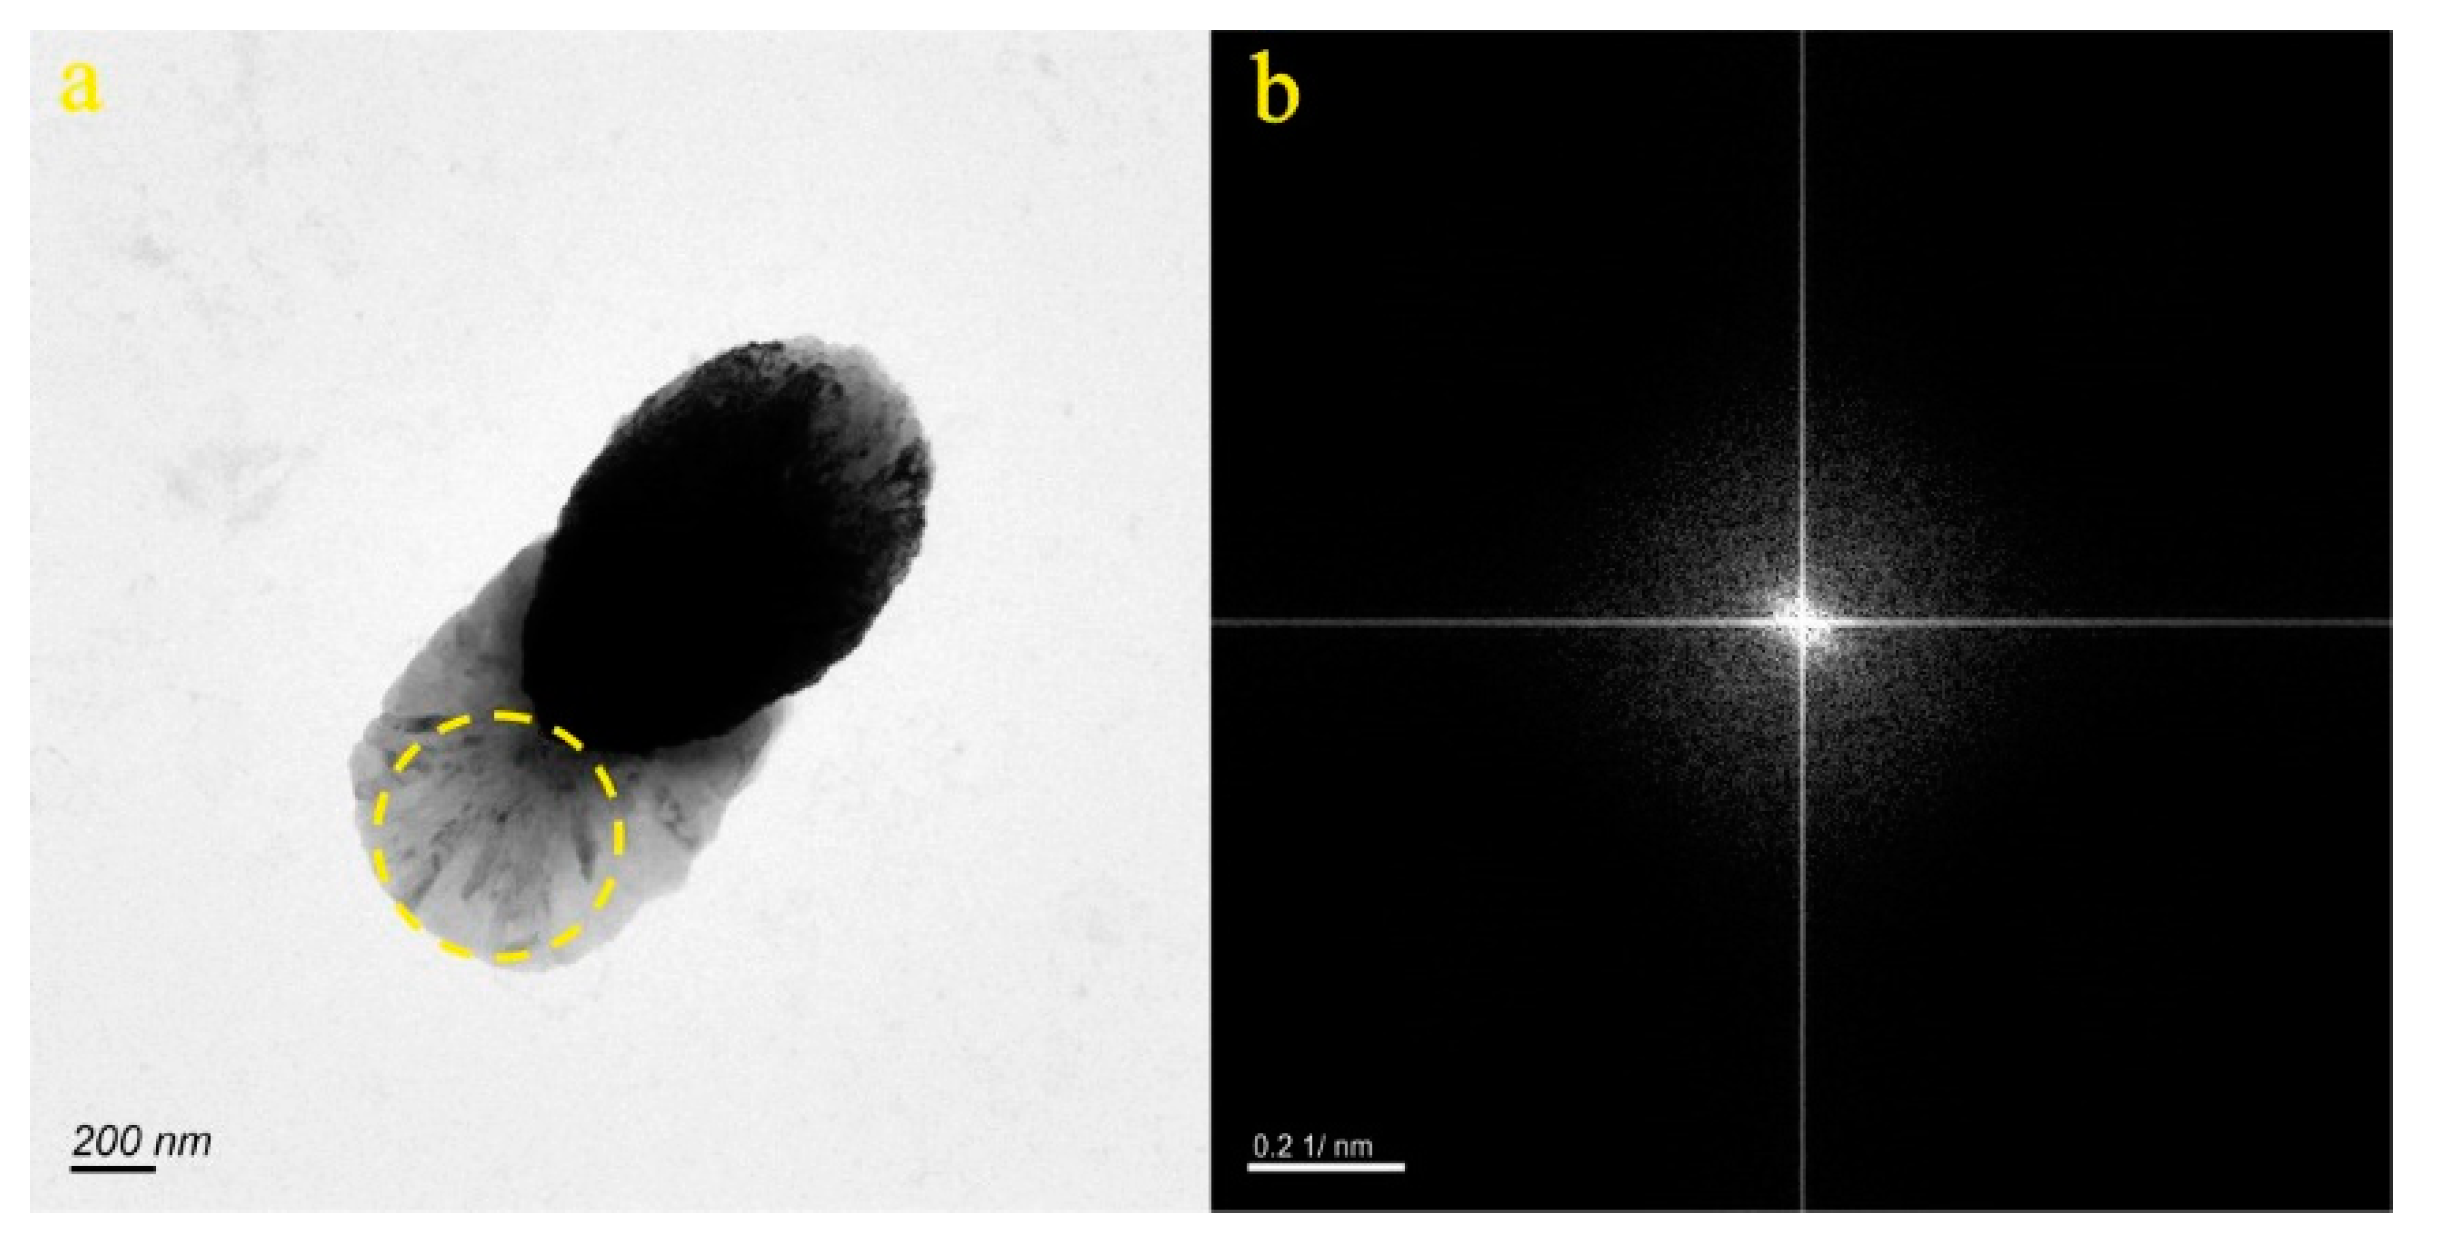
Figure 11.
Particle morphology and diffraction pattern of JN-10 sample.
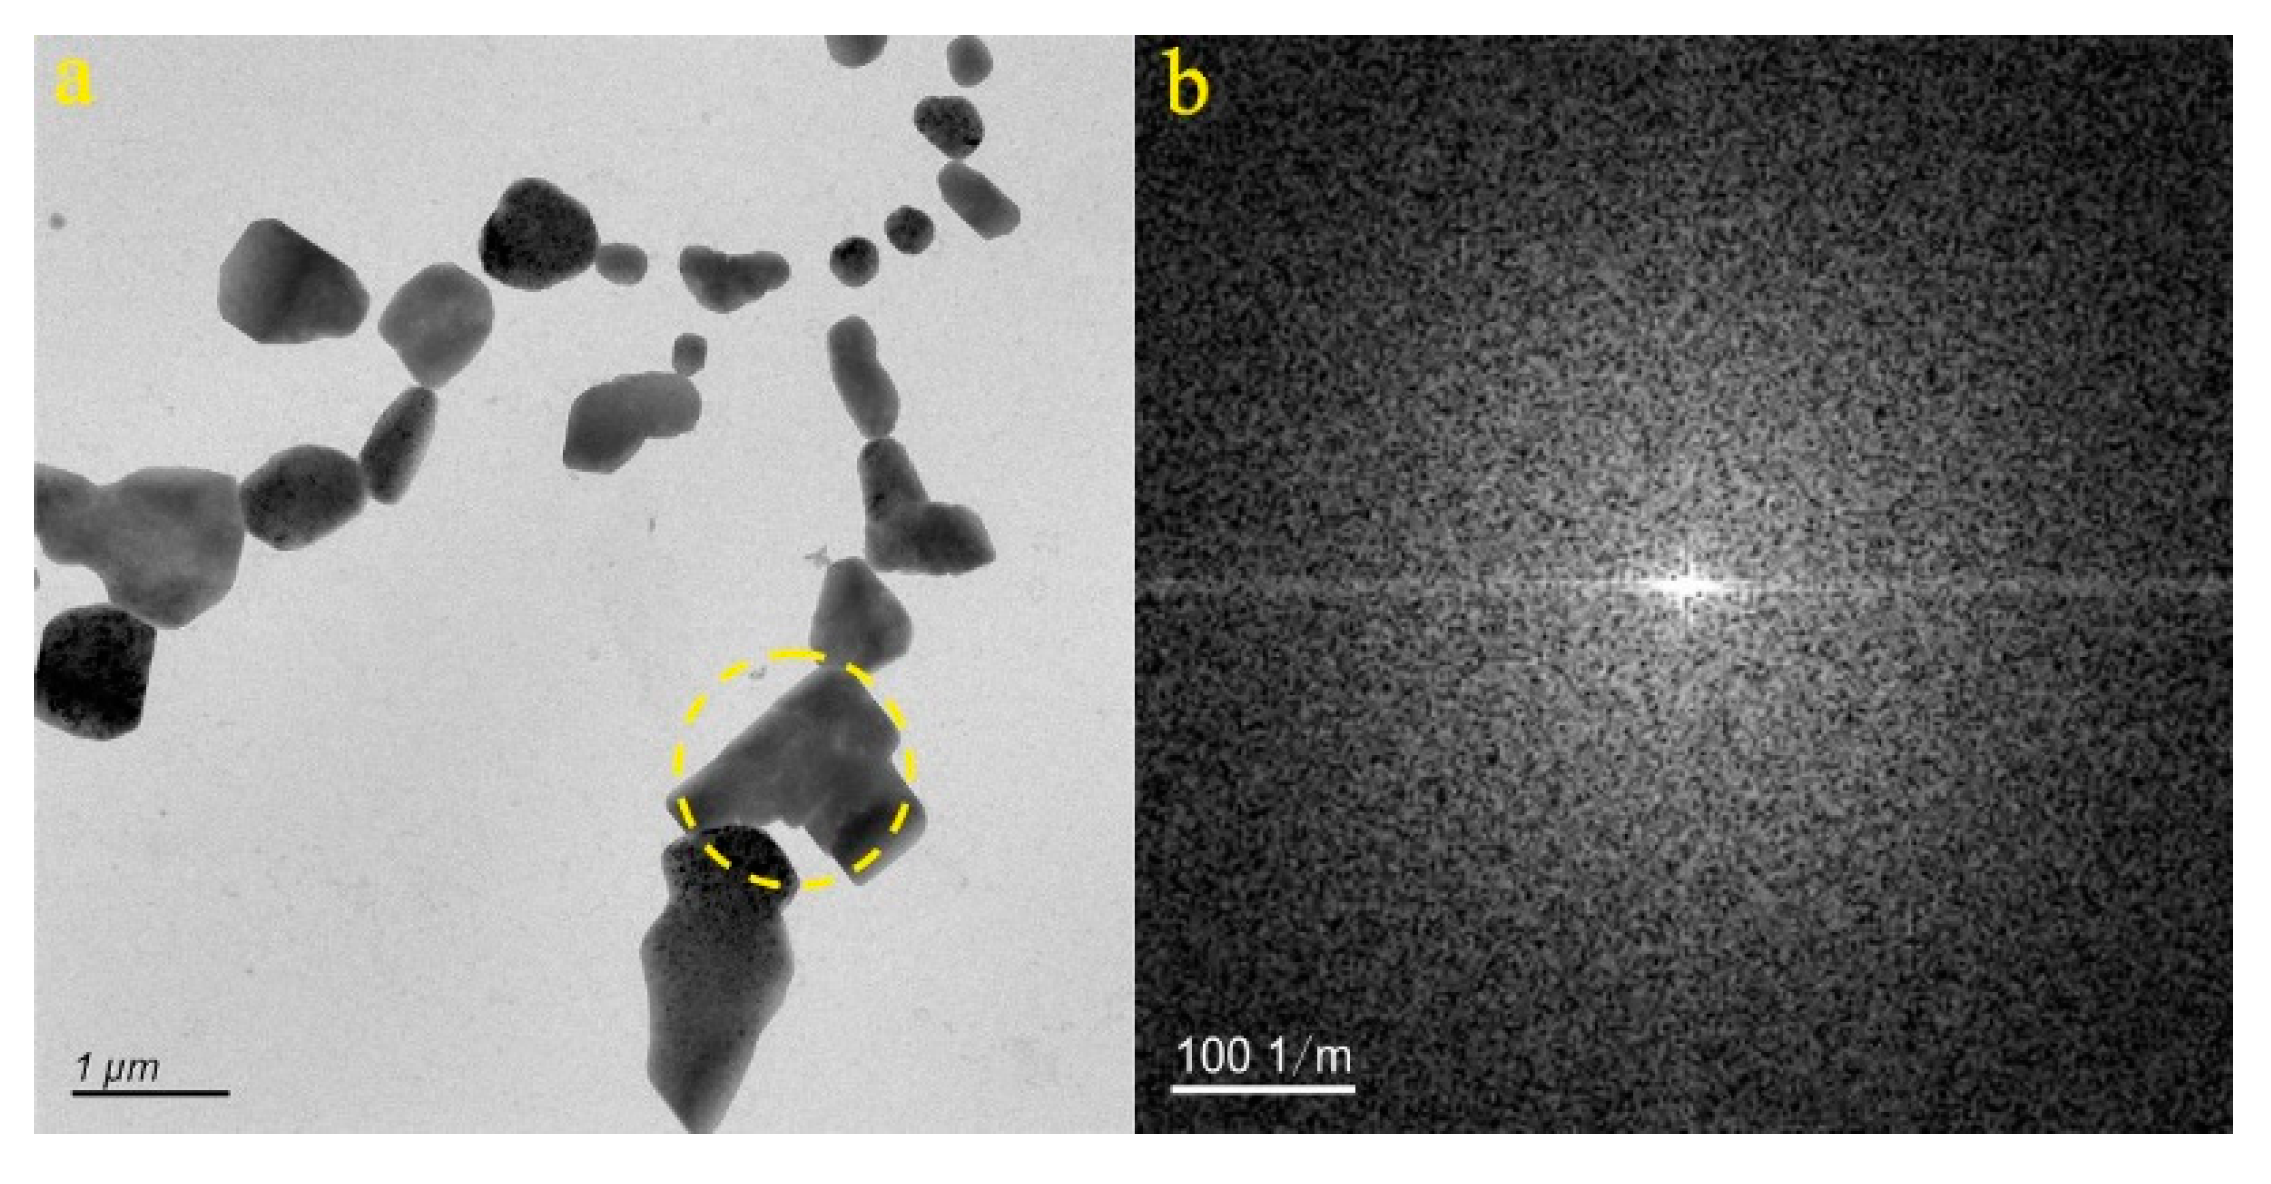
Figure 12.
Particle morphology and diffraction pattern of JN-11 sample.
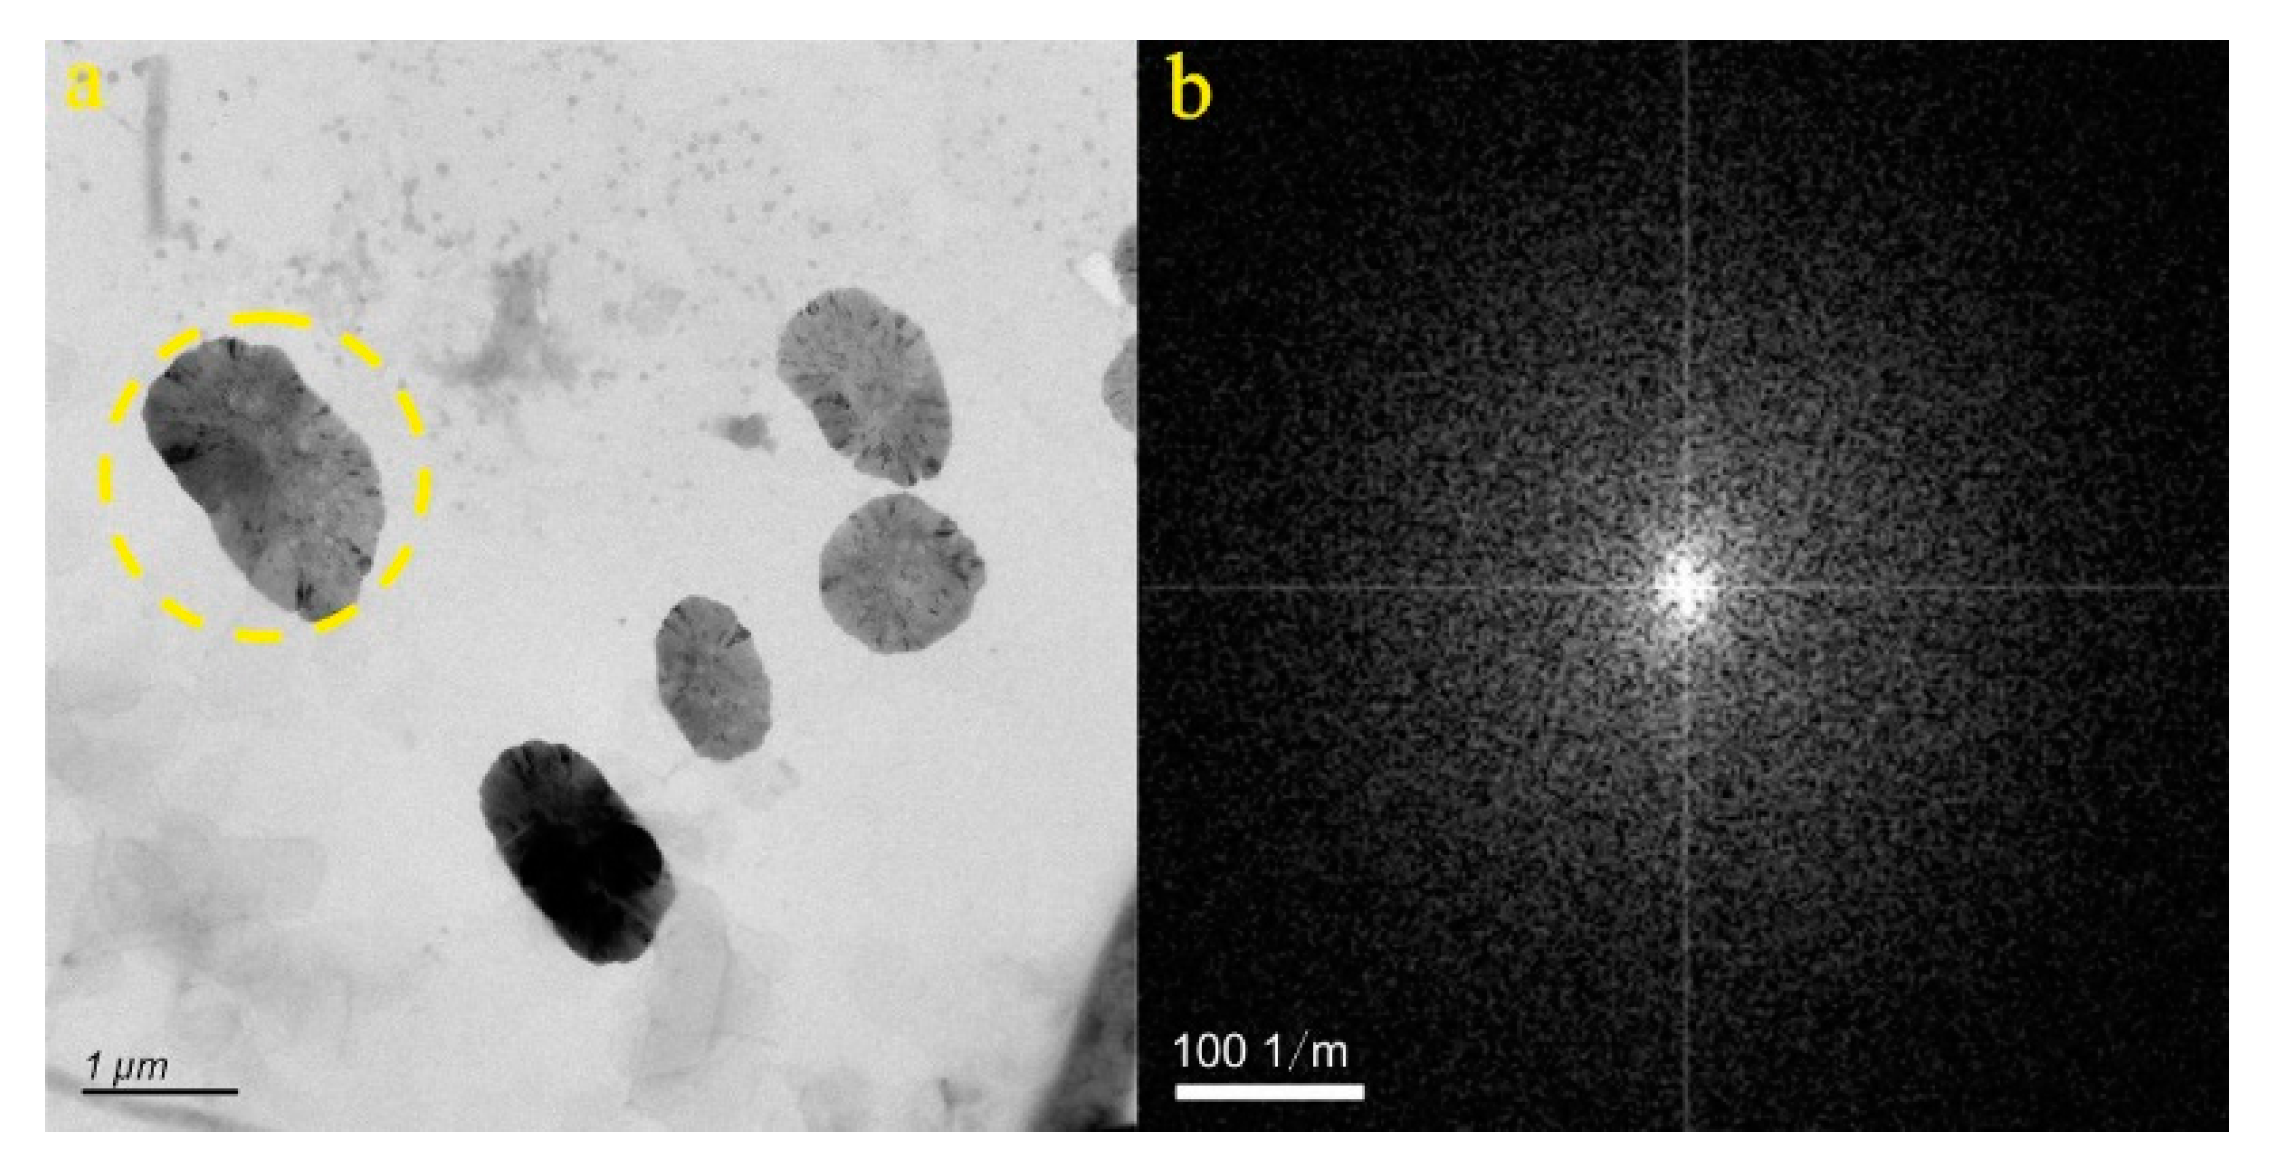
Figure 13.
Particle morphology and diffraction pattern of JN-12 sample.
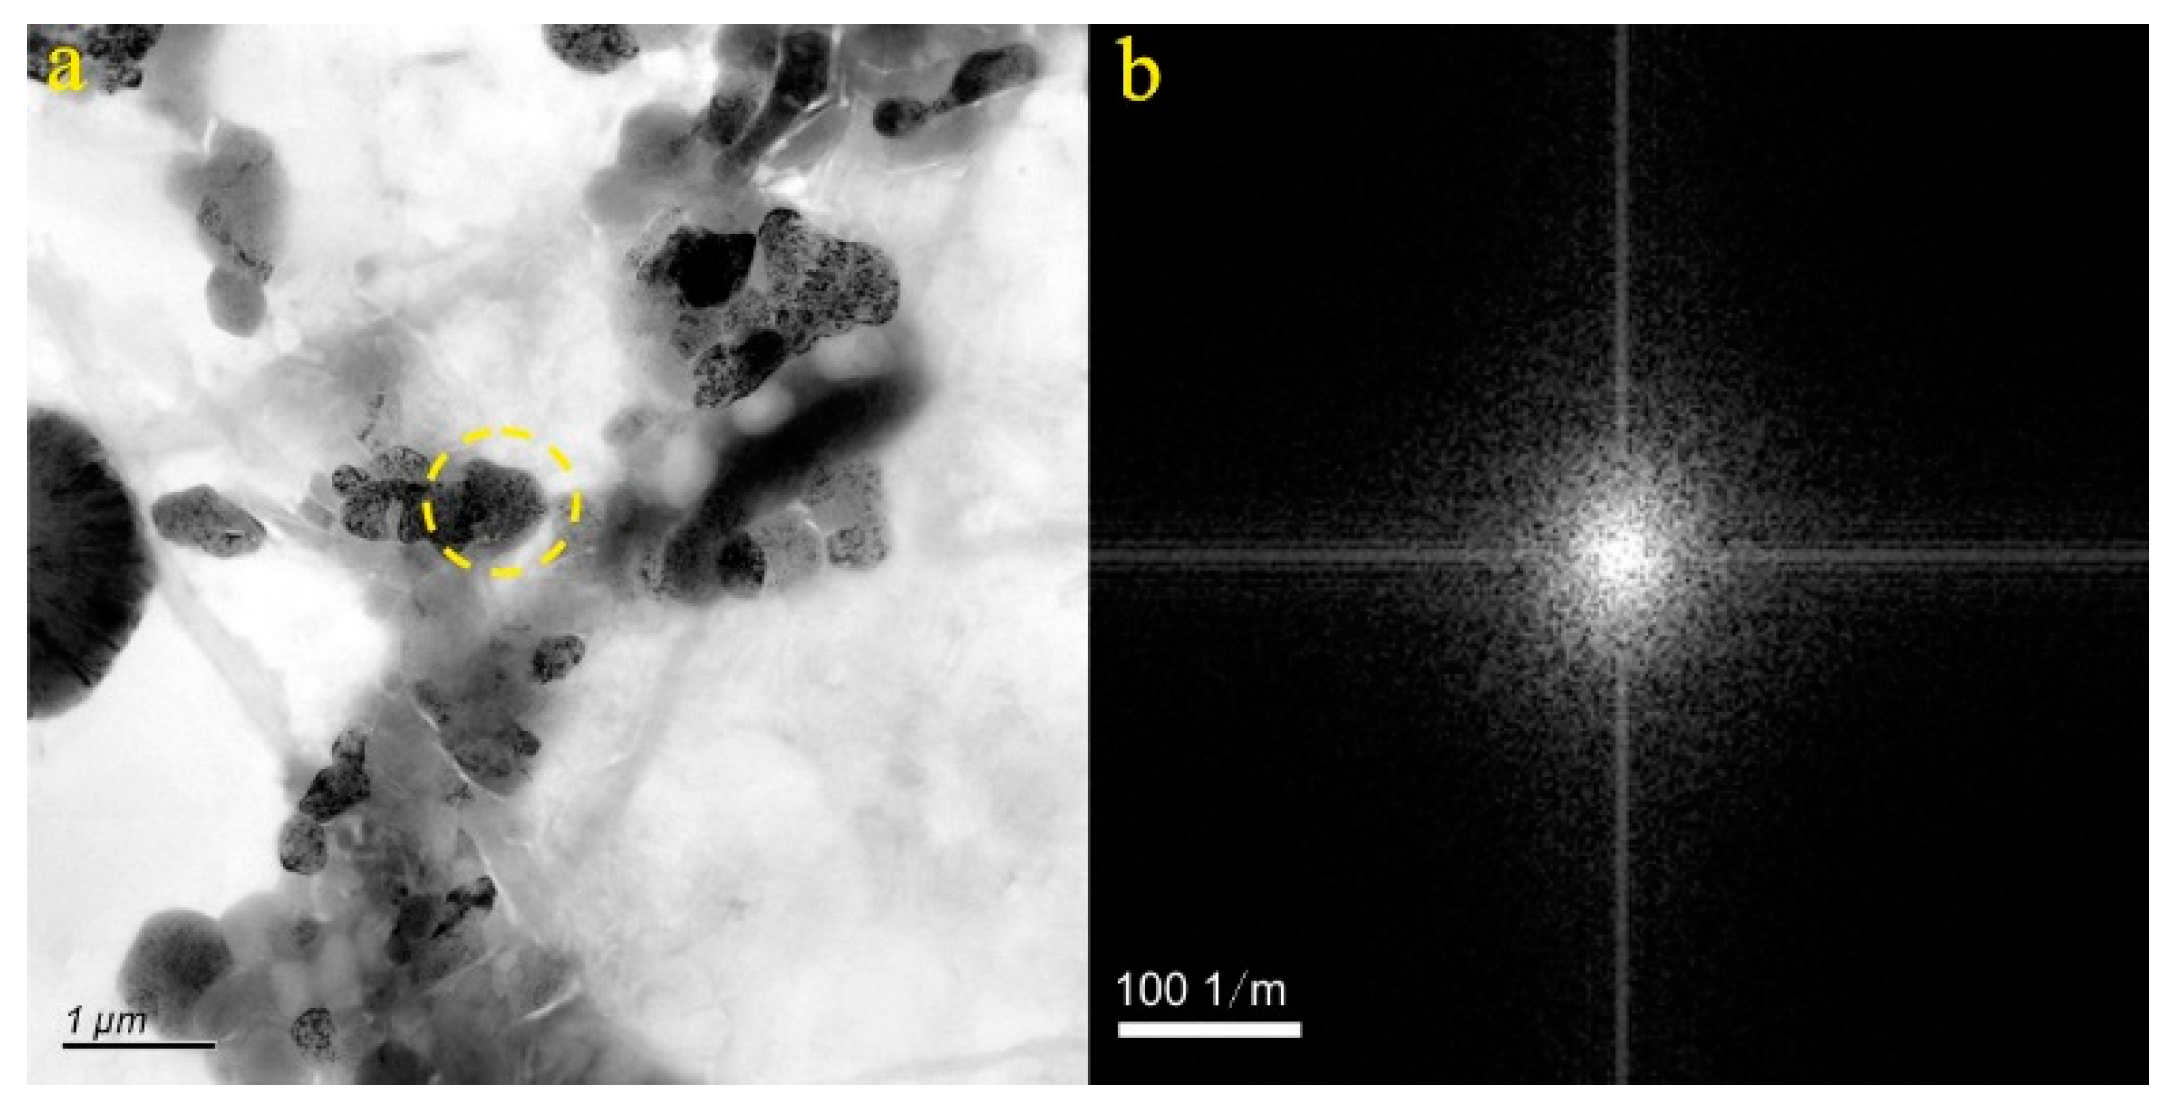
Figure 14.
Particle morphology and diffraction pattern of ZB-1 sample.
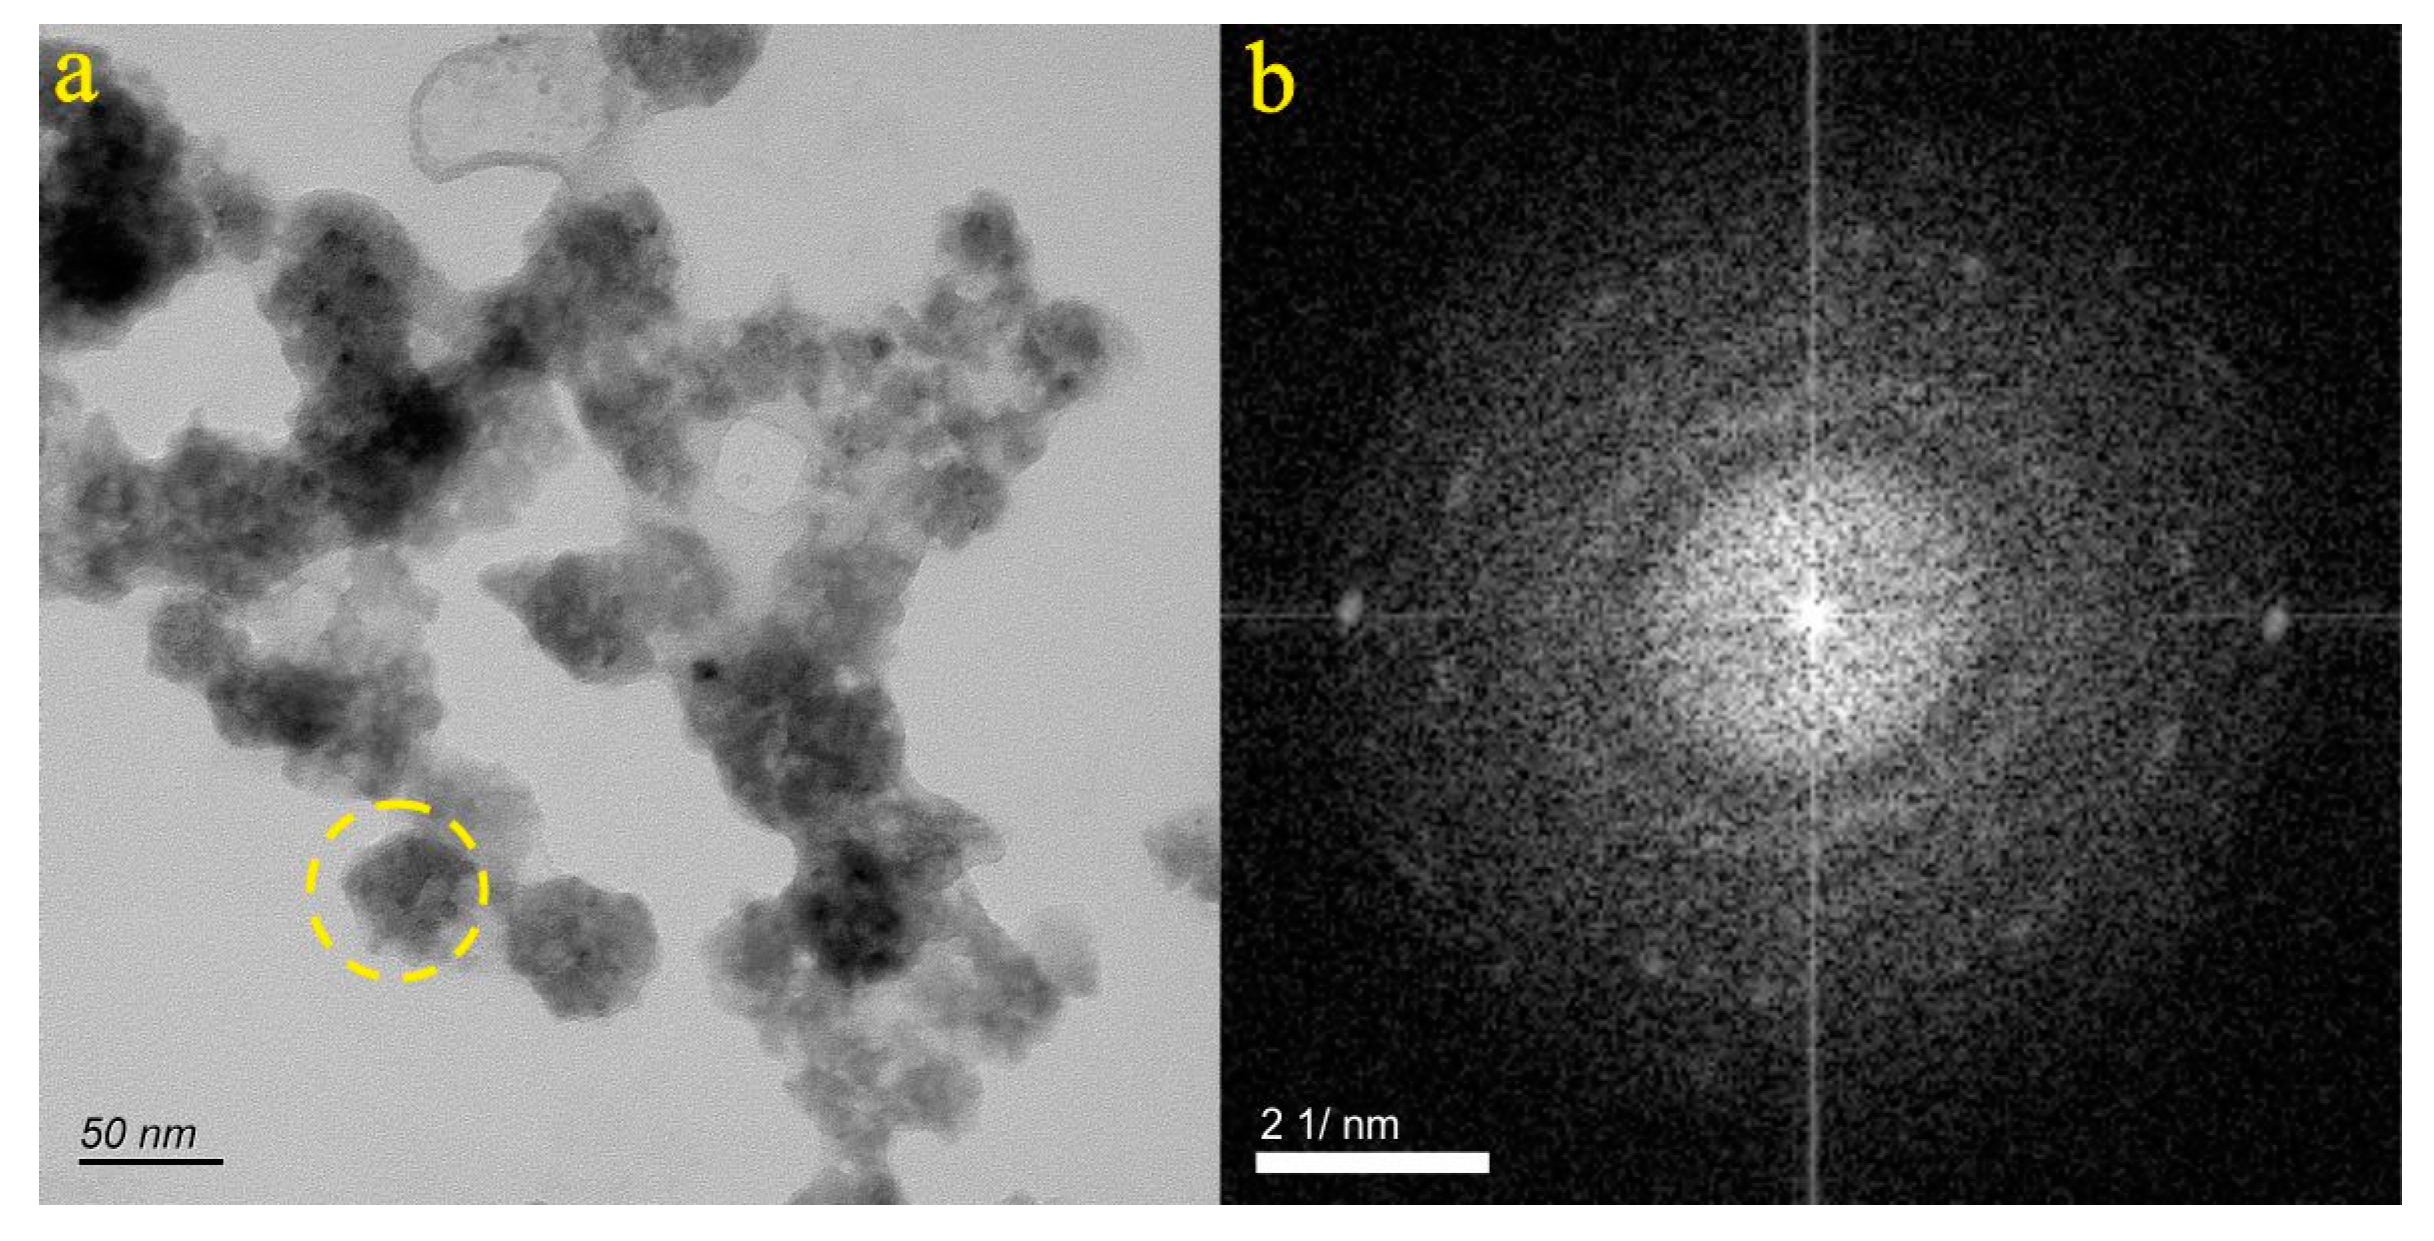
Figure 15.
Particle morphology and diffraction pattern of ZB-2 sample.
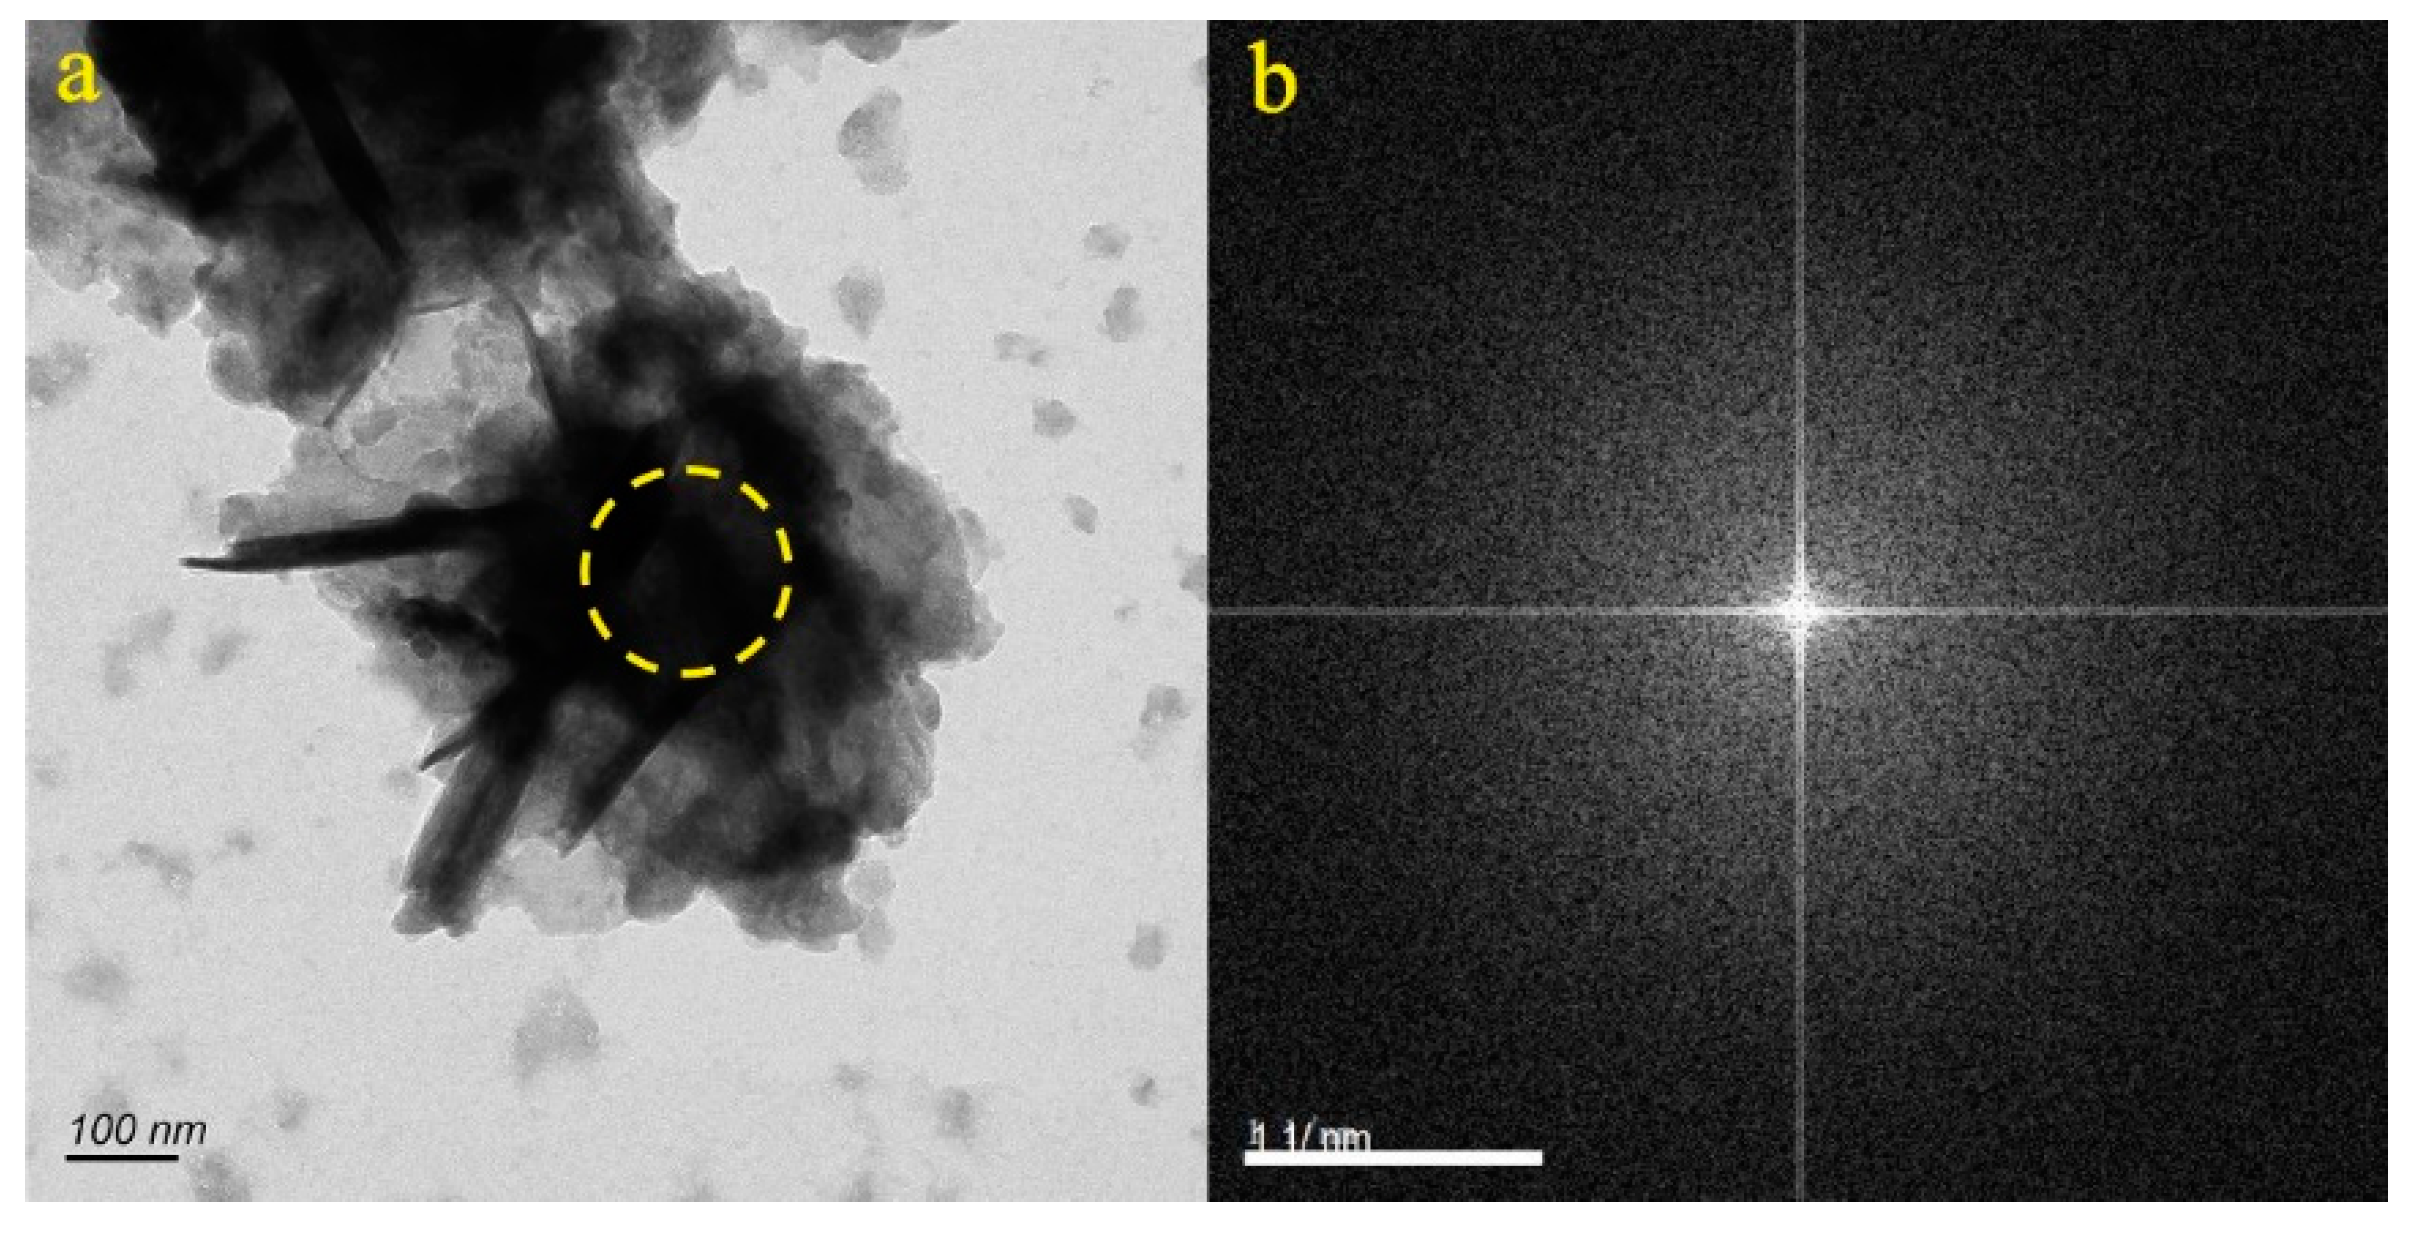
Figure 16.
Particle morphology and diffraction pattern of ZB-3 sample.
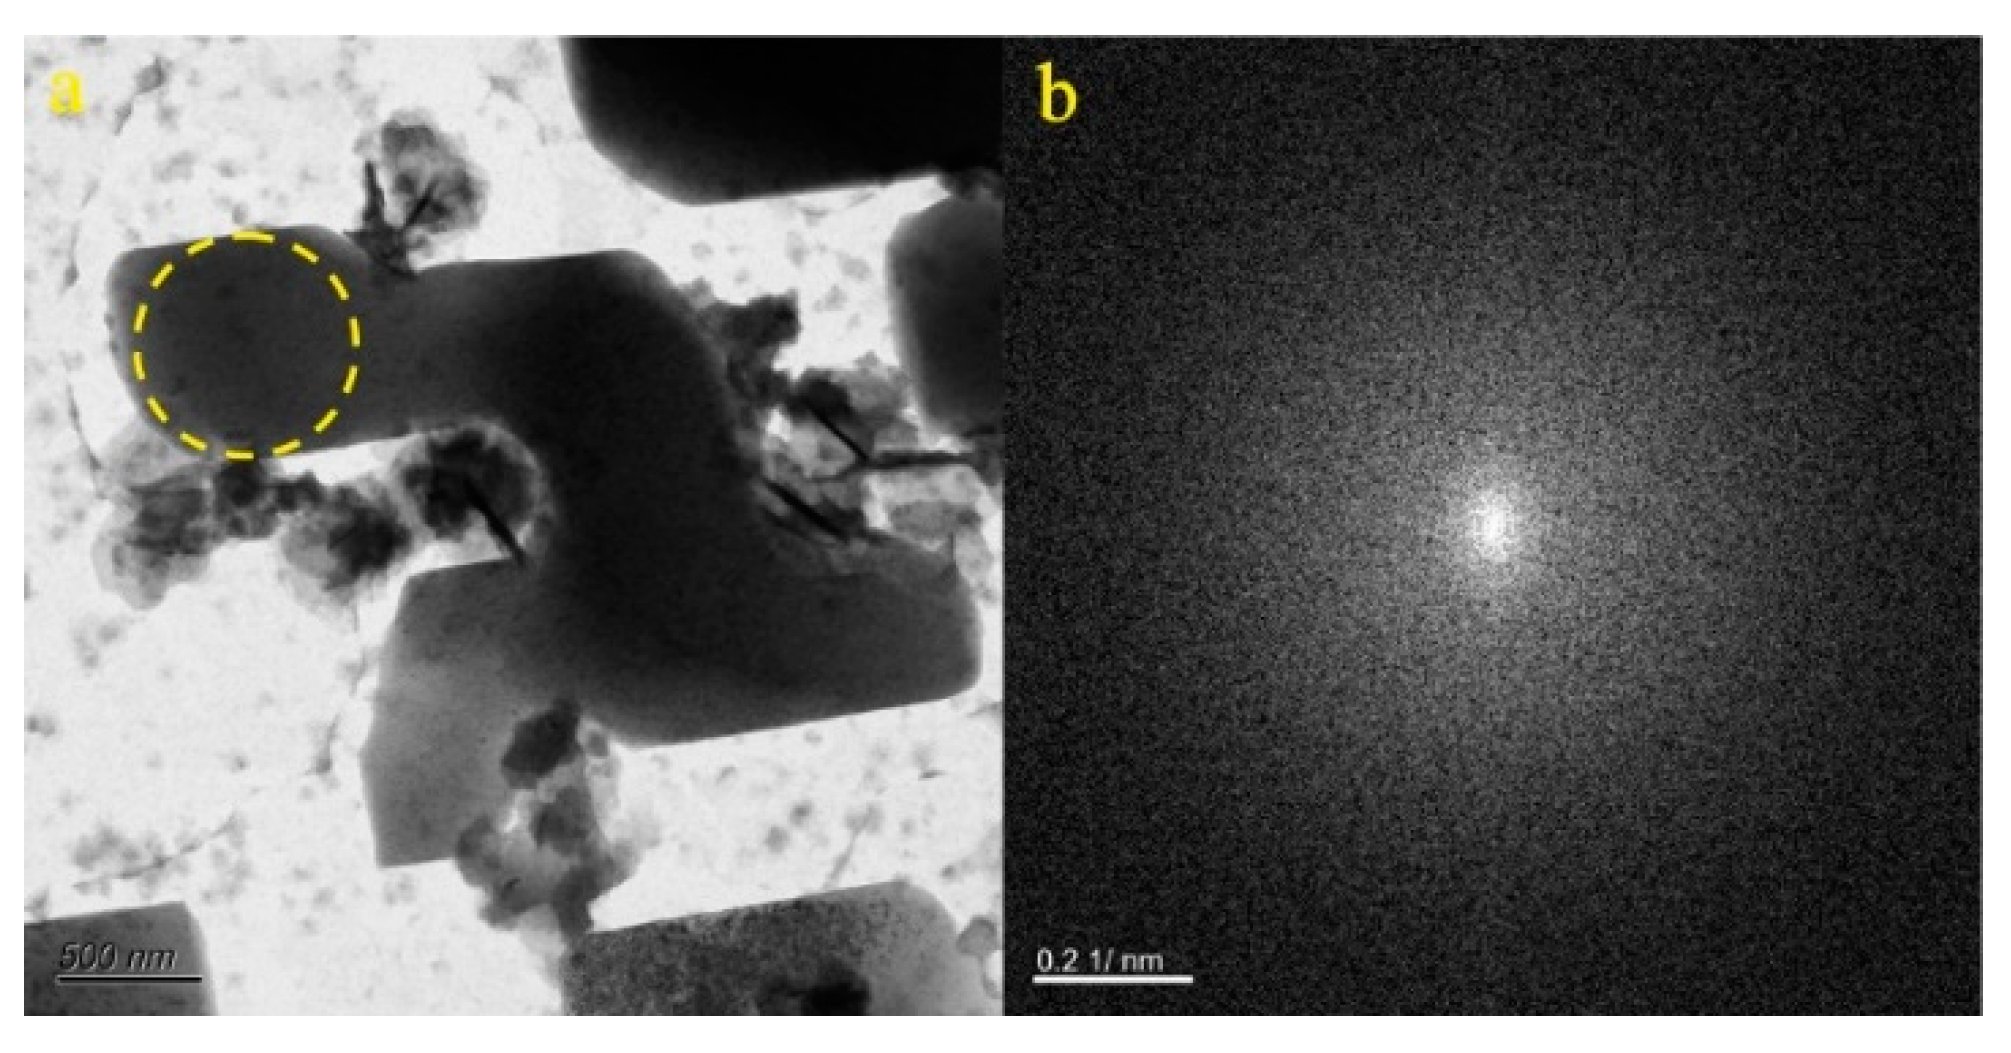
Figure 17.
Particle morphology and diffraction pattern of ZB-4 sample.
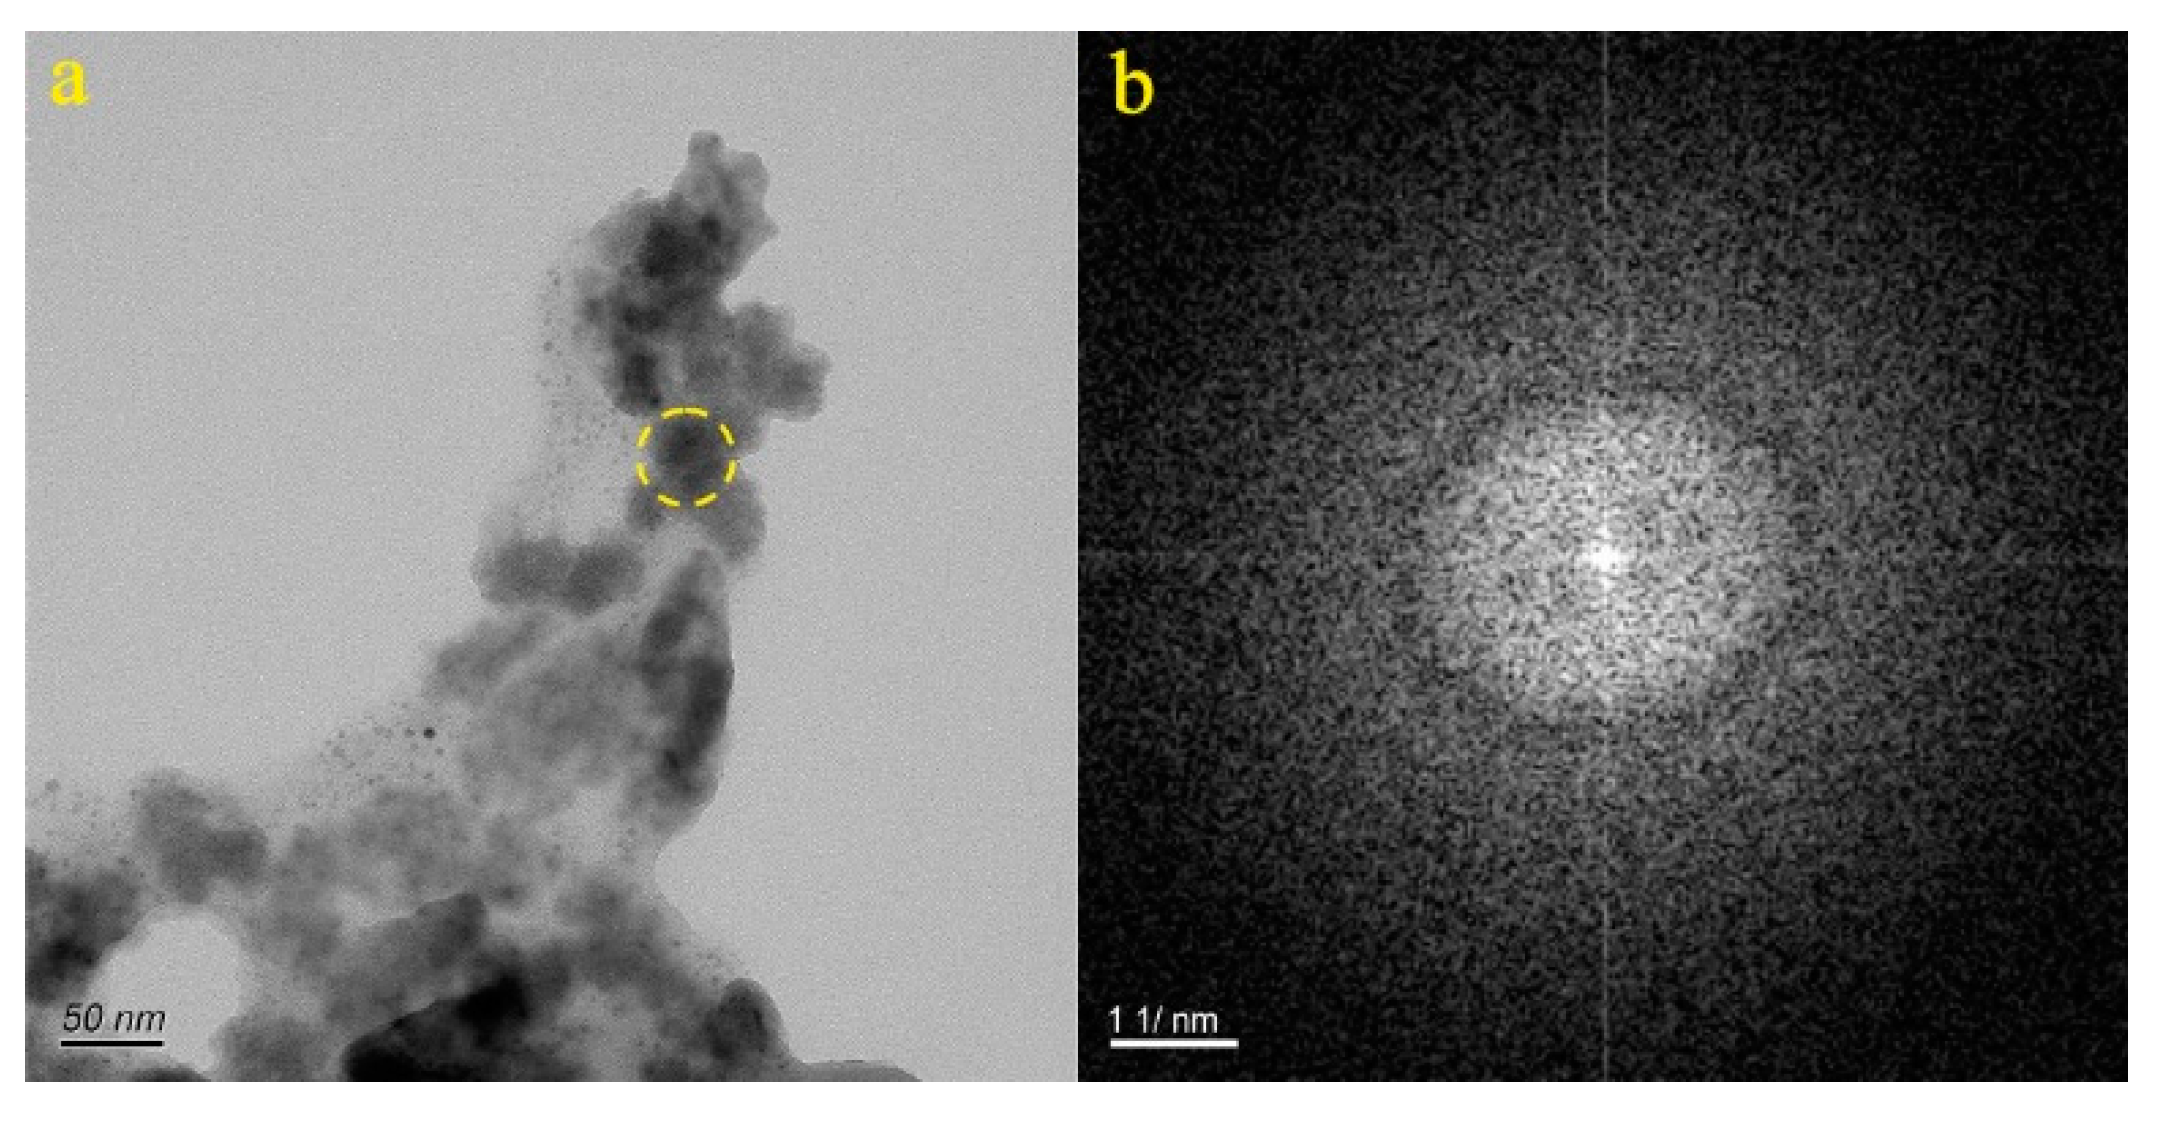
Figure 18.
Particle morphology and diffraction pattern of ZB-5 sample.
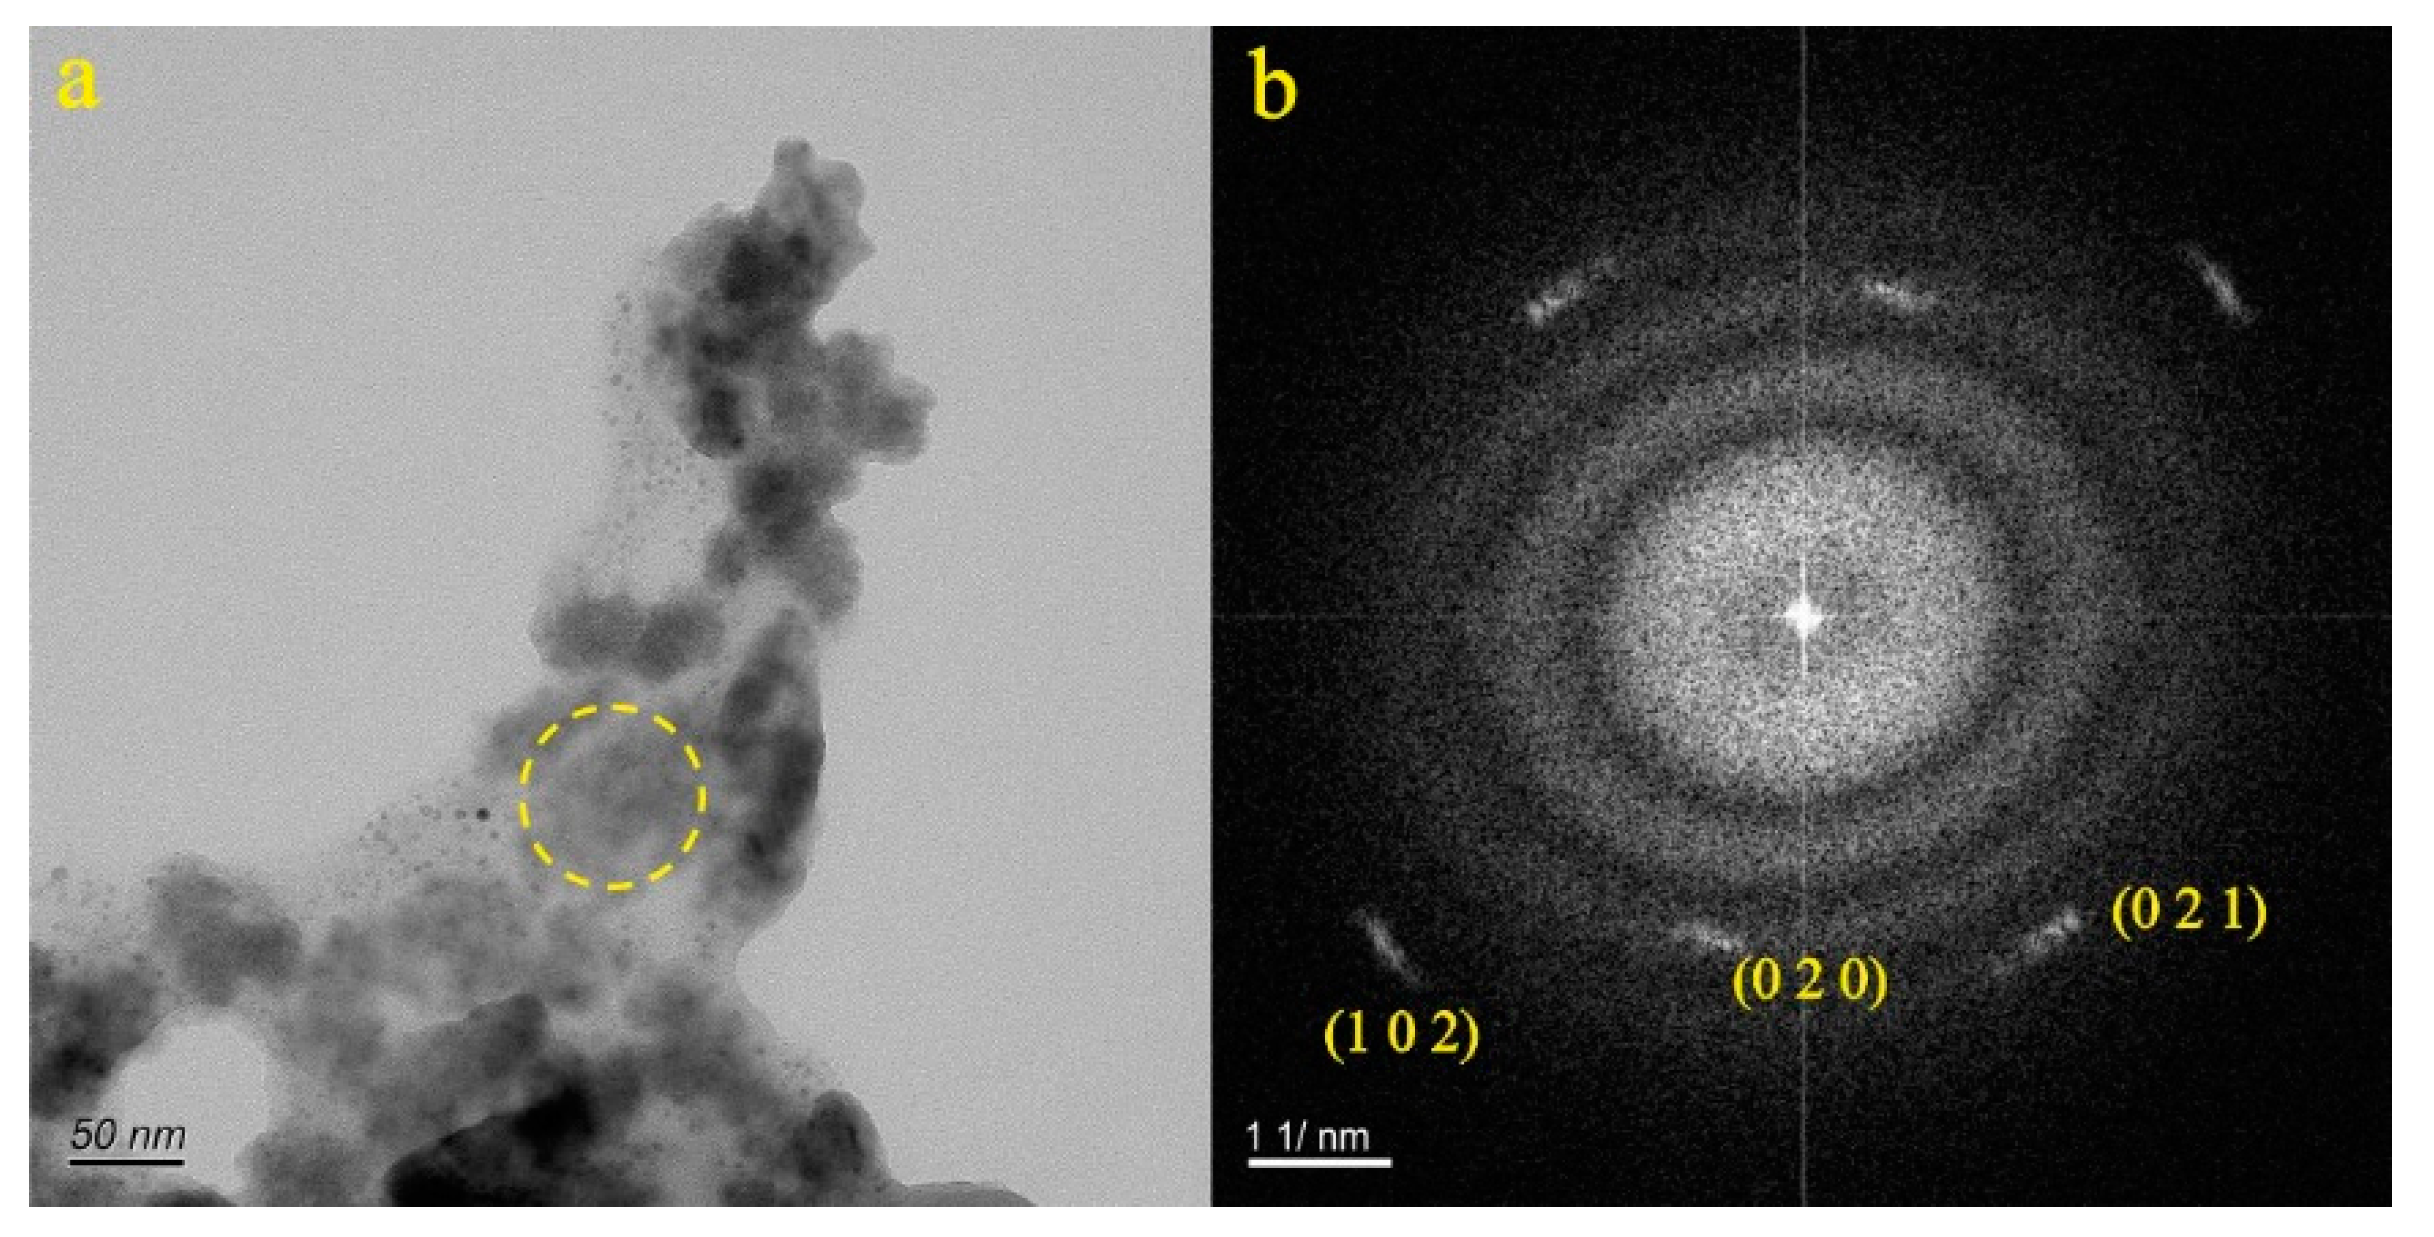
Figure 20.
Particle morphology and diffraction pattern of ZB-7 sample.
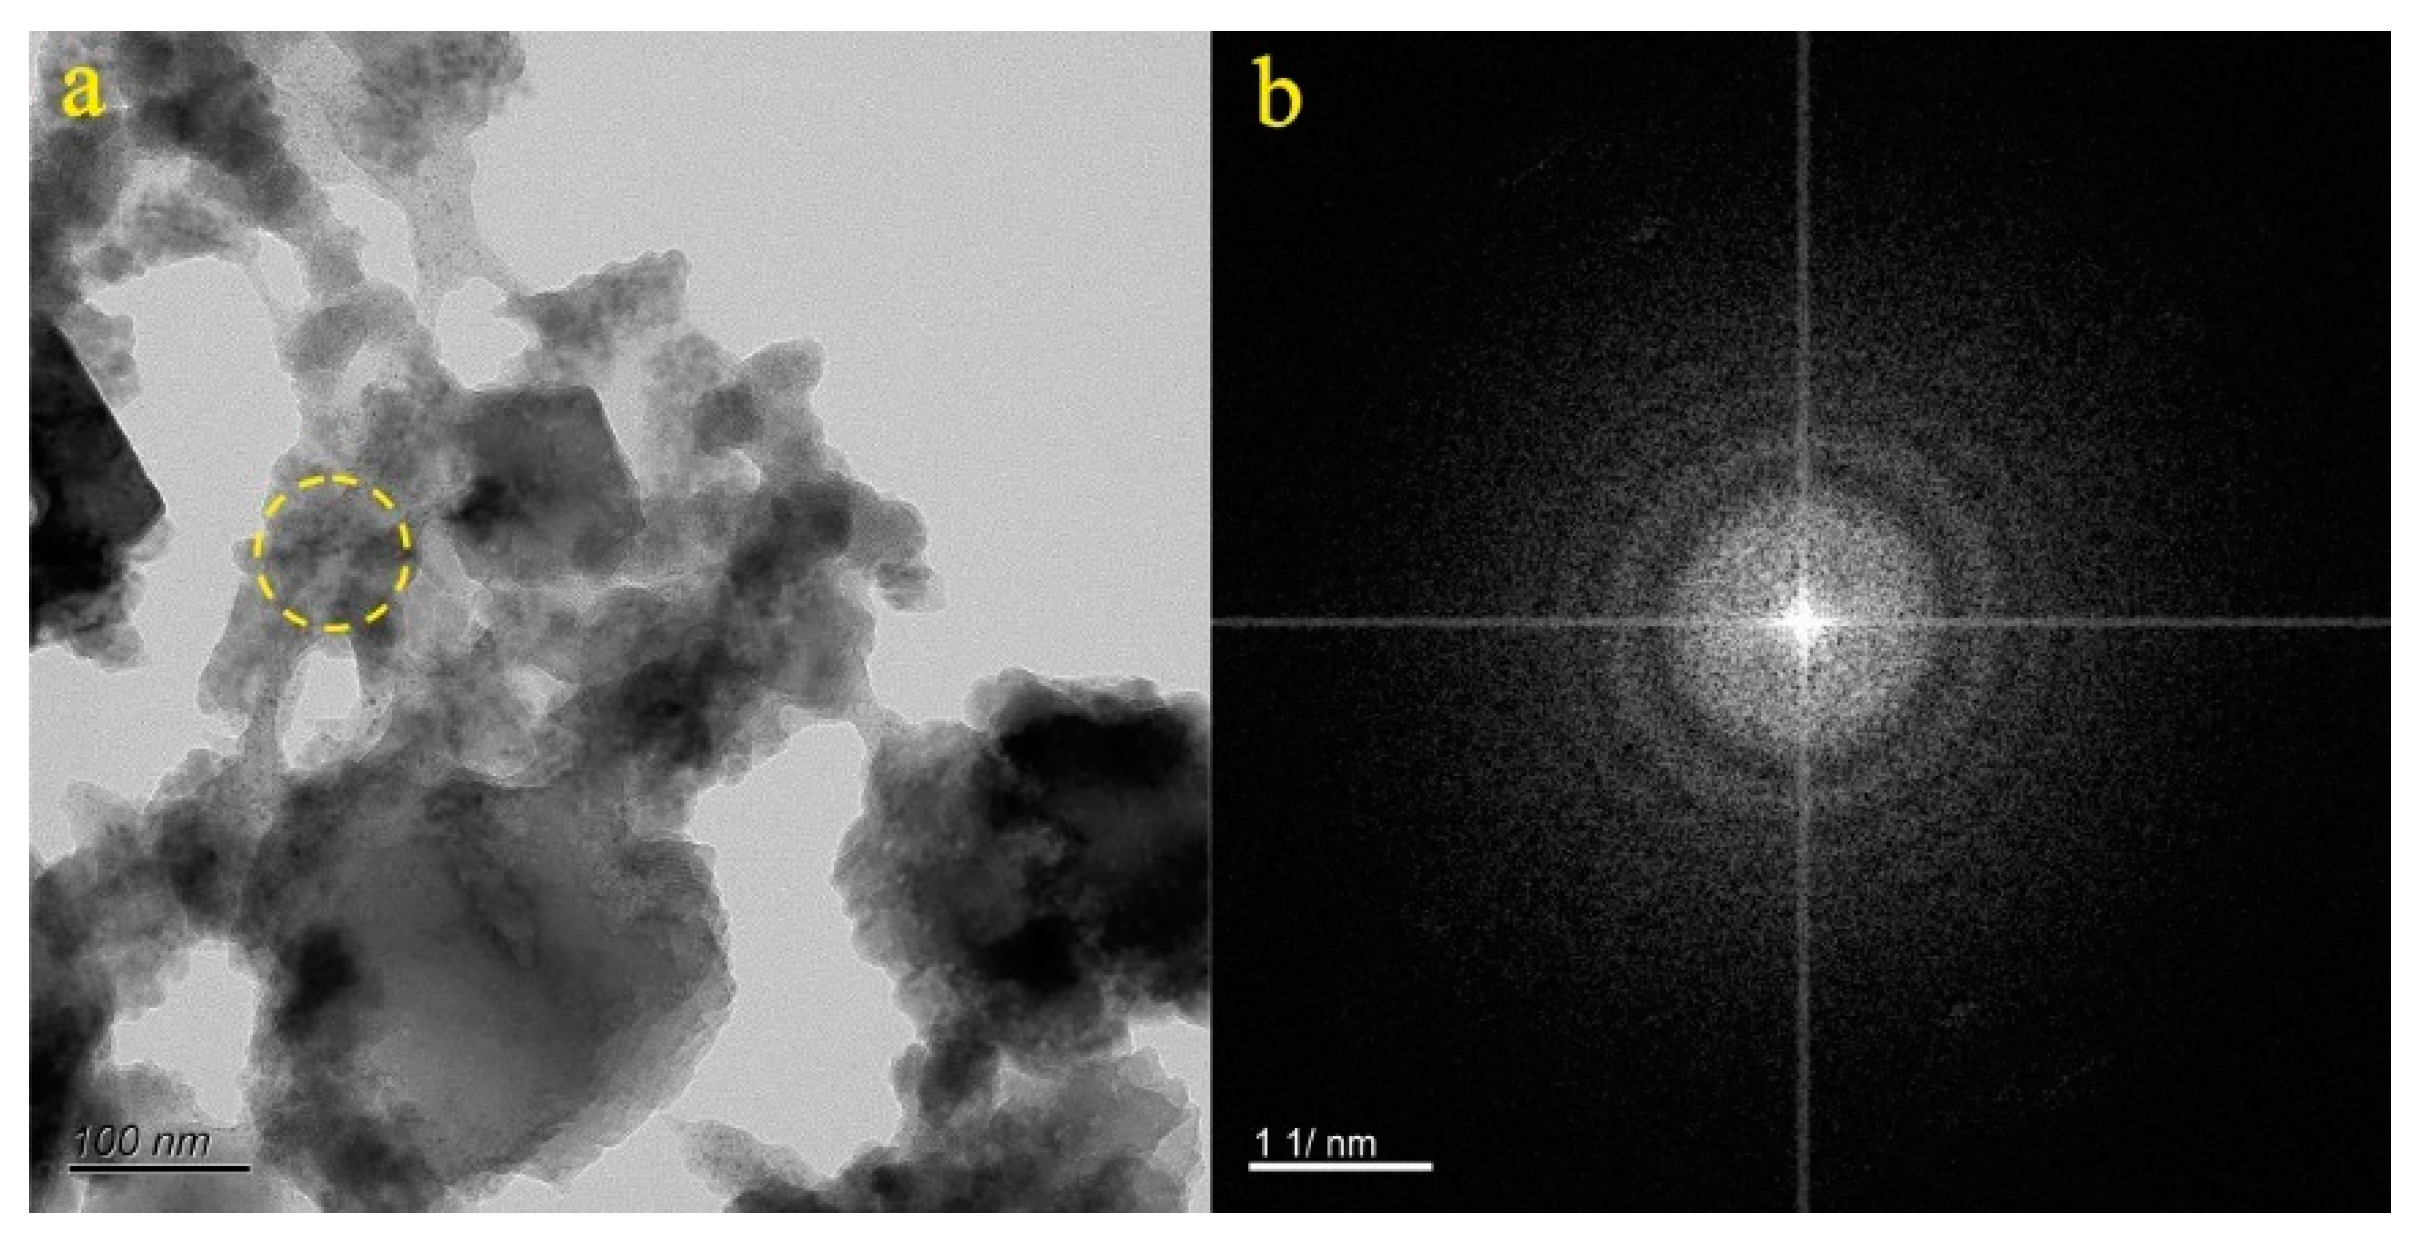
Figure 21.
Particle morphology and diffraction pattern of ZB-8 sample.
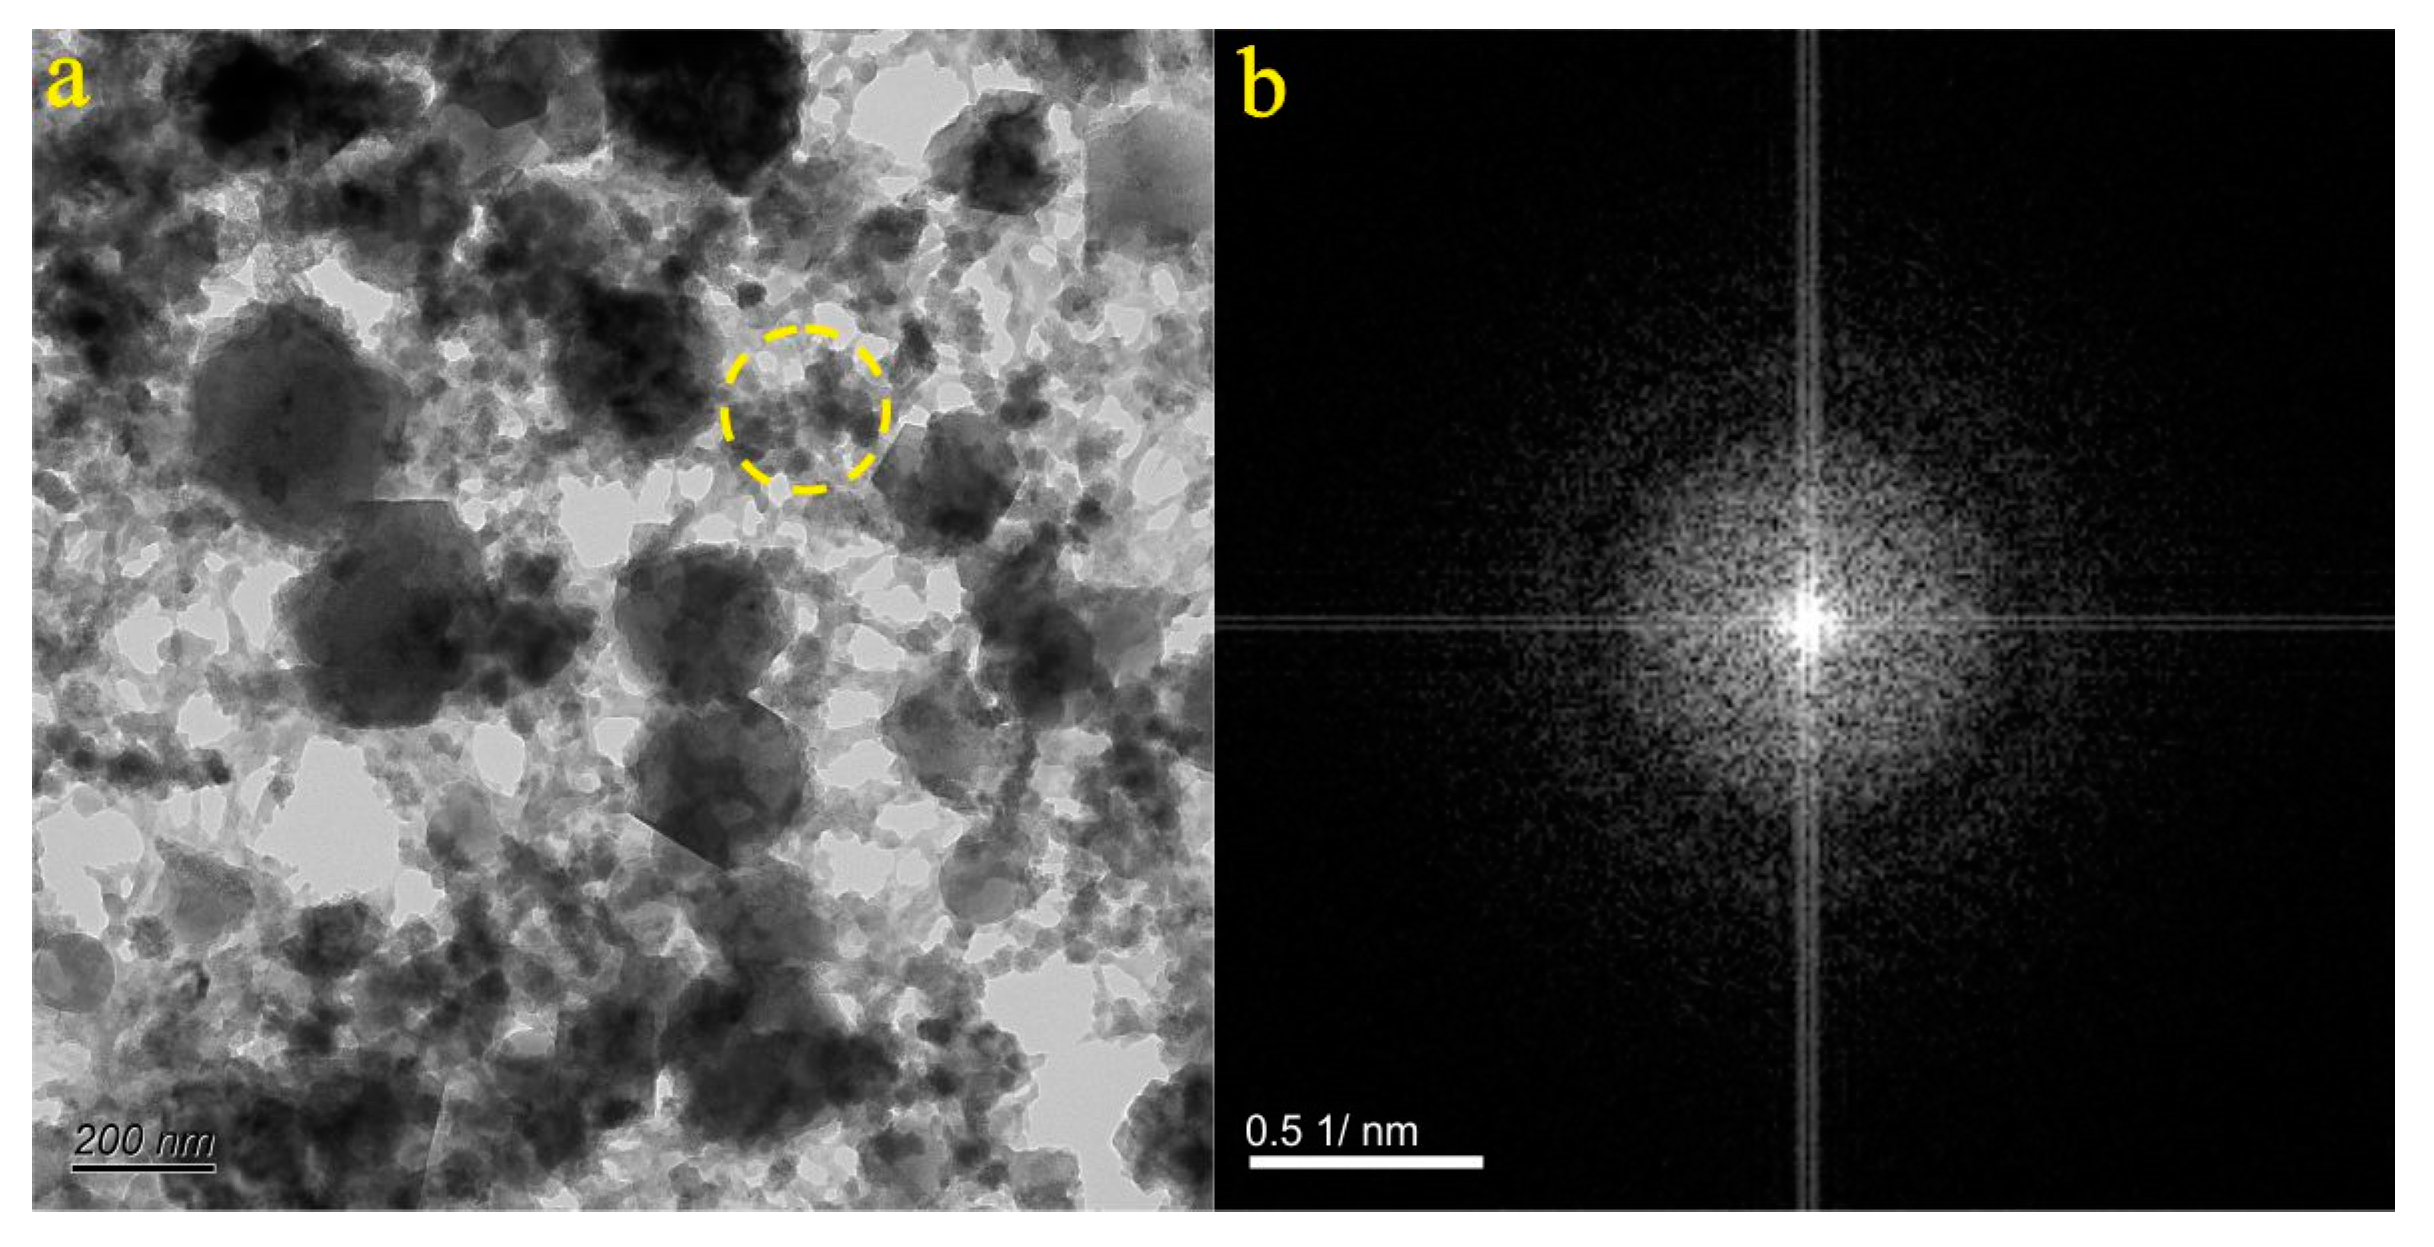
Figure 22.
Particle morphology and diffraction pattern of ZB-9 sample.
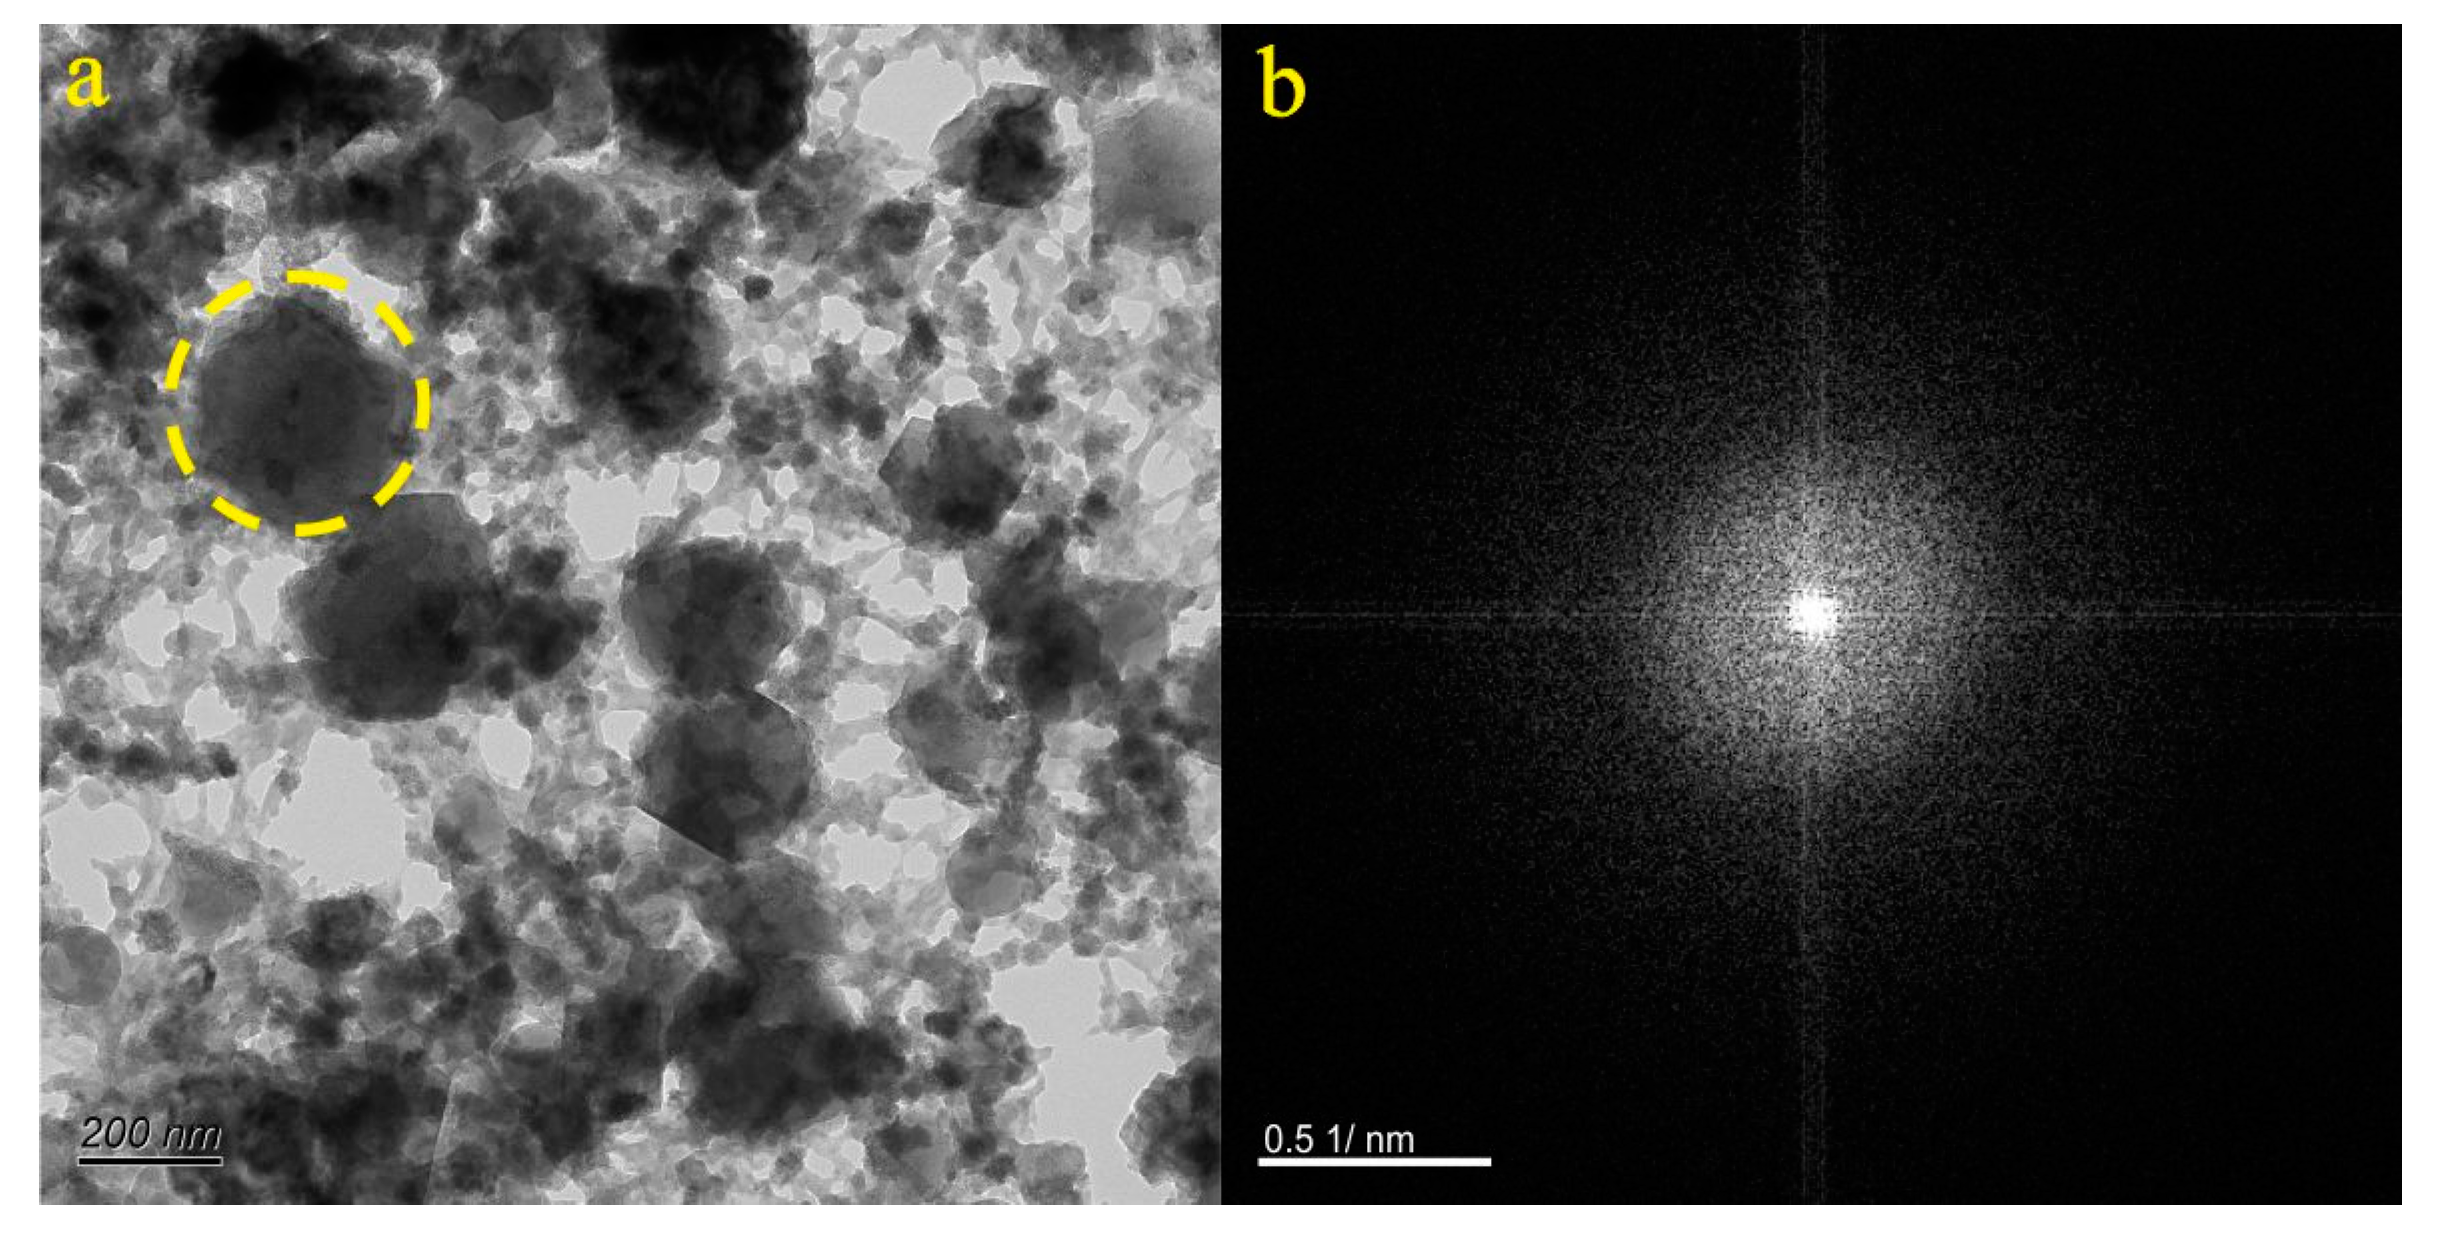

Table 1.
Basic information of samples.
| Samples | Size (nm) | Concentration (Particles/mL) | Aquifer |
|---|---|---|---|
| CJQ | 154.0-482.4 | 0.56-1.8 105 | Ordovician Majiagou Formation |
| JR3 | 113.3-501.9 | 0.96-2.1 105 | Ordovician Majiagou Formation |
| QJZ | 171.4-574.8 | 3.1-3.7 105 | Ordovician Majiagou Formation |
| BL | 152.6-469.5 | 1.6-3.9 105 | Ordovician Majiagou Formation |
| DR2 | 151.4-457.0 | 0.62-1.5 105 | Ordovician |
| Zibo | 196.4-232.4 | 0.71-3.2 105 | Ordovician |
Table 2.
EDS results of sample particles.
| Sample | C | O | Ca | Cu | Si | S | Cl | Mg | Na | Al | K | Fe | Sr | F | Te | In | Pd | Ba | |
| CJQ | JN-1 | 54.83 | 15.88 | 9.81 | 18.57 | 0.68 | 0.21 | ||||||||||||
| JN-2 | 7.51 | 8.74 | 62.23 | 20.54 | 0.61 | 0.35 | |||||||||||||
| JR3 | JN-3 | 5.38 | 20.31 | 58.06 | 12.20 | 2.35 | 1.11 | 0.44 | 0.12 | ||||||||||
| JN-4 | 8.87 | 2.48 | 12.96 | 40.33 | 0.31 | 35.01 | |||||||||||||
| QJZ | JN-5 | 14.99 | 32.02 | 33.77 | 15.61 | 0.85 | 0.62 | 0.67 | 1.42 | ||||||||||
| BL | JN-6 | 7.27 | 33.00 | 1.66 | 9.27 | 3.65 | 0.14 | 44.99 | |||||||||||
| JN-7 | 9.52 | 15.78 | 56.10 | 16.47 | 1.97 | 0.13 | |||||||||||||
| JN-8 | 17.38 | 30.78 | 30.00 | 13.07 | 1.63 | 0.71 | 0.61 | 5.79 | |||||||||||
| DR2 | JN-9 | 21.55 | 42.49 | 10.62 | 8.96 | 0.41 | 12.05 | 0.61 | 0.48 | 2.55 | 0.25 | ||||||||
| JN-10 | 18.68 | 1.82 | 12.57 | 0.26 | 34.23 | 0.29 | 32.12 | ||||||||||||
| JN-11 | 12.2 | 36.02 | 11.28 | 9.79 | 0.16 | 10.6 | 1.19 | 0.95 | 3.25 | 1.49 | 11.4 | 1.6 | |||||||
| JN12 | 14.1 | 4.09 | 0.33 | 15.92 | 0.38 | 0.27 | 32.92 | 0.74 | 23.6 | 7.6 | |||||||||
| Zibo | ZB-1 | 51.16 | 27.36 | 1.15 | 2.14 | 18.18 | |||||||||||||
| ZB-2 | 7.76 | 53.38 | 3.56 | 4.21 | 31.07 | ||||||||||||||
| ZB-3 | 13.55 | 21.29 | 1.93 | 12.47 | 17.48 | 33.26 | |||||||||||||
| ZB-4 | 17.95 | 46.58 | 1.56 | 11.14 | 22.75 | ||||||||||||||
| ZB-5 | 42.87 | 18.72 | 1.35 | 2.82 | 7.50 | 26.71 | |||||||||||||
| ZB-6 | 32.55 | 46.15 | 20.41 | 0.87 | |||||||||||||||
| ZB-7 | 32.42 | 29.62 | 2.02 | 9.70 | 5.47 | 20.74 | |||||||||||||
| ZB-8 | 24.61 | 31.92 | 8.99 | 14.58 | 19.87 | ||||||||||||||
| ZB-9 | 32.96 | 31.95 | 30.77 | 4.31 | |||||||||||||||
Disclaimer/Publisher’s Note: The statements, opinions and data contained in all publications are solely those of the individual author(s) and contributor(s) and not of MDPI and/or the editor(s). MDPI and/or the editor(s) disclaim responsibility for any injury to people or property resulting from any ideas, methods, instructions or products referred to in the content. |
© 2023 by the authors. Licensee MDPI, Basel, Switzerland. This article is an open access article distributed under the terms and conditions of the Creative Commons Attribution (CC BY) license (http://creativecommons.org/licenses/by/4.0/).
Copyright: This open access article is published under a Creative Commons CC BY 4.0 license, which permit the free download, distribution, and reuse, provided that the author and preprint are cited in any reuse.


