
Submitted:
22 September 2023
Posted:
26 September 2023
You are already at the latest version
Abstract
Maritime ports represent an important ecosystem for pollutant emissions and, taking into account the ongoing energy transition, need to adopt new solutions to mitigate current emission levels. These emissions are partially avoidable if ships and vessels docked at the port use electric energy to feed their internal power needs instead of using their internal combustion engines. In Europe, there is an ongoing discussion on including such emissions in the European Emissions Trading System which will represent added costs for maritime operators. Onshore Power Supply systems can contribute to the ongoing energy transition by allowing the use of electric power to feed docked ships. As a first step to contribute to the development of Onshore Power Supply solutions, it is necessary to evaluate the added power needs that these systems would represent for the port. This paper presents a methodology that allows port operators to verify, straightforwardly and transparently, their power needs for Onshore Power Supply applications. The methodology is based on the historical data of docked ships at the port or quay level and provides an energy analysis of each type of vessel to determine the power to be installed at the port so that it is possible to supply energy to different types of ships and vessels simultaneously. Additionally, the implemented methodology provides economic and technical decision support factors by comparing the fuel costs with electric power costs, assessing the potential for this transition to Onshore Power Supply. The methodology is validated using a real case study for the port of Lisbon and obtained results demonstrate the potential for the installation of Onshore Power Supply in medium to large-dimension maritime ports.
Keywords:
Onshore power supply (OPS)
; Port of Lisbon
; Emissions reduction
; ship fuel costs
1. Introduction
Shipping is responsible for annual emissions of 1000 Mt of , which represents roughly 3% of global emissions, and it’s expected to reach up to 1500 Mt by 2050 [1, 2]. These projections have been alarming for the European Commission, which led it to establish the EU Green Deal, creating new challenges for European ports as it calls for a quick green transition. As part of the Fit-for-55 Energy Package, the European Council is also currently proposing the inclusion of shipping-related emissions in the EU Emissions Trading System (ETS), which will result in additional costs for shipping and port operators [3]. Furthermore, the same package considers the mandatory installation of Onshore Power Supply (OPS) systems in ports that receive more than fifty tanker ships on an annual basis[3].
Non-governmental institutions like the European Sea Ports Organisation (ESPO) have also set several ambitions to make European ports more eco-friendly [3]. Some of these ambitions include the mitigation of air, water, and noise pollution in the port area, shipping companies to lower emissions at berth by at least 50% until 2030, and preserving the biodiversity in the port waters.
To mitigate as much as possible the impact of shipping on global warming, it’s important not to neglect the interrelation of the concept ship - port, that is, a measure taken for one concept may affect the other and vice versa. This is particularly relevant in a context where, according to the World Shipping Council, the vast majority of large sea ports operate in a highly urbanized environment, where pollutant emissions have a direct impact also at the local level.
By the time a vessel docks, it no longer needs to be powered by its propulsion engines. However, energy is always required to guarantee essential operations, such as lighting, cooling/heating, ventilation, pumps, and other operations. This energy supply is often obtained by the use of diesel-powered generators inside the vessel [6] that are responsible for gas emissions that negatively affect the environment. Thus, OPS systems have emerged as an alternative to the traditional onboard diesel-powered generators, as it involve, by retrofitting vessels, using shore-side electricity to power moored ships in ports [7]. Taking this into consideration, shifting from these generators to OPS would eliminate all the noise and vibrations, along with the reduction of pollutant emissions near the port area.
OPS are already a mature technology, with some power system component manufacturers offering turn-key solutions. Nonetheless, its application is still incipient due to different barriers. These can be of technical nature or economical nature. Technical barriers are associated with the geographic dispersion of berths or quays in a large port and the existing power grid infrastructure. On one side, previous studies demonstrate that the existence of several small berths, which would require the installation of several OPS, would increase the installation costs to excessive values. on the other side, existing power grids are not designed to accommodate the added electric load that ships would represent, resulting in the need to upgrade the existing systems [8]. On the other hand, economic barriers include the definition of the responsible parties for the several associated costs (e.g. upgrading the power grid) or the non-existence of technological solutions that could allow ports to create business models around the OPS concept (e.g. selling energy to the ships and simultaneously providing flexibility services to the power grid) [9]. Nonetheless, with the ongoing social pressure and transition in the regulatory context, the usage of OPS is expected to increase in the next few years.
The first step in designing an OPS is related to evaluating power needs. This is port-specific and related to berthed ship profiles. To contribute to the future design of OPS systems, this paper presents a methodology to characterize maritime ports, from the vessels’ energy requirements point of view. This will determine the power to be installed for the OPS system. The methodology is implemented flexibly using Python, allowing its easier adaptation to different port realities or including new types of ships (and their electric load profiles) as one example. The implemented solution is tested with real data from Lisbon’s port and the results obtained provide several variables that could be used as decision support to evaluate the need and potential of an OPS.
2. Methodology
The aim of this paper is to provide a methodology for the electrical characterisation of a maritime port in terms of power supply to moored vessels, evaluating as well a comparison of costs incurred by the two solutions (electricity vs fuel costs). This allows for the determination of the power to be installed at port level for OPS purposes as well as having a first idea of costs associated with its operation.
This electrical characterization can be made for any port around the world, with the aid of a self developed Python program. With compatible input data, it is possible to obtain a load diagram considering the time period of the input file, as well as the peak power, average power, the energy demand of that period of time and a comparison of costs with and without OPS. These costs refer only to the comparison of fuel costs (electricity or vessel fuel).
The implemented methodology follows a modular and flexible approach, based on the steps indicated in Figure 1. These steps are further detailed below.
2.1. Data gathering
The required input is related to the data of vessels docking in the port (or quay) under analysis. The data should be input using a .csv file with a specific format (described in the Use Case section). This file needs to contain the following characteristics for each vessel:
- Type of vessel
- Actual Time of Arrival (ATA)
- Actual Time of Departure (ATD)
- Gross Tonnage (GT)
In addition, if the load diagram of a vessel under consideration is known a priori, its load diagram can be changed by entering the new load diagram into the program.
As these are the only required inputs, there are two possible applications for the methodology implemented in this work. One one side, it can be used to calculate the expected maximum power needs for the OPS, which would define its power capacity. Alternatively, if an OPS system is already in place, this methodology can be used to forecast the power needs, based on the expected ATA and ATD of vessels.
2.2. Data Processing
The gathered data is processed using a self developed Python program that translates each vessel eligible for OPS in the .csv file into a load diagram, representing the energy required to power different types of vessels at berth, throughout the considered period. If a specific load diagram is given, this will be used. If there is no information regarding the load diagram of each vessel, an average load diagram is used depending on the vessel type. In the later case, the data of each eligible vessel is combined with the estimated power requirement per vessel in Table 1, obtaining the average power required of that vessel in kW.
In the absence of more detailed information on the energy requirements for each type of vessel, it is assumed that each vessel requires a constant load at the average power supplied, which may not reflect reality, where the power supplied to vessels would fluctuate, but gives an approximate forecast of energy consumption over a given period.
After having the power requirements for each vessel processed, it is necessary to aggregate this information in order to obtain a single load diagram representing the all-time power supplied. To build that diagram it is necessary to take into account each vessel’s ATA and ATD, plus, the fact that they can be docked simultaneously since the energy demanded from the port will increase to supply more vessels.
The features of the program are as follows:
- 1.
- Allows to check how long an individual vessel has been moored and what its energy requirements are, simply by providing the row number where the vessel is located in the .csv file;
- 2.
- Load diagram of the port, from the moment the first vessel docked to the last vessel that docked;
- 3.
- Maximum number of vessels docked at the same time, and when it occurred;
- 4.
- Percentage of time spent without shore power;
- 5.
- Peak power and when it was reached;
- 6.
- Average power;
- 7.
- Total energy supplied;
- 8.
- The ability to change the date range of the program, in order to get a more detailed analysis;
- 9.
- Possibility to change the load diagram of a vessel;
- 10.
- Electrical characterisation of each port terminal;
- 11.
- Cost comparison between OPS and no OPS solutions;
- 12.
- Calculation of energy costs using time-dependent costs.
3. Use Case Description
Lisbon’s port was chosen for this study as it’s located fairly in the center of the Lisbon Metropolitan Area, which itself has an estimated population of 2.870.770 people regarding 2021 [10], representing more than a quarter of Portugal’s population. Furthermore, considering the number of vessels that the port receives in a yearly basis, and according to the proposed regulation changes at the European level, this port would have to install OPS solutions in the near future.
The Lisbon Port Authority (APL) has defined, in 2007, a sustainable development strategy for the port, that relies on 4 underlying principles [11]:
- Social responsibility
- Environmental responsibility
- Economical responsibility
- Transparency
The environmental responsibility principle lays on greater port integration in the urban and natural surroundings.
As the port of Lisbon is placed in Tagus estuary, not only the population are affected from vessel emissions that circulate or are moored in the port, but also multiple species have their own habitat at risk.
If OPS is implemented at the port of Lisbon, it is estimated, for instance, that a cruise ship that stays at berth for 9 hours will experience at least a 15% reduction in its emissions [7].
This paper makes the electrical characterization of the port of Lisbon considering the whole year of 2022, although it could be chosen any other time period or port, so the energy supplied to vessels may vary depending on the chosen year, which always causes an error margin for this matter.
As described in Chapter 2, it’s necessary to gather the data of the vessels docking in the port, which in this case is available at the port’s website [11]. By choosing, for example, the ATA from 01/01/2022 until 31/12/2022, it’s possible to download a .csv file with the records of all the vessels that entered the port during that period.
This file is key to the study since it contains not only the Actual Time of Arrival (ATA) and the Actual Time of Departure (ATD), but also the Gross Tonnage (GT) for each type of vessel, as showcased in Table 2, as well as many other specifications. The file then contains all the required input data for the developed methodology to perform the power needs characterisation.
4. Results
In this chapter, the results provided by the program are analyzed, and thus, the power to be installed at the port of Lisbon to the onshore power supply will be defined.
The results provided by each of the program’s features for the port of Lisbon case study, are displayed below.
4.1. Load diagram of the port
This feature provides the port’s load diagram, containing the power requirements of every OPS-eligible vessel that docked in the considered time period.
The load diagram for the port of Lisbon in 2022 is depicted in Figure 2. It is possible to detect the time period when the port reaches its peak power, corresponding to the month of August. This is an expected result since during the summer the port of Lisbon hosts several cruise ships that have a high energy demand.
4.2. Number of moored vessels
Figure 3 shows the number of moored vessels at the port of Lisbon that may be eligible for OPS over the analysed time period.
It may be useful to check the time period where the maximum amount of docked vessels was reached, in order to understand when the demand at the port is highest, and how many vessels the OPS system has to feed in that time period.
On April 14, 2022, there were 29 OPS-eligible vessels simultaneously moored at the port of Lisbon.
4.3. Peak power
With this feature, it can visualized the value of the peak power in the load diagram, which makes it very important for estimating the power to be installed in the port.
For the time period under consideration, the peak power reaches up to 18,035 kW in August 16, 2022 at 6:00 pm, which leads to an installed power in the port of Lisbon of 22,544 kW, if a margin of 20% is considered. This margin is selected just for illustration purposes, as a safety margin to account for energy losses as well. The considered peak power refers only to the power that would be supplied through the OPS system and it is not related to the electrical consumption of the port.
4.4. Average power
Here, the average power provided by the port during the considered time period can be obtained. This is useful for tracking energy consumption over time by quantifying the port’s energy delivery, for designing and sizing equipment to ensure that it can handle the expected power requirements, and also for comparing the energy usage of different seaports.
For the particular case of the port of Lisbon, it requires an average power of 4,567 kW.
4.5. Energy required
This feature shows the total energy required for the onshore power supply system during the considered time period.
In 2022, the port of Lisbon would require 9,965 MWh to energetically power all of its vessels, with the assumptions made in this work (e.g. vessels with an average load diagram equal to their rated power).
This chapter describes the energy needs and financial costs for the year of 2022, however, it may be useful to have a more detailed analysis, for example, for the month when peak power was reached.
For this purpose, the date range can be changed to a shorter time period than the original, so that the load diagram can be visualized for that particular time period, as well as all other port-related metrics.
In the load diagram of Figure 2 it can be noticed that the peak power is reached around August, so that will be the chosen month to make this particular analysis.
The load diagram of the port of Lisbon for the month of August of 2022 is shown in Figure 4, and for this month, the OPS system requires a total amount of energy of 2,899 MWh, with an average power of 3,891 kW.
4.6. Energy cost comparison
Here, the energy costs for the considered time period with and without the OPS system can be estimated, as well as an estimation of how much money could be saved if this technology were to be implemented.
4.6.1. Fuel costs
The fuel used for the vessel’s auxiliary engines is of the VLSFO (very low sulphur oil) type, which during the 6-months period between September 10, 2022 until March 10, 2023, had an average price of 693.50 USD / mt (metric ton), which currently corresponds to 650.7 €/mt. Also, assuming that these engines have a specific fuel oil consumption of 250 g/kWh [5], it would correspond to a yearly cost of 1,621,077 €.
It is also worth pointing out that the European Commission included maritime transport activities in the European Union Emissions Trading System (EU ETS), which will mean that shipping companies will start to pay for shipping emissions that they reported in the preceding year, with the considered emissions starting in the year 2024 [13]. Taking into consideration the existing carbon pricing schemes [14, 15], a tax of 100 € per ton of released will be applied into the costs without OPS, considering an emission factor of 3.14 g_/g_fuel [5]. This means that if this tax is applied at this emission factor, it will represent an added cost of 789,736 €.
So, adding up both costs will result into a total cost of 2,410,813 € for 2022.
4.6.2. Energy costs under a fixed tariff
In order to obtain the cost per kWh, the national public authority for energy and fuel (DGEG) values were used. These are available in DGEG website [12]. Considering that the port of Lisbon has an annual power consumption rate in between 2,000 MWh and 20,000 MWh, then it lays on a category named ID. The average energy price for this category, excluding VAT and other recoverable taxes, is 0.1326 €/kWh. This translates into an annual energy cost of 1,321,359 € for the port of Lisbon.
4.6.3. Energy costs under market prices
Although the cost of energy for the year 2022 can be estimated using a fixed tariff, this figure is never completely equal to what is actually paid, because the amount that is paid for energy will depend on market prices that always suffer fluctuations throughout the year.
For this purpose, energy prices from the day-ahead market of the MIBEL (Iberian Energy Market) were obtained from [16]. These are depicted in Figure 5, where the highest cost of energy under market prices was 1455.47 €/kWh, on March 8th at 8:00pm, and the lowest cost of energy under market prices was 0.0 €/kWh, on December 31st at 3:00am.
The cost of energy considering the market prices of 2022 is 1,630,668 €, which means that if OPS is implemented, it saves around 780,145 € in that year.
Thus, as a mere comparison between energy costs, if OPS is implemented, there seems to be some space for savings regarding fuel, from the vessels side, and a possible business opportunity for the port by selling energy to the vessels. However, these savings are highly dependent on the implementation of the emission taxes, as without them the OPS business would become less appealing. Nonetheless, taking into account that energy prices were exceptionally high during 2022 due to several factors and are expected to decrease at the medium to long term, the margin for OPS installation is expected to increase.
4.7. Power supplied by terminals
As mentioned in 2.2, the program can be used to make the electrical characterization of each port terminal.
This feature was applied to the port of Lisbon’s use case in order to quantify the power supplied by each of the six major cargo ship terminals (Liscont, TSA, Sotagus, TMB, ETE and Silopor) and also by both of the cruise ship terminals (Santa Apolónia Cruise Terminal and Gare Marítima da Rocha Conde de Óbidos) in 2022, with the results displayed in Table 3 and Table 4, respectively.
Various conclusions can be drawn by analyzing both tables: At the Santa Apolónia Cruise Terminal there is a higher demand for energy and power; At terminals designated for cruise ships there are more ships docked at the same time than at terminals designated for cargo ships; Although the Rocha Conde de Óbidos maritime station requires a smaller amount of energy compared to most cargo terminals, it has to provide much higher peak power, which can be caused by a high demand for energy in short periods of time.
The contribution of each terminal to the energy supplied in each category is shown in the graphs in Figure 6 as the Energy Consumption Ratio (ECR). In this case, for example, the Alcântara Container Terminal (Liscont) by supplying 785.15 MWh has a contribution of 25% in the total energy supplied by the six most important cargo ship terminals, which adding the energy supplied by each terminal (Liscont, TSA, Sotagus, TMB, ETE and Silopor) results in 3148.33 MWh.
The circular graph in Figure 7 allows the visualization of the contribution of each terminal category to the total energy supplied by the port of Lisbon in 2022 (9,787 MWh).
4.8. Null consumption rate per terminal
The shore-supplied power that energetically feeds all OPS-eligible ships, depicted in the load diagram of the port (Figure 2), is no less than the sum of the contribution of all the port’s terminals. For this reason, the analysis of the OPS system’s null consumption rate (NCR) is done per terminal and not by the port as a whole, since there would be no periods of time in which the port of Lisbon would have no power to be supplied throughout 2022.
The advantages of knowing which terminals have the highest or lowest zero energy consumption rate and when it occurs are mainly related to resource allocation, such as finding the best schedule for maintenance operations and staff allocation during periods when there is no demand for energy.
The results of the null consumption rate for the terminals of the port of Lisbon, that is, the percentage of the time under analysis when the terminals were not energetically feeding any ship, are represented in Table 5. It can then be noted that the terminals with the highest NCR for cargo and cruise ships are the Beato Bulk Food Terminal (Silopor) and the Santa Apolónia Cruise Terminal, respectively.
5. Financial Analysis
The OPS technology, as mentioned earlier, apart from bringing ecological benefits, leads to greater financial savings by replacing the fuel used by the vessels at berth. As so, thousands of euros could be saved per year by powering vessels from the shore, which might make the investment in this technology worthwhile if the return on investment can be achieved within a few decades.
One of the dissertations in the bibliography [17] carried out a study where three different power sizing scenarios were defined for the terminals at the port of Lisbon, along with the associated costs.
5.1. Scenario Definition
There were defined three scenarios for some of the main terminals of the port of Lisbon, namely:
- Santa Apolónia Cruise Terminal (SACT)
- Lisbon Multipurpose Terminal (TSA)
- Santa Apolónia Container Terminal (Sotagus)
- Beato Multipurpose Terminal (TMB)
- Beato Foodstuff Bulk Terminal (Silopor)
- Poço do Bispo Multipurpose Terminal (ETE)
The scenario definition is based on the installed power per terminal, so the chosen scenario might change from terminal to terminal in order to minimize the investment costs.
The first scenario is the most conservative, as it was conceived to yield a return on investment, covering only the essential energy needs, where the operating hours of the OPS system were maximized. On the other hand, the third scenario aim to ensure that the energy demand at each terminal is fully met, translating into higher profits in the long run. This makes the second scenario to aim for a balance between the previous scenarios, where a medium-high power usage is achieved.
Simply put, the second and third scenarios reflect a higher probability of the OPS system not being used to its full potential as most of the time the supplied power would be much lower than the installed power, which makes those scenarios less profitable from an economic point of view.
5.2. Costs per Scenario
This subsection addresses the costs that each scenario entails, according to the quantification of OPS systems presented in Table 6. Table 8 provides a breakdown of the estimated initial investment for the project in each scenario, which includes the cost of purchasing and installing equipment, the construction of the necessary civil infrastructure, the realization of the necessary engineering projects, as well as the cost of the infrastructure for connection to the public electrical grid.
Table 8 shows, as could be expected, that as the installed power increases, the higher the OPS investment cost will be for each terminal.
Although the Alcântara Container Terminal (Liscont) and Rocha Conde de Óbidos are unfortunately not present in the OPS cost study for the port of Lisbon [17], which are two of the terminals that would have a high energy demand in an OPS system, this analysis will allow a good insight into the investment costs.
In the Table 3 and Table 4 from Section 4.7, it was defined the electrical characterization of the cargo and cruise ship terminals, respectively, thus obtaining the peak power values for each terminal. Now, with this data, it is possible to chose the most suitable scenario from Table 7 and therefore estimate the cost that the OPS installation will carry out at each terminal.

Table 9.
Installed power per terminal.
| Terminal | Peak Power (MW) |
Installed Power (MVA) |
| SACT | 14.560 | 16 MVA |
| TSA | 1.145 | 1.4 MVA |
| Sotagus | 1.799 | 2 MVA |
| TMB | 0.408 | 1 MVA |
| Silopor | 0.395 | 1 MVA |
| ETE | 0.680 | 0.8 MVA |
Note that the literature only portrays an installed power up to 0.4 MVA for the Poço do Bispo Multipurpose Terminal (ETE), as shown in Table 7, but it turns out that this terminal has an estimated peak power of 680 kW (Table 3). To address this issue, an installed power of 0.8 MVA will be considered, and the OPS cost for this terminal will be estimated by using the cost ratio if 0.2 MVA or 0.4 MVA power was installed, as shown in Figure 8.
The costs of OPS installation, considering the installed power at these six terminals, are displayed in Table 10, as well as the total investment cost for the port.
5.3. Payback Period
The benefits of installing OPS come from the overall cost savings this technology provides, because even though it requires a large initial investment, it is cheaper to use energy from the grid to power the vessels at berth than to use fossil fuels, which are more expensive and environmentally damaging.
It is known from subSection 4.6.3 that the OPS could potentially save up to 780,145 € if it was used in the whole year of 2022. But in this case, the initial investment costs are only known for six of the terminals in the port of Lisbon, so the annual savings considered have to correspond only to those incurred in these very terminals and not for the entire seaport. For this reason, the annual savings that will be considered to estimate the payback period are presented in Table 11.
Considering that 506,310 € is the amount that is saved every year with OPS, it is possible to estimate the payback period for an initial investment of 18,173,269 € to install the OPS at the port of Lisbon, which corresponds to a period of 36 years, as suggested in the payback chart in Figure 9.
5.3.1. Payback period with external financing
36 years may be too long a payback period for port authorities to consider it economically viable to invest in the OPS system. Therefore, this section is concerned with estimating how much of an external financing would be required for the port authorities’ initial investment to be recouped after 20 years.
In order to determine the amount of external financing that is required to achieve a return on investment over the time horizon under consideration, equations 1 and 2 have been used.
The results were as follows:
-
APL Investment = 10,126,200 €
- -
- Savings = 506,310 €
- -
- Payback Year = 20
-
Financing Required = 8,047,069 €
- -
- OPS Cost = 18,173,269 €
- -
- APL Investment = 10,126,200 €
It can therefore be estimated that the payback period will be reduced from 36 to 20 years with external financing of approximately 44% of the total cost of installing OPS.
Table 12 shows the new cost per terminal after applying the debt share to the initial OPS installation cost per terminal, and the new payback chart is illustrated in Figure 10.
This scenario would be of greater economic interest to APL as the payback period would be significantly shorter than the initial one, thereby reducing the investment risk.
It should be noted that the Alcântara Container Terminal (Liscont) and the Rocha Conde de Óbidos Maritime Station (RCOMS) were not included in the payback period estimate because no cost references were found for implementing OPS in these terminals. Since both terminals would consume a lot of energy to power their moored vessels, including them would increase the potential annual savings and most likely reduce the payback period.
6. Conclusions
This paper presents a methodology to assess the maximum power needs to provide electric energy for vessels while docked, through OPS. The methodology is implemented in a self-developed Python program that provides different metrics regarding energy needs and also cost comparison between as-is solutions (running vessels on maritime fuel) and the application of OPS. The minimum required input is a database regarding the ATA ad ATD of vessels in a specific port or quay under analysis as well as vessel types and their gross tonnage.
The developed methodology is applied to a use case considering the port of Lisbon. This port is then characterized from an energy point of view, so that is possible to estimate the power to be installed in the port for the OPS system, and estimate of how much could be saved if this system were to be implemented.
Implementing OPS in the port of Lisbon would not only result in improved public health and greater preservation of the surrounding biodiversity, but would also result in significant annual financial savings from an energy perspective.
Finally, the payback period for the implementation of this technology in the port of Lisbon was estimated, concluding that although a financial return is expected, it is important to obtain external financing to achieve this return in a shorter number of years in order to reduce the investment risk.
Acknowledgments
This research was funded (in part) by the Portuguese FCT program, Center of Technology and Systems (CTS) UIDB/00066/2020 / UIDP/00066/2020.
Conflicts of Interest
The authors declare no conflict of interest.
Abbreviations
The following abbreviations are used in this manuscript:
| APL | Lisbon Port Authority |
| ATA | Actual Time of Arrival |
| ATD | Actual Time of Departure |
| ECR | Energy Consumption Ratio |
| GT | Gross Tonnage |
| NCR | Null Consumption Rate |
| OPS | Onshore Power Supply |
References
- D. Mueller, S. Uibel, M. Takemura, D. Klingelhoefer and D. A. Groneberg. “Ships, ports and particulate air pollution - An analysis of recent studies”. Journal of Occupational Medicine and Toxicology 6 (1 2011). doi: 10.1186/1745-6673-6-31. [CrossRef]
- Shipping emissions [Online]. Retrieved from: https://www.transportenvironment.org/challenges/ ships/. [Accessed on 20/01/2023].
- European Council. Fit for 55 Climate package. 2022.
- A. Mäkilä. ESPO green guide 2021 a manual for european ports towards a green future. ESPO, 2021, pp. 23–24.
- Analysis of charging-and shore power infrastructure in Norwegian ports, ReCharge Project Report DNV-GL. 2017.
- J. Yu, S. Voß, and G. Tang. “Strategy development for retrofitting ships for imple- menting shore side electricity”. Transportation Research Part D: Transport and Environment 74 (2019-09), pp. 201–213. i s s n: 1361-9209. d o i: 10.1016/J.TRD.2019 .08.004. [CrossRef]
- W. J. Hall. “Assessment of CO2 and priority pollutant reduction by installation of shoreside power”. Resources, Conservation and Recycling 54 (7 2010-05), pp. 462– 467. doi: 10.1016/j.resconrec.2009.10.002. [CrossRef]
- Y. Khersonsky et al, “Challenges of Connecting Shipboard Marine Systems to Medium Voltage Shoreside Electrical Power,” IEEE Trans Ind Appl, vol. 43, no. 3, pp. 838–844, 2007, doi: 10.1109/TIA.2007.895810. [CrossRef]
- J. Kumar et al, “Technical design aspects of harbour area grid for shore to ship power: State of the art and future solutions,” International Journal of Electrical Power & Energy Systems, vol. 104, pp. 840–852, Jan. 2019, doi: 10.1016/j.ijepes.2018.07.051. [CrossRef]
- INE (2021). Censos 2021 [Online]. Retrieved from: https://www.ine.pt/scripts/db_censos_2021 .html. [Accessed on 04/11/2022].
- P. de Lisboa. Sustentabilidade [Online]. Retrieved from: https://www.portodelisboa.pt/estrategia- de-desenvolvimento. [Accessed on 04/11/2022].
- DGEG. [Online]. Retrieved from: https://www.dgeg.gov.pt/pt/estatistica/energia. [Accessed on 10/03/2023].
- Reducing emissions from the shipping sector. [Online]. Retrieved from: https://climate.ec.europa.eu/eu-action/transport-emissions/reducing-emissions-shipping-sector_en#inclusion-of-maritime-emissions-in-eu-emissions-trading-system-ets. [Accessed on 11/06/2023].
- Oecd and Itf. Corporate Partnership Board CPB Carbon Pricing in Shipping Case-Specific Policy Analysis.
- I. Gerresten. EU carbon tax puts a price on shipping emissions. [Online]. Retrieved from: https://chinadialogue.net/en/transport/eu-carbon-tax-puts-a-price-on-shipping-emissions/. [Accessed on 10/03/2023].
- OMIE. Preços por hora do mercado diário em Portugal. [Online]. Retrieved from: https://www.omie.es/pt. [Accessed on 11/06/2023].
- A. E. L. dos Santos. LIGAÇÃO ELÉTRICA A NAVIOS DE CRUZEIRO E DE MERCADORIAS (SHORE-TO-SHIP CONNECTION)-CASO DE ESTUDO: TERMINAIS DA ZONA ORIENTAL DO PORTO DE LISBOA. 2020.
Figure 1.
Task Flowchart.
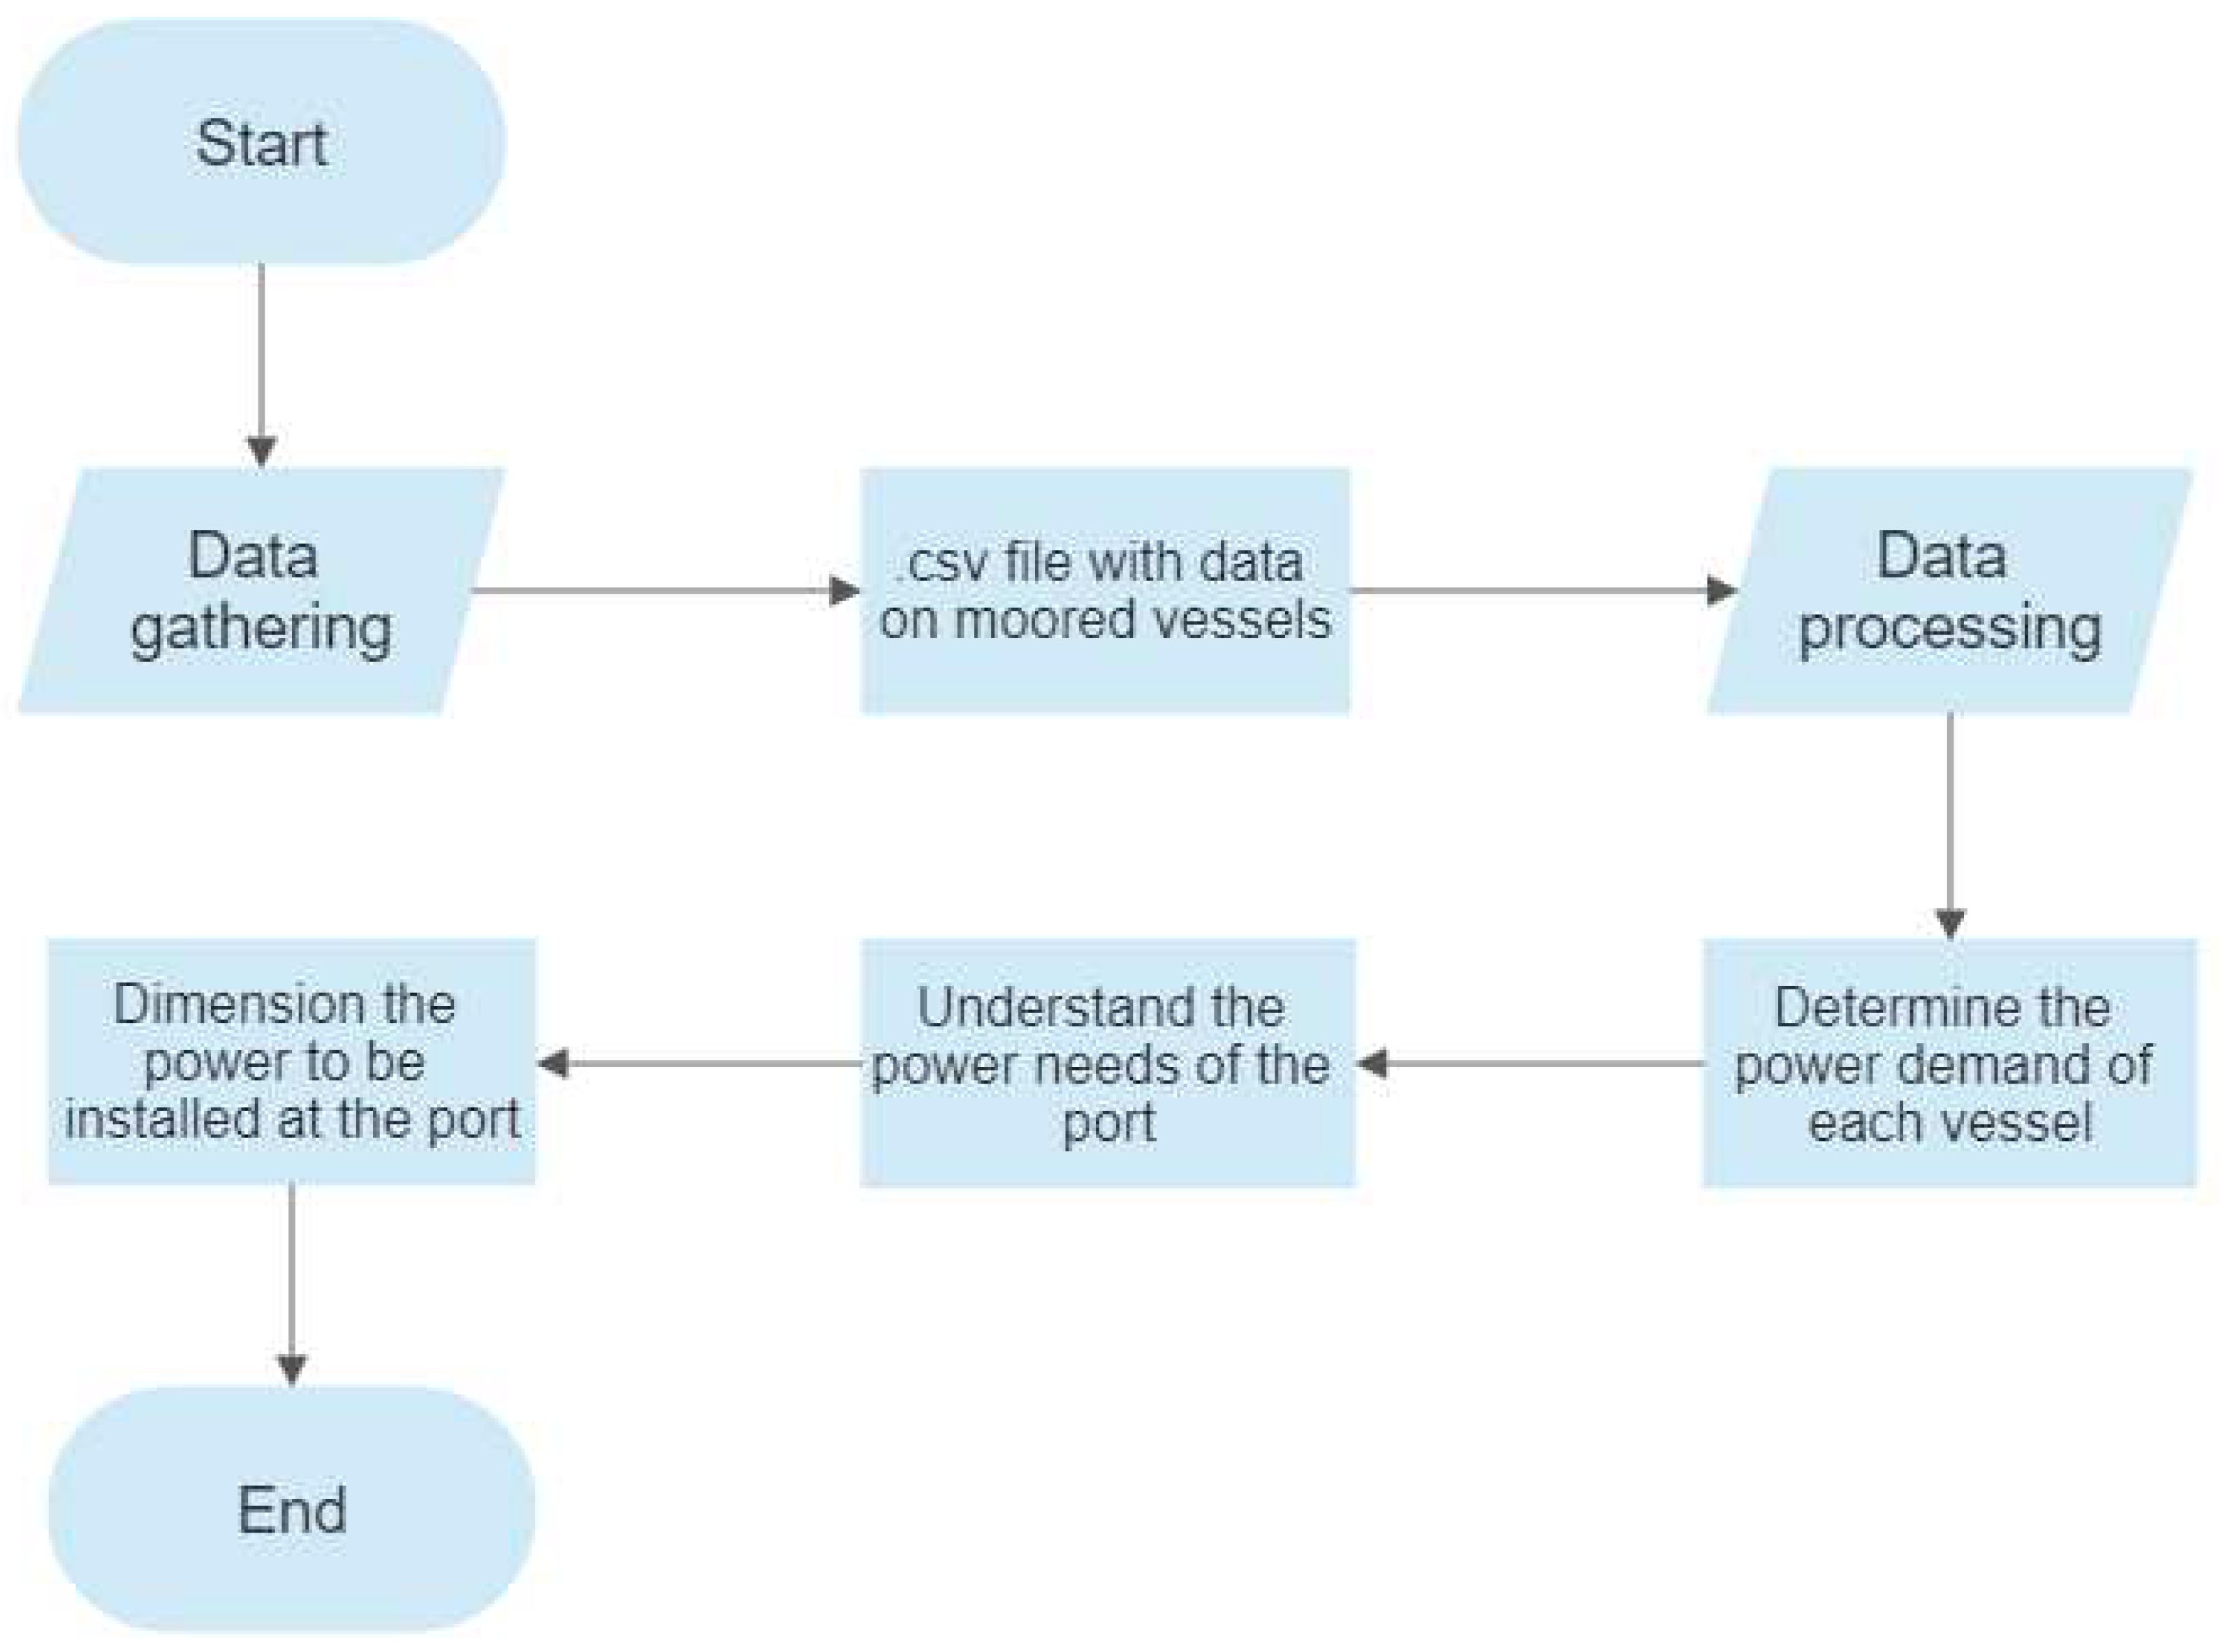
Figure 2.
Port load diagram in 2022.
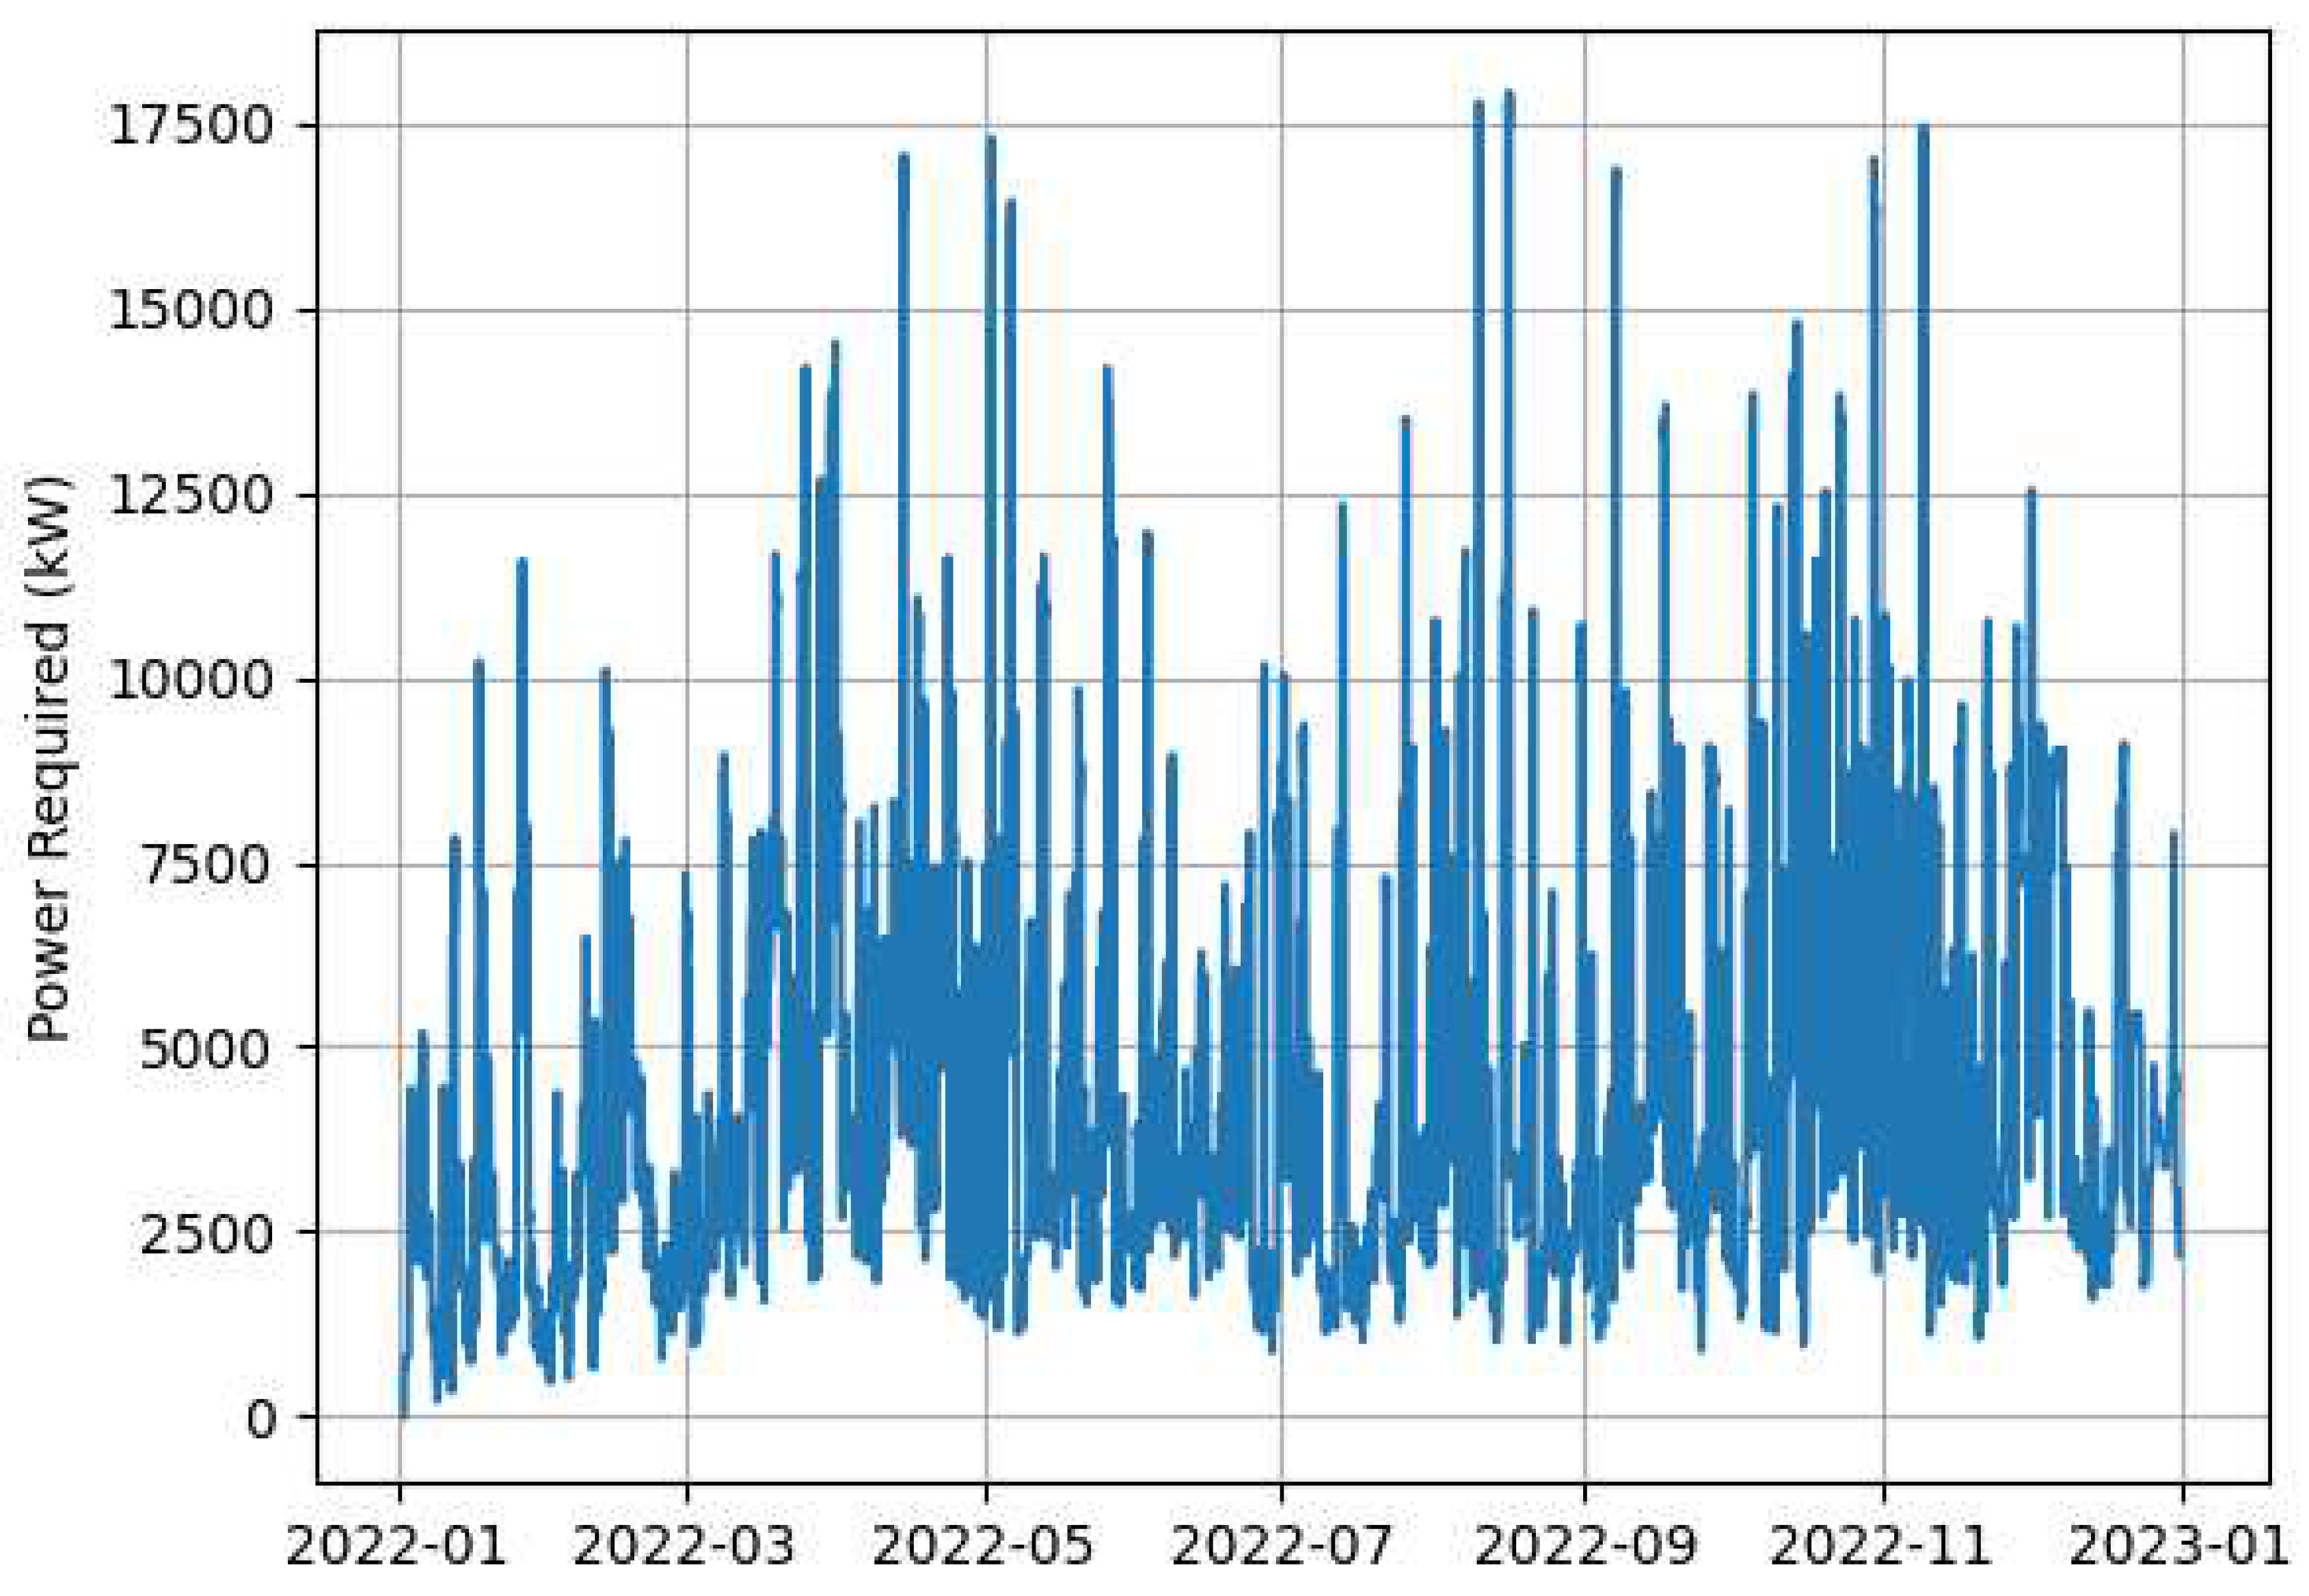
Figure 3.
Number of OPS-eligible vessels moored at the Port of Lisbon in 2022.
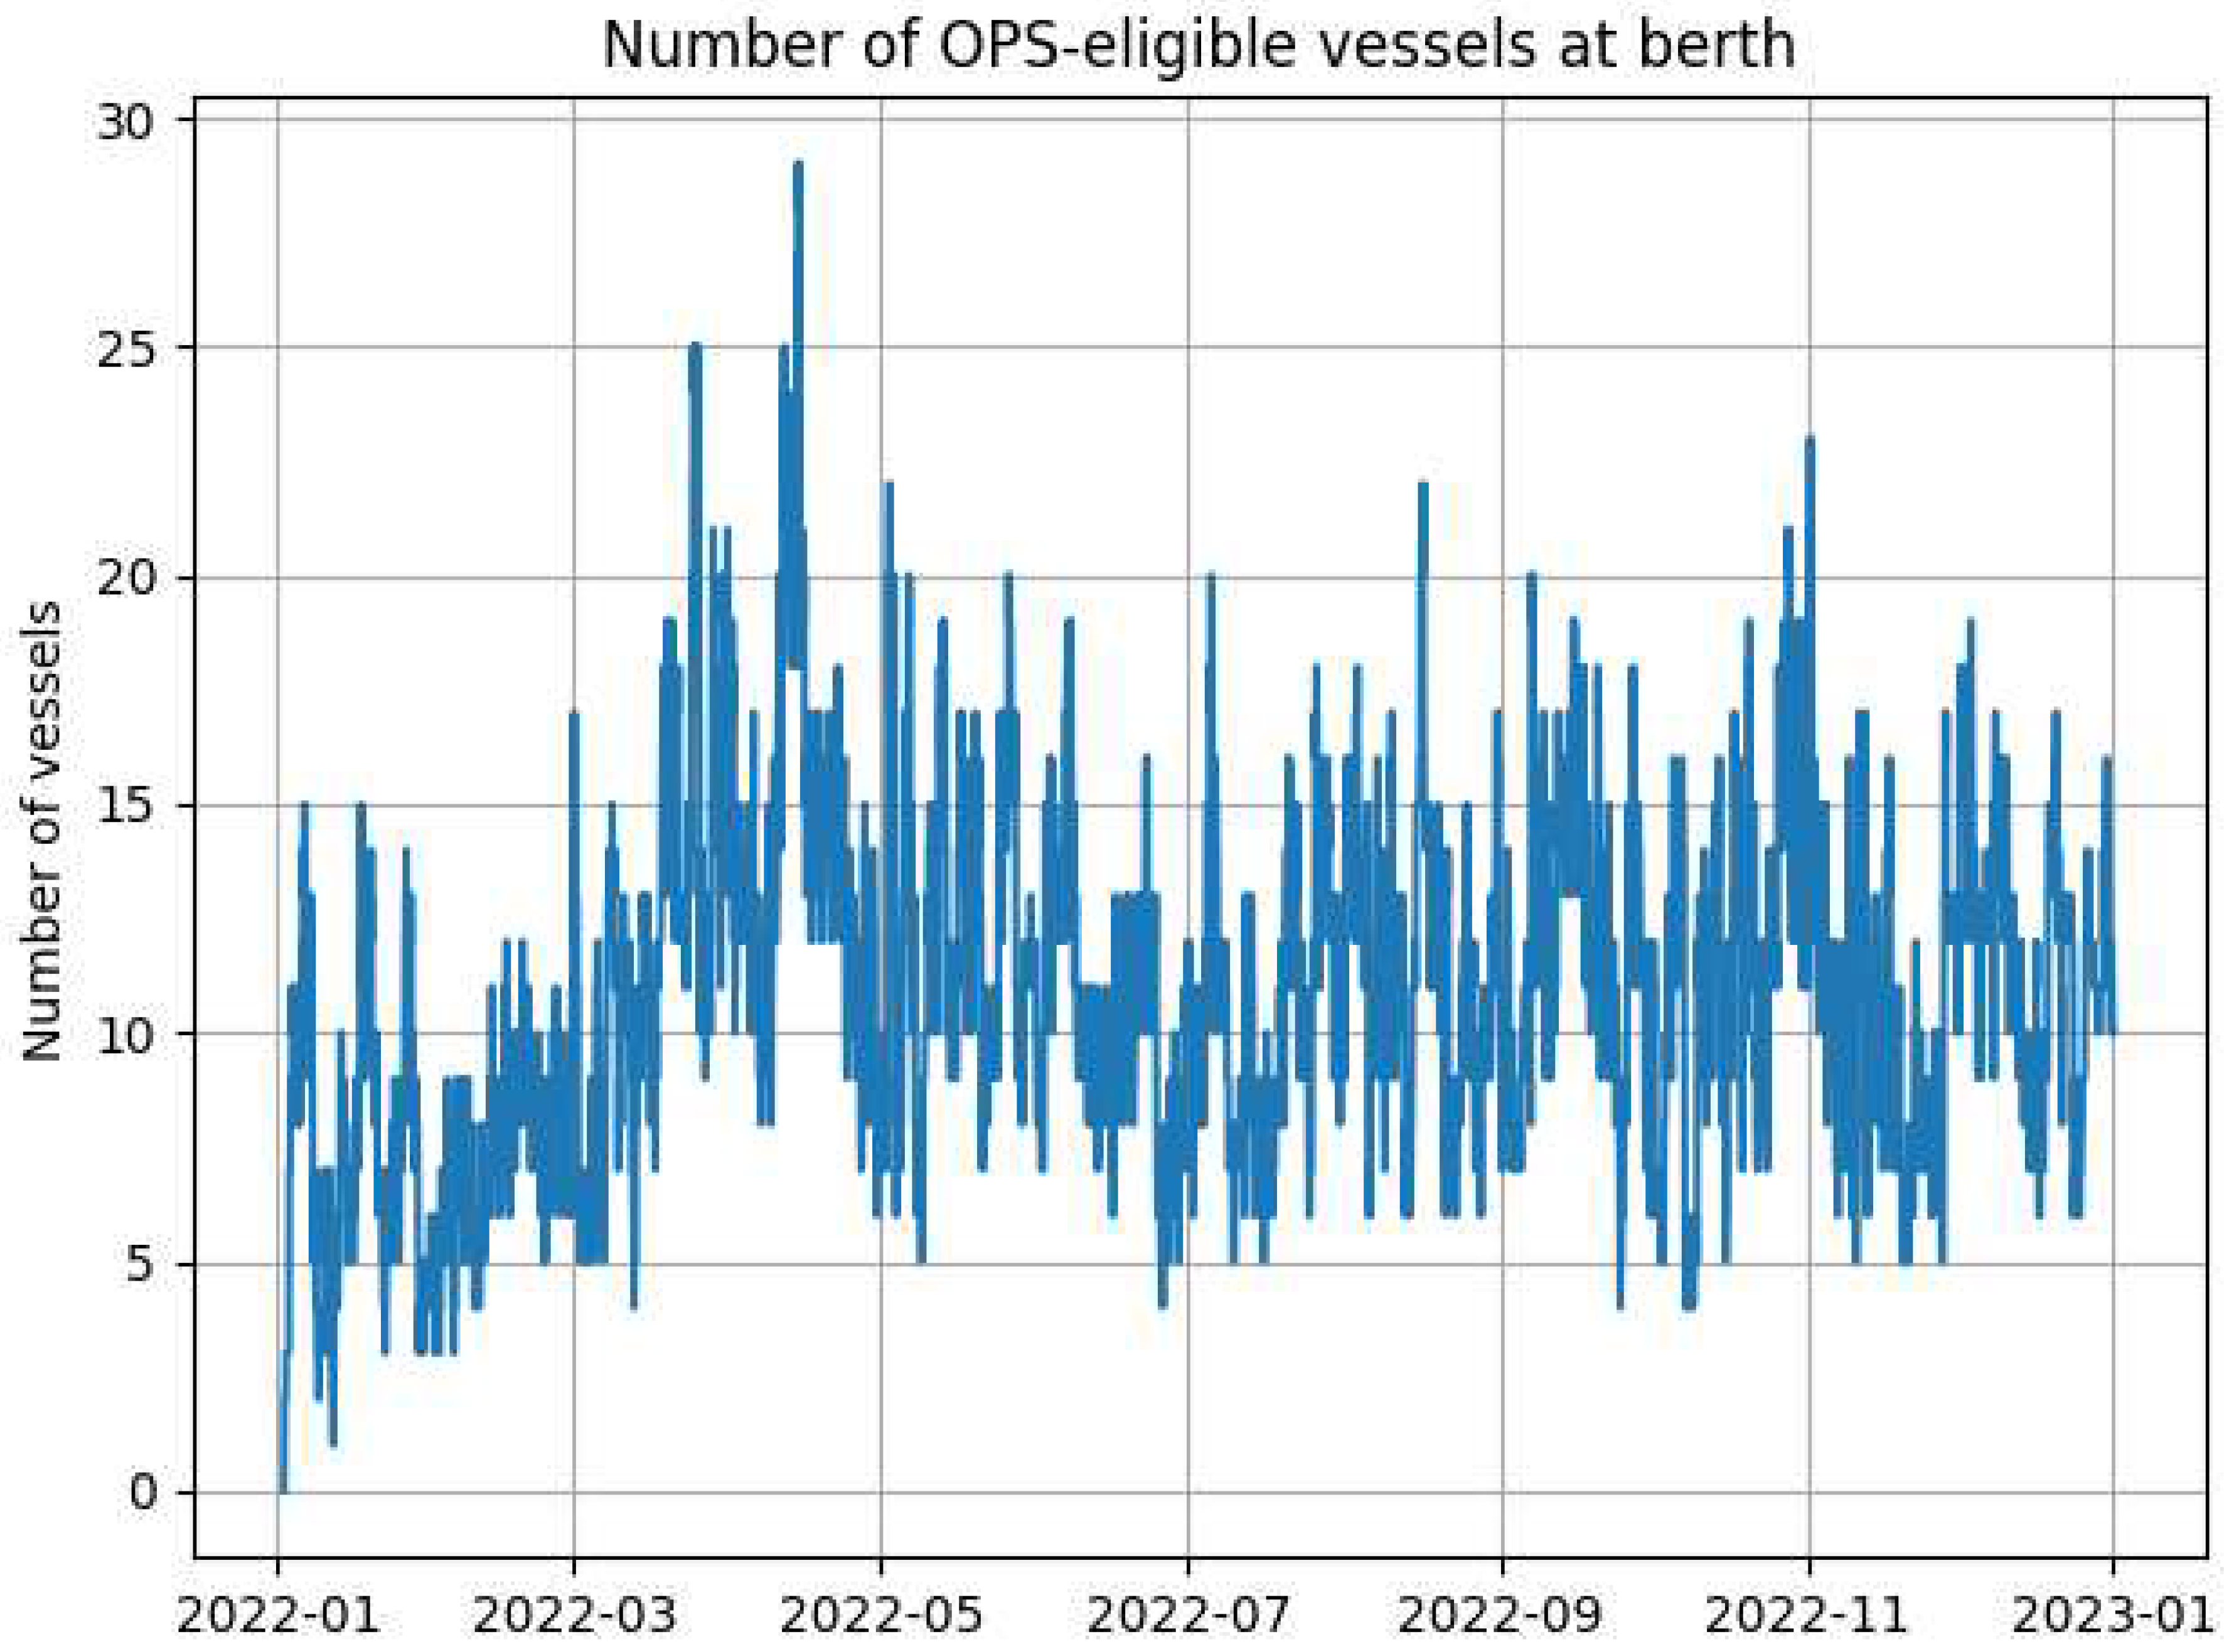
Figure 4.
Port load diagram in August 2022.
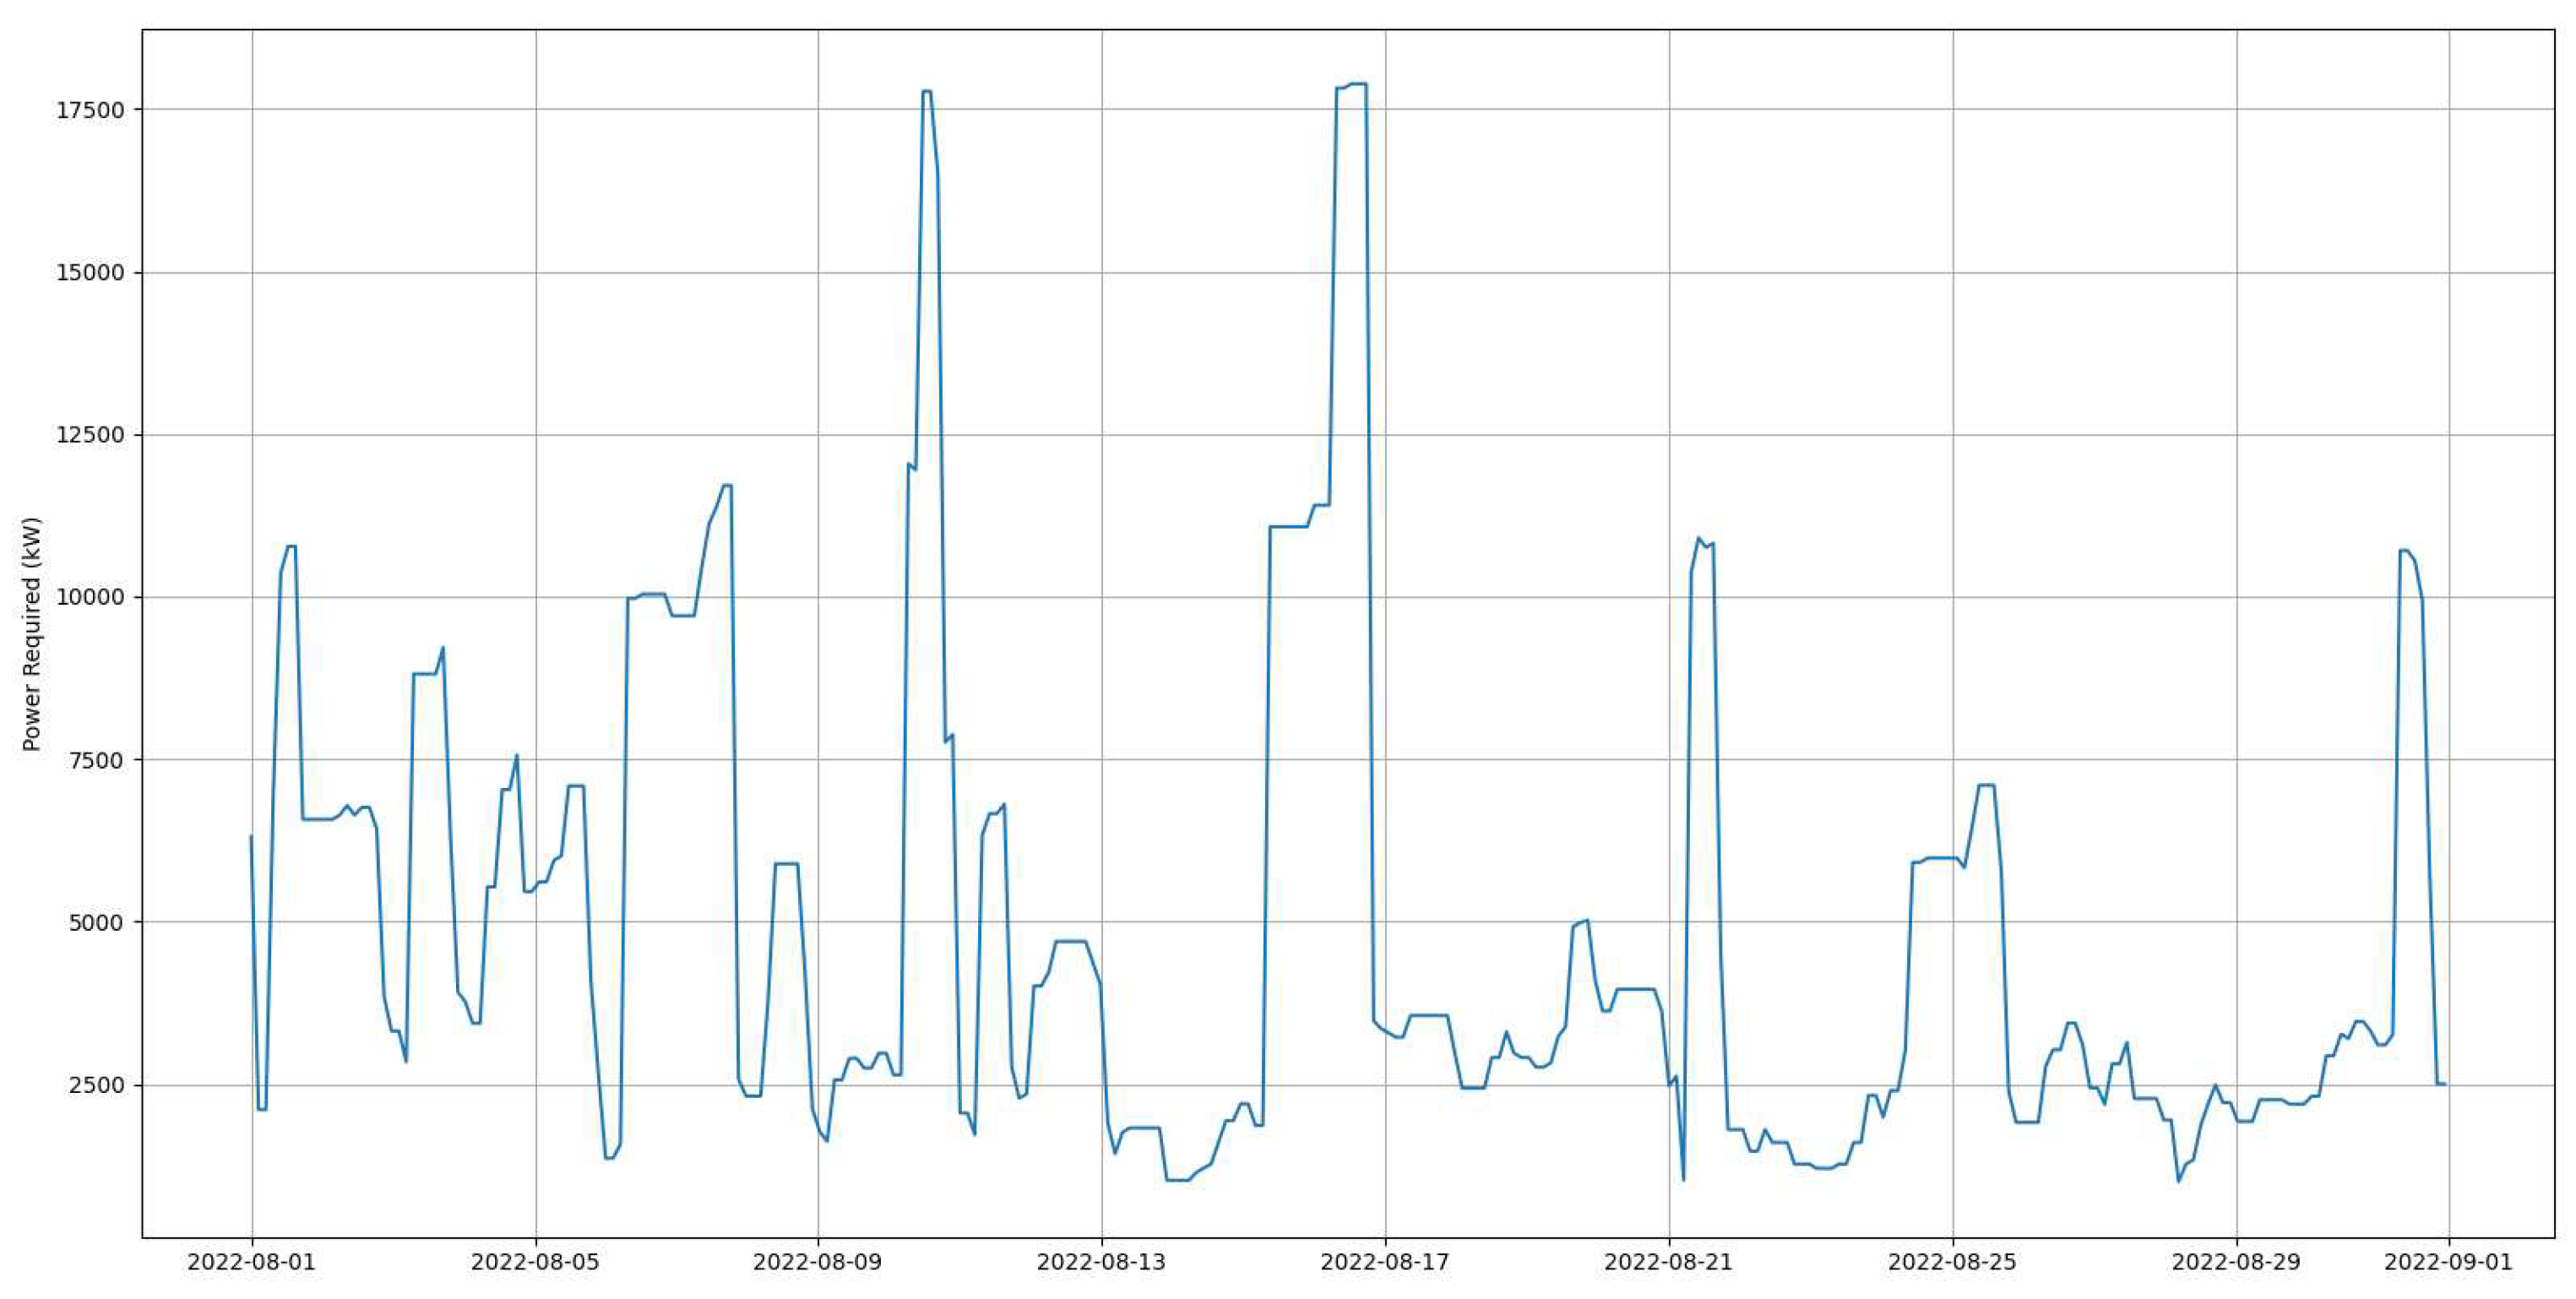
Figure 5.
Energy cost under market prices for the port of Lisbon in 2022.
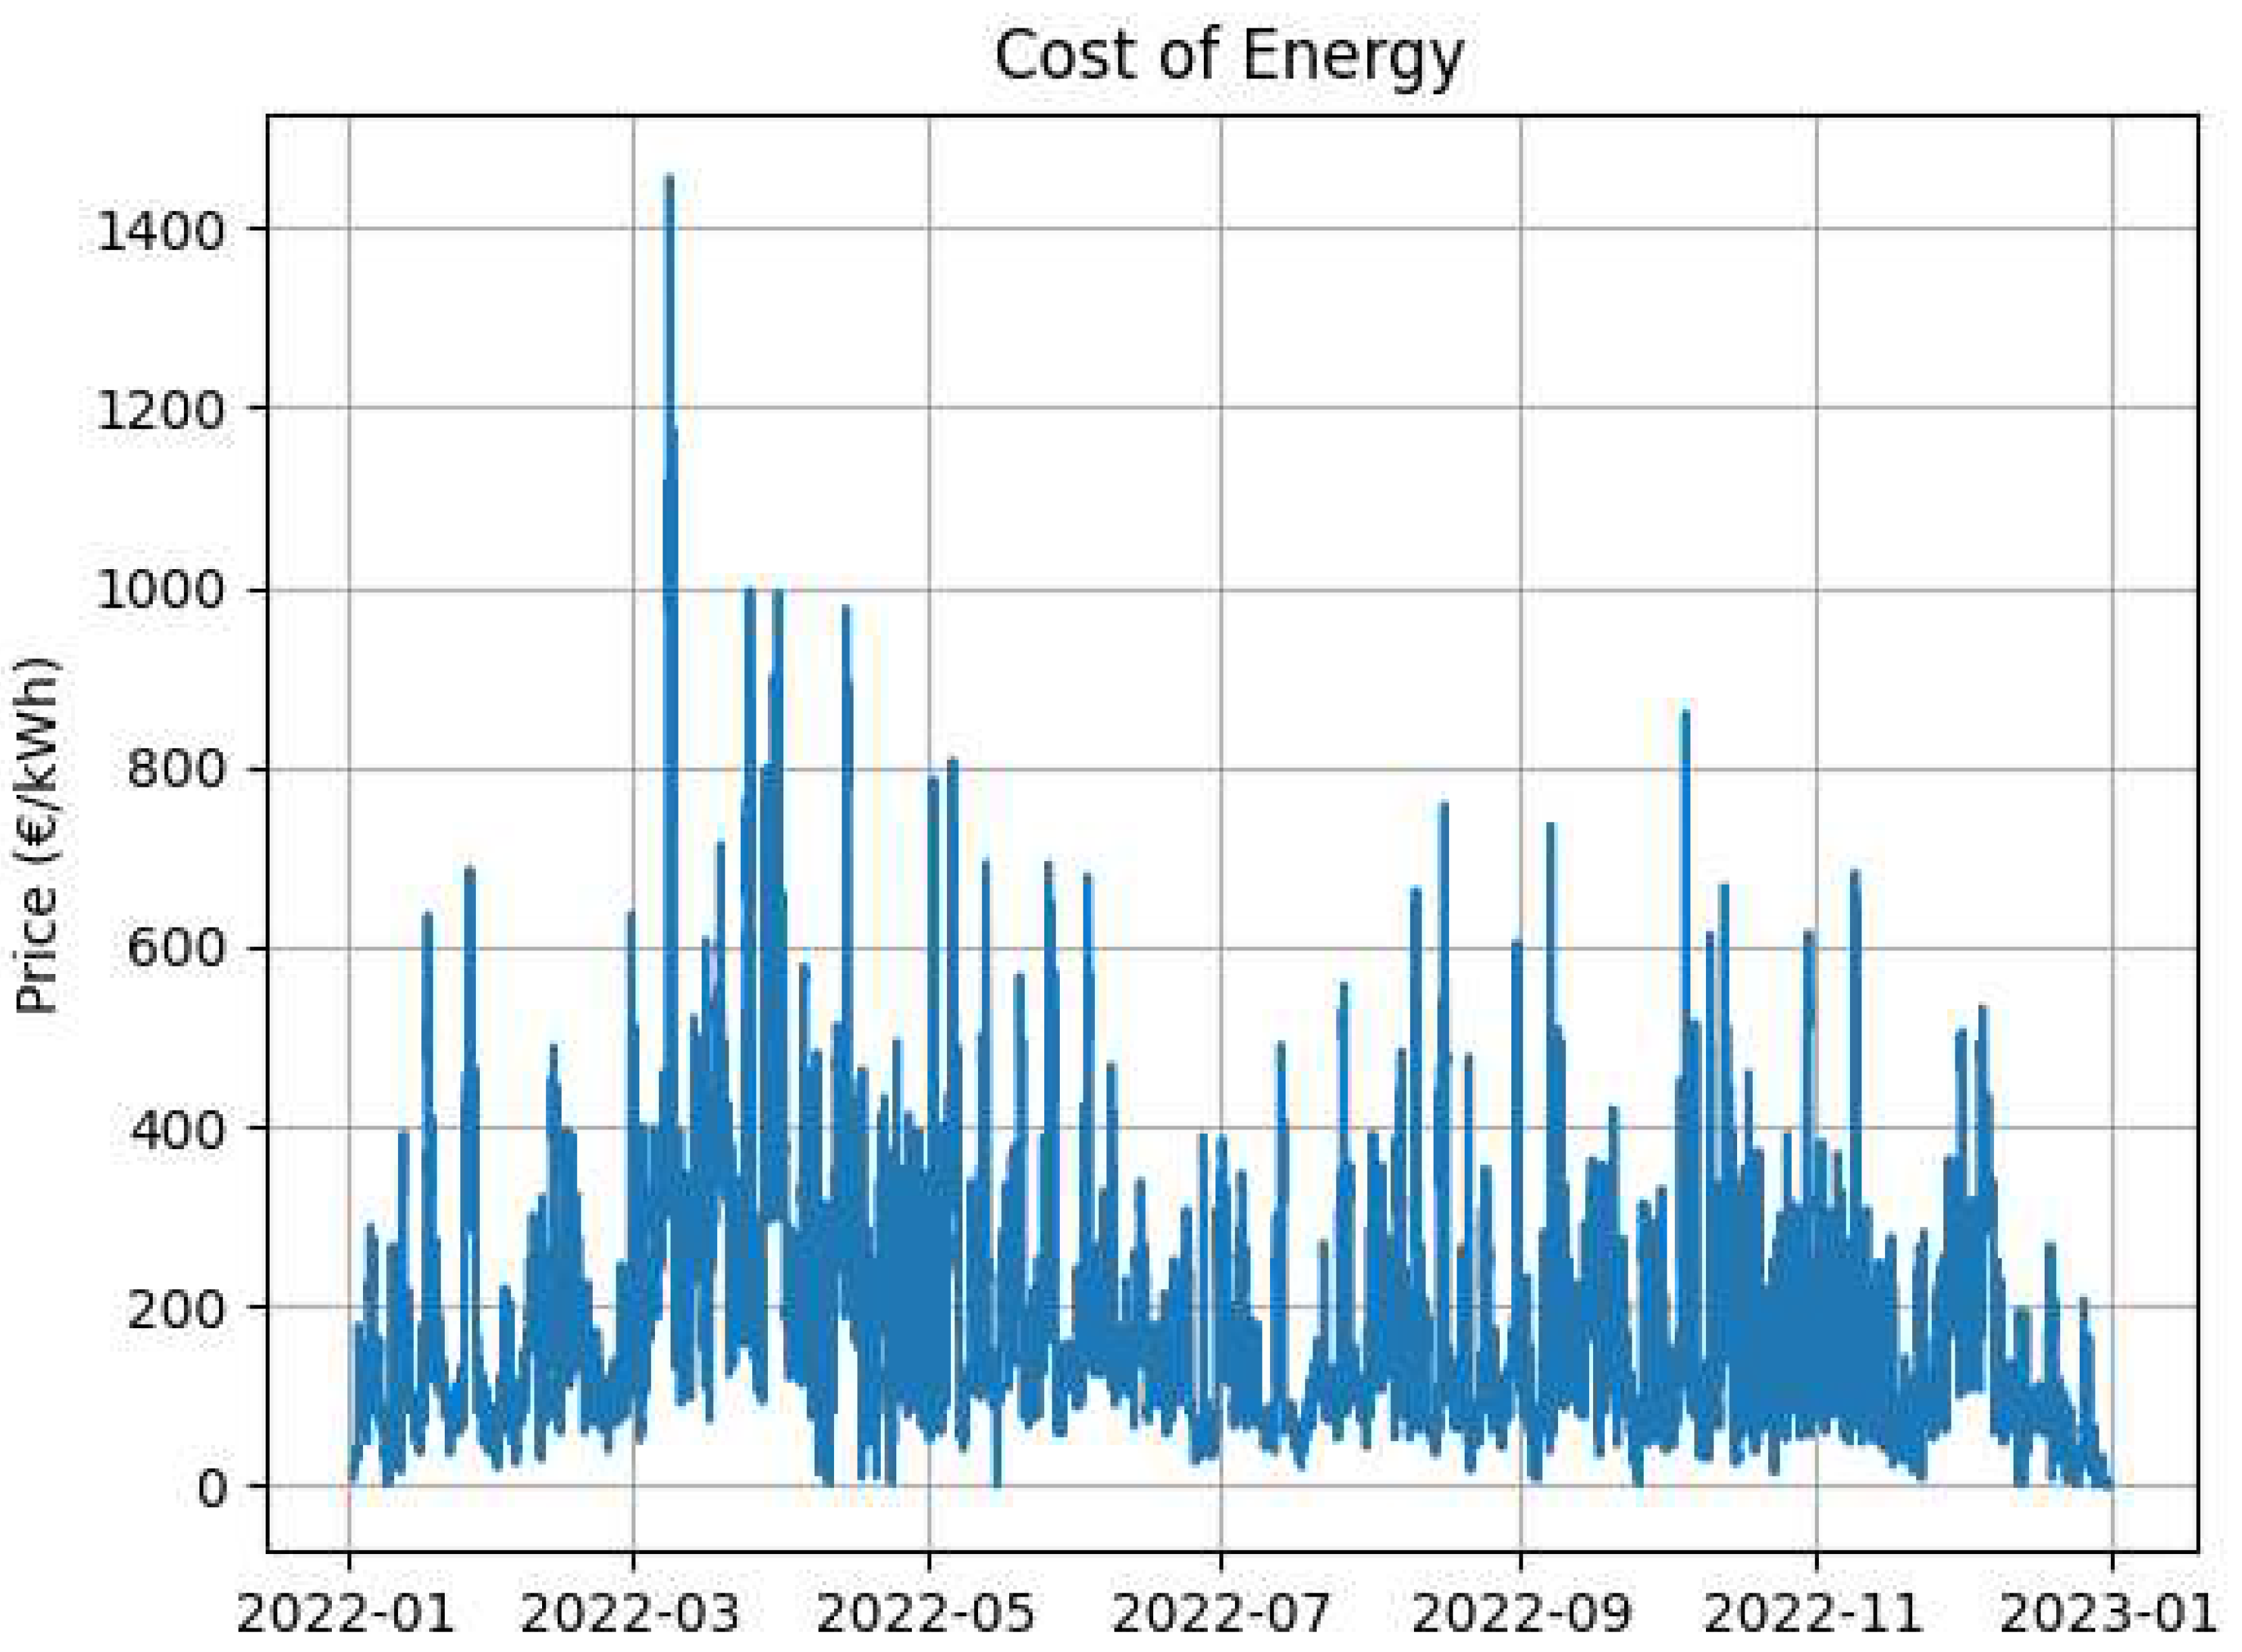
Figure 6.
Contribution of each terminal to total energy supplied by terminal category.
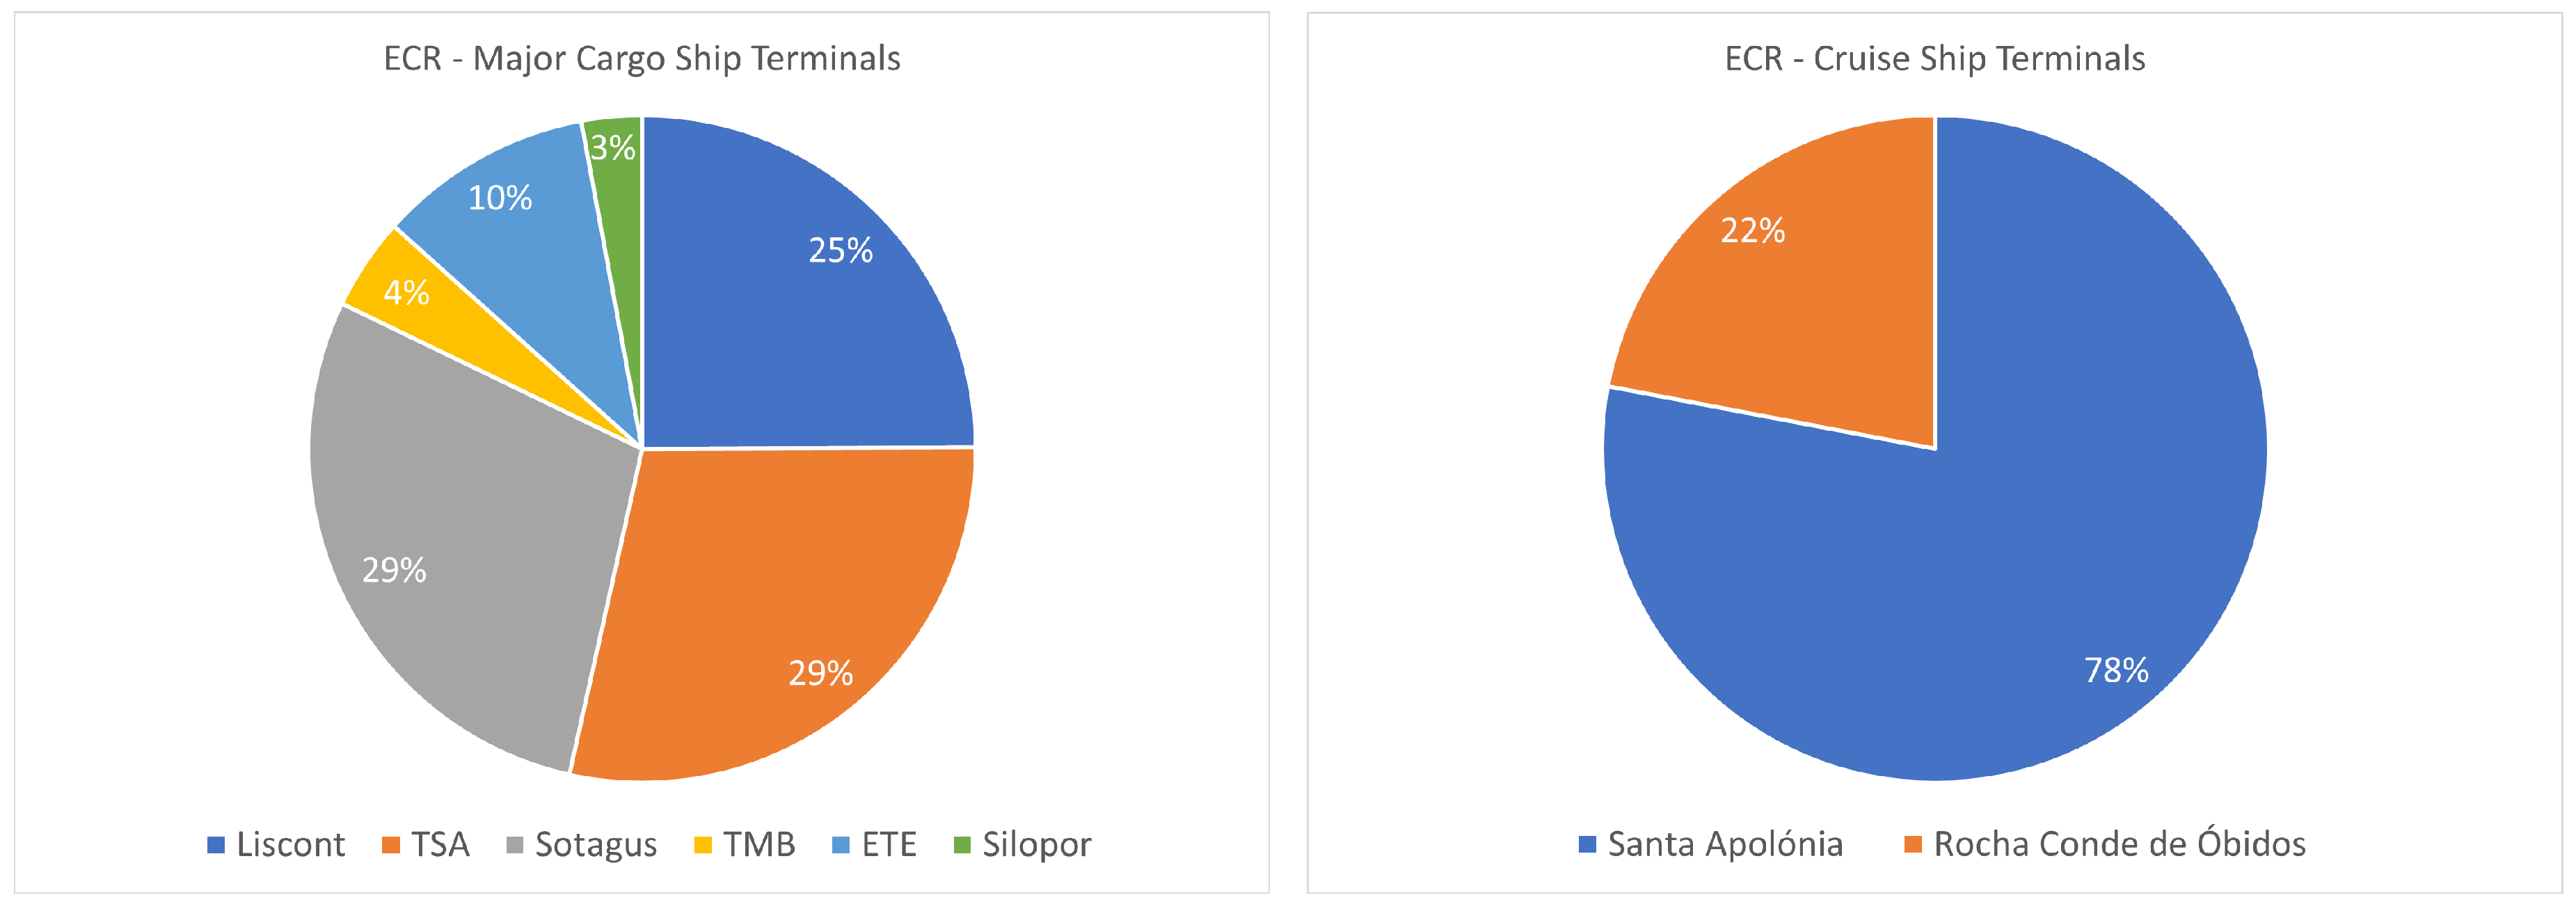
Figure 7.
Energy provided by terminal type in 2022.
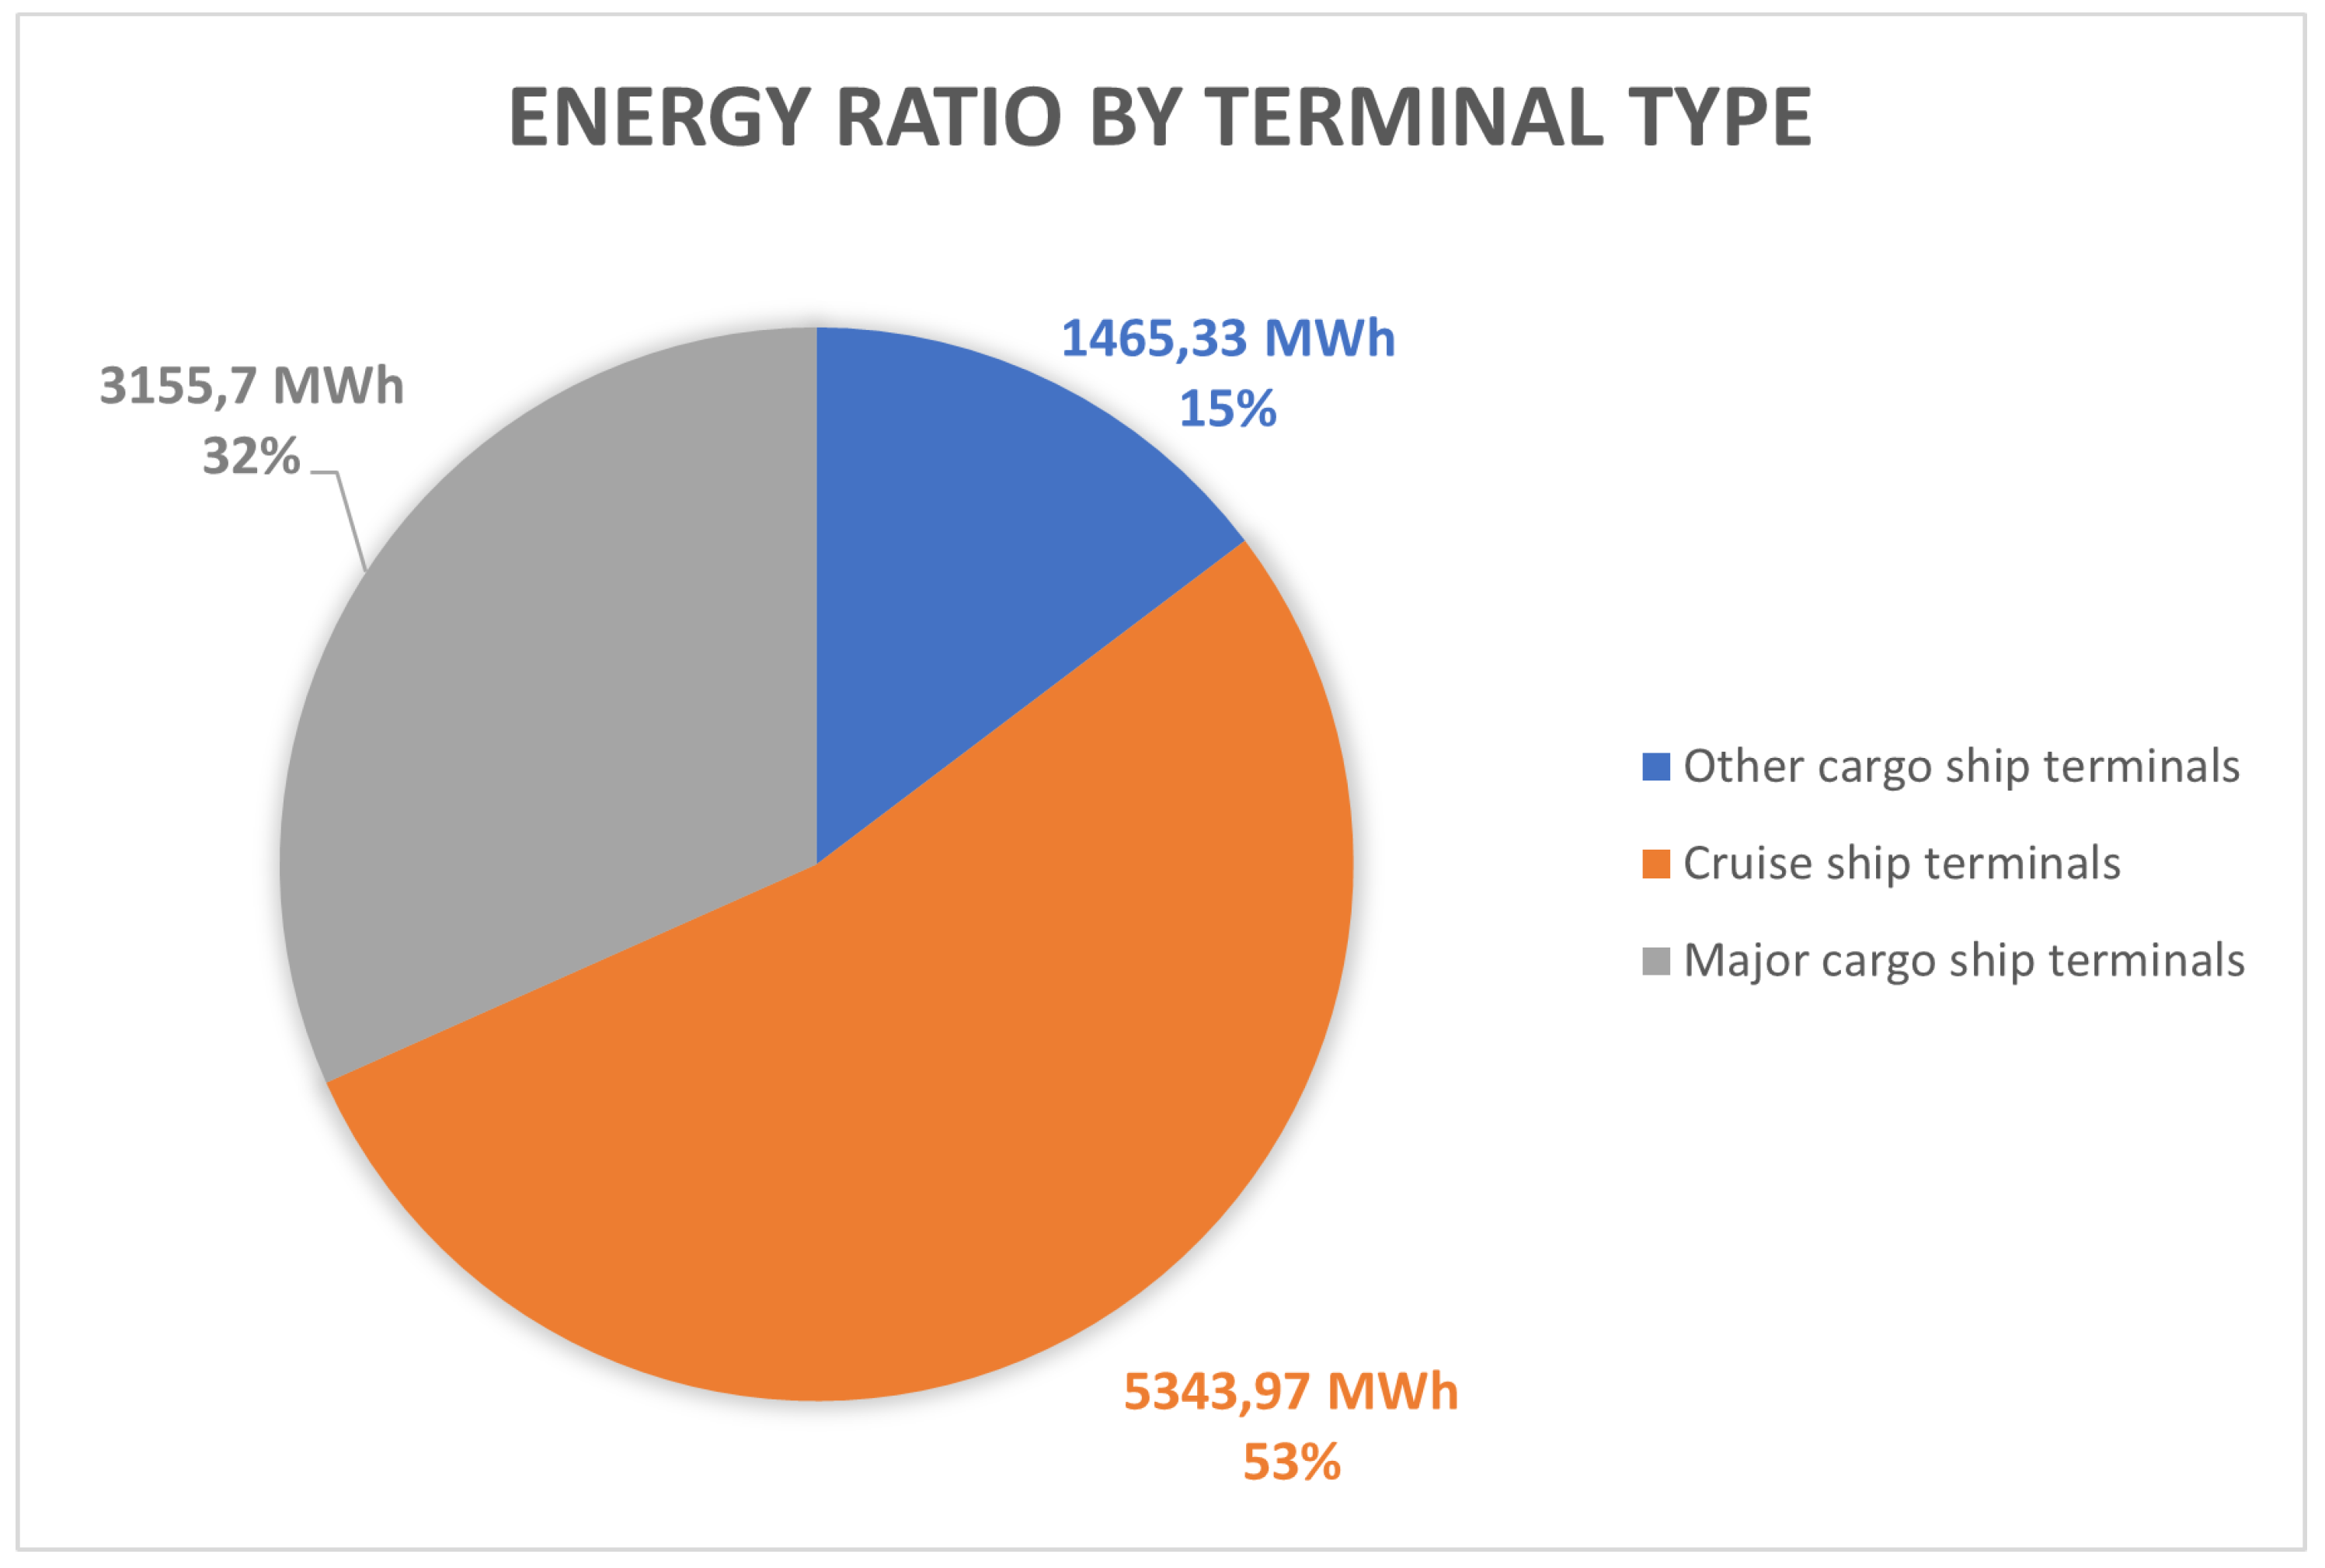
Figure 8.
OPS cost for the ETE terminal as a function of installed power.
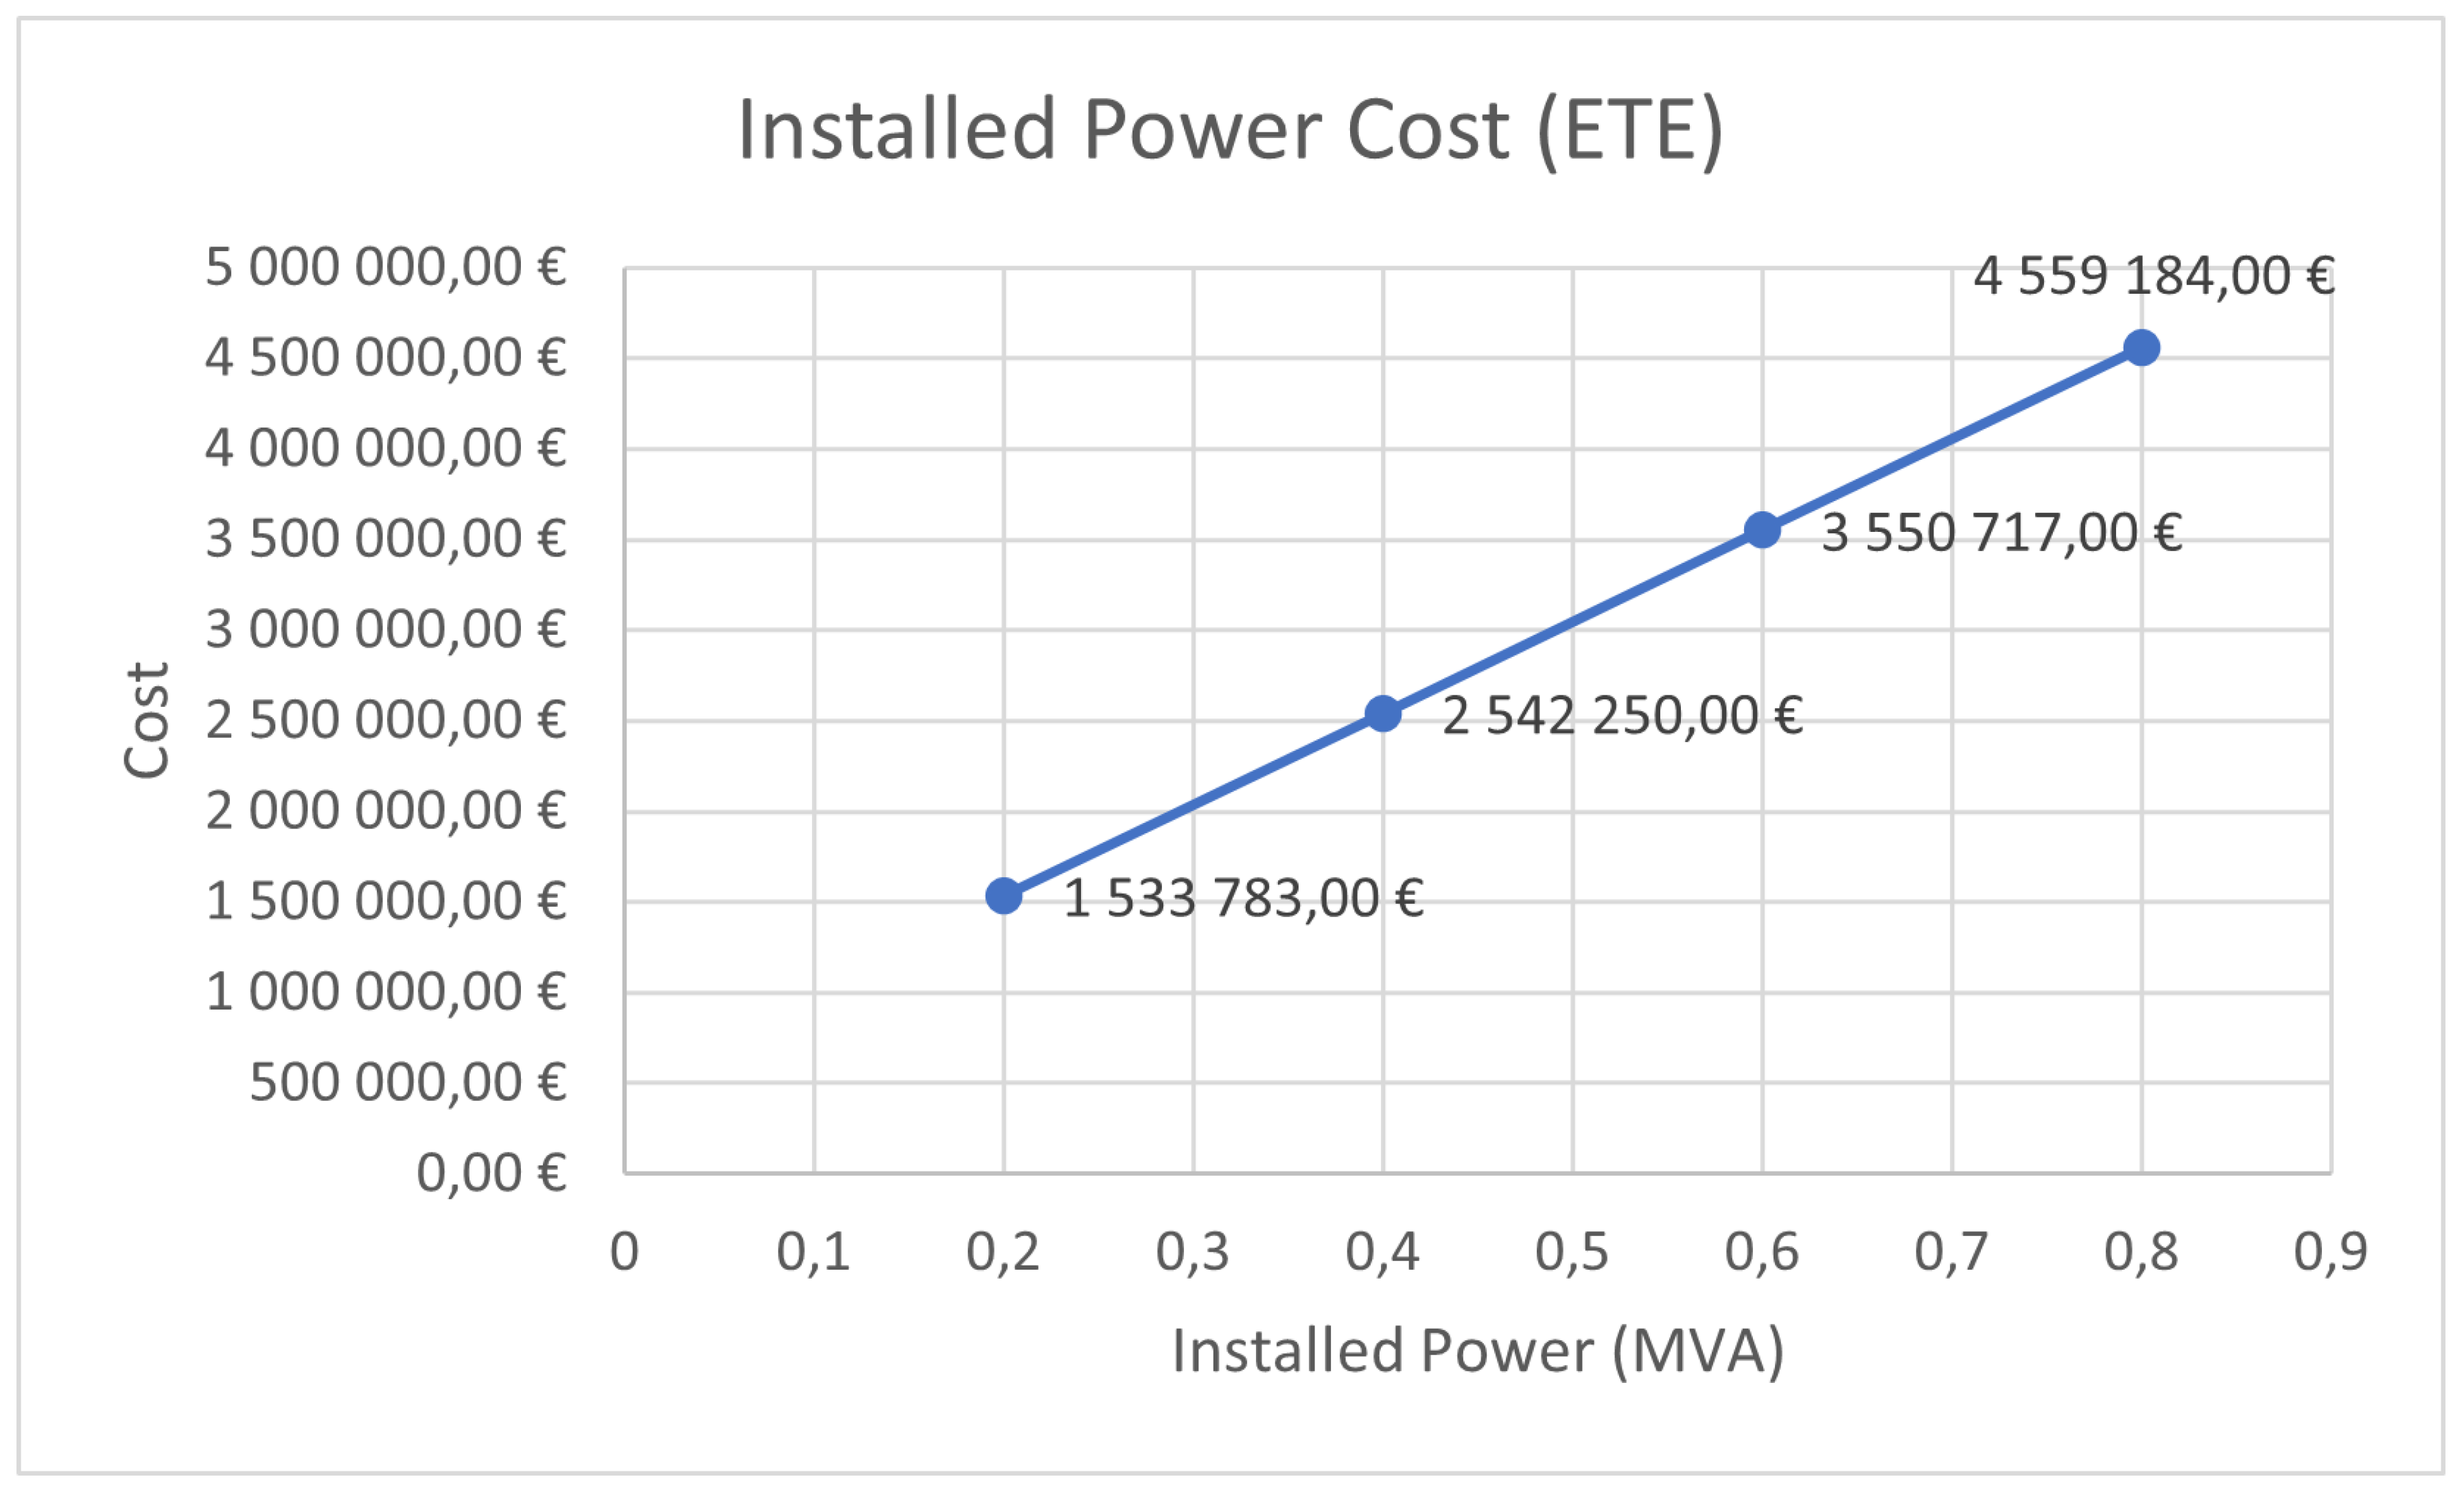
Figure 9.
OPS payback period for the port of Lisbon.
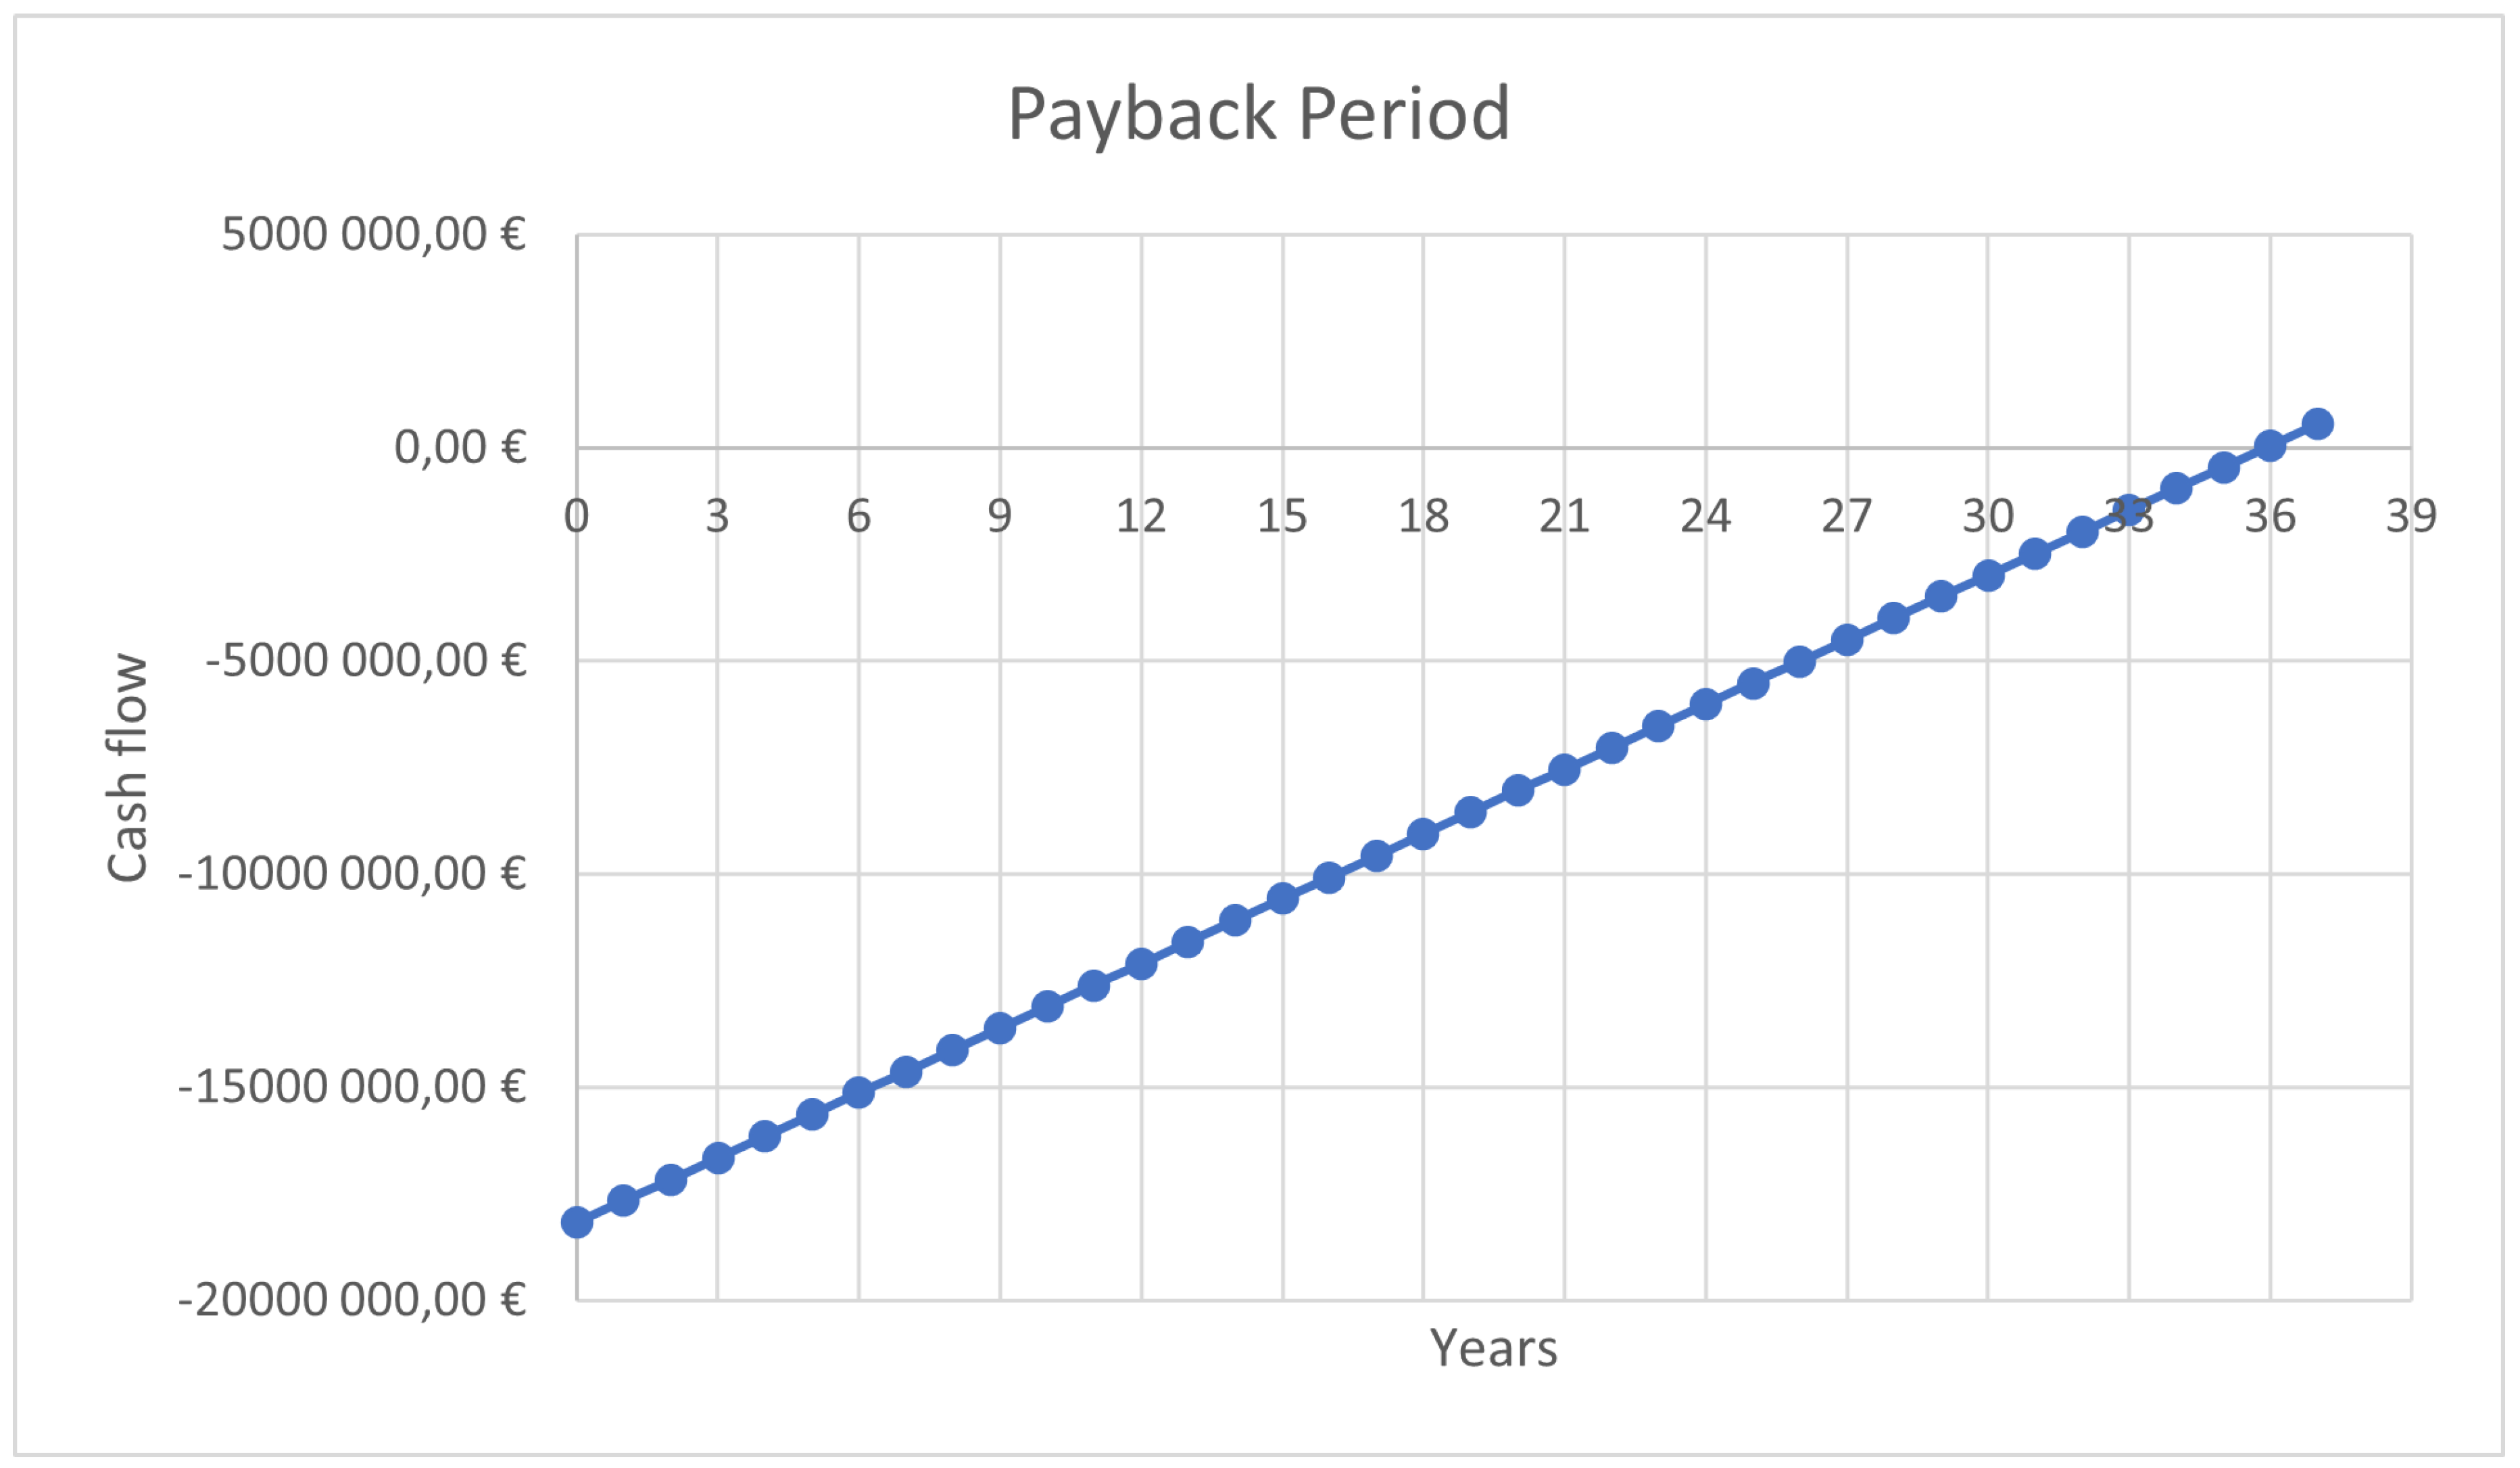
Figure 10.
OPS payback period for the port of Lisbon with external financing of 44%.
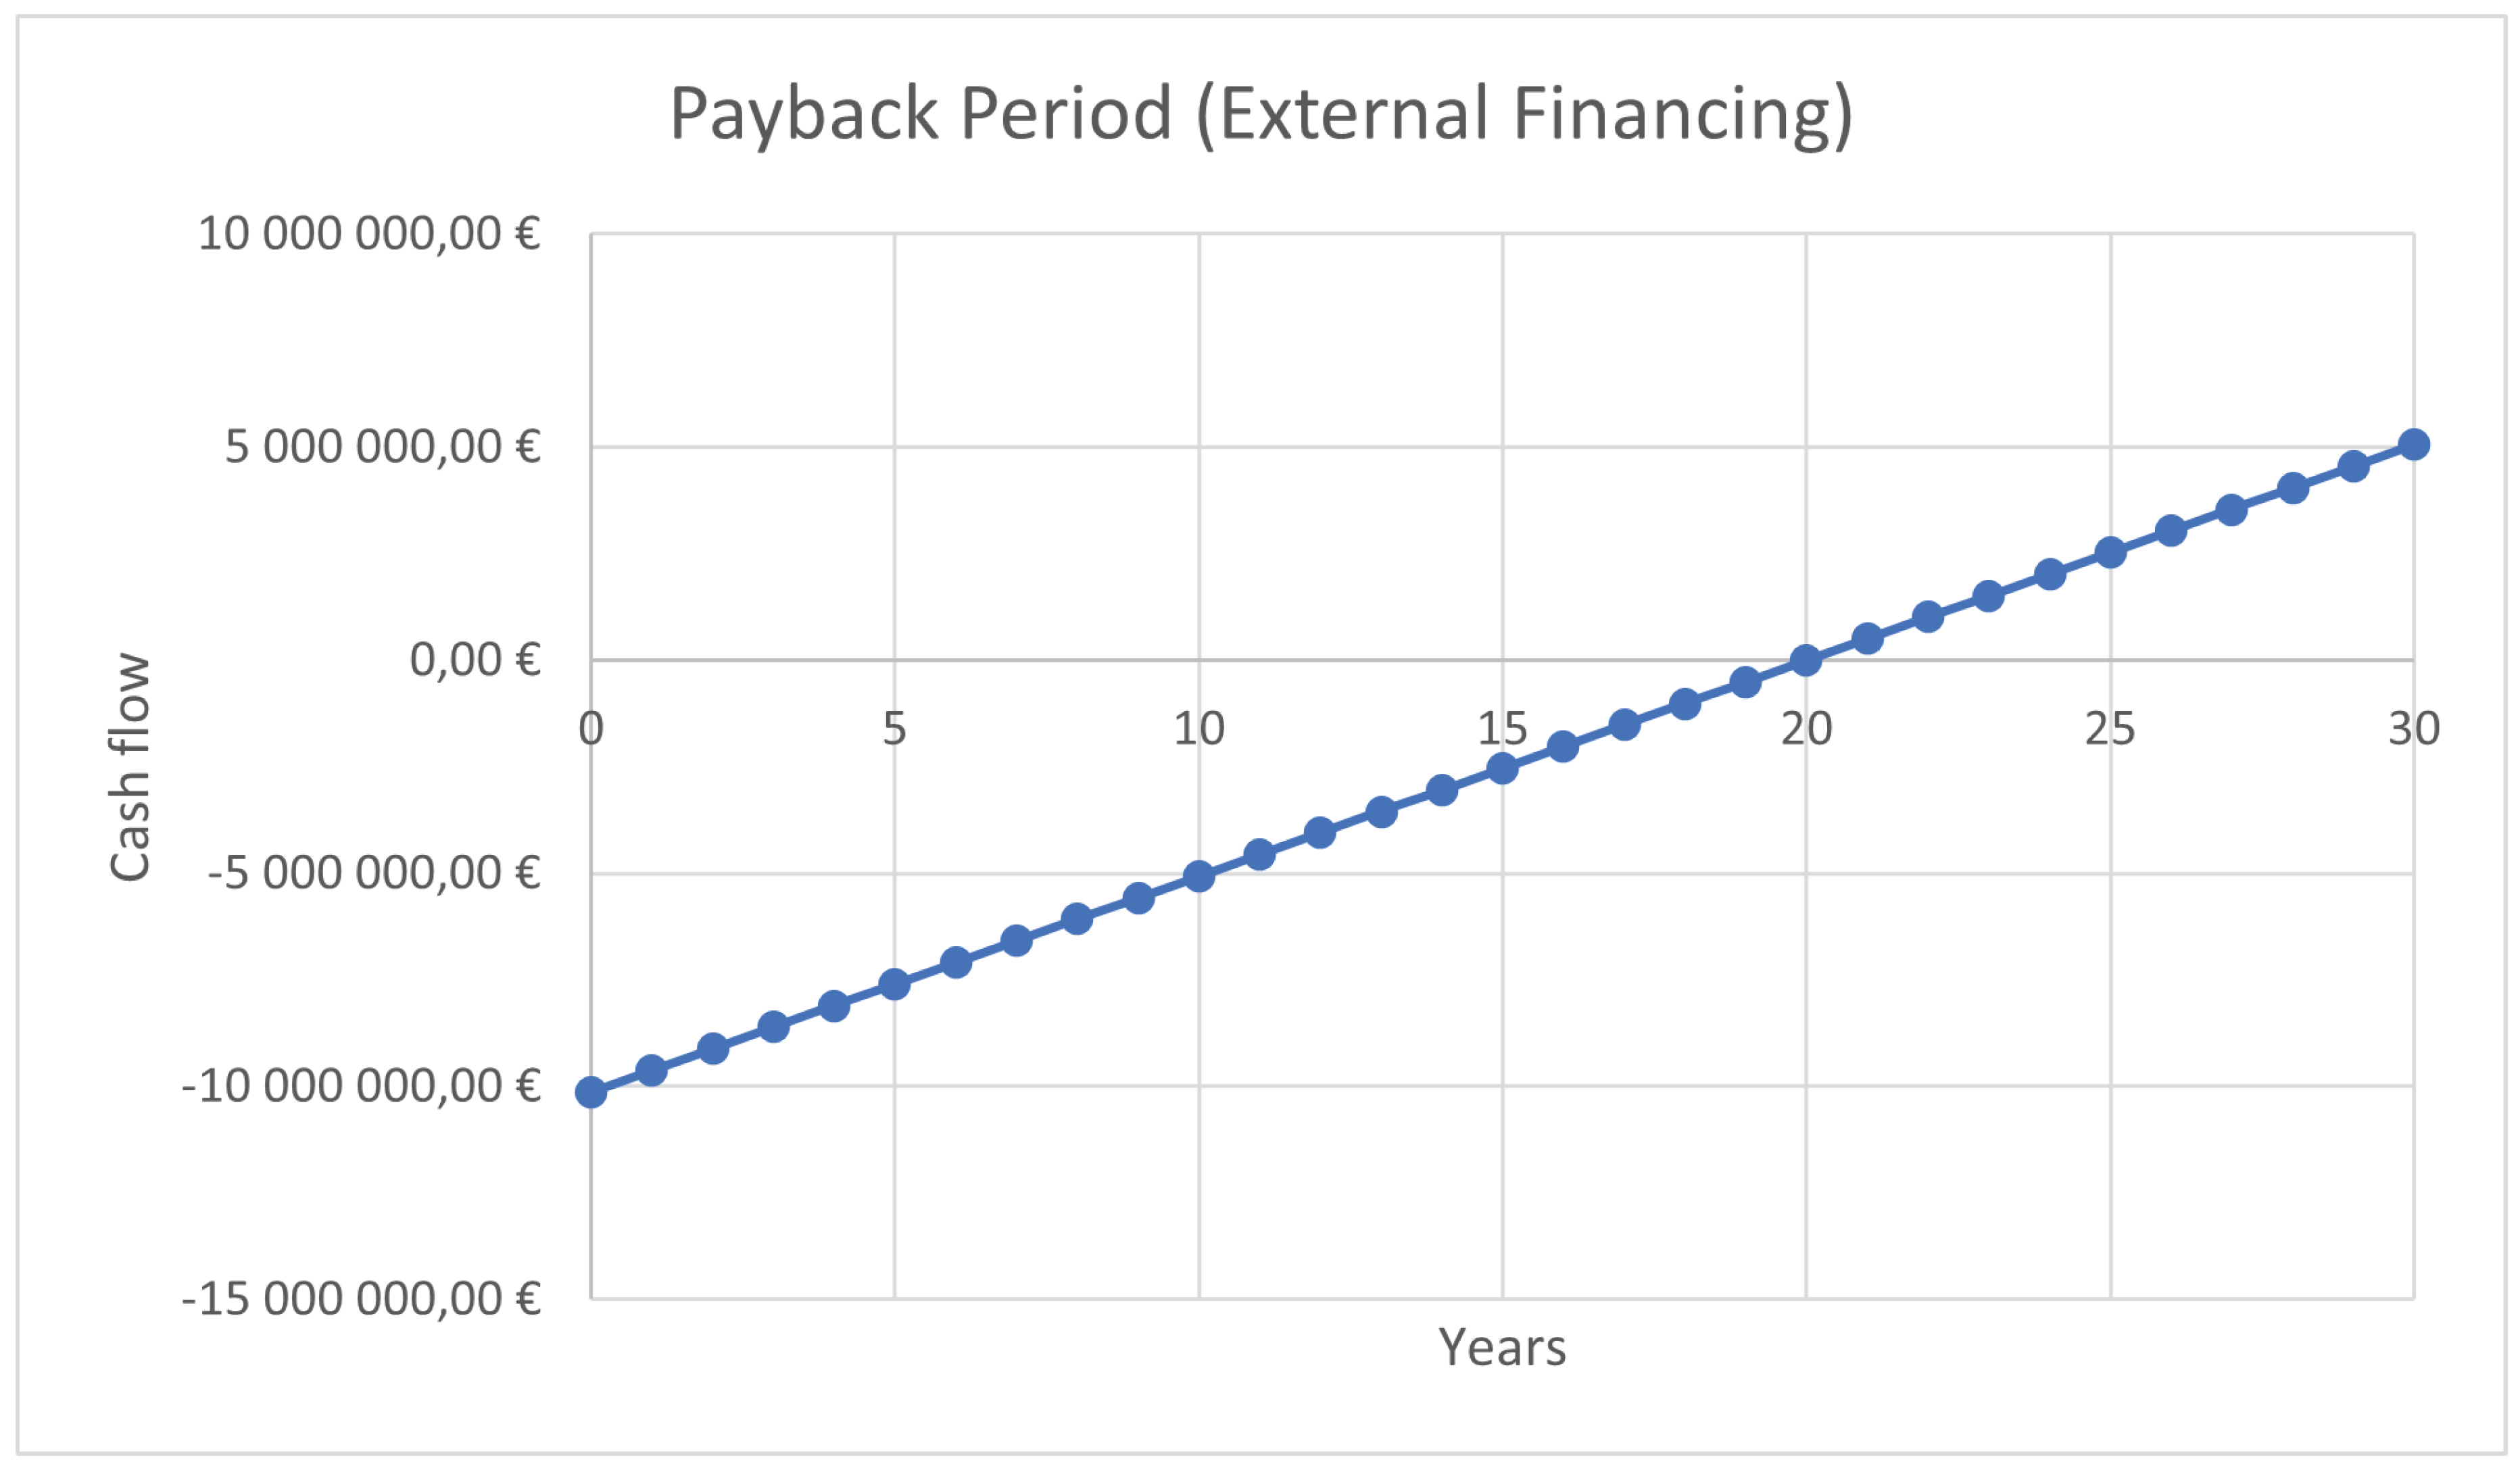
Table 1.
Estimated power requirement per moored vessel [kW] Adapted from [5].
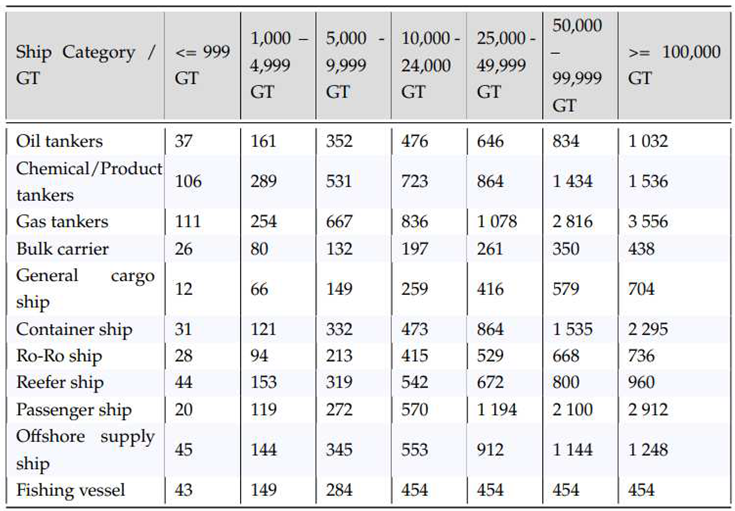 |
Table 2.
Example of the data contained in the .csv file
| ATA | ATD | Tipo Navio | GT |
| 06/01/2022 07:01 | 07/01/2022 07:06 | Porta-Contentores | 11662 |
| 18/03/2022 05:35 | 19/03/2022 00:11 | Porta-Contentores | 10318 |
| 14/03/2022 15:27 | 17/03/2022 00:32 | Porta-Contentores | 17368 |
| 12/07/2022 01:27 | 12/07/2022 19:51 | Carga Geral | 4255 |
| 04/03/2022 06:32 | 05/03/2022 19:12 | Porta-Contentores | 9991 |
Table 3.
Electrical characterisation of major cargo ship terminals in 2022.
| Terminal | Peak Power (kW) |
Average Power (kW) |
Total Energy (MWh) |
Maximum Moored Vessels |
| Liscont | 2399 | 360.42 | 786.35 | 3 |
| TSA | 1145 | 413.52 | 902.26 | 4 |
| Sotagus | 1799 | 414.53 | 904.45 | 5 |
| TMB | 408 | 64.58 | 140.89 | 3 |
| ETE | 680 | 150.93 | 329.3 | 4 |
| Silopor | 395 | 42.39 | 92.45 | 3 |
Table 4.
Electrical characterisation of cruise ship terminals in 2022.
| Terminal | Peak Power (kW) |
Average Power (kW) |
Total Energy (MWh) |
Maximum Moored Vessels |
| Santa Apolónia |
14560 | 1910.63 | 4168.76 | 8 |
| Rocha Conde de Óbidos |
4899 | 538.66 | 1175.21 | 9 |
Table 5.
Null consumption rate per terminal.
| Terminal | NCR | Type |
| Liscont | 58.79% | Cargo ships |
| TSA | 38.74% | |
| Sotagus | 41.76% | |
| TMB | 54.12% | |
| ETE | 21.70% | |
| Silopor | 80.22% | |
| Santa Apolónia | 62.64% | Cruise ships |
| Rocha Conde de Óbidos | 23.35% |
Table 6.
Quantification of electrical substations per terminal [17].
| Terminal | Scenario 1 | Scenario 2 | Scenario 3 |
| SACT | 1 MV SS. | 2 MV SS. | 3 MV SS. |
| TSA | 1 LV SS. | 2 LV SS. | 3 LV SS. |
| Sotagus | 1 LV SS. | 2 LV SS. | 3 LV SS. |
| TMB | 1 LV SS. | 2 LV SS. | 2 LV SS. |
| Silopor | 1 LV SS. | 1 LV SS. | 1 LV SS. |
| ETE | 1 LV SS. | 2 LV SS. | 2 LV SS. |
Table 7.
Peak power per terminal [17].
| Terminal | Scenario 1 | Scenario 2 | Scenario 3 |
| SACT | 16 MVA | 32 MVA | 43 MVA |
| TSA | 1 MVA | 1.4 MVA | 1.8 MVA |
| Sotagus | 1 MVA | 2 MVA | 3 MVA |
| TMB | 1 MVA | 2 MVA | N/A |
| Silopor | 1 MVA | N/A | N/A |
| ETE | 0.2 MVA | 0.4 MVA | N/A |
Table 8.
Estimated costs per terminal [17].
| Terminal | Scenario 1 | Scenario 2 | Scenario 3 |
| SACT | 5,481,144 € | 9,511,060 € | 13,612,397 € |
| TSA | 1,520,922 € | 2,537,721 € | 3,573,637 € |
| Sotagus | 1,524,138 € | 2,540,835 € | 3,583,921 € |
| TMB | 1,532,176 € | 2,542,532 € | N/A |
| Silopor | 1,522,209 € | N/A | N/A |
| ETE | 1,533,783 € | 2,542,250 € | N/A |
| Total | 13,114,372 € | 19,674,398 € | 20,769,955 € |
Table 10.
OPS installation cost per terminal.
| Terminal | Cost |
| SACT | 5,481,144 € |
| TSA | 2,537,721 € |
| Sotagus | 2,540,835 € |
| TMB | 1,532,176 € |
| Silopor | 1,522,209 € |
| ETE | 4,559,184 € |
| Total | 18,173,269 € |
Table 11.
Annual savings considered for the payback period.
| Terminal | Annual Savings |
| SACT | 328,021 € |
| TSA | 65,183 € |
| Sotagus | 68,611 € |
| TMB | 12,887 € |
| Silopor | 7,401 € |
| ETE | 24,207 € |
| Total | 506,310 € |
Table 12.
OPS installation cost per terminal with external financing of 44%.
| Terminal | Cost |
| SACT | 3,054,109.88 € |
| TSA | 1,414,025.75 € |
| Sotagus | 1,415,760.88 € |
| TMB | 853,733.06 € |
| Silopor | 848,179.42 € |
| ETE | 2,540,391.00 € |
| Total | 10,126,200 € |
Disclaimer/Publisher’s Note: The statements, opinions and data contained in all publications are solely those of the individual author(s) and contributor(s) and not of MDPI and/or the editor(s). MDPI and/or the editor(s) disclaim responsibility for any injury to people or property resulting from any ideas, methods, instructions or products referred to in the content. |
© 2023 by the authors. Licensee MDPI, Basel, Switzerland. This article is an open access article distributed under the terms and conditions of the Creative Commons Attribution (CC BY) license (http://creativecommons.org/licenses/by/4.0/).
Copyright: This open access article is published under a Creative Commons CC BY 4.0 license, which permit the free download, distribution, and reuse, provided that the author and preprint are cited in any reuse.


