Submitted:
24 September 2023
Posted:
26 September 2023
You are already at the latest version
Abstract
Recently, e-commerce companies have been adopting and continuously enhancing personalized product recommendation systems, and there is active research in this field within academia. However, personalized product recommendations in offline retail stores have not yielded significant outcomes thus far. Especially for small-format offline retail businesses like convenience stores, where customer information might be limited, providing personalized product recommendations poses even greater challenges. To address this issue, this study aimed to find a solution by shifting the perspective on recommendation methods and altering the target of recommendations in existing personalized recommendation models. In this study, recommending products that customers need in an offline store was defined as suggesting products that should be introduced and displayed within the store. In other words, the recommendation focus shifted from individuals to the stores themselves. This recommendation system proposes products that individual stores have not yet introduced but are anticipated to be purchased by customers among the products managed by the headquarters. Building upon this, we devised a store-based product recommendation system. The widely used user-based collaborative filtering model, a common technique in existing recommendation systems, was adapted into a store-based collaborative filtering model. Furthermore, various rules and logic pertinent to store operations and business considerations for convenience stores were integrated to implement this store product recommendation system. The accuracy and effectiveness of the system were demonstrated through its application in actual convenience stores. Results from the pilot implementation of the system showed that 88% of the newly recommended products in individual stores were sold based on one week of sales data, and the sales revenue was 1.75 times higher than the average sales revenue of those products across the entire company. Survey results on business owners' satisfaction yielded a score of 4.2 out of 5, indicating a high level of contentment. Additional observed effects included the expansion of product range and reduction in order lead times. However, 12% of the total recommended SKUs did not sell within one week, and 34% of the SKUs did not meet the overall average sales quantity. This research holds significance in extending the scope of personalized recommendation studies from primarily online platforms to offline retail businesses like convenience stores. It provides tangible methodologies and outcomes that can be implemented in real-world settings through the construction and validation of an actual system. The study also suggests avenues for future research to address some of the identified limitations.
Keywords:
recommendation models
; store-based recommendation models
; implementation of recommender system
1. Introduction
Recently, the retail industry has been collecting various traces of customers' shopping journeys to provide personalized recommendations based on these data. Furthermore, efforts have been made to develop more sophisticated personalized recommendations to not only attract customers to the shopping space but also enhance purchases within that space. However, these efforts have primarily focused on the online e-commerce domain, and personalized product recommendations for offline stores have proven challenging despite various attempts.
To achieve customized product recommendations for offline customers, it is crucial to gather basic customer information and purchase journey data. Furthermore, accurately identifying the customer's current location and providing appropriate products in a timely manner is essential. In the mid-2010s, some companies with high brand loyalty attempted offline target marketing using location-based systems (LBS) like beacons and mobile coupon distribution. However, due to technological constraints, customer resistance, and challenges related to return on investment (ROI), these systems had limitations in terms of effectiveness. Especially for companies operating multiple stores like convenience stores, collecting customer information is difficult due to the diverse range of visitors. While investing in systems and infrastructure for collecting customer information and target marketing is possible, actual instances of such investments are rare, and even when investments are made, there are few success stories resulting in increased sales and profits.
In this study, we aimed to find a solution by shifting the approach from targeting individual customers to targeting stores in the existing personalized product recommendation models. Traditional personalized recommendation models recommend products with a high likelihood of purchase or selection based on customer purchase/selection history, preferences, and evaluations. In this study, a model was developed to recommend products based on individual stores. This model predicts products that customers visiting a particular store would want to purchase, even if those products are not currently stocked in that store. This approach involves considering the specific rules and logic of the convenience store domain.
While recommendation system algorithms continue to evolve and diversify, limitations still exist in terms of data analysis and algorithms. Moreover, successful implementation in real business scenarios requires additional domain-specific rules and logic based on the fundamental recommendation algorithms. In this study, a store-specific product recommendation model based on convenience store product and sales data was developed. This model was then integrated with domain-specific rules and logic to validate its effectiveness.
In South Korea, there are approximately 50,000 convenience stores, with over 95% of them operated through individual franchise agreements with the headquarters. Generally, each store carries around 2,500 to 3,500 SKU products, with some variation depending on the store's location and size among the approximately 20,000 products offered by the company. When a new convenience store opens, Company E selects products based on pre-defined categories for commercial regions. However, this simplistic approach of categorizing based solely on store location doesn't fully capture the unique characteristics of each individual store. Additionally, after the initial product selection, store owners must decide which new products to introduce from a pool of around 100 different products each month. They usually rely on recommendations from their surroundings or basic product information provided by the company. The store-specific recommendation model in this study recommends products that have succeeded in similar stores with comparable customer types and sales patterns. Moreover, it integrates domain-specific rules and logic to implement a recommendation system for convenience stores and attempts to validate its effectiveness.
2. Literature Review
As personal data has rapidly increased and become more accessible, recommendation systems are widely applied across various online platforms. Especially in online shopping malls, movie and music content providers, news websites, bookstores, and research-related sites, recommendation systems are essential. From the perspective of sellers/suppliers, providing appropriate recommendations that induce actual purchases has a direct impact on revenue generation, underscoring the importance of accurate product recommendations. Consequently, research to enhance the accuracy and efficiency of recommendation systems has been actively pursued (Das et al., 2013).
The concept of recommendation systems was initially proposed by Karlgren in 1990 (Karlgren, 1990). In 1994, the University of Minnesota Group Lens research team developed the first automated recommendation system "Group Lens" using the UCF algorithm. In 1997, content-based collaborative filtering (CF) algorithms were introduced for information retrieval (Balabanović & Shoham, 1997). In 1998, an approach using collaborative filtering with singular value decomposition for classification tasks was introduced (Billsus & Pazzani, 1998). In 2002, item-based CF algorithms were proposed (Sarwar et al., 2002), and Linden (2003) established the widely-known Item-to-Item CF method used in Amazon's recommendation system. Alfred & Lovstakken (2010) increased the accuracy of recommendation systems using implicit user interaction data. Fan et al. (2014) presented a recommendation algorithm utilizing multi-user similarity. Rong et al. (2015) proposed an improved user similarity-based algorithm for collaborative filtering. Since 2015, deep neural networks have been applied to enhance recommendations in large-scale content. In 2016, Google introduced the high-performance YoutubeDNN model by integrating classic recommendation system architectures (Covington et al., 2016). Subsequent developments include VAE-CF considering user preferences (Lee et al., 2017), RNN-based recommendation systems considering user preference changes (Li et al., 2017), and the RKSA model using the Transformer architecture to consider item relationships (Ji et al., 2020). Recent research in recommendation systems primarily focuses on improving algorithm accuracy, with online customers being the main target.
This study differs from previous research in several ways. It implements and validates a recommendation system using user-based collaborative filtering, based on the hypothesis that if a specific store prefers certain products, similar preferences may be present in other stores. While prior studies mainly focused on recommending products to individual online customers, this study aims to recommend products to offline stores. Therefore, unlike previous research that emphasized enhancing the efficiency and accuracy of recommendation algorithms, this study focuses on effectively implementing a recommendation system based on changes in the recommendation target.
In a similar context, Joe & Nam (2017) implemented and validated a recommendation system for SKU recommendations in offline fashion stores of the same brand. Their study proposed methods for handling SKU recommendations at the store level in distribution companies dealing with the same brand across different countries and regions, using collaborative and hybrid filtering. Their models, based on sales data from 52 stores, 24 items, and 404 SKUs of the 'K' brand over a 3-week period, achieved recommendation precision of 9.9% for collaborative filtering and 10.8% for clustering-based recommendations.
This study proposes and validates a recommendation model for offline stores, similar to Joe & Nam (2017), but with three key differences. Firstly, this study utilizes much larger data, including sales data from over 6,000 convenience stores for a year. Secondly, it considers various business characteristics of customer purchasing behavior and system implementation in similarity evaluation. Lastly, the recommendations are validated based on actual sales generated by the store.
3. Method of the Study
3.1. Overview of Research Method
The aim of this study is to implement a model that recommends products expected to be purchased by customers visiting each convenience store (E company) and integrate it with the existing ordering system to validate its effectiveness in real stores. The recommendation model consists of a store-based collaborative filtering model, which is a modification of the user-based collaborative filtering model, and a Top-K Recommendation that recommends the top N products through various business logics and sorting methods tailored to the convenience store business. The constructed recommendation model is implemented within E company's ordering system, enabling store owners to select and place orders for the recommended products. The ordered products are then delivered to the stores and displayed for sale. Subsequently, the performance of the recommendation system is evaluated based on the sales results of the recommended products. The overall research process is illustrated in Figure 1.
3.2. Data Composition
The data used in this study was extracted from the databases of E company’s operational system and POS (Point of Sales) system, covering the period from January 1, 2022, to December 31, 2022, for duration of one year. This data can be categorized into two types: master data, which includes reference information, and various transaction data used for store operations.
The master data includes store master data containing store codes, store names, store locations, store types, store opening dates, and store sizes. Additionally, there is promotion master data, which holds information on promotion codes, promotion names, promotion types, promotion periods, and the stores where the promotions apply. Furthermore, the product master data comprises product codes, product names, product categories, product attributes, and product suppliers. It also includes store-specific product master data containing products available at each store. As for transaction data, it involves sales performance data generated from each store's POS system, inventory movement data for each store, and product ordering data for each store. Customer data that could be identified for individual purchases in each store accounted for less than 5% of the total purchase data, making it challenging to consider customer data for assessing store similarity. Therefore, this data was excluded.
Data preprocessing was conducted in this study prior to data analysis, involving the selection and extraction of relevant items from the entire dataset, removal of inaccurate or incorrect data, and data modification to enhance data accuracy. Outliers primarily originated from sales quantities within the POS data. Data exhibiting distinct patterns from the typical customer sales patterns due to special store sales (such as B2B sales) or specific purpose-driven customer purchases (e.g., bulk purchases for event preparation) were eliminated. Additionally, new items were added for analysis, including daily totals of transaction data, store-specific sales summaries, and recommendation scores. Finally, new database tables, encompassing metric tables and category conversion tables necessary for model generation, were created during the model creation phase. Subsequently, essential data from each table was merged to construct the analysis dataset. As a result, operational and transaction data of approximately 400 million records from E company were leveraged for analysis.
3.3. Recommendation Model
In this study, user-based collaborative filtering, a type of collaborative filtering, was chosen as the initial approach for developing the product recommendation model. The approach for establishing the product recommendation model is in Figure 2.
Select Store Characteristics for Similarity Measurement: Defining the characteristics of similar stores is crucial for utilizing user-based collaborative filtering. Store similarity can be delineated through various methods, such as physical attributes like store size and location, operational characteristics like handled products and services, as well as customer attributes like gender and age group. In this study, the recommendation system aims to suggest products that are well-sold in similar stores to a specific store A, which currently does not offer those products. While E company classifies stores into N commercial areas based on geographical location, there exists substantial variance among stores within each commercial area.
Taking these factors into consideration, this study deemed the most plausible and rational factor for determining store similarity using E company's current data to be the sales trend of products within stores. This information reflects customer purchasing behavior and commercial area attributes. However, comparing the sales trend of each SKU across all stores to determine similarity would be inefficient, as it would necessitate processing a sales quantity matrix of over 10,000 SKUs for approximately 6,000 stores. Consequently, product categories representing individual SKU attributes and sales time slots were chosen as pivotal factors for determining similarity. Thus, store similarity was calculated based on the sales proportion of product categories and sales time slots among all products.
Construction of Input Variable Matrix: To perform similarity calculations, we constructed an input variable matrix based on store x category proportions and store x time slot sales proportions. In this context, categories represent sets of SKUs with similar attributes, and specifically, we composed the input variable matrix for similarity calculation using 180 intermediate categories derived from E Company's product classification rules.
Measuring Store Similarity: In collaborative filtering recommendation techniques, user similarity is utilized to select neighbors for the target user. Various metrics such as Euclidean distance, Pearson correlation, Cosine similarity, and mean squared differences are employed for calculating similarity (Bobadilla et al., 2013). In this study, users were defined as stores, and store similarity was computed based on category-wise revenue proportions. Furthermore, we utilized cosine similarity, as there is no bias in the measurements of the revenue figures for the 180 categories used in similarity calculation.
Calculating Product Recommendation Scores: Typically, a product recommendation model selects the top N items that are expected to be most preferred by the target customer and presents them as a list of recommended products (Karypis, 2001). In traditional movie or document recommendations, preference can be predicted using evaluation scores such as satisfaction scores or preference scores provided by customers (Deshpande & Karypis, 2004). However, in this study, we employed a user-based top-N item recommendation technique (Cremonesi et al., 2010). The calculation of recommendation scores for products involves the following steps: First, based on the similarity matrix calculated from store data, we selected the top 30 most similar stores. Next, from these stores, we identified the 500 products with the highest daily sales volume. Finally, we computed the recommendation score by taking the weighted average of the store similarity scores and the sales frequency of each product. The reason for using sales frequency as a weight is to prioritize recommending products with higher sales. The formula for calculating the product recommendation score is as follows:

Final Selection and Sorting of Recommended Products: In the existing product recommendation system, items were recommended and sorted for individual users based on the recommendation scores calculated by the algorithm. In this study, while still utilizing the recommendation scores as a basis, we introduced exclusion criteria to remove products that lack business significance. Firstly, products currently being managed by the store and those with inventory were excluded. Secondly, products that are currently out of stock but have a purchase history within the maximum ordering lead time were excluded. Thirdly, considering the potential rapid changes in product sales due to promotions in convenience stores, products within the ordering lead time from the end of a promotion were also excluded. Through these processes, recommended products tailored to each individual store were integrated into the store ordering system.
3.4. Recommender System Implementation
The configuration image of the recommendation system implemented in this study is shown in Figure 3. The data collected from the business systems are stored in big data DB in the public cloud system. After batch processing, the store-specific recommended candidate product data is combined with business rules to generate the final recommended products, which are then provided through the ordering system.
Within the ordering system, the implemented product recommendation screen displays up to 10 SKU products per category and time slot in a pop-up window on the main ordering screen. This allows the store owner to select products and enter the order quantity. The target products are periodically updated for a specific period, and a "Do not show again today" feature is added to prevent the pop-up window from being displayed continuously.
3.5. Results Verification
The purpose of the recommendation system is not only to accurately recommend items that users are highly likely to choose but also to provide users with sufficient satisfaction, thereby enhancing trust in the system and encouraging long-term usage. Therefore, the criteria for a good recommendation system should include not only the accuracy of recommendation performance but also psychological and interface factors.
This study is based on a model that recommends products within convenience store stores and implements it within the ordering system to validate its performance. Rather than focusing on advanced algorithms to improve recommendation performance, the study prioritizes the implementation of a realistic and efficient system based on the data, data structure, and existing system currently managed and configured by E company. The goal is to focus on the applicability and usability of the system.
As reviewed in the previous literature, I used the user-based model that is the most widely used collaborative filtering technique, with a store-centric approach. So, I defined this model as a store-based collaborate filtering model. To evaluate the accuracy of the recommendation system, the study plans to implement this user-based model and use Precision as the evaluation metric for the first verification. Additionally, user satisfaction will be assessed through surveys and interviews to evaluate recommendation satisfaction and system usage satisfaction.
4. Results
4.1. Results of Store-Based Collaborate Filtering
This paper utilizes store-based collaborative filtering, with store similarity calculated based on the similarity of category-based sales. Initially, we compared the recommended products for the store with the highest similarity and the store with the lowest similarity in order to assess the precision of store similarity measurement. In the case of Store A, we selected 15 recommended products from the top 30 stores with the highest category-based similarity. These 15 recommended products were filtered based on the exclusion criteria mentioned earlier. Table 1 displays the top 15 recommended products for Store A.
Table 2 presents the top 15 recommended items for Store B, which is the most similar store to Store A. Upon reviewing the items listed in Table 1 and Table 2, it is evident that 10 items are being recommended identically. The 66.7% item duplication rate between the most similar stores is a result of the application of exclusion criteria such as inventory considerations.
Table 3 presents 15 recommended items for Store C, which is the least similar store to Store A. Upon reviewing the items in Table 1 and Table 3, only one item, "Burdock Tea 500ml," is recommended identically, resulting in a very low duplication rate. In conclusion, the analysis of the recommended items in Table 1, Table 2 and Table 3 indicates that the similarity measurement based on category-wise sales, as employed in this study, is appropriate.
Table 4 presents a list of the top 10 recommended items for Store A. In addition to the exclusion criteria mentioned earlier, this list has been reorganized based on business conditions (such as uniqueness, trendiness, profitability, sales growth rate, PL status, etc.). Furthermore, Table 4 has been further fine-tuned based on the expiration of promotions at the time of the recommendation algorithm execution. As a result, 'Thick Buckwheat Tea 340ml' and 'Corn Silk Tea 340ml' were excluded from the list. Additionally, ‘Choco-chip donut 38.3g’ ranked higher than ‘Sour love plum 42g', due to a higher sales growth rate.
4.2. Pilot Implementation Results of the Product Recommender System
The goal of this study is not only to implement the recommended algorithm as mentioned in the introduction but also to evaluate and validate the system's functionality in actual stores. To accomplish this, the implemented recommendation model has been integrated into Company E's order system, and a pilot operation has been conducted. For the pilot operation, stores with well-performing order operations were selected to apply and assess the recommendation system in real-world scenarios. The pilot operation took place from March 13th to April 9th, 2023, spanning four weeks. Each store was instructed to order three or more products from the top 10 recommended products based on the store owner's judgment. The ordered products were promptly displayed and sold. Table 5 provides an overview of the proposed recommendation system's pilot operation.
Among the 8 stores participating in the pilot operation, including Store A, 4 stores placed orders for the recommended products for a duration of 4 weeks, 2 stores placed orders for 3 weeks, and Store F placed orders for 2 weeks. Store K used the recommendation system only in the first week and was excluded from the evaluation. In total, 91 SKUs recommended and ordered from 7 stores were used to evaluate the pilot operation results. Table 6 presents the number of ordered SKUs each week on Mondays and the number of sold SKUs for each week. Orders and Sales
Out of the total 91 newly introduced SKUs across the 7 stores, 80 SKUs were sold within 1 week, while 15 SKUs had no sales during that week. Throughout the entire 4-week pilot operation period, all SKUs were sold at least once. While opinions may vary regarding the sales criterion within 1 week, considering that Company E sells approximately 500 SKUs on average per day and each store manages around 3,500 SKUs, the average sales period for newly introduced products was considered as 1 week.
Based on this 1-week sales period, the accuracy of the recommendation system can be calculated as follows:
Accuracy = Number of Sold SKUs / Number of Recommended Ordered SKUs = 80 SKUs / 91 SKUs = 0.88
The accuracy of the recommendation system calculated in this way is 88%. However, due to the nature of offline stores, this approach alone may not be sufficient to determine the system's effectiveness. To further evaluate the performance of recommended products, the average daily sales quantity of newly introduced products in each store was compared with the overall average sales quantity of those products being sold across all stores. Table 7 presents the results of this comparison.
In comparison, except for Store D, the average daily sales of newly recommended products were higher than the average daily sales of the existing products in the other 6 stores. Across all 7 stores, the average daily sales of newly recommended products were 0.63 units, which was 1.75 times higher than the overall average of 0.36 units for the existing product composition. Furthermore, when comparing individual SKUs, 60 products achieved higher sales than the comparison stores, while 31 products had lower sales. This indicates that approximately 66% of the recommended products demonstrated better sales performance compared to the overall sales performance.
In addition to quantitative results, qualitative evaluation was conducted by collecting user satisfaction and feedback on system usage. To identify areas for improvement, a survey was conducted. Table 8 presents the survey results reflecting user satisfaction and opinions from the 7 stores after the 4-week pilot operation. The survey was conduct with the 5-point Likert scale.
Overall, there was generally positive feedback from users regarding the recommendation system, and the key feedback for the open-ended question (addressing issues or suggestions) is as follows: "We expanded our product lineup through the recommendation of cold noodle category products. The recommended products are selling well, but whether they show better performance than other new products needs further verification. If similar products within the same category are recommended, it may lead to a decrease in sales of other products. The system recommends products that were not previously considered, reducing decision-making scope and time. Concerns were raised about the potential impact on sales of similar products within the same category, such as 'oooo café latte'."
5. Conclusions
There are approximately 50,000 convenience stores insputh Korea, with over 95% of them operated through individual franchise agreements with the headquarters. Generally, each store carries around 2,500 to 3,500 SKU products, with some variation depending on the store's location and size among the approximately 20,000 products offered by the company. In this study, we aimed to find a solution by shifting the approach from targeting individual customers to targeting stores in the existing personalized product recommendation models. The store-specific recommendation model in this study recommends products that have succeeded in similar stores with comparable customer types and sales patterns. Moreover, it integrates domain-specific rules and logic to implement a recommendation system for convenience stores and attempts to validate its effectiveness.
In summary, the results of the pilot operation of the product recommendation system are as follows:
• During the 4-week pilot period, all 91 newly introduced SKUs were sold, achieving a 100% sales rate.
• Out of the 91 recommended SKUs, 80 SKUs were sold within 1 week, demonstrating an 88% recommendation accuracy.
• The overall average daily sales of recommended products in the selected 7 stores is 0.63, which is 1.75 times higher than the overall average.
• When compared to the average sales of identical SKUs across all stores, 66% of the SKUs recorded higher sales.
These results indicate a substantial level of accuracy and effectiveness in the pilot operation of the recommendation system. The business owners' satisfaction rating of 4.2 also reflects continued interest in the system's ongoing use. Additionally, qualitative effects of the pilot operation included the expansion of product diversity in low-performing categories and a significant reduction in the time and effort required for product selection. However, it's worth noting that 12% of recommended SKUs were not selected within 1 week, and 34% of SKUs did not meet the overall average sales. These findings highlight the need for further research and system improvements. Furthermore, additional validation and fine-tuning of the recommendation logic are necessary to determine an appropriate product recommendation cycle.
The significance of this study lies in the expansion of personalized recommendation research, primarily conducted on online platforms, to offline businesses such as convenience stores. The study implemented and validated a store-based collaborative filtering model for product recommendation, considering users across various store locations. Store similarity was calculated based on each store's category-specific sales history. Leveraging collaborative filtering after analyzing SKU sales histories for each store, the model recommended products that were predicted to perform well in terms of sales, taking into account additional business considerations such as headquarter and store product operations.
Furthermore, the implemented recommendation model in this study was integrated into E Company's existing order system, allowing performance testing using actual sales data. The results indicated an 88% recommendation accuracy based on sales within 1 week, with sales amounts 1.75 times higher than the overall average. Additionally, business owners expressed a high level of satisfaction with an overall rating of 4.2, highlighting potential benefits such as diversifying low-performing categories and reducing time spent on product selection.
Additional contribution of this research also lies in extending tailored recommendation studies, predominantly researched on online platforms, to offline businesses like convenience stores. The study presented specific methodologies, results, and future directions by implementing and validating a recommendation system in actual operational stores. However, the main focus of this research was not to find the optimal recommendation model, but to rapidly implement and validate the system in real stores and identify areas for improvement and adjustment through iterative processes.
Several areas require further attention and research. The 12% failure rate of recommended products and the underperformance of 34% when compared to overall average demand indicate the need for additional algorithm refinement and optimization. Furthermore, additional validation is needed for store similarity assessment, considering factors such as store locations, product range, and sales volume. Exploring weight adjustments for various business requirements in recommendation score calculation is necessary. Hybrid recommendation systems using cluster analysis and item-based recommendation systems using basket analysis are potential areas for further research. Moreover, a financial evaluation, such as assessing the overall sales and profitability impact of introduced products, needs to be considered for a comprehensive assessment of the recommendation system's effectiveness from a financial perspective.
In conclusion, this study has laid the foundation for the implementation and expansion of recommendation systems in real offline store environments. However, further research is needed to address identified limitations and future research tasks
References
- Alfred, C. H. , & Lovstakken, L. (2010). Eigen-based clutter filter design for ultrasound color flow imaging: A review. IEEE transactions on ultrasonics, ferroelectrics, and frequency control, 57(5), 1096-1111. [CrossRef]
- Balabanović, M. , & Shoham, Y. (1997). Fab: content-based, collaborative recommendation. Communications of the ACM, 40(3), 66-72. [CrossRef]
- Billsus, D. and Pazzani, M. J. (1998), Learning Collaborative Information Filters, In ICML, 98, 46-54.
- Bobadilla, J. , Ortega, F., Hernando, A., and Gutiérrez, A. (2013), Recommender system s survey, Knowledge-Based Systems, 46, 109-132. [CrossRef]
- Covington, P. , Adams, J., & Sargin, E. (2016, September). Deep neural networks for youtube recommendations. In Proceedings of the 10th ACM conference on recommender systems (pp. 191-198).
- Cremonesi, P. , Koren, Y., and Turrin, R. (2010), Performance of recommender algorithms on top-n recommendation tasks, In Proceedings of the fourth ACM conference on Recommender systems, 39-46.
- Das, M. , De Francisci Morales, G., Gionis, A., and Weber, I. (2013), Learning to question : Leveraging user preferences for shopping advice, In Proceedings of the 19th ACM SIGKDD international conference on Knowledge discovery and data mining, 203-211.
- Deshpande, M. and Karypis, G. (2004), Item-based top-n recommendation algorithms, ACM Transactions on Information Systems (TOIS), 22(1), 143-177.
- Fan, J. , Pan, W., & Jiang, L. (2014, January). An improved collaborative filtering algorithm combining content-based algorithm and user activity. In 2014 International Conference on Big Data and Smart Computing (BIGCOMP) (pp. 88-91). IEEE.
- Ji, M. Joo, W., Song, K., Kim, Y. Y., & Moon, I. C. (2020, April). Sequential recommendation with relation-aware kernelized self-attention. In Proceedings of the AAAI conference on artificial intelligence (Vol. 34, No. 04, pp. 4304-4311).
- Joe, D. , Nam, K., (2017), SKU recommender system for retail stores that carry identical brands using collaborative filtering and hybrid filtering, J Intell Inform Syst 2017 Dec.:23(4): 77-110.
- Karlgren, J. (1990). An algebra for recommendations: Using reader data as a basis for measuring document proximity.
- Karypis, G. (2001), Evaluation of item-based top-n recommendation algorithms, In Proceedings of the tenth international conference on Information and knowledge management, 247-254.
- Li, J. , Ren, P., Chen, Z., Ren, Z., Lian, T., & Ma, J. (2017, November). Neural attentive session-based recommendation. In Proceedings of the 2017 ACM on Conference on Information and Knowledge Management (pp. 1419-1428).
- Linden, G. , Smith, B., and York, J. (2003), Amazon.com recommendations : Item-to-item collaborative filtering, Internet Computing, IEEE, 7(1), 76-80.
- Rong, H. , Gong, L., Qin, Z., Hu, Y., & Hu, C. (2015). A personalized recommendation approach based on content similarity calculation in large-scale data. In Algorithms and Architectures for Parallel Processing: 15th International Conference, ICA3PP 2015, Zhangjiajie, China, November 18-20, 2015, Proceedings, Part I 15 (pp. 460-477). Springer International Publishing.
- Sarwar, B. M. , Karypis, G., Konstan, J., and Riedl, J. (2002), Recommender systems for large-scale e-commerce : Scalable neighborhood formation using clustering, In Proceedings of the fifth international conference on computer and information technology, 1.
Figure 1.
Overall Research Process.
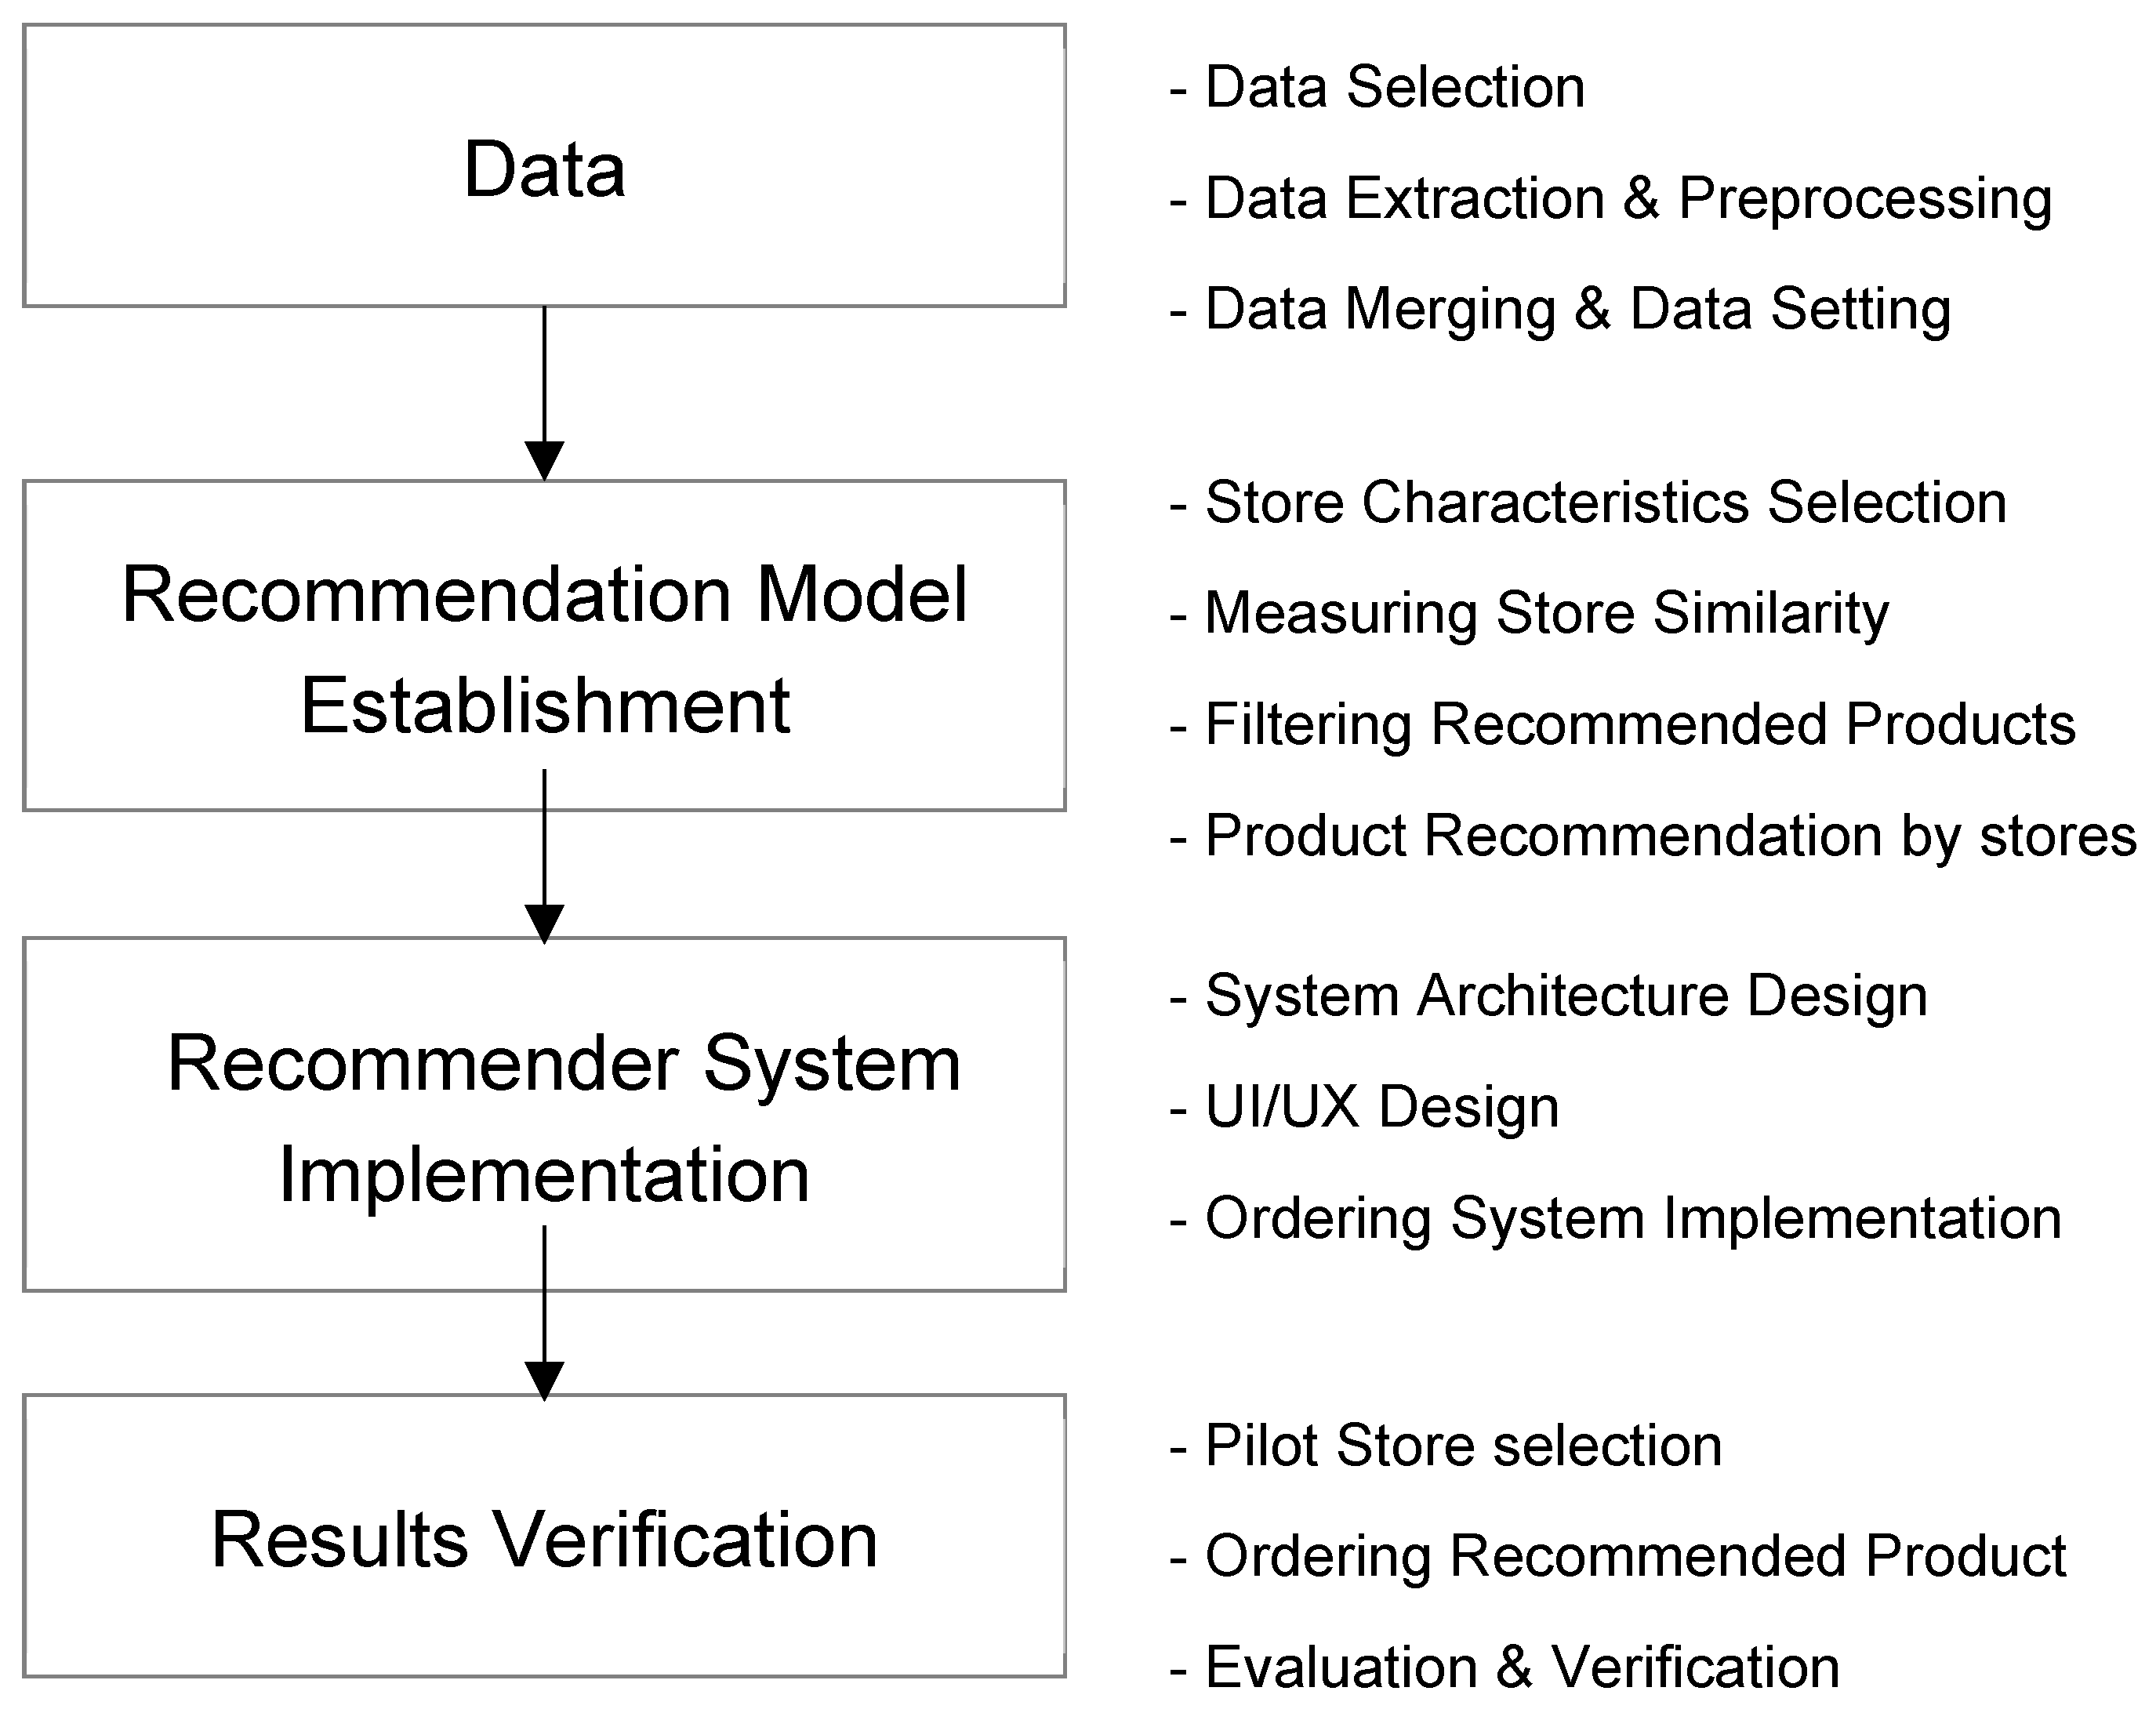
Figure 2.
Recommendation Model.
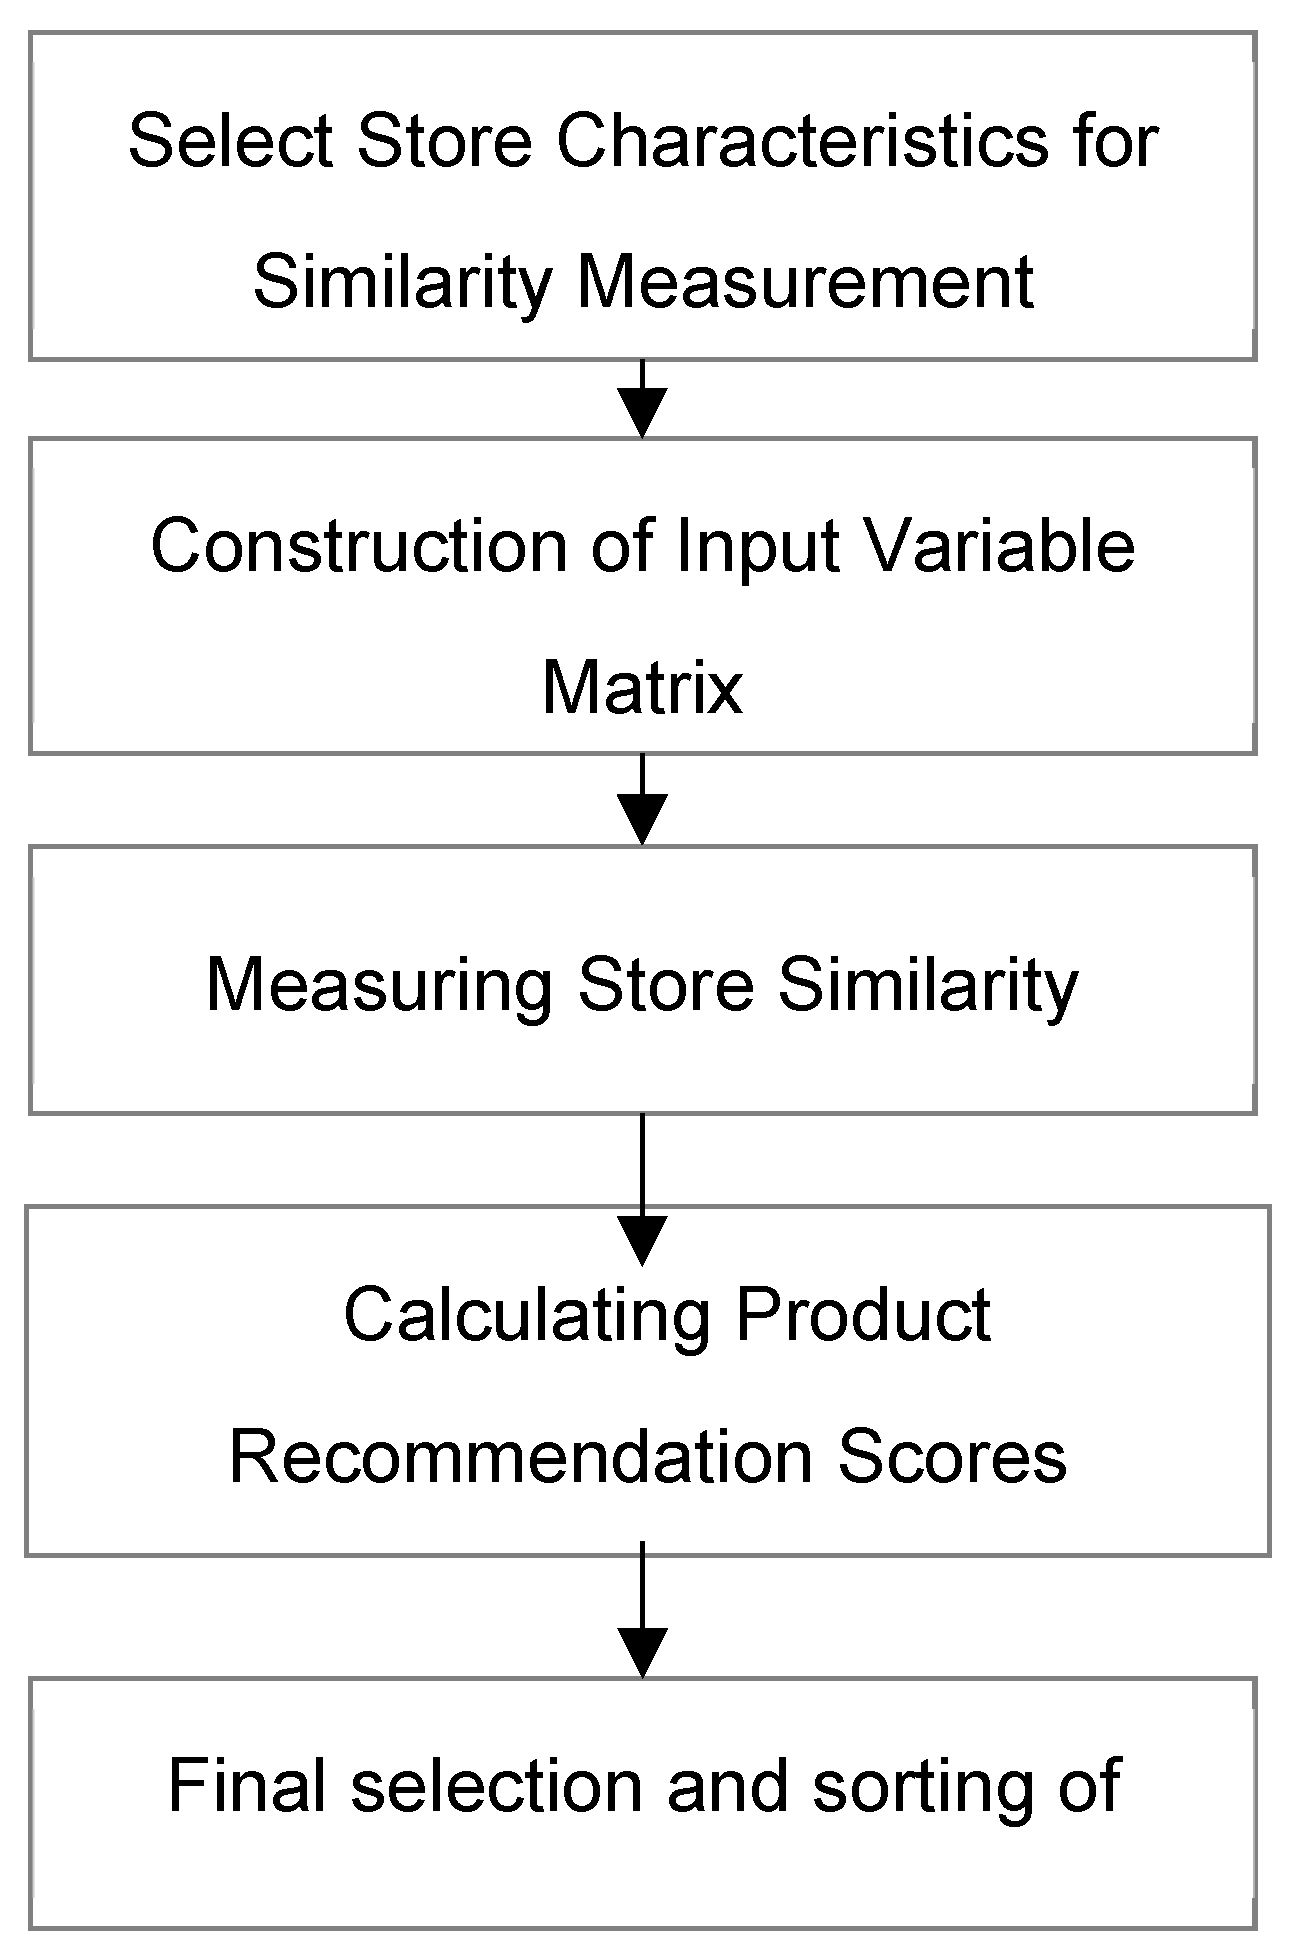
Figure 3.
Overall System Architecture.
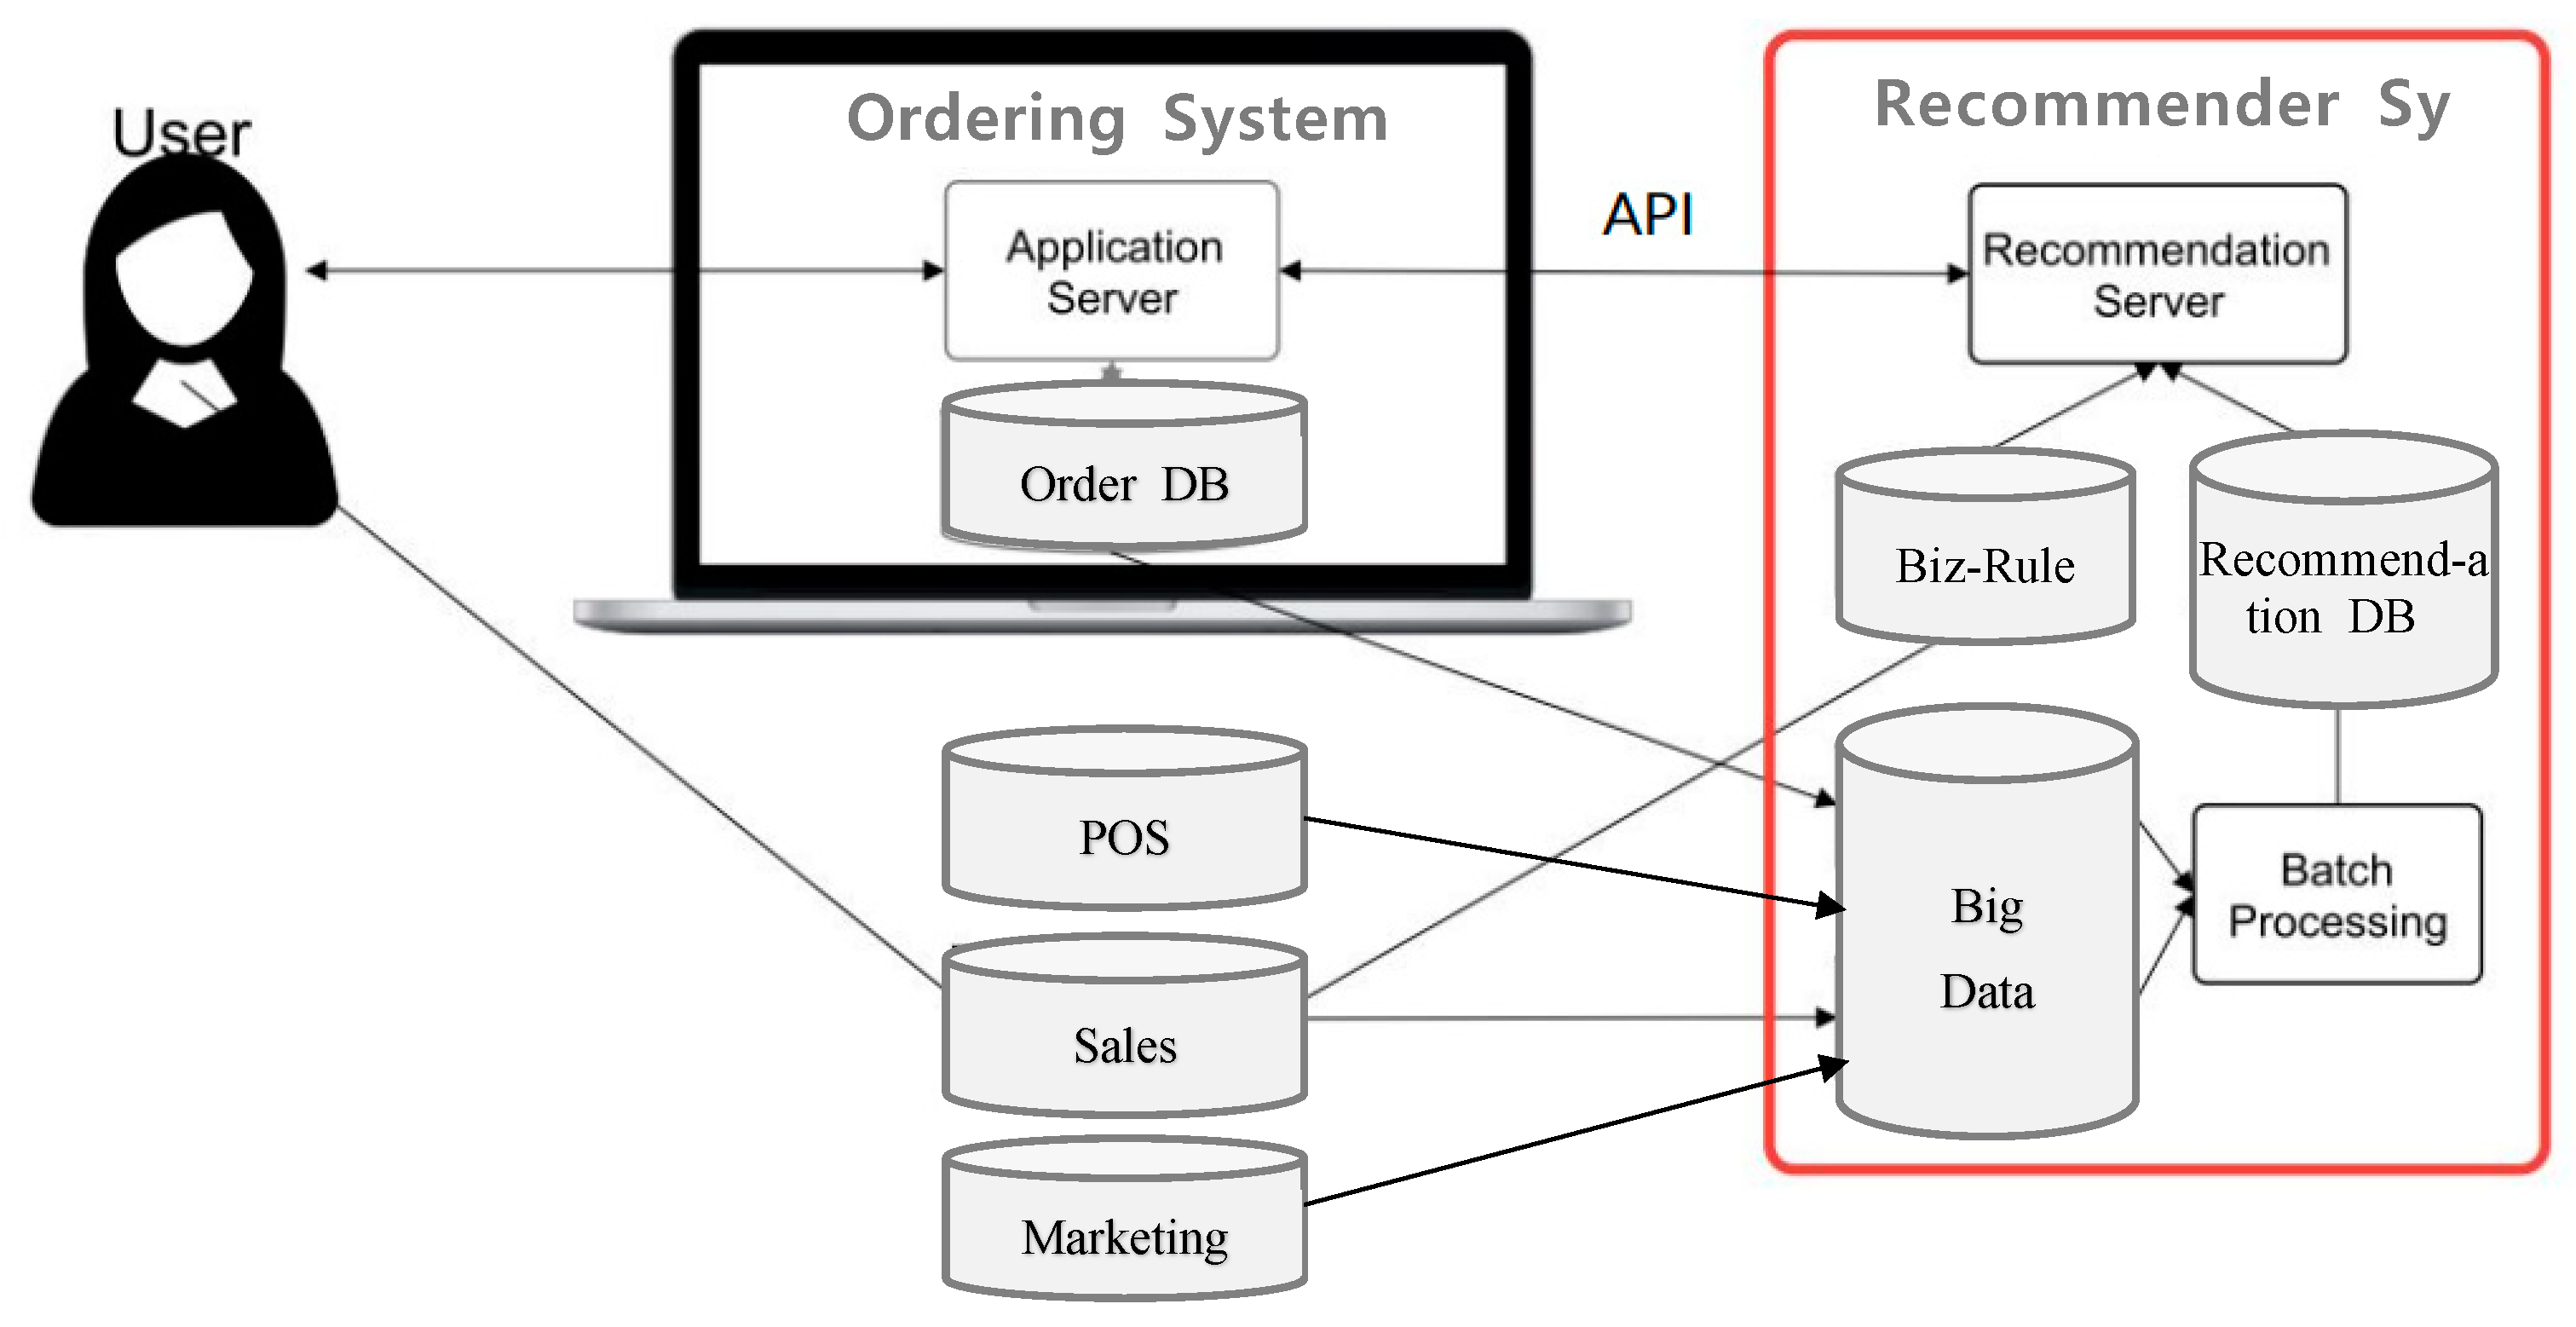

Table 1.
Recommended Products for store A(top 15).
| Rank | Product Code | Product Name | Scores |
|---|---|---|---|
| 1 | 123734 | Chicken breast ricotta salad | 43.5 |
| 2 | 016104 | Thick Buckwheat Tea 340ml | 37.0 |
| 3 | 840169 | Aloe pet 340ml | 30.4 |
| 4 | 000022 | Corn Silk Tea 340ml | 29.6 |
| 5 | 123697 | Tandanji hot chicken tender salad | 19.9 |
| 6 | 840190 | Tandanji grilled chicken breast salad | 19.6 |
| 7 | 012176 | Blue zero soda 250ml | 16.5 |
| 8 | 016098 | Milk chocolate biscuit 102g | 12.7 |
| 9 | 112783 | Kim Rabbit Fresh Strawberry Sandwich | 11.0 |
| 10 | 005314 | Burdock tea 500ml | 10.2 |
| 11 | 008765 | Orange mango 200ml | 8.8 |
| 12 | 008758 | Sour love plum 42g | 7.4 |
| 13 | 016135 | Choco-chip donut 38.3g | 7.4 |
| 14 | 006830 | Coconut milk plus 290ml | 5.8 |
| 15 | 040350 | Noodle Fit Spicy Udon Flavor Cup | 5.6 |
Table 2.
Recommended Products for store B(top 15).
| Rank | Product Code | Product Name | Scores |
|---|---|---|---|
| 1 | 123734 | Chicken breast ricotta salad | 38.7 |
| 2 | 666022 | Min Saeng Bitter Coffee 500ml | 32.4 |
| 3 | 253103 | Ambasa can 350ml | 32.1 |
| 4 | 016104 | Thick Buckwheat Tea 340ml | 27.7 |
| 5 | 840169 | Aloe pet 340ml | 22.8 |
| 6 | 123697 | Tandanji hot chicken tender salad 드 | 14.9 |
| 7 | 840190 | Tandanji grilled chicken breast salad | 14.7 |
| 8 | 062347 | Charcoal Grilled Chicken Skewers | 14.2 |
| 9 | 315095 | Gary Cheese Crackers 100g | 11.8 |
| 10 | 016098 | Milk chocolate biscuit 102g | 9.5 |
| 11 | 213604 | Beyotte cookies and cream | 9.2 |
| 12 | 005314 | Burdock tea 500ml | 7.7 |
| 13 | 008765 | Orange Mango 200ml | 6.6 |
| 14 | 016135 | Choco-chip donut 38.3g | 5.5 |
| 15 | 006830 | Coconut milk plus 290ml | 4.4 |
Table 3.
Recommended Products for store C(top 15).
| Rank | Product Code | Product Name | Scores |
|---|---|---|---|
| 1 | 350109 | Pastel-dol lighter | 14.1 |
| 2 | 511047 | Seoul Jangsu Makgeolli | 13.8 |
| 3 | 551233 | Taewharu Makgeolli | 13.1 |
| 4 | 010414 | Crayon Shin-zzang Candy | 9.4 |
| 5 | 920067 | Sosung alcohol | 9.3 |
| 6 | 230053 | Metalrochi lighter | 8.1 |
| 7 | 000022 | Haru mineral water 500ml | 7.7 |
| 8 | 129378 | Good day bottle 360ml | 6.9 |
| 12 | 005314 | Strong raisin tea 500ml | 6.8 |
| 10 | 008758 | Epresso hot americano coffee | 4.6 |
| 11 | 023379 | Big ice americano coffee | 4.2 |
| 9 | 675367 | Long wheat snack | 3.8 |
| 13 | 159733 | Good day alcohol pet 640ml | 3.8 |
| 14 | 915709 | Grinded pear juice 500ml | 3.7 |
| 15 | 000015 | Haru mineral water 2L*6 | 3.0 |
Table 4.
Finally Recommended Products for store A(top 10).
| Rank | Product Code | Product Name | Score | Sales Growth Rate | PL /PB |
New Prod. | Days after order |
|---|---|---|---|---|---|---|---|
| 1 | 123734 | Chicken breast ricotta salad | 43.5 | NaN | 0 | 0 | NaN |
| 2 | 840169 | Aloe pet 40ml | 30.3 | 17.6 | 0 | 0 | 45 |
| 3 | 123697 | Tandanji hot chicken tender salad | 19.9 | 92.3 | 0 | 0 | NaN |
| 4 | 840190 | Tandanji grilled chicken breast salad | 19.6 | 13.2 | 0 | 1 | NaN |
| 5 | 012176 | Blue zero soda 250ml | 16.5 | 22.5 | 0 | 1 | NaN |
| 6 | 016098 | Milk chocolate biscuit 102g | 12.7 | -33.2 | 0 | 0 | NaN |
| 7 | 005314 | Burdock tea 500ml | 10.2 | 10.8 | 0 | 1 | NaN |
| 8 | 008765 | Orange mango 200ml | 8.8 | NaN | 0 | 0 | NaN |
| 9 | 016135 | Choco-chip donut 38.3g | 7.4 | 35.6 | 0 | 0 | NaN |
| 10 | 008758 | Sour love plum 42g | 7.4 | 7.83 | 0 | 0 | NaN |
Table 5.
Overview of the proposed recommendation system's pilot operation.
| Cat. | Contents |
|---|---|
| Op. Period | 23.3.13 ~ 23.4.09.(4 weeks) |
| No. of Stores | 8 stores |
| New Prod. Order | Order 3 or more of the recommended Top 10 SKUs by each store |
| Order Way | Order every Monday through the recommended ordering screen in the ordering system |
| Performance Criteria | 1. Sales status of recommended/ordered items (1 week) 2. Average daily sales of recommended items" (4 weeks) |
| Comparison criteria | Average sales volume per store for each product |
| Evaluation criteria | 1. Percentage of recommended introduced products that are sold (1 week) 2. Average daily sales of recommended products by store vs. overall average daily sales by all handling stores |
Table 6.
Orders and Sales of SKUs.
| Store Name | 1 week | 2 weeks | 3 weeks | 4 week2 | 1~4 weeks | ||||
|---|---|---|---|---|---|---|---|---|---|
| Order SKU |
Sales SKU |
Order SKU |
Sales SKU |
Order SKU |
Sales SKU |
Order SKU |
Sales SKU |
Unsold/Total SKU |
|
| A | 4 | 4 | 4 | 4 | 4 | 3 | 4 | 2 | 0/16 |
| B | 4 | 4 | 4 | 4 | 4 | 3 | 3 | 2 | 0/15 |
| C | 4 | 4 | 4 | 4 | 4 | 3 | 4 | 4 | 0/16 |
| D | 4 | 4 | 4 | 1 | 4 | 1 | 4 | 3 | 0/16 |
| E | 0 | 0 | 4 | 4 | 2 | 2 | 2 | 2 | 0/8 |
| F | 0 | 0 | 0 | 0 | 4 | 2 | 4 | 4 | 0/12 |
| G | 0 | 0 | 0 | 0 | 4 | 4 | 4 | 4 | 0/8 |
Table 7.
Comparison: Average Daily Sales versus Overall Average Sales.
|
Store Name |
Avg. Daily Sales Qty | Superiority/Inferiority | ||
|---|---|---|---|---|
| Pilot Store | Total Store | Superior SKU | Inferior SKU | |
| A | 0.62 | 0.40 | 11 | 5 |
| B | 0.88 | 0.28 | 12 | 3 |
| C | 0.39 | 0.34 | 6 | 10 |
| D | 0.22 | 0.25 | 8 | 8 |
| E | 1.21 | 0.36 | 7 | 1 |
| F | 0.40 | 0.39 | 8 | 4 |
| G | 0.85 | 0.40 | 8 | 0 |
| Total | 0.63 | 0.36 | 60 SKU | 31 SKU |
Table 8.
User Survey Results.
| Questions | Results | |
|---|---|---|
| System Reliability | Are the recommended products reliable and worth adopting? | 3.7 |
| System Usability | Selecting and ordering products was performed smoothly without any difficulty? | 4.6 |
|
System Utility |
Are you using the recommendation system continuously in the future? | 4.3 |
|
Other Opinion |
Address issues or suggestions | Total Avg. 4.2 |
Disclaimer/Publisher’s Note: The statements, opinions and data contained in all publications are solely those of the individual author(s) and contributor(s) and not of MDPI and/or the editor(s). MDPI and/or the editor(s) disclaim responsibility for any injury to people or property resulting from any ideas, methods, instructions or products referred to in the content. |
© 2023 by the authors. Licensee MDPI, Basel, Switzerland. This article is an open access article distributed under the terms and conditions of the Creative Commons Attribution (CC BY) license (https://creativecommons.org/licenses/by/4.0/).
Copyright: This open access article is published under a Creative Commons CC BY 4.0 license, which permit the free download, distribution, and reuse, provided that the author and preprint are cited in any reuse.


