Submitted:
18 September 2023
Posted:
20 September 2023
Read the latest preprint version here
Abstract
The aim of the paper is to analyze the experimental results of the influence of elevated temperatures and strain rate on the mechanical and structural properties of steel 42CrMo4. The experiments were based on uniaxial tension and compression tests at high temperatures between 700 °C and 1000 °C and strain rates range 0.0018 - 0.1 s-1. The influence of temperature and strain rate on yield stress, strain to fracture, hardness, structural changes, and fracture characteristics were analyzed. Due to the dynamic recrystallization phenomenon present during the hot tensile tests, an increase in the flow stress is observed at the beginning of the deformation, after which it decreases until the fracture. By increasing the deformation temperature from 700 °C to 1000 °C, the tensile stress decreases significantly for all strain rates. The increase in the strain rate leads to the increase in the tensile stress. In compression tests by increasing the strain rate, the true strain is slightly increasing, but this depends on the temperature. The non-uniformity of deformations obtained at different values of the strain rate and temperature were also analyzed. Analysis by scanning electron microscopy showed the ductile behavior of the material. The degree of damage of the material caused by the presence of cavities increases by increasing the deformation temperature.
Keywords:
steel
; tensile test
; compression test
; elevated temperatures
; scanning electronic microscopy
1. Introduction
The commercialization of steel is constantly developing, the range of operation of steels is quite wide, in the field of constructions, the field of transports (cars, trucks, aerospace industry, ship building and railways). Currently, to find out the characteristics of the deformation, laboratory equipment and special programs can be used, which are able to simulate physically or mathematically in a simplified way the real operational conditions, the information provided can be used later to determine the formability of the investigated material.
Steel 42CrMo4 is widely used in the machine building industry, being used in the manufacture of high-strength parts of compressors, turbines, working elements of heavy surface and underground equipment, as well as parts of agricultural equipment and other applications. In general, its application is for statically and dynamically stressed components for engines and machines [1,2,3,4,5,6,7,8,9,10]. Steel 42CrMo4 is a low alloy steel with chromium, molybdenum and manganese usually used in hardened and tempered state and has wide industrial applicability due to its high strength and hardness, good fatigue behavior and good machinability [9,10]. Despite the efforts made in studying the behavior of 42CrMo4 steel, the effects of hot working process parameters on the stress distribution, strain, and microstructural evolution of hot worked 42CrMo4 steel need to be further investigated to study the workability and to optimize the workability parameters hot [11,12]. Although the properties of 42CrMo4 steel have been studied, there is still a great interest in studying the mechanical properties of this material [13,14,15,16]. In the past, many investigations have been carried out on the behaviors of 42CrMo4 steel [15,16,17,18,19,20]. Lin YC et al. shown that preference for use of 42CrMo4 high-strength steel is mainly due to its good balance of strength, toughness, and water resistance [21,22]. Research was also carried out regarding the influence of temperature, strain rate on the deformation behavior and microstructure of the as extruded 42CrMo4 alloy [23,25]. During hot compression was studied the dynamic recrystallization kinetics of 42CrMo steel [26,27,28,29,30]. Constitutive models and equations were developed to explain the hot behavior of 42CrMo4 steel [31,32,33,34,35,36,37,38,39]. Nurnberger et al. studied the microstructure behavior of 42CrMo4 steel during continuous cooling from hot deformation temperatures [40,41,42,43]. Arun S. has studied the influence of the thermomechanical processing of the 40CrMo4 alloy on the mechanical properties [12].
2. Experimental Details
The material used in this study was the commercial steel 42CrMo4, and its chemical compositions are presented in Table 1. The experimental research pursued the study of temperature and strain rate influence on mechanical and structural properties of 42CrMo4 steel. For this purpose, the experimental tests were carried out and included: tensile; compression; hardness; and scanning electronic microscopy (SEM) by using JEOL JMS 5600 LV.
The hot tensile and compression tests were performed on a Heckert type hydraulic press with a maximum force of 200KN (200kN hydraulic Heckert-EDZ-20S testing machine). The hot tensile tests were carried out at temperatures of T=700 °C, T=800 °C, T=900 °C, T=1000 °C, respectively strain rates of 0.0018 s -1, 0.012 s-1, 0.08 s-1.
Tensile specimens were prepared from 18 mm diameter extruded round bars. The geometry and dimensions of the specimen are determined by ASTM standards. The dimensions of the initial tensile specimen are shown in Figure 1.
The hot compression tests were carried out on specimens with dimensions of Ø18 x 30 mm heated to the temperatures T=800 °C, T=900 °C, T=1000 °C, at three strain rates 0.033 s-1, 0.066 s-1, 0.1 s-1. The shape of the initial compression specimen is shown in Figure 2.
3. Experimental Results
3.1. Hot Tensile Behavior
Figure 3, Figure 4, Figure 5 and Figure 6 show the macro morphology of the specimens obtained after the tensile tests under different temperatures and strain rates conditions.
Tensile test specimen tested at 1000 °C from Figure 3 shows ductile fracture. With the increase in strain rates, the necking is more pronounced.
Tensile test specimen tested at 900 °C, Figure 4 and tensile test specimen tested at 800 °C, Figure 5, shows ductile fracture. In Figure 4(a) and Figure 5(a) the neck is very small, and fracture looks more fragile than Figure 4(b), and Figure 4(c). With the increase in strain rates, the necking is more pronounced, Figure 4(c).
Tensile test specimen tested at 700 °C, Figure 6, shows ductile fracture in all strain rates conditions.
Macro fracture morphology under different temperatures and strain rates shows that the ductile fracture behavior can be observed for all deformation conditions, due to the presence of necking localization before fracture.
Figure 7, Figure 8 and Figure 9 show the tensile stress evolution according to the true strain of the specimen for different experimental conditions. The flow curves obtained at different temperatures: 700 °C, 800 °C, 900 °C, 1000 °C and 1100 °C, at strain rate 0.0897 s-1 (Figure 7); at strain rate 0.0128 s-1 (Figure 8); strain rate 0.0018 s-1 (Figure 9). Increasing strain rate was observed also an increased uniformity of curves. At the strain rate of 0.0897 s-1 (Figure 7) and 700 ºC, a maximum tensile stress of 240 N/mm2 more than to the tensile stress 213 N/mm2 at strain rate 0.0128 s-1 (Figure 8), 158 N/mm2, on 0.0018 s-1 strain rate (Figure 9) at the same condition of temperature. At 800 ºC were obtained a maximum tensile stress of 144 N/mm2 (Figure 7) comparative with a maximum tensile stress of 117 N/mm2 (Figure 8) and a maximum tensile stress of 91 N/mm2 (Figure 9). At 900 ºC were obtained a maximum tensile stress of 105 N/mm2 (Figure 7) comparative with a maximum tensile stress of 79 N/mm2 (Figure 8) and a maximum tensile stress of 60.4 N/mm2 (Figure 9). At 1000 ºC were obtained a maximum tensile stress of 71 N/mm2 (Figure 7) comparative with a maximum tensile stress of 52 N/mm2 (Figure 8) and a maximum tensile stress of 37.5 N/mm2 (Figure 9). Similarly, at 1100 ºC were obtained a maximum tensile stress of 48 N/mm2 (Figure 7) comparative with a maximum tensile stress of 35.6 N/mm2 (Figure 8) and a maximum tensile stress of 24.6 N/mm2 (Figure 9). The work hardening and dynamic softening stages can be observed here.
The influence of temperature and strain rate on the maximum ultimate tensile stress is shown in Figure 7, Figure 8 and Figure 9. In all studied deformation conditions by increasing temperature the maximum stress decrease, we have observed.
Along with temperature increase there is a major decrease of stress curves. Along with strain rate increase there is a major increase of stress curves, Figure 10.
The flow stress decreases with the decrease of strain rate and the increase of temperature as can be seen in Figure 9. The explanation for this phenomenon is that the low strain rate leads to a longer time for the accumulation of energy, at the same time the high temperature favours nucleation, the growth of dynamically recrystallized grains and by eliminating the barriers given by the dislocations the flow stress decreases [41,42]. Due to the combined effects of work hardening and softening due to high temperature, the yield stress curves show different hot deformation behaviours of the material. As can be seen in the Figure, at low deformation temperatures (700 °C), the yield stress increases to a maximum value and then monotonously decreases until fracture [23].
The influence of strain rate and temperature on the maximum tensile stress is shown in Figure 10.
The increase in the strain rate leads to the increase in the tensile stress, as can be seen.
3.2. Compression Tests Behavior
The shapes of the specimens resulting from the compression tests for different strain rates and different temperatures are presented in Figure 11, Figure 12 and Figure 13.
The variation of the compression stress according to the true strain for different temperatures and strain rates is presented in Figure 14, Figure 15 and Figure 16. At lower strain rate of 0.33 s-1 (Figure 14) were obtained an expected increase of compression stresses, by increasing the true strain. By increasing the temperature from 800 °C to 1000 °C were obtained lower values of compressing stresses for all values of strain rates. From Figure 15 (0.33 s-1) we observe a slight deviation from this rule, in the range 0-0.15 true strain.
Analyzing the figures, is observed that once the strain rate increases, the true strain is slightly increasing, but this depends on the temperature. Thus, at a temperature of 1000 °C, the higher strain of 0.46 is reached at a strain rate of 0.1 s-1. By increasing the strain rate, the compression stress decreases for the same true strain.
Figure 17, Figure 18 and Figure 19 show the variation curves of the non-uniformity of deformations obtained at different values of the strain rate and temperature.
It can be observed, in all cases, an increase in the non-uniformity of the deformation with the increase in the strain rate.
3.2. Structural Analysis
In order to analyze the influence of temperature and strain rate on structural evolution SEM microscopy images were examined.
Below are presented the images from the scanning electron microscopy made on the tensile tested specimens at different temperatures and strain rates. It was found that with the increase of the temperature at which the test takes place, the formability increases too. At the same time, at a higher magnification, the ductile fracture pattern of the samples can be observed in Figure 20, Figure 21 and Figure 22.
SEM images show classic cup-and-cone fracture surfaces at low magnification (25x) and high magnification (500x) at 700 °C (Figure 20); 900 °C (Figure 21), 1000 °C (Figure 22); (at different strain rates: strain rate (a), (b) 0.001 s-1; (c), (d) strain rate 0.012 s-1; (e), (f) strain rate 0.08 s-1. is presented in Figure 20 and Figure 22 and at 900 °C, Figure 21 at strain rate 0.001 s-1 (a), (b) and (c), (d) strain rate 0.08 s-1).
Ductile fracture characterized by microvoid coalescence (MVC) in the breaking section is describe by all the tensile tests performed. The broken cone-head sample and the images at 500x magnification highlight the agglomeration of dimples in the breaking surface. The intergranular fracture occurs. All fracture surfaces are covered with distinct elongated dimples which indicate the ductile nature of the material at these deformation conditions.
A decohesive embrittlement mechanism is transgranular fracture in the peripheral region [43] extending from the front of the notch, with decohesion developing along the propagation path of a crack likely goes through the matrix lattice only (MLD).
At low values, 0.001 s-1 of strain rate, the cracks are visibly larger Figure 22 (a), (b), compared with 0.012 s-1 Figure 22 (c), (d) and with 0.08 s-1 Figure 22 (e), (f).
The shape of the fracture surfaces indicates the fracture mechanism, which is a ductile one. The fractures occurred perpendicular to the stress direction. As can be seen, the fractures occurred intergranular, dimples can be identified on the break surfaces. Ductile fracture involves the growth and coalescence of voids that lead to the formation of specific formations called dimples.
An advanced decohesive embrittlement is present in the peripheral region at a temperature of 1000 °C under conditions of low strain rate, 0.001 s-1.
The microstructures after the compression tests for different deformation conditions were presented in Figure 23. The SEM images show the microstructure in the longitudinal direction of the specimens subjected to compression.
Following the microscopic analysis, it was observed that after hot plastic deformation, by compression, the structural constituents resulting from cooling in the air from the deformation temperature, are of the ferrite-pearlitic type (very fine pearlite, Figure 23 (b), (d), (f), (g) and (h)) as well as of the bainitic type. Compared to specimen deformed at room temperature, Figure 23 (a), the structure is ferrite-pearlitic type, with a more pronounced elongation perpendicular to the direction of compression, in the case of ferrite, which appears light in colour.
By scanning electron microscope analysis of the surface many lamellas on the fracture surface were found. These lamellas indicated bainitic structures Figure 23 (c), (e), (f), (g), (h), (i) and (j). Figure 23 (j), the structure is predominantly bainitic-pearlitic type, grey and dark coloured.
By analysing the microstructures of samples deformed at different temperatures, with different strain rates, in addition to the presence of pearlite and ferrite, arranged in a network in the case of samples deformed at 800 °C and 900 °C, the presence of formations that have the appearance of upper bainite can be observed.
4. Conclusions
Following the tests, the influence of different parameters of the deformation process (temperature, strain rate, state of stress) on the formability of the 42CrMo4 alloy was studied. The deformation conditions were temperatures (700 °C, 800 °C, 900 °C, 1000 °C) and different strain rates at the two stress states: tensile (0.001833 s-1, 0.012833 s-1, 0.089722 s-1) and compression (0.033 s-1, 0.066 s-1, 0.1 s-1).
As a result of these experimental tests, the following were observed:
1.Tensile stress significantly depends on temperature and strain rate. Yield stress increases by increasing strain rate and decreases by increasing temperature.
2.Dynamic restoration (DRV) and dynamic recrystallization (DRX) have enough time to occur at low strain rates. so that the effect of work hardening is removed, which leads to the reduction of the stress necessary for deformation.
3.The experimental curves show typical characteristics that demonstrate the presence of dynamic recrystallization at high temperatures and low strain rates. At the deformation temperature of 800 °C, 900 °C, 1000 °C, when the balance between hardening and dynamic recovery takes place, the flow curves show a steady phase, in which the flow stress is approximately constant.
4. In case of compression tests is observed that once the strain rate increases, the true strain is slightly increasing, depending on temperature. The greatest non-uniformity of the deformations is observed in the case of the temperature of 1000 °C. By increasing the deformation speed, the non-uniformity of the deformations increases.
5. Scanning electron microscopy investigations demonstrate the influence of temperature and strain rate on the formability and structural change of the material.
Author Contributions
Conceptualization, M.P. and I.M.S.B; methodology, M.P.; software, F.P. and I.M.S.B.; validation, M.P. and I.M.S.B.; formal analysis, M.P. and I.M.S.B.; investigation, M.P., I.M.S.B and F.P.; resources, M.P., I.M.S.B and F.P.; data curation, M.P. and I.M.S.B.; writing—original draft preparation, M.P. and I.M.S.B.; writing—review and editing, M.P. and I.M.S.B.; visualization, M.P., I.M.S.B. and F.P.;; supervision, M.P. and I.M.S.B.; funding acquisition, M.P. and I.M.S.B. All authors have read and agreed to the published version of the manuscript.
Funding
This research received no external funding.
Conflicts of Interest
The authors declare no conflict of interest.
References
- Karadeniz, E. Influence of different initial microstructure on the process of spheroidization in cold forging. Materials Design 2008, 29, 251–256. [Google Scholar] [CrossRef]
- Chaouch, D.; Guessasma, S.; Sadok, A. Finite Element simulation coupled to optimisation stochastic process to assess the effect of heat treatment on the mechanical properties of 42CrMo4 steel. Materials and Design 2012, 34, 679–684. [Google Scholar] [CrossRef]
- Arivazhagan, N.; Singh, S.; Prakash, S.; Reddy, G.M. An assessment of hardness, impact strength, and hot corrosion behaviour of friction-welded dissimilar weldments between AISI 4140 and AISI 304. Int J Adv Manuf Technol 2008, 39, 679–689. [Google Scholar] [CrossRef]
- Demir, T.; Ubeyli, M.; Yildrim, R.O. Investigation on the ballistic impact behaviour of various alloys against 7.62 mm armour piercing projectile. Materials Design 2008, 29, 2009–2016. [Google Scholar] [CrossRef]
- Rodriguez, E.; Flores, M.; Perez, A.; Mercado-Solis, R.D.; González, R.; Rodríguez, J.; González López, J.R.; Rodriguez, J.; Valtierra, S. Erosive wear by silica sand on AISI H13 and 4140 steels. Wear 2009, 267, 2109–2115. [Google Scholar] [CrossRef]
- Cristea, A.F.; Haragâş, S. The lubricants influence in transmission of vibration and noises from aluminium injection machines. Proceedings of The Romanian Academy, Series A 2017, 19, 77–84. [Google Scholar]
- Sas-Boca, I.M.; Frunza, D.; Popa, F.; Ilutiu-Varvara, D.A.; Tintelecan, M.C. Influence of Temperature and Strain Rate on Microstructure and Fracture Mechanism of Mild Steel. Procedia Manufacturing 2020, 46, 891–898. [Google Scholar] [CrossRef]
- Ilhan, E.; Findik, F.; Aslanlar, S. An investigation of the factors affecting the design of drum dryers. Mater Des 2003, 24, 503–507. [Google Scholar] [CrossRef]
- Nouari, M.; Molinari, A. Experimental verification of a diffusion tool wear model using a 42CrMo4 steel with an uncoated cemented tungsten carbide at various cutting speeds. Wear 2005, 259, 1151–1159. [Google Scholar] [CrossRef]
- Starke, P.; Walther, F.; Eifler, D. New fatigue life calculation method for quenched and tempered steel SAE 4140. Mater Sci Eng A 2009, 523, 246–252. [Google Scholar] [CrossRef]
- Lin, Y.C.; Chen, M.S.; Zhong, J. Microstructural evolution in 42CrMo steel during compression at elevated temperatures. Mater Lett 2008, 62, 2136–2139. [Google Scholar] [CrossRef]
- Arun, S.; Thakare, A.S.; Butee, S.P.; Kamble, K.R. Improvement in Mechanical Properties of 42CrMo4 Steel Through Novel Thermomechanical Processing Treatment. Metallography, Microstructure, and Analysis 2020, 9, 759–773. [Google Scholar] [CrossRef]
- Miokovic, T.; Schulze, V.; Vohringer, O.; Lohe, D. Prediction of phase transformations during laser surface hardening of AISI 4140 including the effects of inhomogeneous austenite formation. Mater Sci Eng A 2006, 435– 436, 547–555. [Google Scholar] [CrossRef]
- Nikitin, I.; Besel, M. Correlation between residual stress and plastic strain amplitude during low cycle fatigue of mechanicallysurface treated austenitic stainless steel AISI 304 and ferritic–pearlitic steel SAE 1045. Mater Sci Eng A 2008, 491, 297–303. [Google Scholar] [CrossRef]
- Pop, M.; Frunza, D.; Popa, F.; Neag, A. Aspects Regarding the Hot Fracture Behavior of 42CrMo4 Alloy. Roumanian Journal of Phisycs 2017, 62, 1–13. [Google Scholar]
- Pop, M.; Neag, A.; Frunza, D.; Popa, F. Thermomechanical study on 42CrMo4 steel formability, Acta Technica Napocensis. Applied Mathematics, Mechanics 2019, 62, 287–294. [Google Scholar]
- Lin, Y.C.; Chen, M.S.; Zhong, J. Constitutive modeling for elevated temperature flow behavior of 42CrMo steel. Comput Mater Sci 2008, 42, 470–477. [Google Scholar] [CrossRef]
- Lin, Y.C.; Chen, M.S.; Zhong, J. Prediction of 42CrMo steel flow stress at high temperature and strain rate. Mech Res Commun 2008, 35, 142–150. [Google Scholar] [CrossRef]
- Totik, Y.; Sadeler, R.; Kaymaz, I. Hot workability of AISI 4140 steel with hot torsion test. J Mech Behav Mater 2002, 13, 65–72. [Google Scholar]
- Lin, Y.C.; Chen, M.S.; Zhong, J. Effect of temperature and strain rate on the compressive deformation behavior of 42CrMo steel. J Mater Process Technol 2008, 205, 308–315. [Google Scholar] [CrossRef]
- Lin, Y.C.; Zhang, J.; Zhong, J. Application of neural networks to predict the elevated temperature flow behavior of a low alloy steel. Comput Mater Sci. 2008, 43(4), 752–758. [Google Scholar] [CrossRef]
- Quan, G.Z.; Zhao, L.; Chen, T.; Wang, Y.; Mao, Y.P.; Lv, W.Q.; Zhou, J. Identification for the optimal working parameters of as-extruded 42CrMo high-strength steel from a large range of strain, strain rate and temperature. Mater Sci Eng A 2012, 538, 364–373. [Google Scholar] [CrossRef]
- Quan, G.Z.; Wang, Y.; Liu, Y.Y.; Zhou, J. Effect of Temperatures and Strain Rates on the Average Size of Grains Refined by Dynamic Recrystallization for as-extruded 42CrMo Steel. Mater. Res. 2013, 16, 1092–1105. [Google Scholar] [CrossRef]
- Huang, Y.C.; Lin, Y.C.; Deng, J.; Liu, G.; Chen, M.S. Hot tensile deformation behaviors and constitutive model of 42CrMo steel. Materials and Design 2014, 53, 349–356. [Google Scholar] [CrossRef]
- Quan, G.Z.; Li, G.S.; Chen, T.; Wang, Y.X.; Zhang, Y.W.; Zhou, J. Dynamic recrystallization kinetics of 42CrMo steel during compression at different temperatures and strain rates. Mater Sci Eng A 2011, 528, 4643–4651. [Google Scholar] [CrossRef]
- Chen, M.S.; Lin, Y.C.; Ma, X.S. The kinetics of dynamic recrystallization of 42CrMo steel. Mater Sci Eng A 2012, 556, 260–266. [Google Scholar] [CrossRef]
- Yang, D.; Chen, W.; Zhou, R.; Wang, S.; Ma, Y.; Zan, X.; Peng, L. Microstructure evolution of dynamic recrystallizatin of 42CrMo steel during multi-stage forging by FEM. App Mech Mater 2012, 217–219, 415–418. [Google Scholar] [CrossRef]
- Lin, Y.C.; Chen, M.S.; Zhong, J. Study of Static Recrystallization Kinetics in a Low Alloy Steel. Comput. Mater. Sci. 2008, 44, 316–321. [Google Scholar] [CrossRef]
- Lin, Y.C.; Chen, M.S.; Zhong, J. Study of Metadynamic Recrystallization Behaviors in a Low Alloy Steel. J. Mater. Process. Technol. 2009, 209, 2477–2482. [Google Scholar] [CrossRef]
- Lin, Y.C.; Liu, Y.X.; Liu, G.; Chen, M.S.; Huang, Y.C. Prediction of Ductile Fracture Behaviors for 42CrMo Steel at Elevated Temperatures. JMEPEG 2015, 24, 221–228. [Google Scholar] [CrossRef]
- Li, Y.Y.; Zhao, S.D.; Fan, S.Q.; Zhong, B. Plastic Properties and Constitutive Equations of 42CrMo Steel During Warm Forming Process. Mater. Sci. Technol. 2014, 30, 645–652. [Google Scholar] [CrossRef]
- Huang, Y.C.; Lin, Y.C.; Deng, J.; Liu, G.; Chen, M.S. Hot tensile deformation behaviors and constitutive model of 42CrMo steel. Materials & Design 2014, 53, 349–356. [Google Scholar] [CrossRef]
- Lin, Y.C.; Chen, X.M. A crtitical review of experimental results and constitutive descriptions for metals and alloys in hot working. Mater Des 2011, 32, 1733–1759. [Google Scholar] [CrossRef]
- Zhu, Z.; Lu, Y.; Xie, Q.; Li, D.; Gao, N. Mechanical properties and dynamic constitutive model of 42CrMo steel. Materials and Design 2017, 119, 171–179. [Google Scholar] [CrossRef]
- Kim, S.I.; Lee, Y.; Byon, S.M. Study on constitutive relation of AISI4140 steel subject to large strain at elevated temperatures. J. Mater. Process. Technol. 2003, 140, 84–89. [Google Scholar] [CrossRef]
- Sheng, Z.Q.; Shivpuri, R. Modeling flow stress of magnesium alloys at elevated temperature. Mater. Sci. Eng. A 2006, 419, 202–208. [Google Scholar] [CrossRef]
- Lu, Y.; Zhu, Z.; Li, D.; Xie, Q. Constitutive model of 42CrMo steel under a wide range of strain rates based on crystal plasticity theory. Materials Science & Engineering A 2017, 679, 215–222. [Google Scholar] [CrossRef]
- Kimm, J.S.; Bergmann, J.A.; Woste, F.; Pohl, F.; Wiederkehr, P.; Theisen, W. Deformation behavior of 42CrMo4 over a wide range of temperatures and strain rates in Split-Hopkinson pressure bar tests. Materials Science & Engineering A 2021, 826. [Google Scholar] [CrossRef]
- Nurnberger, F.; Grydin, O.; Yu, Z.; Schaper, M. Microstructural behavior of tempering Steels during precision forging and quenching from hot-forming temperatures. Metall. Min. Ind. 2011, 3(7), 79–86. [Google Scholar]
- Nurnberger, F.; Grydin, O.; Schaper, M.; Bach, F.W.; Koczurklewicz, B.; Milenin, A. Microstructure transformations in tempering steels during continuous cooling from hot forging temperatures. Steel Res. Int. 2010, 81, 224–233. [Google Scholar] [CrossRef]
- Momeni, A.; Dehghani, K. Prediction of dynamic recrystallization kinetics and grain size for 410 martensitic stainless steel during hot deformation. Met Mater Int 2010, 16, 843–849. [Google Scholar] [CrossRef]
- Mirzaee, M.; Keshmiri, H.; Ebrahimi, G.R.; Momeni, A. Dynamic recrystallization and precipitation in low carbon low alloy steel 26NiCrMoV 14–5. Mater Sci Eng A 2012, 551, 25–31. [Google Scholar] [CrossRef]
- Arniella, V.; Zafra, A.; Álvarez, G.; Belzunce, J.; Rodríguez, C. Comparative study of embrittlement of quenched and tempered steels in hydrogen environments. International Journal of Hydrogen Energy 2022, 47, 17056–17068. [Google Scholar] [CrossRef]
Figure 1.
Dimension of the tensile specimen.
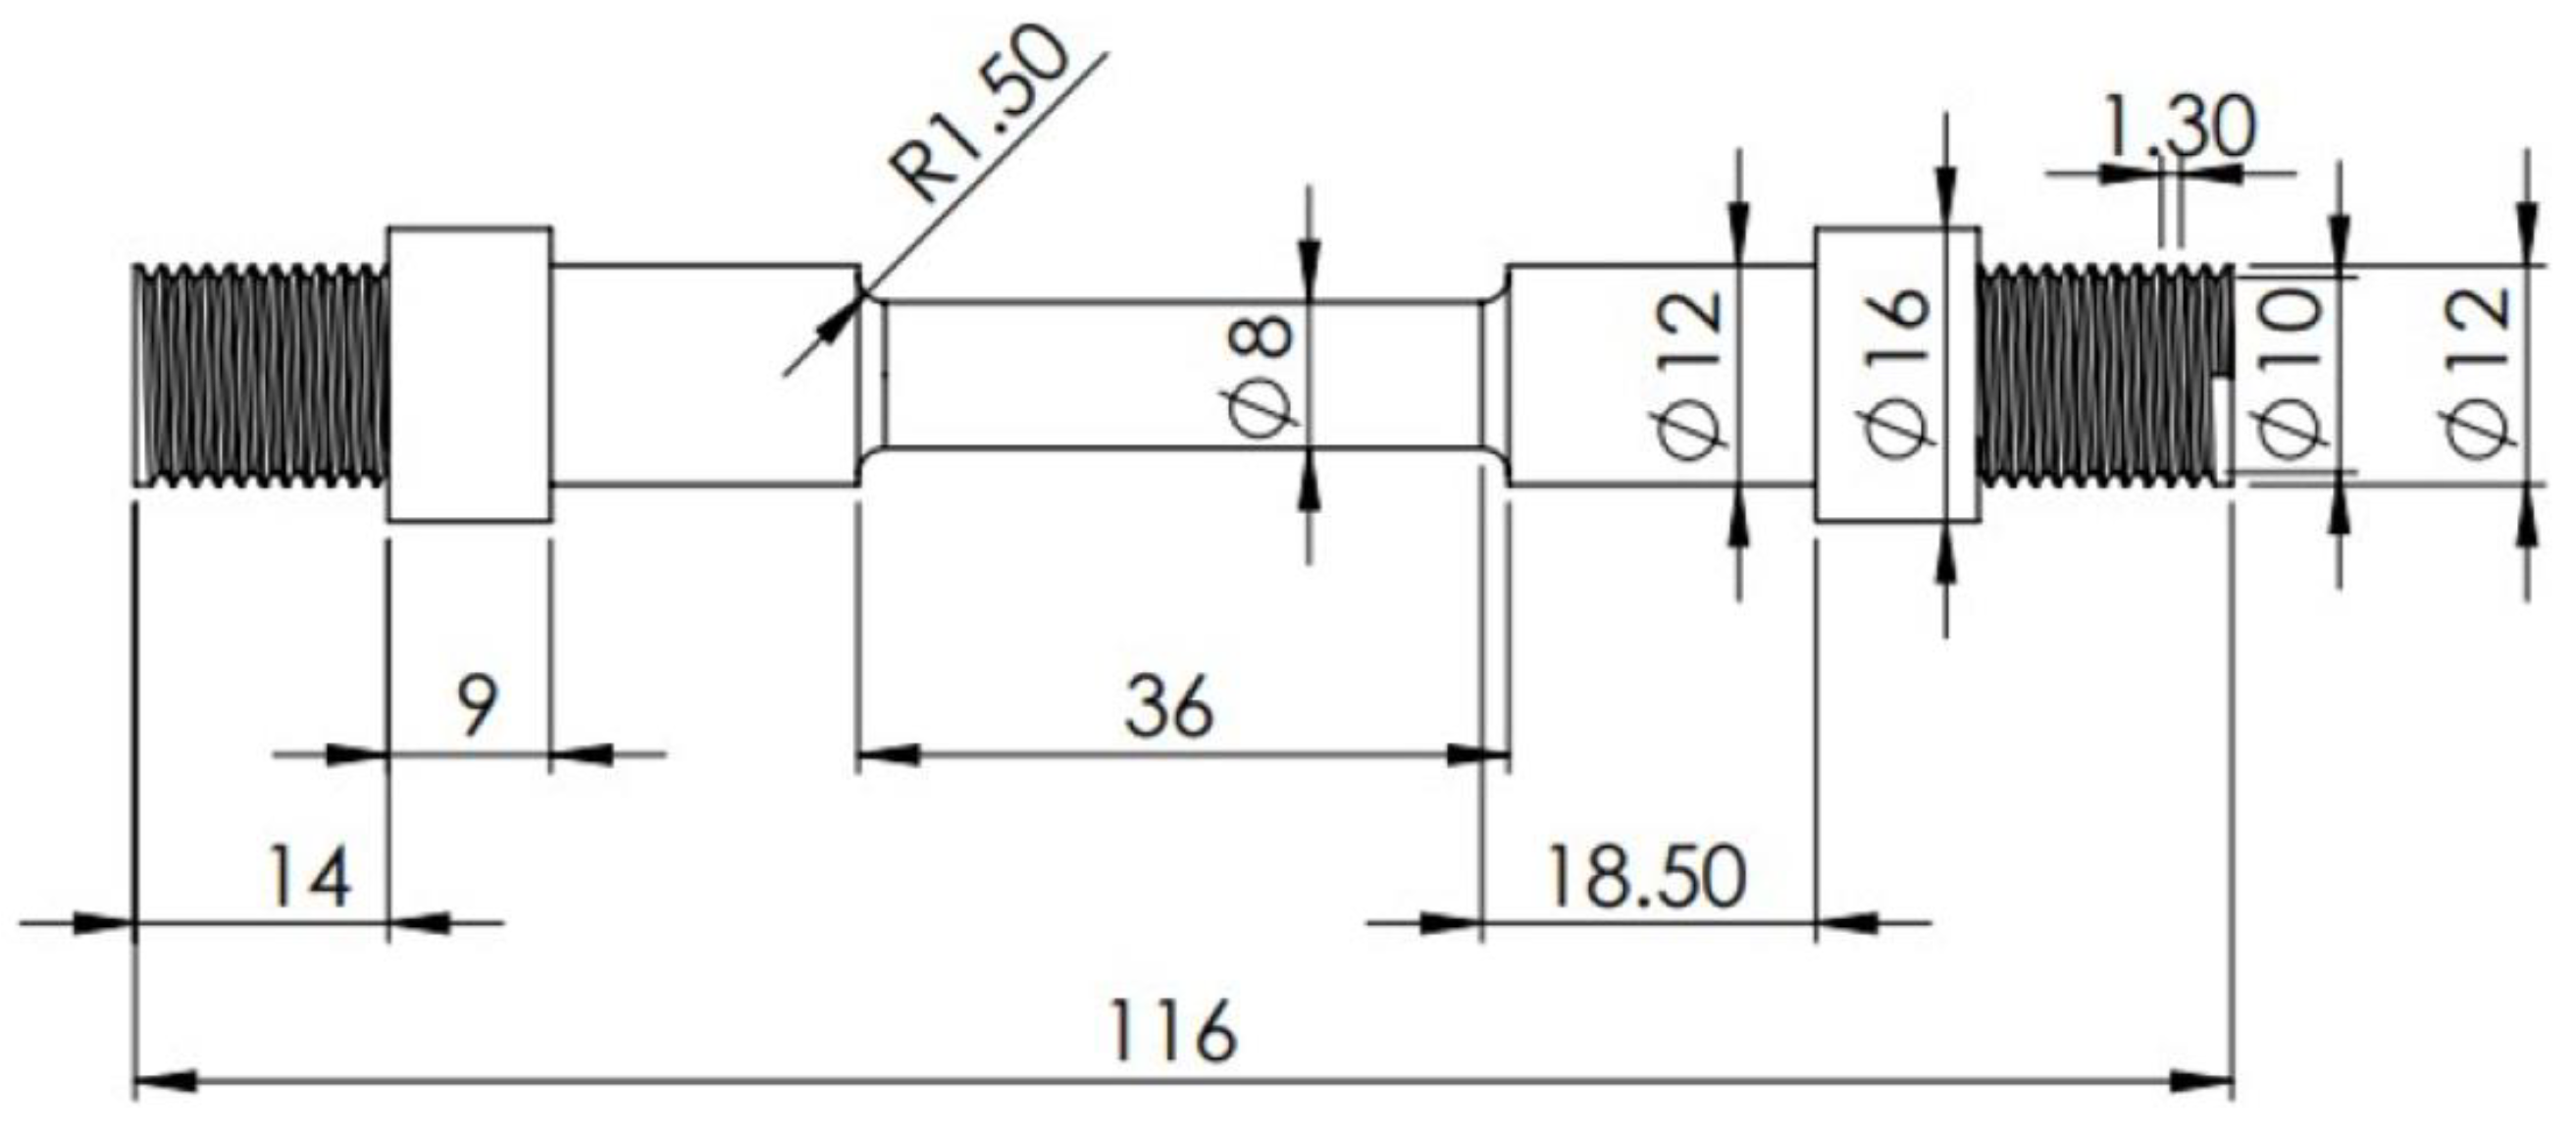
Figure 2.
Compression test specimen.
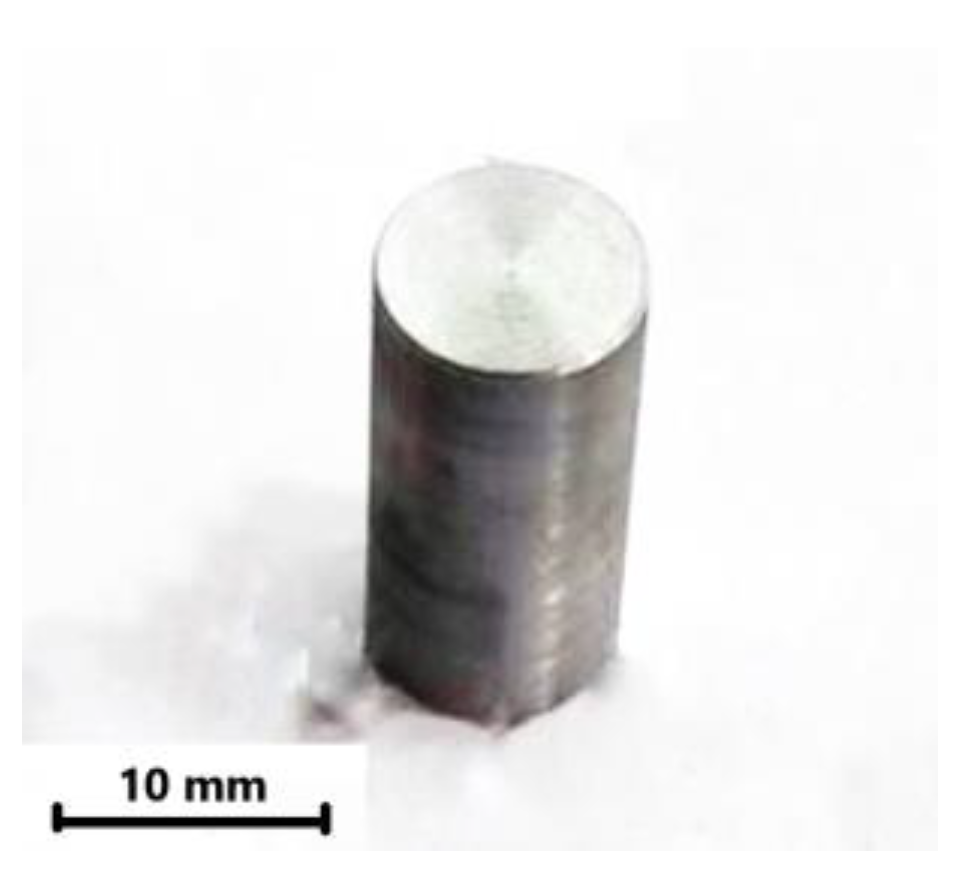
Figure 3.
Tensile tests at T=1000 °C and strain rates conditions: (a) ε ̇= 0.001833 s-1; (b) ε ̇= 0.012833 s-1; (c) ε ̇= 0.089722 s-1.
Figure 3.
Tensile tests at T=1000 °C and strain rates conditions: (a) ε ̇= 0.001833 s-1; (b) ε ̇= 0.012833 s-1; (c) ε ̇= 0.089722 s-1.
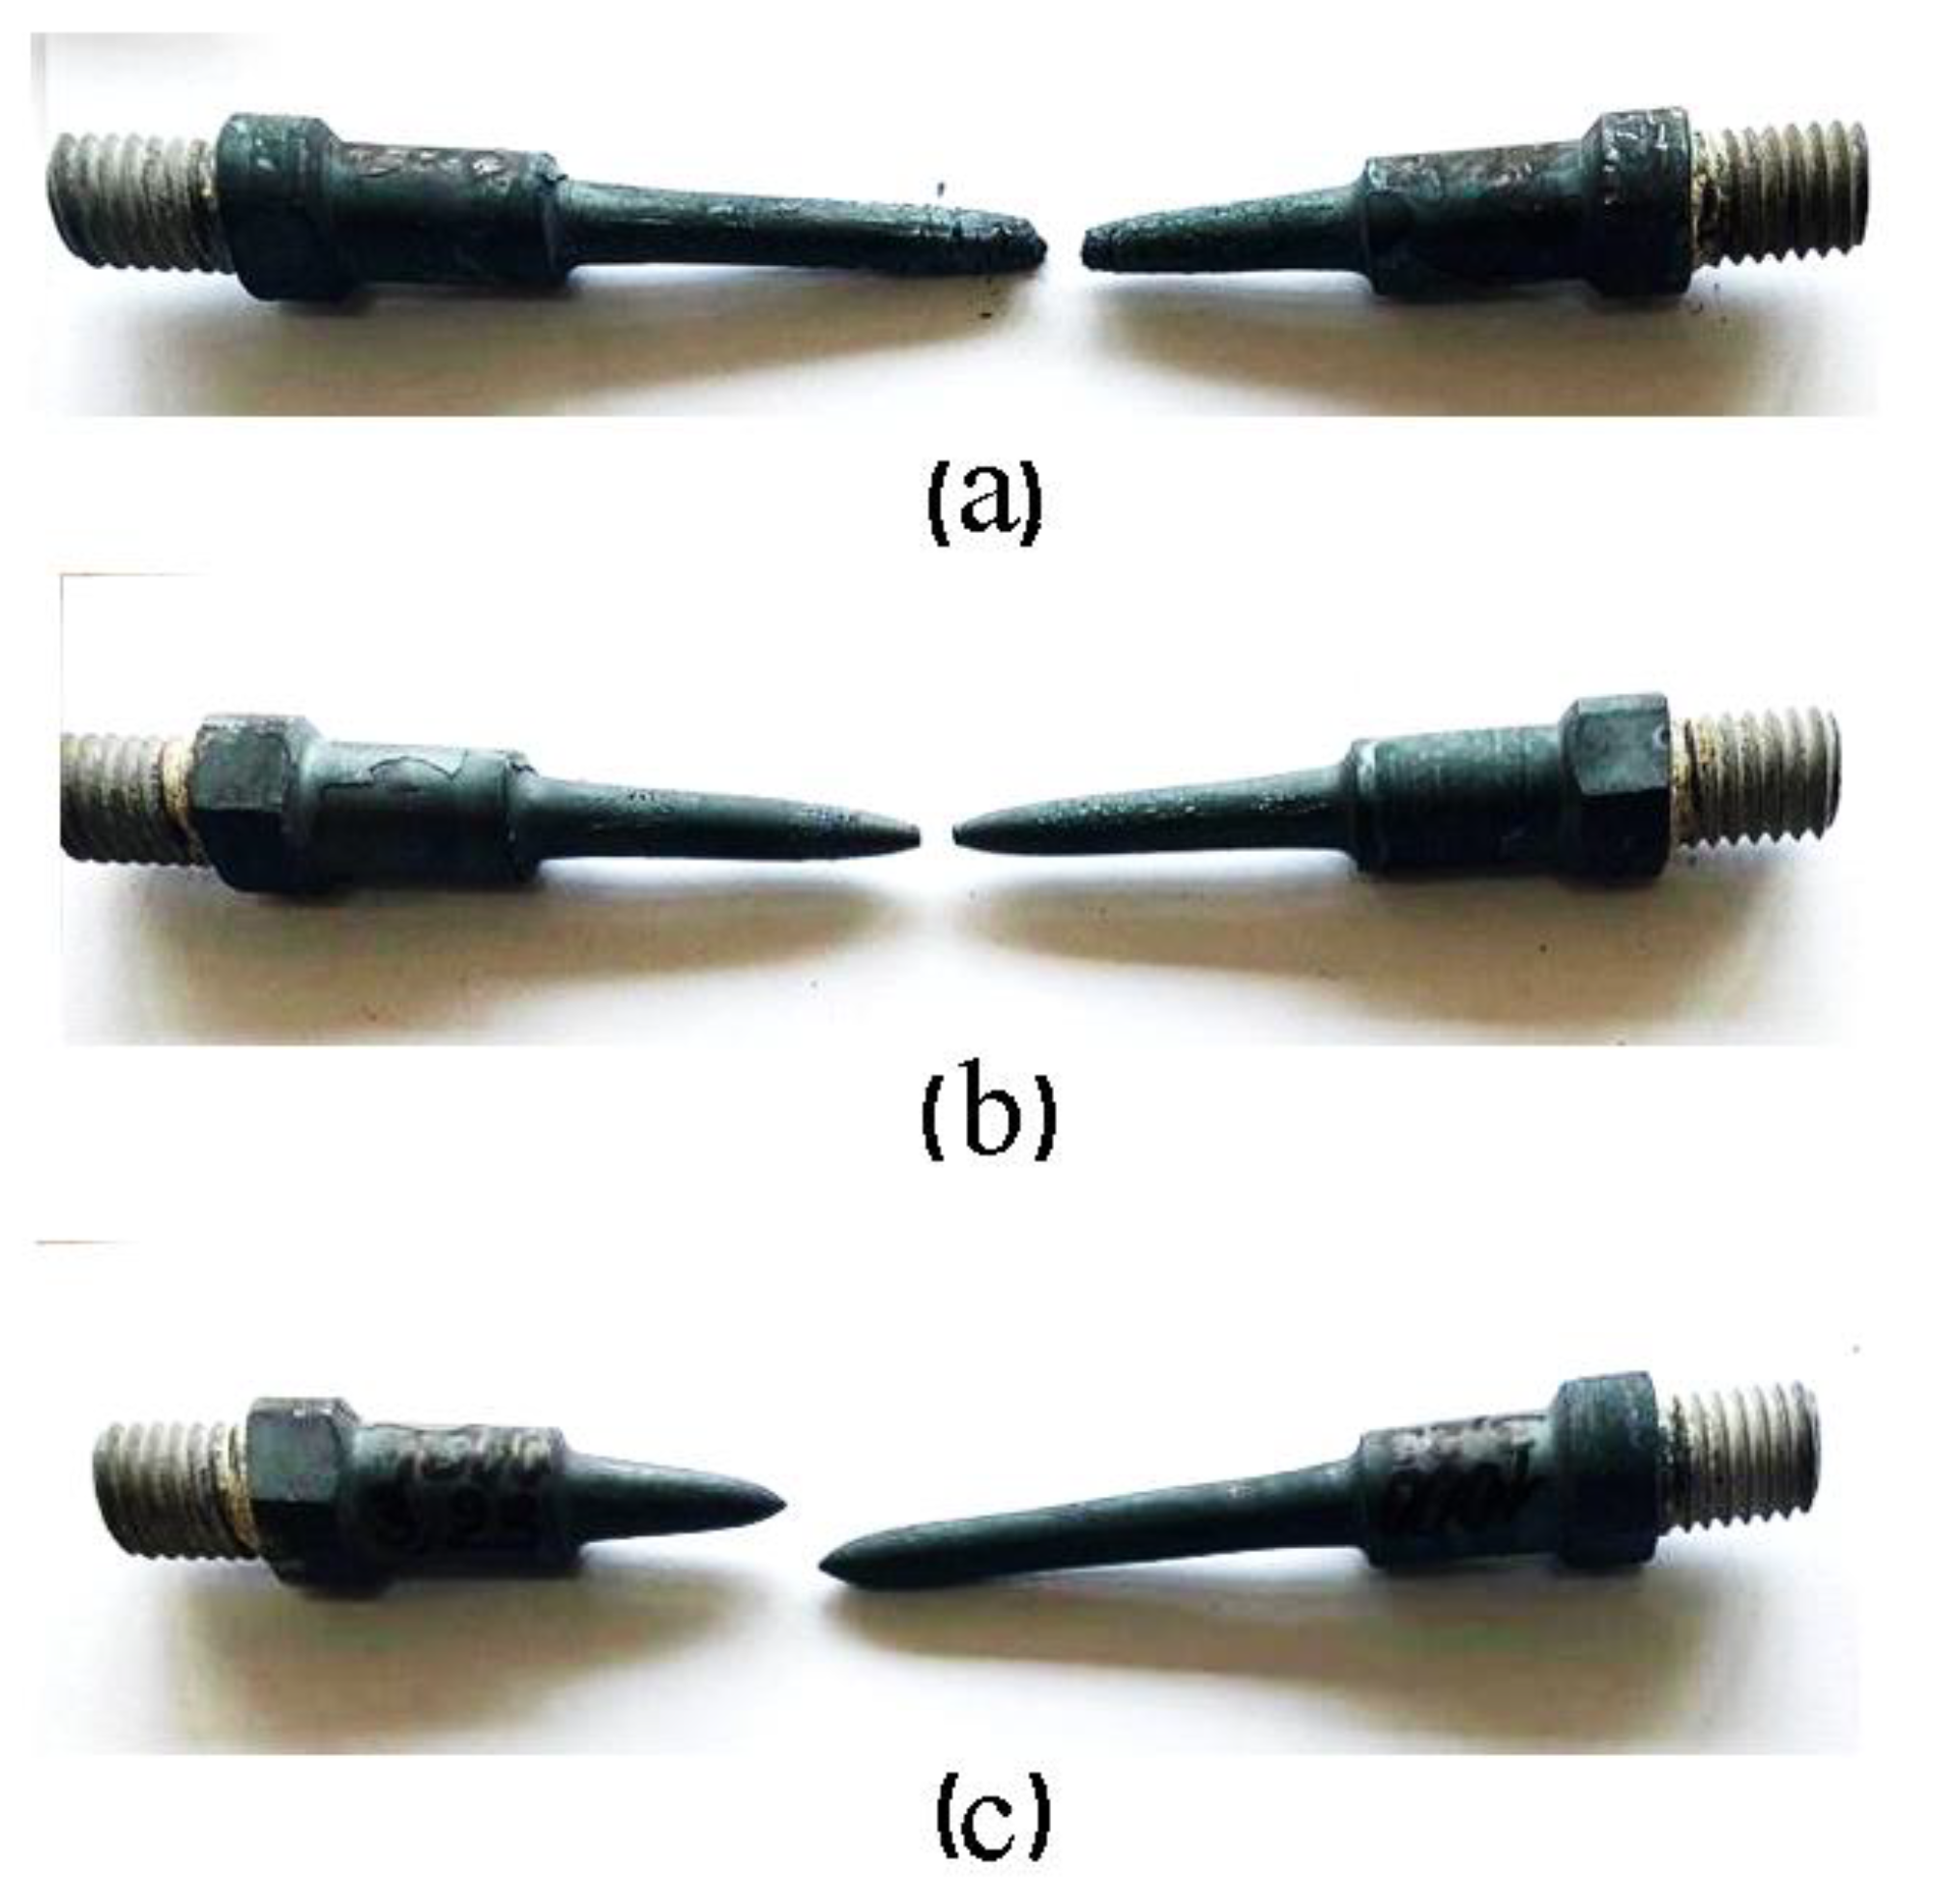
Figure 4.
Tensile tests at T=900 °C and strain rates conditions: (a) ε ̇= 0.001833 s-1; (b) ε ̇= 0.012833 s-1; (c) ε ̇= 0.089722 s-1.
Figure 4.
Tensile tests at T=900 °C and strain rates conditions: (a) ε ̇= 0.001833 s-1; (b) ε ̇= 0.012833 s-1; (c) ε ̇= 0.089722 s-1.
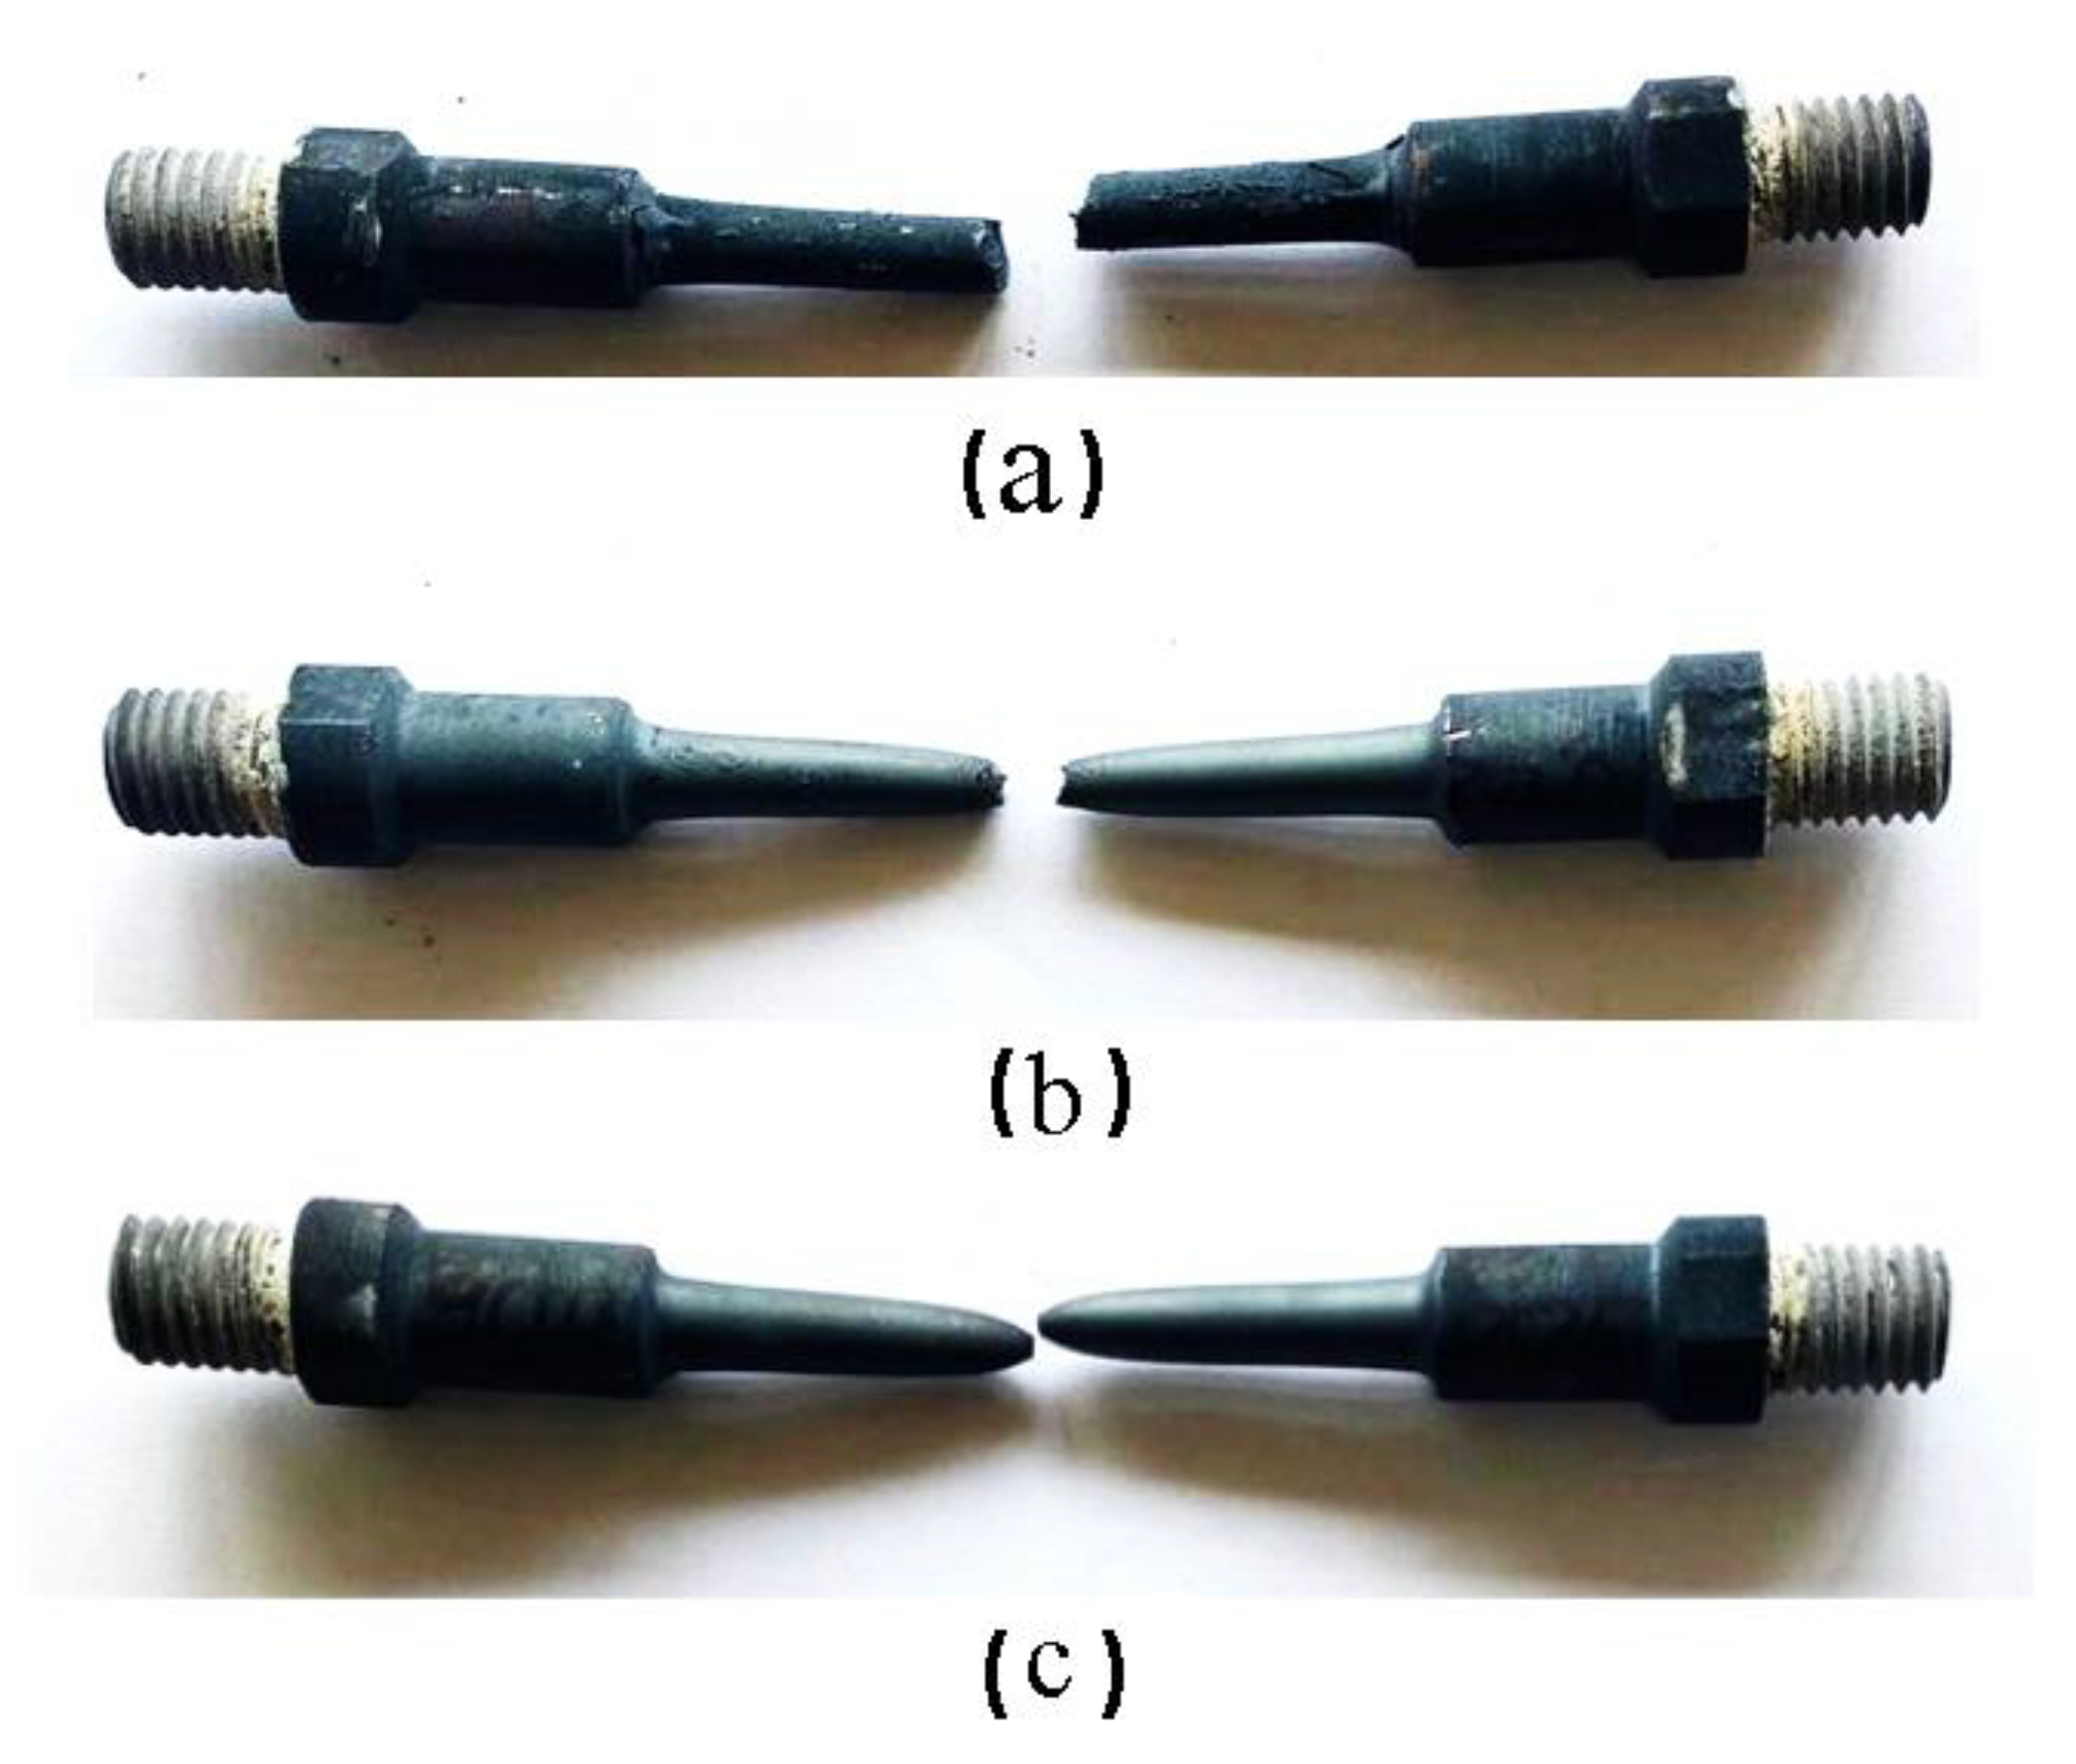
Figure 5.
Tensile tests at T=800 °C and strain rates conditions: (a) ε ̇= 0.001833 s-1; (b) ε ̇ = 0.012833 s-1; (c) ε ̇= 0.089722 s-1.
Figure 5.
Tensile tests at T=800 °C and strain rates conditions: (a) ε ̇= 0.001833 s-1; (b) ε ̇ = 0.012833 s-1; (c) ε ̇= 0.089722 s-1.
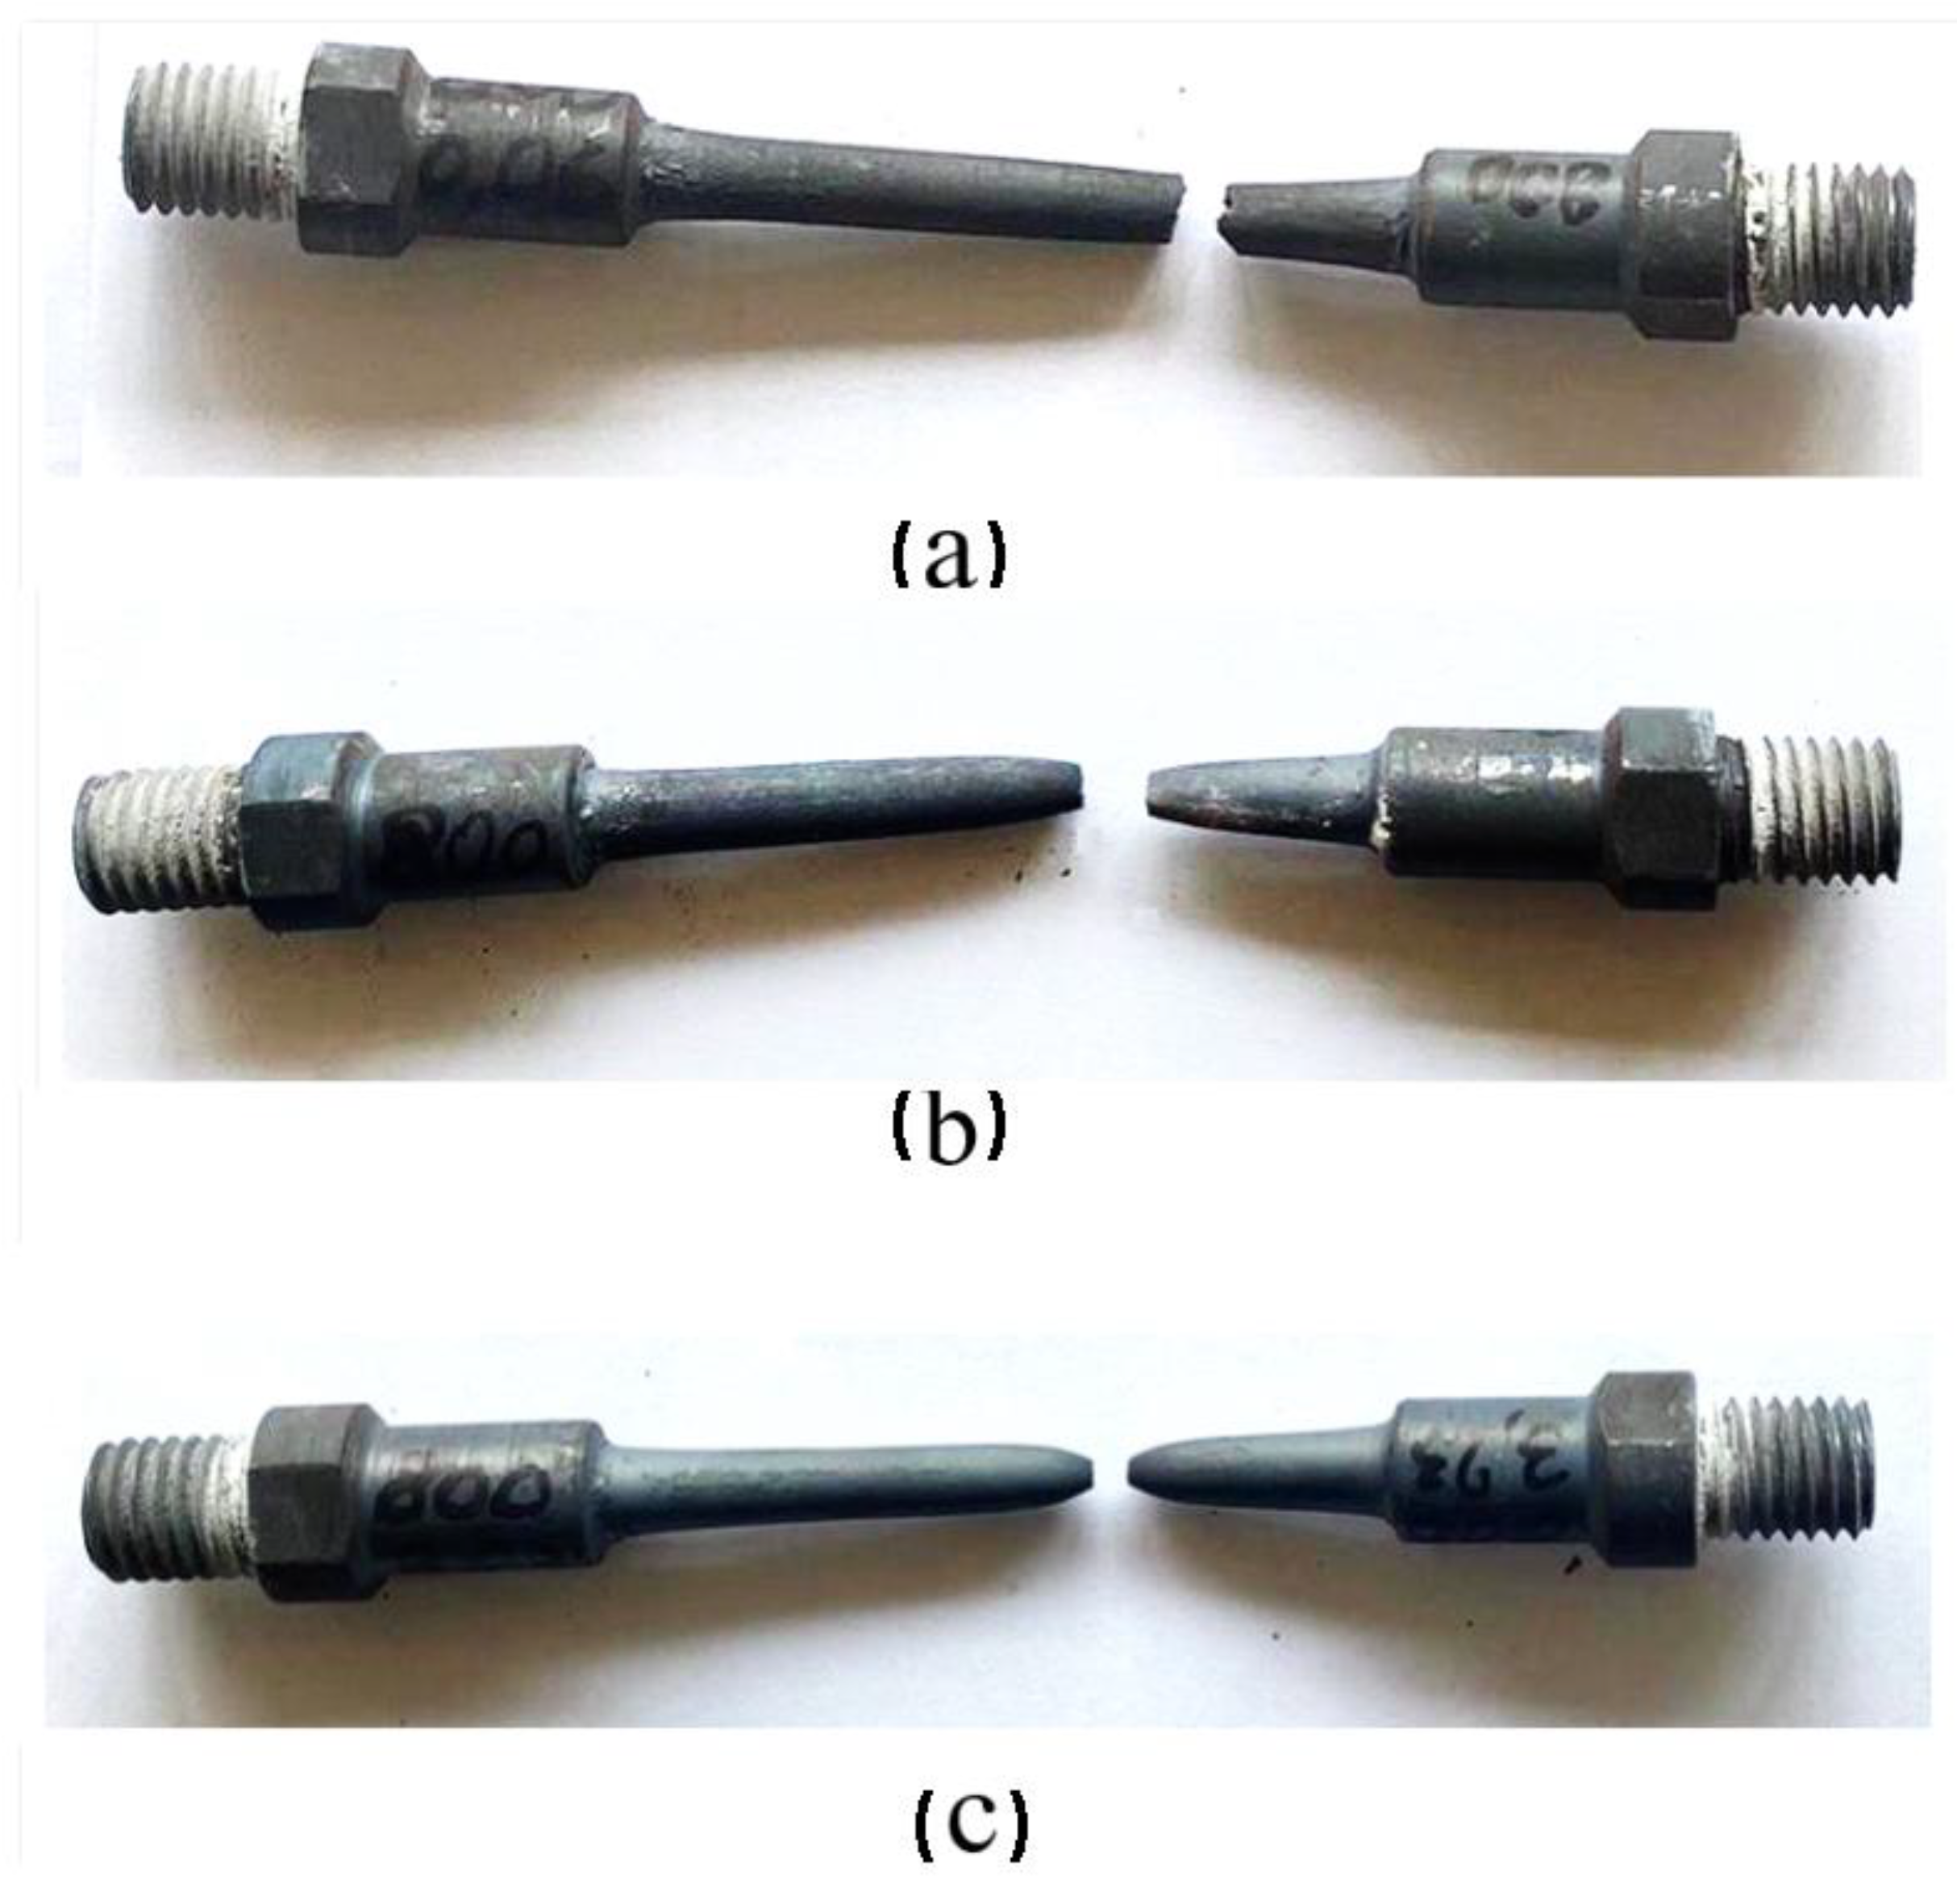
Figure 6.
Tensile tests at T=700 °C and strain rates conditions: (a) ε ̇= 0.001833 s-1; (b) ε ̇= 0.012833 s-1; (c) ε ̇= 0.089722 s-1.
Figure 6.
Tensile tests at T=700 °C and strain rates conditions: (a) ε ̇= 0.001833 s-1; (b) ε ̇= 0.012833 s-1; (c) ε ̇= 0.089722 s-1.
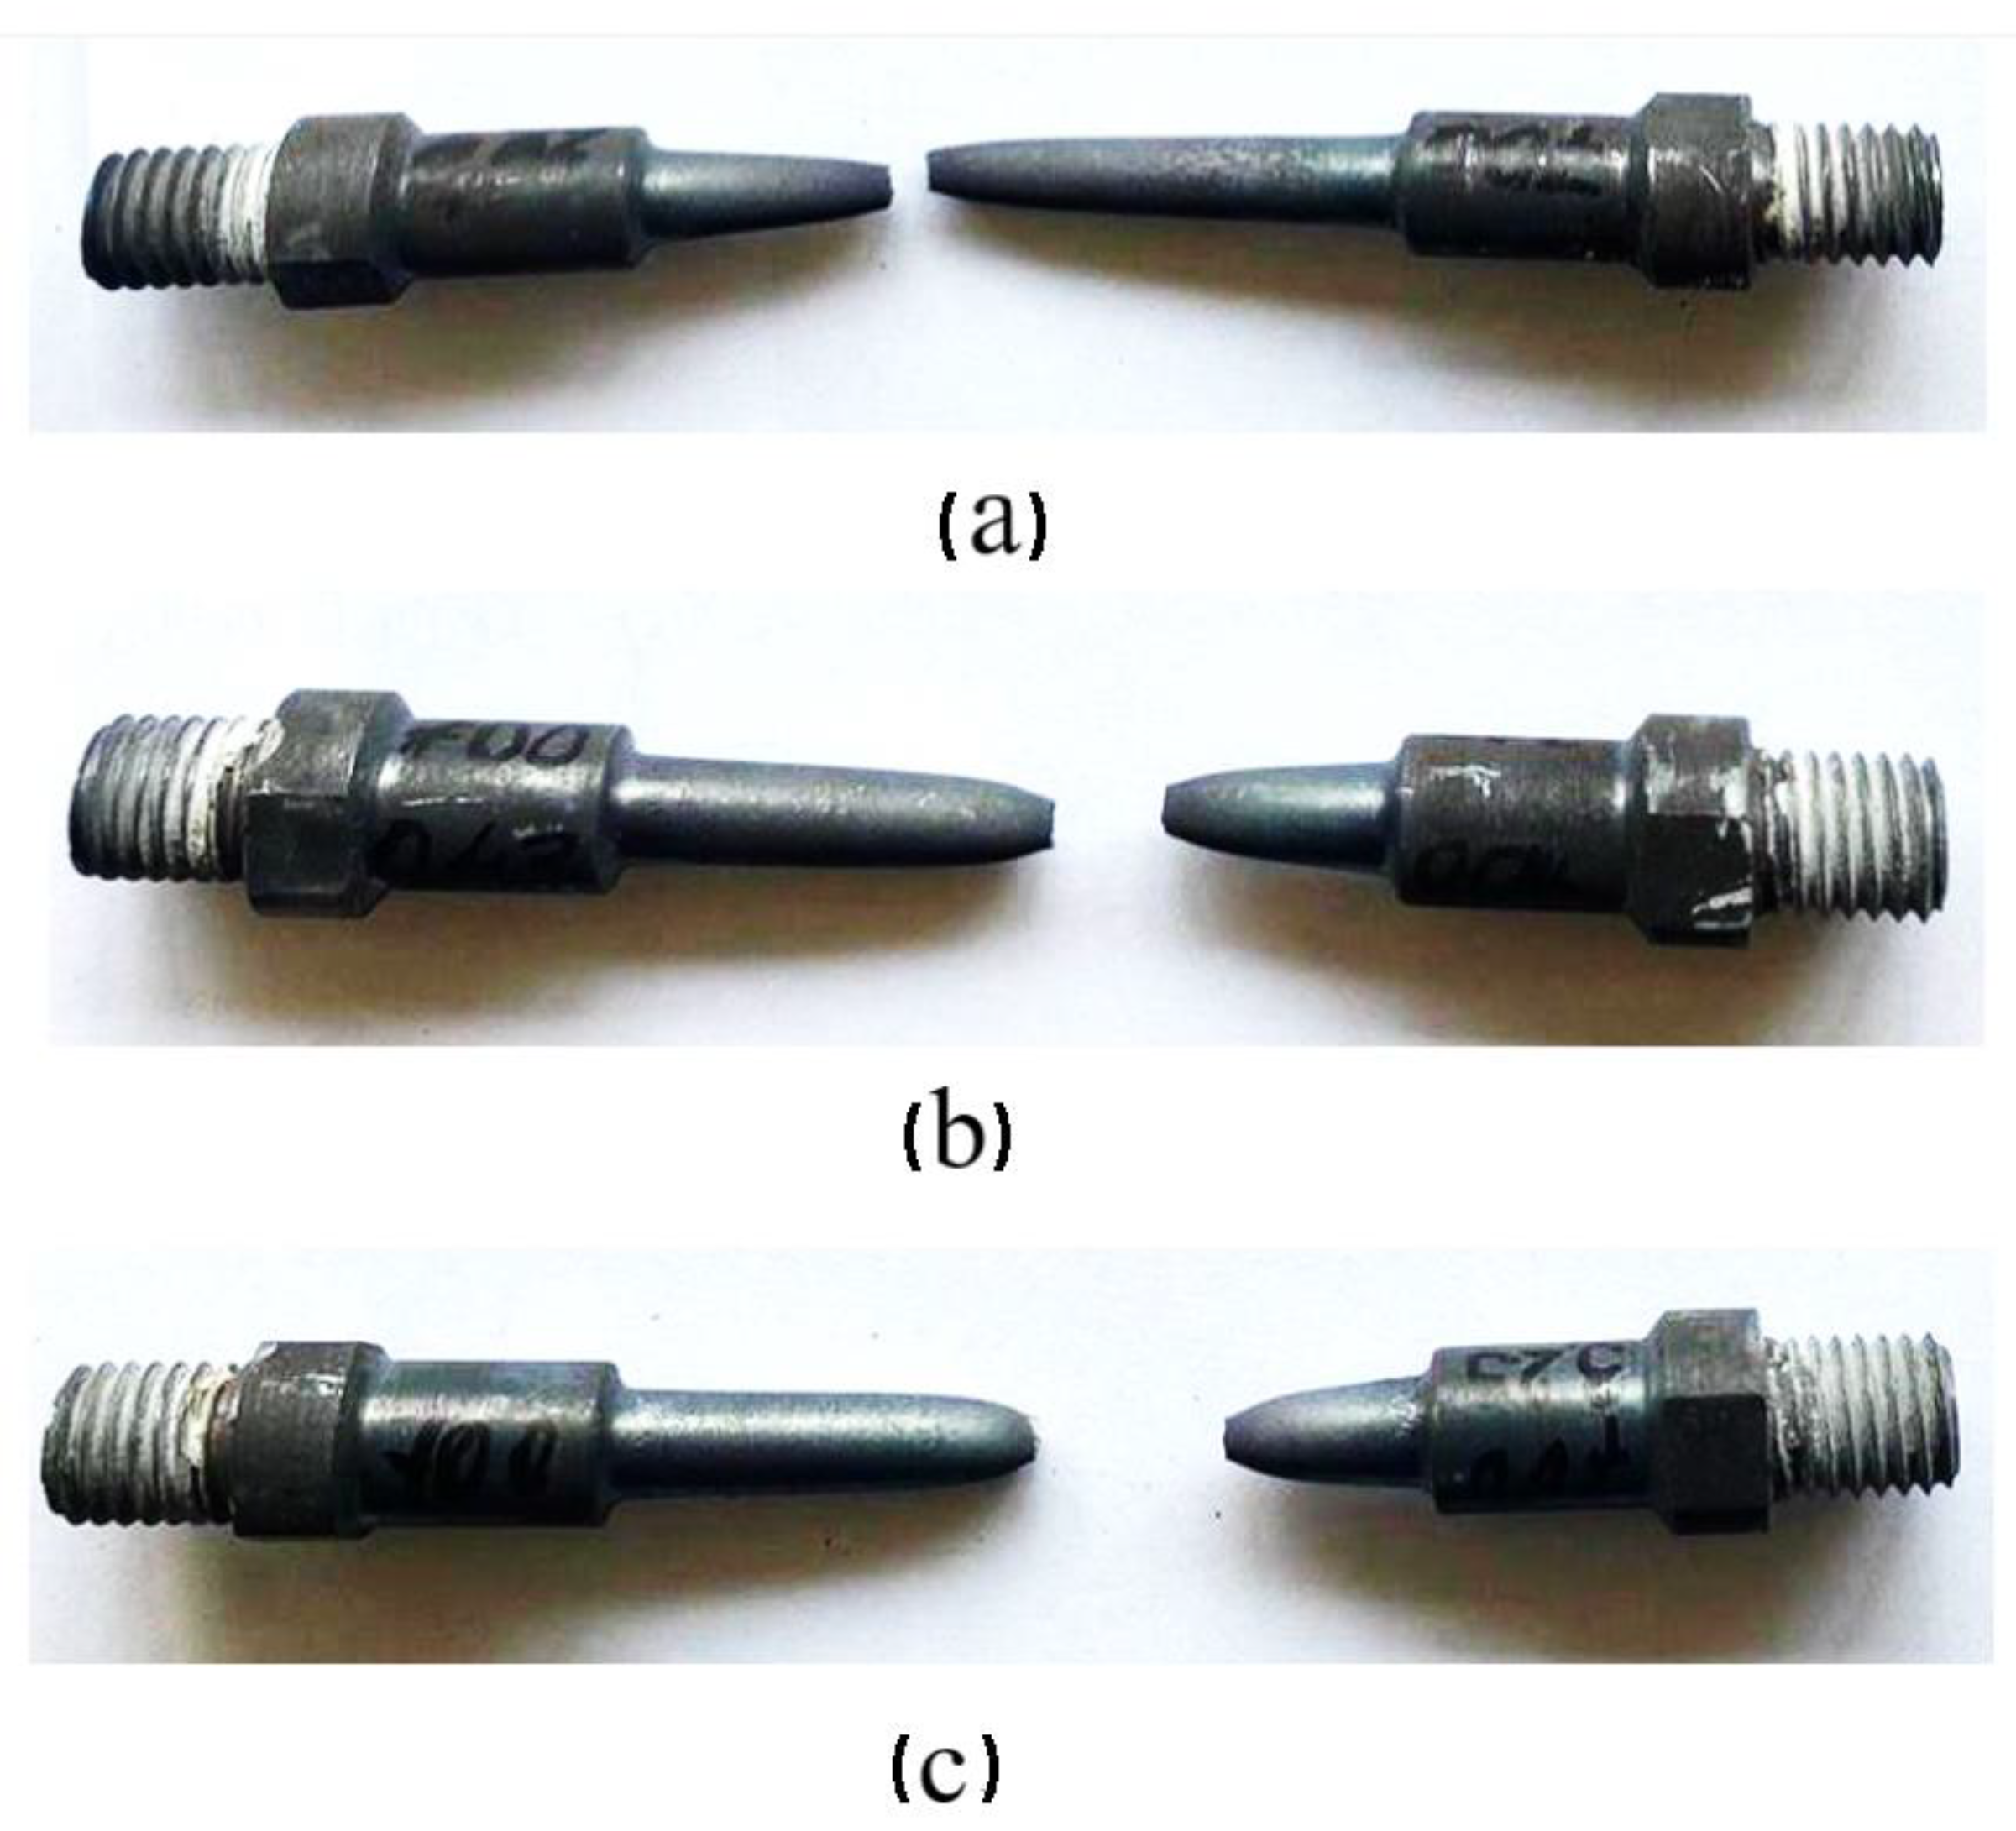
Figure 7.
Variation of tensile stress as a function of true strain, at strain rate of 0.0897 s-1.
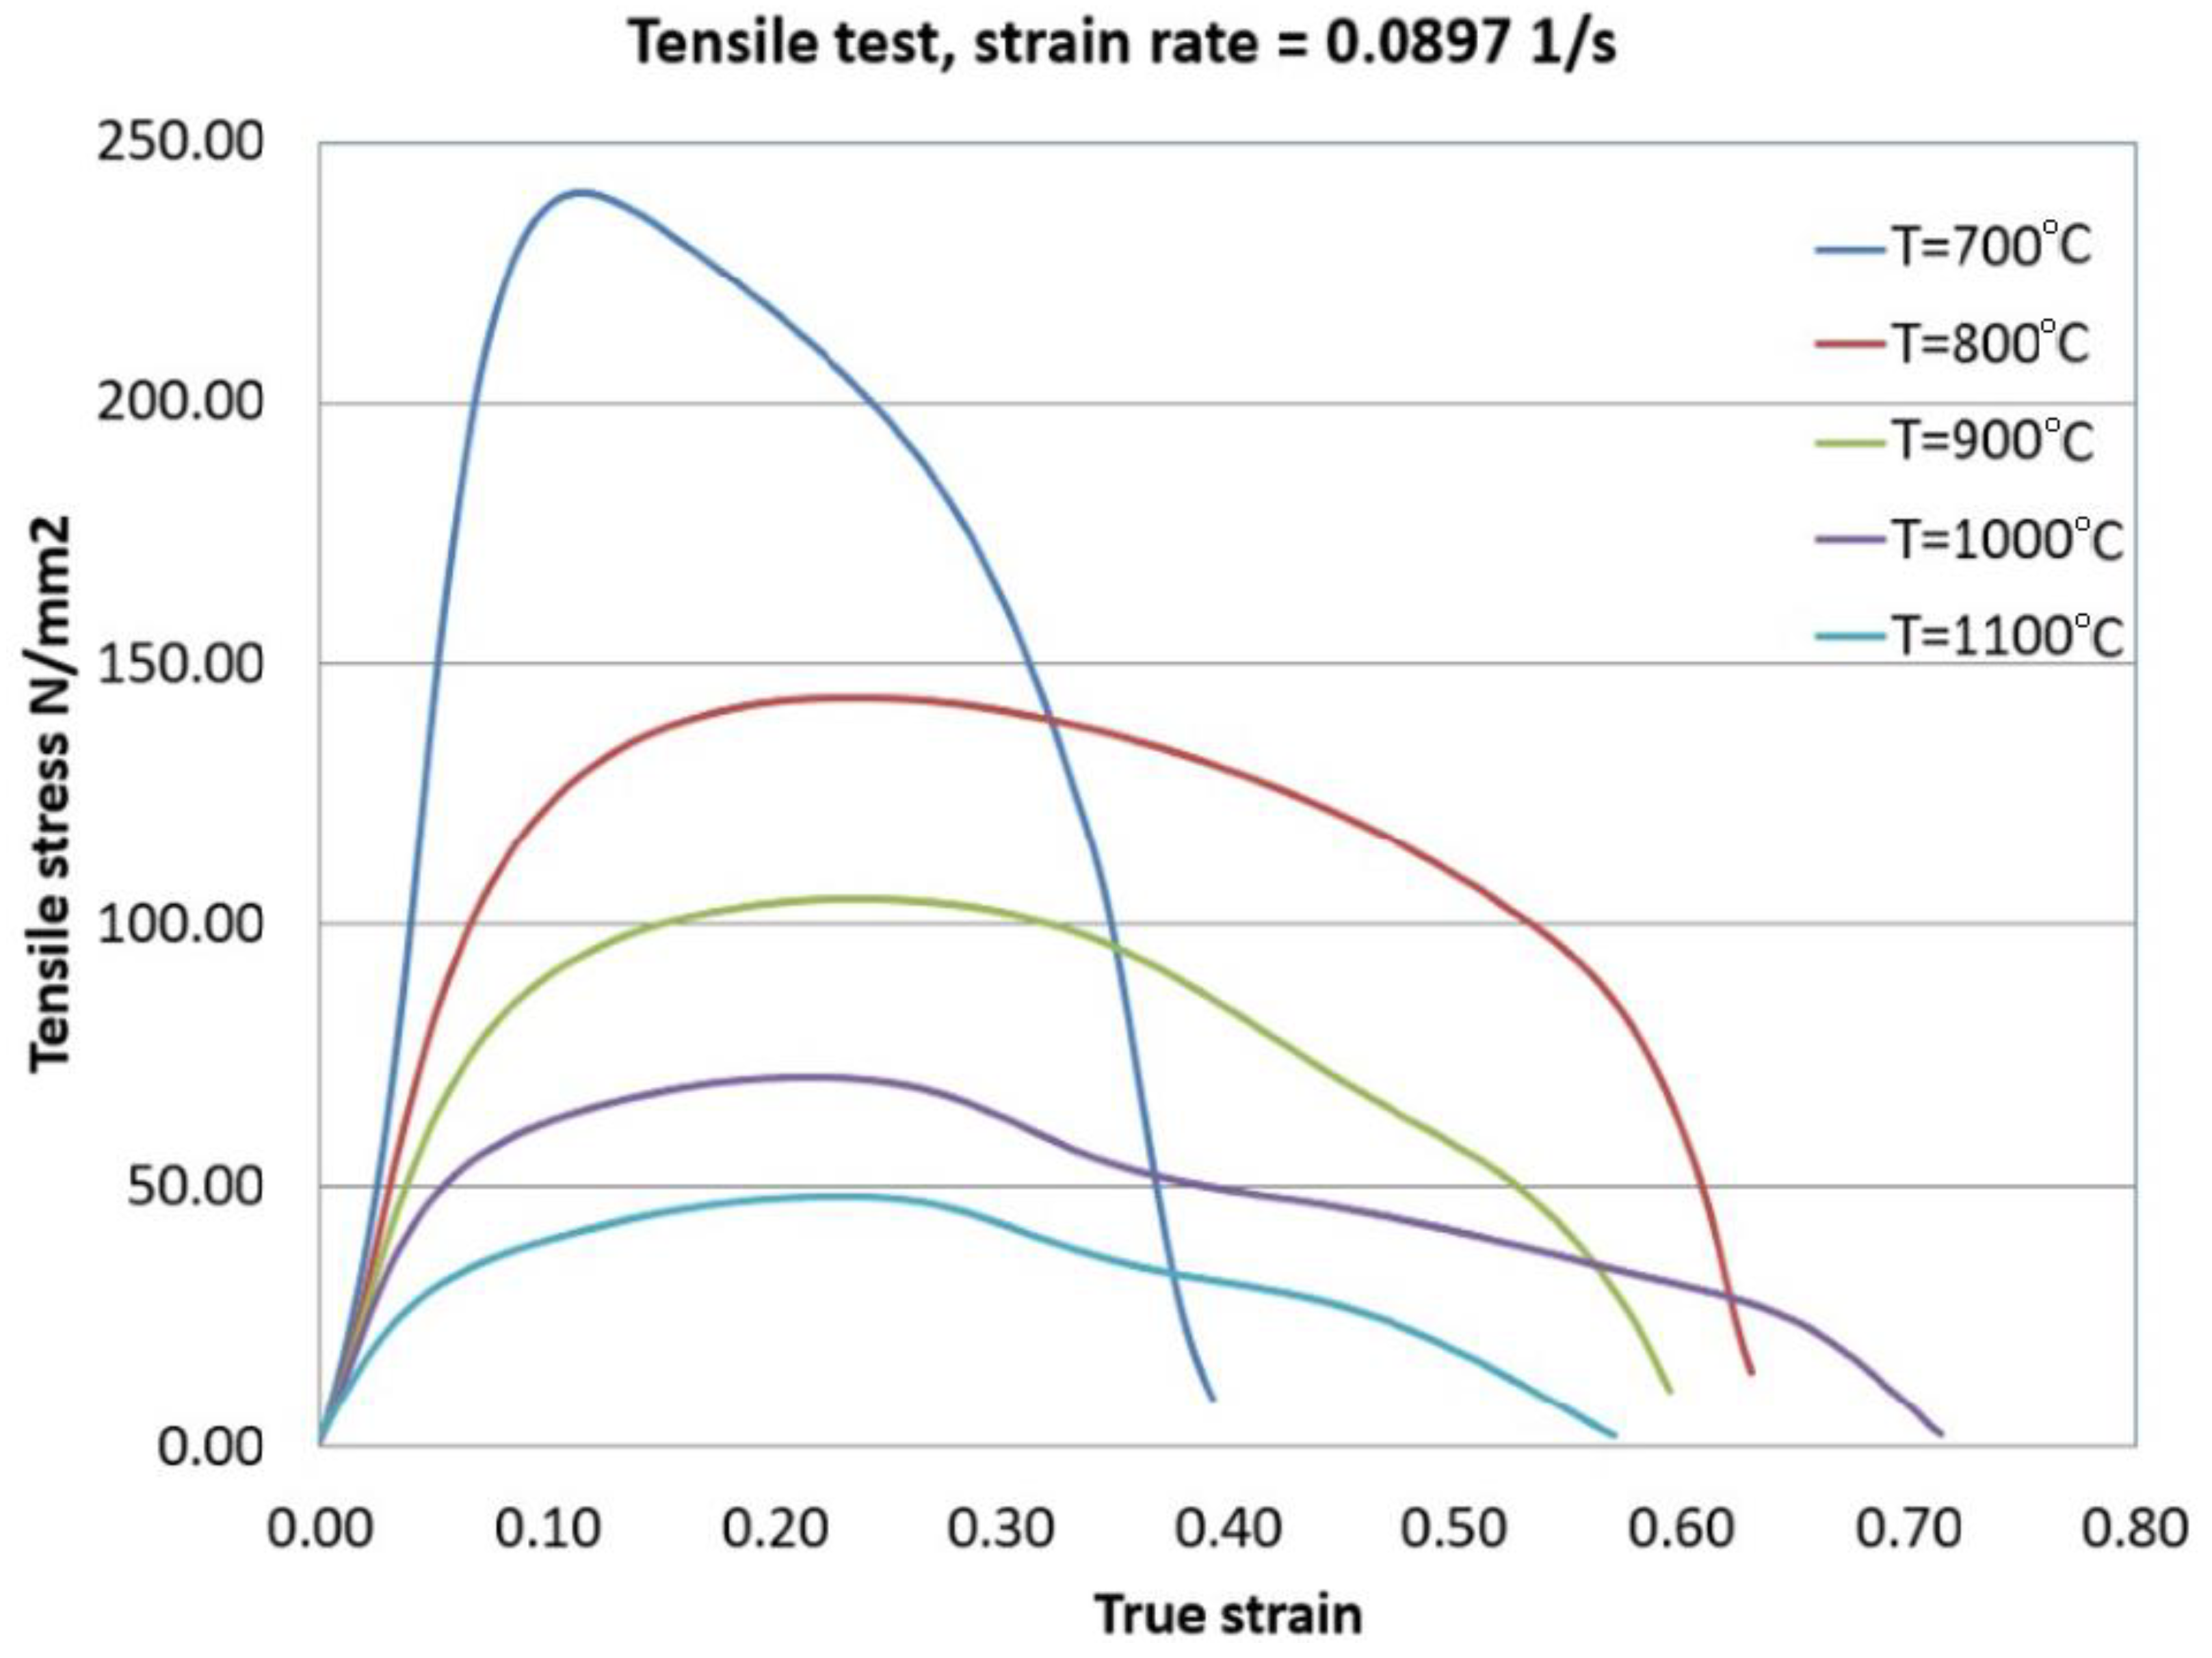
Figure 8.
Variation of tensile stress as a function of true strain, at strain rate of 0.0128 s-1.
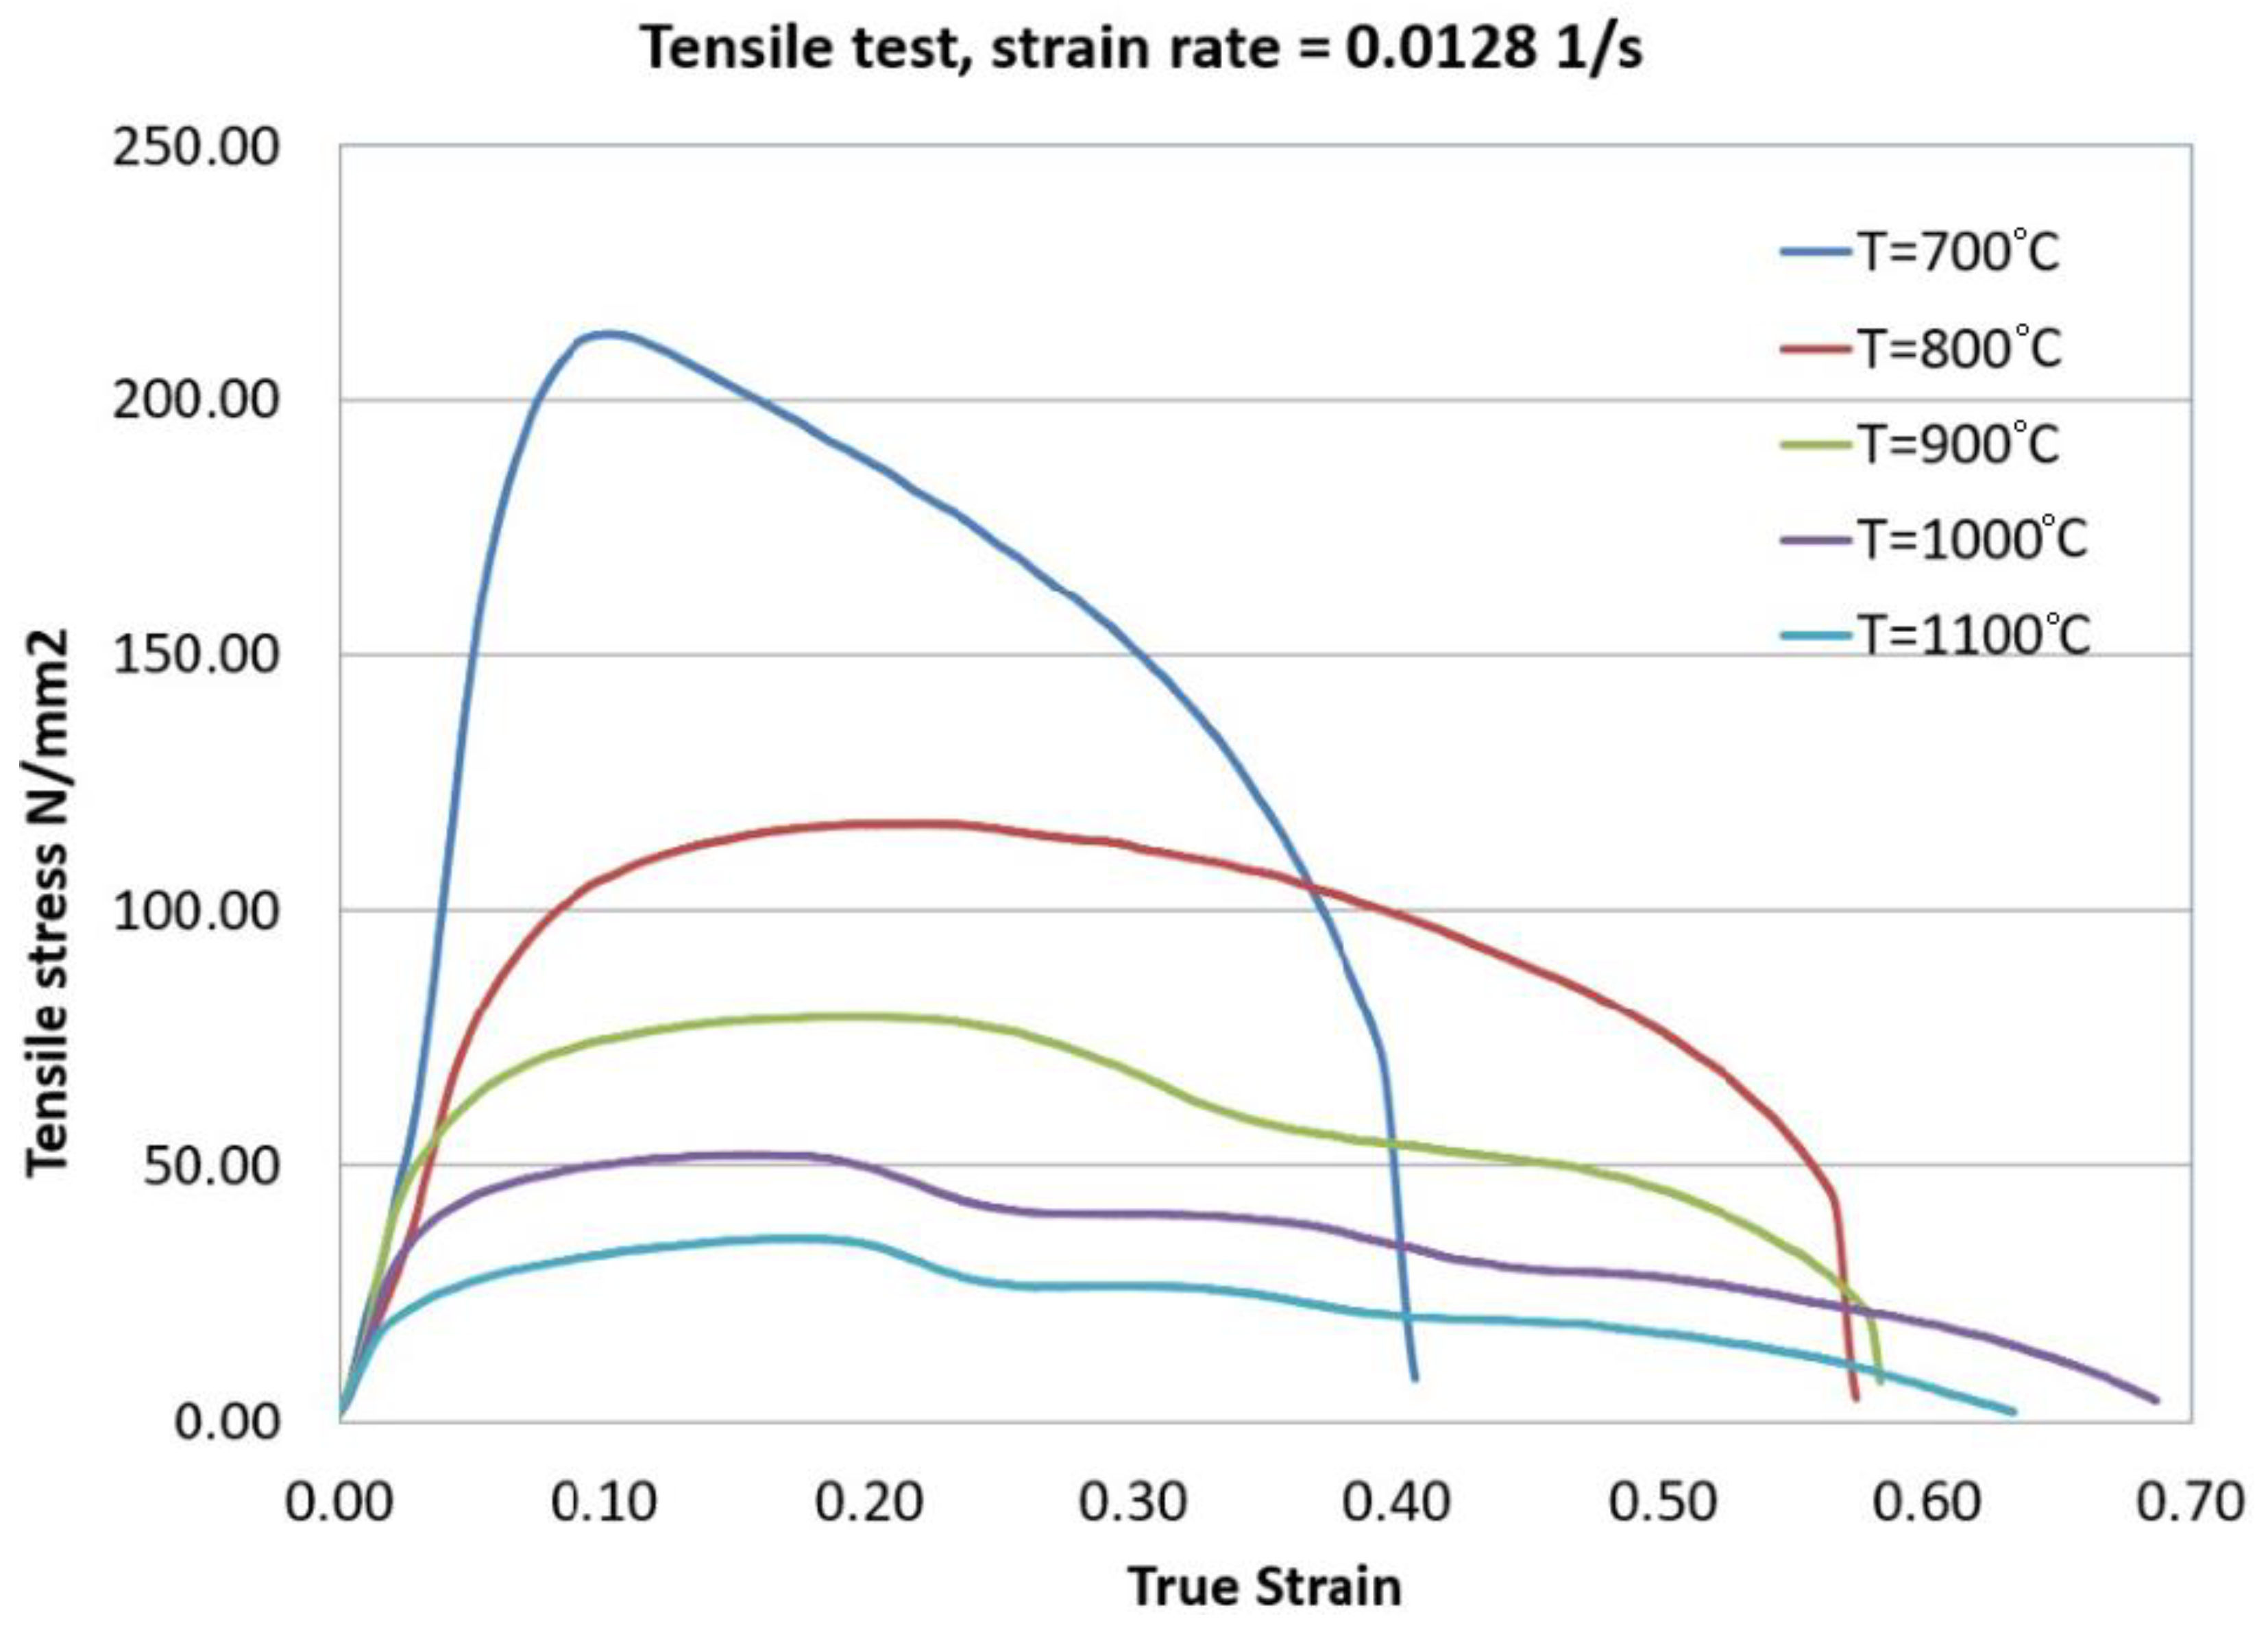
Figure 9.
Variation of tensile stress as a function of true strain, at strain rate of 0.0018 s-1.
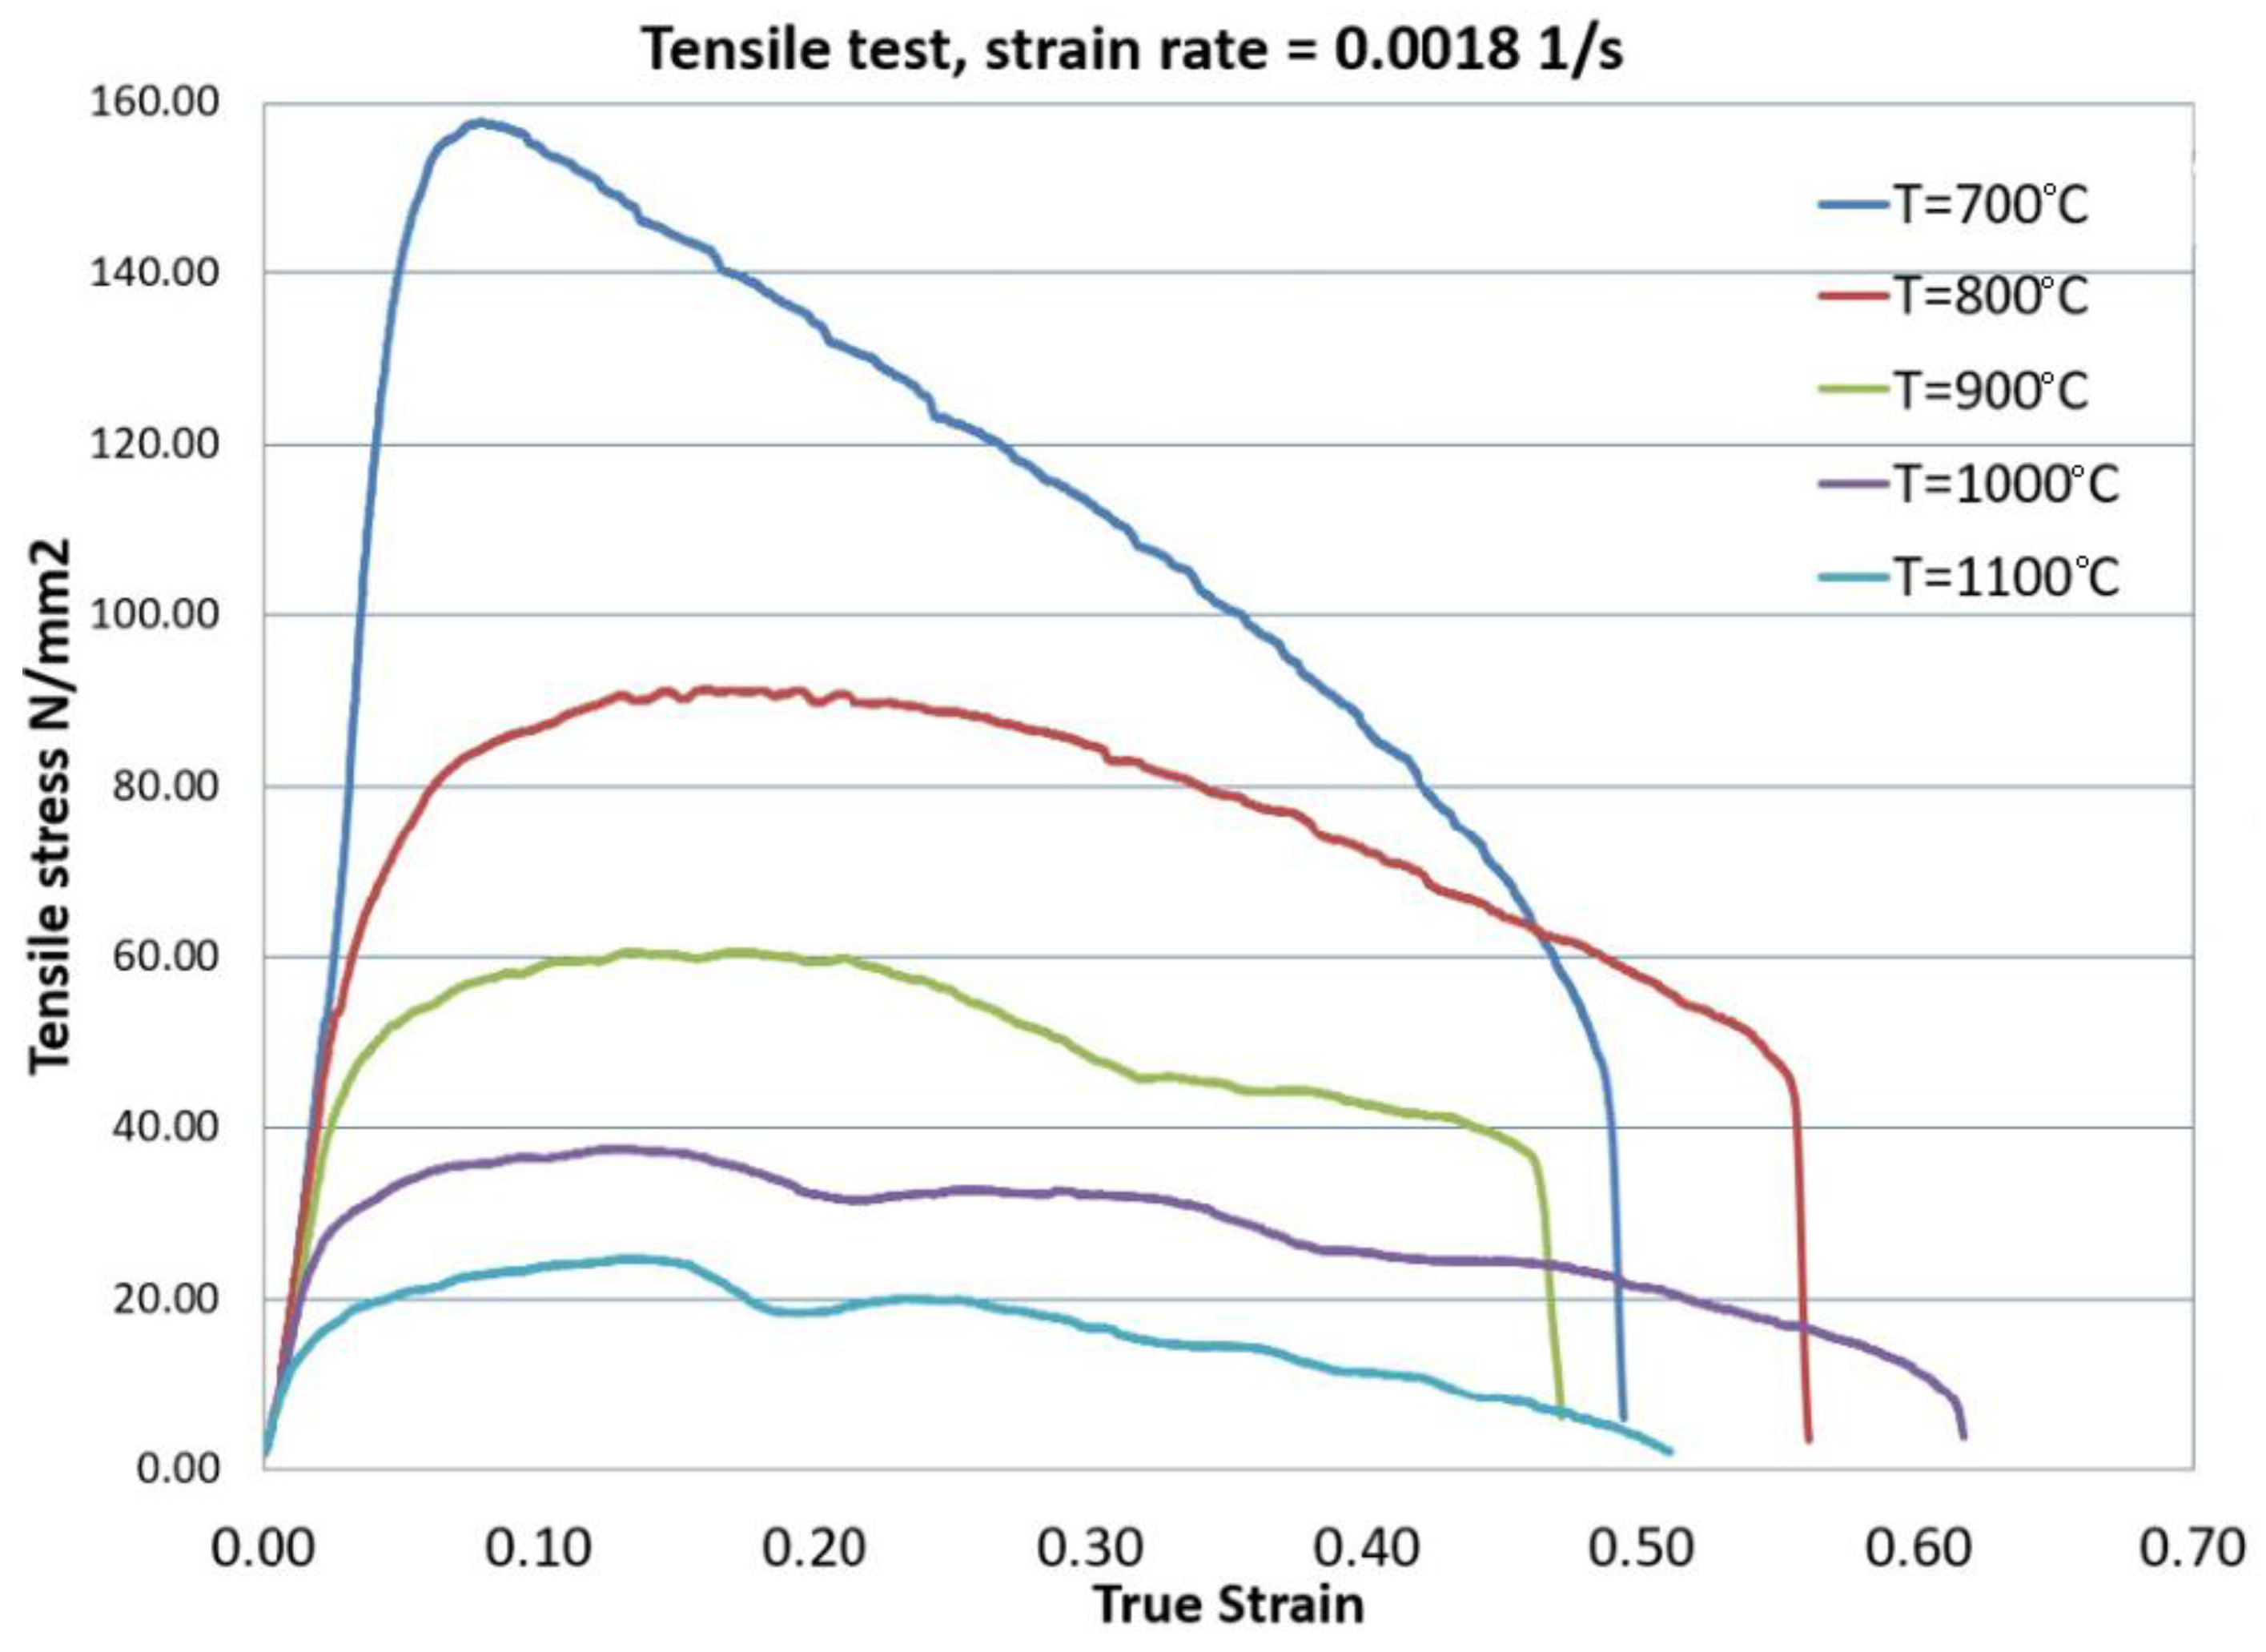
Figure 10.
Variation of tensile stress with temperature for different strain rates.
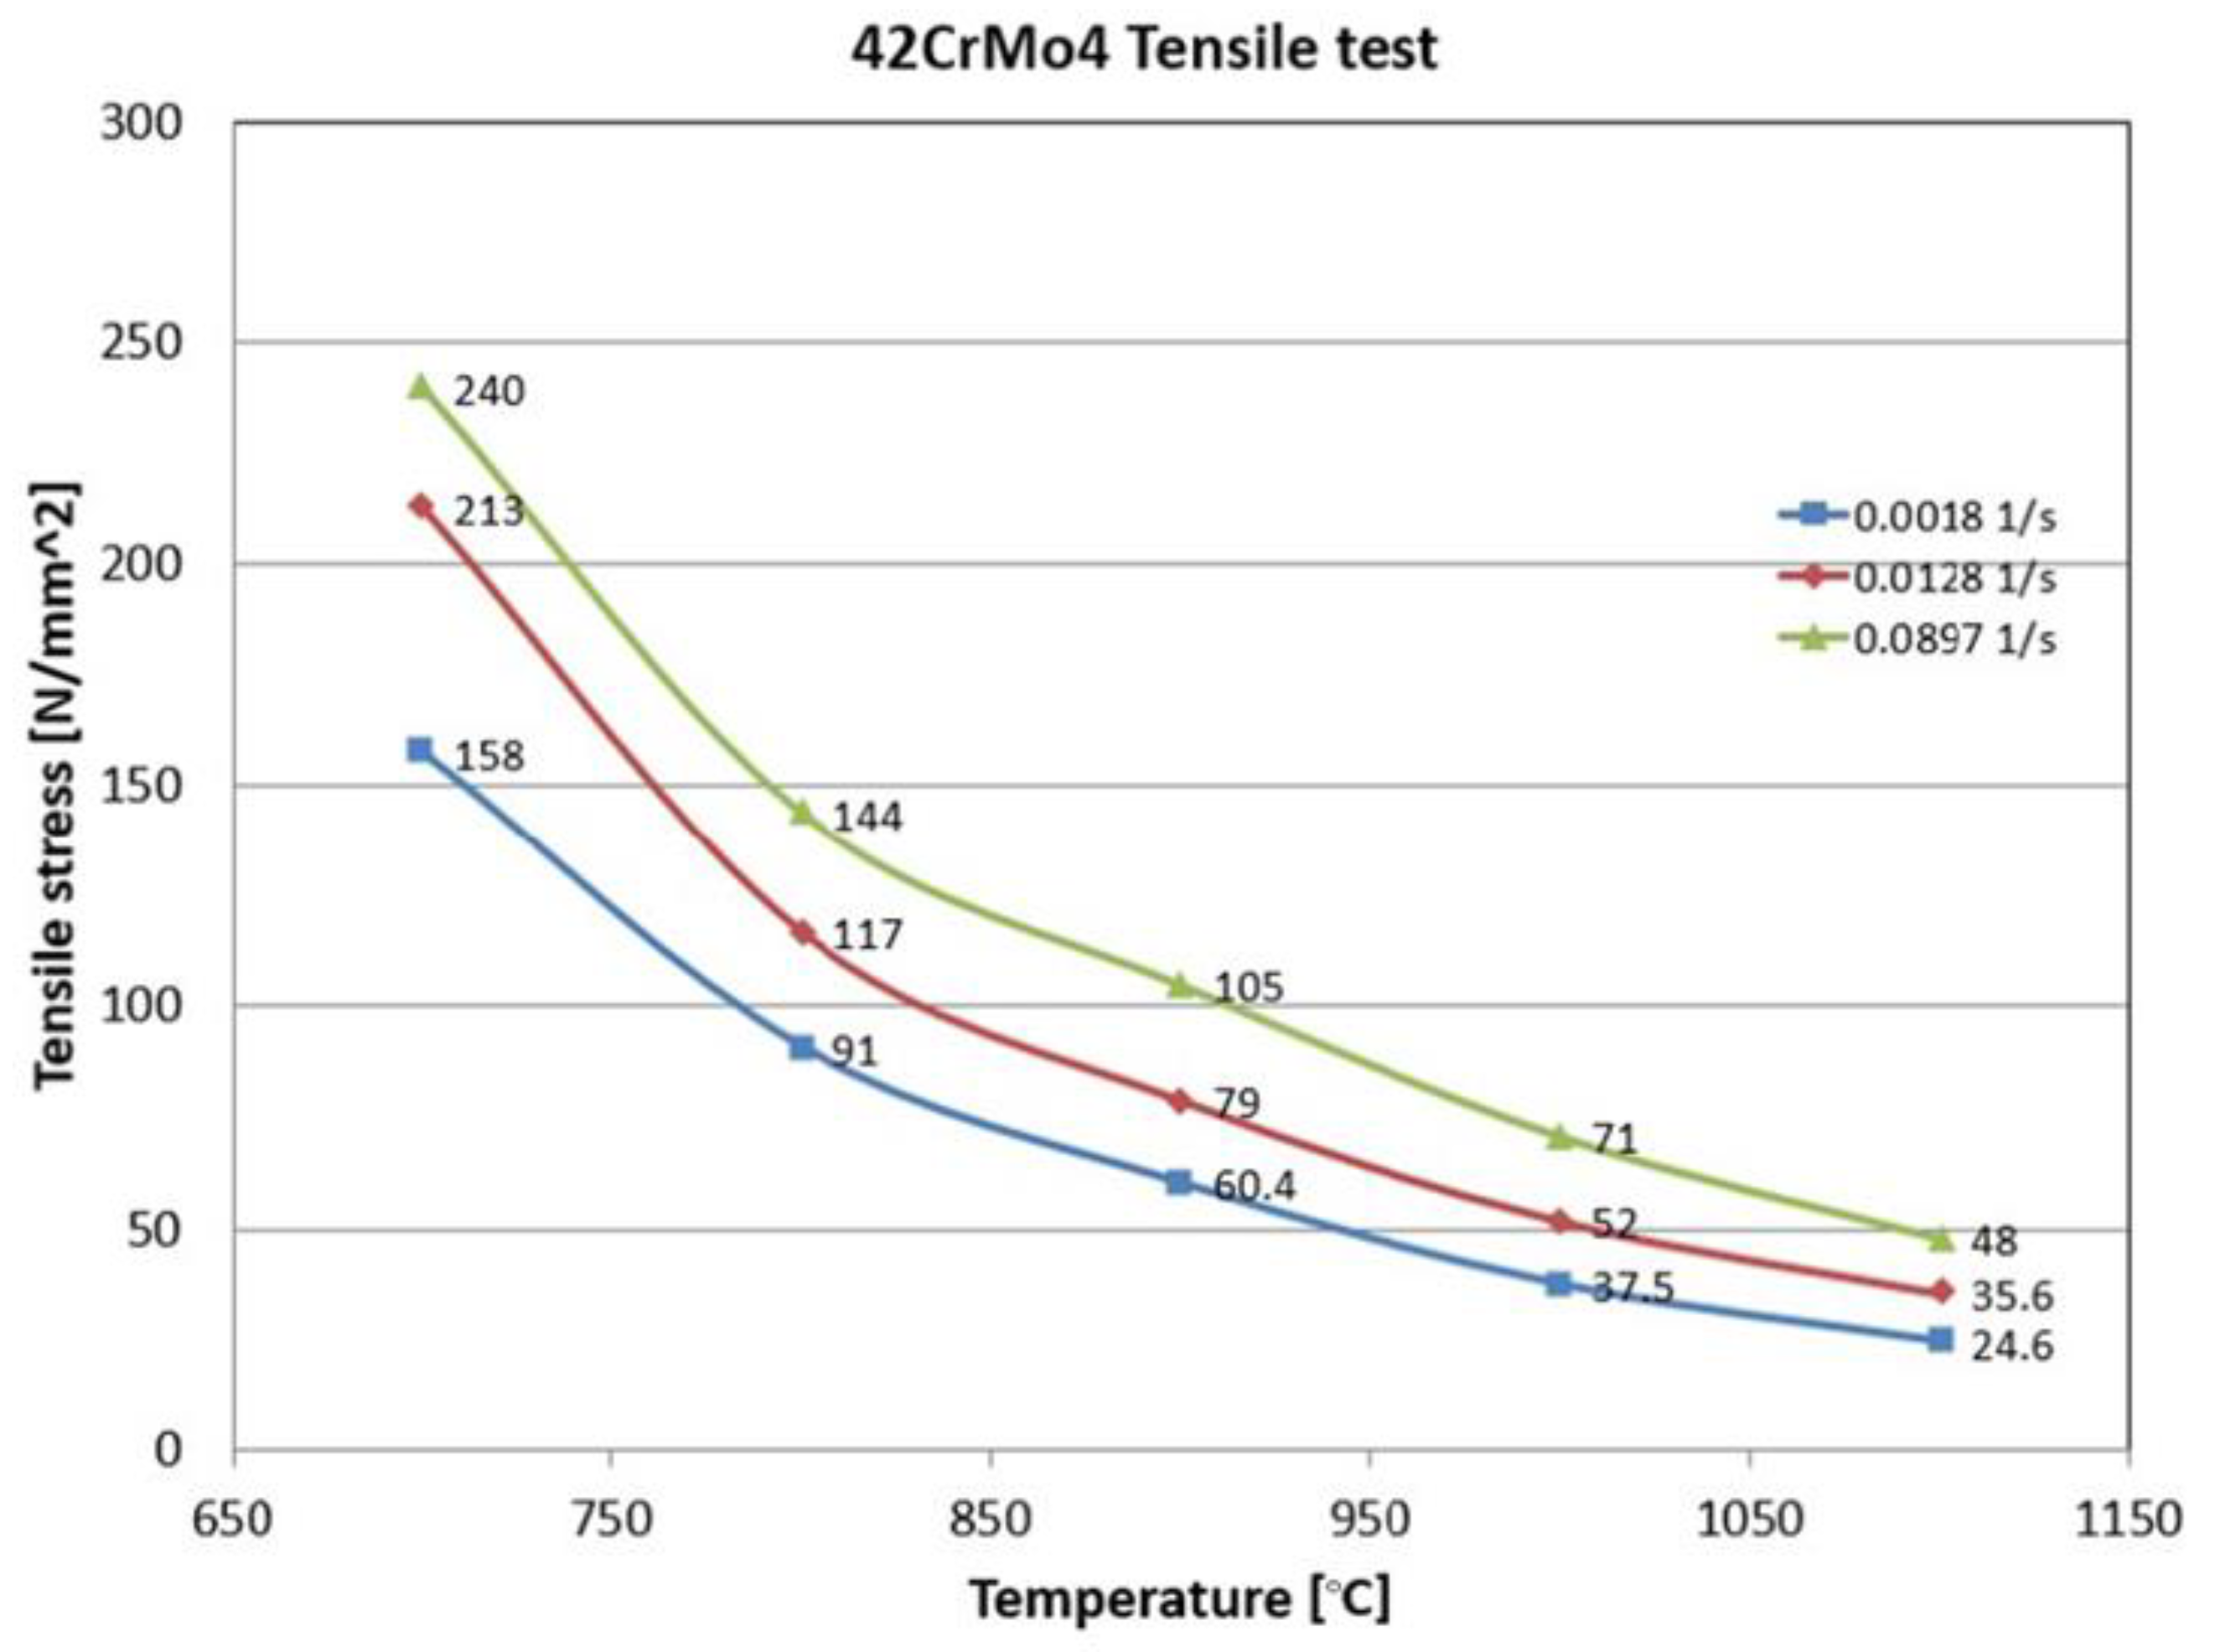
Figure 11.
Compression tests at T= 800 °C (a) 0.033 s-1, (b) 0.066 s-1, (c) 0.1 s-1.
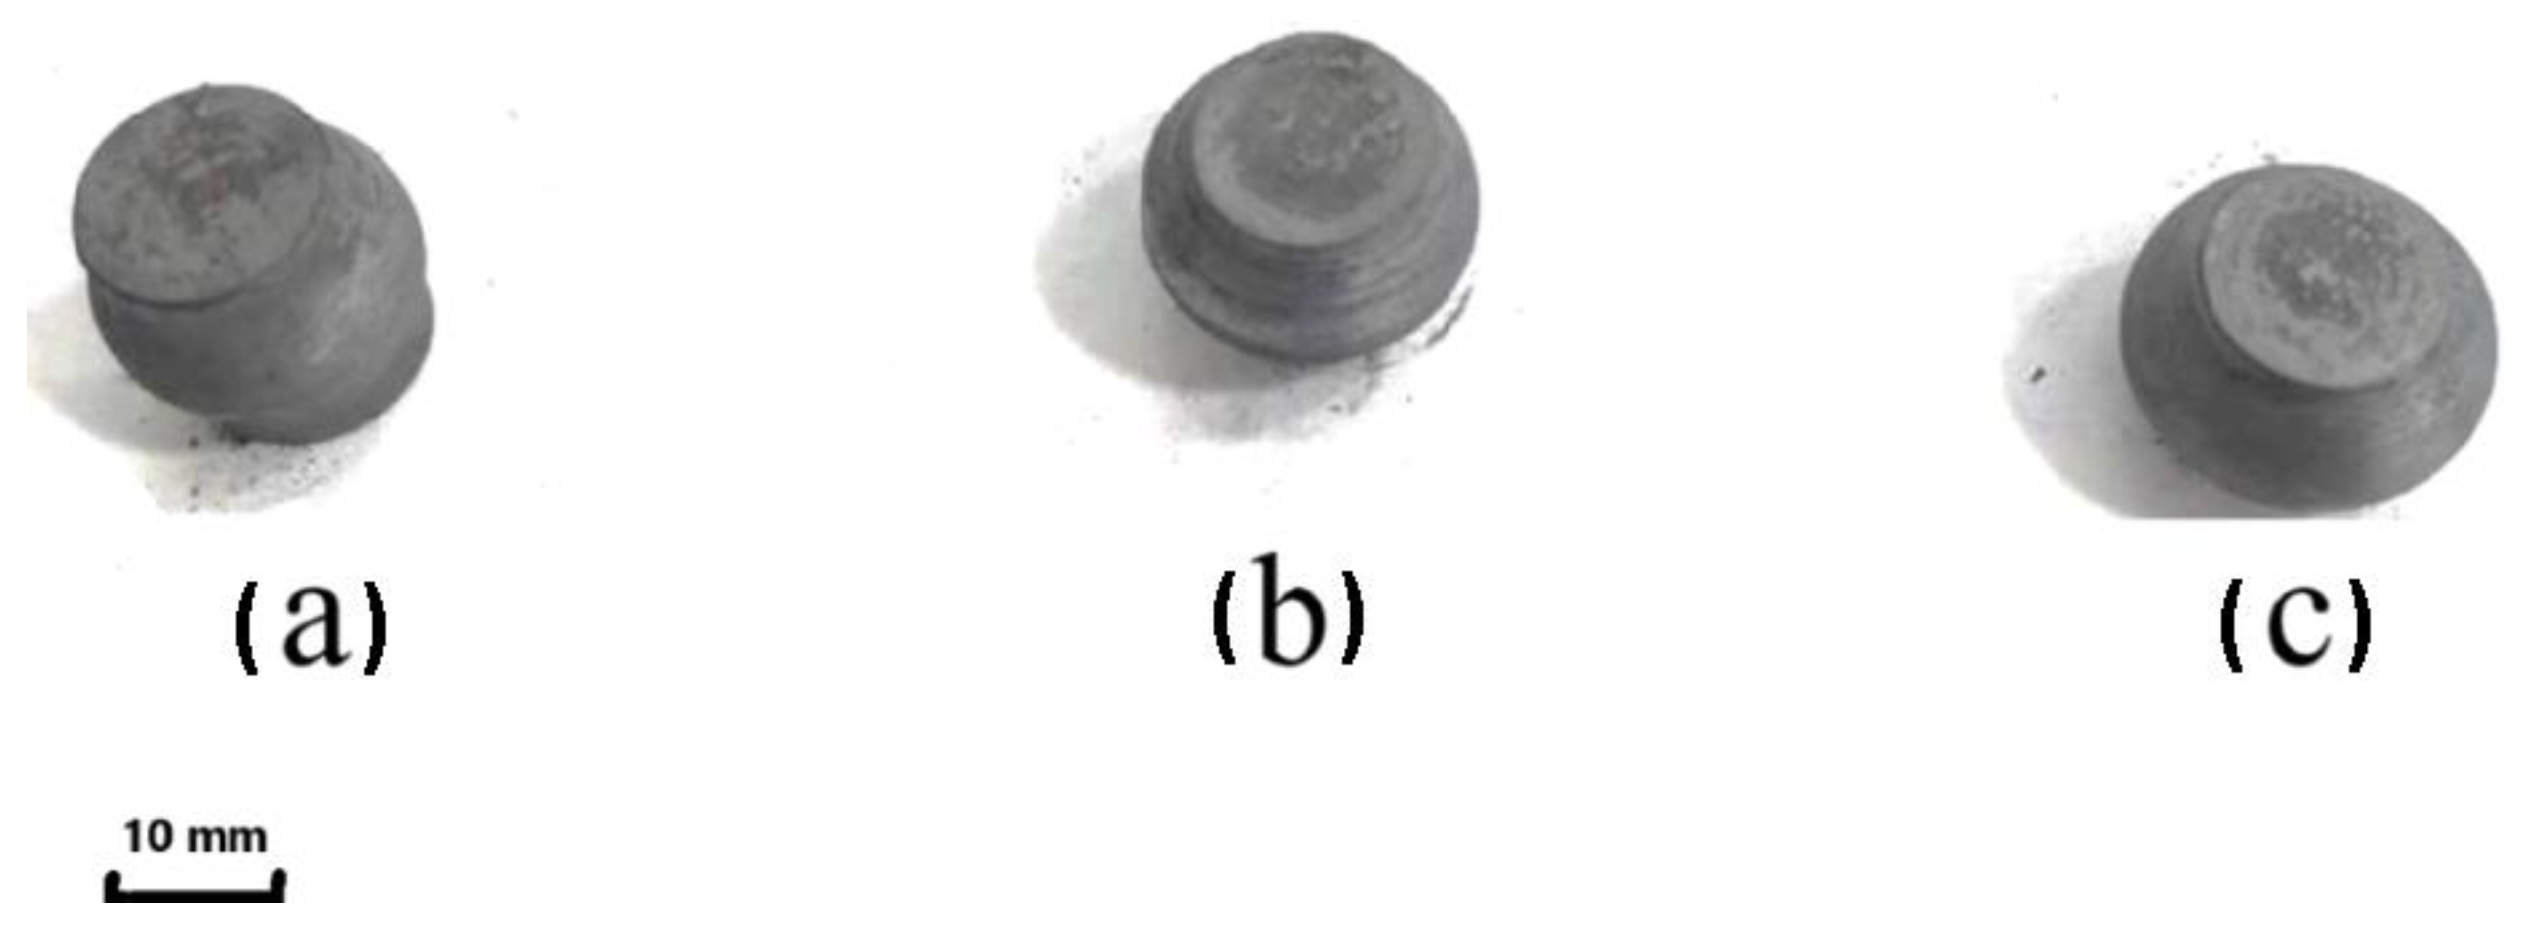
Figure 12.
Compression tests at T= 900 °C (a) 0.033 s-1, (b) 0.066 s-1, (c) 0.1 s-1.
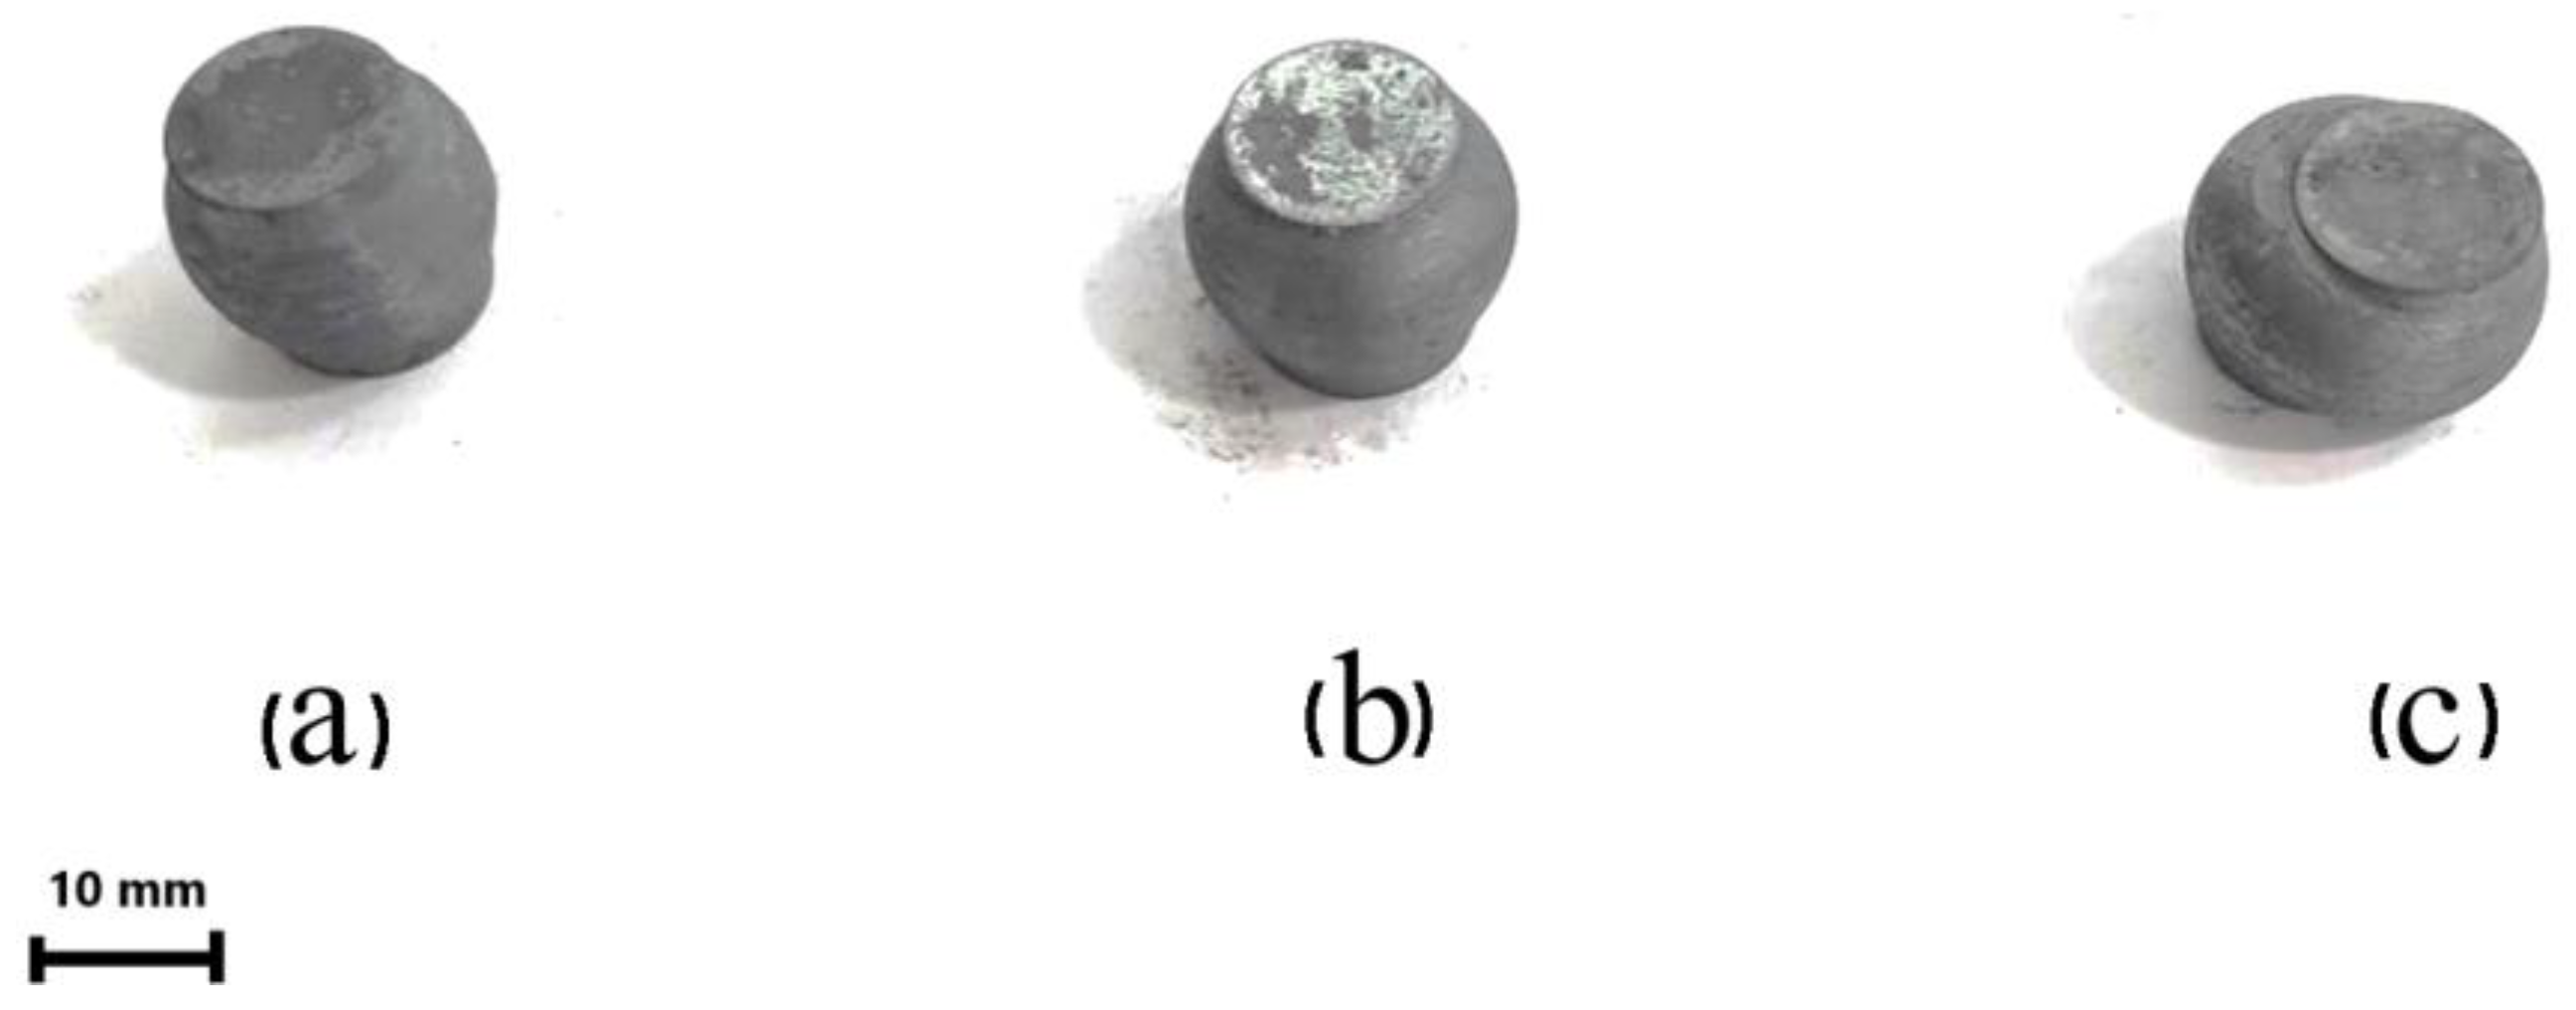
Figure 13.
Compression tests at T= 1000 °C (a) 0.033 s-1, (b) 0.066 s-1, (c) 0.1 s-1.
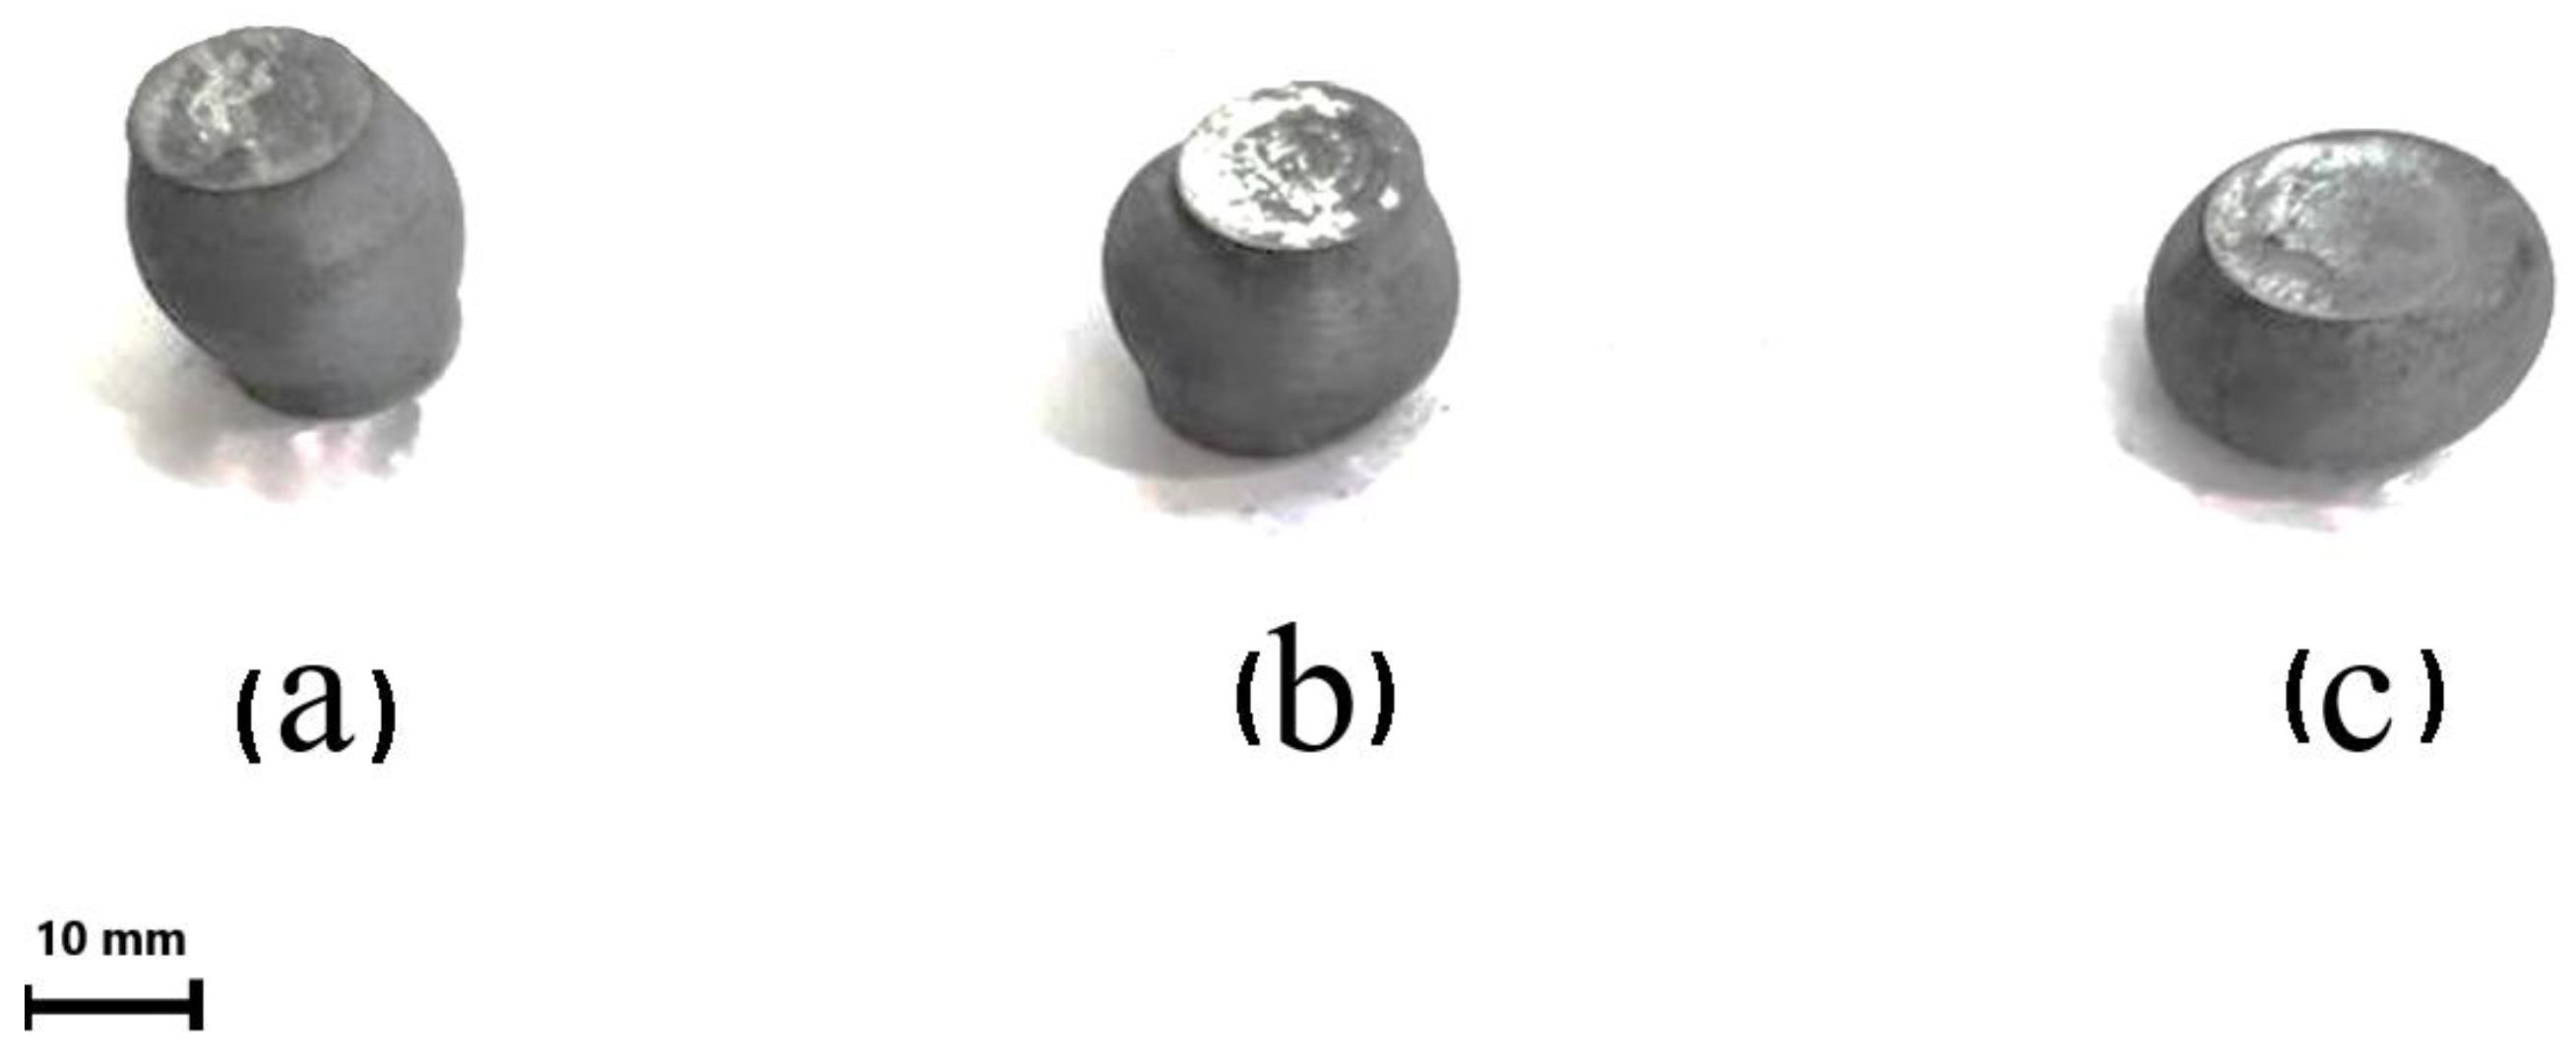
Figure 14.
The variation of the compression stress vs. true strain, 0.033 s-1.
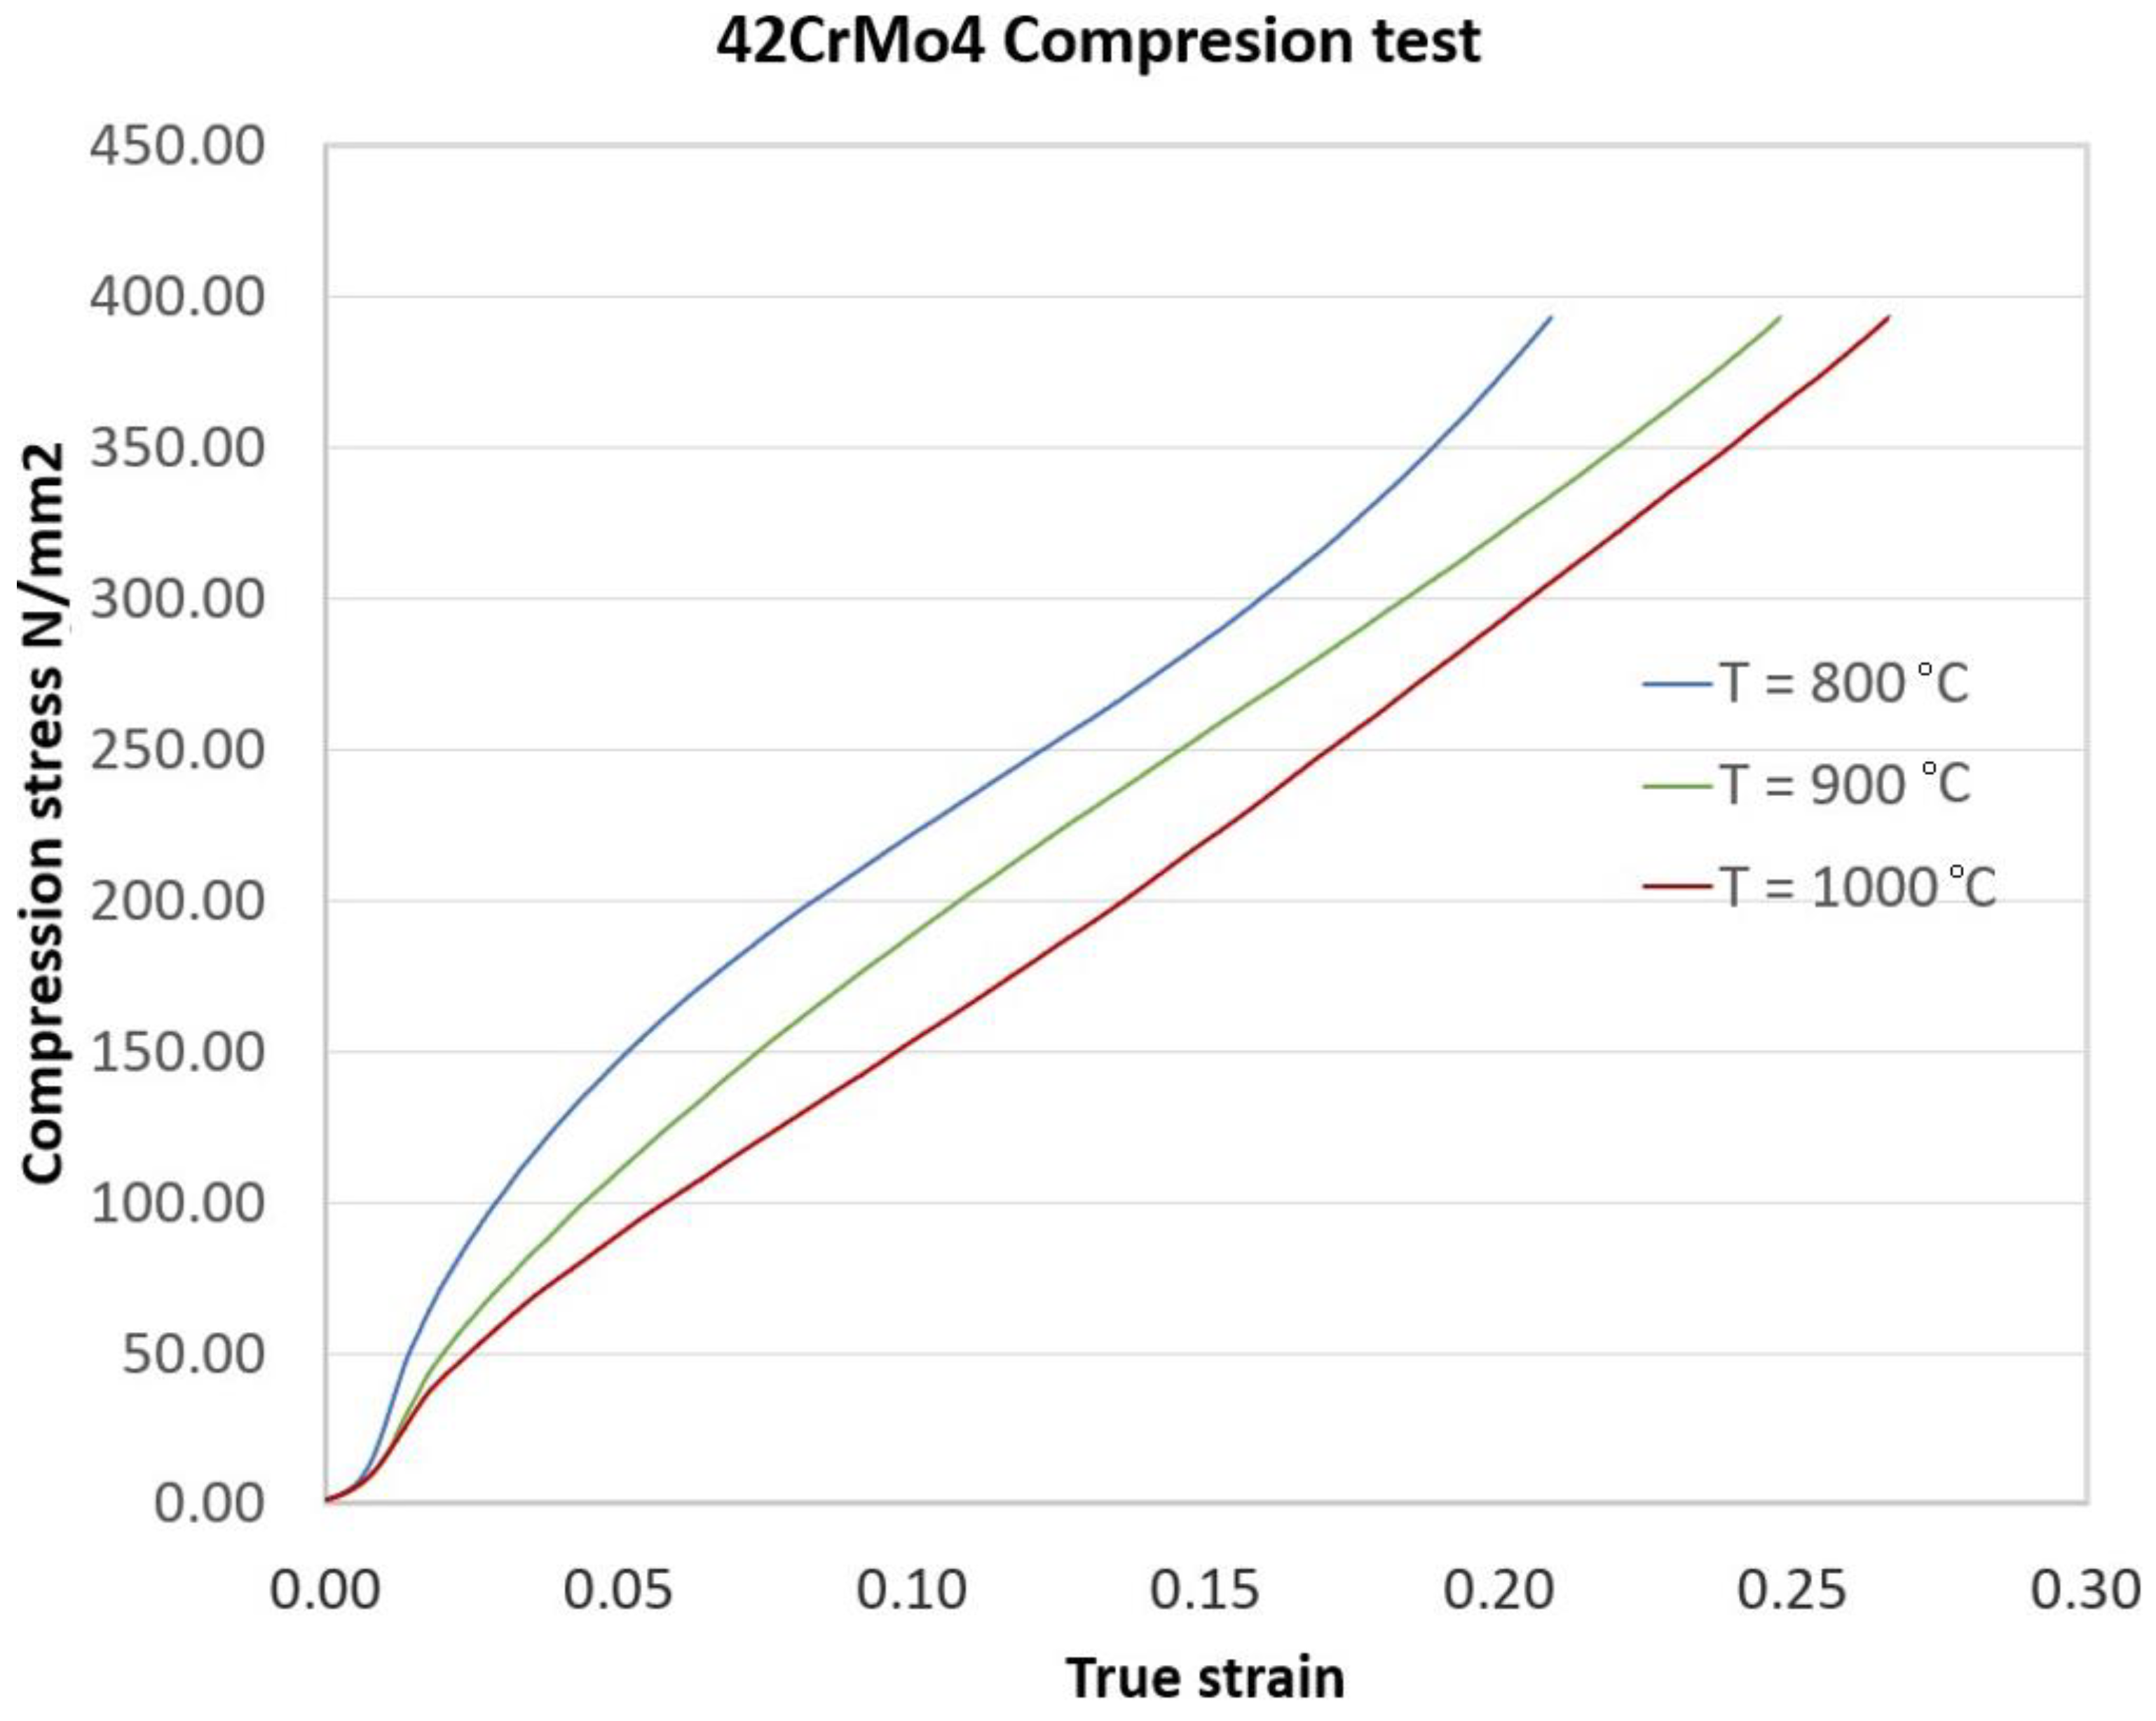
Figure 15.
The variation of the compression stress vs. true strain, 0.066 s-1.
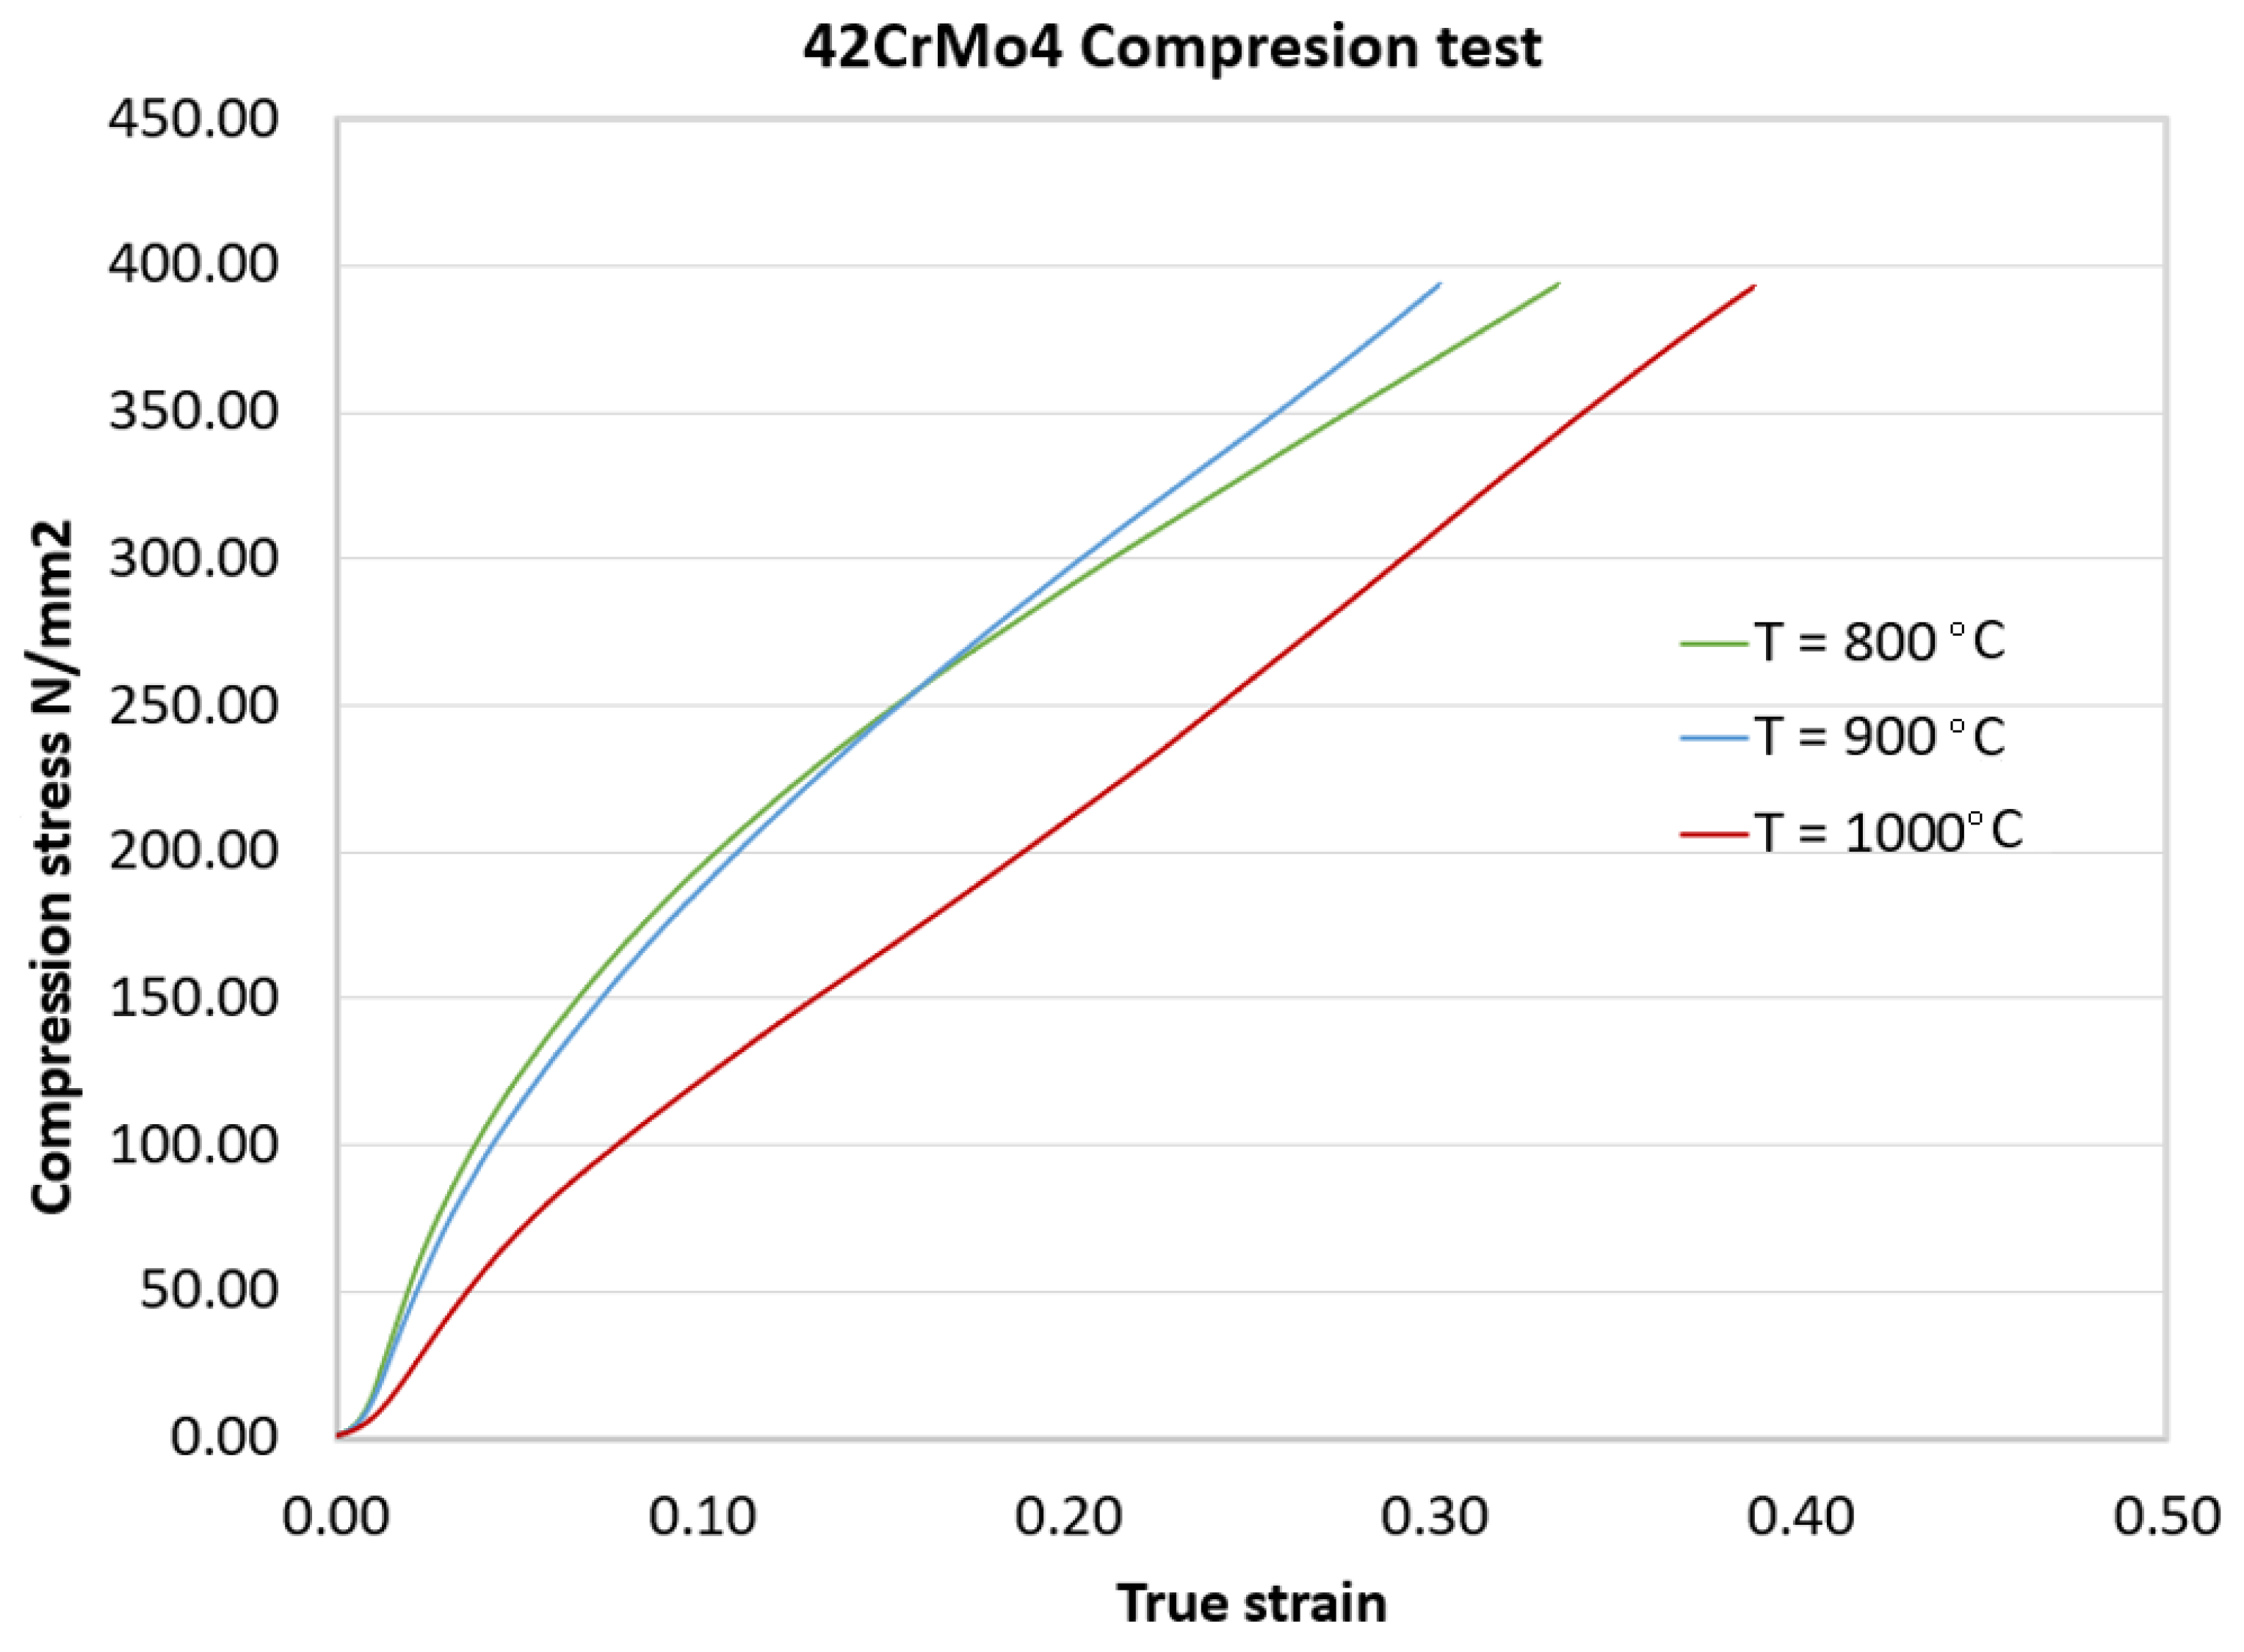
Figure 16.
The variation of the compression stress vs. true strain, 0.1 s-1.
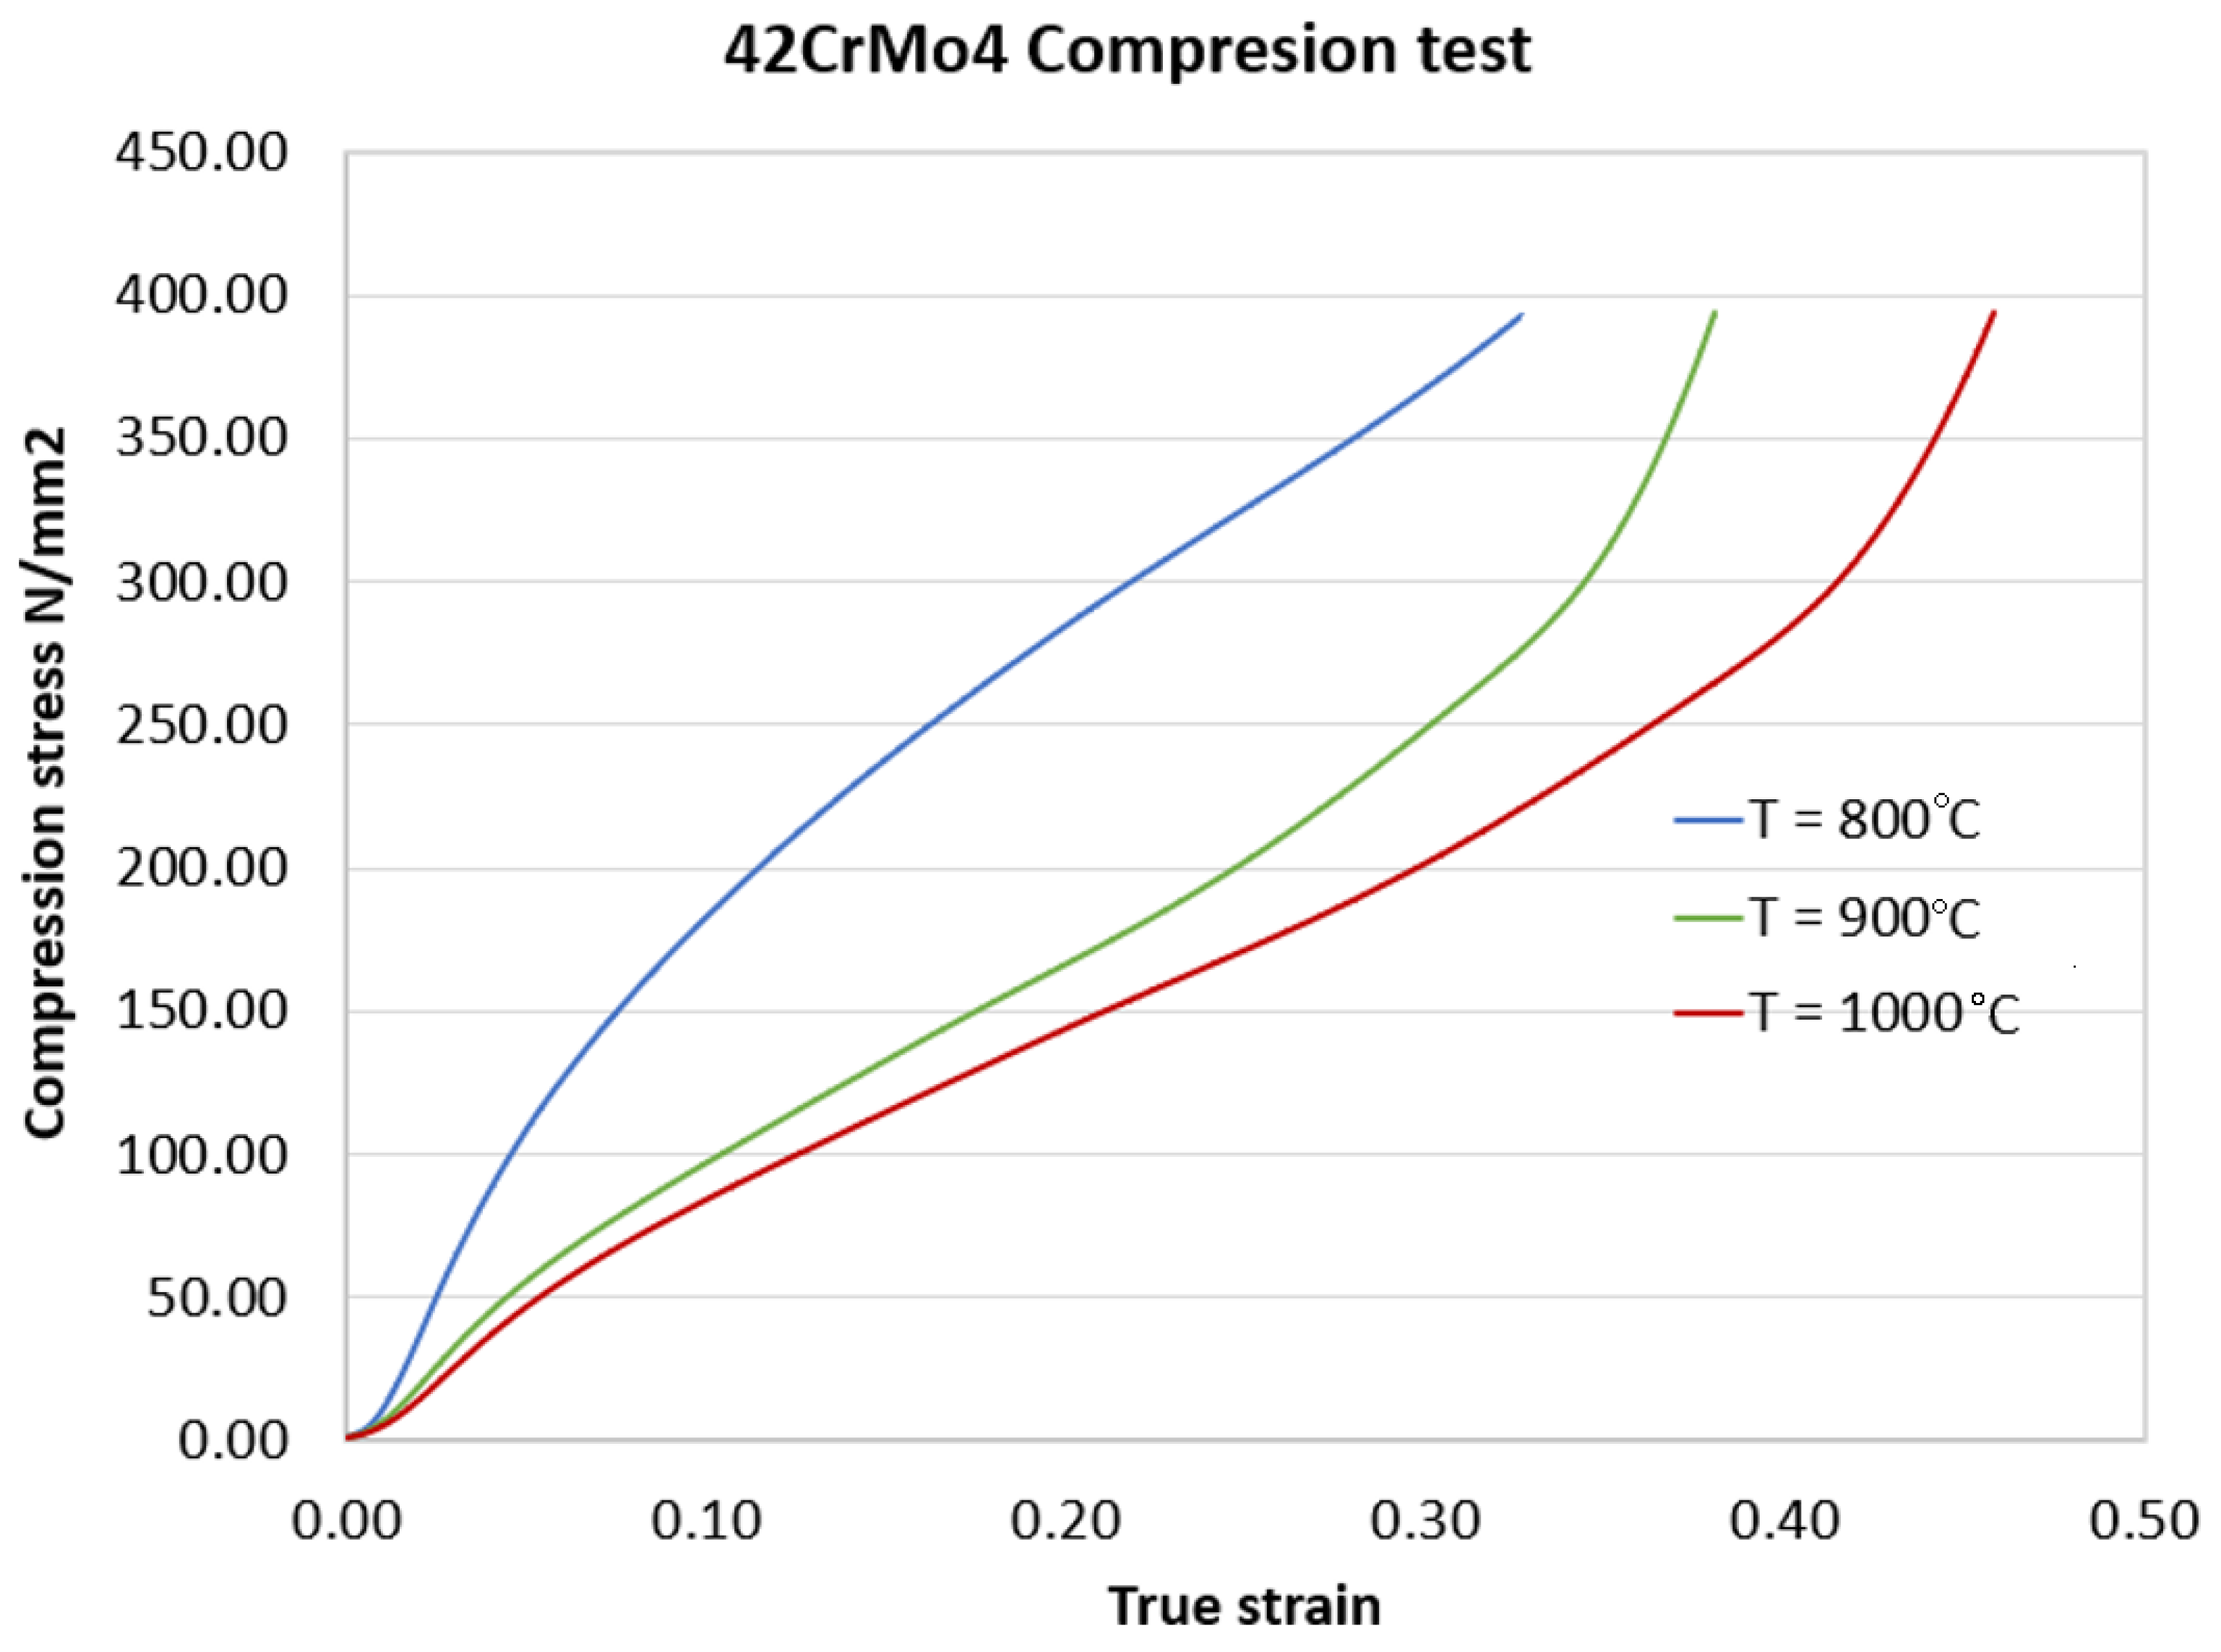
Figure 17.
The variation of deformation non-uniformity vs. strain rate at 1000 °C.
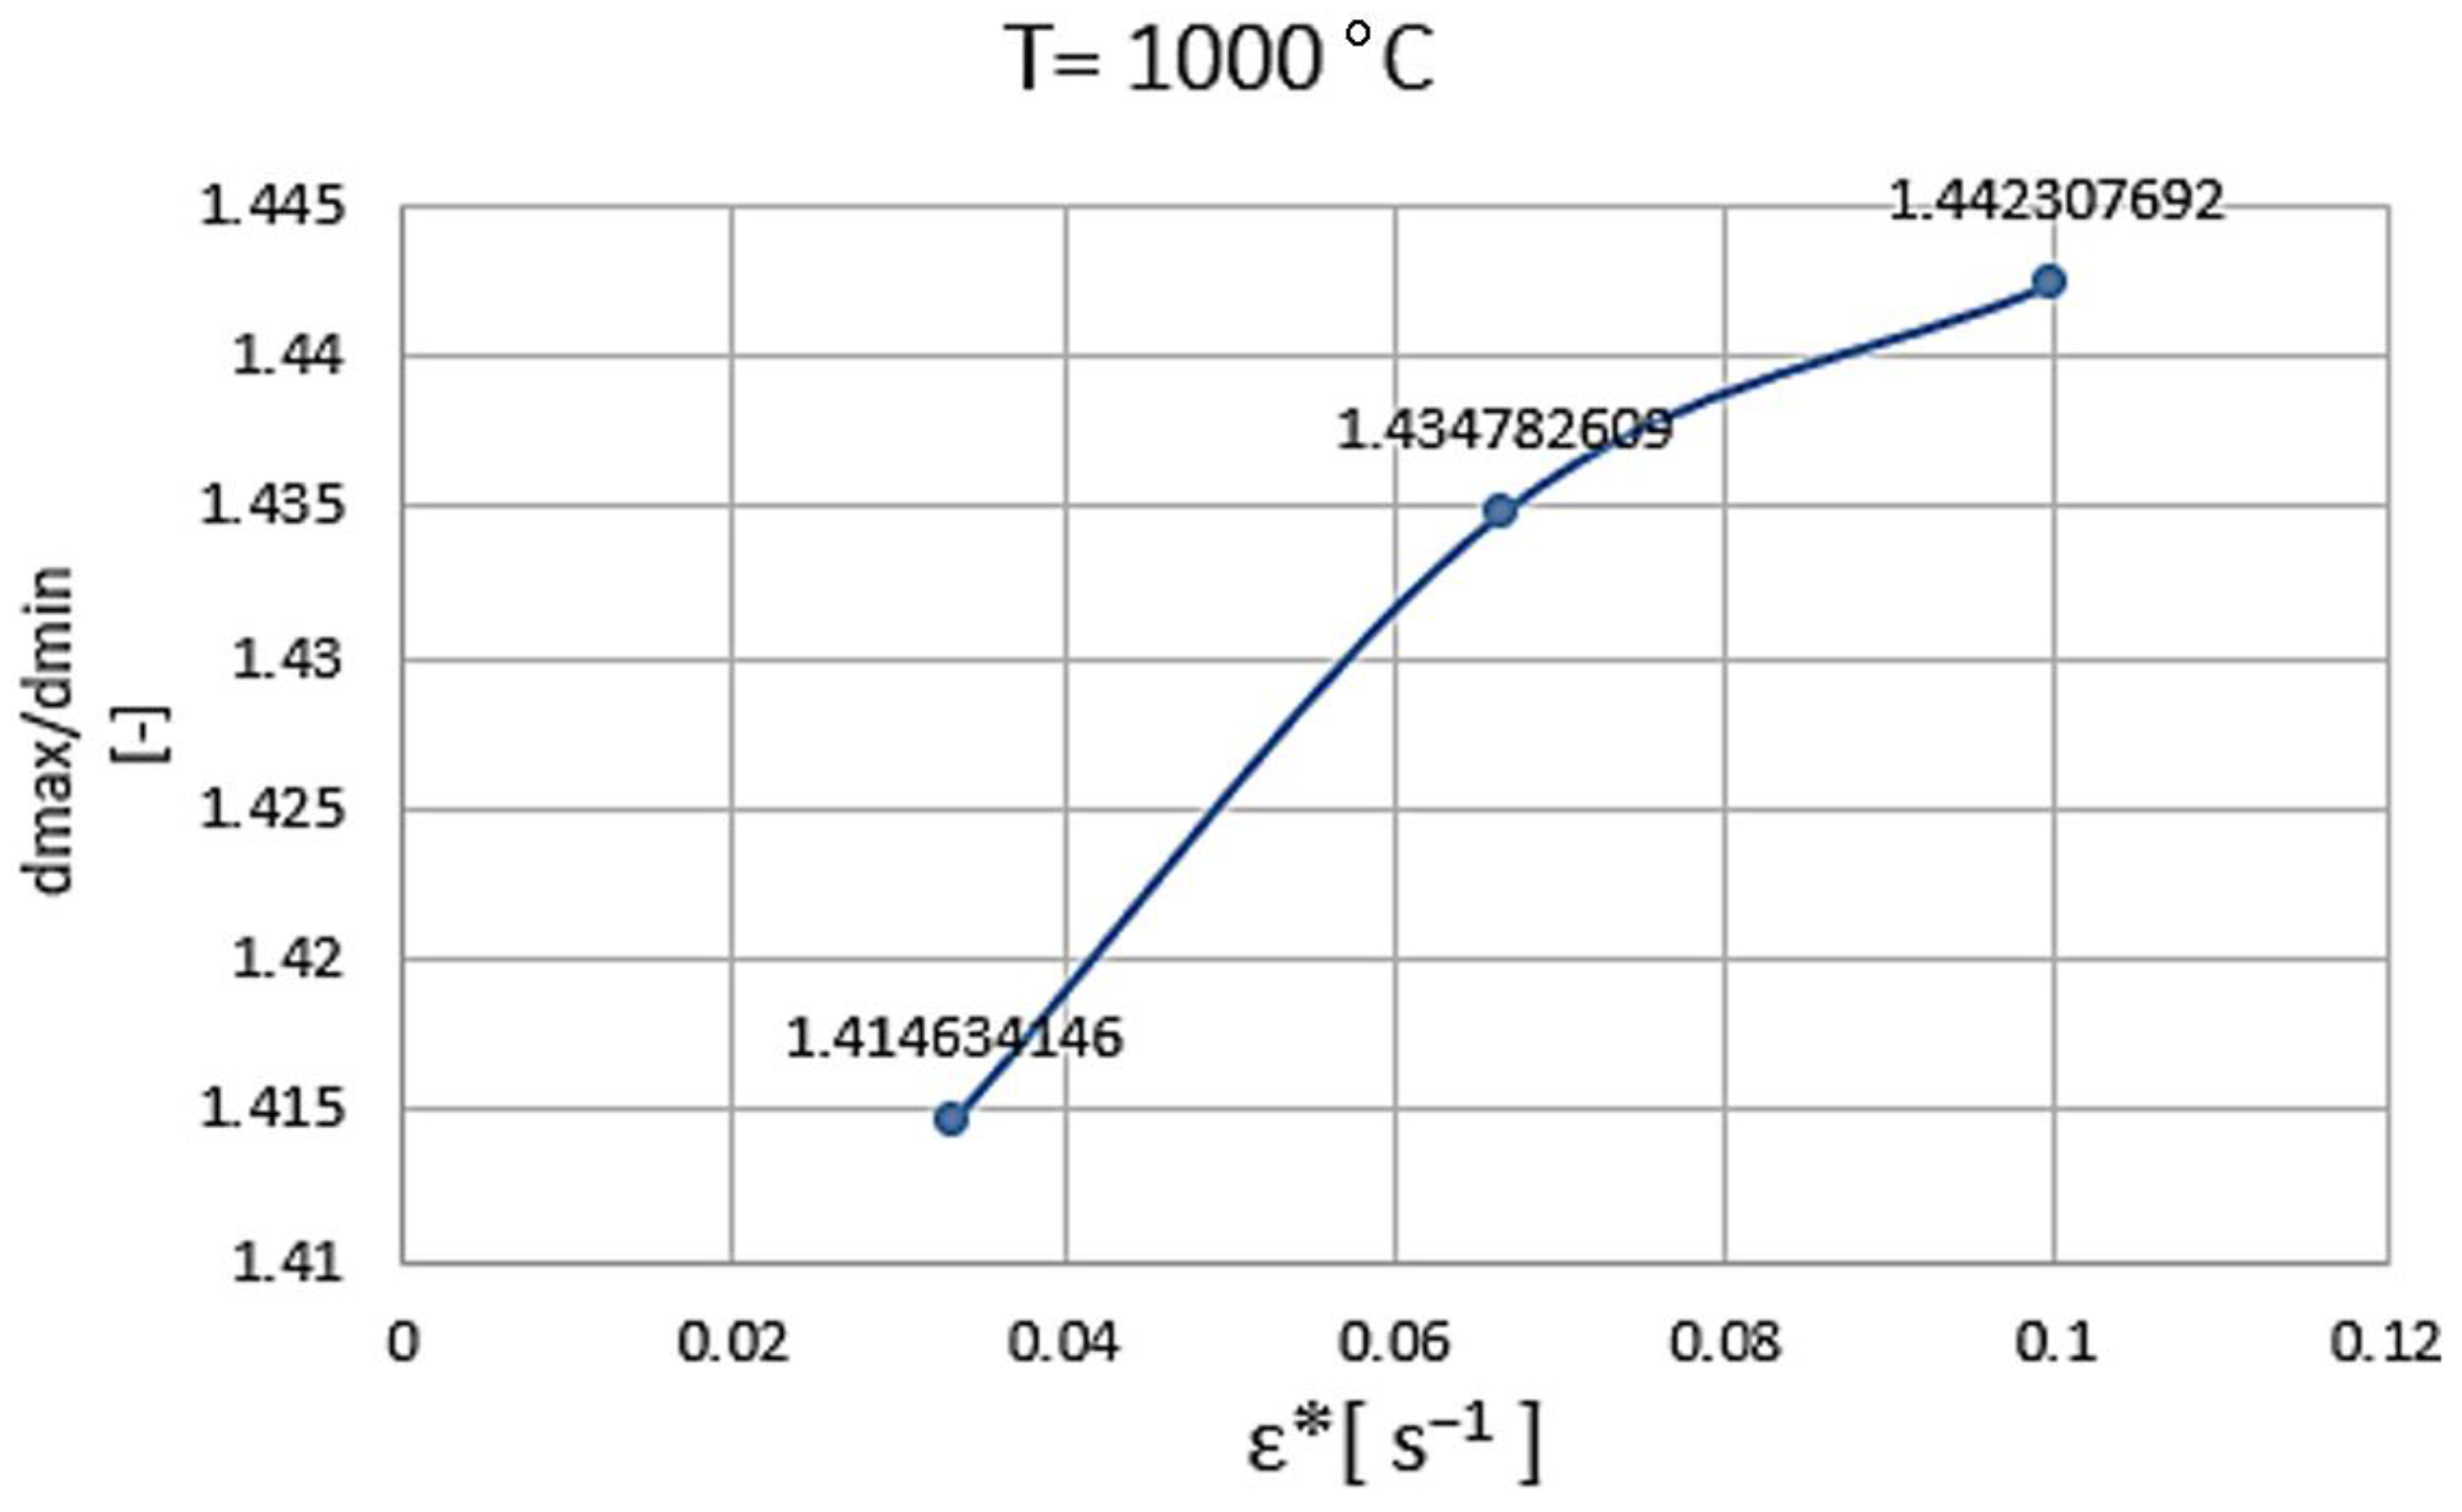
Figure 18.
The variation of deformation non-uniformity vs. strain rate at 900 °C.
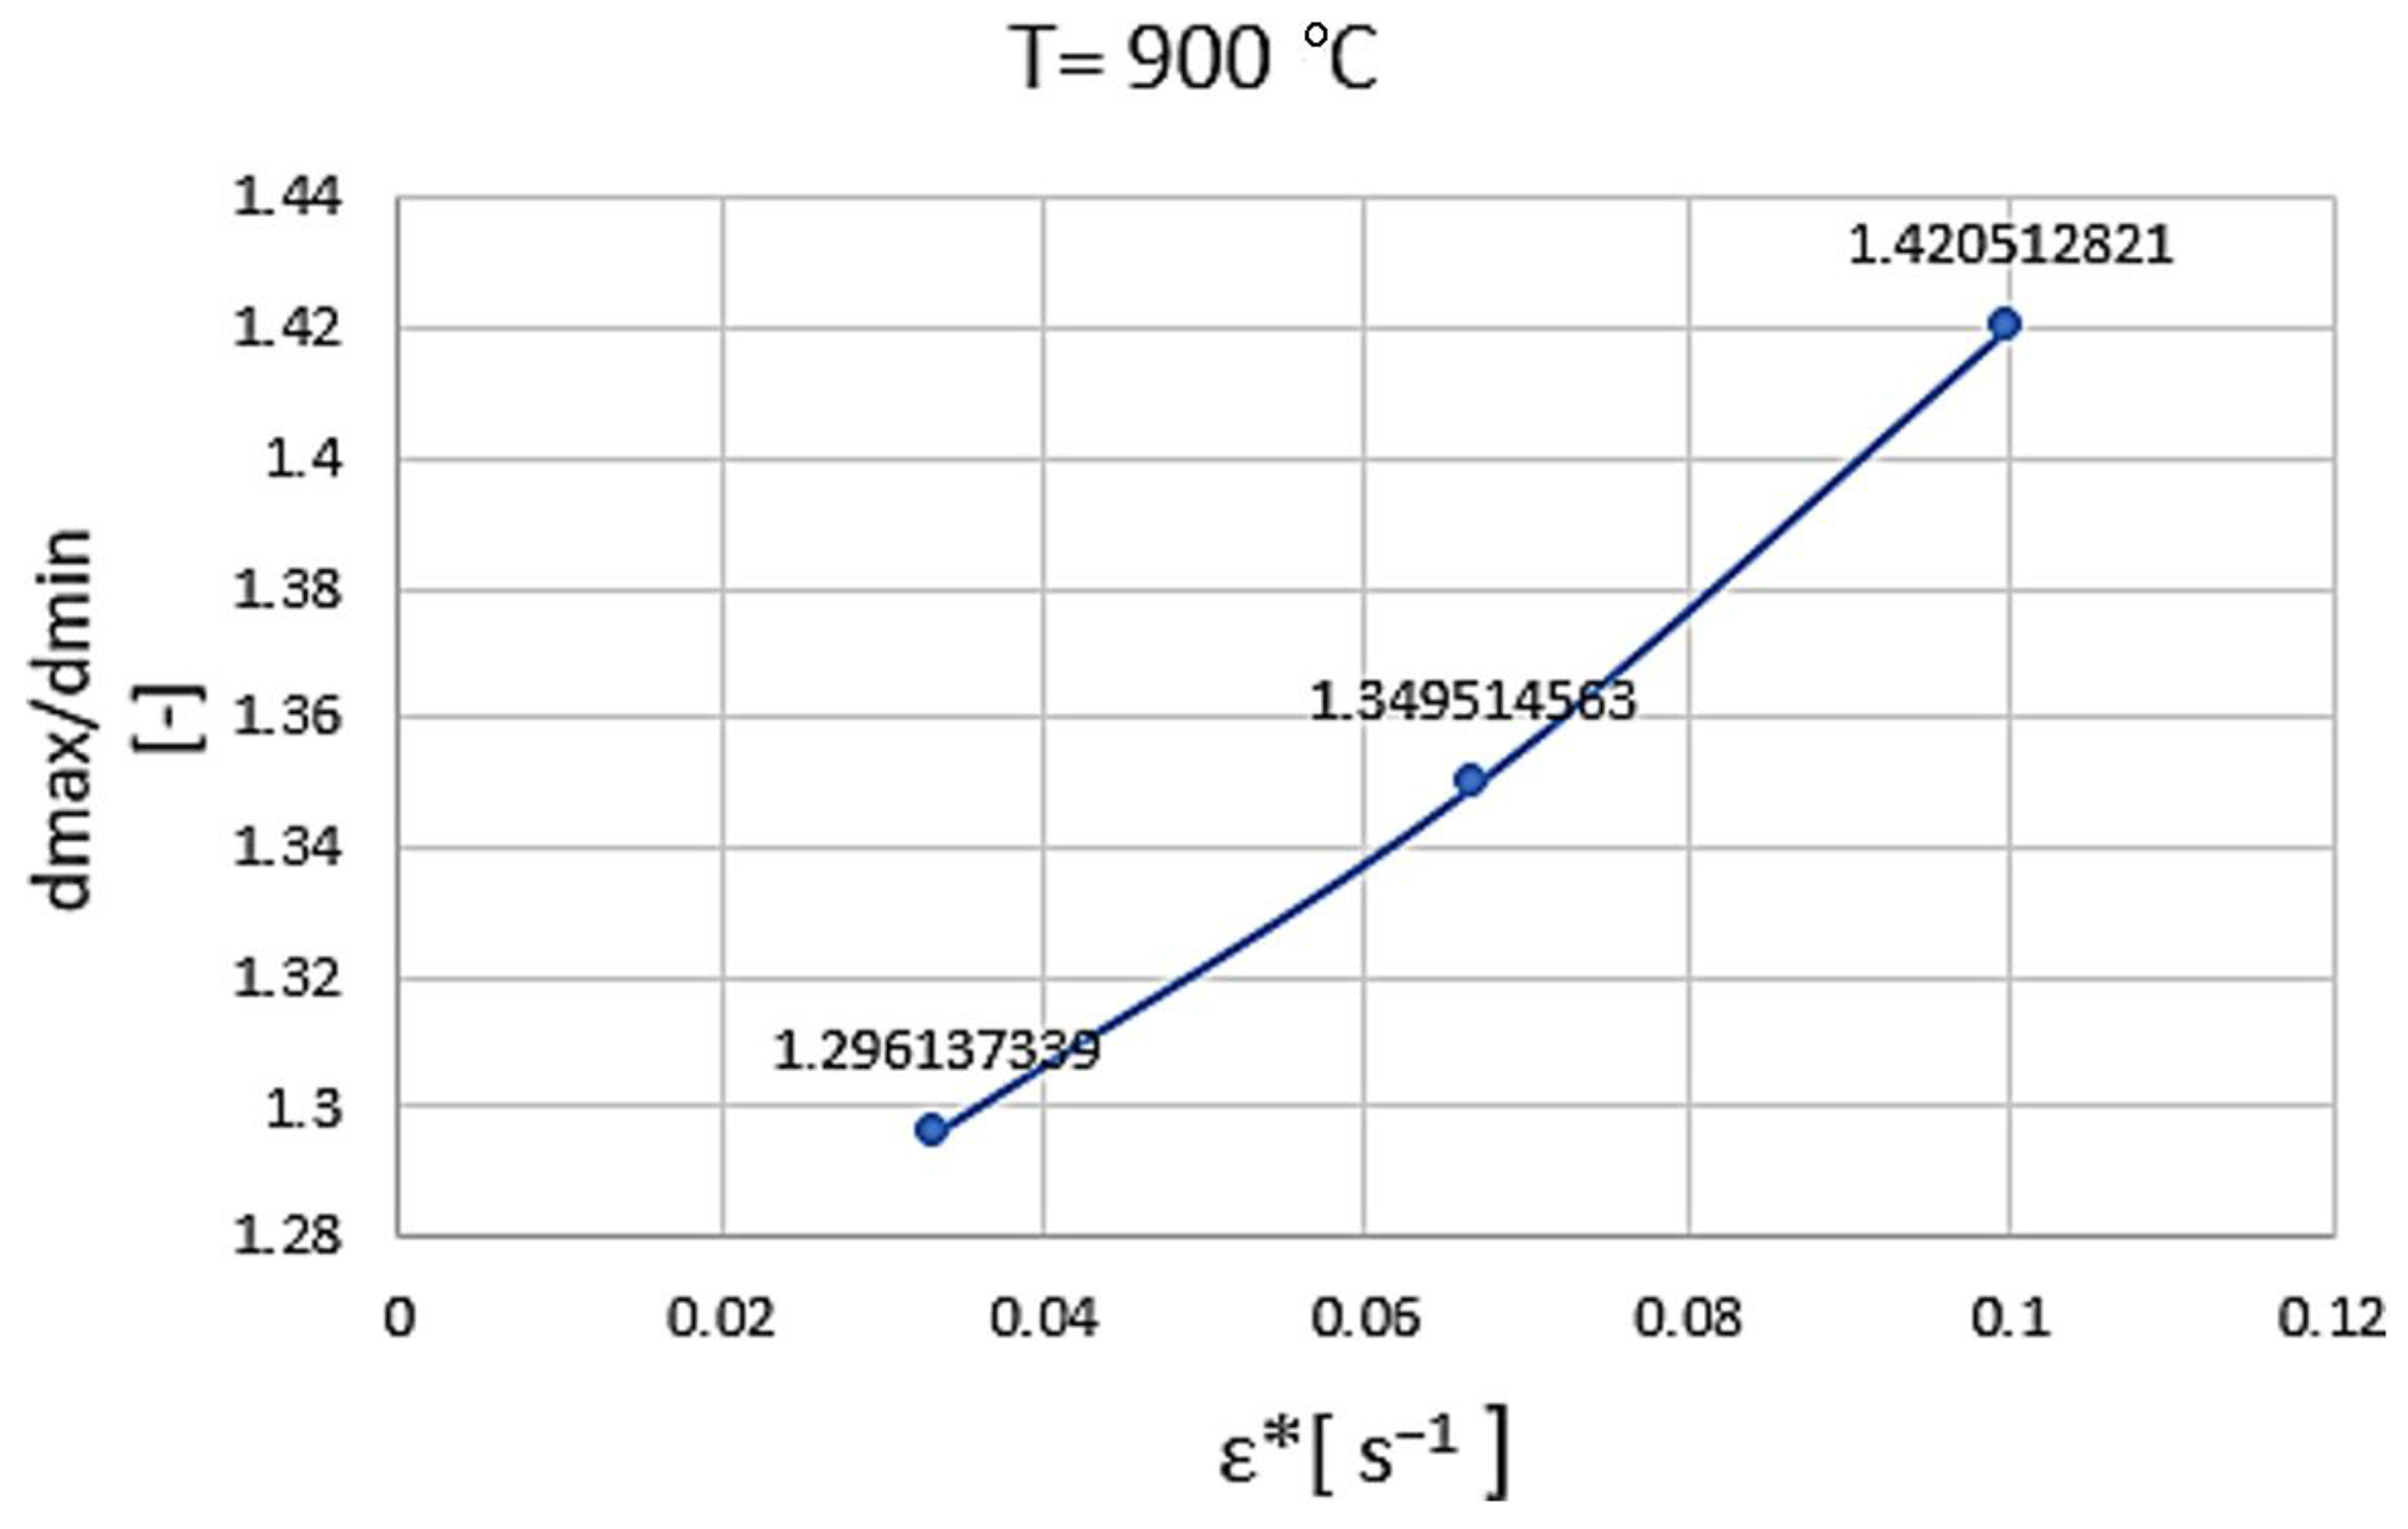
Figure 19.
The variation of deformation non-uniformity vs. strain rate at 800 °C.
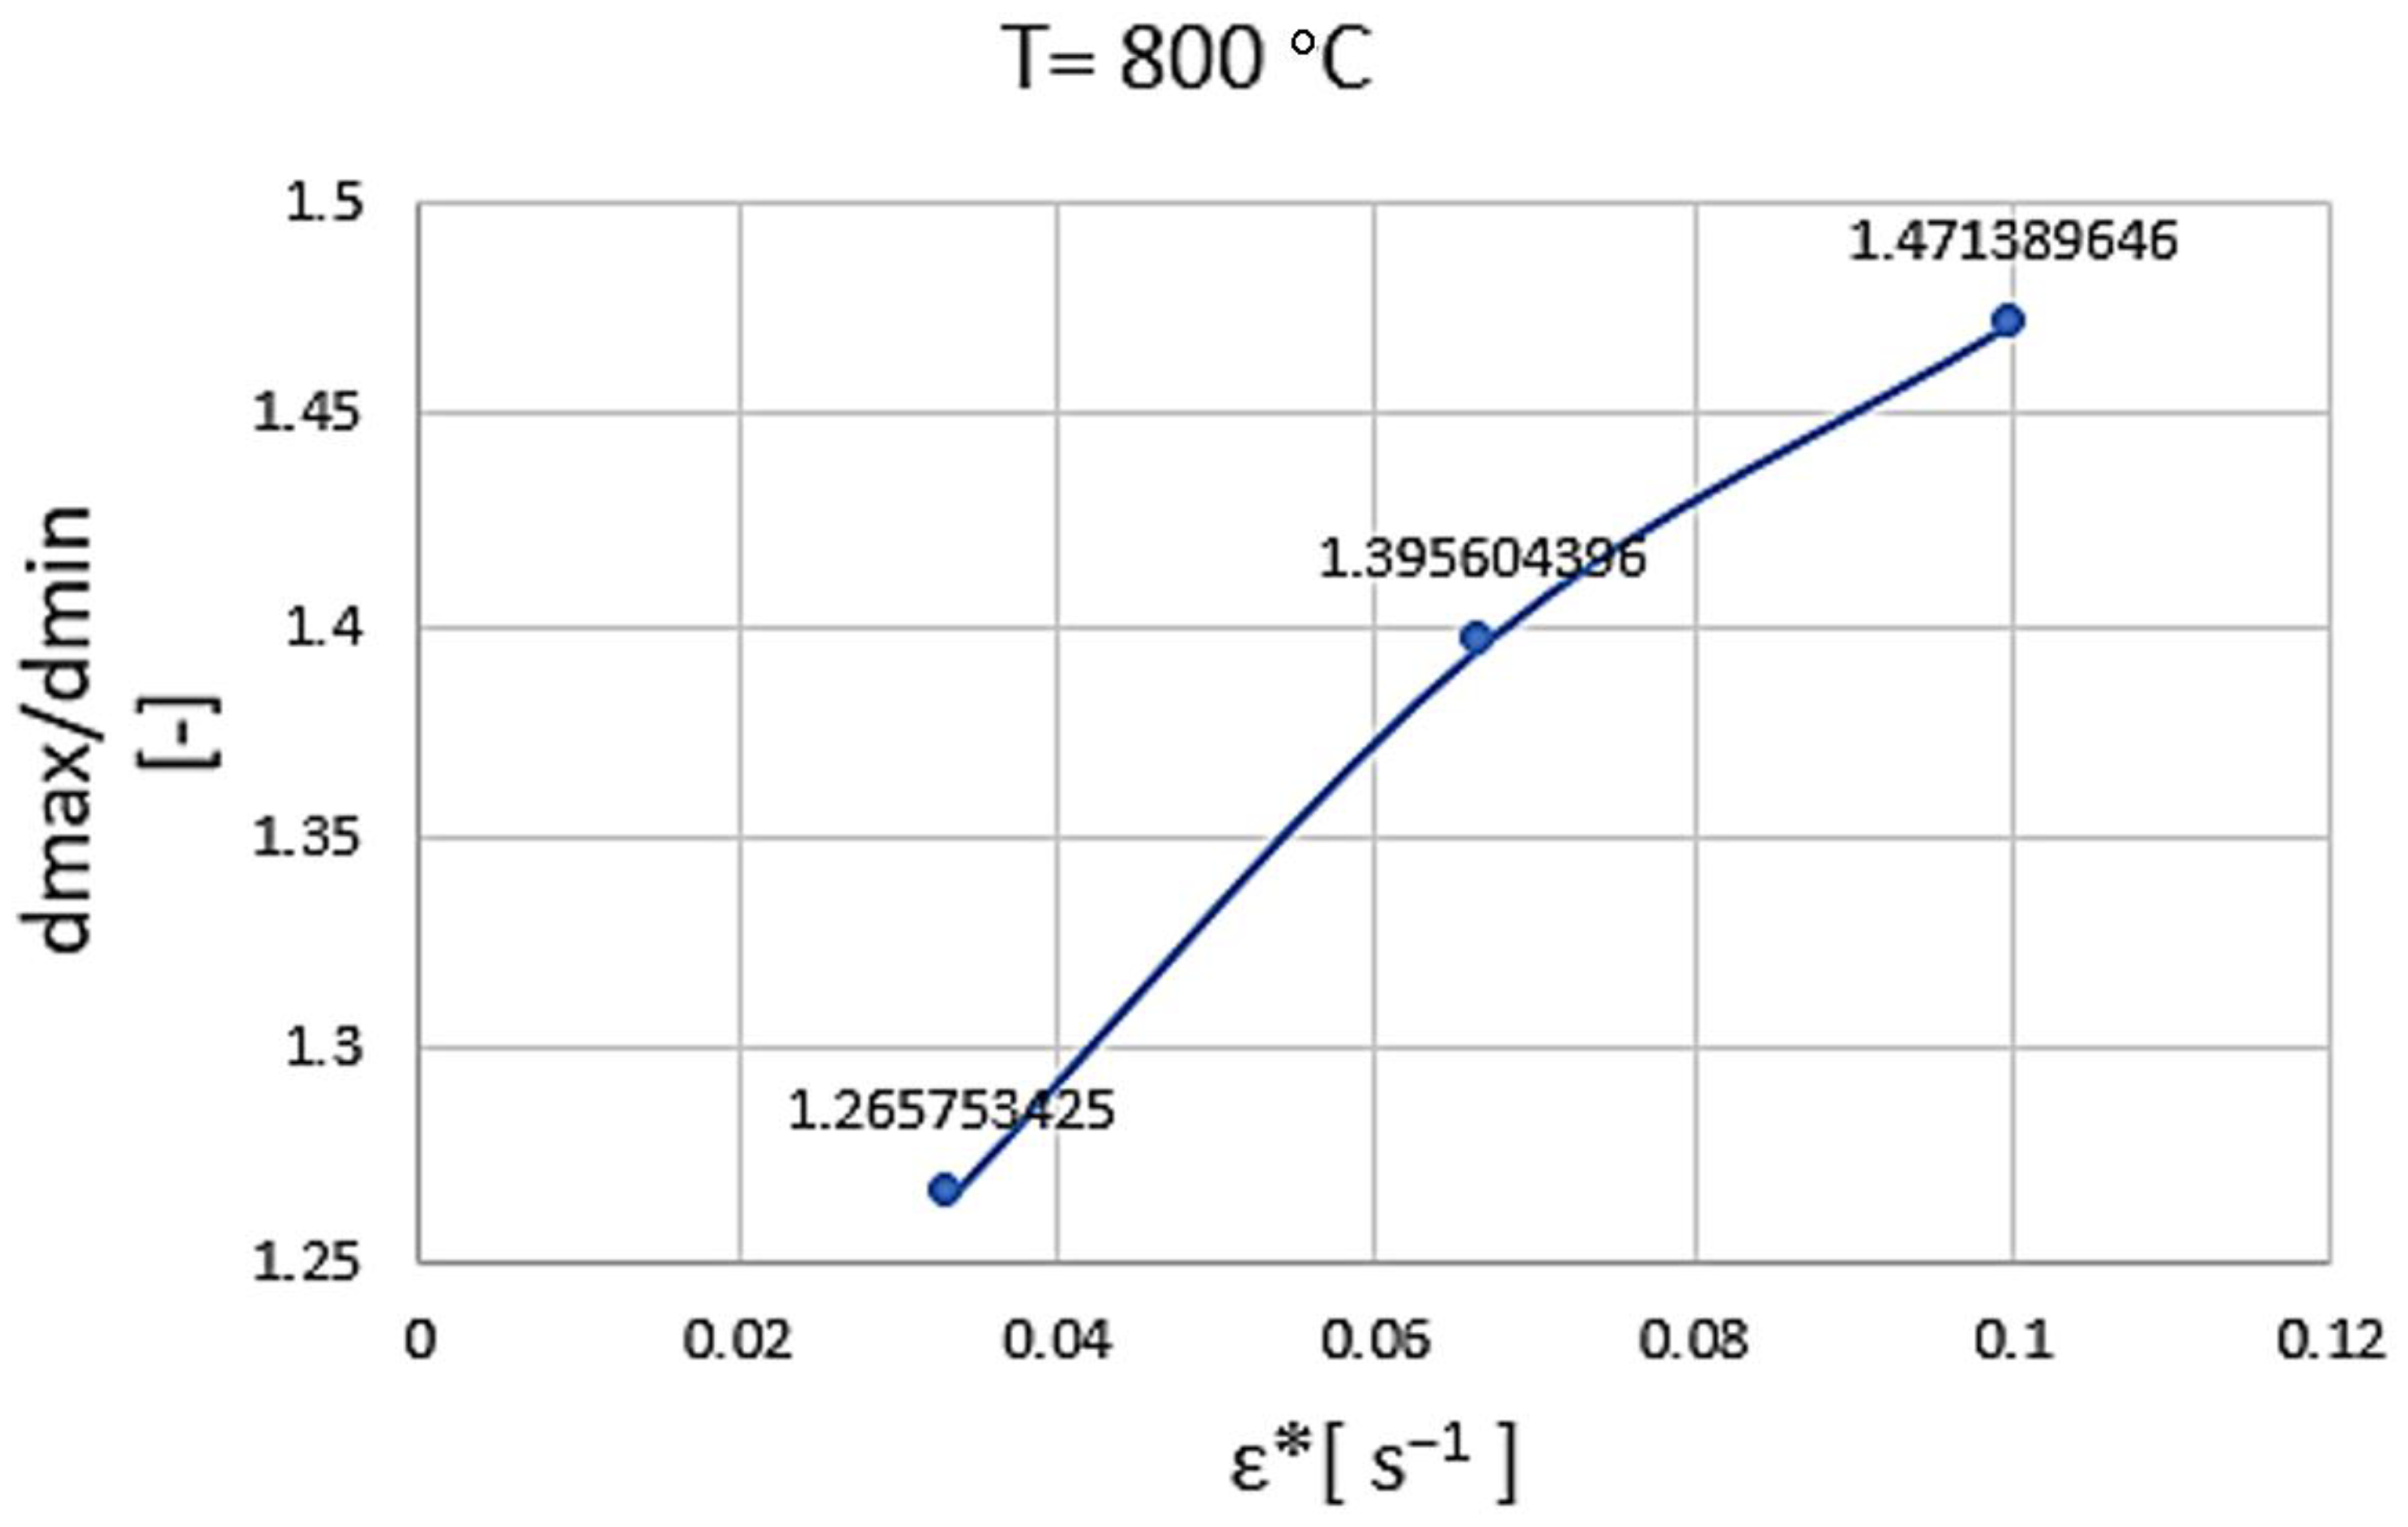
Figure 20.
SEM microstructures after the tensile tests for different deformation conditions (700 °C): aici ar fi fost bine sa fie la 800 °C, dar nu avem imagini (a) 25x, 0.001 s-1; (c) 25x, 0.012 s-1; (e) 25x, 0.08 s-1; (b) 500x, 0.001 s-1; (d) 500x, 0.012 s-1; (f) 500x, 0.001 s-1.
Figure 20.
SEM microstructures after the tensile tests for different deformation conditions (700 °C): aici ar fi fost bine sa fie la 800 °C, dar nu avem imagini (a) 25x, 0.001 s-1; (c) 25x, 0.012 s-1; (e) 25x, 0.08 s-1; (b) 500x, 0.001 s-1; (d) 500x, 0.012 s-1; (f) 500x, 0.001 s-1.
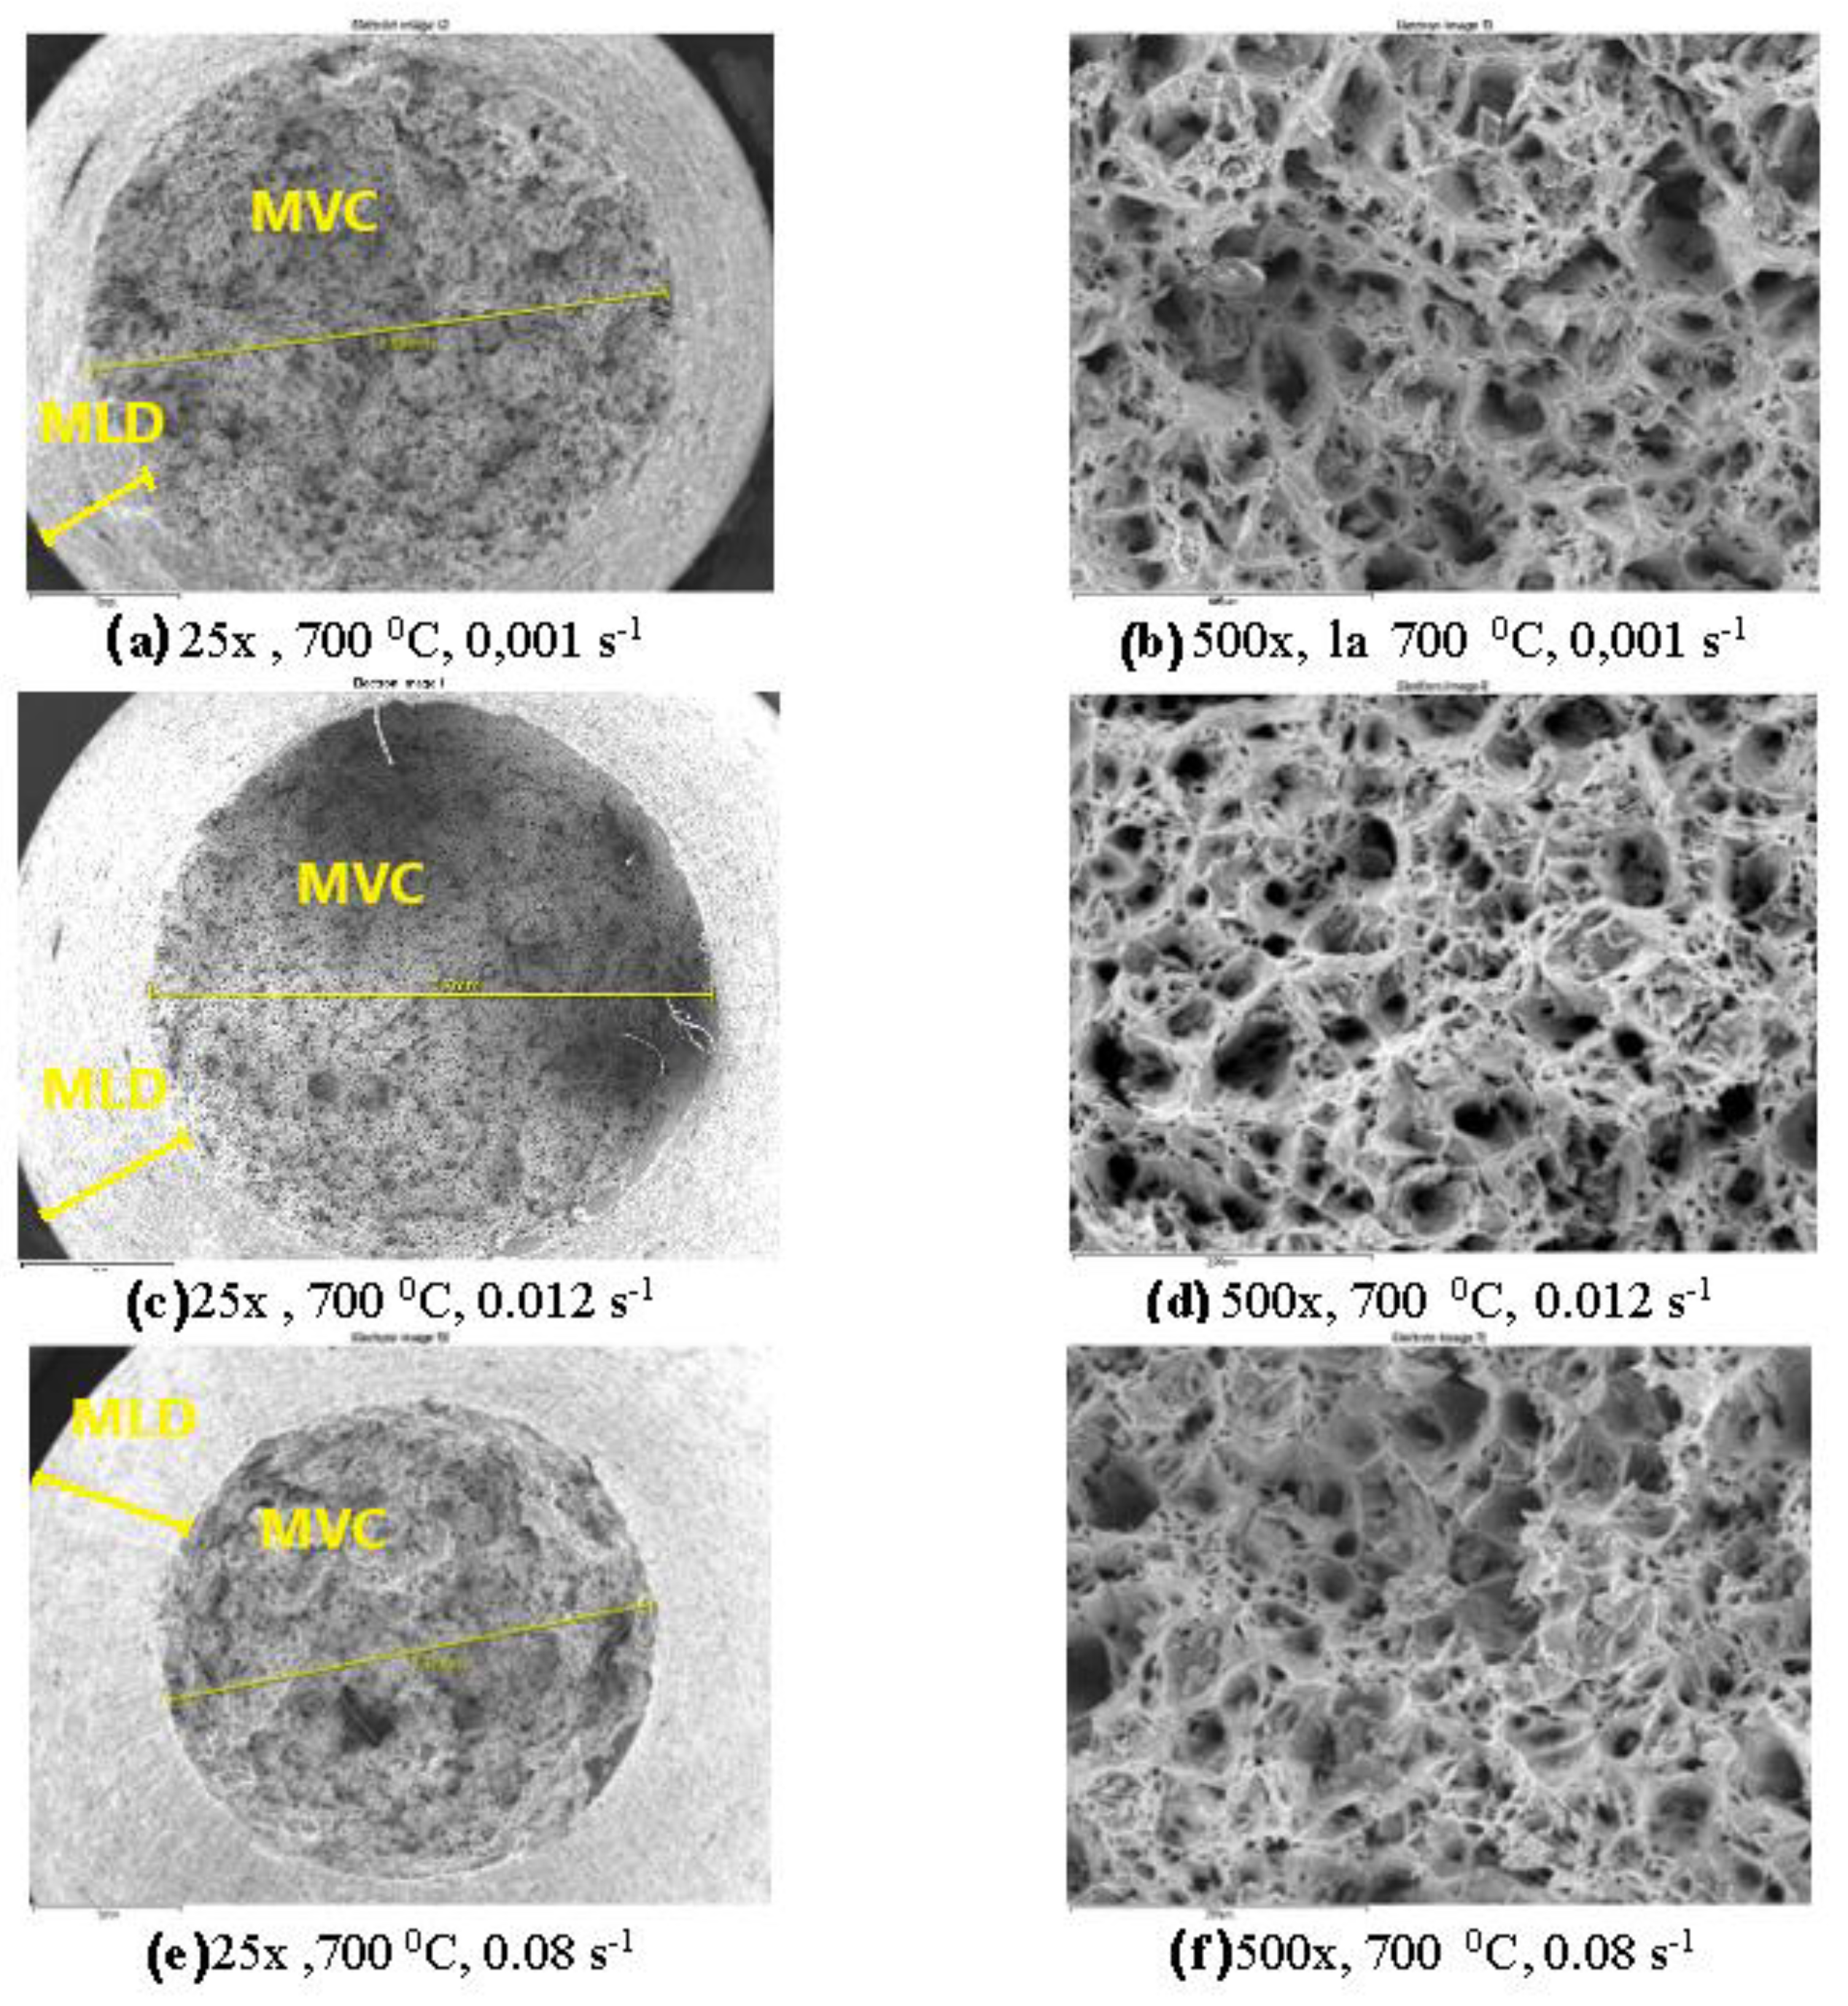
Figure 21.
SEM microstructures after the tensile tests for different deformation conditions (900 °C): (a) 25x, 0.001 s-1; (c) 25x, 0.08 s-1; (b) 500x, 0.001 s-1; (d) 500x, 0.08 s-1.
Figure 21.
SEM microstructures after the tensile tests for different deformation conditions (900 °C): (a) 25x, 0.001 s-1; (c) 25x, 0.08 s-1; (b) 500x, 0.001 s-1; (d) 500x, 0.08 s-1.
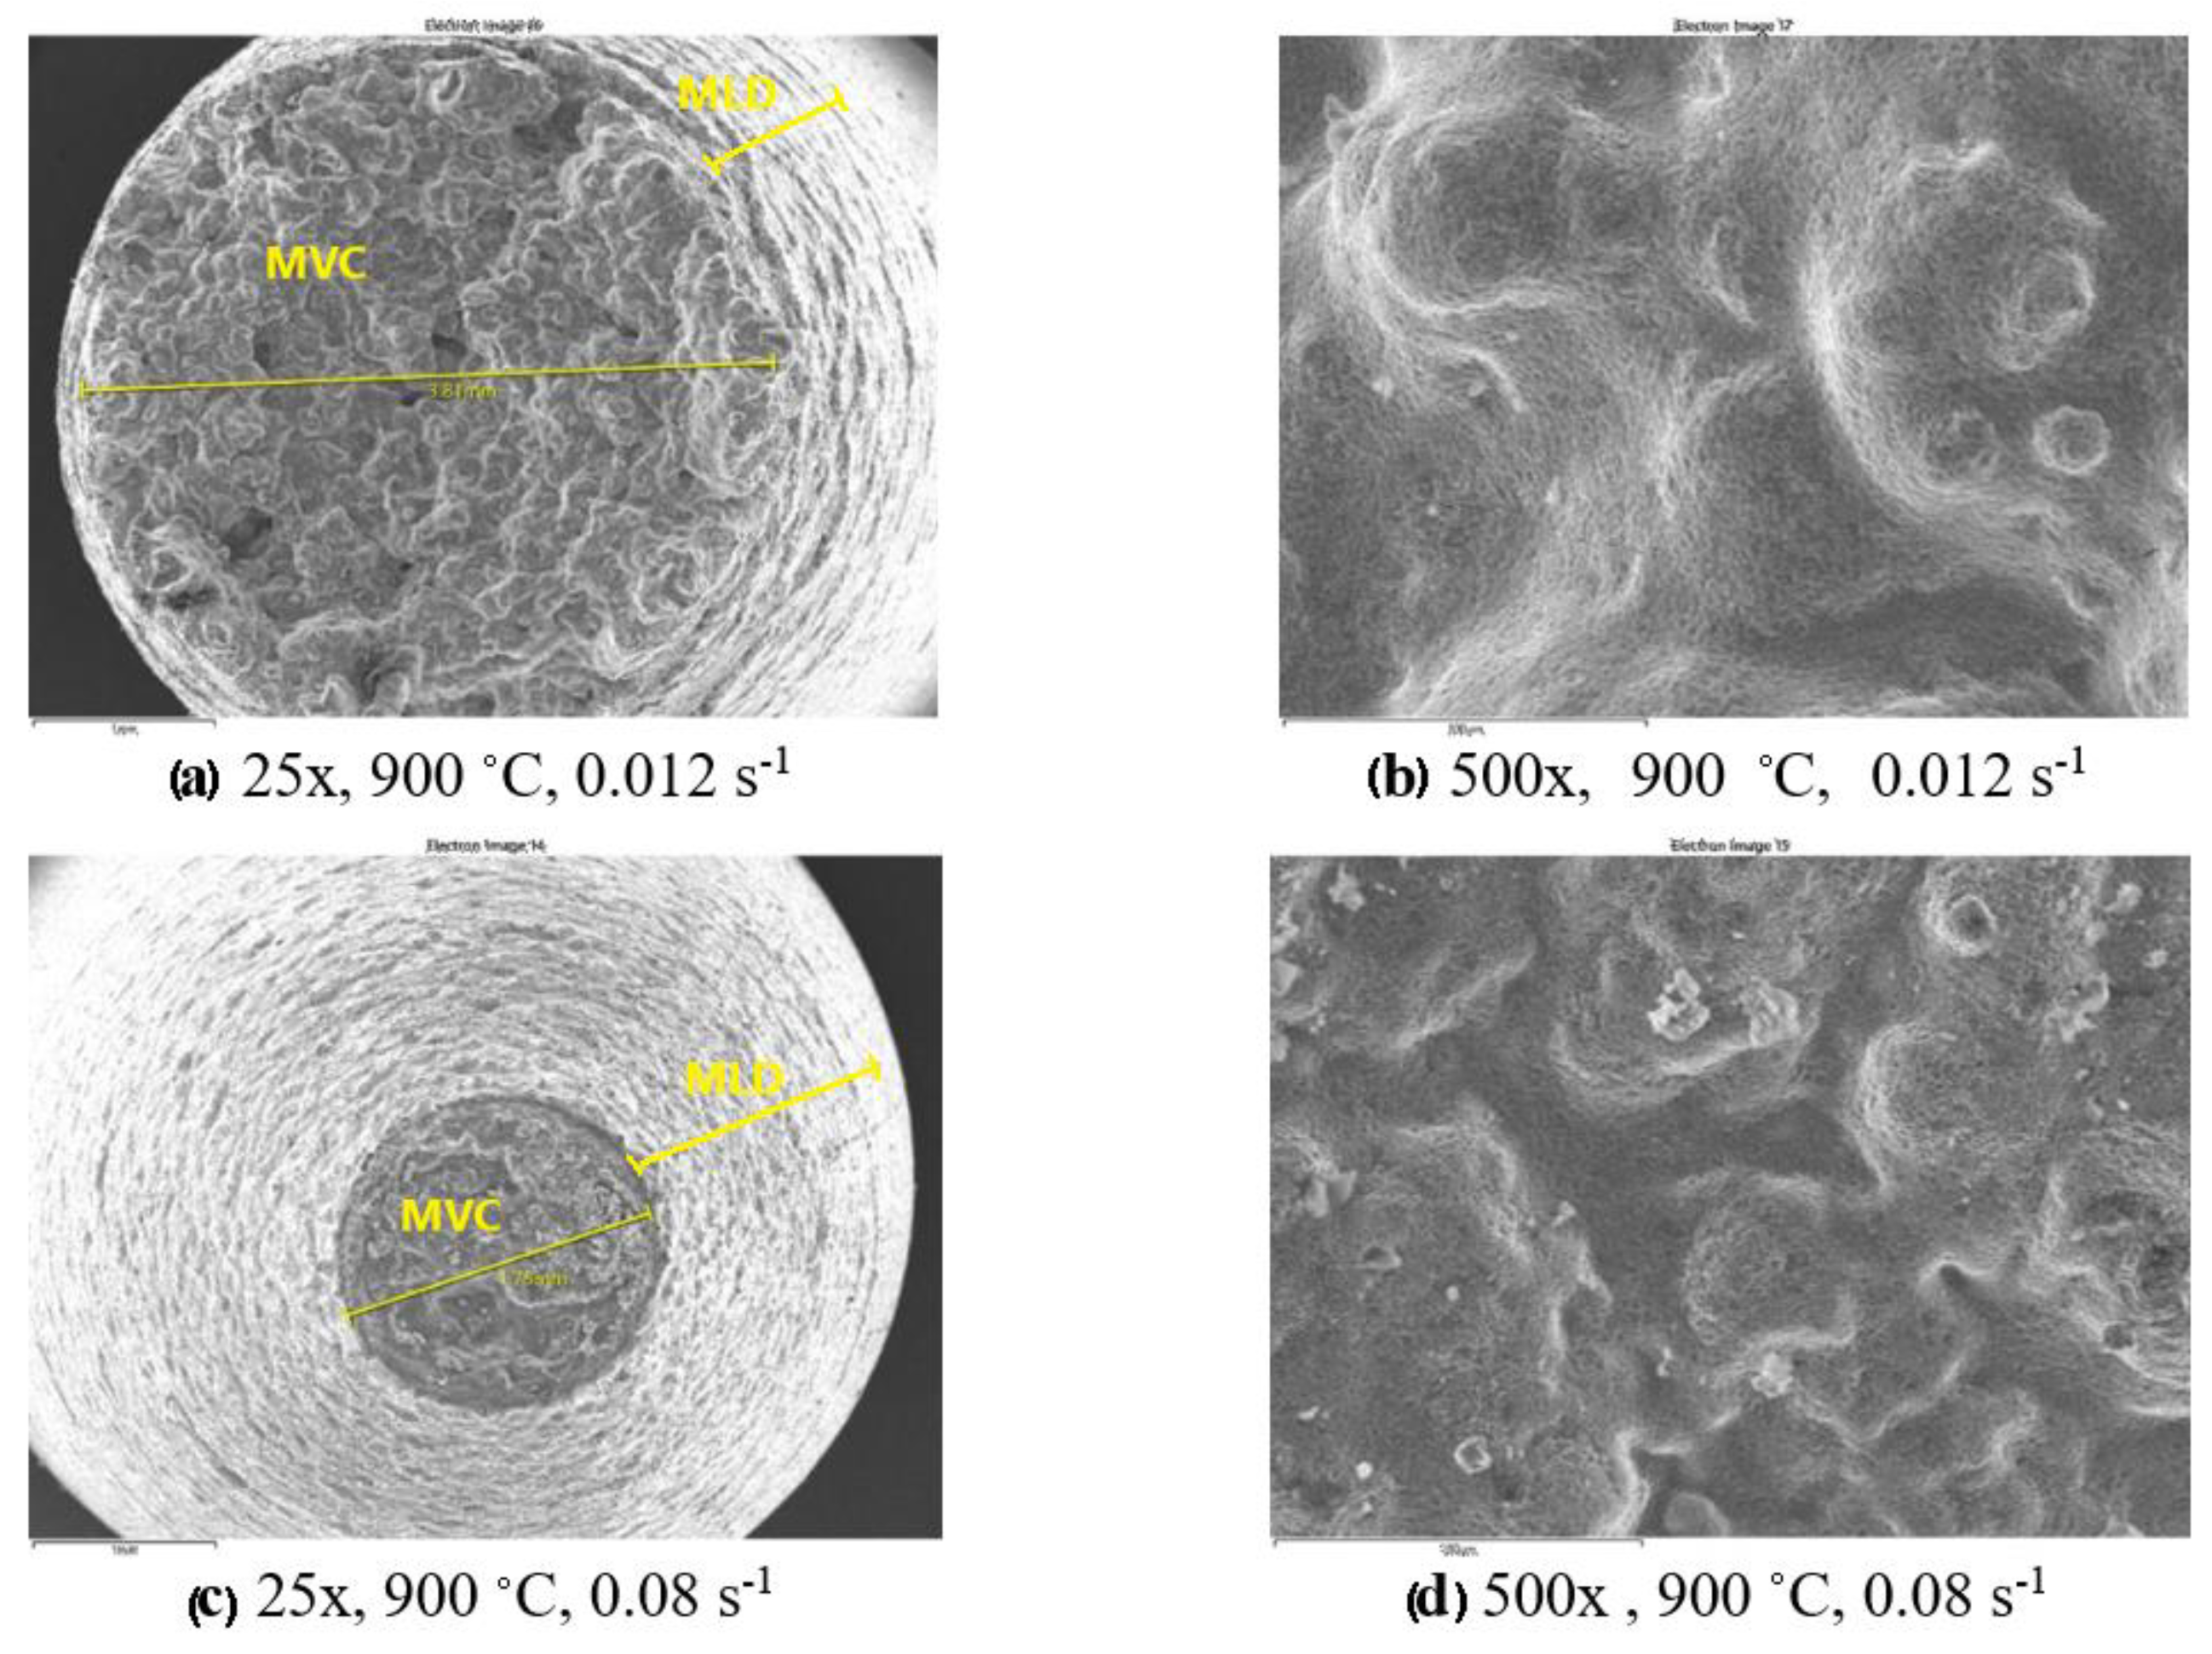
Figure 22.
SEM microstructures after the tensile tests for different deformation conditions (1000 °C): (a) 25x, 0.001 s-1; (c) 25x, 0.012 s-1; (e) 25x, 0.08 s-1; (b) 500x, 0.001 s-1; (d) 500x, 0.012 s-1; (f) 500x, 0.001 s-1.
Figure 22.
SEM microstructures after the tensile tests for different deformation conditions (1000 °C): (a) 25x, 0.001 s-1; (c) 25x, 0.012 s-1; (e) 25x, 0.08 s-1; (b) 500x, 0.001 s-1; (d) 500x, 0.012 s-1; (f) 500x, 0.001 s-1.
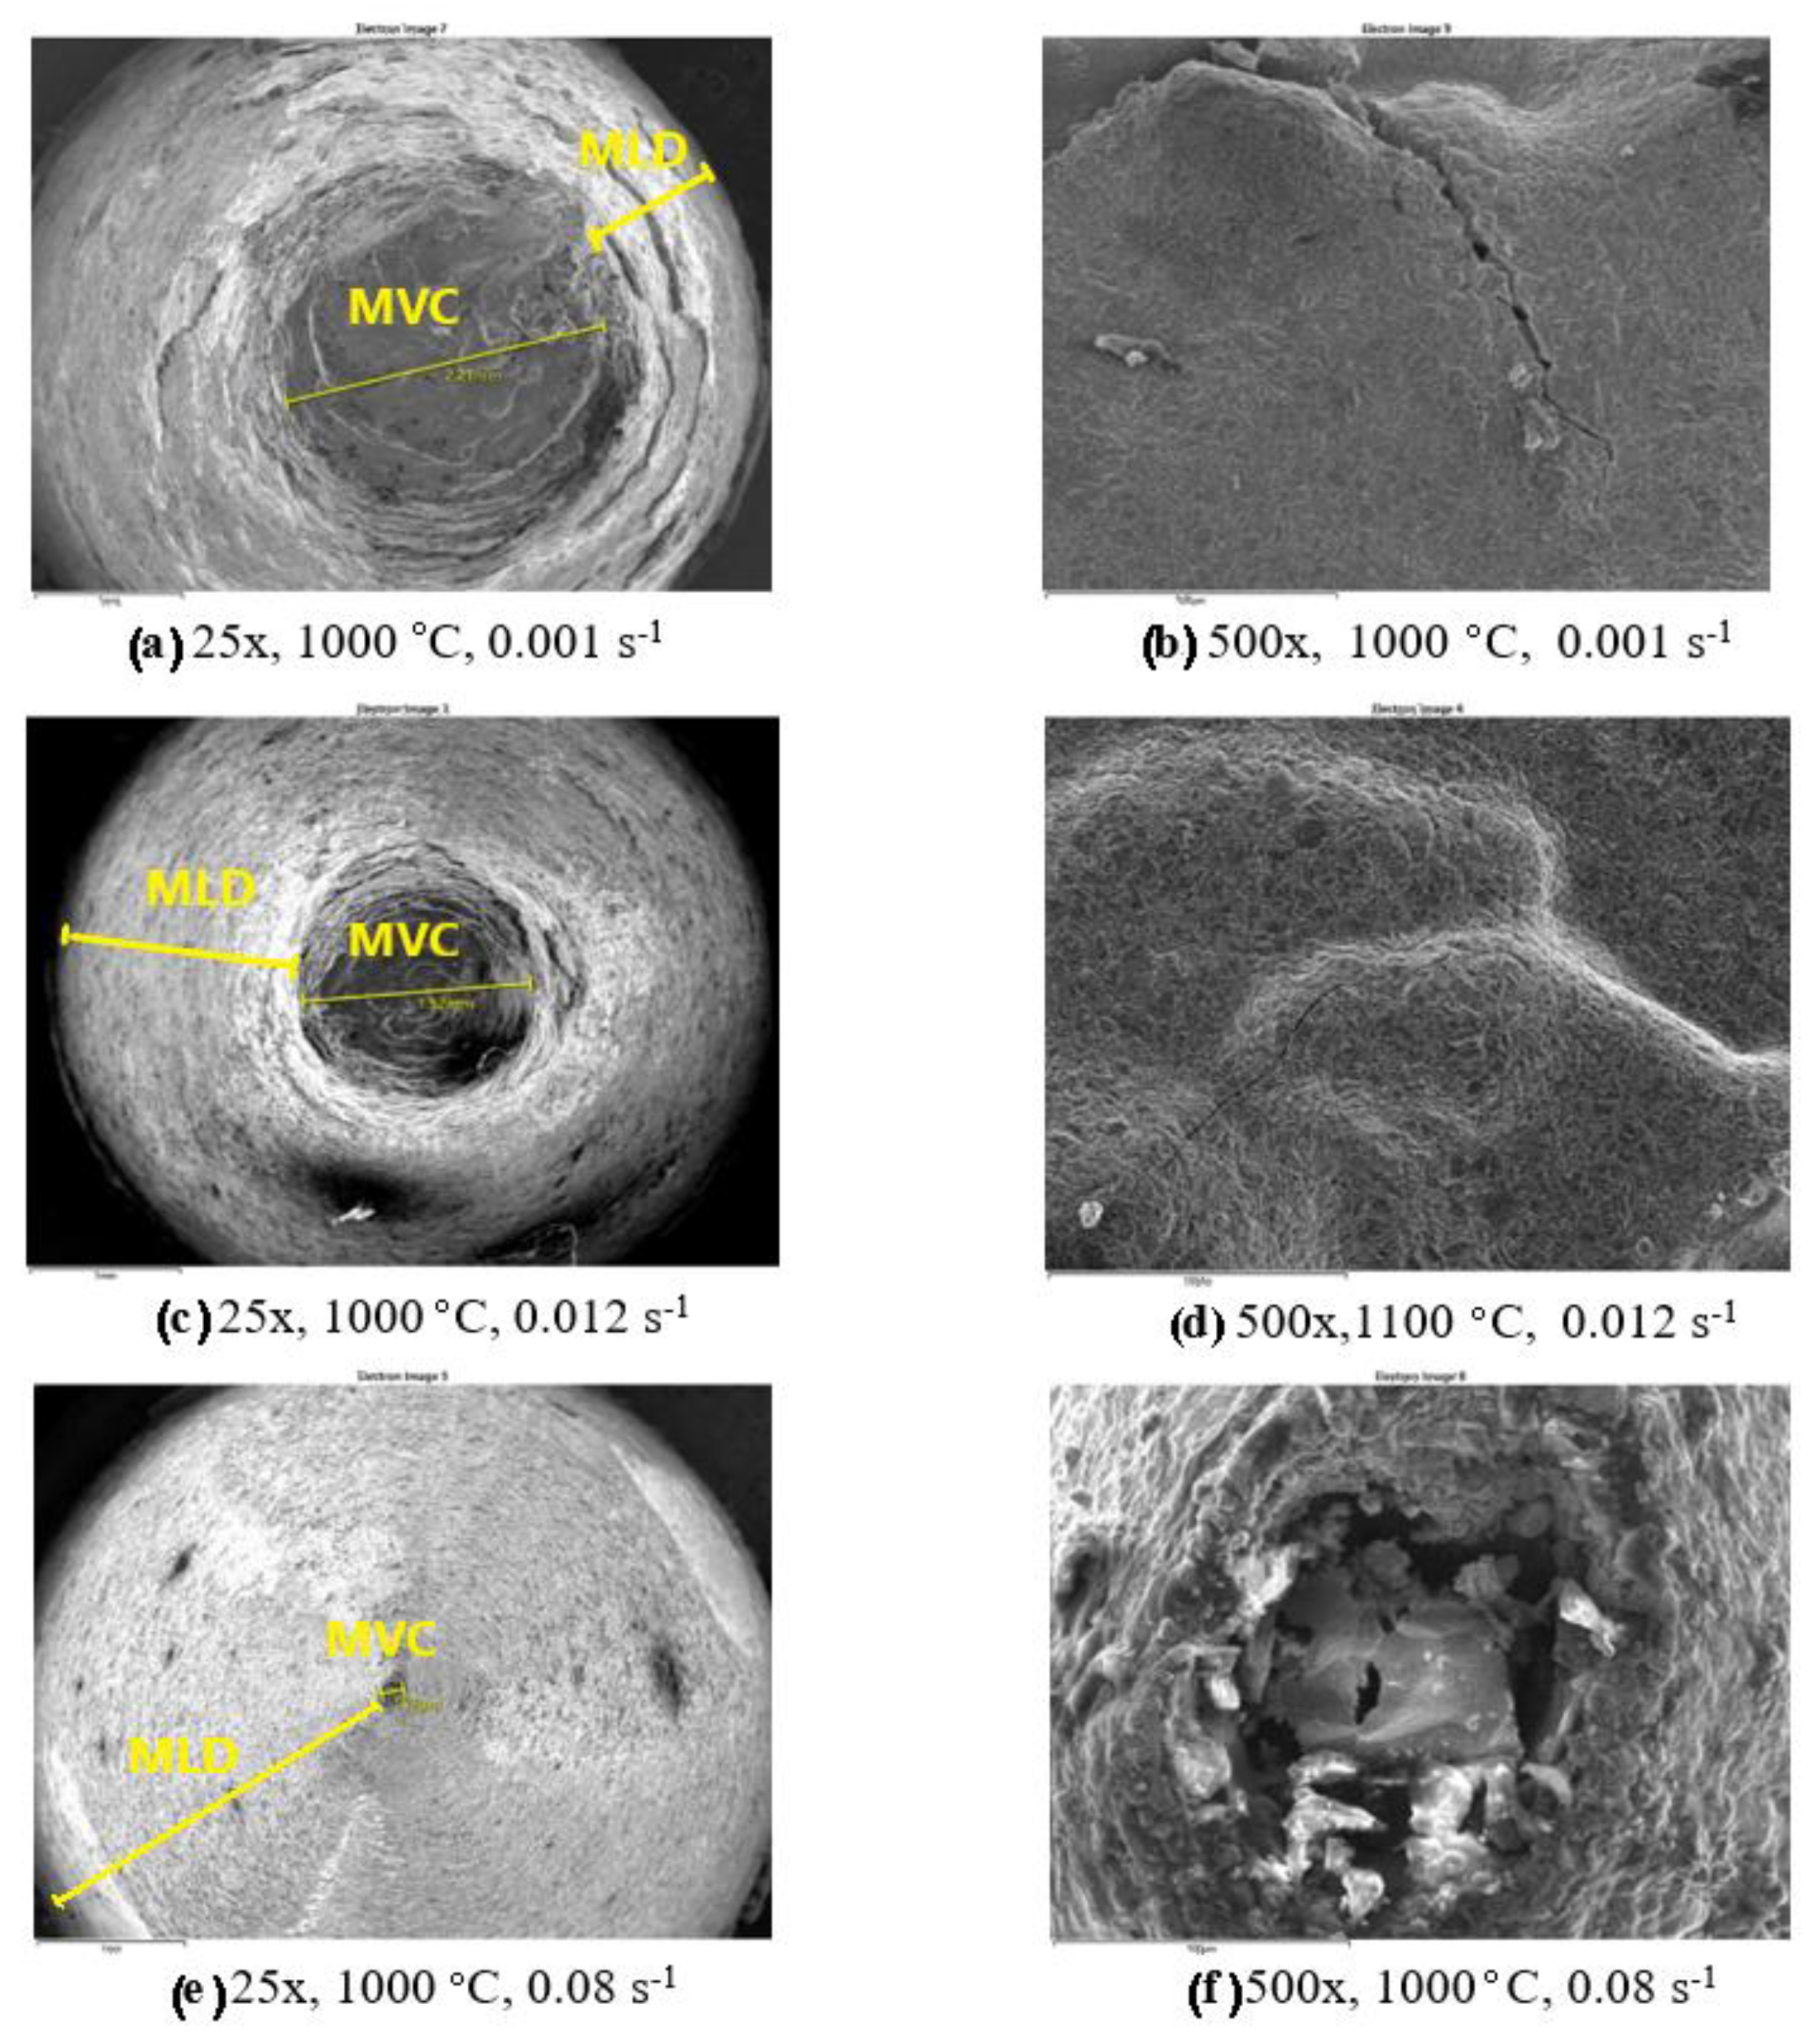
Figure 23.
SEM microstructures after the compression tests for different deformation conditions (800 °C, 900 °C and 1000 °C) at magnification 1000x, (a) Initial state; 0.001 s-1; (b) 800 °C, 0.1 s-1; (c) 800 °C, 0.06 s-1; (d) 800 °C, 0.03 s-1; (e) 900 °C, 0.1 s-1; (f) 900 °C, 0.06 s-1; (g) 900 °C, 0.03 s-1; (h) 1000 °C, 0.1 s-1; (i) 1000 °C, 0.06 s-1; (j) 1000 °C, 0.03 s-1.
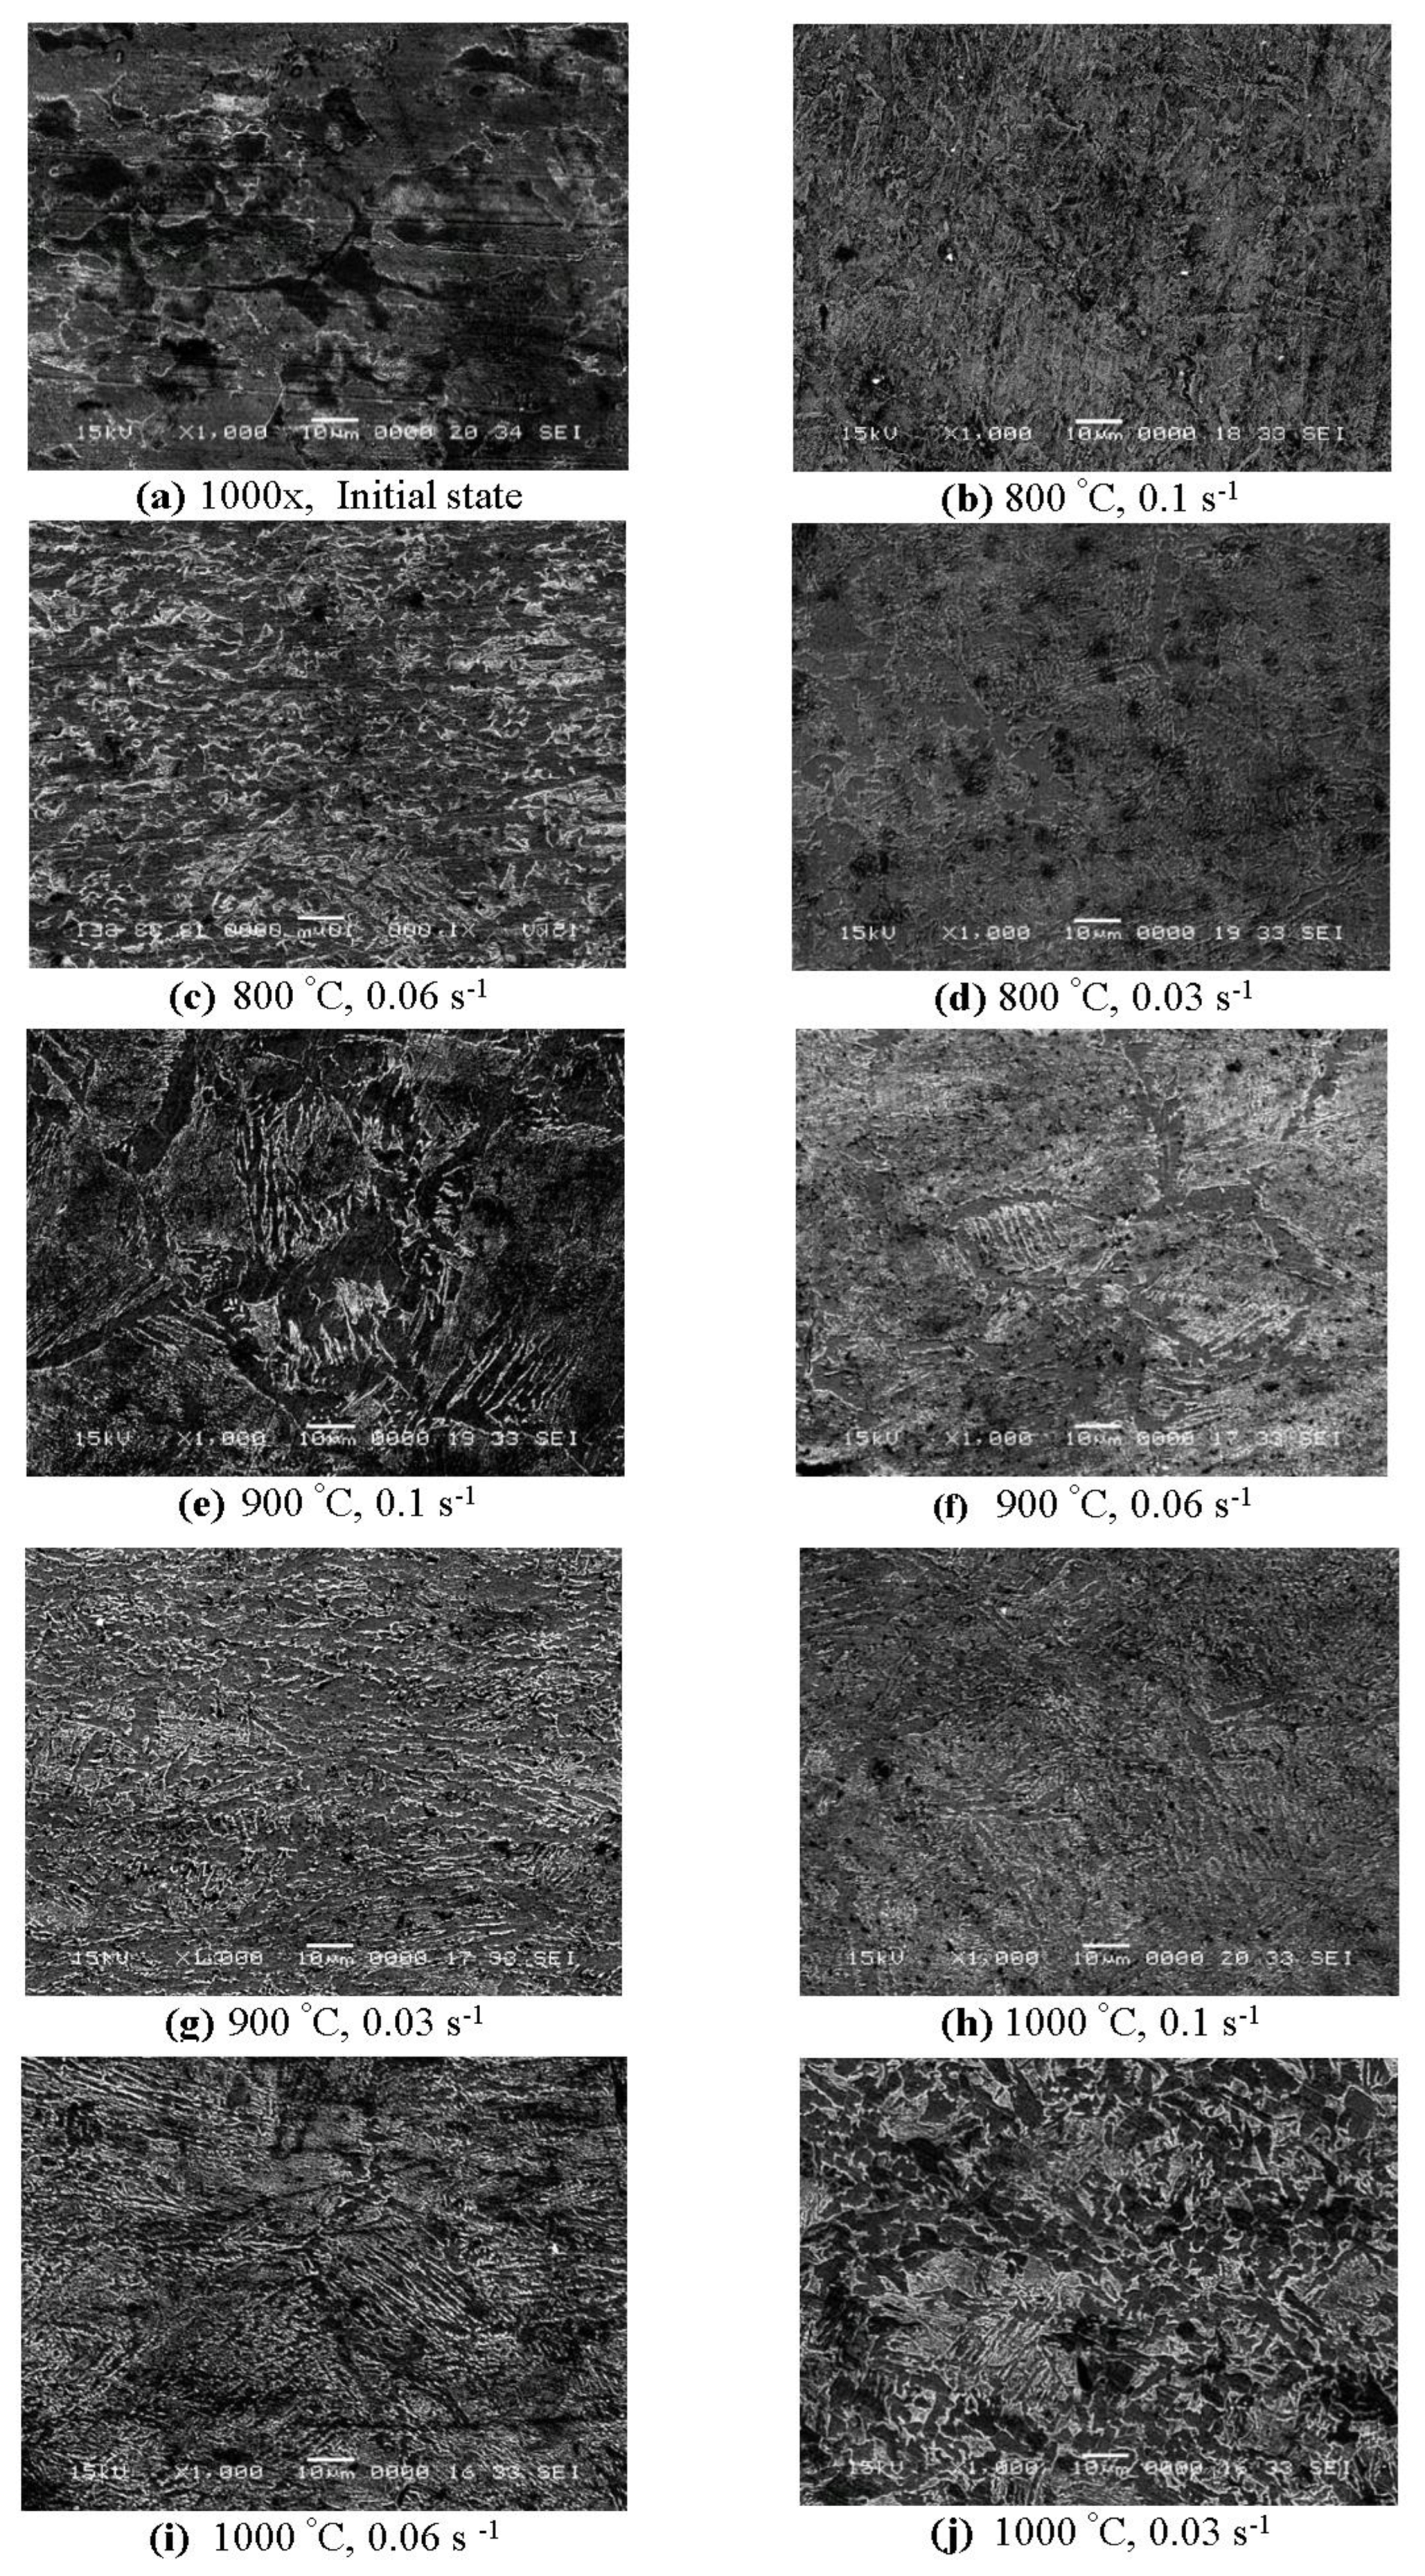

Table 1.
The chemical composition of 42CrMo4 steel (wt.%).
| C | Si | Mn | P | S | Cr | Mo |
|---|---|---|---|---|---|---|
| 0.38 – 0.45 | Max 0.4 | 0.6 – 0.9 | Max 0.025 | Max 0.035 | 0.9 – 1.2 | 0.15 – 0.3 |
Disclaimer/Publisher’s Note: The statements, opinions and data contained in all publications are solely those of the individual author(s) and contributor(s) and not of MDPI and/or the editor(s). MDPI and/or the editor(s) disclaim responsibility for any injury to people or property resulting from any ideas, methods, instructions or products referred to in the content. |
© 2023 by the authors. Licensee MDPI, Basel, Switzerland. This article is an open access article distributed under the terms and conditions of the Creative Commons Attribution (CC BY) license (http://creativecommons.org/licenses/by/4.0/).
Copyright: This open access article is published under a Creative Commons CC BY 4.0 license, which permit the free download, distribution, and reuse, provided that the author and preprint are cited in any reuse.


