
Submitted:
14 September 2023
Posted:
19 September 2023
You are already at the latest version
Abstract
The autosomal recessive disorder Ataxia-Telangiectasia is caused by dysfunction of the stress response protein ATM. In the nucleus of proliferating cells, ATM senses DNA double-strand breaks and coordinates their repair. This role explains T-cell dysfunction and tumor risk. However, it remains unclear whether this function is relevant for postmitotic neurons and underlies the cerebellar atrophy, since ATM is cytoplasmic in postmitotic neurons. Here, we used ATM-null mice that survived early immune deficits by bone-marrow transplantation, and reached initial neurodegeneration stages at 12 months of age. Global cerebellar transcriptomics demonstrated ATM depletion to trigger upregulations in most neurotransmission and neuropeptide systems. Downregulated transcripts were found for the ATM interactome component Usp2, many non-coding RNAs, ataxia genes Itpr1, Grid2, immediate early genes and immunity factors. Allelic splice changes affected prominently neuropeptide machinery, e.g. Oprm1. Validation experiments with stressors were performed in human neuroblastoma cells, where ATM localized only to cytoplasm, similar to brain. Effect confirmation in SH-SY5Y cells occurred after ATM depletion and osmotic stress better than nutrient / oxidative stress, not after ATM kinase inhibition or DNA stressor bleomycin. Overall, we provide pioneer observations from a faithful A-T mouse model, which suggest general changes in synaptic and dense-core vesicle stress adaptation.
Keywords:
cerebellar ataxia
; cytoplasmic ATM
; synaptic pathology
1. Introduction
The disease Ataxia Telangiectasia (A-T) is autosomal recessively inherited, shows a prevalence of 1:100,000 inhabitants, manifests in childhood and shortens lifespan to 25 years on average [1-3]. The diagnostic initial signs include problems of equilibrium (ataxia) and speech, together with uncontrolled eye movements, due to progressively impaired motor coordination in the cerebellar neural circuits, as well as a dilatation of capillary blood vessels (telangiectasia). Blood tests will reveal an abnormal elevation of the prenatal osmosis regulator AFP (alpha-fetoprotein), which should normally be downregulated in postnatal life to be substituted by albumin [4, 5]. Recently, neurofilament light chain (NfL) has been described as a potential biomarker for neurodegeneration from early stages of A-T [6, 7]. In subsequent years, a combined immune deficiency will lead to infections of sinus and lungs, and over time to bronchiectasis [8]. Among classical A-T patients, IgA deficiency correlates with the poorest prognosis [9]. Gonadal atrophy will ensue, with gametogenesis undergoing meiotic arrest in early prophase, due to abnormal synaptonemal complex assembly resulting in fragmented chromosomes [10, 11]. Body weight and height decline with age, accompanied by deficient secretion of growth hormone (GH) and trophic factors such as blood IGF-1, suggesting age-associated nutrient regulation stress [12-14]. A-T patients are particularly vulnerable to ionizing radiation and ultraviolet B light (UVB wavelength is responsible e.g. for sunburns of skin), so their risk of cancer is elevated, manifesting particularly lymphoma and leukemia in childhood, and breast cancer in adulthood [15, 16]. Among these disease phenotypes, only immune deficits, infertility, and cancer risks have been mechanistically explained by the crucial role of nuclear ATM (the protein kinase Ataxia Telangiectasia Mutated, where nonsense or missense mutations usually trigger the A-T phenotype) for the detection and repair of DNA double-strand breaks (DSB) [17]. These DNA damage responses (DDR) coordinated by ATM are required to generate adequate antibody diversity in rapidly proliferating lymphocytes via V(D)J and class switch recombination [18, 19]. However, there is an ongoing debate (1) why the osmotic regulator AFP increases and blood vessels dilate, (2) why nutrients are inadequately controlled in growth, and (3) why selectively post-mitotic neurons in the cerebellum should undergo insidious atrophy [20-23].
More detailed insights about ATM cellular expression, its subcellular redistribution, its stable interaction partners and its transient phosphorylation targets, together with its downstream signaling effects, are urgently needed. Such knowledge would help to understand the cerebellar pathogenesis and to design therapeutic approaches. Currently we only know that cerebellar ATM is expressed mainly in excitatory glutamatergic granule neurons, but also in efferent inhibitory GABAergic Purkinje neurons [24], other cerebellar neurons and afferent neural projections from the brainstem (see https://mouse.brain-map.org/gene/show/11706), as well as glial and endothelial cells. Its expression levels change with stress / stimulus responses [25]. Immunohistochemical and ultrastructural evidence showed neuronal ATM to localize to the cytoplasmic more than the nuclear compartment [24, 26]. In immunoblots of nuclear versus cytoplasmic protein extracts from mice at maximal age 6 weeks, cytoplasmic ATM was solidly detected in cerebellum but not in spleen or in thymus, while nuclear ATM remained strongly predominant even in cerebellum at this young age [27]. However, this might change in adult animals when neuronal circuitry and myelination are complete. Regarding the ATM interactome, it is important to note that ATM is a member of the PIKK family (phosphoinositide 3-kinase-related kinases), which is anchored at membranes via the FATC domain [28, 29]. Most other PIKKs phosphorylate inositol lipids, while ATM and its homolog ATR were reported to target selectively serine or threonine followed by glutamine (SQ-TQ motif) amino acids within several hundred protein substrates identified so far [17]. ATM mutation affects the membrane interface between endoplasmic reticulum and mitochondria [30], as well as endosomes, peroxisomes, lysosomal and autophagic vesicles [24, 31, 32]. Upon endosomal association, ATM was found to interact with beta-Adaptin (AP1B1 / AP2B1) and Neuronal Adaptin-like beta-subunit Protein (beta-NAP) [33]. The cytoplasmic portion of ATM prompted different studies about altered pathways there, and about additional ATM functions [34-37], but a conclusive mechanistic scenario has not emerged yet. Association of ATM with presynaptic neurotransmitter-containing vesicles was also demonstrated [38], with a preferential binding to excitatory vesicles that contain VGLUT1 as glutamate transporter to control their quantal size [39, 40]. Pre- and post-synaptic swelling and loss of cytosolic texture were detectable by electron microscopy in ATM-null mouse cerebellar cortex already at age 2 months [41]. Cerebellar Purkinje pathology involves defects in calcium spike bursts and calcium currents, as well as the progressive reduction in spontaneous action potential firing frequency, from the age of 6 weeks to their maximal lifespan of 5 months in the absence of treatment [42]. Overall, the absence of ATM protein from its physiological membrane association in neuronal cytoplasm clearly triggers age-associated neurodegeneration, but it remains unclear to what degree ATM acts via its physical interactions with membrane lipids and proteins, versus its protein kinase activity.
With regard to ATM presence as opposed to its kinase activity, it is important to know that mice expressing the kinase-deficient ATM exhibit an early embryonic lethality phenotype [43, 44], whereas ATM-null mice are viable and their affection becomes apparent only for the immune system at early adult ages. This might suggest that the absence of ATM is sensed and mostly compensated by cells, whereas substituting ATM function becomes much more difficult if it occupies the correct positions within its interactome, but fails to signal upon stress events. In mouse, the ATM deficiency usually results in shortened survival of hematopoietic cells, early frequent occurrence of lymphomas, and a lifespan over few months only, so the manifestation of ataxia and cerebellar atrophy is usually prevented by an untimely death due to the immune deficit [41, 45]. A dramatic extension of life expectancy from 4 to 12 months was achieved by bone-marrow transplants in ATM-null mice, and in such animals a decreased cerebellar size index was observed upon brain imaging at the age of 8 months [46].
Activation of normally inactive homodimeric ATM is differently regulated, when distinct stressors are applied. Variance in post-translational modifications and interaction partners of ATM exist. The DNA damage-dependent activation (e.g. by the DNA strand breaking drug bleomycin, or ionizing radiation) involves Ser1981 autophosphorylation, Lys3016 acetylation by KAT5, interaction with the MRN protein complex (MRE11, RAD50 and NBS1) and ATM monomerization [47-49]. In neuronal cells, strong excitation promotes immediate-early gene transcription via DNA-DSB, which are mediated by topoisomerase-1 cleavage complexes (TOP1cc), and have to be eliminated by ATM activation, otherwise toxic accumulation of R-loops will occur [50, 51]. It is thought that ATM senses TOP1cc / R-loops and organizes their removal, in a process that is impaired upon oxidative damage [17]. Indeed, elevated levels of R-loops were observed in ATM-null mouse testis, but not in brain tissue, at the age of 1 month [52]. Importantly, the R-loop activation of ATM promotes chromatin displacement of late-stage spliceosomes, so the alternative splicing in ATM mutants may be changed in genome-wide manner [53]. Some ATM-dependent changes in RNA processing were reported to be mediated by the nuclear splice regulator SAM68 [54]. Thus, RNA neurotoxicity via R-loops and SAM68, protein aggregation and unbalanced excitability have been proposed to underlie the ataxia and cerebellar atrophy in A-T, in view of similar clinico-pathological findings in other monogenic spinocerebellar ataxias where mutant AOA2, FRDA, ATXN2, ITPR1 trigger similar cytosolic pathways in pathogenesis [17, 55-57]. However, few other data are available to judge the overlap in pathogenesis between diverse monogenic ataxias, and to decide which other cerebellar ataxias are closest to A-T.
In contrast to these mechanisms following DNA and RNA damage, the activation of ATM upon osmotic stress (e.g. by the drug chloroquine, or hypotonic shock) involves its interaction with ATMIN [47, 58].
Furthermore, activation of nuclear ATM via nutrient deprivation (by 2-deoxyglucose exposure) is mediated by inefficient assembly of a protein complex between endoplasmic reticulum and mitochondrial membranes, which is composed by IP3R1 (gene symbol ITPR1), GRP75 (gene symbol HSPA9), and VDAC1. This inadequate assembly results in impaired release of Ca2+ and excitability in the human bronchial epithelial cell line HBEC3-KT [30].
Finally, the activation of ATM via oxidative stress (e.g. by the drug sodium arsenite, abbreviated as NaARS, or by hydrogen peroxide H2O2) involves Cys2991 disulfide bonds linking active ATM homodimers, but appears independent from the MRN complex [59]. Again, ATMIN plays a relevant role in the protection against oxidative stressors [60]. All these mechanistic insights were obtained in cell culture or in young adult animals. Thus, at present it remains completely unclear which of these stressors and molecular response mechanisms would play the prominent role in cerebellum when the age-associated pathology manifests.
For the present study, we analysed cerebellar homogenates from bone-marrow-transplanted, 12-month-old ATM-null mice, documenting their global transcriptome by oligonucleotide microarrays, in the hope to elucidate the impact of ATM for RNA-mediated stress responses. With this approach, we hoped to answer the following questions: (1) Which impact exists on transcript levels of known ATM interactors, or known ATM phosphorylation substrates? (2) Which dysregulations occur in phosphoinositide pathway membrane factors, in vesicular factors, or in calcium homeostasis factors? (3) To what degree is the altered neuronal excitability reflected by dysregulations of neurotransmission factors or immediate early genes? (4) Were some dysregulations already observed in telangiectasia, in general growth deficit, or selective cerebellar atrophy, e.g. as known disease genes of other cerebellar ataxias? Such findings would define the mechanistic overlap with other genetic disorders. (5) Are there strong dysregulations of novel character outside these already explored pathways?
Validation work in vitro with further methods and samples was performed to answer additional questions: (6) Whether ATM in adult cerebellum is still mostly nuclear with solid cytosolic presence, and if the human neural SH-SY5Y cell line is a good model of ATM distribution, was assessed with differential detergent fractionation. (7) To understand if ATM kinase activity or ATM protein presence triggers such dysregulation events, we exposed the human neuroblastoma cell line SH-SY5Y either to the ATM kinase inhibitor drug KU-55933, or to stable ATM knockdown (KD) via shRNA, and quantified transcript alterations with RT-qPCR. (8) To identify which specific stressor agents provide the best model for the age-effect on dysregulated cerebellar transcripts in ATM-null mice, human SH-SY5Y cells with ATM-KD were assessed with RT-qPCR and quantitative immunoblots.
Overall, in ATM-null mice at advanced age, several strong cerebellar mRNA dysregulations were documented, and their reproducibility in cell culture after ATM depletion and stressor administration provided criteria to distinguish primary from secondary effects.
2. Materials and Methods
2.1. Animal model of Ataxia-Telangiectasia
To study the cerebellar atrophy of A-T, we used ATM-null mice (strain 002753 from the Jackson depository, also denominated as Atmtm1Awb/F or ATM-null or Atm-/-) [45] in the 129/SvEV genetic background. Animal procedures were approved by the regional authority (RPDA number FK/2000). Mice were housed in accordance with the German Animal Welfare Act, Council Directive of 24 November 1986 (86/609/EWG) Annex II, ETS123, and the EU Directive 2010/63/EU, at the FELASA-certified Central Animal Facility (ZFE) of Frankfurt University Medical School, employing type II L cages (365 x 207 x 140 mm3, floor area 530 cm2), with mutants and wildtype (WT) controls being bred and aged in parallel, under controlled conditions of temperature, humidity, and light/dark cycles of 12 h, providing food and water ad libitum. Genotyping of ear-punch DNA was done by PCR procedures are described previously [61].
2.2. Intravenous transplantation of whole bone marrow cells
As conditioning regimen, the recipient mice received 0.125 mg/ml anti-CD4 antibody (clone GK1.5, Sigma, Steinheim, Germany) and 0.125 mg/ml anti-CD8 antibody (clone 53–6.7, Sigma) 7 days before bone marrow transplantation (BMT), and then a second dose of each antibody together with 200 mg/kg cyclophosphamide (80 mg/ml, Sigma-Aldrich, St. Louis, Missouri, USA) 1 day before BMT for nonmyeloablative conditioning. Bone marrow cells were harvested in sterile manner from CD-90.2 depleted ATM-competent donor animals on the day of BMT, and 5 x 10⁶ bone marrow cells were injected intravenously into conditioned recipients [46, 62]. Ageing of mutants and sex- / age-matched WT animals until 12 months was closely monitored after the intervention, continuously assuring that lymphoma and immunological deficits were not threatening the mice. Dissection of 4 ATM-null versus 4 matched WT mice occurred after cervical dislocation, snap-freezing the fresh cerebellar tissue in liquid nitrogen for oligonucleotide microarray surveys and subsequent validation experiments by RT-qPCR.
2.3. Global transcriptome survey
Total RNA was extracted from frozen tissue using TRIzol reagent (Sigma-Aldrich, St. Louis, Missouri, USA), according to manufacturer’s instructions. The RNA integrity number (RIN) was assessed using a 2100 Bioanalyzer RNA 6000 Nano Assay (Agilent Technologies, Santa Clara, California, USA) and its concentration determined with NanoDrop Spectrophotometer (Thermo Fisher Scientific, Waltham, Massachusetts, USA). Samples were kept at -80 ºC until use. Then, 1 μg of RNA was pre-treated with DNase amplification grade (Invitrogen, Carlsbad, California, USA). The Gene ChipTM WT PLUS Reagent Kit (Applied Biosystems, Waltham, Massachusetts, USA) was used to generate single-stranded cDNA (ss-cDNA), which was fragmented and labeled right before hybridization to Clariom D arrays (Thermo Fisher Scientific, Waltham, Massachusetts, USA). The signals were documented with the Affymetrix Gene Chip Scanner, and data were processed with the Transcriptome Analysis Console (TAC) 4.0.1 (Applied Biosystems, Waltham, Massachusetts, USA) software using default algorithm parameters. The complete gene expression data set was deposited publically in the Gene Expression Omnibus under accession number GSE241955.
2.4. Bioinformatics analysis of global transcriptome data
The distribution of all microarray oligonucleotides that showed differential dysregulation with actual significance (false discovery rate FDR P-value < 0.05) in cerebella of 12-month old Atm-deficient mouse cerebella were displayed as volcano plot in Figure 2a (a logarithmic display where log2 values of fold change make downregulations in green color and upregulations in red color easily comparable on the X-axis, and -log10 of FDR P-values on the Y-axis enables graphic representation of outliers). The absolute numbers and percentages of downregulations and upregulations with nominal significance (gene level p-value < 0.05, fold change >1.2 or <-1.2) across the transcriptome, and the overrepresentation of Non-Coding transcripts among downregulations, versus overrepresentation of coding and Multiple-Complex transcripts among upregulations, are displayed as pie charts in Figure 2b. In the Clariom D microarray there are nine predefined oligonucleotide groups: Non-Coding, Multiple Complex (containing more than one of the other groups), Coding, Pseudogene, Precursor microRNA, small RNA, Ribosomal, Unassigned, and tRNA. All transcript dysregulations with nominal significance were subjected to Gene Ontology (GO)-enrichment analysis via PANTHER (http://geneontology.org/). Fisher’s Exact was used for statistical evaluation, and correction was done by FDR. PANTHER Overrepresentation Test was carried out separately for upregulations (Figure 2d) and downregulations (Figure 2c), in each case calculating the enrichment for GO biological process (upper panel) and GO molecular function (lower panel). The resulting GO terms were sorted by Fold Enrichment, and the top 10 hits are displayed as bar graphs. Given that the Clariom D microarrays represent practically each exon of all coding transcripts, further analyses of alternative splicing were possible at genome-wide level (Figure 5). As filtering criteria, genes with exon splicing index > 5 or < -5, and significance with FDR P-value < 0.25 were selected (Figure 5a). Among them, pathway enrichment studies by the STRING (Search Tool for the Retrieval of Interacting Genes/Proteins) webplatform (https://string-db.org/) demonstrated an overrepresentation for the terms “Neuropeptide signaling pathway”, “Regulation of neurotransmitter levels” and “Synapse organization” (shown as interaction plot in Figure 5b).
2.5. Neuroblastoma Cell Culture and Treatments
Parental SH-SY5Y human neuroblastoma cell line was cultured in high glucose DMEM (Thermo Fisher Scientific, Waltham, Massachusetts, USA, 21969-035) supplemented with 10% FCS (Thermo Fisher Scientific, Waltham, Massachusetts, USA, A3160802), 1% L-Glutamine (Thermo Fisher Scientific, Waltham, Massachusetts, USA, 25030-024) and 0.1% Penicillin / Streptomycin (Thermo Fisher Scientific, Waltham, Massachusetts, USA, 15140-122). ATM knockdown SH-SY5Y cells were kept in selection medium, as explained later.
Stable knockdown of ATM in SH-SY5Y was achieved via lentiviral transduction of five different MISSION short hairpin RNAs targeting ATM (shRNA, commercially available at Sigma-Aldrich, St. Louis, Missouri, USA) and one non-targeting control shRNA, targeting no known mammalian genes (Sigma-Aldrich, St. Louis, Missouri, USA, SHC002, hereafter referred to as NT CTRL, gift from Prof. Dr. Kögel) in mammalian expression vector pLKO.1. The shATM sequences were: shATM#1–5’CCGGCCAAGGTCTATGATATGCTTACTCGAGTAAGCATATCATAGACCTTGGTTTTTTG-3’ (cat.no TRCN0000194861), shATM#2–5’CCGGTGGTCAAATACTTCATCAAATCTCGAGATTTGATGAAGTATTTGACCATTTTTG-3’ (cat.no TRCN0000245108), shATM#3–5’CCGGTGATGGTCTTAAGGAACATCTCTCGAGAGATGTTCCTTAAGACCATCATTTTTG-3’ (cat.no TRCN0000010299), shATM#4–5’CCGGCCTTTCATTCAGCCTTTAGAACTCGAGTTCTAAAGGCTGAATGAAAGGTTTTTG-3’ (cat.no TRCN0000039948), shATM#5–5’CCGGGCCTCCAATTCTTCACAGTAACTCGAGTTACTGTGAAGAATTGGAGGCTTTTTG-3’ (cat.no TRCN0000039951). Stable KD cells were generated by transfecting 2 µg of the respective shRNA or NT CTRL plasmid DNA, 1.5 µg gag/pol plasmid DNA (psPAX2, Addgene #12260) and 0.5 µg VSV-G envelope plasmid DNA (pMD2.G, Addgene #12259) into HEK293T cells using FuGENE HD transfection reagent (Promega, Fitchburg, WI, USA, E2311) following the manufacturer’s instructions. psPAX2 was a gift from Didier Trono (Addgene plasmid # 12260; http://n2t.net/addgene:12260; RRID:Addgene_12260). pMD2.G was a gift from Didier Trono (Addgene plasmid # 12259; http://n2t.net/addgene:12259; RRID:Addgene_12259). After 16h and 40h post-transfection, the viral supernatant was collected, pooled, sterile-filtered (0.45 µm) and applied to the SH-SY5Y cells in an 1:1 mixture with fresh medium supplemented with 3 µg/mL polybrene (Sigma-Aldrich, St. Louis, Missouri, USA, TR-1003). SH-SY5Y cells were transduced for 24h and selected via bulk selection using puromycin (Santa Cruz Biotechnology, Dallas, Texas, USA, sc-108071). To achieve this, the SH-SY5Y culture medium was supplemented with 1.25 µg/mL puromycin as determined by kill curve in parental cells. Cells were generally maintained in puromycin selection medium in order to reduce the probability of KD loss.
After expansion, shATM containing cells were assessed on protein and RNA level, and shATM#2 was selected for further experiments after achieving the best KD.
For stress experiments, parental and knockdown cells were treated with chloroquine (CQ, Sigma-Aldrich, St. Louis, Missouri, USA, C6628) for osmotic stress, bleomycin (BLEO, Merck Millipore, Burlington, Massachusetts, USA, 203408-250MG) for genotoxic stress, sodium arsenite (NaARS, Sigma-Aldrich, St. Louis, Missouri, USA, S7400-100G) for oxidative stress, and LY-294002 (LY, Cayman Chemical Company, Ann Arbor, Michigan, USA, 70920) for trophic stress via phosphoinositide 3-kinase (PI3K) inhibition. 20 µM chloroquine was administered for 24 h with sterile water as control. BLEO treatment was at 5 µM for 8 h, with DMSO as control condition. NaARS was delivered at 0.5 mM for 45 min, water serving as a control. LY was administered at a concentration of 10 µg/mL for 24 h, with DMSO as control. For pre-treatment of parental SH-SY5Y cells with the ATM inhibitor KU-55933 (KU, Selleckchem, Houston, Texas, USA, S1092), 10 µM were used over 30 min, prior to the cell stress exposure, with DMSO as a control.
Cells were harvested in Phosphate Buffered Saline (PBS) using cell scrapers. After centrifugation, pellets were frozen until usage in either nucleic acid analysis via RT-qPCR, or protein analysis via immunoblotting or subcellular fractionation.
2.6. Reverse Transcriptase real-time quantitative Polymerase Chain Reaction (RT-qPCR)
Total RNA was isolated from either mouse cerebellum or cell pellets. RNA extraction was performed using TRI reagent (Sigma-Aldrich, St. Louis, Missouri, USA) following the manufacturer’s protocol. To generate cDNA from RNA samples the SuperScript IV Kit (Invitrogen, Carlsbad, California, USA) was used. A total amount of 1 μg RNA was first digested with ezDNase enzyme (Invitrogen, Carlsbad, California, USA) for purification and finally reverse transcribed following the manufacturer’s instructions. For gene expression analysis, RT-qPCR was performed using TaqMan Gene Expression AssaysTM (Thermo Fisher Scientific, Waltham, Massachusetts, USA). For this purpose, cDNA from 10 ng total RNA was used with 2x FastStart Universal Probe Master ROX (Roche, Basel, CHE) and the corresponding TaqMan Assay. The reaction was performed in a StepOnePlus Real-Time PCR Cycler (Applied Biosystems, Waltham, Massachusetts, USA). Data was analysed using the method [63].
The following TaqMan Assays were used for murine transcripts: Atm - Mm01177457_m1; Atmin – Mm01251229_m1; Ecel1 – Mm00469610_m1; Foxo3 – Mm01185722_m1; Grid2 - Mm00515053_m1; Grin2b – Mm00433820_m1; Grin2c – Mm00439180_m1; Grm4 – Mm01306128_m1; Itpr1 – Mm00439907_m1; Mme – Mm00485040_m1; Nr4a1 – Mm01300401_m1; Nr4a2 – Mm01278507_g1; Nr4a3 – Mm00450074_m1; Oprm1 (Exon 2-3) – Mm01188089_m1; Oprm1 (Exon 5-6) – Mm01188387_m1; Per1 - Mm00501813_m1; Rora - Mm01173766_m1; Slc17a6 – Mm00499876_m1; Slc32a1 – Mm00494138_m1; Sst – Mm00436671_m1; Tac1 - Mm00436880_m1; Tacr1 - Mm00436892_m1; Tbp - Mm00446973_m1; Usp2 - Mm00497452_m1.
The following TaqMan Assays were used for human transcripts: ATM – Hs01112311_m1; ATMIN – Hs00739820_m1; CAMK2A – Hs00947041_m1; CAMK4 – Hs00174318_m1; ECEL1 – Hs00191400_m1; FOXO3 – Hs00818121_m1; GRID2 – Hs00910017_m1; ITPR1 – Hs00976045_m1; MME – Hs01115452_m1; NR4A1 – Hs00374226_m1; OPRM1 – Hs01053957_m1; OPRM1 (Exon1-2) – Hs01053956_m1; OPRM1 (Exon 3-4) – Hs00168570_m1; PER1 – Hs00242988_m1; RORA – Hs00536545_m1; RRAGD – Hs00222001_m1; SGK1 – Hs00178612_m1; TBP - Hs9999910_m1; USP2 –Hs00275859_m1.
2.7. Immunoblotting
For protein analysis in cerebellum, the tissues were lysed, homogenized in urea lysis buffer and sonicated on medium power (three 10 second bursts). Lysates were centrifuged at 18,000 x g for 15 min. Protein content of the lysate was estimated using the Pierce 660nM protein assay kit (Thermo Fisher Scientific, Waltham, Massachusetts, USA). Equal amounts of protein lysates (10 µg) were separated by SDS-Polyacrylamide gel electrophoresis (PAGE) (Bio-Rad, Hercules, California, USA) and transferred to nitrocellulose membrane (Merck Millipore, Burlington, Massachusetts, USA). Non-specific binding was blocked using 5% nonfat dry milk/ TBS-T for 1 h at room temperature and then the membrane was incubated with a primary antibody against ATM (#2873, Cell Signaling Technology, Danvers, Massachusetts, USA) or with β-Actin (ACTB, #4970, Cell Signaling Technology, Danvers, Massachusetts, USA) at 4°C overnight in 5% BSA/TBS-T. The next day, membranes were washed with TBS-T (3 x 5 minutes each) and incubated with anti-rabbit IgG (H+L) (DyLight™️680 Conjugate) secondary antibody for 1h. Antibody binding was visualized on the LI-COR Odyssey NIR (near infrared) imaging system.
For protein analysis in SH-SY5Y cells, samples were first lysed in RIPA buffer (50 mM TRIS/HCl pH 8.0, 150 mM NaCl, 1% NP-40, 0.5% sodium deoxycholate, 0.1% sodium dodecylsulfate = SDS), containing HALT phosphatase inhibitors (Thermo Fisher Scientific, Waltham, Massachusetts, USA) and cOmplete proteinase inhibitors (Roche, Basel, CHE) for 30 min on ice. Following that, the lysates were briefly sonicated and subjected to Pierce BCA Protein Assay Kit (Thermo Fisher Scientific, Waltham, Massachusetts, USA) for determination of protein concentration following the manufacturer’s instructions. For the SDS-PAGE, 25 µg protein was used and denatured at 90 °C for 5 min. SDS-PAGE was done following standard procedures. Proteins were transferred on 0.2 µm nitrocellulose membranes (Bio-Rad, Hercules, California, USA) and blocked in 5% bovine serum albumin (BSA, Carl Roth GmbH, Karlsruhe, GER) in TBS-buffer containing 0.1% Tween-20 (Sigma-Aldrich, St. Louis, Missouri, USA) for 1 h. Primary antibodies were rabbit anti-ATM (Cell Signaling Technology, Danvers, Massachusetts, USA, #2873), mouse anti-pATM (S1981, Cell Signaling Technology, Danvers, Massachusetts, USA, #4526), mouse anti-α-tubulin (=TUBA, Sigma-Aldrich, St. Louis, Missouri, USA, T9026), mouse anti-GAPDH (Calbiochem, St. Louis, Missouri, USA, CB1001), mouse anti-vinculin (=VCL, Proteintech, Rosemont, Illinois, USA, 66305-1-Ig), mouse anti-HSP60 (Santa Cruz Biotechnology, Dallas Texas, USA, sc-13115), rabbit anti-LAMIN-A/C (=LAMIN, Abcam, Cambridge, GBR, ab169532), rabbit anti-IP3 receptor (=ITPR1, abcam, Cambridge, GBR, ab5804), rabbit anti-PER1 (Proteintech, Rosemont, Illinois, USA, 13463-1-AP), rabbit anti-USP2 (Proteintech, Rosemont, Illinois, USA, 10392-1-AP). Incubation was performed over night at 4 °C. Membranes were incubated with the respective secondary antibody IRDye 800CW goat anti-rabbit (LI-COR, Lincoln, Nebraska, USA, 926-32211), IRDye 680RD goat anti-rabbit (LI-COR, Lincoln, Nebraska, USA, 926-68071), IRDye 800CW goat anti-mouse (LI-COR, Lincoln, Nebraska, USA, 926-32210), IRDye 680RD goat anti-mouse (LI-COR, Lincoln, Nebraska, USA, 926-68070) for 1 h and subsequently imaged in LI-COR Odyssey Infrared Imager (Lincoln, Nebraska, USA).
2.8. Fractionation
Subcellular fractionation of cells was done as previously described [64]. Briefly, cell pellets were resuspended in cytosolic extract buffer (CEB; 250 mM sucrose, 70 mM KCl, 137 mM NaCl, 4.3 mM Na2HPO4 , 1.4 mM KH2PO4) supplemented with 400 µg/mL digitonin (Sigma-Aldrich, St. Louis, Missouri, USA, D141-100MG), 100 µM PMSF (Carl Roth GmbH, Karlsruhe, GER, S367.1), 10 µg/mL leupeptin (AppliChem, Darmstadt, GER, A2183,0010) and 2 µg/mL aprotinin (Carl Roth GmbH, Karlsruhe, GER, A162.1). The cytoplasmic fraction was removed after centrifugation, and the mitochondrial fraction was generated from the pellets via incubation in mitochondrial lysis buffer (MLB; 50 mM Tris-HCl pH 7.4, 150 mM NaCl, 2 mM EDTA, 2 mM EGTA, 0.2% Triton X-100, 0.3% NP-40) supplemented with 100 µM PMSF, 10 µg/mL leupeptin and 2 µg/mL aprotinin. Extracts were centrifuged and the mitochondrial fraction was removed, before nucleic lysates were prepared from pellets in RIPA buffer, which contained HALT phosphatase inhibitors (Thermo Fisher Scientific, Waltham, Massachusetts, USA) and cOmplete proteinase inhibitors (Roche, Basel, CHE). The nuclear extracts were centrifuged to remove RIPA insoluble debris. Protein concentration in each fraction was quantified by BCA assay. Purity of the fractions was assessed via presence of GAPDH in cytosolic fractions, HSP60 in mitochondrial fractions and LAMIN-A/C in nuclear extracts via quantitative immunoblots.
Subcellular fractionation of cerebellar tissue was performed as previously described [65]. In brief, one cerebellum was first homogenised in Buffer A (150 mM NaCl, 50 mM HEPES pH 7.4; 1 M hexylene glycol) supplemented with 400 µg/mL digitonin, 100 µM PMSF, 10 µg/mL leupeptin and 2 µg/mL aprotinin using a pestle motor mixer. Samples were further homogenised via centrifugation through a QIAshredder (Qiagen, Venlo, NLD). After a 10 min incubation period, samples were centrifuged to obtain the cytoplasmic fraction. Pellets were resuspended in Buffer B (150 mM NaCl, 50 mM HEPES pH 7.4, 1% NP-40, 1 M hexylene glycol) supplemented with 100 µM PMSF, 10 µg/mL leupeptin and 2 µg/mL aprotinin. Extracts were incubated for 30 min and centrifuged to generate mitochondrial fractions. Finally, pellets were incubated with 500 U benzonase nuclease (Sigma-Aldrich, St. Louis, Missouri, USA, E1014-25KU) to digest DNA. Nuclei were lysed by 10 min incubation with Buffer C (150 mM NaCl, 50 mM HEPES pH 7.4, 1 M hexylene glycol, 0.5% sodium deoxycholate, 0.1% SDS) supplemented with 100 µM PMSF, 10 µg/mL leupeptin and 2 µg/mL aprotinin, and nuclear extracts were harvested as supernatant after centrifugation. The fractions were subjected to BCA assay for determination of protein concentration. Purity of fractions was again assessed via presence of GAPDH in cytosolic fractions, HSP60 in mitochondrial fractions and LAMIN-A/C in nuclear extracts via immunoblotting.
2.9. Statistics
Data were statistically analysed using GraphPad Prism 8 Software. Grouped data was analysed via 2-way ANOVA followed by Sidak’s post-hoc test for multiple comparisons. Independent data was analysed via 1-way ANOVA followed by Tukey’s post-hoc test for multiple comparisons. Comparisons of two conditions were performed with unpaired t-test with Welch’s correction. Asterisks represent significance (* = p ≤ 0.05, ** = p ≤ 0.01, *** = p ≤ 0.001, **** = p ≤ 0.0001). P-values 0.05 < p < 0.10 were considered as statistical trend (T) and are displayed as exact values. Data are displayed as mean ± standard error of the mean (SEM) with or without additional single values. Protein and transcript ratios are displayed as fold changes, relative to the untreated control condition.
3. Results
3.1. The cerebellar transcriptome profile of ATM-null mice at 12 months of age
As shown in Figure 1a, the global transcriptome analysis of cerebellar tissue was performed in 4 WT versus 4 ATM-null mice, aged in parallel until 12 months in pairs of identical sex. The genotype of analysed mice was controlled by breeding protocols, PCR from ear-punch DNA, RT-qPCR of Atm mRNA and quantitative immunoblots of ATM protein (Figure 1b/c). The global transcriptome profile of the ATM-null cerebellum was documented in Table S1. To ensure data reproducibility among different organisms in this strongly affected tissue at advanced age, we compared our ATM-null mouse cerebellar transcriptome profile at age 12 months with a published [66] proteome survey of A-T patient cerebellar post-mortem samples (although distortions by altered tissue composition at end-stage will generate artefacts, and mass-spectrometry will detect maximally some 10,000 among all existing proteins), annotating the consistent findings in Table S1. The comparison of our 12-month-old ATM-null mouse cerebellar transcriptome profile with previous A-T patient cerebrospinal fluid proteome data [67] revealed parallel reductions for Reln, Fat2, Omd, Cntn6 (down) and C4b (up). This transcriptome was then interrogated in the context of known ATM functions and phenotypes, as far as known in the current literature. Given the scarcity of 12-month-old ATM-null mice with cerebellar anomalies, and in view of the massive widespread transcriptome changes observed (which are probably a direct consequence of altered phosphorylation cascades that alert to membrane stress and modulate nuclear transcription), we also performed extensive validation work in stressed cell models to elucidate the role of prominent molecular events.
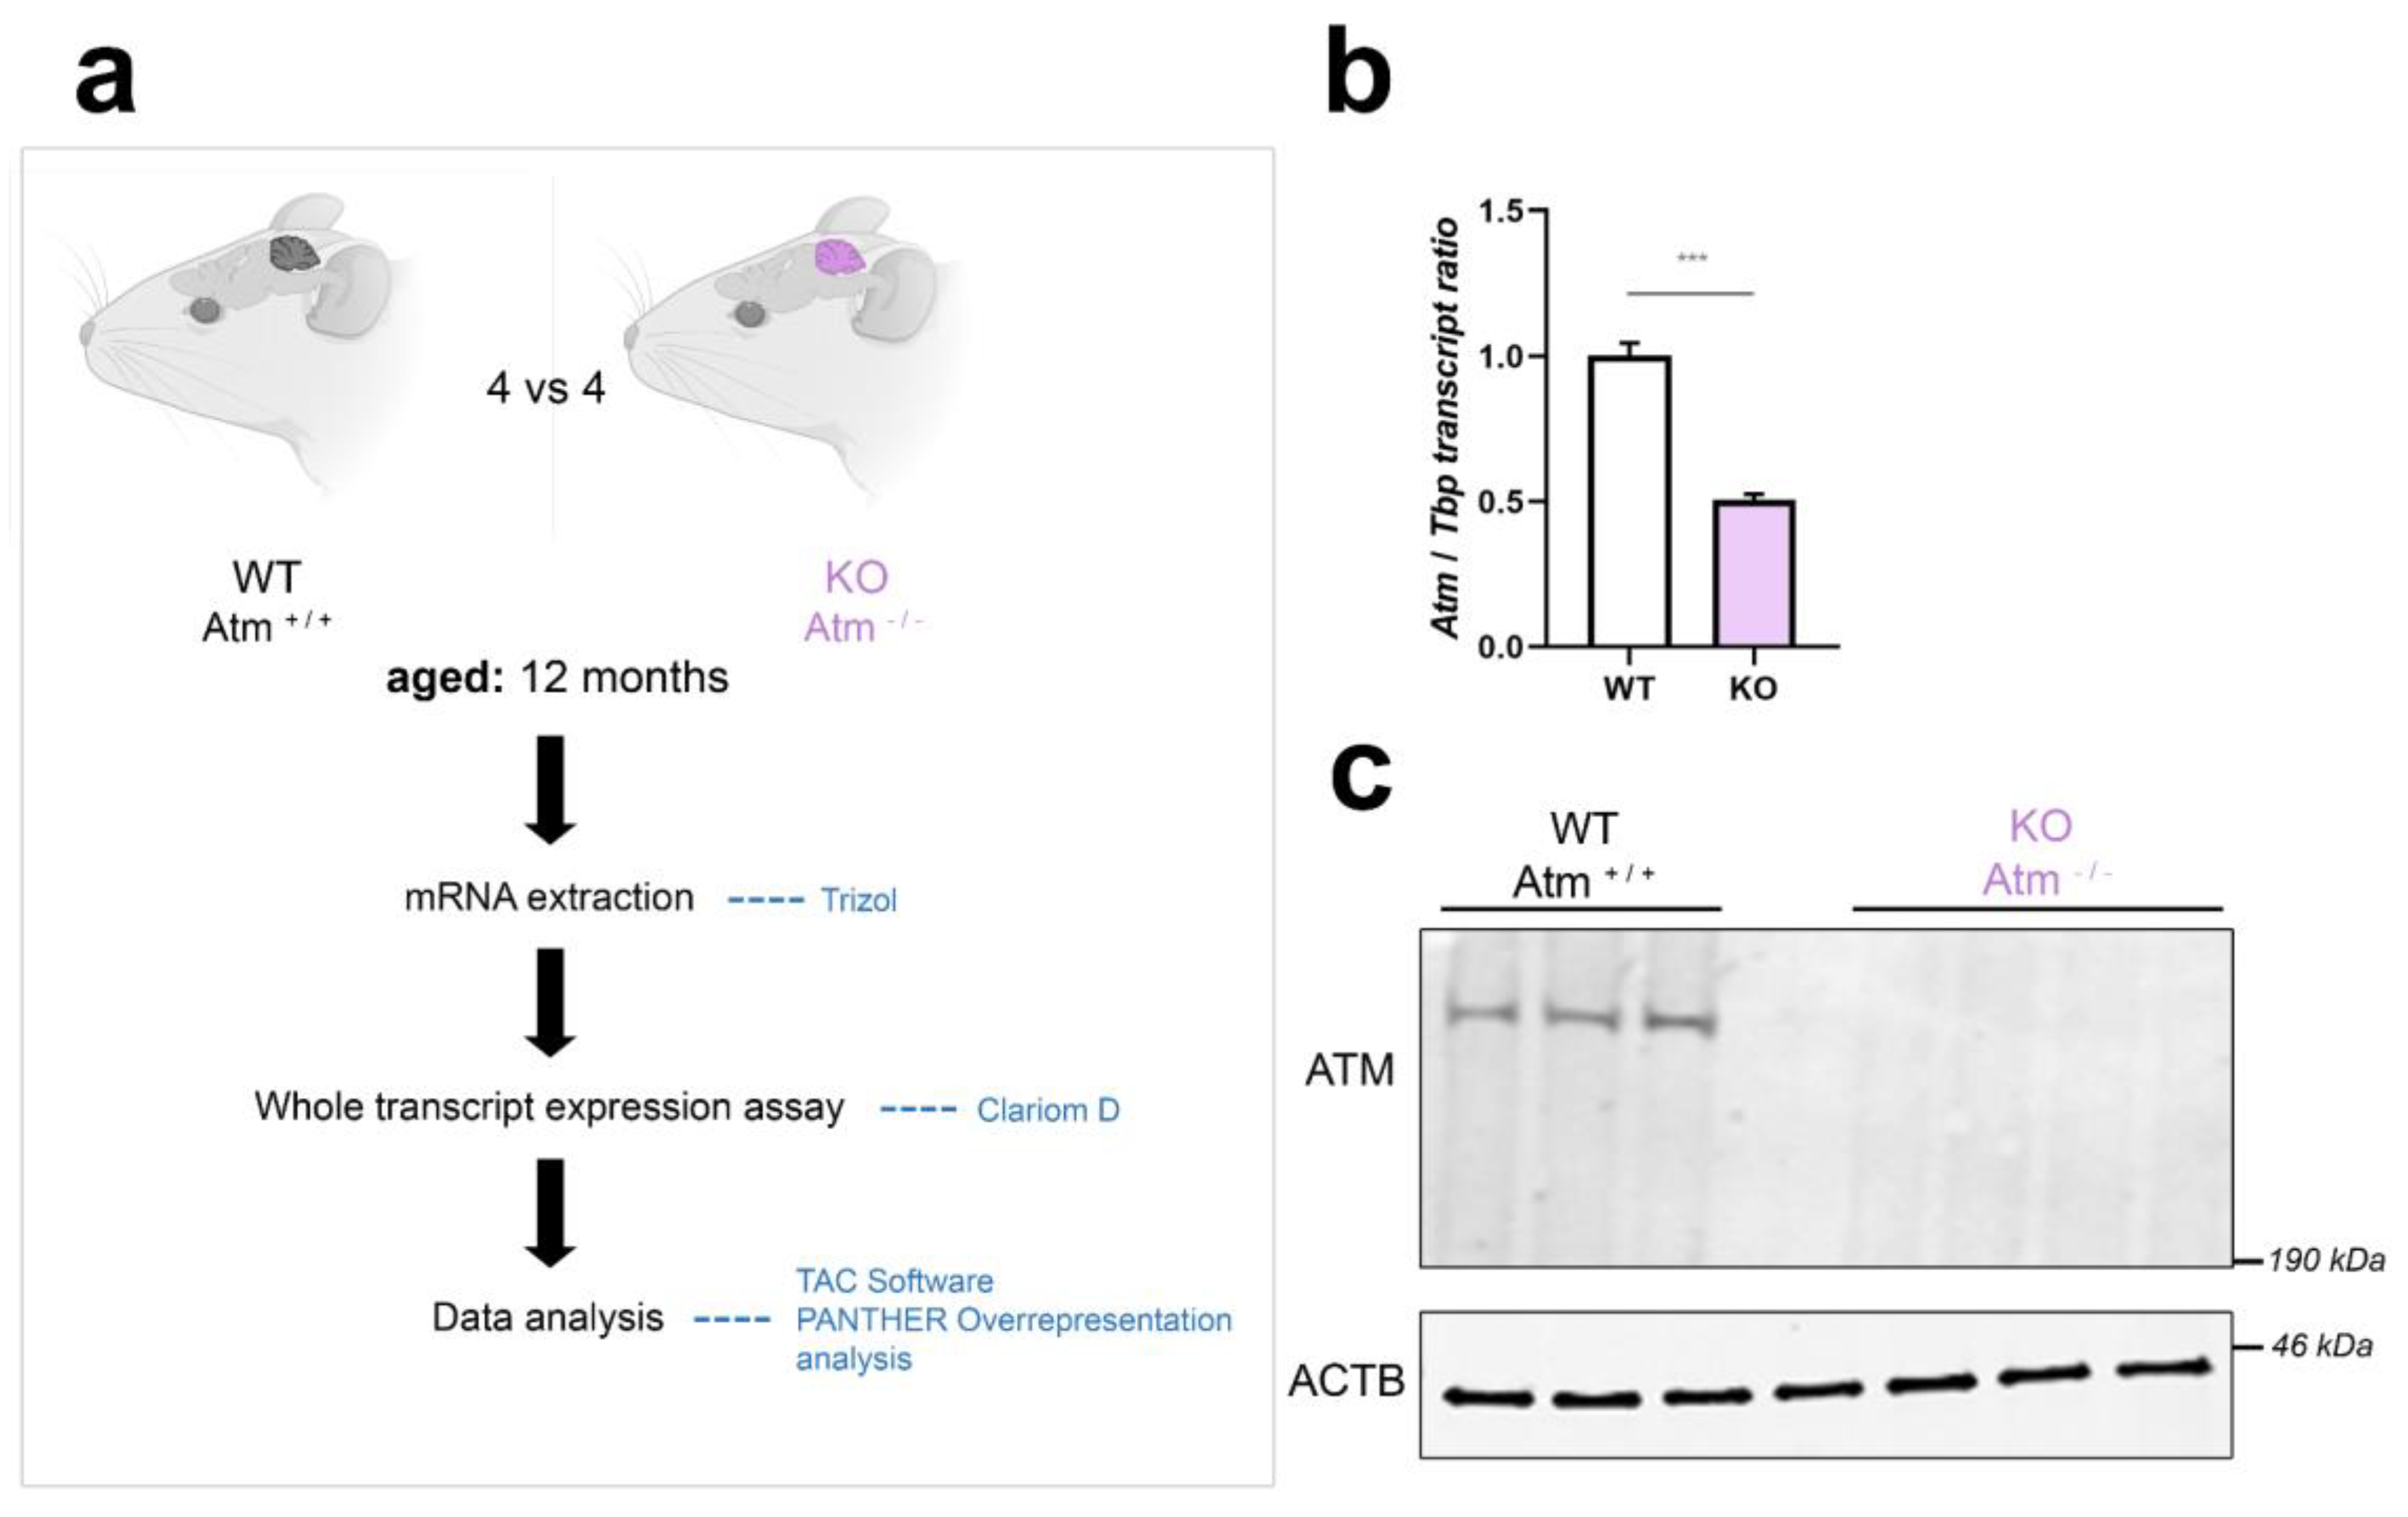
Figure 1.
Workflow and quality control for genome-wide cerebellar transcriptome analysis from 12-month-old Atm-KO mice. (a) Schematic representation of the workflow performed in age and sex-matched Atm+/+ versus Atm-/- mice (n = 4 vs 4). mRNA was extracted from cerebella of these animals using Trizol, and ClariomD microarray hybridisation was then performed. Data were analysed using the TAC Software provided by Affymetrix, and by PANTHER Overrepresentation analysis of pathway enrichments. (b) Mouse genotype validation via RT-qPCR, detecting the quantity of WT Atm transcript versus its reduction due to exon deletion and nonsense-mediated RNA decay in the Atm-KO samples, using Tbp transcript as normalizer (n = 4). (c) Mouse genotype validation via quantitative immunoblots, regarding ATM protein absence versus beta-actin (ACTB) as loading control (WT vs Atm-KO, 3 vs 4). Asterisks reflect significance: *** = p ≤ 0.001. Data are displayed as mean ± SEM.
In Figure 2a, a volcano plot displays the overall distribution of transcript dysregulations with actual significance (FDR < 0.05, corresponding to p<0.0017), identifying particularly relevant coding transcripts by their gene symbols. Prominent upregulations of neurofilament medium and light chain mRNAs (Nefm and Nefl) reflect the axon pathology at this disease stage and presumably represent cellular efforts to compensate the progressive neurofilament loss that is known to occur in A-T [6]. As noteworthy finding, ATM depletion was responsible for significant downregulations of mostly non-coding transcripts, whereas the upregulations concerned almost exclusively coding transcripts. The strongest downregulated microRNA was miR-495 (fold change -3.85, p=0.0002) as angiogenesis-hypoxia-autophagy-synaptic depression modulator [68-73]. An even greater downregulation was detected for the non-coding RNA TC0500000412.mm.1 (fold-change FC -10.77, p=6.30E-07) as a prime example for the massive impact of ATM-loss on non-coding RNAs in general. The cellular roles of TC0500000412.mm.1 are unknown at present. In Figure 2b, pie charts reflect this massive contrast between non-coding downregulations versus coding upregulations, providing absolute numbers and percentages. Extreme upregulations of several factors that are selectively expressed in the choroid plexus whose presence in the cerebellar samples was not controlled were interpreted as artefacts. A bioinformatics survey of gene ontology terms in biological processes and molecular functions by PANTHER software indicated prominent deficits in corticotropin-dependent stress responses as well as presynaptic machinery and vesicle priming (Figure 2c), versus prominent excess transcripts for neurotransmitter loading and channel activity (Figure 2d). The upregulations of neurotransmission components occurred without selectivity for any cell type, involving e.g. glutamate, GABA, glycin, muscarinic and nicotinic acetylcholine, as well as dopamine receptor transcripts. Notably, the neuropeptide signaling pathway (GO:0007218) was the 17th most enriched term among upregulations (FDR p=2.02E-05) and also showed a non-selective pattern in general, involving somatostatin, tachykinin, neurotensin, endothelin, vasohibin, encephalin, opioid mu and kappa3 signaling components. Further more detailed bioinformatics studies showed significant enrichment on the STRING webplatform for ataxia genes, vesicular factors, calcium homeostasis factors, and immediate early genes. The factors involved in these enrichments were annotated in Table S1, together with all ATM protein interactome components and the ATM kinase target proteins known at present.
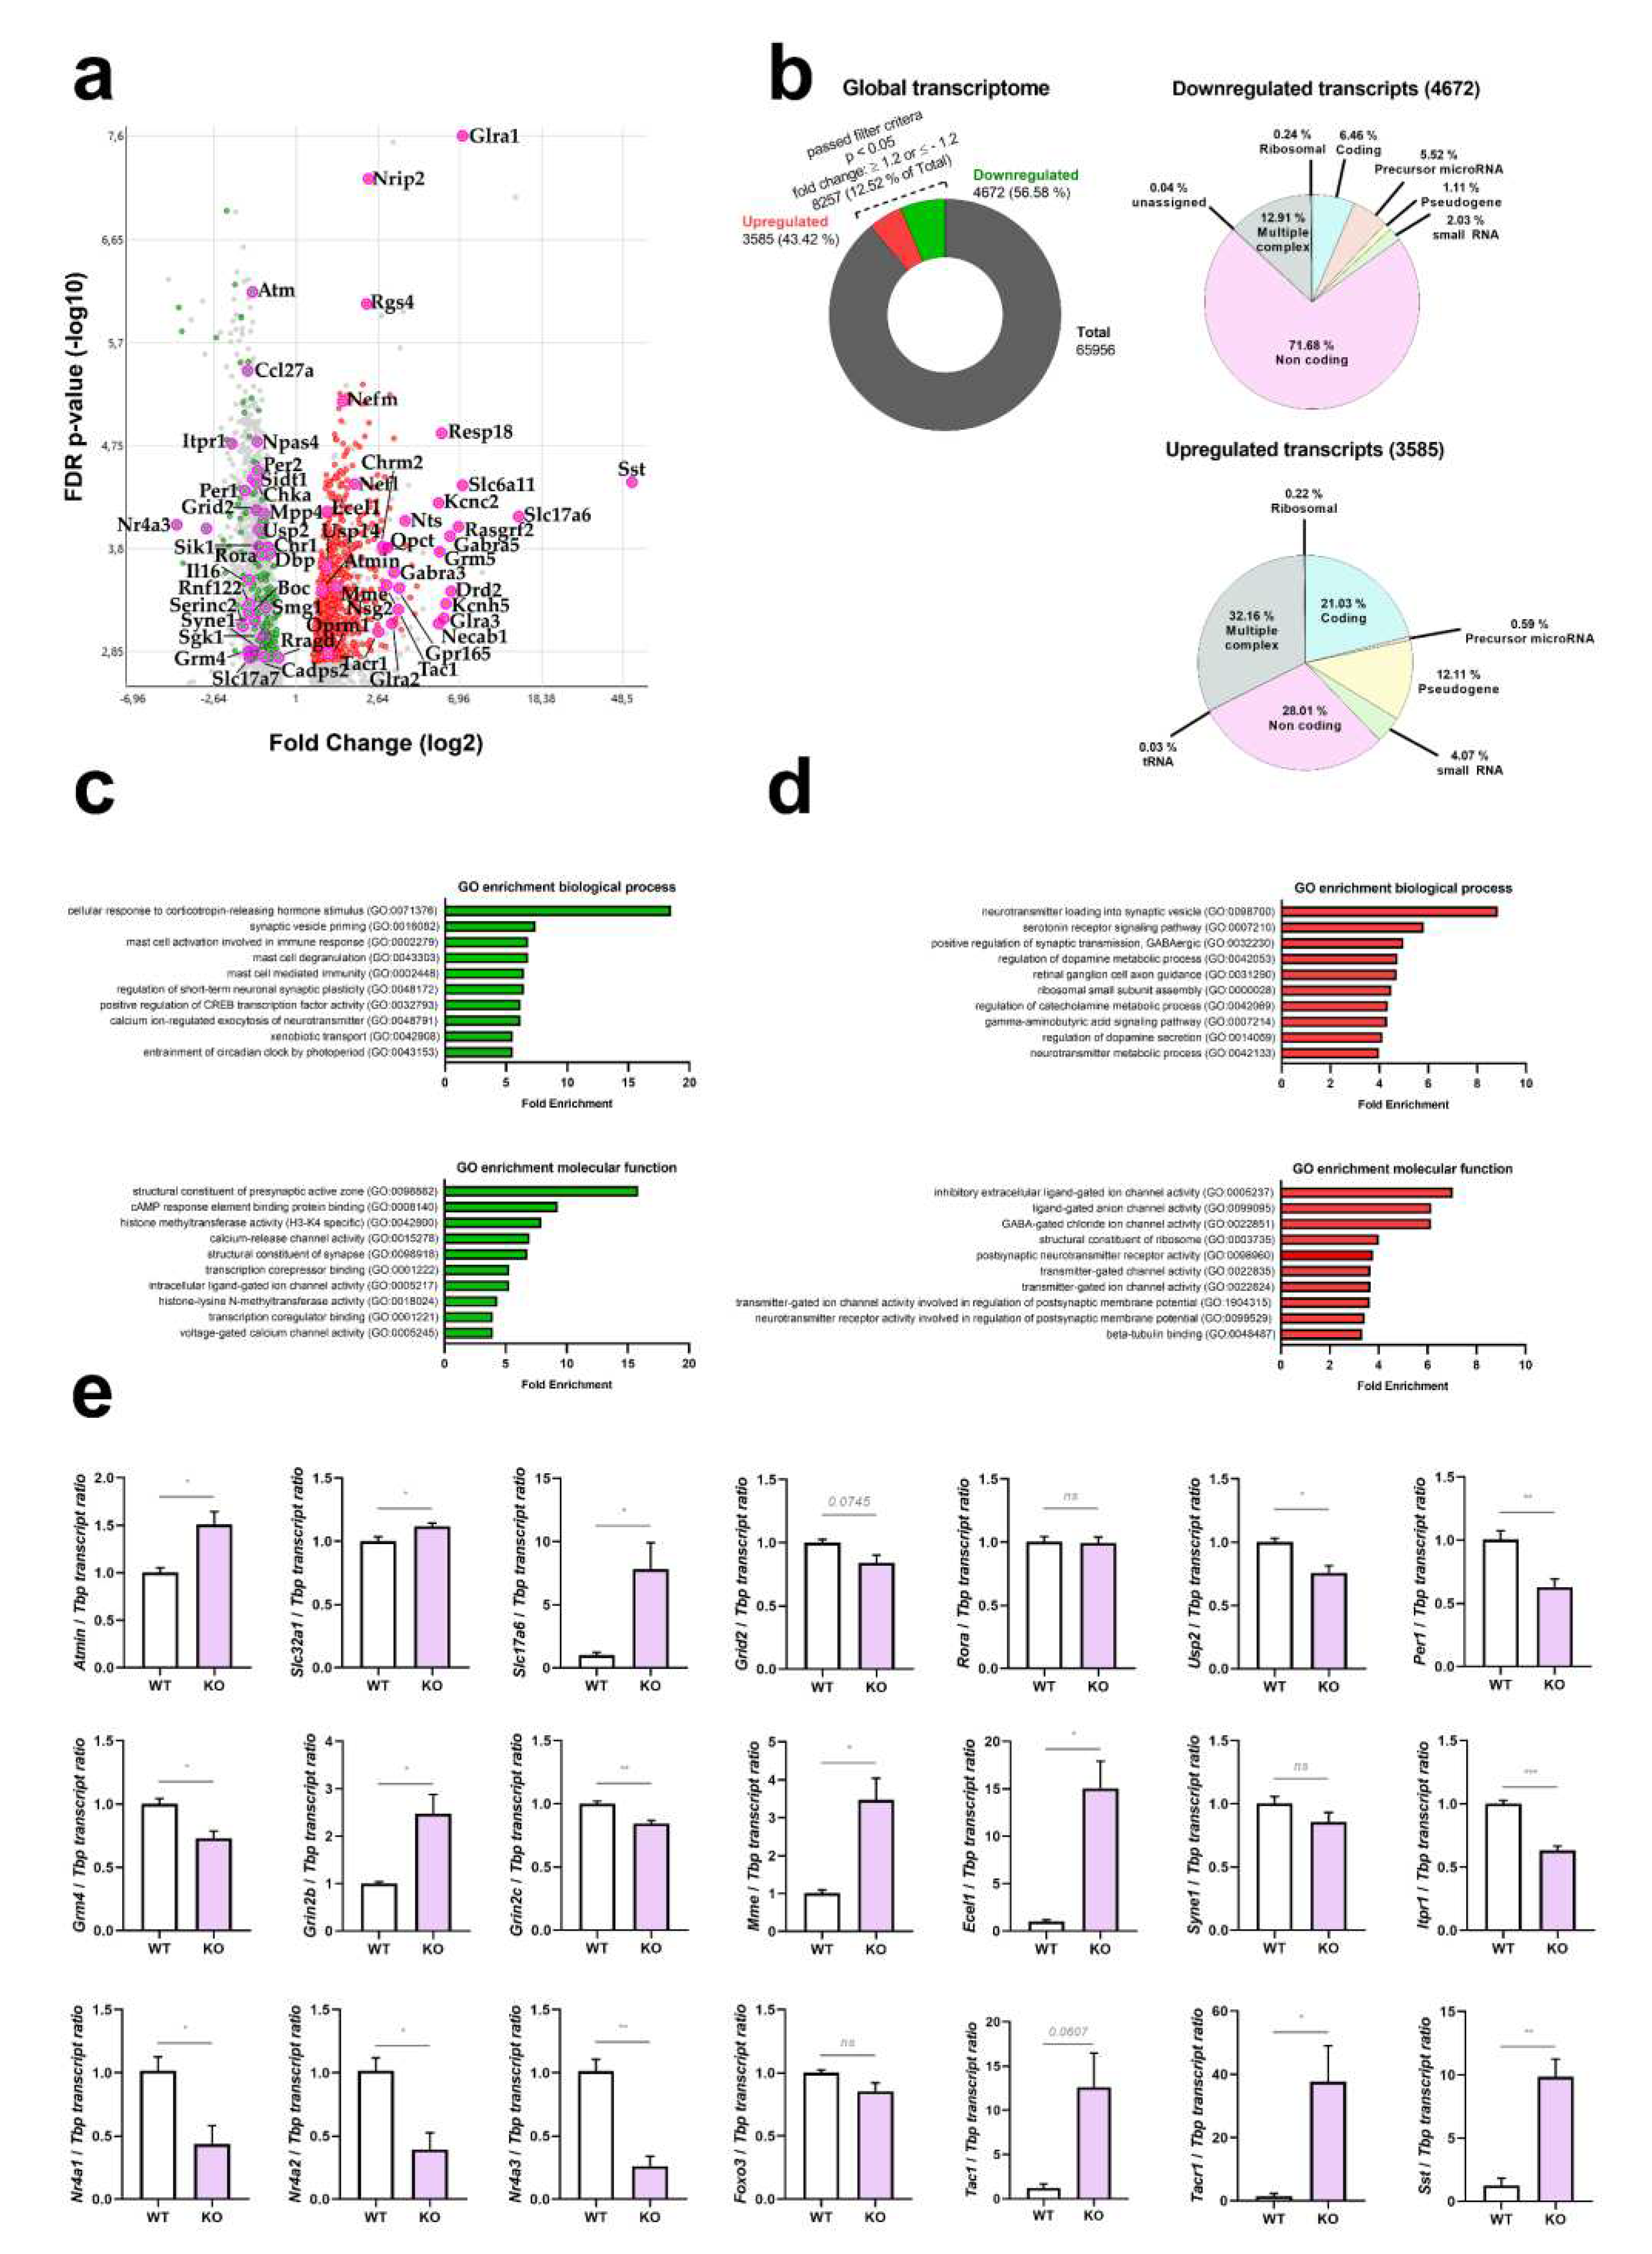
Figure 2.
Genome-wide survey of transcript levels in cerebella from 12-month-old ATM-null mice. (a) Global transcriptome documentation via Clariom D microarrays, visualized as Volcano plot with symmetry due to logarithmic scales, where the X-axis shows down- versus up-regulations (in green versus red color, respectively) while the Y-axis shows the significance of changes via false detection rates (FDR), identifying factors with relevance for pathway enrichments and for follow-up studies by their gene symbols. (b) Total amount of detected transcripts (65956) and ratio of transcripts that passed the filter criteria (8257, 12.52%). Of these, 43.42 % (3585) are upregulated and 56.58 % (4672) are downregulated. The upregulations and downregulation were further classified into different transcript categories, namely ribosomal, coding, precursor micro-RNA, pseudogene, small RNA, non-coding, tRNA and multiple complex, highlighting a prominent downregulation of non-coding RNAs. (c+d) Gene Ontology (GO) enrichment analysis of downregulated (green graphs) and upregulated (red graphs) transcripts, showing biological processes in the upper panel (prominent enrichment for cellular response to corticotropin-releasing hormone stimulus among downregulated transcripts, prominent enrichment for neurotransmitter loading into synaptic vesicle among upregulated transcripts), molecular functions in the lower panel (prominent enrichment for structural constituent of presynaptic active zone among downregulated transcripts, prominent enrichment for inhibitory extracellular ligand-gated ion channel activity among upregulated transcripts). (e) Dysregulation validation via RT-qPCR in these 12-month-old mouse cerebella (WT vs Atm-KO, n = 4 vs 4) for key factors in ATM interaction, excitability, neurotransmission and neuropeptide signaling. For statistical trends, the precise p-value was shown. Asterisks represent significance: * = p ≤ 0.05, ** = p ≤ 0.01, *** = p ≤ 0.001, ns = non-significant. Data are displayed as mean ± SEM.
In the disease context, the transcriptome showed dysregulated expression with nominal significance for genes responsible for phenotypes of ataxia (compiled according to the Online Mendelian Inheritance of Man database, https://www.ncbi.nlm.nih.gov/omim/). Downregulations were observed for Atm, Itpr1, Syne1, Grid2, Grik2, Fgf14, Rora, Gba2, Reln, in good agreement with a previous proteome study of cerebrospinal fluid from A-T patients [67]; a significant enrichment was detected by the STRING webserver for “abnormal cerebellar granule neuron morphology” (q=0.0014) for the cluster of ATM, RORA [74] and GRID2 [75] proteins; an enrichment for “postsynapse” (q=0.0182) was detected for ITPR1 [66, 67, 75, 76], SYNE1, GRID2 [75] and GRIK2 [77]; upregulations were observed for the ataxia genes Mme, Ebf3, Vamp1, Ppp2r2b, Svbp, without significant enrichment, but VAMP1 being a vesicle-associated factor like ATM. Significant expression changes existed also for genes responsible for the pathogenesis of telangiectasia (upregulation of Sst, Sstr1, Sstr2, Tac1, Tacr1, Svbp) [78-81], and for general growth (Sst, Sstr1, Sstr2) [82].
The significant dysregulation of ATM interactome components Atmin, Nr4a1 and Foxo3 / Foxo1 (but not the ATM interactome components Mre11 / Rad50 / Nbs1, nor its downstream effectors Chk2 and Tp53) argued against neural ATM functions at this cerebellar age in DNA damage repair, instead suggesting osmotic / oxidative / nutrient stress [83-85]. Interestingly however, the deubiquitinase USP2 was reported recently to function in the ATM / NBS1 interactome [86], and showed strong downregulation within the ATM-null cerebellar transcriptome. Even the relatively weak Kat5 induction observed may be relevant, in view of the known role of KAT5-dependent ATM Lys3016 acetylation.
Finally, among previously reported ATM phosphorylation target proteins [87-89] with significant dysregulation (see Table S1 annotations) in the 12-month-old ATM-null mouse cerebellar transcriptome, RTN4 (NOGO-A), DOCK10, FSCN1, SOX10, SEPT9 and CCNL2 were already implicated in glutamatergic synapse and dendrite effects [90-95]. Unexpectedly, the transcript upregulations concerned all neurotransmitter and neuropeptide pathways, rather than a signaling balance between glutamate-excitation on the one hand versus GABA-inhibition on the other hand [39].
Validation experiments by the independent method RT-qPCR in the remaining cerebellar tissue from these 12-month-old ATM-null and WT mice confirmed these dysregulations for practically all factors studied. These experiments focused on ATM interactors, ataxia genes, neurotransmitter loading factors, glutamate receptors, immediate early response components, and neuropeptide signaling molecules (Figure 2e). The RT-qPCR validation of these selected dysregulations was extended to cerebellar tissue from 1.5-3-month-old ATM-null versus age- / sex-matched WT mice, showing similar dysregulations to occur early on for Nr4a1, Nr4a2, Oprm1, and Tacr1 (Figure S1). Furthermore, the 12-month-old ATM-null cerebellar transcriptome confirmed previous RT-qPCR results in ATM-null cerebellum at the age of 2 months [67] regarding the downregulations of Itpr1, Atp2b2 and Grin2c, versus the upregulations of Grin2b and Cyp46a1 mRNA levels.
3.2. In human neural cells with stable ATM-knockdown, cerebellar hallmark dysregulations are recapitulated best after osmotic stress, and partially after trophic stress
ATM-deficiency was studied further in cell culture, to assess the reproducibility of these findings in human and to identify the most suitable stressor in vitro that mirrors such age-associated dysregulations while enabling us to generate unlimited samples for mechanistic studies. We used the human SH-SY5Y neuroblastoma cell line, introduced various ATM shRNAs via lentiviral transduction, and produced a stable ATM KD cell line that achieved high ATM protein and mRNA reduction for further analysis. The most efficient KD was produced by shRNA#2 (hereafter be referred to as shATM), triggering obvious changes in cellular morphology (Figure S2a), and reductions of ATM transcript to 36% (Figure S2b) and protein to 9.5% (Figure S2c), compared to the non-target shRNA control (NT CTRL) condition. In this human neural cell line, the application of the osmotic stressor chloroquine (CQ) did not alter the abundance of ATM protein, but induced phosphorylation at ATM residue S1981 (1.8-fold, with p=0.1408 in three biological replicates), an expected event for DDR-triggered autophosphorylation / activation of this stress sensor molecule (Figure S2d).
To assess whether SH-SY5Y neuroblastoma cells have a similar distribution of ATM in subcellular fractions as adult cerebellar tissue, differential detergent isolation of nuclear, mitochondrial, and cytoplasmic fractions was performed firstly in cerebellum from WT versus ATM-null mice at the age of 3.5 months (Figure 3a), and secondly in SH-SY5Y NT CTRL cells compared to shATM cells (Figure 3b). Even though there was some leakage from the GAPDH-immunopositive cytoplasmic (cyto) fraction to the HSP60-positive mitochondrial (mito) and the LAMIN-A/C-positive nuclear (nuc) fraction, ATM was clearly located in the cytoplasmic rather than the nuclear fraction in mouse cerebellum (Figure 3a). This finding is novel, since previous analyses until maximal cerebellar age of 6 weeks, after completion of Purkinje neuron maturation and granule cell precursor migration [96-98], had observed ATM more in nuclear than cytosolic fractions.
A localization in the cytosolic fraction was also clearly observed for ATM in SH-SY5Y cells, although the gels exhibited some leakage of the nuclear fraction to the mitochondrial fraction (Figure 3b). Importantly, this cytoplasmic localization of ATM in vitro was not altered by administration of the osmotic stressor CQ or the genotoxic stressor bleomycin (BLEO) in several independent experiments (Figure S3a/b). One experiment with LY stress, and one experiment with NaARS stress also failed to detect an ATM localization change. These results indicate that the ATM knockdown in SH-SY5Y neuroblastoma cells can be used as useful in vitro models for neural Atm-deficiency, regarding transcript and protein levels, stress induction and subcellular fractionation.
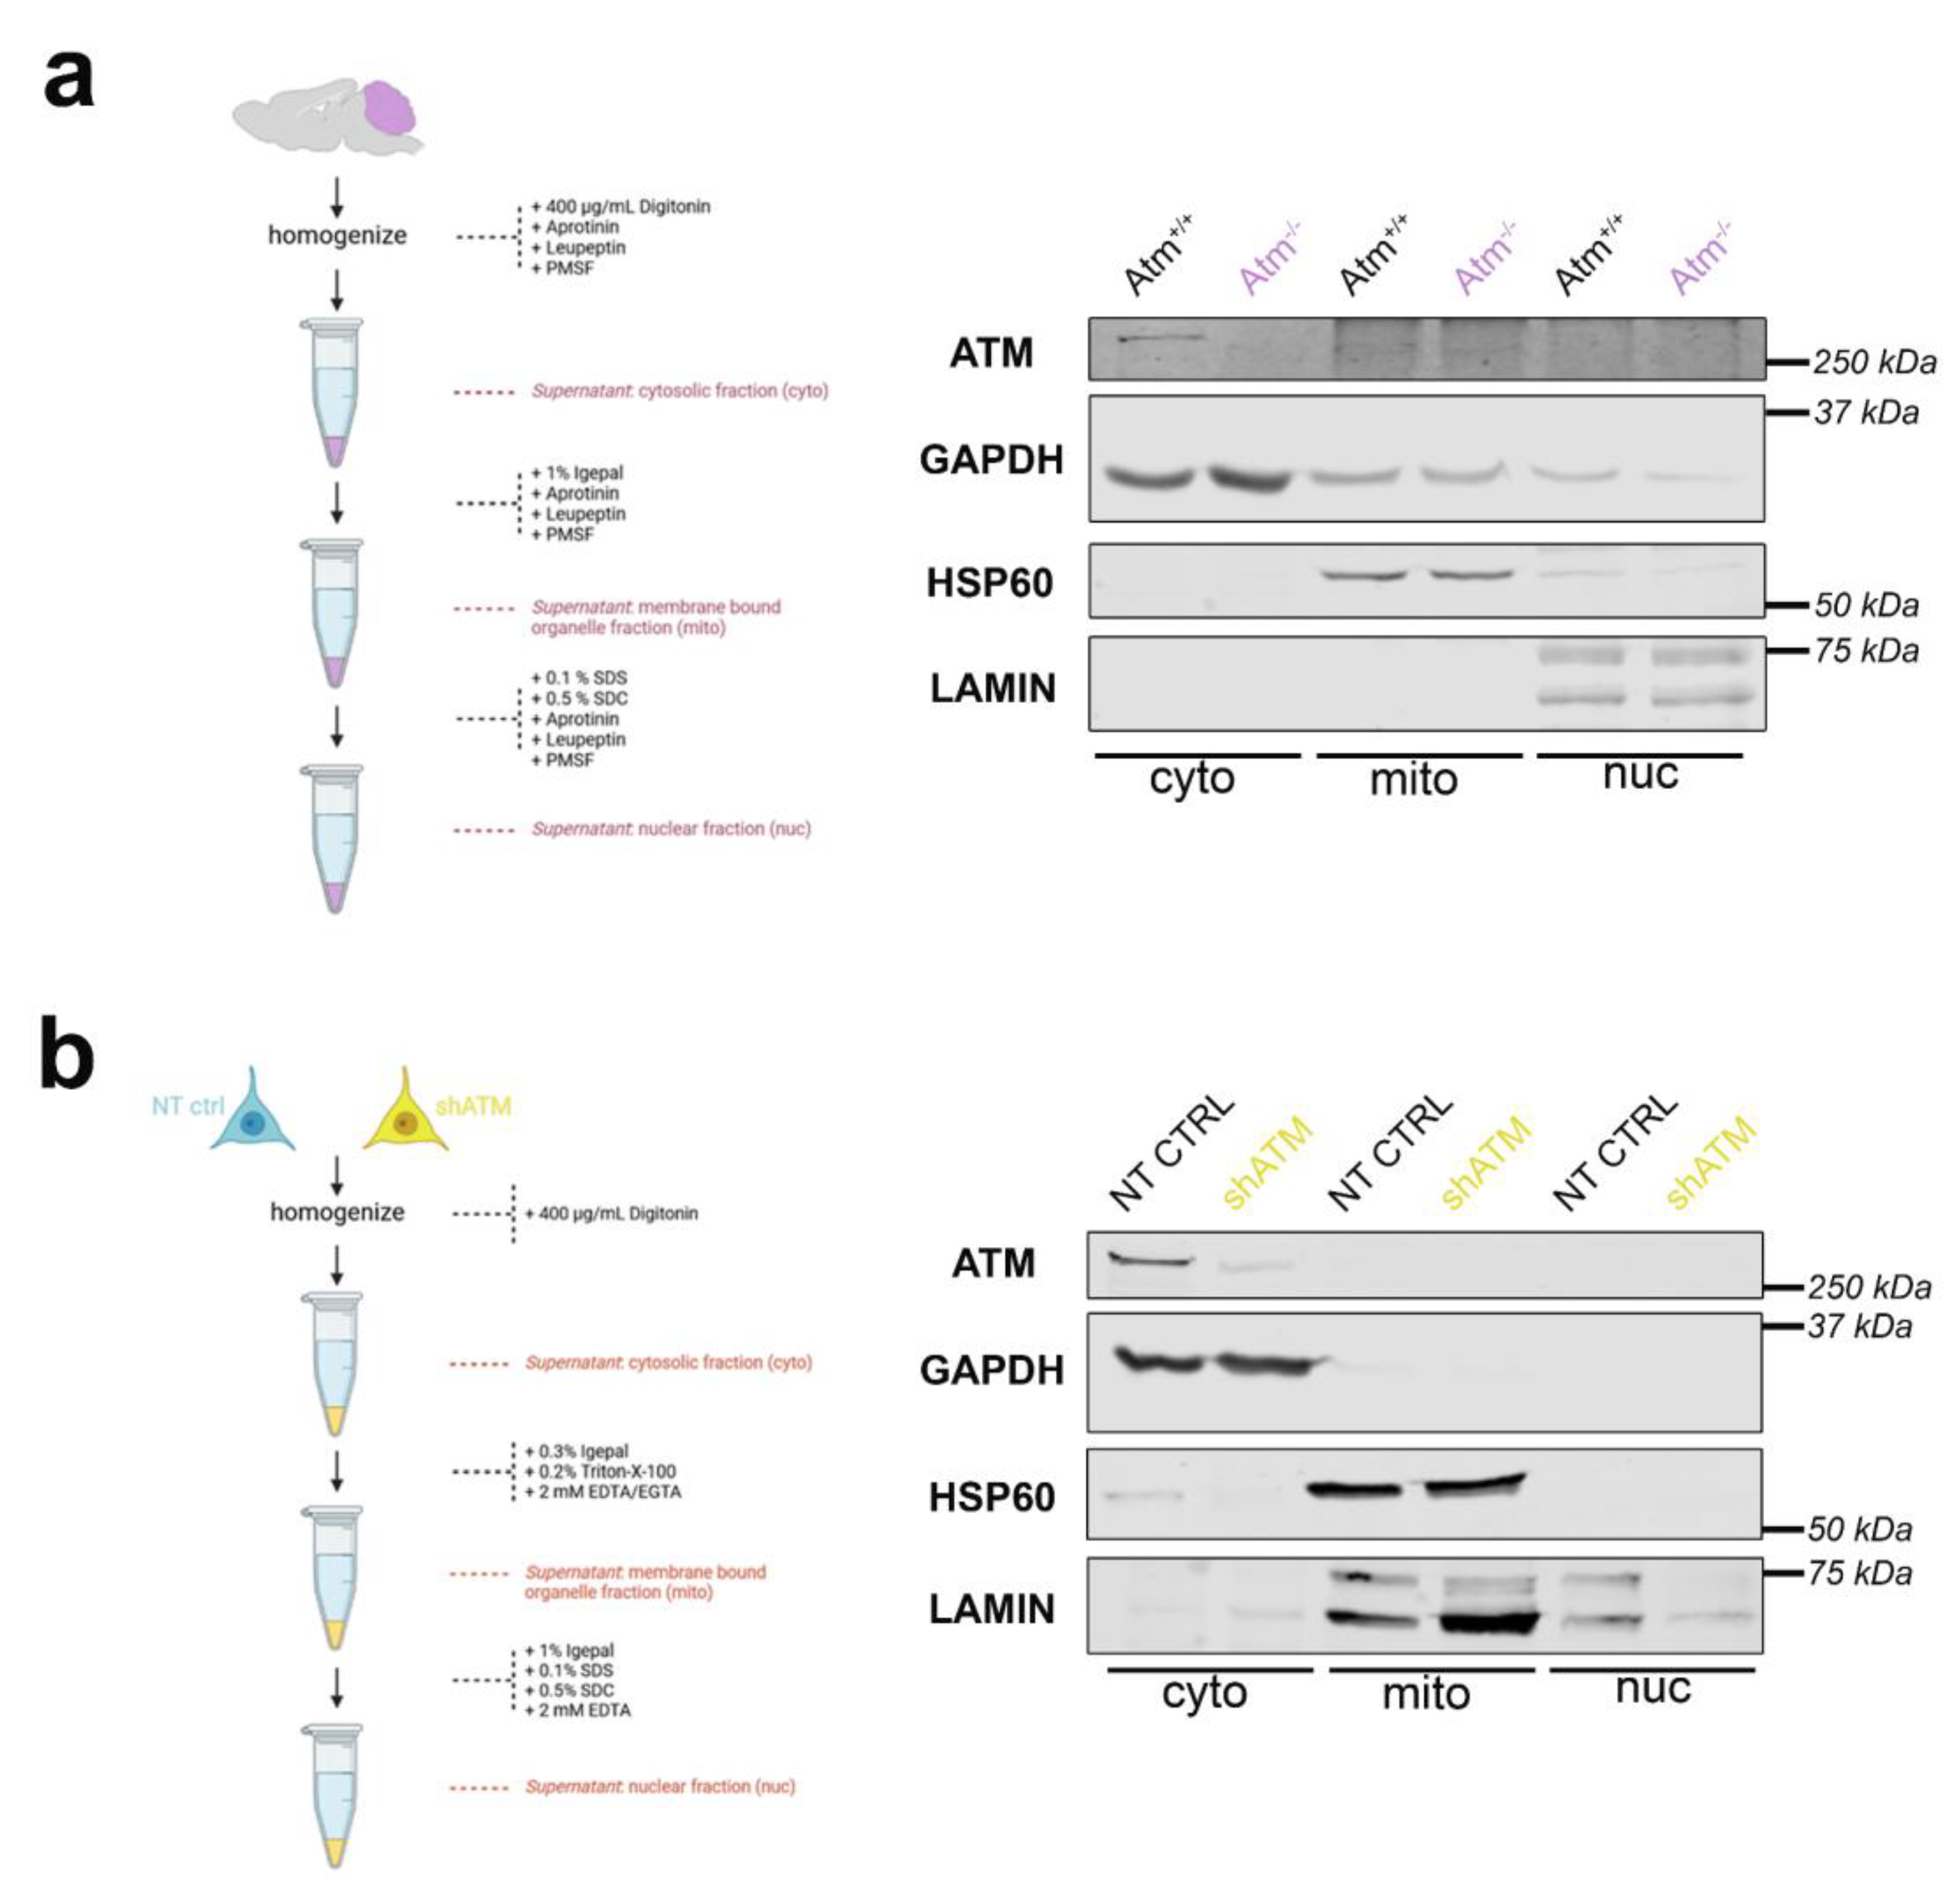
Figure 3.
ATM localization in subcellular fractions by differential detergents. The workflow scheme is shown on the left side. On the right side, samples represent cell fractions of cytoplasm (cyto), mitochondria (mito) and nucleus (nuc). The purity of each aliquot was assessed by the markers GAPDH for cytoplasm, HSP60 for mitochondria, and LAMIN-A/C for nucleus. The size markers in kilodaltons (kDa) on the right margin of each gel confirm the expected molecular weight of each protein studied. (a) Immunoblot detecting ATM in WT versus Atm-KO mouse cerebella from 3.5-month-old mice. (b) Immunoblot detecting ATM in non-target shRNA transduced control (NT CTRL) versus shATM transduced mutant SH-SY5Y neuroblastoma cells.
3.3. The ATM-null cerebellar mRNA dysregulations are mimicked in SH-SH5Y cells by ATM knockdown rather than ATM kinase antagonism, and by CQ better than trophic / oxidative / genotoxic stress
To understand whether the cerebellar dysregulations of old ATM-null mice are due to ATM absence as platform for protein complex formation, or absent ATM kinase activity, we assessed if they are recapitulated after stress in neuroblastoma cells upon KD of ATM mRNA, or after treatment with KU-55933 (KU) as pharmacological inhibitor of ATM-mediated phosphorylation (scheme and control of ATM mRNA levels in Figure 4a/b). As representative transcripts under control of ATM, we chose upstream effectors such as USP2 in view of its role within the ATM-interactome, and PER1 as immediate-early transcript modulated by phosphorylation cascades (Figure 4c-f). Figure 4c shows the expected significant downregulation of USP2 after CQ administration in the ATM-KD cells (to 65% of control after CQ, and further reduction to 48% and 38% in shATM cells with and without CQ-stress), while in KU-treated cells downregulation of USP2 was only generated by CQ-treatment but not the kinase inhibition. Similarly, Figure 4d shows significant ATM dependent CQ stressor effect, with the significant 1.5 fold induction of PER1 by CQ stressor being abolished to control levels in shATM cells. Again this effect was not reproduced in KU-treated cells. For USP2 (Figure 4e), genotoxic and oxidative stress were unable to trigger the downregulation, only trophic stress by treatment with the PI3K-inhibitor LY-294002 resulted in a significant ATM-dependent reduction. For PER1 (Figure 4f), all other stressors were ineffective. Exploiting the availability of a specific and sensitive anti-PER1 antibody, a reduction of PER1 protein was found in neuroblastoma cells with stable ATM KD even before the application of acute stress (Figure 4g). The administration of CQ resulted in a PER1 reduction in NT CTRL cells, but a converse PER1 protein induction in shATM cells. Thus, a combination of ATM-KD with CQ-stress appeared to represent the best in vitro modelling approach in SH-SY5Y neuroblastoma cells, to investigate the roles of cerebellar mRNA dysregulations in aged ATM-null cerebellum.
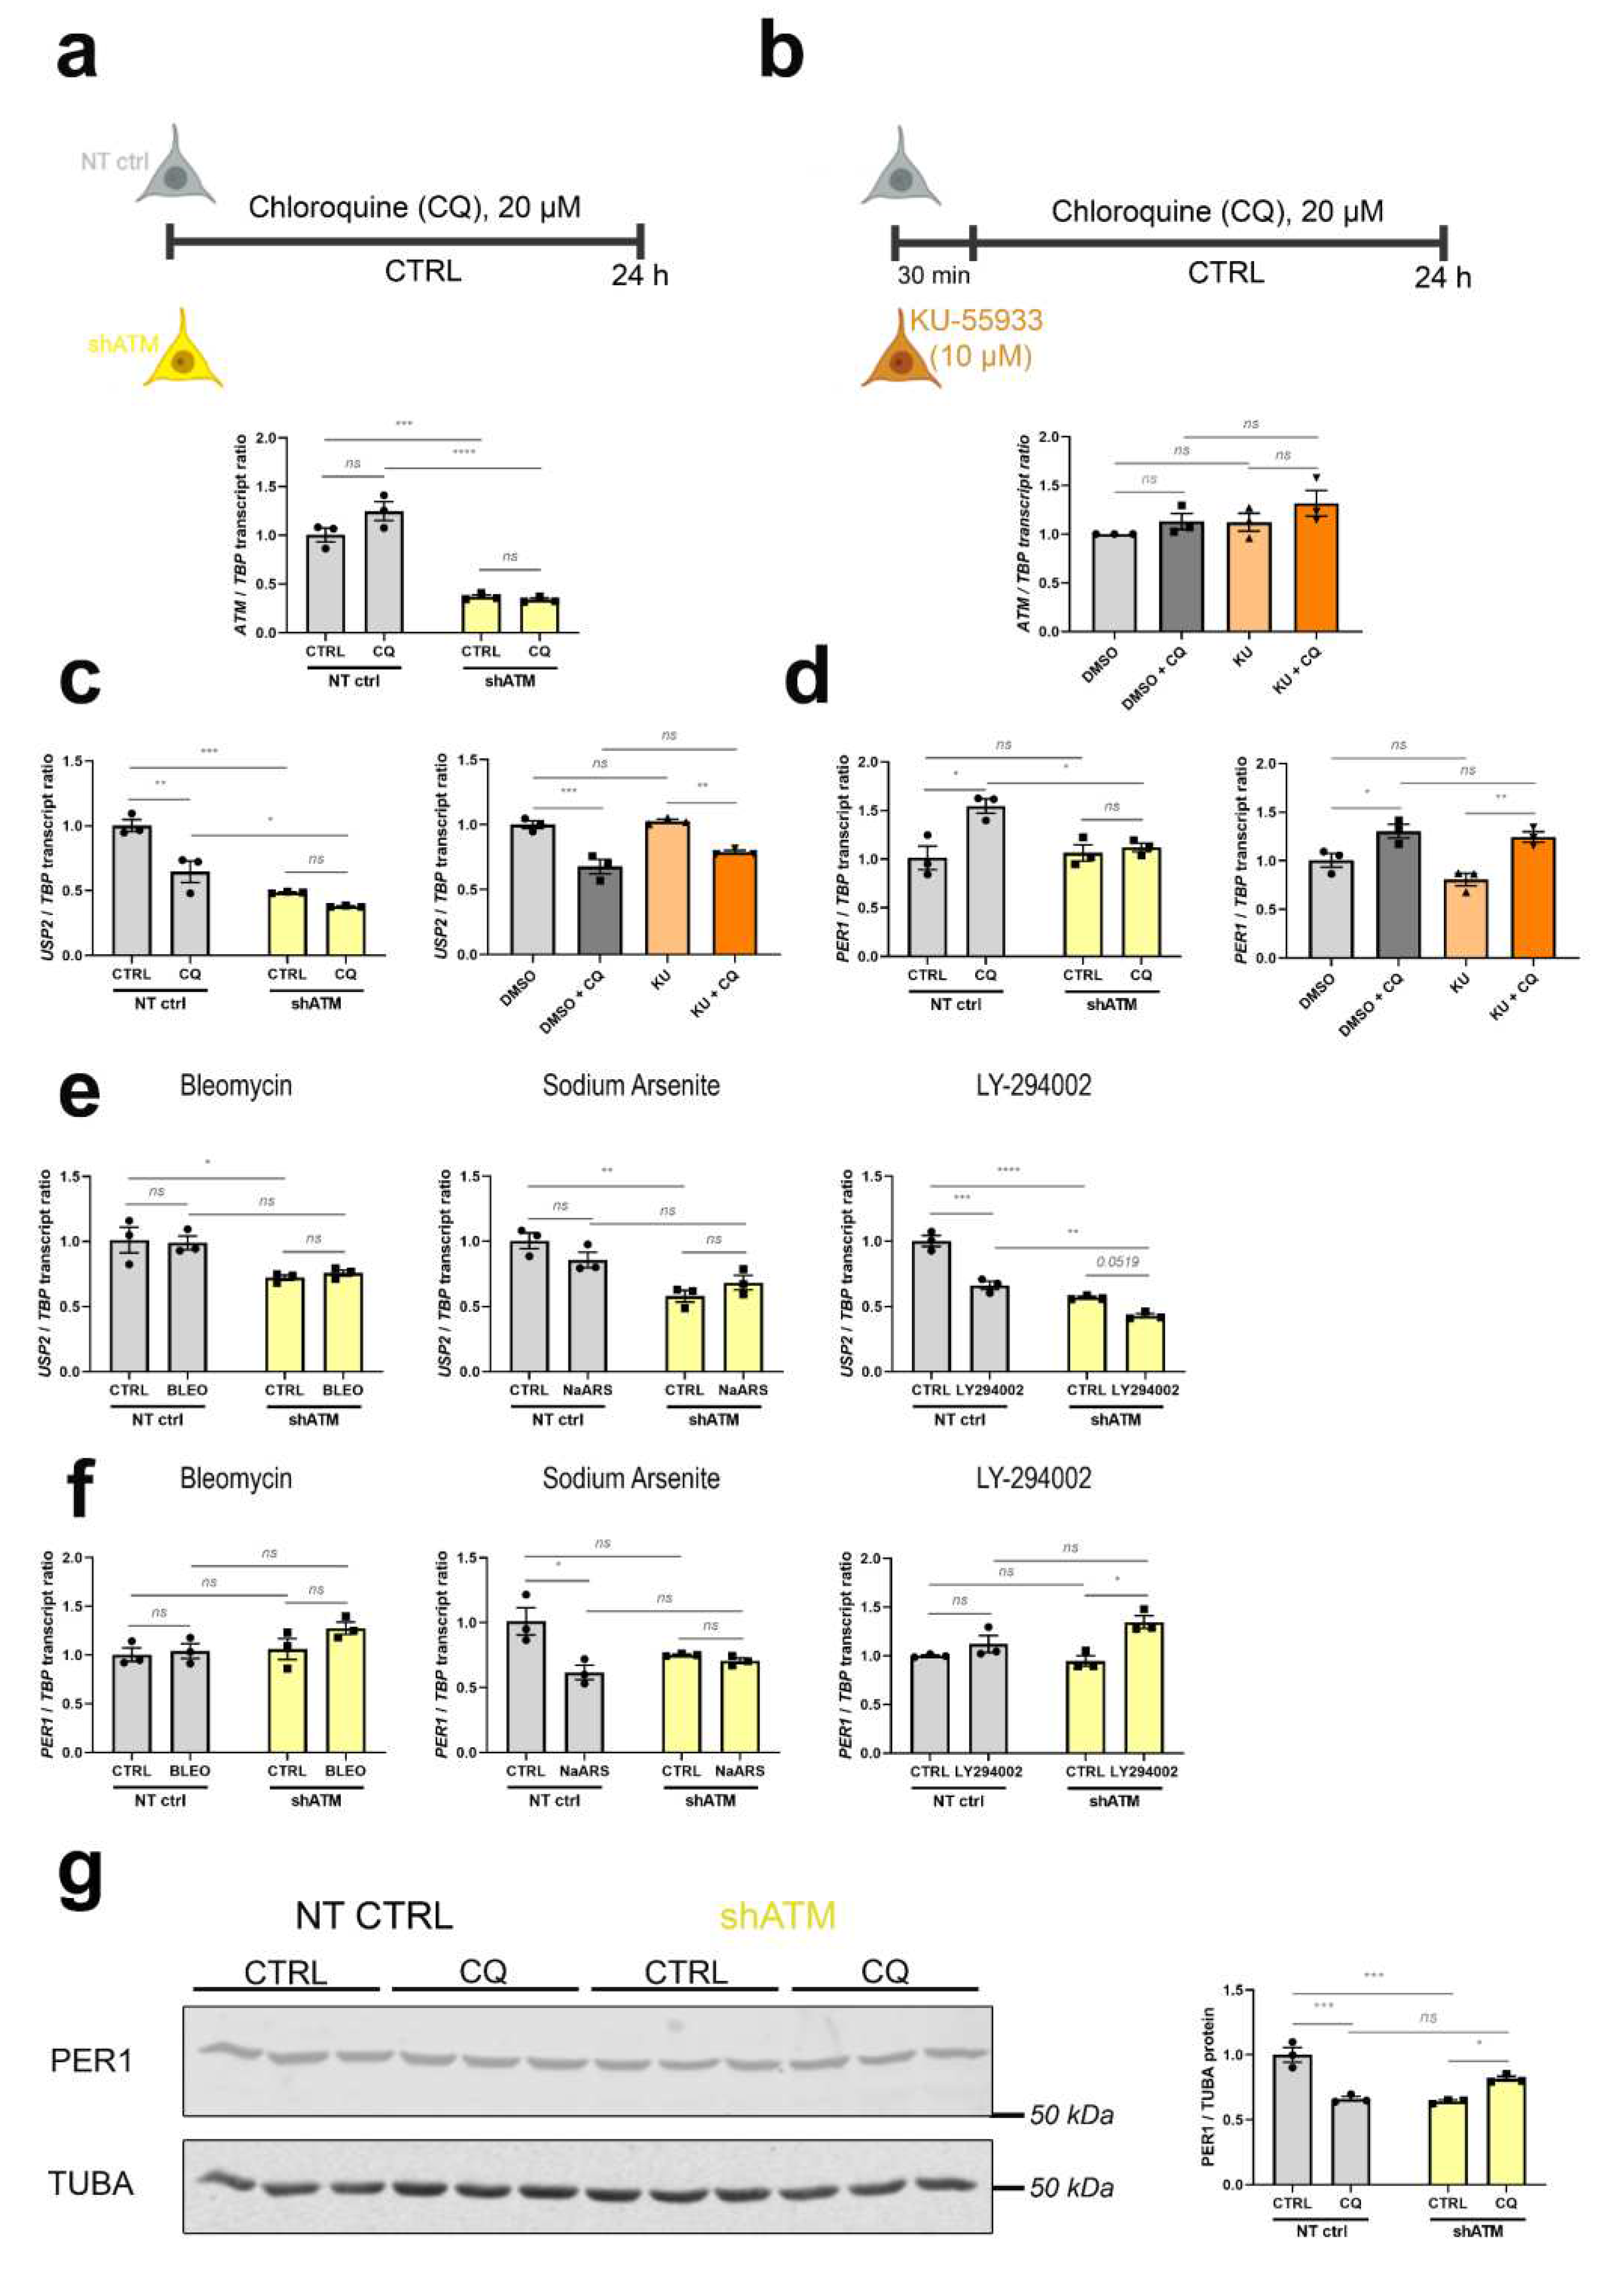
Figure 4.
ATM-KD successfully models the dysregulations found in vivo, while inhibition of ATM kinase function is not effective. (a) Scheme of chloroquine (CQ) stressor treatment in ATM-KD SH-SY5Y cells (upper panel) and corresponding ATM transcript levels determined via RT-qPCR (n = 3, lower panel). (b) Scheme of CQ stressor treatment in parental SH-SY5Y cells with KU-55933 ATM kinase inhibitor pretreatment (upper panel) and corresponding ATM transcript levels determined via RT-qPCR (n = 3, lower panel). (c) Comparison of ATM interactor USP2 mRNA and (d) immediate early transcript PER1 levels in ATM-KD (left) vs ATM-kinase-inhibited parental cells (right) after CQ stress, as determined via RT-qPCR (n = 3). (e) Reduction of USP2 transcripts upon CQ-stress and in ATM-KD is largely reproduced by LY-294002 stressor treatment, but not after BLEO and NaARS treatment of ATM-KD cells (n = 3). (f) BLEO, NaARS and LY-294002 stressor treatments do not reproduce the ATM dependent PER1 transcript induction present in aged ATM-null cerebellum, which was however successfully modelled after CQ-stressor treatment of ATM-KD cells (n = 3) as seen in panel (d). (g) PER1 protein is reduced by CQ-stress administration in NT CTRL cells and generally in shATM cells, as determined by quantitative immunoblots (n = 3). For statistical trends, the precise p-value was shown. Asterisks display significance. * = p ≤ 0.05, ** = p ≤ 0.01, *** = p ≤ 0.001, **** = p ≤ 0.0001, ns = non-significant. Data were displayed as bar plots with data points, mean ± SEM.
3.4. Also in human cells, ATM-deficiency impacts key pathomechanism factors like interactor ATMIN, immediate-early mRNA FOXO3, osmotic regulator RRAGD, vasoconstriction regulator ECEL1, and ataxia transcripts GRID2, ITPR1 and MME
Although the global transcriptome profile of old ATM-null cerebellum identified many novel pathogenesis events, it remained unclear to what degree these findings are conserved in human, and whether they can be explained by osmotic stress. Therefore, validation experiments were conducted with RT-qPCR and quantitative immunoblots to assess key factors in human SH-SY5Y cells with ATM-KD, unstressed or after CQ administration. For validation of individual dysregulations, we selected crucial effectors of ATM function and critical determinants of the phenotypes that characterize A-T.
In parallel to the desired reduction of ATM in SH-SY5Y knockdown cells documented in Figure 4a, these further studies (see Figure 5 and Figure S4) confirmed strong genotype-dependent downregulations for ATMIN mRNA (to 71% and 76%) as mediator of ATM responses to osmotic and oxidative stress. NR4A1 and FOXO3 mRNA as immediate-early mediators of phosphorylation signals to the nucleus, both were found to be responsive to CQ-stressor treatment (1.5-fold and 1.6-fold increase, respectively), while displaying abrogated induction in shATM cells (Figure 5a, Figure S4a). Also the CQ-triggered inductions of calcium-dependent kinases CAMK2A and CAMK4 mRNA (4.1 fold and 1.3 fold, respectively) were significantly impaired upon ATM-KD (Figure S4a). Importantly, an ATM-dependent mRNA downregulation (to 32% and 37% for unstressed and stressed condition, respectively) was also observed for the ataxia gene ITPR1 and might therefore be interpreted as a loss-of-function that may have a primary role in the pathogenesis of autosomal recessive A-T, while the other ataxia genes GRID2 [99, 100] and MME [101] showed ATM-dependent mRNA upregulations (2.4 fold and 3.4 fold for GRID2; 1.6 fold and 3.0 fold for MME, in unstressed and stressed ATM-KD cells) that may represent compensatory efforts, and the ataxia transcript RORA [102, 103] exhibited only a response to osmotic stress (1.8 fold increase in CQ treated cells; Figure 5a). As further evidence for compensatory reactions to osmotic stress, RRAGD mRNA (encoding Ras-related RagD amino acid sensor [104, 105]) showed significant upregulation after CQ treatment, and even bigger upregulation after ATM-KD (4.0 fold induction in NT CTRL cells and 8.1 fold increase in stressed shATM cells, Figure 5a). Also SGK1 transcript was induced only upon CQ treatment in shATM cells (1.4-fold, p = 0.3903 and 2.4-fold, p = 0.0007) corroborates the presence of osmotic stress (Figure S4a). As putative modifier of vasodilatation, ECEL1 mRNA [106, 107] was found upregulated after CQ stress in NT CTRL cells (1.4-fold, Figure 5a) and after oxidative stress in ATM-KD cells (1.4-fold), as well as after CQ stress during ATM kinase inhibition (1.2-fold) (Figure S4b).
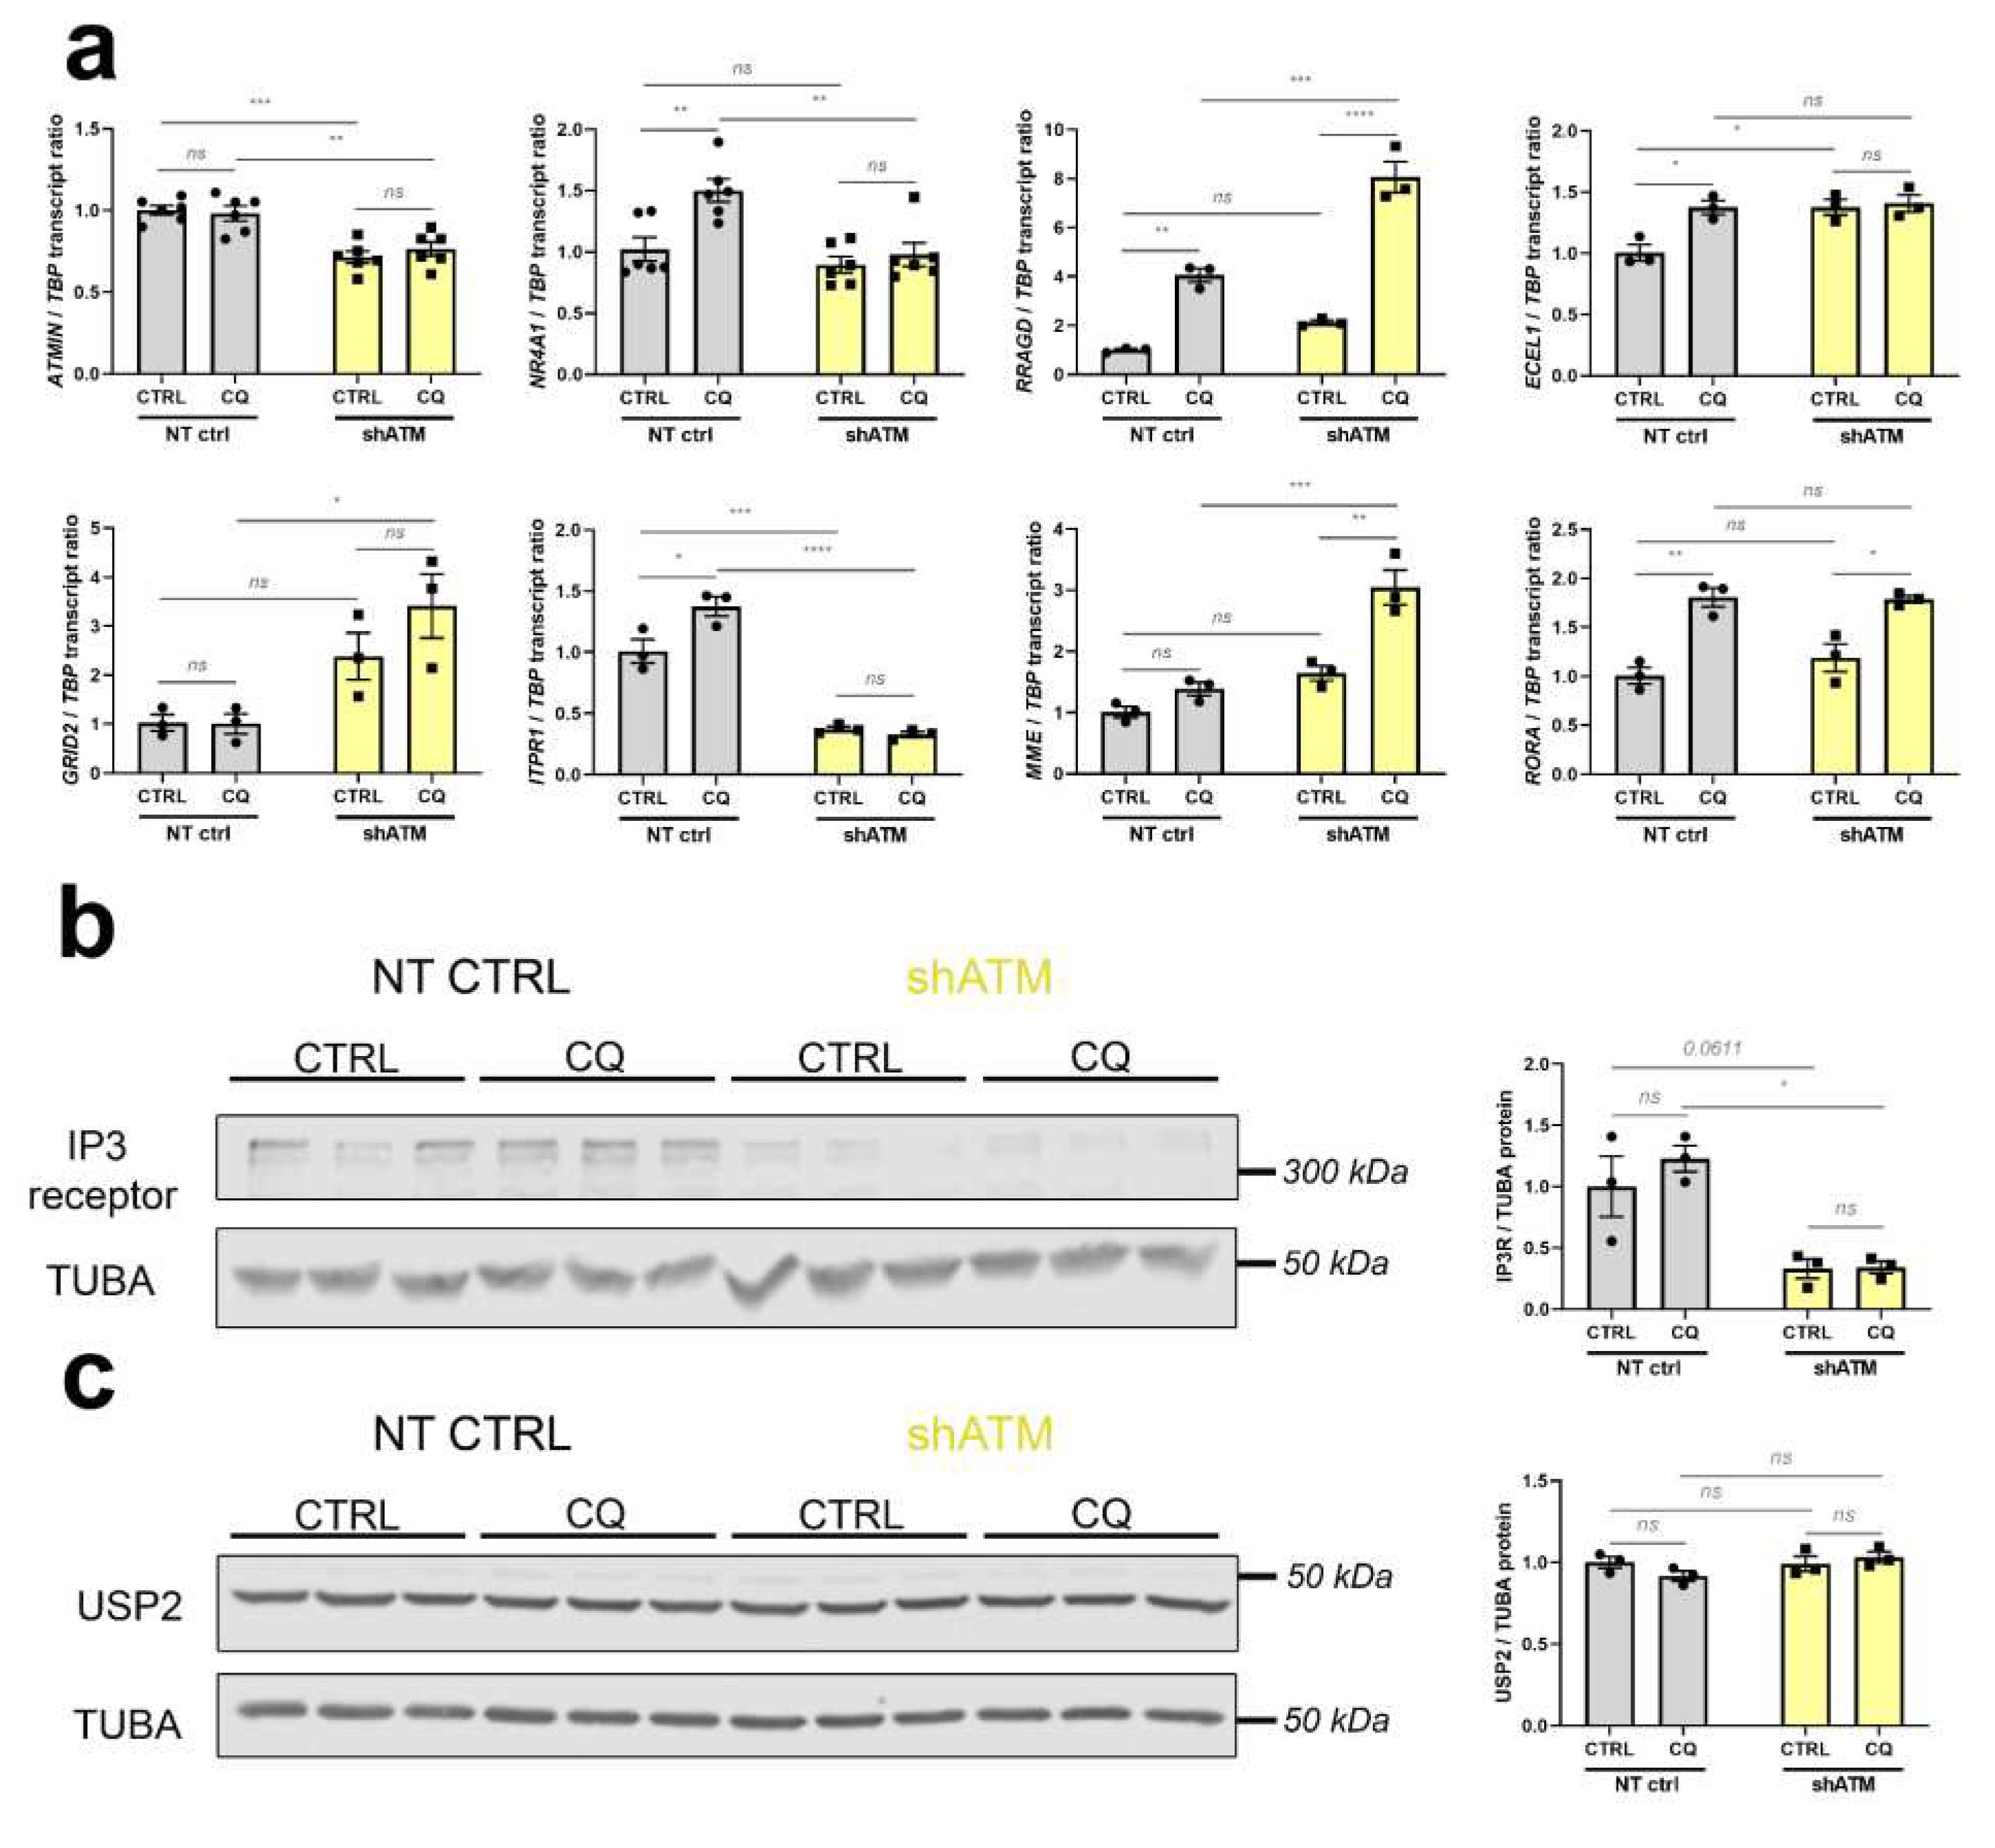
Figure 5.
The stressor chloroquine provides the most effective model in SH-SY5Y ATM-KD cells, for representative strong dysregulations in different pathways, which were previously documented in aged ATM-null cerebellum. (a) ATMIN mRNA (n = 6) was analysed as interactome component of ATM. NR4A1 (n = 6) was analysed as immediate early gene. RRADG (n = 3) transcript levels were analysed as positive controls for osmotic stress elicited by CQ. ECEL1 (n = 3) and MME (n = 3) were analysed for the group of neuropeptide endopeptidases. mRNAs for GRID2 (n = 3), ITPR1 (n = 3) and RORA (n = 3) were analysed as known ataxia disease genes. (b) The protein Inositol-1,4,5-Trisphosphate receptor (IP3R, encoded by ITPR1) was also significantly reduced in shATM cells compared to NT CTRL cells as determined by quantitative immunoblots, while induction by CQ stressor treatment did not reach significance (n = 3). The double band around 315 kDa was quantified by densitometry. Tubulin A (TUBA) was used as sample loading control and normalizer, in view of its high abundance similar to IP3R. (c) USP2 protein appeared unchanged in quantitative immunoblots (n = 3) of shATM cells compared to NT CTRL cells, despite the transcript induction shown in Figure 3e. For statistical trends, the precise p-value was shown. Asterisks reflect significance: * = p ≤ 0.05, ** = p ≤ 0.01, *** = p ≤ 0.001, **** = p ≤ 0.0001, ns = non-significant. Data were displayed as bar plots with data points, mean ± SEM.
Quantitative immunoblots were conducted when commercial antibodies were available to us with sufficient specificity and sensitivity to detect the endogenous protein levels. For the human IP3R protein encoded by ITPR1 transcript, these experiments confirmed a strong reduction of abundance (to about 35%) upon ATM-deficiency (Figure 5b). In contrast, the quantitative immunoblots indicated the protein levels of USP2 to be unchanged by CQ and by ATM-KD (Figure 5c), so apparently the significant USP2 mRNA reduction after CQ and ATM-KD demonstrated in Figure 4c does not rapidly impact the steady-state immunoreactivity, and it may be that posttranslational control of USP2 and its MDM4/HDMX-MRN-complex-association [86, 108, 109] are more decisive for short-term USP2 activity regulation than its resynthesis. Still, our mRNA findings confirm USP2 as very consistently ATM-dependent factor whose expression is modified by cytosolic ATM in neural cells, and which functions very upstream in the ATM-dependent stress response pathways – so it might be a useful target of novel preventive therapies.
3.5. ATM-null mouse cerebellum alternatively spliced mRNAs are enriched for neurotransmission and neuropeptide signaling factors
For rapidity, stress responses are conveyed through the cytoplasm by phosphorylation signals to adapt transcription of immediate-early genes in the nuclear chromatin, but even more directly stress signaling readjusts the alternative splicing of existing transcripts in the nucleus and the editing of actively translated transcripts in the cytosol. Since the ClariomD microarrays employed for cerebellar transcriptome profiling represent almost all exons, we also assessed splice dysregulations in this dataset from aged ATM-null mice, employing the “Alt Splice View” function in the Transcriptome Analysis Console from AppliedBiosystems. Interestingly, upon filtering for significant changes (p-value < 0.05, FDR p-value < 0.25) with strong fold-change (Exon Splicing Index >/< +/- 5), a set of 40 alternatively spliced transcripts was identified. Of these, 31 displayed an overall increased exon splicing index, while 9 showed reduced exon splicing index (Figure 6a). More detailed assessment revealed that most of them represent altered quantities of a single exon within a dysregulated transcript, and because of concerns that not all oligonucleotide probes within a mRNA can be expected to exhibit parallel linear signal changes and might therefore mimic alternative splicing artificially, we decided to annotate such observations for the main candidates (Table S1, second datasheet). Again the neuropeptide signaling pathway (FDR q=1.16e-6), regulation of neurotransmitter levels and synapse organization were prominent, as identified by the STRING Web browser (Figure 6b).
Oprm1 stood out with an overall exon splicing index of 39.17, which is summarized graphically (Figure 6c) by the Transcriptome Analysis Console (Applied Biosystems) for each oligonucleotide probe along the transcript structure. Extrapolating probes within individual exons or at the junction between known exons or cryptic exons from these data in mouse onto known facts in human, we tested the credibility of these Oprm1 splice changes by RT-qPCR in human neuroblastoma cells. It should also be taken into account that an oligonucleotide probe within an exon may show a differential increase or decrease, while a Taqman assay is usually quantifying the amplification product at the junction between two adjacent exons, so a splice change may be detectable by a specific RT-qPCR assay but not the neighboring assay, and the effects may not be conserved between species, with differing exon number nomenclature. As shown in Figure 6d, the exon 2-3 boundary of Oprm1 exhibited a 15-fold signal increase in old ATM-null cerebellum, while the exon 5-6 junction signal was unaltered. In the human SH-SY5Y cells, the RT-qPCR results of exon 1-2 and exon 3-4 boundaries in OPRM1 transcript also showed a massive dysregulation upon ATM deficiency (reduction to 5%), with no significant change after osmotic stress (Figure 6e). This downregulation was not detected upon ATM kinase inhibitor treatment (Figure S4c), where OPRM1 transcript levels remained stable. OPRM1 transcript downregulation exclusively in the ATM-KD condition was robustly reproduced also in experiments with BLEO, NaARS and LY-294002 (Figure S4c), reflecting stressor-independent effects of ATM deficiency itself. Thus, although the splicing details may differ between species and cell type, with cerebellar tissue even revealing opposite effects than cultured neuroblastoma cells, the mouse microarray data and validation experiments by RT-qPCR in mouse cerebellum and human neuroblastoma cells clearly identified the opioid mu receptor as mRNA under control of ATM.
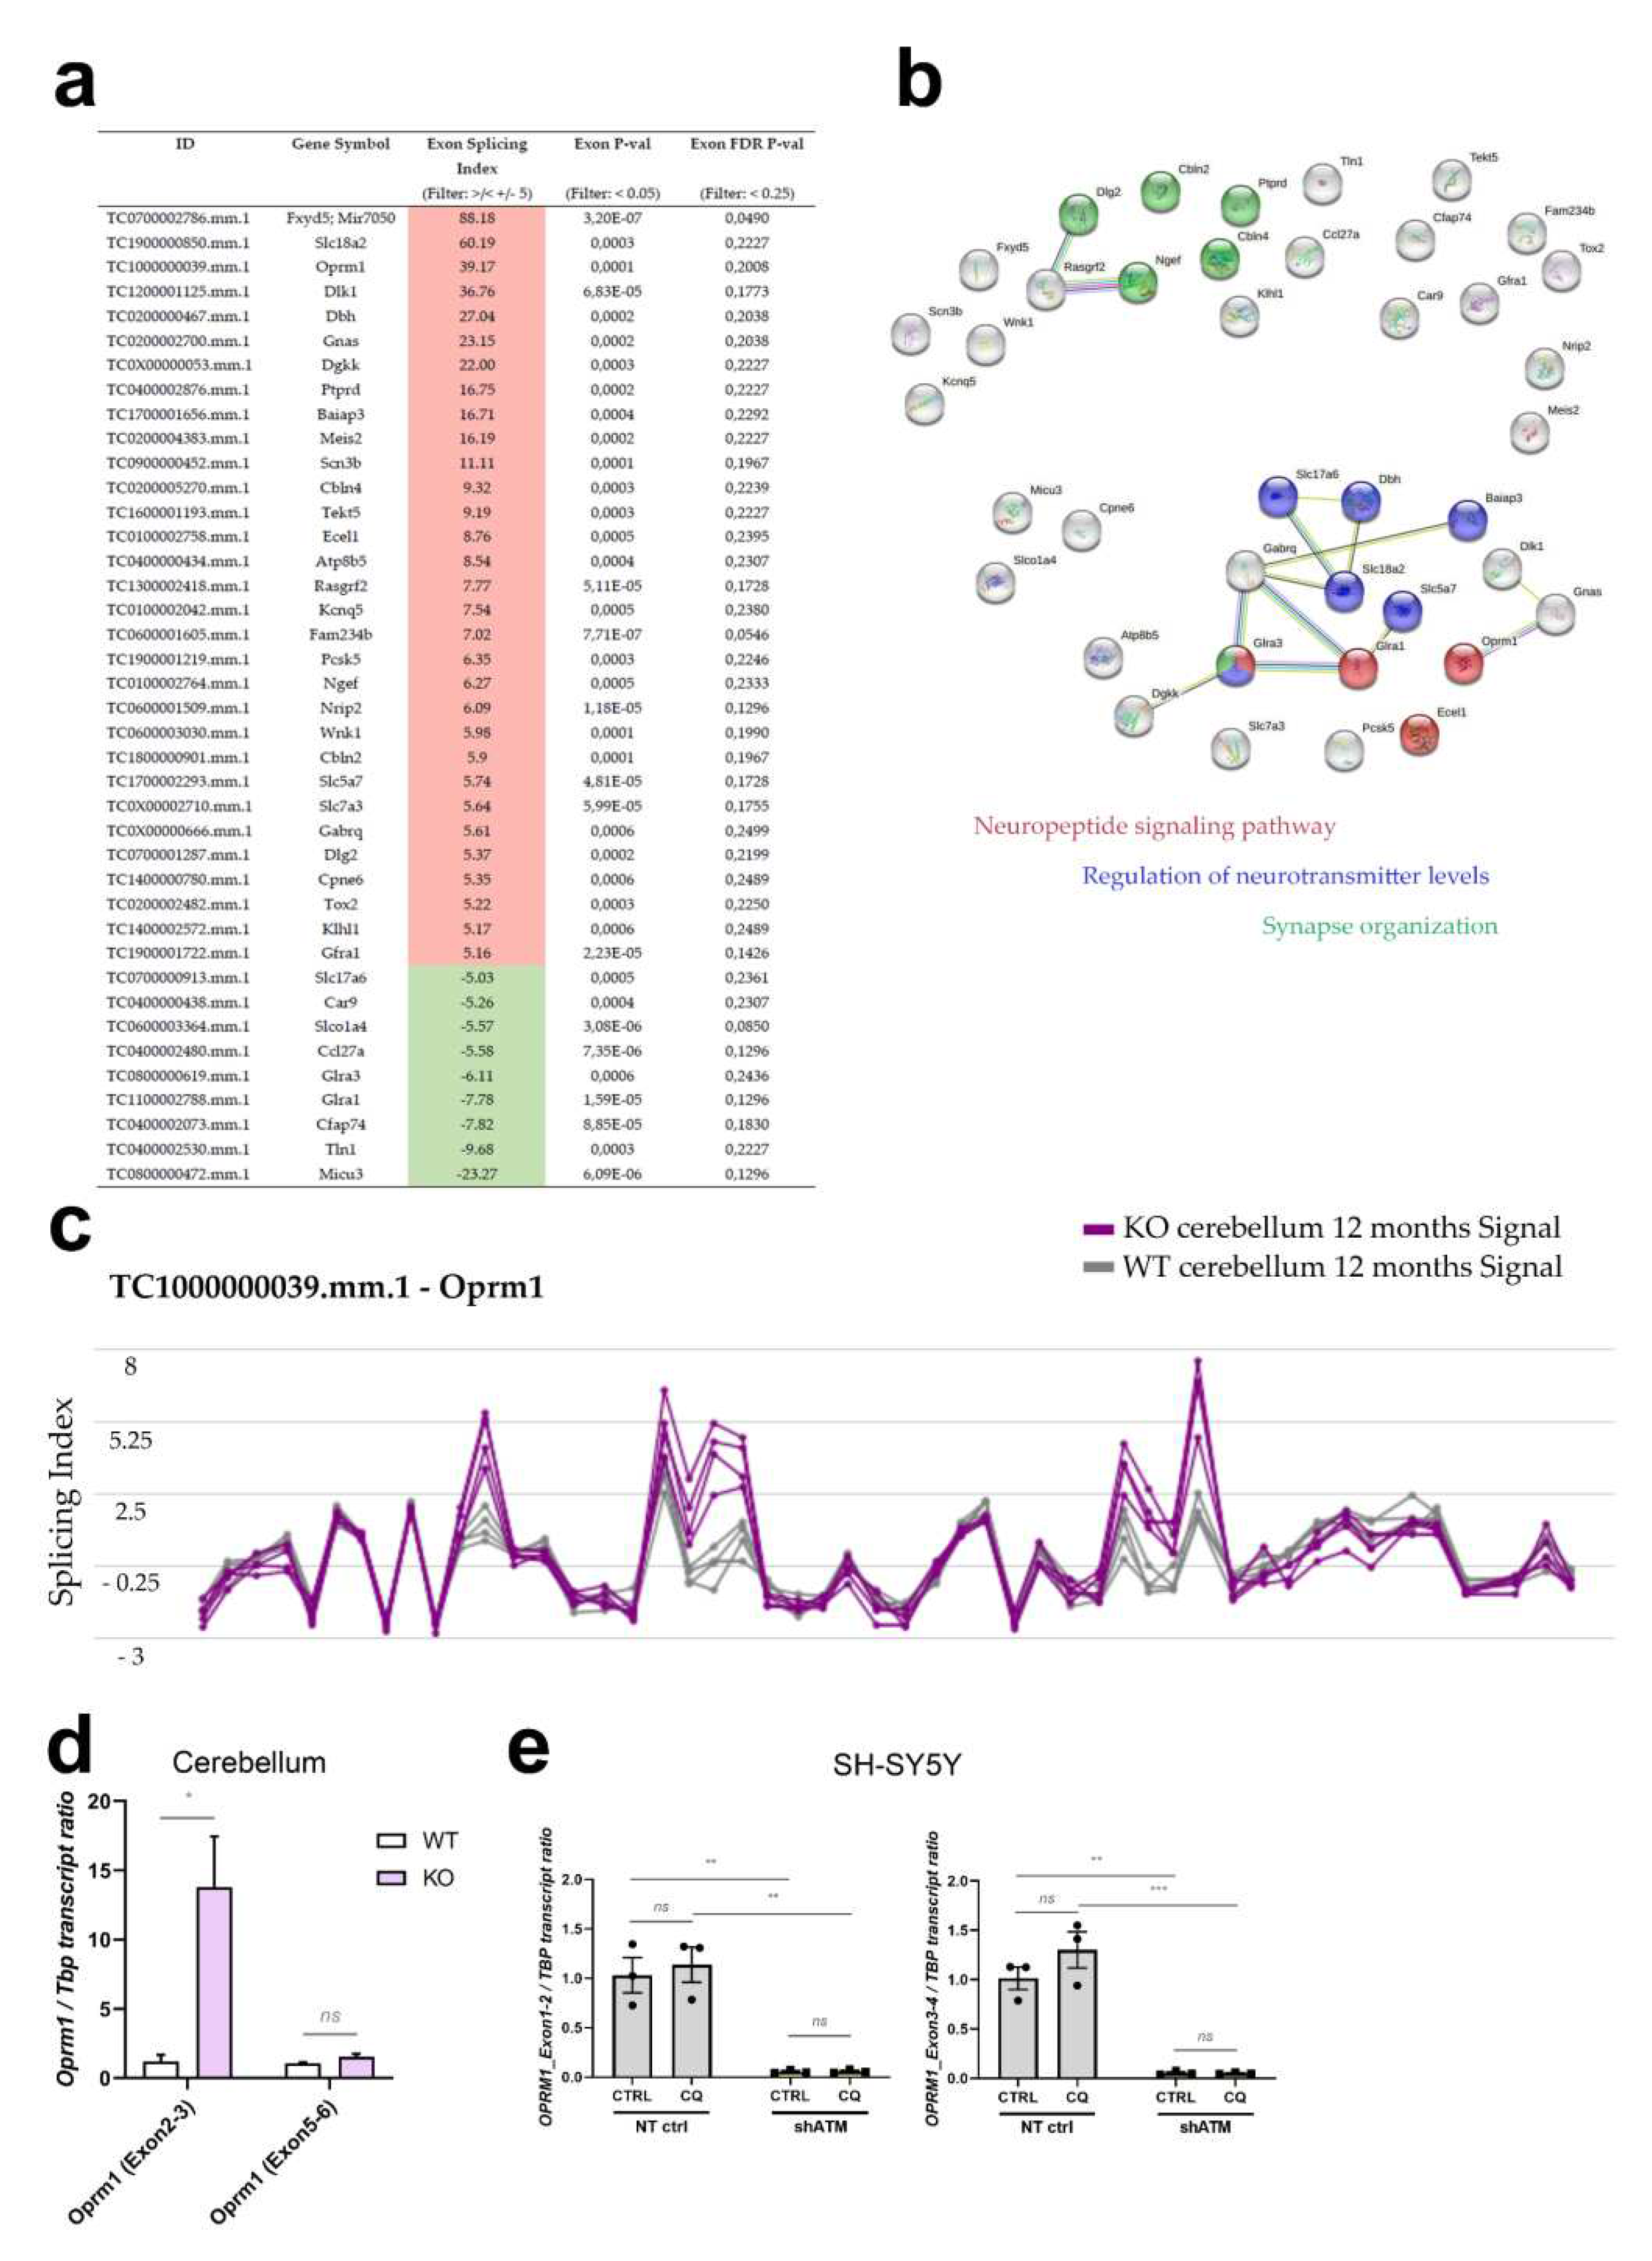
Figure 6.
Genome-wide survey of alternative splicing in cerebella from 12-month-old ATM-null mice reveals enrichment for neuropeptide signaling pathways and neurotransmission. (a) Table of all transcripts that display excessive alternative splicing (Filter criteria: Exon Splicing Index >/< +/- 5, Exon p-value < 0.05, Exon FDR p-value < 0.25 and Group: Multiple Complex and Coding). Increased exon splicing index is highlighted in red, decreased exon splicing index in green. (b) String functional connection networks (https://string-db.org/) of these alternatively spliced transcripts. Red buttons belong to the neuropeptide signaling pathway, blue buttons are implicated in regulation of neurotransmitter levels, and green buttons exert functions during synapse organization. (c) Structure view of the Oprm1 transcript structure with splicing indexes displayed in line plots for WT (grey) and Atm-KO (purple) cerebellum. Validation experiments in (d) cerebellum of 12-month-old Atm-KO vs WT (4 vs 4) mice and (e) SHSY5Y-KD cells under CQ-stress. Asterisks reflect significance: * = p ≤ 0.05, ** = p ≤ 0.01, *** = p ≤ 0.001, ns = non-significant.
4. Discussion
Overall, the novel transcriptome profile of 12-month-old ATM-null cerebellum shed light on the primary role of osmotic stress in A-T pathogenesis, identified molecular correlates of A-T phenotypes such as incipient ataxia / vasodilatation / growth impairment, defined dysregulations of interactor molecules of cytosolic ATM that may represent useful upstream targets of neuroprotection, and documented generalized affection of neurotransmission and neuropeptide signaling – presumably mediated by cytoplasmic vesicles that have ATM protein associated to them. Given that the validation experiments were able to reproduce faithfully many dysregulations in human cell culture models of A-T, it is worthwhile to take all cerebellar dysregulations seriously and discuss the novel evidence extensively.
4.1. The cerebellar transcriptome profile of ATM-null mice at 12 months of age
This cerebellar transcriptome profile was exceptionally informative, probably because protein kinases such as ATM are part of phosphorylation cascades that relay information on membrane events to the nucleus, governing transcriptional responses to stimuli versus stress. Before experiments in a cell culture model of ATM dysfunction validated whether individual dysregulations are reproducible in human, and how they depend on stress, it is important to understand the relevance of these key factors within the complex pathogenesis of cerebellar A-T. Thus, we feel the necessity to discuss the integration of all the strong dysregulations with multiple weaker effects within the same significantly enriched pathway, because often upstream events are small while subsequent signaling cascades will amplify the fold-changes of downstream molecular events. After identifying relevant changes in upstream coordinators and mechanisms of each affected pathway, it is important to explore how they are connected to ATM and how they overlap with other cerebellar ataxias. This discussion text aims to describe a coherent scenario where the failure of stress responses and the underlying toxic agents can be understood better.
To better understand the observations, it may help to consider the analogies between the cerebellar pathology in A-T on the one hand, versus the common sunburn on the other hand. Ionizing radiation and ultraviolet-B-light (UVB) light are typical causes of DNA-DSB in the nucleus, which are sensed by ATM to coordinate repairs. UVB is also the typical cause of sunburns in skin tissue, where not only DNA-DSB is known to ensue, but also cytoplasmic effects like calcium-dependent excitation with chemokine / cytokine release, vasodilatation, inflammation, pain, and keratinocyte death or carcinogenesis [110, 111]. It is already known that ATM is needed after sunburns to mitigate UVB damage and restore normal cell growth [112-114], so ATM deficiency is indeed expected to result to impact cytoplasmic homeostasis, including prolonged vasodilatation, edema and pain via peptide signaling. The present transcriptome data provide the molecular details for a similar scenario of pathomechanism in cerebellar tissue.
Regarding the prominent neurotransmission effects of cytosolic ATM, previous investigations had reported it to be key for glutamatergic excitation, while ATR was implicated in a complementary role for inhibitory GABAergic neurotransmission [39]. Indeed, our hypothesis-free microarray profiling observed a widespread profound affection of the glutamatergic pathway, reflected by downregulations of receptors Grid2 (which is responsible for Spinocerebellar Ataxia type 18 [115]), Grid2ip [116], Gria4, Grik2, Grin2c, Grm1 (responsible for autosomal recessive Spinocerebellar Ataxia type 13, and autosomal dominant Spinocerebellar Ataxia type 44 [117, 118]) and Grm4, the glial high affinity glutamate transporter Slc1a3 (encoding EAAT1 / GLAST which is responsible for Episodic Ataxia type 6 [119, 120]) and Slc1a6 (encoding EAAT4 which is involved in Spinocerebellar Ataxia type 5 [121, 122], the mitochondrial glutamate transporter Slc25a22, and an eye-catching contrast between downregulation of transporter Slc17a7 (encoding VGLUT1 in parallel fibers of the cerebellar cortex), versus massive upregulation of Slc17a6 (encoding VGLUT2 in climbing fibers of the deep cerebellum) [123]. Glutamatergic upregulations also affected Grm5, Grm3, Grm8, Grin2b, Grin3a, Grid1, Slc1a1 (encoding EAAT3), Slc1a2 (encoding EAAT2 / GLT1), Slc1a4 (encoding ASCT1), the AMPA-receptor interactor Nsg2 [124], the glutamate receptor interactor Grip1 [125], and excitation-repressing Cnr1 [126].
While extending our notions about a glutamate-focused ATM role, this transcriptomic approach permitted the additional insight that ATM loss also upregulates receptors in the inhibitory GABA-pathways (Gabra3, Gabra5, Gabra2, Gabrg1, Gabrg3, Gabrg2, Gabrq, Gabre, Gabrb1, Gabarapl1 (contrasted by downregulation only for Gabra6), together with upregulation of GABA-transporters Slc6a11 and Slc32a1, as well as receptors in the inhibitory glycine (Glra1, Glra3, Glra2, Glra4), and in the dopamine (Drd2, Drd5), acetylcholine (Chrm2, Chrna4, Chrm3, Chrna7, Chrna6, Chrm5, Chrnb4, Chrnb3) systems. These data suggest that ATM plays a main role for stress adaptation of synaptic vesicles not only for excitatory but also for inhibitory signaling, possibly via the regulation of vesicle availability / loading / release / recycling.
Regarding neuropeptides and their receptors, additional general affection of these signaling pathways was documented, with upregulations of somatostatin (Sst, Sstr1, Sstr2), neurotensin (Nts, Ntsr1, Ntsr2), tachykinin (Tac1, Tacr1, Tacr3), neuropeptide-Y (Npy, Npy1r, Npy4r) mRNAs, and Resp18 mRNA encoding a factor responsible of neuropeptide packing in dense core vesicles [127-129], as well as Qpct encoding a factor responsible for the N-terminal pyroglutamyl residues of neuropeptides and cytokines [130]. Also Oprm1 as mu-type (morphin-type), Oprl1 as kappa3-type (nociception-type), and Oprk1 as kappa1-type (for alpha-neoendorphins and dynorphins) of opioid receptors showed upregulated transcripts. These cerebellar findings identify molecular mechanisms how ATM deficits trigger not only excessive changes in neurotransmission, but may come to impact vasodilatation / telangiectasia and inflammatory edema (via tachykinins, Ecel1), growth and fertility (via somatostatin and neuropeptide-Y), immunity and lipid metabolism (via neurotensin), as well as pain perception (via opioids). As one of the strongest upregulated transcripts, Rgs4 is a known regulator of G-protein signaling downstream from mu- and kappa-opioid signaling [131-134]. Even the neuropeptide activator Pcsk1 and its inhibitor Pcsk1n, as well as neuropeptide inactivators like Mme (which is responsible for Spinocerebellar Ataxia type 43 [101]) and Ecel1 were upregulated. These data suggest that ATM plays a stress adaptor role in general also for dense core vesicles where neuropeptides are stored.
Regarding the atrophy of aged cerebellum in A-T, it is plausible to pay attention to neurotrophins and other cytokines, which are stored in large dense core vesicles (LCDV) before their release and where ATM might play a similar role as for neuropeptides. Indeed, upregulations of neurotrophin receptors Gfra1 and Gfra2 [135, 136], inhibitory neurite growth modulators Slitrk3 [137, 138], Slitrk5 [139] and Slitrk6 [140], neuronal sorting receptors Sorcs1 and Sorcs2 [141-144], stress-dependent transcription factor Jun with its kinase Mapk9 / Jnk2 [145, 146], and heavy-metal-toxicity-inducible death executor Ngfrap1 [147, 148] suggest at first glance that LCDV pathology might contribute to a trophic imbalance in the cerebellum. Furthermore, a downregulation of the ligands Nrg1 and Nrg3 with converse upregulation of their receptor Erbb3 and Erbb4 transcripts was observed [149]. However, while systematic interrogation confirmed exclusively upregulations as in neurotransmission and neuropeptide pathways, a similar systematic interrogation of cytokine receptors and their ligands did not reveal a similarly uniform effect. Crucial downregulations of neurotrophin Ntf3 with its receptor Ntrk3, as well as the sorting receptor Sorl1 [150] were observed. On the one hand, increased transcript levels were documented for Tgfbr1, Tgfbr2, Pdgfra (with ligand Pdgfc), Epha4, Epha5, Epha5 (with ligands Efna2, Efna3, Efna5), Fgfr3 (with ligands Fgf18 and Fgf5), Fgfr1op2, Csf1r, Bmpr1b, Lifr, Atp2b4, Tnfrsf13c, Tnfrsf21, Fzd8, Sfrp5, Kdr, and ligands Bmp2, Fgf13, Efnb3, Il18, Il33, Il34, Igf1 without their receptors. On the other hand, a smaller number of conversely decreased transcript levels were documented for Fzd4 (with downregulated ligands Wnt3, Wnt7a), Igf2r (with downregulated ligand Igf2), Igflr1, Epha3, Pdgfrl, Sfrp1, Kit, Socs7, Il20rb, and ligands Bmp1, Bmp7, Fgf14, Il16 without their corresponding receptor. Thus, while a systematic effect of ATM on all cytokines and neurotrophins is doubtful, specifically the deficits of Ntf3 and Ntrk3 are relevant for the survival of cerebellar granule neurons in a mechanism via Phospho-inositol-3’-kinase (PI3K). Importantly, the vesicle release of neurotransmitters, neuropeptides and neurotrophin-3 has a common upstream mediator in Cadps2, which showed decreased cerebellar mRNA levels [151-156]. The balance between neurotrophin support and glutamate neurotoxicity is known to be critical also for the survival of Purkinje neurons [157-160].
What other pathways were impacted in several components across the cerebellar transcriptome profile of ATM-null mice, given that the hypothesis-free global transcriptomics approach might give novel clues to understand A-T pathogenesis better? Second messengers downstream from neuropeptide receptors appeared altered, in view of the G-protein signaling factors Rgs4, Rasgrf2 and Gpr165 upregulations [131, 161, 162], and the dysregulation of calcium modulators Necab1 (up) [163] versus Itpr1 (down, its loss-of-function being the cause of autosomal dominant Spinocerebellar Ataxia types 15 and 29, as well as autoimmune cerebellar ataxia) [57, 164-166]. The decreased mRNA levels of inositol-trisphosphate receptor Itpr1, and of Cadps2 (the Ca2+-dependent release activator for neurotransmitters, neuropeptides and neurotrophins), might be underlying contributors to this generalized pathology, given that loss-of-function of both downregulated factors results in cerebellar ataxia [154, 164, 167-169]. As further potentially upstream coordinators of pathology, the deficits of inositol-triphosphate-associated Astn2, Sorl1, and Mpp4 levels could lead to inappropriate localization of membrane proteins away from the tip of neural processes [170, 171].
Regarding upstream factors within the protein interactome of ATM, the following dysregulations deserve discussion: As a key modulator much farther upstream in the pathomechanism, the increased levels of ATM interactor Atmin mRNA probably represent a compensatory response to ATM dysfunction, possibly affecting synaptic adhesion [172, 173]. The Atmin upregulation upon ATM deficiency was unexpected, since both factors were thought to stabilize each other, with ATMIN levels being reduced upon ATM decrease, and vice versa [60, 83]. The ATM-interacting MRN complex responsible for DNA damage signaling did not show any changed mRNA levels, but the NBS1 stabilizing factor Usp2 mRNA displayed a downregulation of similar effect size and significance as Atm mRNA [86]. USP2-null mice show impaired motor coordination and equilibrium [174], so its deficiency in ATM-null cerebellum might contribute to ataxia pathogenesis. This deubiquitinase is also known as regulator of circadian clock components [175], and indeed several USP2 effectors also showed deficient transcript levels, such as Cry1 and Cry2. In view of the role of KAT5 for the regulation of ATM activity it may also be relevant that a transcript reduction in our dataset was observed for the KAT5-dependent kinase Chka, which is responsible for phospholipid biosynthesis [176, 177].
Overall, excitation and growth stimuli in the ATM-null mouse cerebellum appeared to elicit deficient nuclear responses, in view of the downregulation of immediate-early genes Nr4a3 / Nr4a2 / Nr4a1, Dusp1, Fos / Fosl2, Npas4, Per1 / Per2 / Per3, Foxo3 / Foxo1, and Homer1. A parallel downregulation of the NPAS4 protein interactor Arnt and its binding partner Hif3a mRNA were observed, as well as reduced transcript levels of downstream factors Slc2a12 and Rora (which is responsible for ataxia and intellectual deficits [178, 179]), contrasting with upregulation of the alternative interactor Arnt2 mRNA [180-184]. With relevance to the osmotic homeostasis in ATM-null cerebellum, a strong downregulation was observed for Dbp as the transcription factor that controls the expression of alpha-fetoprotein and albumin (whose dysregulation is characteristic for A-T [4, 5]), and is crucial for circadian regulation of synaptic plasticity [185-187]. The notion of changed nutrient and osmotic regulation was also supported by the downregulation of amino acid-sensing Rragd [104]. Downregulation was prominent for immune-regulating and damage-responsive protein kinase transcripts Smg1, Sik1 and Sgk1 [188-190], findings that also implicate altered RNA surveillance, osmotic and nutrient homeostasis in A-T pathology.
A deficit in inflammatory responses was also evident from the downregulated transcripts of Ccl27a, Sidt1, Il16, Rnf122 and Serinc2 [191-195]. The deficiency of immunoglobulin/fibronectin-domain-containing Boc may contribute to the observed upregulation of many protocadherin, cadherin, and contactin pathway members (Cdh6, Cdh9, Cdh10, Cdh19, Pcdh7, Pcdh10, Pcdh11x, Pcdh17, Pcdh18, Pcdh19, Cntn4, Cntn5 and Cntnap5a) [196].
In conclusion, pathway enrichment analyses of the transcriptome profile supported the novel concept that failure of ATM-mediated adaptation to osmotic / nutrient and perhaps oxidative stress, via altered USP2 / ATMIN signals, leads to a generalized abnormality in neurotransmitter-neuropeptide signals from synaptic and dense core vesicles, with reduced immediate-early signals and impaired synaptic adhesion.
4.2. The alternative splice profile of ATM-null mouse cerebellum at 12 months of age
Previous studies of ATM dysfunction demonstrated its impact on alternative splicing [53], and of course the stimulus- / stress-dependent changes in phosphorylation cascades would first impact the splice apparatus before topoisomerase-dependent immediate-early reactions and more cumbersome chromatin unpackaging events permit the subsequent transcription adaptations. Overall, our interrogation of the transcriptome for factors with strong exon splicing index effects confirmed significant enrichments in three pathways. Neurotransmission (Slc17a6, Slc18a2, Slc7a3, Slc5a7, Slco1a4, Scn3b, Kcnq5, Gabrq, Glra1, Glra3, Dbh, Wnk1, Car9, Micu3), neuropeptides / neurotrophins (Oprm1, Baiap3, Gnas, Dlk1, Dlg2, Rasgrf2, Ngef, Ecel1, Dgkk, Ccl27a, Pcsk5, Cpne6, Ptprd, Gfra1) and synaptic adhesion (Fxyd5, Cbln4, Cbln2, Nrip2) modulation was prominent. Baiap3 splice changes could contribute to impaired biogenesis of secretory vesicles, with consequences for the Ca2+ stimulated release of neurotransmitters and neuropeptides [197]. While cerebellar tissue has a broad expression profile, a neural cell culture model would express only a small subset of these molecules, so further validation experiments were focused on Oprm1, which exhibited the exceptional exon splicing index of 39.7, and acts to dampen glutamatergic neurotoxicity in the contacts between cerebellar granule neuron projections (parallel fibers) and Purkinje neuron dendrites [198-200], which is the cerebellar site most vulnerable to ataxia pathogenesis [201, 202]. With a prominent negative exon splicing index of -5.03 (p=0.005), Slc17a6 (encoding VGLUT2) also displayed evident adaptation of its exon structure, providing additional evidence that also glutamatergic climbing fiber signaling is modulated by ATM. In contrast, Slc17a7 (VGLUT1 in parallel fibers) showed a change only for its 3’-exon with nominal significance and an exon splicing index of 1.6. While the ClariomD microarray has oligonucleotides to detect sequences within most exons, the Taqman RT-qPCR assays in contrast are optimized to detect exon-exon-boundaries, so a validation experiment by RT-qPCR can only confirm the dysregulation of a specific mRNA overall, and may detect whether it disappears for a specific exon, but will not quantify the selective inclusion / exclusion of an exon. Overall, it is important to be cautious regarding the value of this splicing profile, because dysregulations of a complete mRNA may not be equally represented by every oligonucleotide, mimicking true alternative splice changes, and because experimental quantitative validation across species is cumbersome. Thus, we consider these data as preliminary screen.
4.3. Differential detergent fractionation of adult mouse cerebellum and SH-SY5Y neuroblastoma cells detects ATM mainly in cytosol
For validation of these mouse findings in the human species, a knockdown of ATM in neuroblastoma SH-SY5Y cells was employed, taking into account the previous usefulness of such human in vitro modelling projects in autophagy and chemoresistance studies of ATM [203, 204]. Neuroblastoma cell lines are known to represent a mixed population, termed N-type (neural) and S-type (substrate-adherent, epithelial like) cells. While N-type cells are neuroblast-like with little cytoplasm and few neuritic processes, the S-type cells have bigger cytoplasm and flattened morphology with strong attachment to the substrate [205-208]. Unexpectedly, ATM-KD SH-SY5Y cells displayed gross alterations in appearance, with larger and flattened cell bodies without processes, while the non-targeting control (NT CTRL) cells retained an overall neuroblast-like appearance and displayed short neuritic processes (Figure S2). Thus, flattened cells without processes that are predominant for ATM-KD cells could reflect a shift in neuroblastoma cell populations towards S-type cells. The remodelling of Ca2+ signaling was already demonstrated to be altered in S-type cells [206]. Given that SH-SY5Y cells were already shown to require ATM mediated phosphorylation of CREB protein at serine 133, to enable retinoic acid induced differentiation [209], this change of gross morphology in ATM-KD cells may represent a loss of differentiation. Indeed, dysregulation of retinoic-acid dependent differentiation regulators was also evident in the 12-month-old ATM-null mouse cerebellar transcriptome, where most components of this well characterized pathway [210-212] were strongly dysregulated, displaying increased Nrip2 (Fig. 2a), Nrip3, Rorb, Creb5, Crebl2 and Zfhx3 mRNA levels versus decreased expression of Tcf4, Crtc2, Foxo3 and the ataxia disease gene Rora, as well as downstream Itpr1 [213, 214]. A more proliferative state of the ATM-KD cells may result in reduced expression of many neurotransmission factors, potentially explaining the drastic downregulation of OPRM1 in ATM-KD neuroblastoma cells, as opposed to increased Oprm1 in ATM-null cerebellum (Figure 6d). Although some dysregulations of neuropeptide signaling were massive in the old ATM-null mouse cerebellum and were very relevant for phenotypes of A-T, e.g. the increases in mRNA of growth hormone inhibitor somatostatin (Sst), vasodilator preprotachykinin (Tac1) and the tachykinin receptor (Tacr1), as well as the glutamate-excitability factor VGLUT2 (encoded by Slc17a6), the SH-SY5Y neuroblastoma line did not express these genes. It is also important to consider that glutamate availability is very restricted for excitable neurons in vivo, but provided constantly in overdose to cultured neuroblastoma cells. Thus, our in vitro model had very limited value to model and study the ATM-dependent stress-adaptations of neurotransmitter- and neuropeptide-containing vesicles, but seemed quite helpful for the study of upstream factors in the interactome of ATM and of immediate-early responses in the nucleus.
The use of differential detergents to achieve subcellular fractionation of the old adult mouse cerebellum and of SH-SY5Y neuroblastoma line localized ATM mainly to the cytosol, both in unstressed and in stressed conditions, in WT cells and ATM-KD cells (Figure 3, Figure S3). The absence of ATM from the nucleus is in excellent agreement with subsequent findings that characteristic ATM-null cerebellar transcriptome profile anomalies such as USP2 and PER1 downregulations could not be elicited robustly by the DNA DSB stressor bleomycin in vitro, but were mirrored best by osmotic stress instead (Figure 4). Our observations that ATM is almost exclusively found within cytoplasmic fractions of cerebellum and SH-SY5Y cells are in excellent agreement with a previous immunohistochemical study that localized ATM in the cytosol of cerebellar tissue Purkinje neurons from this mouse mutant [32], but they contrast with human reports and with the immunohistochemical observation of ATM in the nucleus of cerebellar Purkinje and granule neurons, once they are dissected and kept in organotypic slice cultures [215, 216]. While nuclear ATM clearly has a role for DNA repair in proliferating cells, these fractionation findings emphasize the urgent need to understand what the functions of cytosolic ATM in postmitotic neurons are, and how impaired stress adaptation there might trigger a neurodegenerative process. Given the inefficiency of ATM kinase inhibition by KU-55933 to reproduce transcript changes observed in cerebellar tissue and upon ATM-KD in vitro, we consider the possibility that cytoplasmic ATM acts as a protein scaffold and interaction platform, rather than a kinase in cytoplasmic signaling. This was already proposed when cytoplasmic ATM was demonstrated to serve as docking site for PP2A to dephosphorylate AKT and thereby regulate cell death upon ER-stress via an ATM-AKT-GSK3β-αNAC/γTX signaling axis [217]. Further research is necessary to elucidate the potential functions of ATM as a protein scaffold in the cytoplasm.
4.4. Validation work in SH-SY5Y cells shows ATM-deficiency to impair the CQ-triggered regulation of postsynaptic calcium release channel ITPR1, in parallel to immediate-early transcripts PER1/NR4A1
The mechanistic validation experiments (Figure 4, 5, S4) focused on A-T-phenotype-related factors, documenting consistent reductions for ITPR1 levels upon ATM deficiency. Given that ATM is a member of the phosphatidylinositol 3' kinase-like kinase (PIKK) enzyme family, it may have functional interaction with the inositol-1,4,5-trisphosphate-receptor IP3R, so this decrease of ITPR1 mRNA and IP3R abundance may also represent a crucial primary loss-of-function event in autosomal recessive A-T. Genetic loss-of-function of IP3R has a profound impact on calcium-dependent excitability of Purkinje neurons and was repeatedly observed as sufficient to cause hereditary progressive cerebellar neurodegeneration, with deletion of one ITPR1 gene copy via haploinsufficiency triggering ataxia inheritance in autosomal dominant manner [218, 219]. Thus, our observation of IP3R abundance reduction below 50% in ATM-KD neuroblastoma cells (Figure 5b) emerges from the transcriptome profile validation work as arguably the most important molecular event, which might explain the preferential affection of cerebellar neurons [57]. In this context it is important to note that parallel loss of IP3R together with two more ataxia-responsible proteins was previously demonstrated in cerebellar tissue of A-T patients [66], namely the calcium homeostasis factor INPP5A (also known as Type I Inositol 1,4,5-Trisphosphate 5-Phosphatase) [220] and the CA8 (also known as Carbonic Anhydrase 8) [221, 222]. Furthermore, a protein complex of ITPR1 as endoplasmic reticulum Ca2+ homeostasis regulator with the mitochondrial HSP70-family member / chaperone GRP75 (=HSPA9) and the mitochondrial voltage-gated Ca2+ homeostasis channel VDAC1 was previously shown to mediate ATM dysfunction in bronchial cells after nutrient stress [30]. A very similar expression alteration in the ATM-null mouse cerebellar transcriptome may therefore be relevant, where downregulation of the ataxia gene Itpr1 occurred in parallel with downregulation of the HSP70-family member / chaperone Hspa12a and several voltage-gated Ca2+ homeostasis channels in the plasma membrane (Cacna1a, Cacna1c, Cacna1d, Cacna1g). Cytosolic HSPA12A protein has a very specific role, modulating its interactor SORL1 with downstream GFRA1/2 [223, 224], all of which showed downregulated mRNA levels in our ATM-null mouse cerebellar transcriptome profiling study, suggesting that the sorting of trophic signaling receptors is abnormally regulated. Also the receptor tyrosine kinase ERBB2 is regulated both by SORL1 and by USP2 [225, 226], and this may underlie the reduced cerebellar levels of Erbb2ip as a factor responsible for the surface localization of glutamate receptors [227]. In analogy to the impact of nutrient deficits as stressors via ATM onto endoplasmic reticulum and mitochondria homeostasis as previously published [30], the transcriptional dysregulation of ITPR1, HSPA12A (instead of HSPA9/GRP75) and its interactors SORL1 and ERBB2 in ATM-null cerebellum may therefore constitute the primary pathogenesis pathway and explain why neurotransmitter receptors / transporters / neuropeptide modulators are not in the right position in polarized processes, trophic signaling deficits ensue, and tissue shrinkage ensues over time. Given that SORL1, GFRA1/2, ERBB2, are poorly or not expressed in SH-SY5Y neuroblastoma cells according to the Human Protein Atlas, we made no attempt to model this trophic pathogenesis cascade in vitro.
The reduction of IP3R would also mediate a postsynaptic excitability deficit, and contribute to the diminished transcriptional response of immediate-early transcripts such as PER1 and NR4A1.
5. Conclusions
Overall, our genome-wide RNA profile provided useful knowledge to identify factors that might underlie the growth deficit (somatostatin and neuropeptide-Y) and vasodilatation phenotypes (tachykinins and Ecel1) of A-T, and to define the mechanistic overlap of A-T with the Itpr1–triggered monogenic variants of cerebellar ataxia. The data in this project suggested that the presence of cytosolic ATM in postmitotic cerebellar neurons serves an important modulator of the transcriptional regulation of excitability factors in response to ageing, and to osmotic stress more than nutrient or oxidative stress. Validations in neuroblastoma culture could largely reproduce crucial insights and the prominent alterations found in the cerebellar transcriptome: Strong reduction of Atm levels was reflected by similar strong decreases of its interactor Usp2, the mainly Purkinje-neuron-expressed Ca2+-excitability modulator Itpr1 mRNAs, and immediate-early signaling factors such as Per1 and Nr4a1.
References
Supplementary Materials
The following supporting information can be downloaded at: www.mdpi.com/xxx/s1, Figure S1: RT-qPCR validation of cerebellar transcript dysregulations in 1.5-3-month-old ATM-null mice shows early onset of immediate-early mRNA reductions, suggesting insufficient excitability; Figure S2: Modeling stable ATM-deficiency in vitro via knockdown in SH-SY5Y neuroblastoma cells; Figure S3: Subcellular localization of ATM to SH-SY5Y cytoplasm is unchanged after CQ and BLEO stress; Figure S4: RT-qPCR analysis of the modelling of cerebellar dysregulations in SH-SY5Y cells, testing different stressors, as well as ATM deficiency versus kinase inhibition; Table S1: The global transcriptome profile of the ATM-null cerebellum.
Author Contributions
Conceptualization, M.R., R.S., Z.I. and G.A.; methodology, M.R., J.C.-P., G.K., W.N., R.-P.D., C.D., K.A. and J.K.; software, W.N., C.D. and J.K.; validation, M.R., J.C.-P., G.K., W.N., K.A. M.-P.S., Z.I. and G.A.; formal analysis, M.-P.S., S.Z., R.S., Z.I. and G.A.; investigation, Z.I. and G.A.; resources, R.S. and Z.I.; data curation, C.D., K.A. and M.-P.S.; writing—original draft M.R.; writing—review and editing, W.N., S.Z., R.S. and G.A.; visualization, M.R., J.C.-P., J.K. and G.A.; supervision, Z.I. and G.A.; project administration, G.A.; funding acquisition, S.Z., R.S., Z.I. and G.A. All authors have read and agreed to the published version of the manuscript.
Funding
This research was funded by the Deutsche Forschungsgemeinschaft, grant number AU96/19-1.
Institutional Review Board Statement
The study was conducted in accordance with the Declaration of Helsinki, and approved by the Institutional Review Board of the Regierungspräsidium Darmstadt (protocol code V54 – 19 c20/15 – FK/2000 and date of approval 03. Sept. 2020).
Informed Consent Statement
Not applicable.
Data Availability Statement
The complete gene expression data set was deposited publically in the Gene Expression Omnibus under accession number GSE241955.
Acknowledgments
We thank Dr. Suzana Gispert-Sánchez and Dr. Benedikt Linder for advice. We are grateful to the staff of the animal facility ZFE at the Goethe university hospital for technical assistance.
Conflicts of Interest
The authors declare no conflict of interest. The funders had no role in the design of the study; in the collection, analyses, or interpretation of data; in the writing of the manuscript; or in the decision to publish the results.
Abbreviations
| ACTB | β-Actin |
| AFP | Alpha-Fetoprotein |
| AKT | AKT serine/threonine kinase |
| AMPA | α-amino-3-hydroxy-5-methyl-4-isoxazolepropionic acid |
| ANOVA | Analysis of variance |
| AOA2 | Ataxia with oculomotor apraxia type 2 |
| AP1B1 | Adaptor Related Protein Complex 1 Subunit Beta 1 |
| AP2B1 | Adaptor Related Protein Complex 2 Subunit Beta 1 |
| ARNT2 | Aryl Hydrocarbon Receptor Nuclear Translocator 2 |
| ASTN2 | Astrotactin 2 |
| A-T | Ataxia Telangiectasia |
| ATM | Ataxia Telangiectasia Mutated |
| ATMIN | ATM Interactor |
| ATP2B2 | ATPase Plasma Membrane Ca2+ Transporting 2 |
| ATP2B4 | ATPase Plasma Membrane Ca2+ Transporting 4 |
| ATR | Ataxia Telangiectasia And Rad3-Related Protein |
| ATXN2 | Ataxin 2 |
| BAIAP3 | BAI1 Associated Protein 3 |
| BCA | Bicinchoninic acid |
| beta-NAP | Neuronal Adaptin-like beta-subunit Protein |
| BLEO | Bleomycin |
| BMP1 | Bone Morphogenetic Protein 1 |
| BMP2 | Bone Morphogenetic Protein 2 |
| BMP7 | Bone Morphogenetic Protein 7 |
| BMPR1B | Bone Morphogenetic Protein Receptor Type 1B |
| BMT | Bone arrow transplantation |
| BSA | Bovine Serum Albumin |
| C4B | Complement Component 4B |
| CA8 | Carbonic Anhydrase 8 |
| CACNA1A | Calcium Voltage-Gated Channel Subunit Alpha1 A |
| CACNA1C | Calcium Voltage-Gated Channel Subunit Alpha1 C |
| CACNA1D | Calcium Voltage-Gated Channel Subunit Alpha1 D |
| CACNA1G | Calcium Voltage-Gated Channel Subunit Alpha1 G |
| CADPS2 | Calcium Dependent Secretion Activator 2CAMK2A |
| CAMK4 | Calcium/Calmodulin Dependent Protein Kinase IV |
| Car9 | murine Carbonic Anhydrase 9 |
| CBLN2 | Cerebellin 2 Precursor |
| CBLN4 | Cerebellin 4 Precursor |
| CCL27A | C-C Motif Chemokine Ligand 27 |
| CCNL2 | Cyclin L2 |
| CDH10 | Cadherin 10 |
| CDH19 | Cadherin 19 |
| CDH6 | Cadherin 6 |
| CDH9 | Cadherin 9 |
| cDNA | complementary DNA |
| CEB | cytosolic extract buffer |
| CHK2 | Checkpoint Kinase 2 |
| CHKA | Choline Kinase Alpha |
| CHRM2 | Cholinergic Receptor Muscarinic 2 |
| CHRM3 | Cholinergic Receptor Muscarinic 3 |
| CHRM5 | Cholinergic Receptor Muscarinic 5 |
| CHRNA4 | Cholinergic Receptor Nicotinic Alpha 4 Subunit |
| CHRNA6 | Cholinergic Receptor Nicotinic Alpha 6 Subunit |
| CHRNA7 | Cholinergic Receptor Nicotinic Alpha 7 Subunit |
| CHRNB3 | Cholinergic Receptor Nicotinic Beta 3 Subunit |
| CHRNB4 | Cholinergic Receptor Nicotinic Beta 4 Subunit |
| CNR1 | Cannabinoid Receptor 1 |
| CNTN4 | Contactin 4 |
| CNTN5 | Contactin 5 |
| CNTN6 | Contactin 6 |
| CNTNAP5A | Contactin Associated Protein Family Member 5 |
| CPNE6 | Copine 6 |
| CQ | Chloroquine |
| CREB5 | CAMP Responsive Element Binding Protein 5 |
| CREBL2 | CAMP Responsive Element Binding Protein Like 2 |
| CRTC2 | CREB Regulated Transcription Coactivator 2 |
| CRY1 | Cryptochrome Circadian Regulator 1 |
| CRY2 | Cryptochrome Circadian Regulator 2 |
| CSF1R | Colony Stimulating Factor 1 Receptor |
| CYP46A1 | Cytochrome P450 Family 46 Subfamily A Member 1 |
| DBH | Dopamine Beta-Hydroxylase |
| DBP | D-Box Binding PAR BZIP Transcription Factor |
| DDR | DNA Damage Response |
| DGKK | Diacylglycerol Kinase Kappa |
| DLG2 | Discs Large MAGUK Scaffold Protein 2 |
| DLK1 | Delta Like Non-Canonical Notch Ligand 1 |
| DMSO | Dimethyl sulfoxide |
| DNA | Deoxyribonucleic acid |
| DOCK10 | Dedicator Of Cytokinesis 10 |
| DRD2 | Dopamine Receptor D2 |
| DRD5 | Dopamine Receptor D5 |
| DSB | Double-Strand Breaks |
| DUSP1 | Dual Specificity Phosphatase 1 |
| EBF3 | EBF Transcription Factor 3 |
| ECEL1 | Endothelin Converting Enzyme Like 1 |
| EFNA2 | Ephrin A2 |
| EFNA3 | Ephrin A3 |
| EFNA5 | Ephrin A5 |
| EFNB3 | Ephrin B3 |
| EPHA3 | EPH Receptor A3 |
| EPHA4 | EPH Receptor A4 |
| EPHA5 | EPH Receptor A5 |
| ERBB2 | Erb-B2 Receptor Tyrosine Kinase 2 |
| ERBB3 | Erb-B2 Receptor Tyrosine Kinase 3 |
| ERBB4 | Erb-B2 Receptor Tyrosine Kinase 4 |
| FAT2 | FAT Atypical Cadherin 2 |
| FATC | FRAP, ATM, TRRAP C-terminal |
| FCS | Fetal Calf Serum |
| FDR | False Discovery Rate |
| FGF13 | Fibroblast Growth Factor 13 |
| FGF14 | Fibroblast Growth Factor 14 |
| FGF18 | Fibroblast Growth Factor 18 |
| FGF5 | Fibroblast Growth Factor 5 |
| FGFR1OP2 | FGFR1 Oncogene Partner 2 |
| FGFR3 | Fibroblast Growth Factor Receptor 3 |
| FOS | Fos Proto-Oncogene |
| FOSL2 | FOS Like 2 |
| FOXO1 | Forkhead Box O1 |
| FOXO3 | Forkhead Box O3 |
| FRDA | Friedreich's Ataxia |
| FSCN1 | Fascin Actin-Bundling Protein 1 |
| FXYD5 | FXYD Domain Containing Ion Transport Regulator 5 |
| FZD4 | Frizzled Class Receptor 4 |
| FZD8 | Frizzled Class Receptor 8 |
| GABA | Gamma-aminobutyric acid |
| GABARAPL1 | GABA Type A Receptor Associated Protein Like 1 |
| GABRA2 | Gamma-Aminobutyric Acid Type A Receptor Subunit Alpha2 |
| GABRA3 | Gamma-Aminobutyric Acid Type A Receptor Subunit Alpha3 |
| GABRA5 | Gamma-Aminobutyric Acid Type A Receptor Subunit Alpha5 |
| GABRA6 | Gamma-Aminobutyric Acid Type A Receptor Subunit Alpha6 |
| GABRB1 | Gamma-Aminobutyric Acid Type A Receptor Subunit Beta1 |
| GABRE | Gamma-Aminobutyric Acid Type A Receptor Subunit Epsilon |
| GABRG1 | Gamma-Aminobutyric Acid Type A Receptor Subunit Gamma1 |
| GABRG2 | Gamma-Aminobutyric Acid Type A Receptor Subunit Gamma2 |
| GABRG3 | Gamma-Aminobutyric Acid Type A Receptor Subunit Gamma3 |
| GABRQ | Gamma-Aminobutyric Acid Type A Receptor Subunit Theta |
| GAPDH | Glyceraldehyde-3-Phosphate Dehydrogenase |
| GBA2 | Glucosylceramidase Beta 2 |
| GFRA1 | GDNF Family Receptor Alpha 1 |
| GFRA2 | GDNF Family Receptor Alpha 2 |
| GH | growth hormone |
| GLRA1 | Glycine Receptor Alpha 1 |
| GLRA2 | Glycine Receptor Alpha 2 |
| GLRA3 | Glycine Receptor Alpha 3 |
| GLRA4 | Glycine Receptor Alpha 4 |
| GNAS | GNAS Complex Locus |
| GO | Gene Ontology |
| GPR165 | G Protein-Coupled Receptor 165 |
| GRID1 | Glutamate Ionotropic Receptor Delta Type Subunit 1 |
| GRID2 | Glutamate Ionotropic Receptor Delta Type Subunit 2 |
| GRID2IP | Grid2 Interacting Protein |
| GRIK2 | Glutamate Ionotropic Receptor Kainate Type Subunit 2 |
| GRIN2B | Glutamate Ionotropic Receptor NMDA Type Subunit 2B |
| GRIN2C | Glutamate Ionotropic Receptor NMDA Type Subunit 2C |
| GRIN3A | Glutamate Ionotropic Receptor NMDA Type Subunit 3A |
| GRIP1 | Glutamate Receptor Interacting Protein 1 |
| GRM3 | Glutamate Metabotropic Receptor 3 |
| GRM4 | Glutamate Metabotropic Receptor 4 |
| GRM5 | Glutamate Metabotropic Receptor 5 |
| GRM8 | Glutamate Metabotropic Receptor 8 |
| GRP75 / HSPA9 | Heat Shock Protein Family A (Hsp70) Member 9 |
| GSK3β | Glycogen Synthase Kinase 3 Beta |
| H2O2 | Hydrogen peroxide |
| HDMX | human ortholog of mouse MDMX (also known as MDM4) |
| HIF3A | Hypoxia Inducible Factor 3 Subunit Alpha |
| HOMER1 | Homer Scaffold Protein 1 |
| HSP60 | 60 KDa Heat Shock Protein, Mitochondrial |
| HSP70 | Heat Shock 70 KDa Protein 4 |
| HSPA12A | Heat Shock Protein Family A (Hsp70) Member 12A |
| IGF1 | Insulin Like Growth Factor 1 |
| IGF2 | Insulin Like Growth Factor 2 |
| IGF2R | Insulin Like Growth Factor 2 Receptor |
| IGFLR1 | IGF Like Family Receptor 1 |
| IgG | Immunoglobulin G |
| IL16 | Interleukin 16 |
| IL18 | Interleukin 18 |
| IL20RB | Interleukin 20 Receptor Subunit Beta |
| IL33 | Interleukin 33 |
| IL34 | Interleukin 34 |
| INPP5A | Type I Inositol 1,4,5-Trisphosphate 5-Phosphatase |
| ITPR1 / IP3R1 | Inositol 1,4,5-Trisphosphate Receptor Type 1 |
| JUN | Jun Proto-Oncogene |
| KAT5 | Lysine Acetyltransferase 5 |
| KCNQ5 | Potassium Voltage-Gated Channel Subfamily Q Member 5 |
| KD | knockdown |
| KDR | Kinase Insert Domain Receptor |
| KIT | KIT Proto-Oncogene |
| KO | knockout |
| KU | KU-55933 |
| LCDV | Large Dense Core Vesicles |
| LIFR | LIF Receptor Subunit Alpha |
| LY | LY-294002 |
| MAPK9 / JNK2 | Mitogen-Activated Protein Kinase 9 |
| MDM4 | MDM4 Regulator Of P53 |
| MICU3 | Mitochondrial Calcium Uptake Family Member 3 |
| miR | microRNA |
| MLB | mitochondrial lysis buffer |
| MME | Membrane Metalloendopeptidase |
| MPP4 | MAGUK P55 Scaffold Protein 4 |
| MRE11 | Double-Strand Break Repair Protein MRE11 |
| MRN | MRE11-RAD50-NBS1 |
| mRNA | messenger RNA |
| NaARS | Sodium Arsenite |
| NBS1 | Nibrin |
| NECAB1 | N-Terminal EF-Hand Calcium Binding Protein 1 |
| NEFL | Neurofilament Light Chain |
| NEFM | Neurofilament Medium Chain |
| ng | nanogram |
| NGEF | Neuronal Guanine Nucleotide Exchange Factor |
| NGFRAP1 | Nerve Growth Factor Receptor Associated Protein 1 |
| NPAS4 | Neuronal PAS Domain Protein 4 |
| NPY | Neuropeptide Y |
| NPY1R | Neuropeptide Y Receptor Y1 |
| NPY4R | Neuropeptide Y Receptor Y4 |
| NR4A1 | Nuclear Receptor Subfamily 4 Group A Member 1 |
| NR4A2 | Nuclear Receptor Subfamily 4 Group A Member 2 |
| NR4A3 | Nuclear Receptor Subfamily 4 Group A Member 3 |
| NRG1 | Neuregulin 1 |
| NRG3 | Neuregulin 3 |
| NRIP2 | Nuclear Receptor Interacting Protein 2 |
| NRIP3 | Nuclear Receptor Interacting Protein 3 |
| NSG2 | Neuronal Vesicle Trafficking Associated 2 |
| NT CTRL | Non-targeting control shRNA |
| NTF3 | Neurotrophin 3 |
| NTRK3 | Neurotrophic Receptor Tyrosine Kinase 3 |
| NTS | Neurotensin |
| NTSR1 | Neurotensin Receptor 1 |
| NTSR2 | Neurotensin Receptor 2 |
| OMD | Osteomodulin |
| OPRK1 | Opioid Receptor Kappa 1 |
| OPRL1 | Opioid Related Nociceptin Receptor 1 |
| OPRM1 | Opioid Receptor Mu 1 |
| PBS | Phosphate Buffered Saline |
| PCDH10 | Protocadherin 10 |
| PCDH11X | Protocadherin 11 X-Linked |
| PCDH17 | Protocadherin 17 |
| PCDH18 | Protocadherin 18 |
| PCDH19 | Protocadherin 19 |
| PCDH7 | Protocadherin 7 |
| PCSK1 | Proprotein Convertase Subtilisin/Kexin Type 1 |
| PCSK1N | Proprotein Convertase Subtilisin/Kexin Type 1 Inhibitor |
| PCSK5 | Proprotein Convertase Subtilisin/Kexin Type 5 |
| PDGFC | Platelet Derived Growth Factor C |
| PDGFRA | Platelet Derived Growth Factor Receptor Alpha |
| PDGFRL | Platelet Derived Growth Factor Receptor Like |
| PER1 | Period Circadian Regulator 1 |
| PER2 | Period Circadian Regulator 2 |
| PER3 | Period Circadian Regulator 3 |
| PI3K | Phosphoinositide 3-kinase |
| PIKK | Phosphoinositide 3-kinase-related kinases |
| PMSF | Phenylmethylsulfonyl fluoride |
| PP2A | Protein phosphatase 2A |
| PPP2R2B | Protein Phosphatase 2 Regulatory Subunit Bbeta |
| PTPRD | Protein Tyrosine Phosphatase Receptor Type D |
| QPCT | Glutaminyl-Peptide Cyclotransferase |
| RAD50 | RAD50 Double Strand Break Repair Protein |
| RASGRF2 | Ras Protein Specific Guanine Nucleotide Releasing Factor 2 |
| RELN | Reelin |
| RESP18 | Regulated Endocrine Specific Protein 18 |
| RGS4 | Regulator Of G Protein Signaling 4 |
| RIN | RNA integrity number |
| RNA | Ribonucleic acid |
| RNF122 | Ring Finger Protein 122 |
| RORA | RAR Related Orphan Receptor A |
| RORB | RAR Related Orphan Receptor B |
| RRAGD | Ras Related GTP Binding D |
| RTN4 | Reticulon 4 |
| RT-qPCR | Reverse transcription-quantitative polymerase chain reaction |
| SAM68 | Src-Associated In Mitosis 68 KDa Protein |
| SCN3B | Sodium Voltage-Gated Channel Beta Subunit 3 |
| SDS-PAGE | Sodium dodecyl-sulfate polyacrylamide gel electrophoresis |
| SEM | Standard error of the mean |
| SEPT9 | Septin 9 |
| SERINC2 | Serine Incorporator 2 |
| SFRP1 | Secreted Frizzled Related Protein 1 |
| SFRP5 | Secreted Frizzled Related Protein 5 |
| SGK1 | Serum/Glucocorticoid Regulated Kinase 1 |
| shATM | shRNA targeting ATM |
| shRNA | Short hairpin RNA |
| SIDT1 | SID1 Transmembrane Family Member 1 |
| SIK1 | Salt Inducible Kinase 1 |
| SLC17A6 / VGLUT 2 | Solute Carrier Family 17 Member 6 |
| SLC17A7 / VGLUT1 | Solute Carrier Family 17 Member 7 |
| SLC18A2 | Solute Carrier Family 18 Member A2 |
| SLC1A1 | Solute Carrier Family 1 Member 1 |
| SLC1A2 | Solute Carrier Family 1 Member 2 |
| SLC1A3 | Solute Carrier Family 1 Member 3 |
| SLC1A4 | Solute Carrier Family 1 Member 4 |
| SLC1A6 | Solute Carrier Family 1 Member 6 |
| SLC25A22 | Solute Carrier Family 25 Member 22 |
| SLC2A12 | Solute Carrier Family 2 Member 12 |
| SLC32A1 | Solute Carrier Family 32 Member 1 |
| SLC5A7 | Solute Carrier Family 5 Member 7 |
| SLC6A11 | Solute Carrier Family 6 Member 11 |
| SLC7A3 | Solute Carrier Family 7 Member 3 |
| SLCO1A4 | Solute Carrier Organic Anion Transporter Family Member 1A2 |
| SLITRK3 | SLIT And NTRK Like Family Member 3 |
| SLITRK5 | SLIT And NTRK Like Family Member 5 |
| SLITRK6 | SLIT And NTRK Like Family Member 6 |
| SMG1 | SMG1 Nonsense Mediated MRNA Decay Associated PI3K Related Kinase |
| SOCS7 | Suppressor Of Cytokine Signaling 7 |
| SORCS1 | Sortilin Related VPS10 Domain Containing Receptor 1 |
| SORCS2 | Sortilin Related VPS10 Domain Containing Receptor 2 |
| SORL1 | Sortilin Related Receptor 1 |
| SOX10 | SRY-Box Transcription Factor 10 |
| ss-cDNA | single-stranded cDNA |
| SST | Somatostatin |
| SSTR1 | Somatostatin Receptor 1 |
| SSTR2 | Somatostatin Receptor 2 |
| SVBP | Small Vasohibin Binding Protein |
| SYNE1 | Spectrin Repeat Containing Nuclear Envelope Protein 1 |
| TAC | Transcriptome Analysis Console |
| TAC1 | Tachykinin Precursor 1 |
| TACR1 | Tachykinin Receptor 1 |
| TACR3 | Tachykinin Receptor 3 |
| TBP | TATA-Box Binding Protein |
| TBS | Tris Buffered Saline |
| TBS-T | TBS with 0.1% Tween-20 detergent |
| TCF4 | Transcription Factor 4 |
| TGFBR1 | Transforming Growth Factor Beta Receptor 1 |
| TGFBR2 | Transforming Growth Factor Beta Receptor 2 |
| TNFRSF13C | TNF Receptor Superfamily Member 13C |
| TNFRSF21 | TNF Receptor Superfamily Member 21 |
| TOP1cc | Topoisomerase-1 cleavage complexes |
| TP53 | Tumor Protein P53 |
| tRNA | transfer RNA |
| TUBA | α-tubulin |
| USP2 | Ubiquitin Specific Peptidase 2 |
| UVB | Ultraviolet B |
| V(D)J | Variability – Diversity – Joining Rearrangement |
| VAMP1 | Vesicle Associated Membrane Protein 1 |
| VCL | Vinculin |
| VDAC1 | Voltage Dependent Anion Channel 1 |
| WNK1 | WNK Lysine Deficient Protein Kinase 1 |
| WNT3 | Wnt Family Member 3 |
| WNT7A | Wnt Family Member 7A |
| WT | Wildtype |
| ZFHX3 | Zinc Finger Homeobox 3 |
| αNAC | Nascent Polypeptide Associated Complex Subunit Alpha |
| γTX | γ-taxilin |
| μg | microgram |
| µm | mircometer |
References
- Nissenkorn, A. and B. Ben-Zeev, Ataxia telangiectasia. Handb Clin Neurol, 2015. 132: p. 199-214.
- Gatti, R. and S. Perlman, Ataxia-Telangiectasia, in GeneReviews((R)), M.P. Adam, et al., Editors. 1993: Seattle (WA).
- Taylor, A.M.R.; Rothblum-Oviatt, C.; Ellis, N.A.; Hickson, I.D.; Meyer, S.; Crawford, T.O.; Smogorzewska, A.; Pietrucha, B.; Weemaes, C.; Stewart, G.S. Chromosome instability syndromes. Nat. Rev. Dis. Prim. 2019, 5, 1–20. [Google Scholar] [CrossRef] [PubMed]
- Schieving, J.; de Vries, M.; van Vugt, J.; Weemaes, C.; van Deuren, M.; Nicolai, J.; Wevers, R.; Willemsen, M. Alpha-fetoprotein, a fascinating protein and biomarker in neurology. Eur. J. Paediatr. Neurol. 2014, 18, 243–248. [Google Scholar] [CrossRef]
- Woelke, S.; Schrewe, R.; Donath, H.; Theis, M.; Kieslich, M.; Duecker, R.; Auburger, G.; Schubert, R.; Zielen, S. Altered Cerebrospinal Fluid (CSF) in Children with Ataxia Telangiectasia. Cerebellum 2020, 20, 31–40. [Google Scholar] [CrossRef]
- Donath, H.; Woelke, S.; Schubert, R.; Kieslich, M.; Theis, M.; Auburger, G.; Duecker, R.P.; Zielen, S. Neurofilament Light Chain Is a Biomarker of Neurodegeneration in Ataxia Telangiectasia. Cerebellum 2021, 21, 39–47. [Google Scholar] [CrossRef]
- Veenhuis, S.; Gupta, A.; de Gusmão, C.; Thornton, J.; Margus, B.; Rothblum-Oviatt, C.; Otto, M.; Halbgebauer, S.; van Os, N.; van de Warrenburg, B.; et al. Neurofilament light chain: A novel blood biomarker in patients with ataxia telangiectasia. Eur. J. Paediatr. Neurol. 2021, 32, 93–97. [Google Scholar] [CrossRef]
- Schroeder, S.A.; Zielen, S. Infections of the respiratory system in patients with ataxia-telangiectasia. Pediatr. Pulmonol. 2013, 49, 389–399. [Google Scholar] [CrossRef]
- Zielen, S.; Duecker, R.P.; Woelke, S.; Donath, H.; Bakhtiar, S.; Buecker, A.; Kreyenberg, H.; Huenecke, S.; Bader, P.; Mahlaoui, N.; et al. Simple Measurement of IgA Predicts Immunity and Mortality in Ataxia-Telangiectasia. J. Clin. Immunol. 2021, 41, 1878–1892. [Google Scholar] [CrossRef]
- Xu, Y.; Ashley, T.; E Brainerd, E.; Bronson, R.T.; Meyn, M.S.; Baltimore, D. Targeted disruption of ATM leads to growth retardation, chromosomal fragmentation during meiosis, immune defects, and thymic lymphoma. Minerva Anestesiol. 1996, 10, 2411–2422. [Google Scholar] [CrossRef]
- Plug, A.W.; Peters, A.H.; Xu, Y.; Keegan, K.S.; Hoekstra, M.F.; Baltimore, D.; de Boer, P.; Ashley, T. ATM and RPA in meiotic chromosome synapsis and recombination. Nat. Genet. 1997, 17, 457–461. [Google Scholar] [CrossRef] [PubMed]
- Natale, V.A.I., et al., Growth in ataxia telangiectasia. Orphanet J Rare Dis, 2021. 16(1): p. 123.
- Voss, S.; Pietzner, J.; Hoche, F.; Taylor, A.M.R.; Last, J.I.; Schubert, R.; Zielen, S. Growth retardation and growth hormone deficiency in patients with Ataxia telangiectasia. Growth Factors 2014, 32, 123–129. [Google Scholar] [CrossRef]
- Schubert, R.; Reichenbach, J.; Zielen, S. Growth factor deficiency in patients with ataxia telangiectasia. Clin. Exp. Immunol. 2005, 140, 517–519. [Google Scholar] [CrossRef]
- Khanna, K.K. Cancer Risk and the ATM Gene: a Continuing Debate. JNCI J. Natl. Cancer Inst. 2000, 92, 795–802. [Google Scholar] [CrossRef] [PubMed]
- Bakhtiar, S.; Salzmann-Manrique, E.; Donath, H.; Woelke, S.; Duecker, R.P.; Fritzemeyer, S.; Schubert, R.; Huenecke, S.; Kieslich, M.; Klingebiel, T.; et al. The incidence and type of cancer in patients with ataxia-telangiectasia via a retrospective single-centre study. Br. J. Haematol. 2021, 194, 879–887. [Google Scholar] [CrossRef]
- Lee, J.-H.; Paull, T.T. Cellular functions of the protein kinase ATM and their relevance to human disease. Nat. Rev. Mol. Cell Biol. 2021, 22, 796–814. [Google Scholar] [CrossRef]
- Rotman, G.; Shiloh, Y. ATM: from gene to function. Hum. Mol. Genet. 1998, 7, 1555–1563. [Google Scholar] [CrossRef]
- Weitering, T.J.; Takada, S.; Weemaes, C.M.; van Schouwenburg, P.A.; van der Burg, M. ATM: Translating the DNA Damage Response to Adaptive Immunity. Trends Immunol. 2021, 42, 350–365. [Google Scholar] [CrossRef]
- Choy, K.R.; Watters, D.J. Neurodegeneration in ataxia-telangiectasia: Multiple roles of ATM kinase in cellular homeostasis. Dev. Dyn. 2017, 247, 33–46. [Google Scholar] [CrossRef]
- Guleria, A.; Chandna, S. ATM kinase: Much more than a DNA damage responsive protein. DNA Repair 2016, 39, 1–20. [Google Scholar] [CrossRef] [PubMed]
- Hoche, F., et al., Neurodegeneration in ataxia telangiectasia: what is new? What is evident? Neuropediatrics, 2012. 43(3): p. 119-29.
- Shiloh, Y. The cerebellar degeneration in ataxia-telangiectasia: A case for genome instability. DNA Repair 2020, 95, 102950. [Google Scholar] [CrossRef] [PubMed]
- Kuljis, R.; Chen, G.; Lee, E.Y.-H.; Aguila, M.; Xu, Y. ATM immunolocalization in mouse neuronal endosomes: implications for ataxia-telangiectasia. Brain Res. 1999, 842, 351–358. [Google Scholar] [CrossRef] [PubMed]
- Gueven, N.; Fukao, T.; Luff, J.; Paterson, C.; Kay, G.; Kondo, N.; Lavin, M.F. Regulation of theAtm promoter in vivo. Genes, Chromosom. Cancer 2005, 45, 61–71. [Google Scholar] [CrossRef] [PubMed]
- Oka, A.; Takashima, S. Expression of the ataxia-telangiectasia gene (ATM) product in human cerebellar neurons during development. Neurosci. Lett. 1998, 252, 195–198. [Google Scholar] [CrossRef]
- Li, J.; Han, Y.R.; Plummer, M.R.; Herrup, K. Cytoplasmic ATM in Neurons Modulates Synaptic Function. Curr. Biol. 2009, 19, 2091–2096. [Google Scholar] [CrossRef]
- Sommer, L.A.M.; Schaad, M.; Dames, S.A. NMR- and Circular Dichroism-monitored Lipid Binding Studies Suggest a General Role for the FATC Domain as Membrane Anchor of Phosphatidylinositol 3-Kinase-related Kinases (PIKK). J. Biol. Chem. 2013, 288, 20046–20063. [Google Scholar] [CrossRef]
- Rahim, M.S.A.; Cherniavskyi, Y.K.; Tieleman, D.P.; Dames, S.A. NMR– and MD simulation–based structural characterization of the membrane-associating FATC domain of ataxia telangiectasia mutated. J. Biol. Chem. 2019, 294, 7098–7112. [Google Scholar] [CrossRef]
- Yeo, A.J.; Chong, K.L.; Gatei, M.; Zou, D.; Stewart, R.; Withey, S.; Wolvetang, E.; Parton, R.G.; Brown, A.D.; Kastan, M.B.; et al. Impaired endoplasmic reticulum-mitochondrial signaling in ataxia-telangiectasia. iScience 2020, 24, 101972. [Google Scholar] [CrossRef]
- Watters, D.; Kedar, P.; Spring, K.; Bjorkman, J.; Chen, P.; Gatei, M.; Birrell, G.; Garrone, B.; Srinivasa, P.; Crane, D.I.; et al. Localization of a Portion of Extranuclear ATM to Peroxisomes. J. Biol. Chem. 1999, 274, 34277–34282. [Google Scholar] [CrossRef] [PubMed]
- Barlow, C.; Ribaut-Barassin, C.; Zwingman, T.A.; Pope, A.J.; Brown, K.D.; Owens, J.W.; Larson, D.; Harrington, E.A.; Haeberle, A.-M.; Mariani, J.; et al. ATM is a cytoplasmic protein in mouse brain required to prevent lysosomal accumulation. Proc. Natl. Acad. Sci. 2000, 97, 871–876. [Google Scholar] [CrossRef] [PubMed]
- Lim, D.S., et al., ATM binds to beta-adaptin in cytoplasmic vesicles. Proc Natl Acad Sci U S A, 1998. 95(17): p. 10146-51.
- Ambrose, M.; Gatti, R.A. Pathogenesis of ataxia-telangiectasia: the next generation of ATM functions. Blood 2013, 121, 4036–4045. [Google Scholar] [CrossRef]
- Xie, X.; Zhang, Y.; Wang, Z.; Wang, S.; Jiang, X.; Cui, H.; Zhou, T.; He, Z.; Feng, H.; Guo, Q.; et al. ATM at the crossroads of reactive oxygen species and autophagy. Int. J. Biol. Sci. 2021, 17, 3080–3090. [Google Scholar] [CrossRef]
- Subramanian, G.N.; Yeo, A.J.; Gatei, M.H.; Coman, D.J.; Lavin, M.F. Metabolic Stress and Mitochondrial Dysfunction in Ataxia-Telangiectasia. Antioxidants 2022, 11, 653. [Google Scholar] [CrossRef]
- Herrup, K. ATM and the epigenetics of the neuronal genome. Mech. Ageing Dev. 2013, 134, 434–439. [Google Scholar] [CrossRef]
- Vail, G.; Cheng, A.; Han, Y.R.; Zhao, T.; Du, S.; Loy, M.M.T.; Herrup, K.; Plummer, M.R. ATM protein is located on presynaptic vesicles and its deficit leads to failures in synaptic plasticity. J. Neurophysiol. 2016, 116, 201–209. [Google Scholar] [CrossRef]
- Cheng, A.; Zhao, T.; Tse, K.-H.; Chow, H.-M.; Cui, Y.; Jiang, L.; Du, S.; Loy, M.M.T.; Herrup, K. ATM and ATR play complementary roles in the behavior of excitatory and inhibitory vesicle populations. Proc. Natl. Acad. Sci. 2017, 115, 201716892–E301. [Google Scholar] [CrossRef]
- Zucker, R.; Nr, W.; J, K.; Ev, H.; T, L.; H, V.; Jg, M.; Jd, E.; G, L. Faculty Opinions recommendation of Presynaptic regulation of quantal size by the vesicular glutamate transporter VGLUT1. . 2005, 25. [Google Scholar] [CrossRef]
- Kuljis, R.O., et al., Degeneration of neurons, synapses, and neuropil and glial activation in a murine Atm knockout model of ataxia-telangiectasia. Proc Natl Acad Sci U S A, 1997. 94(23): p. 12688-93.
- Chiesa, N.; Barlow, C.; Wynshaw-Boris, A.; Strata, P.; Tempia, F. Atm-deficient mice Purkinje cells show age-dependent defects in calcium spike bursts and calcium currents. Neuroscience 2000, 96, 575–583. [Google Scholar] [CrossRef] [PubMed]
- Yamamoto, K.; Wang, Y.; Jiang, W.; Liu, X.; Dubois, R.L.; Lin, C.-S.; Ludwig, T.; Bakkenist, C.J.; Zha, S. Kinase-dead ATM protein causes genomic instability and early embryonic lethality in mice. J. Cell Biol. 2012, 198, 305–313. [Google Scholar] [CrossRef] [PubMed]
- Daniel, J.A.; Pellegrini, M.; Lee, B.-S.; Guo, Z.; Filsuf, D.; Belkina, N.V.; You, Z.; Paull, T.T.; Sleckman, B.P.; Feigenbaum, L.; et al. Loss of ATM kinase activity leads to embryonic lethality in mice. J. Cell Biol. 2012, 198, 295–304. [Google Scholar] [CrossRef] [PubMed]
- Barlow, C.; Hirotsune, S.; Paylor, R.; Liyanage, M.; Eckhaus, M.; Collins, F.; Shiloh, Y.; Crawley, J.N.; Ried, T.; Tagle, D.; et al. Atm-Deficient Mice: A Paradigm of Ataxia Telangiectasia. Cell 1996, 86, 159–171. [Google Scholar] [CrossRef] [PubMed]
- Pietzner, J.; Baer, P.C.; Duecker, R.P.; Merscher, M.B.; Satzger-Prodinger, C.; Bechmann, I.; Wietelmann, A.; Del Turco, D.; Doering, C.; Kuci, S.; et al. Bone marrow transplantation improves the outcome of Atm-deficient mice through the migration of ATM-competent cells. Hum. Mol. Genet. 2012, 22, 493–507. [Google Scholar] [CrossRef]
- Bakkenist, C.J.; Kastan, M.B. DNA damage activates ATM through intermolecular autophosphorylation and dimer dissociation. Nature 2003, 421, 499–506. [Google Scholar] [CrossRef]
- Berkovich, E., R.J. Monnat, Jr., and M.B. Kastan, Roles of ATM and NBS1 in chromatin structure modulation and DNA double-strand break repair. Nat Cell Biol, 2007. 9(6): p. 683-90.
- Sun, Y.; Xu, Y.; Roy, K.; Price, B.D. DNA Damage-Induced Acetylation of Lysine 3016 of ATM Activates ATM Kinase Activity. Mol. Cell. Biol. 2007, 27, 8502–8509. [Google Scholar] [CrossRef]
- Sordet, O.; E Redon, C.; Guirouilh-Barbat, J.; Smith, S.; Solier, S.; Douarre, C.; Conti, C.; Nakamura, A.J.; Das, B.B.; Nicolas, E.; et al. Ataxia telangiectasia mutated activation by transcription- and topoisomerase I-induced DNA double-strand breaks. EMBO Rep. 2009, 10, 887–893. [Google Scholar] [CrossRef]
- Mabb, A.M.; Simon, J.M.; King, I.F.; Lee, H.-M.; An, L.-K.; Philpot, B.D.; Zylka, M.J. Topoisomerase 1 Regulates Gene Expression in Neurons through Cleavage Complex-Dependent and -Independent Mechanisms. PLOS ONE 2016, 11, e0156439–e0156439. [Google Scholar] [CrossRef] [PubMed]
- Yeo, A.J.; Becherel, O.J.; Luff, J.E.; Cullen, J.K.; Wongsurawat, T.; Jenjaroenpoon, P.; Kuznetsov, V.A.; McKinnon, P.J.; Lavin, M.F. R-Loops in Proliferating Cells but Not in the Brain: Implications for AOA2 and Other Autosomal Recessive Ataxias. PLOS ONE 2014, 9, e90219. [Google Scholar] [CrossRef] [PubMed]
- Tresini, M.; Warmerdam, D.O.; Kolovos, P.; Snijder, L.; Vrouwe, M.G.; Demmers, J.A.A.; van Ijcken, W.F.J.; Grosveld, F.G.; Medema, R.H.; Hoeijmakers, J.H.J.; et al. The core spliceosome as target and effector of non-canonical ATM signalling. Nature 2015, 523, 53–58. [Google Scholar] [CrossRef] [PubMed]
- Stagni, V.; Orecchia, S.; Mignini, L.; Beji, S.; Antonioni, A.; Caggiano, C.; Barilà, D.; Bielli, P.; Sette, C. DNA Damage Regulates the Functions of the RNA Binding Protein Sam68 through ATM-Dependent Phosphorylation. Cancers 2022, 14, 3847. [Google Scholar] [CrossRef]
- Ostrowski, L.A.; Hall, A.C.; Mekhail, K. Ataxin-2: From RNA Control to Human Health and Disease. Genes 2017, 8, 157. [Google Scholar] [CrossRef] [PubMed]
- Arsović, A.; Halbach, M.V.; Canet-Pons, J.; Esen-Sehir, D.; Döring, C.; Freudenberg, F.; Czechowska, N.; Seidel, K.; Baader, S.L.; Gispert, S.; et al. Mouse Ataxin-2 Expansion Downregulates CamKII and Other Calcium Signaling Factors, Impairing Granule—Purkinje Neuron Synaptic Strength. Int. J. Mol. Sci. 2020, 21, 6673. [Google Scholar] [CrossRef] [PubMed]
- Tada, M.; Nishizawa, M.; Onodera, O. Roles of inositol 1,4,5-trisphosphate receptors in spinocerebellar ataxias. Neurochem. Int. 2016, 94, 1–8. [Google Scholar] [CrossRef]
- Kanu, N. and A. Behrens, ATMINistrating ATM signalling: regulation of ATM by ATMIN. Cell Cycle, 2008. 7(22): p. 3483-6.
- Paull, T.T. Mechanisms of ATM Activation. Annu. Rev. Biochem. 2015, 84, 711–738. [Google Scholar] [CrossRef]
- Kanu, N.; Penicud, K.; Hristova, M.; Wong, B.; Irvine, E.; Plattner, F.; Raivich, G.; Behrens, A. The ATM Cofactor ATMIN Protects against Oxidative Stress and Accumulation of DNA Damage in the Aging Brain. J. Biol. Chem. 2010, 285, 38534–38542. [Google Scholar] [CrossRef]
- Barlow, C.; Dennery, P.A.; Shigenaga, M.K.; Smith, M.A.; Morrow, J.D.; Roberts, L.J.; Wynshaw-Boris, A.; Levine, R.L. Loss of the ataxia–telangiectasia gene product causes oxidative damage in target organs. Proc. Natl. Acad. Sci. 1999, 96, 9915–9919. [Google Scholar] [CrossRef] [PubMed]
- Bagley, J.; Cortes, M.L.; Breakefield, X.O.; Iacomini, J. Bone marrow transplantation restores immune system function and prevents lymphoma in Atm-deficient mice. Blood 2004, 104, 572–578. [Google Scholar] [CrossRef] [PubMed]
- Schmittgen, T.D. and K.J. Livak, Analyzing real-time PCR data by the comparative C(T) method. Nat Protoc, 2008. 3(6): p. 1101-8.
- Adrain, C.; Creagh, E.M.; Martin, S.J. Apoptosis-associated release of Smac/DIABLO from mitochondria requires active caspases and is blocked by Bcl-2. EMBO J. 2001, 20, 6627–6636. [Google Scholar] [CrossRef]
- Baghirova, S.; Hughes, B.G.; Hendzel, M.J.; Schulz, R. Sequential fractionation and isolation of subcellular proteins from tissue or cultured cells. MethodsX 2015, 2, 440–445. [Google Scholar] [CrossRef]
- Lee, J.-H.; Ryu, S.W.; Ender, N.A.; Paull, T.T. Poly-ADP-ribosylation drives loss of protein homeostasis in ATM and Mre11 deficiency. Mol. Cell 2021, 81, 1515–1533. [Google Scholar] [CrossRef]
- Canet-Pons, J.; Schubert, R.; Duecker, R.P.; Schrewe, R.; Wölke, S.; Kieslich, M.; Schnölzer, M.; Chiocchetti, A.; Auburger, G.; Zielen, S.; et al. Ataxia telangiectasia alters the ApoB and reelin pathway. neurogenetics 2018, 19, 237–255. [Google Scholar] [CrossRef]
- Capauto, D.; Colantoni, A.; Lu, L.; Santini, T.; Peruzzi, G.; Biscarini, S.; Morlando, M.; Shneider, N.A.; Caffarelli, E.; Laneve, P.; et al. A Regulatory Circuitry Between Gria2, miR-409, and miR-495 Is Affected by ALS FUS Mutation in ESC-Derived Motor Neurons. Mol. Neurobiol. 2018, 55, 7635–7651. [Google Scholar] [CrossRef]
- Li, W.; Yang, Y.; Hou, X.; Zhuang, H.; Wu, Z.; Li, Z.; Guo, R.; Chen, H.; Lin, C.; Zhong, W.; et al. MicroRNA-495 regulates starvation-induced autophagy by targeting ATG3. FEBS Lett. 2016, 590, 726–738. [Google Scholar] [CrossRef]
- Chen, X.; Li, C.; Zeng, R.; Qiu, L.; Huang, J.; Wang, N.; Ren, X.; Lin, X. Inhibition of miR-495-3p ameliorated sevoflurane induced damage through BDNF/ERK/CREB signaling pathways in HT22 cells. Transpl. Immunol. 2022, 75, 101708. [Google Scholar] [CrossRef]
- Inouye, M.; Colameo, D.; Ammann, I.; Winterer, J.; Schratt, G. miR-329– and miR-495–mediated Prr7 down-regulation is required for homeostatic synaptic depression in rat hippocampal neurons. Life Sci. Alliance 2022, 5, e202201520. [Google Scholar] [CrossRef] [PubMed]
- Meng, Y., et al., lncRNA NEAT1/miR-495-3p regulates angiogenesis in burn sepsis through the TGF-beta1 and SMAD signaling pathways. Immun Inflamm Dis, 2023. 11(1): p. e758.
- Zhang, L.; Wu, H.; Zhang, Y.; Xiao, X.; Chu, F. Induction of lncRNA NORAD accounts for hypoxia-induced chemoresistance and vasculogenic mimicry in colorectal cancer by sponging the miR-495-3p/ hypoxia-inducible factor-1α (HIF-1α). Bioengineered 2021, 13, 950–962. [Google Scholar] [CrossRef] [PubMed]
- Shi, Y.; Cao, J.; Gao, J.; Zheng, L.; Goodwin, A.; An, C.H.; Patel, A.; Lee, J.S.; Duncan, S.R.; Kaminski, N.; et al. Retinoic Acid–related Orphan Receptor-α Is Induced in the Setting of DNA Damage and Promotes Pulmonary Emphysema. Am. J. Respir. Crit. Care Med. 2012, 186, 412–419. [Google Scholar] [CrossRef] [PubMed]
- Kwak, Y.D.; Shaw, T.I.; Downing, S.M.; Tewari, A.; Jin, H.; Li, Y.; Dumitrache, L.C.; Katyal, S.; Khodakhah, K.; Russell, H.R.; et al. Chromatin architecture at susceptible gene loci in cerebellar Purkinje cells characterizes DNA damage–induced neurodegeneration. Sci. Adv. 2021, 7, eabg6363. [Google Scholar] [CrossRef] [PubMed]
- Yeo, A.; Subramanian, G.; Chong, K.; Gatei, M.; Parton, R.; Coman, D.; Lavin, M. An anaplerotic approach to correct the mitochondrial dysfunction in ataxia-telangiectasia (A-T). Mol. Metab. 2021, 54, 101354. [Google Scholar] [CrossRef]
- Focchi, E.; Cambria, C.; Pizzamiglio, L.; Murru, L.; Pelucchi, S.; D’andrea, L.; Piazza, S.; Mattioni, L.; Passafaro, M.; Marcello, E.; et al. ATM rules neurodevelopment and glutamatergic transmission in the hippocampus but not in the cortex. Cell Death Dis. 2022, 13, 1–13. [Google Scholar] [CrossRef]
- Gade, A.K.; Olariu, E.; Douthit, N.T. Carcinoid Syndrome: A Review. Cureus 2020, 12, e7186. [Google Scholar] [CrossRef]
- Eilam, R., et al., Late degeneration of nigro-striatal neurons in ATM-/- mice. Neuroscience, 2003. 121(1): p. 83-98.
- Hannah-Shmouni, F.; Stratakis, C.A.; Koch, C.A. Flushing in (neuro)endocrinology. Rev. Endocr. Metab. Disord. 2016, 17, 373–380. [Google Scholar] [CrossRef]
- Said, S.I., Vasoactive peptides. State-of-the-art review. Hypertension, 1983. 5(2 Pt 2): p. I17-26.
- Ghigo, E.; Arvat, E.; Bellone, J.; Ramunni, J.; Camanni, F. Neurotransmitter Control of Growth Hormone Secretion in Humans. J. Pediatr. Endocrinol. Metab. 1993, 6, 263–266. [Google Scholar] [CrossRef]
- Kanu, N.; Behrens, A. ATMIN defines an NBS1-independent pathway of ATM signalling. EMBO J. 2007, 26, 2933–2941. [Google Scholar] [CrossRef]
- Yang, Y., et al., The orphan nuclear receptor NR4A1 attenuates oxidative stress-induced beta cells apoptosis via up-regulation of glutathione peroxidase 1. Life Sci, 2018. 203: p. 225-232.
- Shi, Y.Y., et al., Role of FOXO protein's abnormal activation through PI3K/AKT pathway in platinum resistance of ovarian cancer. J Obstet Gynaecol Res, 2021. 47(6): p. 1946-1957.
- Kim, H.; Kim, D.; Choi, H.; Shin, G.; Lee, J.-K. Deubiquitinase USP2 stabilizes the MRE11–RAD50–NBS1 complex at DNA double-strand break sites by counteracting the ubiquitination of NBS1. J. Biol. Chem. 2022, 299. [Google Scholar] [CrossRef] [PubMed]
- Matsuoka, S.; Ballif, B.A.; Smogorzewska, A.; McDonald, E.R., III; Hurov, K.E.; Luo, J.; Bakalarski, C.E.; Zhao, Z.; Solimini, N.; Lerenthal, Y.; et al. ATM and ATR Substrate Analysis Reveals Extensive Protein Networks Responsive to DNA Damage. Science 2007, 316, 1160–1166. [Google Scholar] [CrossRef]
- Bensimon, A.; Schmidt, A.; Ziv, Y.; Elkon, R.; Wang, S.-Y.; Chen, D.J.; Aebersold, R.; Shiloh, Y. ATM-Dependent and -Independent Dynamics of the Nuclear Phosphoproteome After DNA Damage. Sci. Signal. 2010, 3, rs3–rs3. [Google Scholar] [CrossRef]
- Schlam-Babayov, S.; Bensimon, A.; Harel, M.; Geiger, T.; Aebersold, R.; Ziv, Y.; Shiloh, Y. Phosphoproteomics reveals novel modes of function and inter-relationships among PIKKs in response to genotoxic stress. EMBO J. 2020, 40, e104400. [Google Scholar] [CrossRef]
- Petrinovic, M.M.; Hourez, R.; Aloy, E.M.; Dewarrat, G.; Gall, D.; Weinmann, O.; Gaudias, J.; Bachmann, L.C.; Schiffmann, S.N.; Vogt, K.E.; et al. Neuronal Nogo-A negatively regulates dendritic morphology and synaptic transmission in the cerebellum. Proc. Natl. Acad. Sci. 2012, 110, 1083–1088. [Google Scholar] [CrossRef]
- Jaudon, F.; Raynaud, F.; Wehrlé, R.; Bellanger, J.-M.; Doulazmi, M.; Vodjdani, G.; Gasman, S.; Fagni, L.; Dusart, I.; Debant, A.; et al. The RhoGEF DOCK10 is essential for dendritic spine morphogenesis. Mol. Biol. Cell 2015, 26, 2112–2127. [Google Scholar] [CrossRef] [PubMed]
- Bell, S.; Rousseau, J.; Peng, H.; Aouabed, Z.; Priam, P.; Theroux, J.-F.; Jefri, M.; Tanti, A.; Wu, H.; Kolobova, I.; et al. Mutations in ACTL6B Cause Neurodevelopmental Deficits and Epilepsy and Lead to Loss of Dendrites in Human Neurons. Am. J. Hum. Genet. 2019, 104, 815–834. [Google Scholar] [CrossRef] [PubMed]
- Cruz-Solis, I.; Zepeda, R.C.; Ortiz, S.; Aguilera, J.; López-Bayghen, E.; Ortega, A. Glutamate-dependent transcriptional control in Bergmann glia: Sox10 as a repressor. J. Neurochem. 2009, 109, 899–910. [Google Scholar] [CrossRef] [PubMed]
- Karasmanis, E.P., et al., Polarity of Neuronal Membrane Traffic Requires Sorting of Kinesin Motor Cargo during Entry into Dendrites by a Microtubule-Associated Septin. Dev Cell, 2018. 46(2): p. 204-218 e7.
- Manley, J.; Jd, B.; V, S.; Pp, Z.; B, L.; M, V.; M, K.; Se, H. Faculty of 1000 evaluation for Dopamine and glutamate induce distinct striatal splice forms of Ania-6, an RNA polymerase II-associated cyclin. . 2001, 32. [Google Scholar] [CrossRef]
- van Essen, M.J., et al., Deconstructing cerebellar development cell by cell. PLoS Genet, 2020. 16(4): p. e1008630.
- Rahimi-Balaei, M.; Bergen, H.; Kong, J.; Marzban, H. Neuronal Migration During Development of the Cerebellum. Front. Cell. Neurosci. 2018, 12, 484. [Google Scholar] [CrossRef]
- van der Heijden, M.E.; Gill, J.S.; Sillitoe, R.V. Abnormal Cerebellar Development in Autism Spectrum Disorders. Dev. Neurosci. 2021, 43, 181–190. [Google Scholar] [CrossRef]
- Ceylan, A.C.; Arslan, E.A.; Erdem, H.B.; Kavus, H.; Arslan, M.; Topaloğlu, H. Autosomal recessive spinocerebellar ataxia 18 caused by homozygous exon 14 duplication in GRID2 and review of the literature. Acta Neurol. Belg. 2020, 121, 1457–1462. [Google Scholar] [CrossRef]
- Coutelier, M.; Burglen, L.; Mundwiller, E.; Abada-Bendib, M.; Rodriguez, D.; Chantot-Bastaraud, S.; Rougeot, C.; Cournelle, M.-A.; Milh, M.; Toutain, A.; et al. GRID2 mutations span from congenital to mild adult-onset cerebellar ataxia. Neurology 2015, 84, 1751–1759. [Google Scholar] [CrossRef]
- Depondt, C., et al., MME mutation in dominant spinocerebellar ataxia with neuropathy (SCA43). Neurol Genet, 2016. 2(5): p. e94.
- Boukhtouche, F.; Doulazmi, M.; Frederic, F.; Dusart, I.; Brugg, B.; Mariani, J. Rorα, a pivotal nuclear receptor for Purkinje neuron survival and differentiation: From development to ageing. Cerebellum 2006, 5, 97–104. [Google Scholar] [CrossRef]
- Jolly, S.; Journiac, N.; Garabedian, B.V.-D.; Mariani, J. RORalpha, a Key to the Development and Functioning of the Brain. Cerebellum 2012, 11, 451–452. [Google Scholar] [CrossRef] [PubMed]
- Betz, C. and M.N. Hall, Where is mTOR and what is it doing there? J Cell Biol, 2013. 203(4): p. 563-74.
- Gollwitzer, P.; Grützmacher, N.; Wilhelm, S.; Kümmel, D.; Demetriades, C. Author Correction: A Rag GTPase dimer code defines the regulation of mTORC1 by amino acids. Nature 2022, 25, 1–1. [Google Scholar] [CrossRef] [PubMed]
- Schweizer, A.; Valdenaire, O.; Köster, A.; Lang, Y.; Schmitt, G.; Lenz, B.; Bluethmann, H.; Rohrer, J. Neonatal Lethality in Mice Deficient in XCE, a Novel Member of the Endothelin-converting Enzyme and Neutral Endopeptidase Family. J. Biol. Chem. 1999, 274, 20450–20456. [Google Scholar] [CrossRef] [PubMed]
- Kiryu-Seo, S.; Nagata, K.; Saido, T.C.; Kiyama, H. New Insights of a Neuronal Peptidase DINE/ECEL1: Nerve Development, Nerve Regeneration and Neurogenic Pathogenesis. Neurochem. Res. 2018, 44, 1279–1288. [Google Scholar] [CrossRef]
- Wang, C.-L.; Wang, J.-Y.; Liu, Z.-Y.; Ma, X.-M.; Wang, X.-W.; Jin, H.; Zhang, X.-P.; Fu, D.; Hou, L.-J.; Lu, Y.-C. Ubiquitin-specific protease 2a stabilizes MDM4 and facilitates the p53-mediated intrinsic apoptotic pathway in glioblastoma. Carcinog. 2014, 35, 1500–1509. [Google Scholar] [CrossRef]
- Pereg, Y.; Shkedy, D.; de Graaf, P.; Meulmeester, E.; Edelson-Averbukh, M.; Salek, M.; Biton, S.; Teunisse, A.F.A.S.; Lehmann, W.D.; Jochemsen, A.G.; et al. Phosphorylation of Hdmx mediates its Hdm2- and ATM-dependent degradation in response to DNA damage. Proc. Natl. Acad. Sci. 2005, 102, 5056–5061. [Google Scholar] [CrossRef]
- Moore, C.; Cevikbas, F.; Pasolli, H.A.; Chen, Y.; Kong, W.; Kempkes, C.; Parekh, P.; Lee, S.H.; Kontchou, N.-A.; Yeh, I.; et al. UVB radiation generates sunburn pain and affects skin by activating epidermal TRPV4 ion channels and triggering endothelin-1 signaling. Proc. Natl. Acad. Sci. 2013, 110, E3225–E3234. [Google Scholar] [CrossRef]
- Bernard, J.J.; Cowing-Zitron, C.; Nakatsuji, T.; Muehleisen, B.; Muto, J.; Borkowski, A.W.; Martinez, L.; Greidinger, E.L.; Yu, B.D.; Gallo, R.L. Ultraviolet radiation damages self noncoding RNA and is detected by TLR3. Nat. Med. 2012, 18, 1286–1290. [Google Scholar] [CrossRef] [PubMed]
- Sarkar, S.; Gaddameedhi, S. Solar ultraviolet-induced DNA damage response: Melanocytes story in transformation to environmental melanomagenesis. Environ. Mol. Mutagen. 2020, 61, 736–751. [Google Scholar] [CrossRef] [PubMed]
- Mavrogonatou, E.; Angelopoulou, M.; Rizou, S.V.; Pratsinis, H.; Gorgoulis, V.G.; Kletsas, D. Activation of the JNKs/ATM-p53 axis is indispensable for the cytoprotection of dermal fibroblasts exposed to UVB radiation. Cell Death Dis. 2022, 13, 1–14. [Google Scholar] [CrossRef]
- Kawasumi, M.; Lemos, B.; Bradner, J.E.; Thibodeau, R.; Kim, Y.-S.; Schmidt, M.; Higgins, E.; Koo, S.-W.; Angle-Zahn, A.; Chen, A.; et al. Protection from UV-induced skin carcinogenesis by genetic inhibition of the ataxia telangiectasia and Rad3-related (ATR) kinase. Proc. Natl. Acad. Sci. 2011, 108, 13716–13721. [Google Scholar] [CrossRef] [PubMed]
- Panda, P.K.; Sharawat, I.K.; Dawman, L. GRID2 Mutation-Related Spinocerebellar Ataxia Type 18: A New Report and Literature Review. J. Pediatr. Genet. 2020, 11, 099–109. [Google Scholar] [CrossRef] [PubMed]
- Matsuda, K., et al., Characterization of the delta2 glutamate receptor-binding protein delphilin: Splicing variants with differential palmitoylation and an additional PDZ domain. J Biol Chem, 2006. 281(35): p. 25577-87.
- Yousaf, H.; Fatima, A.; Ali, Z.; Baig, S.M.; Toft, M.; Iqbal, Z. A Novel Nonsense Variant in GRM1 Causes Autosomal Recessive Spinocerebellar Ataxia 13 in a Consanguineous Pakistani Family. Genes 2022, 13, 1667. [Google Scholar] [CrossRef]
- Watson, L.M., et al., Dominant Mutations in GRM1 Cause Spinocerebellar Ataxia Type 44. Am J Hum Genet, 2017. 101(5): p. 866.
- Jen, J.C.; Wan, J.; Palos, T.P.; Howard, B.D.; Baloh, R.W. Mutation in the glutamate transporter EAAT1 causes episodic ataxia, hemiplegia, and seizures. Neurology 2005, 65, 529–534. [Google Scholar] [CrossRef]
- Wu, Q.; Akhter, A.; Pant, S.; Cho, E.; Zhu, J.X.; Garner, A.; Ohyama, T.; Tajkhorshid, E.; van Meyel, D.J.; Ryan, R.M. Ataxia-linked SLC1A3 mutations alter EAAT1 chloride channel activity and glial regulation of CNS function. J. Clin. Investig. 2022, 132. [Google Scholar] [CrossRef]
- La Spada, A.; Y, I.; Ka, D.; Weatherspoon; D, G.; Kr, A.; Jc, D.; G, S.; A, D.; C, Z.; et al. Faculty Opinions recommendation of Spectrin mutations cause spinocerebellar ataxia type 5.. 2006, 38. [CrossRef]
- Perkins, E.M.; Clarkson, Y.L.; Suminaite, D.; Lyndon, A.R.; Tanaka, K.; Rothstein, J.D.; A Skehel, P.; A Wyllie, D.J.; Jackson, M. Loss of cerebellar glutamate transporters EAAT4 and GLAST differentially affects the spontaneous firing pattern and survival of Purkinje cells. Hum. Mol. Genet. 2018, 27, 2614–2627. [Google Scholar] [CrossRef] [PubMed]
- Hioki, H.; Fujiyama, F.; Taki, K.; Tomioka, R.; Furuta, T.; Tamamaki, N.; Kaneko, T. Differential distribution of vesicular glutamate transporters in the rat cerebellar cortex. Neuroscience 2003, 117, 1–6. [Google Scholar] [CrossRef] [PubMed]
- Chander, P.; Kennedy, M.J.; Winckler, B.; Weick, J.P. Neuron-Specific Gene 2 (NSG2) Encodes an AMPA Receptor Interacting Protein That Modulates Excitatory Neurotransmission. eneuro 2019, 6. [Google Scholar] [CrossRef]
- Takamiya, K.; Mao, L.; Huganir, R.L.; Linden, D.J. The Glutamate Receptor-Interacting Protein Family of GluR2-Binding Proteins Is Required for Long-Term Synaptic Depression Expression in Cerebellar Purkinje Cells. J. Neurosci. 2008, 28, 5752–5755. [Google Scholar] [CrossRef]
- Lévénès, C.; Daniel, H.; Soubrié, P.; Crépel, F. Cannabinoids decrease excitatory synaptic transmission and impair long-term depression in rat cerebellar Purkinje cells. J. Physiol. 1998, 510, 867–879. [Google Scholar] [CrossRef]
- Bloomquist, B.; Darlington, D.; Mains, R.; Eipper, B. RESP18, a novel endocrine secretory protein transcript, and four other transcripts are regulated in parallel with pro-opiomelanocortin in melanotropes. J. Biol. Chem. 1994, 269, 9113–9122. [Google Scholar] [CrossRef]
- Zhang, G.; Hirai, H.; Cai, T.; Miura, J.; Yu, P.; Huang, H.; Schiller, M.R.; Swaim, W.D.; Leapman, R.D.; Notkins, A.L. RESP18, a homolog of the luminal domain IA-2, is found in dense core vesicles in pancreatic islet cells and is induced by high glucose. J. Endocrinol. 2007, 195, 313–321. [Google Scholar] [CrossRef]
- Toledo, P.L.; Torkko, J.M.; Müller, A.; Wegbrod, C.; Sönmez, A.; Solimena, M.; Ermácora, M.R. ICA512 RESP18 homology domain is a protein-condensing factor and insulin fibrillation inhibitor. J. Biol. Chem. 2019, 294, 8564–8576. [Google Scholar] [CrossRef]
- Huang, K.-F.; Liu, Y.-L.; Cheng, W.-J.; Ko, T.-P.; Wang, A.H.-J. Crystal structures of human glutaminyl cyclase, an enzyme responsible for protein N-terminal pyroglutamate formation. Proc. Natl. Acad. Sci. 2005, 102, 13117–13122. [Google Scholar] [CrossRef]
- Wang, Q. and J.R. Traynor, Opioid-induced down-regulation of RGS4: role of ubiquitination and implications for receptor cross-talk. J Biol Chem, 2011. 286(10): p. 7854-7864.
- Traynor, J. μ-Opioid receptors and regulators of G protein signaling (RGS) proteins: From a symposium on new concepts in mu-opioid pharmacology. Drug Alcohol Depend. 2011, 121, 173–180. [Google Scholar] [CrossRef] [PubMed]
- Santhappan, R.; Crowder, A.T.; Gouty, S.; Cox, B.M.; Côté, T.E. Mu opioid receptor activation enhances regulator of G protein signaling 4 association with the mu opioid receptor/G protein complex in a GTP-dependent manner. J. Neurochem. 2015, 135, 76–87. [Google Scholar] [CrossRef] [PubMed]
- Senese, N.B.; Kandasamy, R.; Kochan, K.E.; Traynor, J.R. Regulator of G-Protein Signaling (RGS) Protein Modulation of Opioid Receptor Signaling as a Potential Target for Pain Management. Front. Mol. Neurosci. 2020, 13, 5. [Google Scholar] [CrossRef]
- Trupp, M.; Raynoschek, C.; Belluardo, N.; Ibáñez, C.F. Multiple GPI-Anchored Receptors Control GDNF-Dependent and Independent Activation of the c-Ret Receptor Tyrosine Kinase. Mol. Cell. Neurosci. 1998, 11, 47–63. [Google Scholar] [CrossRef]
- Burazin, T.C. and A.L. Gundlach, Localization of GDNF/neurturin receptor (c-ret, GFRalpha-1 and alpha-2) mRNAs in postnatal rat brain: differential regional and temporal expression in hippocampus, cortex and cerebellum. Brain Res Mol Brain Res, 1999. 73(1-2): p. 151-71.
- Aruga, J.; Mikoshiba, K. Identification and characterization of Slitrk, a novel neuronal transmembrane protein family controlling neurite outgrowth. Mol. Cell. Neurosci. 2003, 24, 117–129. [Google Scholar] [CrossRef]
- Takahashi, H., et al., Selective control of inhibitory synapse development by Slitrk3-PTPdelta trans-synaptic interaction. Nat Neurosci, 2012. 15(3): p. 389-98, S1-2.
- Song, M.; Giza, J.; Proenca, C.C.; Jing, D.; Elliott, M.; Dincheva, I.; Shmelkov, S.V.; Kim, J.; Schreiner, R.; Huang, S.-H.; et al. Slitrk5 Mediates BDNF-Dependent TrkB Receptor Trafficking and Signaling. Dev. Cell 2015, 33, 690–702. [Google Scholar] [CrossRef]
- Matsumoto, Y.; Katayama, K.-I.; Okamoto, T.; Yamada, K.; Takashima, N.; Nagao, S.; Aruga, J. Impaired Auditory-Vestibular Functions and Behavioral Abnormalities of Slitrk6-Deficient Mice. PLOS ONE 2011, 6, e16497. [Google Scholar] [CrossRef]
- Lane, R.F.; George-Hyslop, P.S.; Hempstead, B.L.; Small, S.A.; Strittmatter, S.M.; Gandy, S. Vps10 Family Proteins and the Retromer Complex in Aging-Related Neurodegeneration and Diabetes. J. Neurosci. 2012, 32, 14080–14086. [Google Scholar] [CrossRef] [PubMed]
- Savas, J.N.; Ribeiro, L.F.; Wierda, K.D.; Wright, R.; DeNardo-Wilke, L.A.; Rice, H.C.; Chamma, I.; Wang, Y.-Z.; Zemla, R.; Lavallée-Adam, M.; et al. The Sorting Receptor SorCS1 Regulates Trafficking of Neurexin and AMPA Receptors. Neuron 2015, 87, 764–780. [Google Scholar] [CrossRef] [PubMed]
- Gospodinova, K.O.; Olsen, D.; Kaas, M.; Anderson, S.M.; Phillips, J.; Walker, R.M.; Bermingham, M.L.; Payne, A.L.; Giannopoulos, P.; Pandya, D.; et al. Loss of SORCS2 is Associated with Neuronal DNA Double-Strand Breaks. Cell. Mol. Neurobiol. 2021, 43, 237–249. [Google Scholar] [CrossRef] [PubMed]
- Kebede, M.A., et al., SORCS1 is necessary for normal insulin secretory granule biogenesis in metabolically stressed beta cells. J Clin Invest, 2014. 124(10): p. 4240-56.
- Coffey, E.T., et al., c-Jun N-terminal protein kinase (JNK) 2/3 is specifically activated by stress, mediating c-Jun activation, in the presence of constitutive JNK1 activity in cerebellar neurons. J Neurosci, 2002. 22(11): p. 4335-45.
- Ham, J.; Eilers, A.; Whitfield, J.; Neame, S.J.; Shah, B. c-Jun and the transcriptional control of neuronal apoptosis. Biochem. Pharmacol. 2000, 60, 1015–1021. [Google Scholar] [CrossRef]
- Mukai, J.; Hachiya, T.; Shoji-Hoshino, S.; Kimura, M.T.; Nadano, D.; Suvanto, P.; Hanaoka, T.; Li, Y.; Irie, S.; Greene, L.A.; et al. NADE, a p75NTR-associated Cell Death Executor, Is Involved in Signal Transduction Mediated by the Common Neurotrophin Receptor p75NTR. J. Biol. Chem. 2000, 275, 17566–17570. [Google Scholar] [CrossRef]
- Mukai, J., et al., Structure-function analysis of NADE: identification of regions that mediate nerve growth factor-induced apoptosis. J Biol Chem, 2002. 277(16): p. 13973-82.
- Zhang, D.; Sliwkowski, M.X.; Mark, M.; Frantz, G.; Akita, R.; Sun, Y.; Hillan, K.; Crowley, C.; Brush, J.; Godowski, P.J. Neuregulin-3 (NRG3): A novel neural tissue-enriched protein that binds and activates ErbB4. Proc. Natl. Acad. Sci. 1997, 94, 9562–9567. [Google Scholar] [CrossRef]
- Pallesen, L.T.; Vaegter, C.B. Sortilin and SorLA Regulate Neuronal Sorting of Trophic and Dementia-Linked Proteins. Mol. Neurobiol. 2012, 45, 379–387. [Google Scholar] [CrossRef]
- Segal, R.A.; Takahashi, H.; McKay, R.D. Changes in neurotrophin responsiveness during the development of cerebellar granule neurons. Neuron 1992, 9, 1041–1052. [Google Scholar] [CrossRef] [PubMed]
- Bates, B.; Rios, M.; Trumpp, A.; Chen, C.; Fan, G.; Bishop, J.M.; Jaenisch, R. Neurotrophin–3 is required for proper cerebellar development. Nat. Neurosci. 1999, 2, 115–117. [Google Scholar] [CrossRef] [PubMed]
- Katoh-Semba, R., et al., Neurotrophin-3 controls proliferation of granular precursors as well as survival of mature granule neurons in the developing rat cerebellum. J Neurochem, 2000. 74(5): p. 1923-30.
- Sadakata, T.; Kakegawa, W.; Mizoguchi, A.; Washida, M.; Katoh-Semba, R.; Shutoh, F.; Okamoto, T.; Nakashima, H.; Kimura, K.; Tanaka, M.; et al. Impaired Cerebellar Development and Function in Mice Lacking CAPS2, a Protein Involved in Neurotrophin Release. J. Neurosci. 2007, 27, 2472–2482. [Google Scholar] [CrossRef] [PubMed]
- Sadakata, T.; Mizoguchi, A.; Sato, Y.; Katoh-Semba, R.; Fukuda, M.; Mikoshiba, K.; Furuichi, T. The Secretory Granule-Associated Protein CAPS2 Regulates Neurotrophin Release and Cell Survival. J. Neurosci. 2004, 24, 43–52. [Google Scholar] [CrossRef] [PubMed]
- Skaper, S.D.; Floreani, M.; Negro, A.; Facci, L.; Giusti, P. Neurotrophins rescue cerebellar granule neurons from oxidative stress-mediated apoptotic death: selective involvement of phosphatidylinositol 3-kinase and the mitogen-activated protein kinase pathway. J. Neurochem. 2002, 70, 1859–1868. [Google Scholar] [CrossRef]
- Lindholm, D.; Dechant, G.; Heisenberg, C.-P.; Thoenen, H. Brain-derived Neurotrophic Factor is a Survival Factor for Cultured Rat Cerebellar Granule Neurons and Protects them Against Glutamate-induced Neurotoxicity. Eur. J. Neurosci. 1993, 5, 1455–1464. [Google Scholar] [CrossRef]
- Morrison, M.E.; Mason, C.A. Granule Neuron Regulation of Purkinje Cell Development: Striking a Balance Between Neurotrophin and Glutamate Signaling. J. Neurosci. 1998, 18, 3563–3573. [Google Scholar] [CrossRef]
- Lindholm, D.; Castrén, E.; Tsoulfas, P.; Kolbeck, R.; Berzaghi, M.d.P.; Leingärtner, A.; Heisenberg, C.; Tessarollo, L.; Parada, L.; Thoenen, H. Neurotrophin-3 induced by tri-iodothyronine in cerebellar granule cells promotes Purkinje cell differentiation. J. Cell Biol. 1993, 122, 443–450. [Google Scholar] [CrossRef]
- Mount, H.T.J.; Elkabes, S.; Dreyfus, C.F.; Black, I.B. Differential Involvement of Metabotropic and p75 Neurotrophin Receptors in Effects of Nerve Growth Factor and Neurotrophin-3 on Cultured Purkinje Cell Survival. J. Neurochem. 2002, 70, 1045–1053. [Google Scholar] [CrossRef]
- Schwechter, B.; Rosenmund, C.; Tolias, K.F. RasGRF2 Rac-GEF activity couples NMDA receptor calcium flux to enhanced synaptic transmission. Proc. Natl. Acad. Sci. 2013, 110, 14462–14467. [Google Scholar] [CrossRef] [PubMed]
- Gloriam, D.E.; Schiöth, H.B.; Fredriksson, R. Nine new human Rhodopsin family G-protein coupled receptors: identification, sequence characterisation and evolutionary relationship. Biochim. et Biophys. Acta (BBA) - Gen. Subj. 2005, 1722, 235–246. [Google Scholar] [CrossRef] [PubMed]
- Jaarsma, D.; Blot, F.G.C.; Wu, B.; Venkatesan, S.; Voogd, J.; Meijer, D.; Ruigrok, T.J.H.; Gao, Z.; Schonewille, M.; De Zeeuw, C.I. The basal interstitial nucleus (BIN) of the cerebellum provides diffuse ascending inhibitory input to the floccular granule cell layer. J. Comp. Neurol. 2018, 526, 2231–2256. [Google Scholar] [CrossRef] [PubMed]
- Jarius, S., et al., Inositol 1,4,5-trisphosphate receptor type 1 autoantibody (ITPR1-IgG/anti-Sj)-associated autoimmune cerebellar ataxia, encephalitis and peripheral neuropathy: review of the literature. J Neuroinflammation, 2022. 19(1): p. 196.
- Storey, E., Spinocerebellar Ataxia Type 15, in GeneReviews((R)), M.P. Adam, et al., Editors. 1993: Seattle (WA).
- Zambonin, J.L.; Bellomo, A.; Ben-Pazi, H.; Everman, D.B.; Frazer, L.M.; Geraghty, M.T.; Harper, A.D.; Jones, J.R.; Kamien, B.; Kernohan, K.; et al. Spinocerebellar ataxia type 29 due to mutations in ITPR1: a case series and review of this emerging congenital ataxia. Orphanet J. Rare Dis. 2017, 12, 1–8. [Google Scholar] [CrossRef]
- Speidel, D., et al., A family of Ca2+-dependent activator proteins for secretion: comparative analysis of structure, expression, localization, and function. J Biol Chem, 2003. 278(52): p. 52802-9.
- Lorenzo-Betancor, O.; Galosi, L.; Bonfili, L.; Eleuteri, A.M.; Cecarini, V.; Verin, R.; Dini, F.; Attili, A.; Berardi, S.; Biagini, L.; et al. Homozygous CADPS2 Mutations Cause Neurodegenerative Disease with Lewy Body-like Pathology in Parrots. Mov. Disord. 2022, 37, 2345–2354. [Google Scholar] [CrossRef]
- Perlman, S., Hereditary Ataxia Overview, in GeneReviews((R)), M.P. Adam, et al., Editors. 1993: Seattle (WA).
- Yang, J.; Pawlyk, B.; Wen, X.-H.; Adamian, M.; Soloviev, M.; Michaud, N.; Zhao, Y.; Sandberg, M.A.; Makino, C.L.; Li, T. Mpp4 is required for proper localization of plasma membrane calcium ATPases and maintenance of calcium homeostasis at the rod photoreceptor synaptic terminals. Hum. Mol. Genet. 2007, 16, 1017–1029. [Google Scholar] [CrossRef]
- Ni, T.; Harlos, K.; Gilbert, R.; Tao, N.; Karl, H.; Robert, G.; T, N.; R, G. Structure of astrotactin-2: a conserved vertebrate-specific and perforin-like membrane protein involved in neuronal development. Open Biol. 2016, 6. [Google Scholar] [CrossRef]
- Richards, T.; Modarage, K.; Dean, C.; McCarthy-Boxer, A.; Hilton, H.; Esapa, C.; Norman, J.; Wilson, P.; Goggolidou, P. Atmin modulates Pkhd1 expression and may mediate Autosomal Recessive Polycystic Kidney Disease (ARPKD) through altered non-canonical Wnt/Planar Cell Polarity (PCP) signalling. Biochim. et Biophys. Acta (BBA) - Mol. Basis Dis. 2018, 1865, 378–390. [Google Scholar] [CrossRef] [PubMed]
- Basu, R.; Taylor, M.R.; E Williams, M. The classic cadherins in synaptic specificity. Cell Adhes. Migr. 2015, 9, 193–201. [Google Scholar] [CrossRef] [PubMed]
- Srikanta, S.B.; Stojkovic, K.; Cermakian, N. Behavioral phenotyping of mice lacking the deubiquitinase USP2. PLOS ONE 2021, 16, e0241403. [Google Scholar] [CrossRef]
- Harris-Gauthier, N.; Srikanta, S.B.; Cermakian, N. Deubiquitinases: key regulators of the circadian clock. Am. J. Physiol. Physiol. 2022, 323, C1539–C1547. [Google Scholar] [CrossRef]
- Liu, R.; Lee, J.-H.; Li, J.; Yu, R.; Tan, L.; Xia, Y.; Zheng, Y.; Bian, X.-L.; Lorenzi, P.L.; Chen, Q.; et al. Choline kinase alpha 2 acts as a protein kinase to promote lipolysis of lipid droplets. Mol. Cell 2021, 81, 2722–2735. [Google Scholar] [CrossRef] [PubMed]
- Klöckner, C.; Fernández-Murray, J.P.; Tavasoli, M.; Sticht, H.; Stoltenburg-Didinger, G.; Scholle, L.M.; Bakhtiari, S.; Kruer, M.C.; Darvish, H.; Firouzabadi, S.G.; et al. Bi-allelic variants in CHKA cause a neurodevelopmental disorder with epilepsy and microcephaly. Brain 2022, 145, 1916–1923. [Google Scholar] [CrossRef] [PubMed]
- Chauvet, C.; Bois-Joyeux, B.; Berra, E.; Pouyssegur, J.; Danan, J.-L. The gene encoding human retinoic acid-receptor-related orphan receptor α is a target for hypoxia-inducible factor 1. Biochem. J. 2004, 384, 79–85. [Google Scholar] [CrossRef]
- Guissart, C.; Latypova, X.; Rollier, P.; Khan, T.N.; Stamberger, H.; McWalter, K.; Cho, M.T.; Kjaergaard, S.; Weckhuysen, S.; Lesca, G.; et al. Dual Molecular Effects of Dominant RORA Mutations Cause Two Variants of Syndromic Intellectual Disability with Either Autism or Cerebellar Ataxia. Am. J. Hum. Genet. 2018, 102, 744–759. [Google Scholar] [CrossRef]
- Sun, X.; Lin, Y. Npas4: Linking Neuronal Activity to Memory. Trends Neurosci. 2016, 39, 264–275. [Google Scholar] [CrossRef]
- Hong, H.; Su, J.; Huang, C.; Lu, X.; Cui, Z. Comprehensive insights into the function and molecular and pharmacological regulation of neuron-derived orphan receptor 1, an orphan receptor. Front. Pharmacol. 2022, 13, 981490. [Google Scholar] [CrossRef] [PubMed]
- Cheon, S.; Park, N.; Cho, S.; Kim, K. Glucocorticoid-mediated Period2 induction delays the phase of circadian rhythm. Nucleic Acids Res. 2013, 41, 6161–6174. [Google Scholar] [CrossRef] [PubMed]
- Sun, X., et al., Structures of NPAS4-ARNT and NPAS4-ARNT2 heterodimers reveal new dimerization modalities in the bHLH-PAS transcription factor family. Proc Natl Acad Sci U S A, 2022. 119(46): p. e2208804119.
- Hao, N., et al., Reciprocal regulation of the basic helix-loop-helix/Per-Arnt-Sim partner proteins, Arnt and Arnt2, during neuronal differentiation. Nucleic Acids Res, 2013. 41(11): p. 5626-38.
- Mueller, C.R.; Liu, B.; Bell, A.W.; Paranjpe, S.; Bowen, W.C.; Khillan, J.S.; Luo, J.-H.; Mars, W.M.; Michalopoulos, G.K.; Park, J.K.; et al. The Down-Regulation of Albumin Transcription During Regeneration Is Due to the Loss of HNF-1 and the D-Site Transcription Factors. DNA Cell Biol. 1992, 11, 559–566. [Google Scholar] [CrossRef] [PubMed]
- Klugmann, M.; Leichtlein, C.B.; Symes, C.W.; Klaussner, B.C.; Brooks, A.I.; Young, D.; During, M.J. A novel role of circadian transcription factor DBP in hippocampal plasticity. Mol. Cell. Neurosci. 2006, 31, 303–314. [Google Scholar] [CrossRef]
- Stratmann, M.; Stadler, F.; Tamanini, F.; van der Horst, G.T.; Ripperger, J.A. Flexible phase adjustment of circadian albumin D site-binding protein (Dbp) gene expression by CRYPTOCHROME1. Minerva Anestesiol. 2010, 24, 1317–1328. [Google Scholar] [CrossRef]
- Gat, Y.; Schuller, J.M.; Lingaraju, M.; Weyher, E.; Bonneau, F.; Strauss, M.; Murray, P.J.; Conti, E. InsP6 binding to PIKK kinases revealed by the cryo-EM structure of an SMG1–SMG8–SMG9 complex. Nat. Struct. Mol. Biol. 2019, 26, 1089–1093. [Google Scholar] [CrossRef]
- Darling, N.J.; Cohen, P. Nuts and bolts of the salt-inducible kinases (SIKs). Biochem. J. 2021, 478, 1377–1397. [Google Scholar] [CrossRef]
- Jang, H.; Park, Y.; Jang, J. Serum and glucocorticoid-regulated kinase 1: Structure, biological functions, and its inhibitors. Front. Pharmacol. 2022, 13, 1036844. [Google Scholar] [CrossRef]
- Homey, B., et al., CCL27-CCR10 interactions regulate T cell-mediated skin inflammation. Nat Med, 2002. 8(2): p. 157-65.
- Nguyen, T.A.; Smith, B.R.C.; Elgass, K.D.; Creed, S.J.; Cheung, S.; Tate, M.D.; Belz, G.T.; Wicks, I.P.; Masters, S.L.; Pang, K.C. SIDT1 Localizes to Endolysosomes and Mediates Double-Stranded RNA Transport into the Cytoplasm. J. Immunol. 2019, 202, 3483–3492. [Google Scholar] [CrossRef] [PubMed]
- Kurschner, C.; Yuzaki, M. Neuronal Interleukin-16 (NIL-16): A Dual Function PDZ Domain Protein. J. Neurosci. 1999, 19, 7770–7780. [Google Scholar] [CrossRef] [PubMed]
- Wang, W.; Jiang, M.; Liu, S.; Zhang, S.; Liu, W.; Ma, Y.; Zhang, L.; Zhang, J.; Cao, X. RNF122 suppresses antiviral type I interferon production by targeting RIG-I CARDs to mediate RIG-I degradation. Proc. Natl. Acad. Sci. 2016, 113, 9581–9586. [Google Scholar] [CrossRef]
- Xu, S.; Zheng, Z.; Pathak, J.L.; Cheng, H.; Zhou, Z.; Chen, Y.; Wu, Q.; Wang, L.; Zeng, M.; Wu, L. The Emerging Role of the Serine Incorporator Protein Family in Regulating Viral Infection. Front. Cell Dev. Biol. 2022, 10, 856468. [Google Scholar] [CrossRef]
- Kang, J.-S.; Feinleib, J.L.; Knox, S.; Ketteringham, M.A.; Krauss, R.S. Promyogenic members of the Ig and cadherin families associate to positively regulate differentiation. Proc. Natl. Acad. Sci. 2003, 100, 3989–3994. [Google Scholar] [CrossRef] [PubMed]
- Zhang, X.; Jiang, S.; Mitok, K.A.; Li, L.; Attie, A.D.; Martin, T.F. BAIAP3, a C2 domain–containing Munc13 protein, controls the fate of dense-core vesicles in neuroendocrine cells. J. Cell Biol. 2017, 216, 2151–2166. [Google Scholar] [CrossRef]
- Rodríguez-Muñoz, M.; Garzón, J. Nitric Oxide and Zinc-Mediated Protein Assemblies Involved in Mu Opioid Receptor Signaling. Mol. Neurobiol. 2013, 48, 769–782. [Google Scholar] [CrossRef]
- Yang, Y.; Bai, J.; Sun, J.-Y.; Ye, T.; Zhang, L.; Wu, F.-Y.; Nan, J.; Lan, Y. Mechanisms Underlying Mu Opioid Receptor Effects on Parallel Fiber-Purkinje Cell Synaptic Transmission in Mouse Cerebellar Cortex. Front. Synaptic Neurosci. 2022, 14, 862704. [Google Scholar] [CrossRef]
- Bai, J.; Ye, T.; Wei, Y.-B.; Yang, Y.; Yang, H.-M.; Lan, Y. Opioid receptors modulate parallel fiber-Purkinje cell synaptic transmission in mouse cerebellum. Neurosci. Lett. 2021, 770, 136356. [Google Scholar] [CrossRef]
- Hoxha, E.; Tempia, F.; Lippiello, P.; Miniaci, M.C. Modulation, Plasticity and Pathophysiology of the Parallel Fiber-Purkinje Cell Synapse. Front. Synaptic Neurosci. 2016, 8, 35. [Google Scholar] [CrossRef] [PubMed]
- Robinson, K.J.; Watchon, M.; Laird, A.S. Aberrant Cerebellar Circuitry in the Spinocerebellar Ataxias. Front. Neurosci. 2020, 14, 707. [Google Scholar] [CrossRef] [PubMed]
- Xi, L.; Peng, M.; Liu, S.; Liu, Y.; Wan, X.; Hou, Y.; Qin, Y.; Yang, L.; Chen, S.; Zeng, H.; et al. Hypoxia-stimulated ATM activation regulates autophagy-associated exosome release from cancer-associated fibroblasts to promote cancer cell invasion. J. Extracell. Vesicles 2021, 10, e12146. [Google Scholar] [CrossRef]
- Koneru, B.; Farooqi, A.; Nguyen, T.H.; Chen, W.H.; Hindle, A.; Eslinger, C.; Makena, M.R.; Burrow, T.A.; Wilson, J.; Smith, A.; et al. ALT neuroblastoma chemoresistance due to telomere dysfunction–induced ATM activation is reversible with ATM inhibitor AZD0156. Sci. Transl. Med. 2021, 13. [Google Scholar] [CrossRef] [PubMed]
- Piacentini, M.; Piredda, L.; Starace, D.; Annicchiarico-Petruzzelli, M.; Mattei, M.; Oliverio, S.; Farrace, M.G.; Melino, G. DIFFERENTIAL GROWTH OF N- AND S-TYPE HUMAN NEUROBLASTOMA CELLS XENOGRAFTED INTO SCID MICE. CORRELATION WITH APOPTOSIS. J. Pathol. 1996, 180, 415–422. [Google Scholar] [CrossRef]
- Bell, N.; Hann, V.; Redfern, C.P.; Cheek, T.R. Store-operated Ca2+ entry in proliferating and retinoic acid-differentiated N- and S-type neuroblastoma cells. Biochim. et Biophys. Acta (BBA) - Mol. Cell Res. 2013, 1833, 643–651. [Google Scholar] [CrossRef] [PubMed]
- Walton, J.D.; Kattan, D.R.; Thomas, S.K.; Spengler, B.A.; Guo, H.-F.; Biedler, J.L.; Cheung, N.-K.V.; Ross, R.A. Characteristics of Stem Cells from Human Neuroblastoma Cell Lines and in Tumors. Neoplasia 2004, 6, 838–845. [Google Scholar] [CrossRef]
- Kovalevich, J.; Langford, D. Considerations for the use of SH-SY5Y neuroblastoma cells in neurobiology. Methods Mol. Biol. 2013, 1078, 9–21. [Google Scholar] [CrossRef]
- Fernandes, N.D.; Sun, Y.; Price, B.D. Activation of the Kinase Activity of ATM by Retinoic Acid Is Required for CREB-dependent Differentiation of Neuroblastoma Cells. J. Biol. Chem. 2007, 282, 16577–16584. [Google Scholar] [CrossRef]
- Wen, Z., et al., Up-regulated NRIP2 in colorectal cancer initiating cells modulates the Wnt pathway by targeting RORbeta. Mol Cancer, 2017. 16(1): p. 20.
- Gudas, L.J.; Wagner, J.A. Retinoids regulate stem cell differentiation. J. Cell. Physiol. 2010, 226, 322–330. [Google Scholar] [CrossRef]
- Kim, T.-S.; Kawaguchi, M.; Suzuki, M.; Jung, C.-G.; Asai, K.; Shibamoto, Y.; Lavin, M.F.; Khanna, K.K.; Miura, Y. The ZFHX3 (ATBF1) transcription factor induces PDGFRB, which activates ATM in the cytoplasm to protect cerebellar neurons from oxidative stress. Dis. Model. Mech. 2010, 3, 752–762. [Google Scholar] [CrossRef]
- Yamada, N.; Makino, Y.; A Clark, R.; Pearson, D.W.; Mattei, M.G.; Guénet, J.L.; Ohama, E.; Fujino, I.; Miyawaki, A.; Furuichi, T.; et al. Human inositol 1,4,5-trisphosphate type-1 receptor, InsP3R1: structure, function, regulation of expression and chromosomal localization. Biochem. J. 1994, 302, 781–790. [Google Scholar] [CrossRef] [PubMed]
- Takeo, Y.H.; Kakegawa, W.; Miura, E.; Yuzaki, M. ROR Regulates Multiple Aspects of Dendrite Development in Cerebellar Purkinje Cells In Vivo. J. Neurosci. 2015, 35, 12518–12534. [Google Scholar] [CrossRef] [PubMed]
- Dar, I.; Biton, S.; Shiloh, Y.; Barzilai, A. Analysis of the Ataxia Telangiectasia Mutated-Mediated DNA Damage Response in Murine Cerebellar Neurons. J. Neurosci. 2006, 26, 7767–7774. [Google Scholar] [CrossRef] [PubMed]
- Gorodetsky, E.; Calkins, S.; Ahn, J.; Brooks, P. ATM, the Mre11/Rad50/Nbs1 complex, and topoisomerase I are concentrated in the nucleus of Purkinje neurons in the juvenile human brain. DNA Repair 2007, 6, 1698–1707. [Google Scholar] [CrossRef]
- Hotokezaka, Y.; Katayama, I.; Nakamura, T. ATM-associated signalling triggers the unfolded protein response and cell death in response to stress. Commun. Biol. 2020, 3, 1–11. [Google Scholar] [CrossRef]
- Novak, M.J., et al., An ITPR1 gene deletion causes spinocerebellar ataxia 15/16: a genetic, clinical and radiological description. Mov Disord, 2010. 25(13): p. 2176-82.
- Synofzik, M.; Helbig, K.L.; Harmuth, F.; Deconinck, T.; Tanpaiboon, P.; Sun, B.; Guo, W.; Wang, R.; Palmaer, E.; Tang, S.; et al. De novo ITPR1 variants are a recurrent cause of early-onset ataxia, acting via loss of channel function. Eur. J. Hum. Genet. 2018, 26, 1623–1634. [Google Scholar] [CrossRef]
- Yang, A.W.; Sachs, A.J.; Nystuen, A.M. Deletion of Inpp5a causes ataxia and cerebellar degeneration in mice. neurogenetics 2015, 16, 277–285. [Google Scholar] [CrossRef]
- Paternoster, L.; Soblet, J.; Aeby, A.; De Tiège, X.; Goldman, S.; Yue, W.W.; Coppens, S.; Smits, G.; Vilain, C.; Deconinck, N. Novel homozygous variant of carbonic anhydrase 8 gene expanding the phenotype of cerebellar ataxia, mental retardation, and disequilibrium syndrome subtype 3. Am. J. Med Genet. Part A 2020, 182, 2685–2693. [Google Scholar] [CrossRef] [PubMed]
- Türkmen, S.; Guo, G.; Garshasbi, M.; Hoffmann, K.; Alshalah, A.J.; Mischung, C.; Kuss, A.; Humphrey, N.; Mundlos, S.; Robinson, P.N. CA8 Mutations Cause a Novel Syndrome Characterized by Ataxia and Mild Mental Retardation with Predisposition to Quadrupedal Gait. PLOS Genet. 2009, 5, e1000487. [Google Scholar] [CrossRef] [PubMed]
- Madsen, P.; Isaksen, T.J.; Siupka, P.; Tóth, A.E.; Nyegaard, M.; Gustafsen, C.; Nielsen, M.S. HSPA12A targets the cytoplasmic domain and affects the trafficking of the Amyloid Precursor Protein receptor SorLA. Sci. Rep. 2019, 9, 1–13. [Google Scholar] [CrossRef]
- Glerup, S., et al., SorLA controls neurotrophic activity by sorting of GDNF and its receptors GFRalpha1 and RET. Cell Rep, 2013. 3(1): p. 186-99.
- Zhang, J.; Liu, S.; Li, Q.; Shi, Y.; Wu, Y.; Liu, F.; Wang, S.; Zaky, M.Y.; Yousuf, W.; Sun, Q.; et al. The deubiquitylase USP2 maintains ErbB2 abundance via counteracting endocytic degradation and represents a therapeutic target in ErbB2-positive breast cancer. Cell Death Differ. 2020, 27, 2710–2725. [Google Scholar] [CrossRef]
- Pietilä, M.; Sahgal, P.; Peuhu, E.; Jäntti, N.Z.; Paatero, I.; Närvä, E.; Al-Akhrass, H.; Lilja, J.; Georgiadou, M.; Andersen, O.M.; et al. SORLA regulates endosomal trafficking and oncogenic fitness of HER2. Nat. Commun. 2019, 10, 1–16. [Google Scholar] [CrossRef]
- Tao, Y., et al., Erbin interacts with TARP gamma-2 for surface expression of AMPA receptors in cortical interneurons. Nat Neurosci, 2013. 16(3): p. 290-9.
Disclaimer/Publisher’s Note: The statements, opinions and data contained in all publications are solely those of the individual author(s) and contributor(s) and not of MDPI and/or the editor(s). MDPI and/or the editor(s) disclaim responsibility for any injury to people or property resulting from any ideas, methods, instructions or products referred to in the content. |
© 2023 by the authors. Licensee MDPI, Basel, Switzerland. This article is an open access article distributed under the terms and conditions of the Creative Commons Attribution (CC BY) license (http://creativecommons.org/licenses/by/4.0/).
Copyright: This open access article is published under a Creative Commons CC BY 4.0 license, which permit the free download, distribution, and reuse, provided that the author and preprint are cited in any reuse.


