
Submitted:
16 September 2023
Posted:
18 September 2023
You are already at the latest version
Abstract
HSF1 is a well-known Heat Shock Protein expression regulator in response to stress. It also regulates processes important for growth, development, or tumorigenesis. Here, we studied the HSF1 influence on the phenotype of non-tumorigenic human mammary epithelial (MCF10A and MCF12A) and several triple-negative breast cancer cell lines. MCF10A and MCF12A differ by HSF1 levels, morphology, growth in the matrigel, expression of epithelial (CDH1) and mesenchymal (VIM) markers (MCF10A are epithelial cells, MCF12A resemble mesenchymal cells). HSF1 down-regulation led to reduced proliferation rate and spheroid formation in matrigel by MCF10A cells, while it did not affect the MCF12A proliferation but led to CDH1 up-regulation and the formation of better-organized spheroids. HSF1 overexpression in MCF10A resulted in reduced CDH1 and increased VIM expression, and the acquisition of elongated fibroblast-like morphology. The above results suggest that elevated levels of HSF1 may direct mammary epithelial cells toward a mesenchymal phenotype while lowering HSF1 could reverse the mesenchymal phenotype to an epithelial one. Therefore, HSF1 may be involved in the remodeling of mammary gland architecture over the female lifetime. Moreover, HSF1 levels positively correlated with the invasive phenotype of triple-negative breast cancer cells, and their growth was inhibited by the HSF1 inhibitor, DTHIB.
Keywords:
epithelial-to-mesenchymal transition
; heat shock transcription factor 1
; HSF1 inhibitor
; human mammary epithelial cells
1. Introduction
The epithelium, one of the four main tissue types in the human body, is formed of cells that are closely bound to each other to ensure the mechanistic integrity of the tissues and the permeability barrier. It usually lines the outer surfaces of organs and blood vessels, the inner surfaces of cavities, and also covers the outer surface of the human body (skin). Nevertheless, during development (e.g., embryogenesis) epithelial cells may give rise to mesodermal tissue (among others, mesenchyme), which involves profound modification of epithelial cell phenotypes exhibited by changes in their shape and polarity, delamination, and migration, characteristic of mesenchymal cells. This transition between epithelial and mesenchymal states is known as epithelial-to-mesenchymal (EMT) and plays an essential role in morphogenesis during embryogenesis, wound healing, cancer progression, and metastasis formation [1].
The EMT plays an important role in breast development. The mammary gland (breast) undergoes dynamic changes in tissue architecture and function over the female lifetime. It is composed of branching epithelial ducts embedded within a stromal fat, comprising adipocytes, fibroblasts, lymphatic cells, and vascular cells, whose interactions ensure proper organ functioning. The mammary ductal epithelium is a bilayered structure, which includes two types of cells: luminal and basal/myoepithelial cells. The luminal cells are polarized, cuboid in shape, and surround a lumen. They can differentiate into either ductal cells or milk-producing cells. The basal/myoepithelial cells are spindle-shaped and located in a basal position adjacent to the basement membrane. Furthermore, there is evidence of a mammary epithelial cell hierarchy, where bi-potent or multipotent stem cells give rise to more differentiated cell progenitors, essential for breast growth and development throughout a woman’s life [2,3]. The major developmental changes within the mammary gland occur postnatally and begin in puberty. At this stage, the branched epithelial network of the ducts is formed and the appearance of motile cells harboring EMT features is correlated with tube elongation [4]. EMT is also observed in many models of breast cancer. This so-called oncogenic EMT is associated with pro-metastatic characteristics, such as increased motility, invasiveness, anoikis resistance, and evasion of the immune system. Additionally, the acquisition of cancer stem cell-like properties can be linked with EMT and is associated with therapeutic resistance [5,6].
Down-regulation of E-cadherin (CDH1) is a hallmark of EMT. This is associated with the destabilization of adherens junctions and diffused cytoplasmic and nuclear localization of β-catenin that promotes the expression of mesenchymal proteins such as N-cadherin, vimentin, and fibronectin. This process is orchestrated by complex regulatory networks involving transcriptional control with SNAI1 and SNAI2, ZEB1 and ZEB2, Twist among transcriptional factors, non-coding RNAs, chromatin remodeling, and epigenetic modification [7].
Several data indicate that Heat Shock Factor 1 (HSF1), a well-known regulator of stress response, can promote TGFβ-induced EMT in the ovarian cancer model [8] or in the breast cancer model [9,10]. HSF1 is a ubiquitously expressed transcription factor. It mainly regulates the expression of stress-inducible Heat Shock Proteins (HSPs), which function as molecular chaperones assisting protein folding. In mammals, HSF1 deficiency leads to dysregulation of many physiological functions (e.g., thermotolerance, systemic body temperature regulation, redox homeostasis, antioxidative defenses, immune response, motor activity, smell, hearing, memory, and others), also related to gametogenesis and reproduction [11,12,13]. HSF1 also plays an important role in cancerogenesis [14]. It can support tumor initiation and growth, as well as metastasis formation and angiogenesis [15]. Although many functions of HSF1 in the regulation of acute stress response are established, several questions regarding HSF1 activity during development remain unresolved.
Here, our objective was to investigate the function of HSF1 in modulating the plasticity of human mammary epithelial cells, and we demonstrated that HSF1 can affect the intrinsic ability of these cells to acquire mesenchymal characteristics. Furthermore, we analyzed the effect of HSF1 on the phenotype of triple-negative breast cancer cells and found that increasing HSF1 levels positively correlated with the acquisition of an invasive phenotype in matrigel.
2. Materials and Methods
Cell culture and treatment. Non-tumorigenic human breast epithelial cell lines, MCF10A (authenticated in 2016) and MCF12A (ATCC, Manassas, VA, USA) were cultured in DMEM/F12 medium supplemented with 5% horse serum (BioWest, Nuaillé, France), 5 µg/ml insulin (Sigma-Aldrich, Saint Louis, MO, USA), 0.5 µg/ml hydrocortisone (Sigma-Aldrich), 20 ng/ml EGF (Sigma-Aldrich). Breast cancer MDA-MB-468, BT-549, and HCC1395 cells were cultured in RPMI-1640 medium supplemented with 10% Fetal Bovine Serum (EURx, Gdansk, Poland). MDA-MB-231 and CAL120 breast cancer cells were cultured in high glucose DMEM medium supplemented with 10% FBS (EURx). Cells were routinely tested for mycoplasma contamination. Heat shock was carried out by placing plates with logarithmically growing cells in a water bath at a temperature of 43°C for 1 hour. Subsequently, cells were allowed to recover for the indicated time in a CO2 incubator at 37°C. DTHIB at indicated concentration was added 48 hours before heat shock.
HSF1 down-regulation using shRNA. The shRNA target sequences for human HSF1 (NM_005526.4) were selected as described in [16,17]. MCF10A and MCF12A cells were transduced with lentiviruses and selected using a medium supplemented with 1 μg/ml puromycin (Life Technologies/Thermo Fisher Scientific, Waltham, MA, USA) as described in [17]. Control sh.CTRL cell lines were generated by subsequent transductions of MCF10A cells with pLVX-shRNA1 vectors encoding the shRNA-SCR sequence (5’CCT AAG GTT AAG TCG CCC TCG-3’) or MCF12A cells with pLVX-shRNA1 vectors encoding shRNA-LUC sequence (5’GTG CGT TGC TAG TAC CAAC-3’ [18].
HSF1 overexpression. Human HSF1 coding sequence was amplified by PCR on the template of the hHSF1-pLNCX2 vector [16]. The sequence recognized by the EcoRI restriction enzyme was introduced into the primers. The HSF1 cDNA fragment was inserted into the pLVX-Puro plasmid (Clontech/Takara Bio, Mountain View, CA, USA) using the In-Fusion® HD Cloning Kit (Clontech/Takara Bio). Infectious lentiviruses were generated by transfection of DNA into HEK293T cells, and virus-containing supernatants were collected. MCF10A or MDA-MB-468 cells were transduced with lentiviruses containing HSF1 cDNA (HSF1-pLVX) or the empty vector (pLVX) and selected using a medium supplemented with 1 μg/ml puromycin (Life Technologies).
Cell proliferation. Cells (MCF10A - 1.5x10⁴ per well, MCF12A - 2x10⁴ per well) were seeded and cultured in 12-well plates. At the indicated time, cells were washed with PBS, fixed in cold methanol, and rinsed with distilled water. Cells were stained with 0.2% crystal violet for 30 min, rinsed extensively with distilled water, and dried. The cell-associated dye was extracted with 2 ml of 10% acetic acid. Aliquots (200 μl) were transferred to a 96-well plate and the absorbance was measured at 595 nm (Synergy2 microtiter plate reader, BioTek Instruments, Winooski, VT, USA ). The grow curves are shown as the absorbance ratio on days 1, 2, and 3 versus day 0 and were calculated from three to six independent experiments, each in 2-3 technical replicates.
Ki-67 staining. MCF10A cells (5x10⁴) were seeded in poly-L-lysine (Sigma-Aldrich) coated 4-well glass slides Nunc Lab-Tek II chambered coverglass (Nalge Nunc International, Rochester, NY, USA). Two days later, cells were washed with phosphate-buffered solution (PBS) and fixed with 4% paraformaldehyde for 15 min at room temperature. The cells were then washed with PBS, permeabilized with 0.1% Triton X-100 for 5 min at room temperature, washed, and blocked with 2.5% normal goat serum (Abcam, Cambridge, Great Britain). Cells were incubated with mouse monoclonal antibody against Ki-67 (1:100, MAB4190, Millipore, Burlington, MA, USA) at 4°C overnight. Primary antibody was detected using an anti-mouse secondary antibody conjugated with AlexaFluor594 (1:200, ab150116, Abcam). Cells were counterstained using DAPI (Sigma-Aldrich) and mounted. Images were taken using a Carl Zeiss (Jena, Germany) LSM 710 confocal microscope with ZEN navigation software. The experiments were performed in triplicate. Cells were counted in 10 randomly selected fields for each replicate. The Ki67 index was represented as a ratio of Ki67 positive cells to the overall number.
Senescence-associated β-galactosidase (SA-β-gal) assay. MCF10A cells (5x10⁴) were seeded in poly-L-lysine-coated 4-well slides (Nalge Nunc International). Two days later, cells were washed and fixed with paraformaldehyde and glutaraldehyde. Cells were washed twice with PBS and incubated at 37°C for 16 hours with a staining solution containing 40 nM citric acid/sodium phosphate (pH 6.0), 150 mM NaCl, 2 mM MgCl2, 1 mg/ml X-gal, 5 mM potassium ferrocyanide and 5 mM potassium ferricyanide. Cells were observed under a ZEISS AXIOPHOT microscope with ZEN navigation software.
Protein extraction and Western blotting. Whole-cell extracts and Western blot analysis were performed as described in [17]. Primary antibodies against HSF1 (1:4,000, rabbit polyclonal, ADI-SPA-901, Enzo Life Sciences, Farmingdale, NY, USA), HSPA1 (1:10,000, mouse monoclonal, ADI-SPA-810, Enzo Life Sciences), ACTB (1:25,000, #A3854, Merck KGaA), HSPA8/HSC70 (1:5,000, #sc-7298, Santa Cruz Biotechnology, Dallas, TX) and antibodies from the EMT Antibody Sampler Kit (1:1,000, #9782, Cell Signaling Technology, Danvers, MA, USA) were used. The primary antibody was detected by an appropriate secondary antibody conjugated with horseradish peroxidase (Thermo Fisher Scientific) and visualized by an ECL kit (Thermo Fisher Scientific).
3D overlay culture and spheroid staining. Cells were cultured in matrigel as previously reported [19]. Eight-well chamber slides (Nalge Nunc International) cells were covered with Growth Factor-Reduced Matrigel (354230, Corning, NY, USA) and allowed to solidify in a CO2 incubator for 15 min. Meanwhile, cells were trypsinized, counted, and diluted in DMEM/F12 culture medium containing 2% horse serum (BioWest, Nuaillé, France), 0.5 mg/ml hydrocortisone (Sigma-Aldrich), 10 µg/ml insulin, 5 ng/ml EGF (Sigma-Aldrich) and 2% matrigel. Cells (5x10³) were overlayed on top of the solidified matrigel and allowed to grow for 14 days (unless otherwise indicated). Spheroids were observed under the Axiovert 40 CFL microscope (Carl Zeiss) and pictures were taken. The spheroid perimeter was measured using ImageJ software. The radius of a sphere has been calculated as r=C/2π (C-perimeter) and the spheroid volume was calculated as V=3/4*π*r3. Spheroids formed by MCF12A cell variants were counted in 10 random fields and their morphology was distinguished into round (oval, regular shape), disruptive (oval, irregular shape, bulgy shape), and multi-acinar (berry-shaped; multiple lobules) as described in [20]. Cells were fixed with 4% paraformaldehyde, permeabilized with 0.5% Triton X-100 for 10 min at room temperature, washed with PBS containing 100 mM glycine, and blocked using 10% normal goat serum (Abcam) in buffer containing 0.1% bovine serum albumin (BSA, Sigma-Aldrich), 0.2% Triton X-100 and 0.05% Tween-20 for 1 hour at room temperature. Cells were incubated with rat monoclonal antibody against ITGA6 (1:50, MAB13501, R&D Systems, MN, USA) or rabbit monoclonal antibody against CDH1 (1:100, #3195, Cell Signaling Technology) at 4°C overnight. The primary antibody was detected using an anti-rat secondary antibody conjugated with AlexaFluor488 (1:200, Invitrogen, Waltham, MA, USA) or an anti-rabbit secondary antibody conjugated with AlexaFluor 488 (1:200, ab150077, Abcam). Cells were counterstained with TRITC-labelled phalloidin (Sigma-Aldrich) to visualize F-actin and DAPI (Sigma-Aldrich), and mounted. Images were taken using a Carl Zeiss LSM 710 confocal microscope with ZEN navigation software.
Global Gene Expression Profiling. Total RNA was isolated using the Direct-ZolTM RNA MiniPrep Kit (Zymo Research, Irvine, CA, USA) and digested with DNase I (Worthington Biochemical Corporation, Lakewood, NJ, USA). The cDNA libraries were sequenced by Illumina HighSeq 1500 (run type: paired-end, read length: 2 × 76 bp). Raw RNA-Seq reads were aligned to human genome hg38 in a Bash environment using hisat2 v 2.0.5. [21] with Ensembl genes transcriptome reference. Aligned files were processed using Samtools (v. 1.13) [22]. Furthermore, reads aligned in the coding regions of the genome were counted using FeatureCounts (v. 1.6.5) [23]. Finally, read counts were normalized using DESeq2 (v. 1.32.0) [24], then normalized expression values were subject to differential analysis (mean-based fold change) in the R/Bioconductor programming environment. Changes (MCF10A HSF1-pLVX versus MCF10A wild type) were considered significant if the signal ratios were >2.0 or <0.50 in both biological replicates. Raw RNA-seq data were deposited in the NCBI GEO database; acc. no. GSE241795. Enrichment analyzes of gene sets were performed in PANTHER Pathways using the PANTHER Overrepresentation Test, version 17.0 [25].
Boyden chamber assay. Transwell chambers (with 8-µm pore size membrane, Becton Dickinson, Franklin Lakes, NJ, USA) were coated with fibronectin (10 µg/ml, Becton Dickinson). Cells were harvested by trypsinization and suspended in a serum-free Hepes-buffered medium containing 0.1% BSA, seeded at the top of the chambers, and placed in wells containing culture medium supplemented with 10% fetal bovine serum. After incubation (MCF10A cells for 4 hours, breast cancer cells for 6 hours) at 37°C, cells were washed with PBS, fixed with methanol, and stained with 0.2% crystal violet solution. The cells on the upper surface of the inserts were removed by cotton swabs. Migrated cells were counted under a microscope in five random fields. All experiments were performed at least three times.
Flow cytometry. Cells were harvested by trypsinization and counted, and 5x10⁵ cells were used for staining. Cells were washed twice with PBS, suspended in the Flow Cytometry Buffer, and incubated with APC-conjugated antibody against EPCAM (BioLegend, San Diego, CA, USA, 5 µl/1x106 cells) and PE-conjugated antibody against ITGA6 (BioLegend, 5 µl/1x106 cells) or PE-conjugated antibody against CD24 (clone ML5, 311106, BioLegend, 5 µl/1x106 cells) and FITC-conjugated antibody against CD44 (clone BJI18, 338804, BioLegend, 5 µl/1x106 cells) for 30 min at room temperature in the dark. Cells were suspended in PBS and analyzed by flow cytometry (BD FACS CantoTM).
Cell viability assay. BT-549 cells (2×10³/well) were seeded in 96-well plates. The next days, the medium was replaced with one containing DTHIB at a concentration ranging from 0 to 200 μM in DMSO (max. DMSO concentration <0.5%) and cells were incubated for 72 hours. Cell viability was determined using CellTiter 96 Aqueous One Solution reagents according to the manufacturer’s protocol (Promega, Madison, WI, USA). The absorbance of the formazan product was measured (λ = 490 nm) using a microplate reader. The experiment was carried out at least 3 times with three replications for each concentration of the compound tested. IC50 values were determined using the Quest Graph IC50 Calculator (AAT Bioquest, Inc, 28 September 2021, https://www. aatbio.com/ tools/ ic50-calculator) with the option ‘Set minimum response to zero’.
Statistical analyzes. For each dataset, the normality of the distribution was assessed using the Shapiro-Wilk test. Depending on data distribution, the homogeneity of variances was verified by the Levene test or Brown-Forsythe test. Outliers were determined using the Tuckey criterion and the QQ plot. For analysis of differences between compared groups with normal distribution, the quality of the mean values was verified by the ANOVA test with a pairwise comparison done with the HSD Tukey test or Games-Howell test depending on the homogeneity of variance. In the case of non-Gaussian distribution, the Kruskal–Wallis ANOVA was applied to verify the hypothesis on the equality of the medians with the Conover-Iman test or Dunn test for pairwise comparisons. P = 0.05 was selected as a statistical significance threshold.
3. Results
3.1. Down-regulation of HSF1 results in inhibition of MCF10A cell proliferation and alters the morphology of MCF12A cells in 2D and 3D cultures.
Several studies have shown higher expression of HSF1 in more malignant cells, which supports their growth [26,27]. We found that also non-tumorigenic cell lines, MCF10A and MCF12A, derived from breast tissue of patients with fibrocystic changes [28,29], both estrogen receptor-negative [30,31], differ in the level of HSF1, which is higher (about two-fold) in the MCF12A line (Figure 1a). Despite their similar origin, these two cell lines differ in the expression of EMT markers (Figure 1b). MCF12A cells show significantly lower expression of epithelial CDH1 (E-cadherin) and its binding partner CTNNB1 (β-catenin) than MCF10A cells, which correlates with a higher expression of SNAI2, a known CDH1 transcriptional repressor and regulator of the epithelial-mesenchymal transition. Moreover, MCF12A cells express mesenchymal VIM (vimentin), which is almost undetectable in MCF10A cells. These differences in the expression levels of EMT markers are reflected in cell morphology. In subconfluent and confluent 2D culture, MCF10A cells grow in clusters and exhibit cobblestone epithelial morphology, while MCF12A cells grow as a mixed population consisting of dispersed, spindle-shaped, or spheroid cells that surround small cell clusters (Figure 1c). In the matrigel, MCF10A cells form round spheroids with a well-polarized outer layer of cells (stained for ITGA6/α6-integrin/CD49f, a biomarker of basolateral polarity, which is localized to the basal cell membrane), while MCF12A cells, in addition to round spheroids, form disruptive acini characterized with an oval irregular and protruding shape or even multi-acinar spheroids with multiple lobules with incomplete basal polarity (Figure 1d). The above characterization of the two breast epithelial cell lines shows that, unlike MCF10A cells, MCF12A cells are more heterogeneous with some features of mesenchymal cells.
To study the effect of HSF1 on the phenotype of non-tumorigenic mammary epithelial cell lines, we first down-regulated HSF1 expression in MCF10A and MCF12A cells (Figure 2a). HSF1 silencing using specific shRNA resulted in decreased proliferation of MCF10A but not MCF12A cells (Figure 2b). The slowdown in the growth of MCF10A cells after HSF1 silencing correlated well with a reduction in the number of cells expressing Ki-
67 (a biomarker of proliferation) (Figure 2c). In addition, in this cell line variant, we noted a greater number of enlarged, flattened, and vacuolated cells exhibiting the senescence-associated β-galactosidase (β-gal) activity (Figure 2d). More importantly, HSF1-deficient MCF10A cells partially lost their ability to form spheroids in matrigel (and their volume was reduced; Figure 2e, f), probably due to a lower rate of proliferation. Nevertheless, the basal polarization (as confirmed by the ITGA6 staining) was the same regardless of the HSF1 level (Figure 2e), suggesting that acini polarization was not changed. In the case of MCF12A cells with reduced HSF1 expression, they began to form clusters in subconfluent 2D culture, which was not observed in cells with normal HSF1 levels (Figure 2g, upper panel). In the matrigel, a reduction in the number of disruptive or multi-acinar spheroids in favor of round spheroids was observed after HSF1 silencing (Figure 2g,h). Moreover, HSF1-deficient spheroids exhibited a better polarized outer layer of cells (stained for ITGA6) compared to spheroids with normal HSF1 levels, which were characterized by incomplete or lost basal polarity (Figure 2g). These results suggest that in cells with certain mesenchymal features (such as MCF12A), down-regulation of HSF1 can result in adopting epithelial morphology (observed in MCF10A cells). We hypothesized that HSF1 overexpression might have the opposite effect. Therefore, in the next step, we aimed to study the effect of HSF1 overexpression on the MCF10A cell phenotype.
3.2. HSF1 overexpression may promote the epithelial-mesenchymal transition of MCF10A cells in a mechanism that involves CDH1 down-regulation.
Stable HSF1 overexpression (Figure 3a) did not affect MCF10A cell proliferation (Figure 3b). However, we observed that MCF10A cells overexpressing HSF1 changed their appearance in 2D culture, partially acquiring fibroblast-like scattered morphology (typical of MCF12A) (Figure 3c). Also, spheroids in the matrigel were enlarged compared to the control ones (Figure 3c,d). Nevertheless, there was no change in the basal polarity as evidenced by ITGA6 staining (Figure 3c). Western blot analyses of EMT markers revealed that HSF1 overexpression in MCF10A cells correlated with decreased expression of CDH1 and increased expression of VIM (Figure 3a). RNA-seq analyses (Table S1) revealed that the cadherin signaling pathway (P00012) was also the most enriched in the set of genes down-regulated in these cells (Table 1). In addition to a decrease in CDH1 expression, RNA-seq analysis also showed reduced expression of CDH2 and 19 genes encoding protocadherins. Among the genes most severely affected in cells with HSF1 overexpression were many genes encoding cell adhesion or cytoskeleton-organizing proteins (e.g., GJA5, NID2, TUBA1A, MFAP5, TAGLN were inhibited, TTC25, CADM3, IQGAP2, SDK2, CEACAM6, FAT2 were upregulated; Table S1). On the other hand, the down-regulation of HSF1 in MCF12A cells was accompanied by increased CDH1 expression and a slight reduction in the SNAI2 level, while VIM and CTNNB1 levels were not changed (Figure 3a). We also found lower expression of CDH1, a cell-cell contact marker, in spheroids formed by MCF10A cells overexpressing HSF1. Moreover, even after 21 days of culture, they lacked a hollow lumen (such incomplete luminal development was considered a hallmark of a premalignant state; [32]). In contrast, control spheroids (wild-type or with empty vector) formed mature acini with a hollow lumen and well-distinguished CDH1 localization at cell-cell contacts (Figure 3e). In turn, MCF12A cells with reduced expression of HSF1 were characterized by a stronger expression of CDH1 in cell-cell contacts within formed acini compared to control cells (Figure 3f).
To determine whether the observed changes in EMT markers levels (resulting from HSF1 overexpression or down-regulation) translate into the ability of cells to migrate, we performed the Boyden chamber assay. The number of migrating cells increased in the MCF10A cell population overexpressing HSF1 (Figure 3g) but did not change after HSF1 silencing in MCF12A cells (not shown). Additionally, the time required to detach HSF1-overexpressing MCF10A cells with trypsin was shorter than that required to detach control cells. On the contrary, MCF12A cells with a reduced level of HSF1 needed more time to be detached than control cells (Figure 3h). These results indicate that the HSF1 level affects the adhesion of cells to the surface they grow on: the higher the level of HSF1, the weaker the adhesion of cells. HSF1 may affect some features associated with the plasticity of human mammary epithelial cells, especially its levels negatively correlate with CDH1 levels, which influence cellular interactions.
Acquisition of a mesenchymal-like phenotype via EMT in mammary epithelial cells and breast cancer cells has been proposed to generate stem cell features [33]. To characterize changes in mesenchymal phenotype and stem cell characteristics associated with HSF1 levels, we first assessed the differentiation status of MCF10A and MCF12A cell variants by flow cytometry analysis using EPCAM and ITGA6, as these two markers can identify the four distinct cell populations of the human normal mammary gland [34,35] (Figure 4a). These analyses confirmed that control (WT and expressing pLVX or shCTRL) MCF10A and MCF12A cells have different phenotypes: MCF10A were enriched in the luminal progenitors population positive for EPCAM and ITGA6 (EPCAMpos/ITGA6pos), while MCF12A cells exhibited the basal phenotype (EPCAMlow/ITGA6pos; Figure 4a). HSF1 overexpression in MCF10A cells was associated with a change in phenotype from luminal progenitors to basal-like (Figure 4a). On the other hand, the down-regulation of HSF1 in MCF12A cells (which initially were basal-like) led to the enrichment of the luminal progenitors’ subpopulation. Further analysis was directed to assess the CD44pos/CD24neg profile, which is associated with the population of stem cell-like or cancer stem cell features [36]. Unlike MCF10A cells, which are mainly CD44pos/CD24pos, MCF12A cells exhibit CD44pos/CD24neg phenotype (Figure 4b), which is associated with a mesenchymal phenotype. Increasing HSF1 levels in MCF10A cells led to the acquisition of the CD44pos/CD24neg subpopulation while decreasing HSF1 levels in MCF12A cells led to the enrichment of CD44low/CD24pos subpopulation (which is frequently associated with a terminally differentiated luminal phenotype; [37]) and decline in CD44pos/CD24low subpopulation. It indicates that the HSF1 level may positively correlate with the acquisition of a mesenchymal phenotype and stem cell-like characteristics in human mammary epithelial cells. By manipulating HSF1 levels, the phenotype of these cells can be altered.
3.3. Higher HSF1 levels in triple-negative breast cancer cells correlate with a more invasive phenotype.
Taking into account our observation that HSF1 may play a role in the EMT of human mammary epithelial cells, we examined the correlation between HSF1 levels and the phenotype of breast cancer cells. We used several breast cancer cell lines (MDA-MB-468, BT-549, MDA-MB-231, CAL120, and HCC1395) originating from patients with triple-negative breast cancer (TNBC; negative for estrogen and progesterone receptors and HER2). Additionally, all these cell lines are characterized by wild-type BRCA1 [38]. Among them, MDA-MB-468 cells showed the lowest HSF1 level, while HCC1395 cells had the highest (Figure 5a). Only MDA- MB468 cells expressed CDH1 (and lacked VIM and SNAI2) (Figure 5b) and showed CD44pos/CD24pos (epithelial-like) phenotype (Figure 5c). The other four cell lines lacked CDH1 expression, but expressed VIM and SNAI2 (Figure 5b) and were also characterized with a predominant CD44pos/CD24neg (mesenchymal) phenotype (Figure 5c). CTNNB1 and SNAI1 had a distinct expression in all cell lines tested (Figure 5b). The epithelial-like phenotype of MDA-MB-468 cells well correlated with the lowest ability to migrate in the transwell assay, while the highest ability was detected for BT549 cells (with the highest expression of VIM and SNAI2) (Figure 5b, d). Analyzing cell growth in matrigel, we found that two cell lines with the highest HSF1 levels (BT-549 and HCC1395), although they differed greatly in their ability to migrate, both exhibited a stellate (invasive) phenotype (Figure 5f). MDA-MB-468 cells, possessing the lowest HSF1 level and positive for CDH1 expression, showed the mass phenotype (less invasive). In general, the ability to migrate in the Boyden chamber correlated well with the levels of mesenchymal markers, while the transition from mass phenotype to the stellate phenotype correlated well with increasing HSF1 levels.
3.4. HSF1 may affect the invasive phenotype of triple-negative breast cancer cells.
To test whether HSF1 can change the phenotype of breast cancer cells from epithelial-like toward mesenchymal, we constructed MDA-MB-468 cells with HSF1 overexpression (Figure 6a). The expression of CDH1, CTNBB1, or SNAI1 and epithelial-like phenotype (CD44pos/CD24pos) did not change in these cells (Figure 6a,b). However, the number of migrating cells (Boyden assay) increased (Figure 6c), as well as these cells acquired a grape-like phenotype in matrigel (Figure 6d), indicating the progression of cancer cell phenotype toward a more invasive one. It is worth noting that although we did not observe changes in CDH1 expression in cells grown in 2D conditions, weaker CDH1 expression was observed in cell-cell contacts in spheroids formed by MDA-MB-468 cells overexpressing HSF1 (Figure 6e).
Next, to study the effect of HSF1 inhibition on the viability and phenotype of the most mobile and invasive TNBC cells (i.e., BT-549; see Figure 5d,e), we used DTHIB (Direct Targeted HSF1 InhiBitor; [39]). Treatment of BT-549 cells for 48 hours with DTHIB at a concentration below IC50 (which was set at 7.7; Figure 7a) led to a decrease in HSF1 levels (although these changes were not statistically significant; Figure 7b) with accompanying inhibition by about 20% of heat shock-induced HSPA1 expression (Figure 7c). Growth inhibition by DTHIB was more effective in matrigel than in 2D culture. At a concentration of 5 μM, no spheroids grew, while at a concentration of 2.5 μM (which did not affect growth in 2D culture), round, tight spheroids with a reduced elongated invasive body instead of stellate spheroids formed (Figure 7d). This suggests that DTHIB may be further tested in the treatment of TNBC.
4. Discussion
By studying the effect of HSF1 on the phenotype of non-tumorigenic mammary epithelial cells, we found that this factor can contribute to cell plasticity. By manipulating HSF1 levels in MCF10A and MCF12A cells used in our study, we showed that increased HSF1 levels correlate with the acquisition of mesenchymal cell characteristics while lowering HSF1 can reverse this process. HSF1 overexpression or inhibition also affects the phenotype of triple-negative cancer cells, mainly their invasiveness in 3D culture. HSF1 is a well-known regulator of the cell response induced by proteotoxic stress (i.e., heat shock, exposure to heavy metals, and others). Beyond, studies carried out on mice deficient in HSF1 revealed its role in different developmental processes associated with growth [40,41], fertility [42,43], immune response, and inflammation [44,45]. Lack of HSF1 also makes mice partially resistant to neoplastic transformation, for example, driven by mutated HRAS (V12D) [14] or ERBB2 overexpression [10]. Delay in ERBB2/NEU (HER2)-induced breast tumor growth in Hsf1-/- mice may result from inhibited cell proliferation of mammary epithelial cells [10]. We also observed that a decrease in HSF1 levels inhibited the proliferation of MCF10A cells. However, the influence of HSF1 on cell plasticity highlights its role in breast morphogenesis and cancer development. High HSF1 levels observed in MCF12A cells correlated with an increased number of multi-acinar structures with an incomplete basement membrane formed in the matrigel. Such multi-acinar structures recapitulate some aspects of breast tissue hyperplasia [32,46]. Therefore, elevated HSF1 levels are likely relevant to the hyperplastic changes in the breast.
We showed that the mesenchymal phenotype resulting from HSF1 overexpression in human mammary epithelial cells is associated with enhanced migratory capacity, expression of vimentin and down-regulation of CDH1, and enrichment of the population of invasive mesenchymal CD44high/CD24neg cells. Down-regulation of CDH1 is assumed to be the main signal initiating EMT. Its expression is repressed by several transcription factors, such as TWIST, SNAI1, SNAI2, E12/E47, and SIP1. Another mechanism can involve epigenetic mechanisms [47]. We assume that HSF1 can be directly involved in the CDH1 gene regulation since its promoter contains the HSF1 consensus binding site. However, HSF1 bound in the promoter has been shown to have an activating rather than a repressive function [45]. Therefore, we assume that HSF1-dependent inhibition may occur at the chromatin level, especially since it was demonstrated that HSF1 can participate in chromatin organization [17,45]. Importantly, HSF1 was shown to interact with MTA1 [48], a component of the NuRD complex known to repress CDH1 expression [47]. Nevertheless, the mechanism of CDH1 expression inhibition by HSF1 requires further studies.
The result of EMT is an increase in the phenotypic and functional cell diversity in the breast. It was shown that the acquisition of mesenchymal phenotypes via EMT is accompanied by stem cell-like characteristics with CD44pos/CD24neg or EPCAMneg/ITGA6high phenotype [49,50]. The CD44pos/CD24neg mesenchymal-like phenotype is also characteristic of cancer stem cells and is associated with invasive features of breast cancer malignancy. Similar gene expression profiles of CD44pos/CD24neg cells from normal breast and breast tumors [51] indicate that branching in breast morphogenesis and invasion events in breast cancer progression may involve similar signaling pathways. Our data indicate that HSF1 may be involved in the molecular pathways that link EMT to the acquisition of stem cell properties. The supportive role of HSF1 for the cancer stem cell (or stem cell-like) phenotype was already demonstrated in breast cancer [52], melanoma [16], gynecological cancer [53], or acute myeloid leukemia [54]. Additionally, several experimental models have demonstrated that a high level of HSF1 was required for EMT associated with the invasion and migration of human pancreatic cancer cells [55] or hepatocellular carcinoma cells [56]. Surprisingly, in our model, the increase in HSF1 expression did not affect the stem cell-like characteristics of MD-MB-468 breast cancer cells (which exhibit CD44pos/CD24pos) but facilitated their migration and growth in the matrigel. This shows that high levels of HSF1 can regulate several steps of the invasion cascade in cancer cells, which is not necessarily linked to the acquisition of CD44pos/CD24neg phenotype. Many experimental data indicate that HSF1 is indispensable for cancer cell migration and invasion, which plays an important role in cancer progression [55,57,58,59]. Importantly, we observed that inhibition of HSF1 using its specific inhibitor, DTHIB [39], reduced the proliferation of highly invasive BT-549 cells and their ability to invade the matrigel.
The important issue that remains unresolved is the regulation of HSF1 levels in cells. Analyses of HSF1 levels in murine tissues revealed high expression in the testes and weaker in the brain, ovary, heart, lung, and spleen [60]. According to the Human Protein Atlas portal (proteinatlas.org), there is also variation in HSF1 levels in human tissues, with high expression in some regions of the brain, lung, testes, and breast (and others) and lower expression in the liver and soft tissues. Early reports showed that human HSF1 is constitutively transcribed under non-shock conditions, and the level of mRNA did not change in heat-shocked HeLa cells compared to control ones [61]. Later data demonstrated increased levels of HSF1 mRNA in many cancer types [27,62] suggesting regulation of HSF1 expression at the transcription/promoter level. NOTCH binding to the HSF1 promoter was demonstrated in samples from patients with acute T cell lymphoblastic leukemia (T-ALL), resulting in increased expression of HSF1 and its downstream effectors with subsequent activation of the cellular stress response machinery [63]. Additionally, five transcription factors such as c-MYC, MXI1, MAX1, TAF1, and YY1, were found to bind around the transcription start site of the HSF1 gene [64]. In particular, the c-MYC oncogene could be responsible for higher levels of HSF1 expression in tumors (according to the Human Protein Atlas, the expression levels of both genes in tumors correlate well with each other). However, HSF1 activation appears to be primarily regulated at the protein level [64,65]. HSF1 is a long-lived protein with a half-life of approximately 14-20 hours, which allows it to exert an immediate cytoprotective effect [66]. The regulation of its activity is complex, can be cell-type specific, and is not yet fully understood. It is possible that changes in HSF1 levels in mammary epithelial cells can promote gland differentiation during pregnancy and lactation. This may be one of the signaling mechanisms that regulate the continued plasticity of the mammary epithelium, but cancer cells may exploit or corrupt it to support aberrant growth and progression toward invasion.
5. Conclusions
Heat Shock Factor 1 is a well-known regulator of cell response to environmental stress. We found that an increase in its expression may affect the intrinsic ability of human mammary epithelial cells to acquire mesenchymal characteristics. Elevated levels of HSF1 also positively correlate with invasive characteristics of triple-negative breast cancer cells. The use of DTHIB, a low-molecular-weight HSF1 inhibitor, significantly inhibits the growth of the highly-invasive BT549 cell line in standard culture or Matrigel. We postulate that this inhibitor can be tested for further treatment of patients with TNBC.
Supplementary Materials
The following supporting information can be downloaded at the website of this paper posted on Preprints.org, Table S1: List of genes identified in RNA-Seq as up-regulated and down-regulated (at least 2-fold) in MCF10A cells overexpressing HSF1 in relation to wild-type cells. Normalized expression values and fold changes are shown. Excel document.
Author Contributions
Conceptualization, NV and WW; Data curation, TS; Formal analysis, AT-J and TS; Funding acquisition, NV; Investigation, NV, AT-J, PJ, KM and MO; Methodology, NV, AT-J, PJ, KM, MG-K and DRS; Project administration, NV; Visualization, NV and WW; Writing – original draft, NV and WW; Writing – review & editing, NV and WW. All authors have read and agreed to the published version of the manuscript.
Funding
This research was funded by the National Science Centre, Poland, grant number 2021/43/B/NZ5/01850.
Institutional Review Board Statement
Not applicable.
Informed Consent Statement
Not applicable.
Data Availability Statement
The data presented in this study are openly available in the NCBI GEO database: acc. no. GSE241795.
Acknowledgments
We thank Mrs. Krystyna Klyszcz for her skillful technical assistance, Dr. Bartosz Wojtaś and Dr. Bartłomiej Gielniewski for help in RNA sequencing, and Ryszard Smolarczyk for microscopic assistance.
Conflicts of Interest
The authors declare no conflict of interest. The funders had no role in the design of the study; in the collection, analyses, or interpretation of data; in the writing of the manuscript; or in the decision to publish the results.
References
- Voulgari, A.; Pintzas, A. Epithelial-Mesenchymal Transition in Cancer Metastasis: Mechanisms, Markers and Strategies to Overcome Drug Resistance in the Clinic. Biochim. Biophys. Acta 2009, 1796, 75–90. [Google Scholar] [CrossRef] [PubMed]
- Phillips, S.; Kuperwasser, C. SLUG: Critical Regulator of Epithelial Cell Identity in Breast Development and Cancer. Cell Adhes. Migr. 2014, 8, 578–587. [Google Scholar] [CrossRef] [PubMed]
- Visvader, J.E. Keeping Abreast of the Mammary Epithelial Hierarchy and Breast Tumorigenesis. Genes Dev. 2009, 23, 2563–2577. [Google Scholar] [CrossRef] [PubMed]
- Githaka, J.M.; Pirayeshfard, L.; Goping, I.S. Cancer Invasion and Metastasis: Insights from Murine Pubertal Mammary Gland Morphogenesis. Biochim. Biophys. Acta Gen. Subj. 2023, 1867, 130375. [Google Scholar] [CrossRef] [PubMed]
- Fedele, M.; Cerchia, L.; Chiappetta, G. The Epithelial-to-Mesenchymal Transition in Breast Cancer: Focus on Basal-Like Carcinomas. Cancers 2017, 9, 134. [Google Scholar] [CrossRef] [PubMed]
- Drasin, D.J.; Robin, T.P.; Ford, H.L. Breast Cancer Epithelial-to-Mesenchymal Transition: Examining the Functional Consequences of Plasticity. Breast Cancer Res. 2011, 13, 226. [Google Scholar] [CrossRef]
- Roche, J. The Epithelial-to-Mesenchymal Transition in Cancer. Cancers 2018, 10, 52. [Google Scholar] [CrossRef]
- Powell, C.D.; Paullin, T.R.; Aoisa, C.; Menzie, C.J.; Ubaldini, A.; Westerheide, S.D. The Heat Shock Transcription Factor HSF1 Induces Ovarian Cancer Epithelial-Mesenchymal Transition in a 3D Spheroid Growth Model. PLoS ONE 2016, 11, e0168389. [Google Scholar] [CrossRef]
- Carpenter, R.L.; Paw, I.; Dewhirst, M.W.; Lo, H.-W. Akt Phosphorylates and Activates HSF-1 Independent of Heat Shock, Leading to Slug Overexpression and Epithelial-Mesenchymal Transition (EMT) of HER2-Overexpressing Breast Cancer Cells. Oncogene 2015, 34, 546–557. [Google Scholar] [CrossRef]
- Xi, C.; Hu, Y.; Buckhaults, P.; Moskophidis, D.; Mivechi, N.F. Heat Shock Factor Hsf1 Cooperates with ErbB2 (Her2/Neu) Protein to Promote Mammary Tumorigenesis and Metastasis. J. Biol. Chem. 2012, 287, 35646–35657. [Google Scholar] [CrossRef]
- Abane, R.; Mezger, V. Roles of Heat Shock Factors in Gametogenesis and Development. FEBS J. 2010, 277, 4150–4172. [Google Scholar] [CrossRef] [PubMed]
- Barna, J.; Csermely, P.; Vellai, T. Roles of Heat Shock Factor 1 beyond the Heat Shock Response. Cell. Mol. Life Sci. CMLS 2018, 75, 2897–2916. [Google Scholar] [CrossRef] [PubMed]
- Widlak, W.; Vydra, N. The Role of Heat Shock Factors in Mammalian Spermatogenesis. In The Role of Heat Shock Proteins in Reproductive System Development and Function; MacPhee, D.J., Ed.; Springer International Publishing: Cham, 2017; Vol. 222, pp. 45–65. ISBN 978-3-319-51408-6. [Google Scholar]
- Dai, C.; Whitesell, L.; Rogers, A.B.; Lindquist, S. Heat Shock Factor 1 Is a Powerful Multifaceted Modifier of Carcinogenesis. Cell 2007, 130, 1005–1018. [Google Scholar] [CrossRef] [PubMed]
- Vydra, N.; Toma, A.; Widlak, W. Pleiotropic Role of HSF1 in Neoplastic Transformation. Curr. Cancer Drug Targets 2014, 14, 144–155. [Google Scholar] [CrossRef] [PubMed]
- Vydra, N.; Toma, A.; Glowala-Kosinska, M.; Gogler-Piglowska, A.; Widlak, W. Overexpression of Heat Shock Transcription Factor 1 Enhances the Resistance of Melanoma Cells to Doxorubicin and Paclitaxel. BMC Cancer 2013, 13, 504. [Google Scholar] [CrossRef]
- Vydra, N.; Janus, P.; Kus, P.; Stokowy, T.; Mrowiec, K.; Toma-Jonik, A.; Krzywon, A.; Cortez, A.J.; Wojtas, B.; Gielniewski, B.; et al. Heat Shock Factor 1 (HSF1) Cooperates with Estrogen Receptor α (ERα) in the Regulation of Estrogen Action in Breast Cancer Cells. eLife 2021, 10, e69843. [Google Scholar] [CrossRef]
- Gogler-Pigłowska, A.; Klarzyńska, K.; Sojka, D.R.; Habryka, A.; Głowala-Kosińska, M.; Herok, M.; Kryj, M.; Halczok, M.; Krawczyk, Z.; Scieglinska, D. Novel Role for the Testis-Enriched HSPA2 Protein in Regulating Epidermal Keratinocyte Differentiation. J. Cell. Physiol. 2018, 233, 2629–2644. [Google Scholar] [CrossRef]
- Debnath, J.; Muthuswamy, S.K.; Brugge, J.S. Morphogenesis and Oncogenesis of MCF-10A Mammary Epithelial Acini Grown in Three-Dimensional Basement Membrane Cultures. Methods 2003, 30, 256–268. [Google Scholar] [CrossRef]
- Kurup, A.; Ravindranath, S.; Tran, T.; Keating, M.; Gascard, P.; Valdevit, L.; Tlsty, T.D.; Botvinick, E.L. Novel Insights from 3D Models: The Pivotal Role of Physical Symmetry in Epithelial Organization. Sci. Rep. 2015, 5, 15153. [Google Scholar] [CrossRef]
- Kim, D.; Langmead, B.; Salzberg, S.L. HISAT: A Fast Spliced Aligner with Low Memory Requirements. Nat. Methods 2015, 12, 357–360. [Google Scholar] [CrossRef]
- Li, H.; Handsaker, B.; Wysoker, A.; Fennell, T.; Ruan, J.; Homer, N.; Marth, G.; Abecasis, G.; Durbin, R. ; 1000 Genome Project Data Processing Subgroup The Sequence Alignment/Map Format and SAMtools. Bioinforma. Oxf. Engl. 2009, 25, 2078–2079. [Google Scholar] [CrossRef] [PubMed]
- Liao, Y.; Smyth, G.K.; Shi, W. FeatureCounts: An Efficient General Purpose Program for Assigning Sequence Reads to Genomic Features. Bioinforma. Oxf. Engl. 2014, 30, 923–930. [Google Scholar] [CrossRef] [PubMed]
- Lowe, J.M.; Menendez, D.; Bushel, P.R.; Shatz, M.; Kirk, E.L.; Troester, M.A.; Garantziotis, S.; Fessler, M.B.; Resnick, M.A. P53 and NF-ΚB Coregulate Proinflammatory Gene Responses in Human Macrophages. Cancer Res. 2014, 74, 2182–2192. [Google Scholar] [CrossRef] [PubMed]
- Thomas, P.D.; Ebert, D.; Muruganujan, A.; Mushayahama, T.; Albou, L.-P.; Mi, H. PANTHER: Making Genome-Scale Phylogenetics Accessible to All. Protein Sci. Publ. Protein Soc. 2022, 31, 8–22. [Google Scholar] [CrossRef] [PubMed]
- Ince, T.A.; Richardson, A.L.; Bell, G.W.; Saitoh, M.; Godar, S.; Karnoub, A.E.; Iglehart, J.D.; Weinberg, R.A. Transformation of Different Human Breast Epithelial Cell Types Leads to Distinct Tumor Phenotypes. Cancer Cell 2007, 12, 160–170. [Google Scholar] [CrossRef] [PubMed]
- Mendillo, M.L.; Santagata, S.; Koeva, M.; Bell, G.W.; Hu, R.; Tamimi, R.M.; Fraenkel, E.; Ince, T.A.; Whitesell, L.; Lindquist, S. HSF1 Drives a Transcriptional Program Distinct from Heat Shock to Support Highly Malignant Human Cancers. Cell 2012, 150, 549–562. [Google Scholar] [CrossRef]
- Paine, T.M.; Soule, H.D.; Pauley, R.J.; Dawson, P.J. Characterization of Epithelial Phenotypes in Mortal and Immortal Human Breast Cells. Int. J. Cancer 1992, 50, 463–473. [Google Scholar] [CrossRef]
- Soule, H.D.; Maloney, T.M.; Wolman, S.R.; Peterson, W.D.; Brenz, R.; McGrath, C.M.; Russo, J.; Pauley, R.J.; Jones, R.F.; Brooks, S.C. Isolation and Characterization of a Spontaneously Immortalized Human Breast Epithelial Cell Line, MCF-10. Cancer Res. 1990, 50, 6075–6086. [Google Scholar]
- Sweeney, M.F.; Sonnenschein, C.; Soto, A.M. Characterization of MCF-12A Cell Phenotype, Response to Estrogens, and Growth in 3D. Cancer Cell Int. 2018, 18, 43. [Google Scholar] [CrossRef]
- Vydra, N.; Janus, P.; Toma-Jonik, A.; Stokowy, T.; Mrowiec, K.; Korfanty, J.; Długajczyk, A.; Wojtaś, B.; Gielniewski, B.; Widłak, W. 17β-Estradiol Activates HSF1 via MAPK Signaling in ERα-Positive Breast Cancer Cells. Cancers 2019, 11, 1533. [Google Scholar] [CrossRef]
- Imbalzano, K.M.; Tatarkova, I.; Imbalzano, A.N.; Nickerson, J.A. Increasingly Transformed MCF-10A Cells Have a Progressively Tumor-like Phenotype in Three-Dimensional Basement Membrane Culture. Cancer Cell Int. 2009, 9, 7. [Google Scholar] [CrossRef] [PubMed]
- May, C.D.; Sphyris, N.; Evans, K.W.; Werden, S.J.; Guo, W.; Mani, S.A. Epithelial-Mesenchymal Transition and Cancer Stem Cells: A Dangerously Dynamic Duo in Breast Cancer Progression. Breast Cancer Res. BCR 2011, 13, 202. [Google Scholar] [CrossRef] [PubMed]
- Lim, E.; Vaillant, F.; Wu, D.; Forrest, N.C.; Pal, B.; Hart, A.H.; Asselin-Labat, M.-L.; Gyorki, D.E.; Ward, T.; Partanen, A.; et al. Aberrant Luminal Progenitors as the Candidate Target Population for Basal Tumor Development in BRCA1 Mutation Carriers. Nat. Med. 2009, 15, 907–913. [Google Scholar] [CrossRef] [PubMed]
- Sarrio, D.; Franklin, C.K.; Mackay, A.; Reis-Filho, J.S.; Isacke, C.M. Epithelial and Mesenchymal Subpopulations within Normal Basal Breast Cell Lines Exhibit Distinct Stem Cell/Progenitor Properties. Stem Cells Dayt. Ohio 2012, 30, 292–303. [Google Scholar] [CrossRef]
- Chang, C.-C. Recent Translational Research: Stem Cells as the Roots of Breast Cancer. Breast Cancer Res. BCR 2006, 8, 103. [Google Scholar] [CrossRef]
- Sleeman, K.E.; Kendrick, H.; Ashworth, A.; Isacke, C.M.; Smalley, M.J. CD24 Staining of Mouse Mammary Gland Cells Defines Luminal Epithelial, Myoepithelial/Basal and Non-Epithelial Cells. Breast Cancer Res. BCR 2006, 8, R7. [Google Scholar] [CrossRef]
- Dai, C. The Heat-Shock, or HSF1-Mediated Proteotoxic Stress, Response in Cancer: From Proteomic Stability to Oncogenesis. Philos. Trans. R. Soc. Lond. B. Biol. Sci. 2018, 373, 20160525. [Google Scholar] [CrossRef]
- Dong, B.; Jaeger, A.M.; Hughes, P.F.; Loiselle, D.R.; Hauck, J.S.; Fu, Y.; Haystead, T.A.; Huang, J.; Thiele, D.J. Targeting Therapy-Resistant Prostate Cancer via a Direct Inhibitor of the Human Heat Shock Transcription Factor 1. Sci. Transl. Med. 2020, 12, eabb5647. [Google Scholar] [CrossRef]
- Jin, X.; Eroglu, B.; Moskophidis, D.; Mivechi, N.F. Targeted Deletion of Hsf1, 2, and 4 Genes in Mice. Methods Mol. Biol. Clifton NJ 2018, 1709, 1–22. [Google Scholar] [CrossRef]
- Xiao, X.; Zuo, X.; Davis, A.A.; McMillan, D.R.; Curry, B.B.; Richardson, J.A.; Benjamin, I.J. HSF1 Is Required for Extra-Embryonic Development, Postnatal Growth and Protection during Inflammatory Responses in Mice. EMBO J. 1999, 18, 5943–5952. [Google Scholar] [CrossRef]
- Christians, E.; Davis, A.A.; Thomas, S.D.; Benjamin, I.J. Maternal Effect of Hsf1 on Reproductive Success. Nature 2000, 407, 693–694. [Google Scholar] [CrossRef] [PubMed]
- Widlak, W.; Vydra, N. The Role of Heat Shock Factors in Mammalian Spermatogenesis. Adv. Anat. Embryol. Cell Biol. 2017, 222, 45–65. [Google Scholar] [CrossRef] [PubMed]
- Inouye, S.; Izu, H.; Takaki, E.; Suzuki, H.; Shirai, M.; Yokota, Y.; Ichikawa, H.; Fujimoto, M.; Nakai, A. Impaired IgG Production in Mice Deficient for Heat Shock Transcription Factor 1. J. Biol. Chem. 2004, 279, 38701–38709. [Google Scholar] [CrossRef] [PubMed]
- Janus, P.; Kuś, P.; Vydra, N.; Toma-Jonik, A.; Stokowy, T.; Mrowiec, K.; Wojtaś, B.; Gielniewski, B.; Widłak, W. HSF1 Can Prevent Inflammation Following Heat Shock by Inhibiting the Excessive Activation of the ATF3 and JUN&FOS Genes. Cells 2022, 11, 2510. [Google Scholar] [CrossRef]
- Zhan, L.; Xiang, B.; Muthuswamy, S.K. Controlled Activation of ErbB1/ErbB2 Heterodimers Promote Invasion of Three-Dimensional Organized Epithelia in an ErbB1-Dependent Manner: Implications for Progression of ErbB2-Overexpressing Tumors. Cancer Res. 2006, 66, 5201–5208. [Google Scholar] [CrossRef]
- Knudsen, K.A.; Wheelock, M.J. Cadherins and the Mammary Gland. J. Cell. Biochem. 2005, 95, 488–496. [Google Scholar] [CrossRef]
- Khaleque, M.A.; Bharti, A.; Gong, J.; Gray, P.J.; Sachdev, V.; Ciocca, D.R.; Stati, A.; Fanelli, M.; Calderwood, S.K. Heat Shock Factor 1 Represses Estrogen-Dependent Transcription through Association with MTA1. Oncogene 2008, 27, 1886–1893. [Google Scholar] [CrossRef]
- Hollier, B.G.; Evans, K.; Mani, S.A. The Epithelial-to-Mesenchymal Transition and Cancer Stem Cells: A Coalition against Cancer Therapies. J. Mammary Gland Biol. Neoplasia 2009, 14, 29–43. [Google Scholar] [CrossRef]
- Mani, S.A.; Guo, W.; Liao, M.-J.; Eaton, E.Ng.; Ayyanan, A.; Zhou, A.Y.; Brooks, M.; Reinhard, F.; Zhang, C.C.; Shipitsin, M.; et al. The Epithelial-Mesenchymal Transition Generates Cells with Properties of Stem Cells. Cell 2008, 133, 704–715. [Google Scholar] [CrossRef]
- Shipitsin, M.; Campbell, L.L.; Argani, P.; Weremowicz, S.; Bloushtain-Qimron, N.; Yao, J.; Nikolskaya, T.; Serebryiskaya, T.; Beroukhim, R.; Hu, M.; et al. Molecular Definition of Breast Tumor Heterogeneity. Cancer Cell 2007, 11, 259–273. [Google Scholar] [CrossRef]
- Wang, B.; Lee, C.-W.; Witt, A.; Thakkar, A.; Ince, T.A. Heat Shock Factor 1 Induces Cancer Stem Cell Phenotype in Breast Cancer Cell Lines. Breast Cancer Res. Treat. 2015, 153, 57–66. [Google Scholar] [CrossRef]
- Yasuda, K.; Hirohashi, Y.; Mariya, T.; Murai, A.; Tabuchi, Y.; Kuroda, T.; Kusumoto, H.; Takaya, A.; Yamamoto, E.; Kubo, T.; et al. Phosphorylation of HSF1 at Serine 326 Residue Is Related to the Maintenance of Gynecologic Cancer Stem Cells through Expression of HSP27. Oncotarget 2017, 8, 31540–31553. [Google Scholar] [CrossRef]
- Dong, Q.; Xiu, Y.; Wang, Y.; Hodgson, C.; Borcherding, N.; Jordan, C.; Buchanan, J.; Taylor, E.; Wagner, B.; Leidinger, M.; et al. HSF1 Is a Driver of Leukemia Stem Cell Self-Renewal in Acute Myeloid Leukemia. Nat. Commun. 2022, 13, 6107. [Google Scholar] [CrossRef] [PubMed]
- Chen, K.; Qian, W.; Li, J.; Jiang, Z.; Cheng, L.; Yan, B.; Cao, J.; Sun, L.; Zhou, C.; Lei, M.; et al. Loss of AMPK Activation Promotes the Invasion and Metastasis of Pancreatic Cancer through an HSF1-Dependent Pathway. Mol. Oncol. 2017, 11, 1475–1492. [Google Scholar] [CrossRef] [PubMed]
- Liu, D.; Sun, L.; Qin, X.; Liu, T.; Zhang, S.; Liu, Y.; Li, S.; Guo, K. HSF1 Promotes the Inhibition of EMT-Associated Migration by Low Glucose via Directly Regulating Snail1 Expression in HCC Cells. Discov. Med. 2016, 22, 87–96. [Google Scholar] [PubMed]
- Fang, F.; Chang, R.; Yang, L. Heat Shock Factor 1 Promotes Invasion and Metastasis of Hepatocellular Carcinoma in Vitro and in Vivo. Cancer 2012, 118, 1782–1794. [Google Scholar] [CrossRef] [PubMed]
- Hoang, A.T.; Huang, J.; Rudra-Ganguly, N.; Zheng, J.; Powell, W.C.; Rabindran, S.K.; Wu, C.; Roy-Burman, P. A Novel Association between the Human Heat Shock Transcription Factor 1 (HSF1) and Prostate Adenocarcinoma. Am. J. Pathol. 2000, 156, 857–864. [Google Scholar] [CrossRef]
- Kourtis, N.; Moubarak, R.S.; Aranda-Orgilles, B.; Lui, K.; Aydin, I.T.; Trimarchi, T.; Darvishian, F.; Salvaggio, C.; Zhong, J.; Bhatt, K.; et al. FBXW7 Modulates Cellular Stress Response and Metastatic Potential through HSF1 Post-Translational Modification. Nat. Cell Biol. 2015, 17, 322–332. [Google Scholar] [CrossRef]
- Fiorenza, M.T.; Farkas, T.; Dissing, M.; Kolding, D.; Zimarino, V. Complex Expression of Murine Heat Shock Transcription Factors. Nucleic Acids Res. 1995, 23, 467–474. [Google Scholar] [CrossRef]
- Rabindran, S.K.; Giorgi, G.; Clos, J.; Wu, C. Molecular Cloning and Expression of a Human Heat Shock Factor, HSF1. Proc. Natl. Acad. Sci. U. S. A. 1991, 88, 6906–6910. [Google Scholar] [CrossRef]
- Chen, F.; Fan, Y.; Cao, P.; Liu, B.; Hou, J.; Zhang, B.; Tan, K. Pan-Cancer Analysis of the Prognostic and Immunological Role of HSF1: A Potential Target for Survival and Immunotherapy. Oxid. Med. Cell. Longev. 2021, 2021, 5551036. [Google Scholar] [CrossRef] [PubMed]
- Kourtis, N.; Lazaris, C.; Hockemeyer, K.; Balandrán, J.C.; Jimenez, A.R.; Mullenders, J.; Gong, Y.; Trimarchi, T.; Bhatt, K.; Hu, H.; et al. Oncogenic Hijacking of the Stress Response Machinery in T Cell Acute Lymphoblastic Leukemia. Nat. Med. 2018, 24, 1157–1166. [Google Scholar] [CrossRef] [PubMed]
- Prince, T.L.; Lang, B.J.; Guerrero-Gimenez, M.E.; Fernandez-Muñoz, J.M.; Ackerman, A.; Calderwood, S.K. HSF1: Primary Factor in Molecular Chaperone Expression and a Major Contributor to Cancer Morbidity. Cells 2020, 9, 1046. [Google Scholar] [CrossRef] [PubMed]
- Cyran, A.M.; Zhitkovich, A. Heat Shock Proteins and HSF1 in Cancer. Front. Oncol. 2022, 12, 860320. [Google Scholar] [CrossRef] [PubMed]
- Dayalan Naidu, S.; Dinkova-Kostova, A.T. Regulation of the Mammalian Heat Shock Factor 1. FEBS J. 2017, 284, 1606–1627. [Google Scholar] [CrossRef]
Figure 1.
MCF10A and MCF12A cells derived from the breast tissue of patients with fibrocystic changes differ in HSF1 and EMT marker levels and morphology. (a) The expression of HSF1 and (b) EMT markers was assessed by Western blot. ACTB and HSPA8 were used as loading controls. The graph shows the results of densitometric analyses (n = 3). *p<0.05 (significance of differences). (c) Morphology of cells in 2D culture: phase-contrast images of subconfluent (upper panel) and confluent cells (bottom panel). Scale bar 100 µm. The enlargement shows a cluster of cells within the MCF12A population. (d) Morphology of cells cultured in matrigel: phase-contrast images (upper panel; scale bar 100 µm) and confocal images of spheroids stained for ITGA6, F-actin, and DNA (bottom panel; scale bar 20 µm).
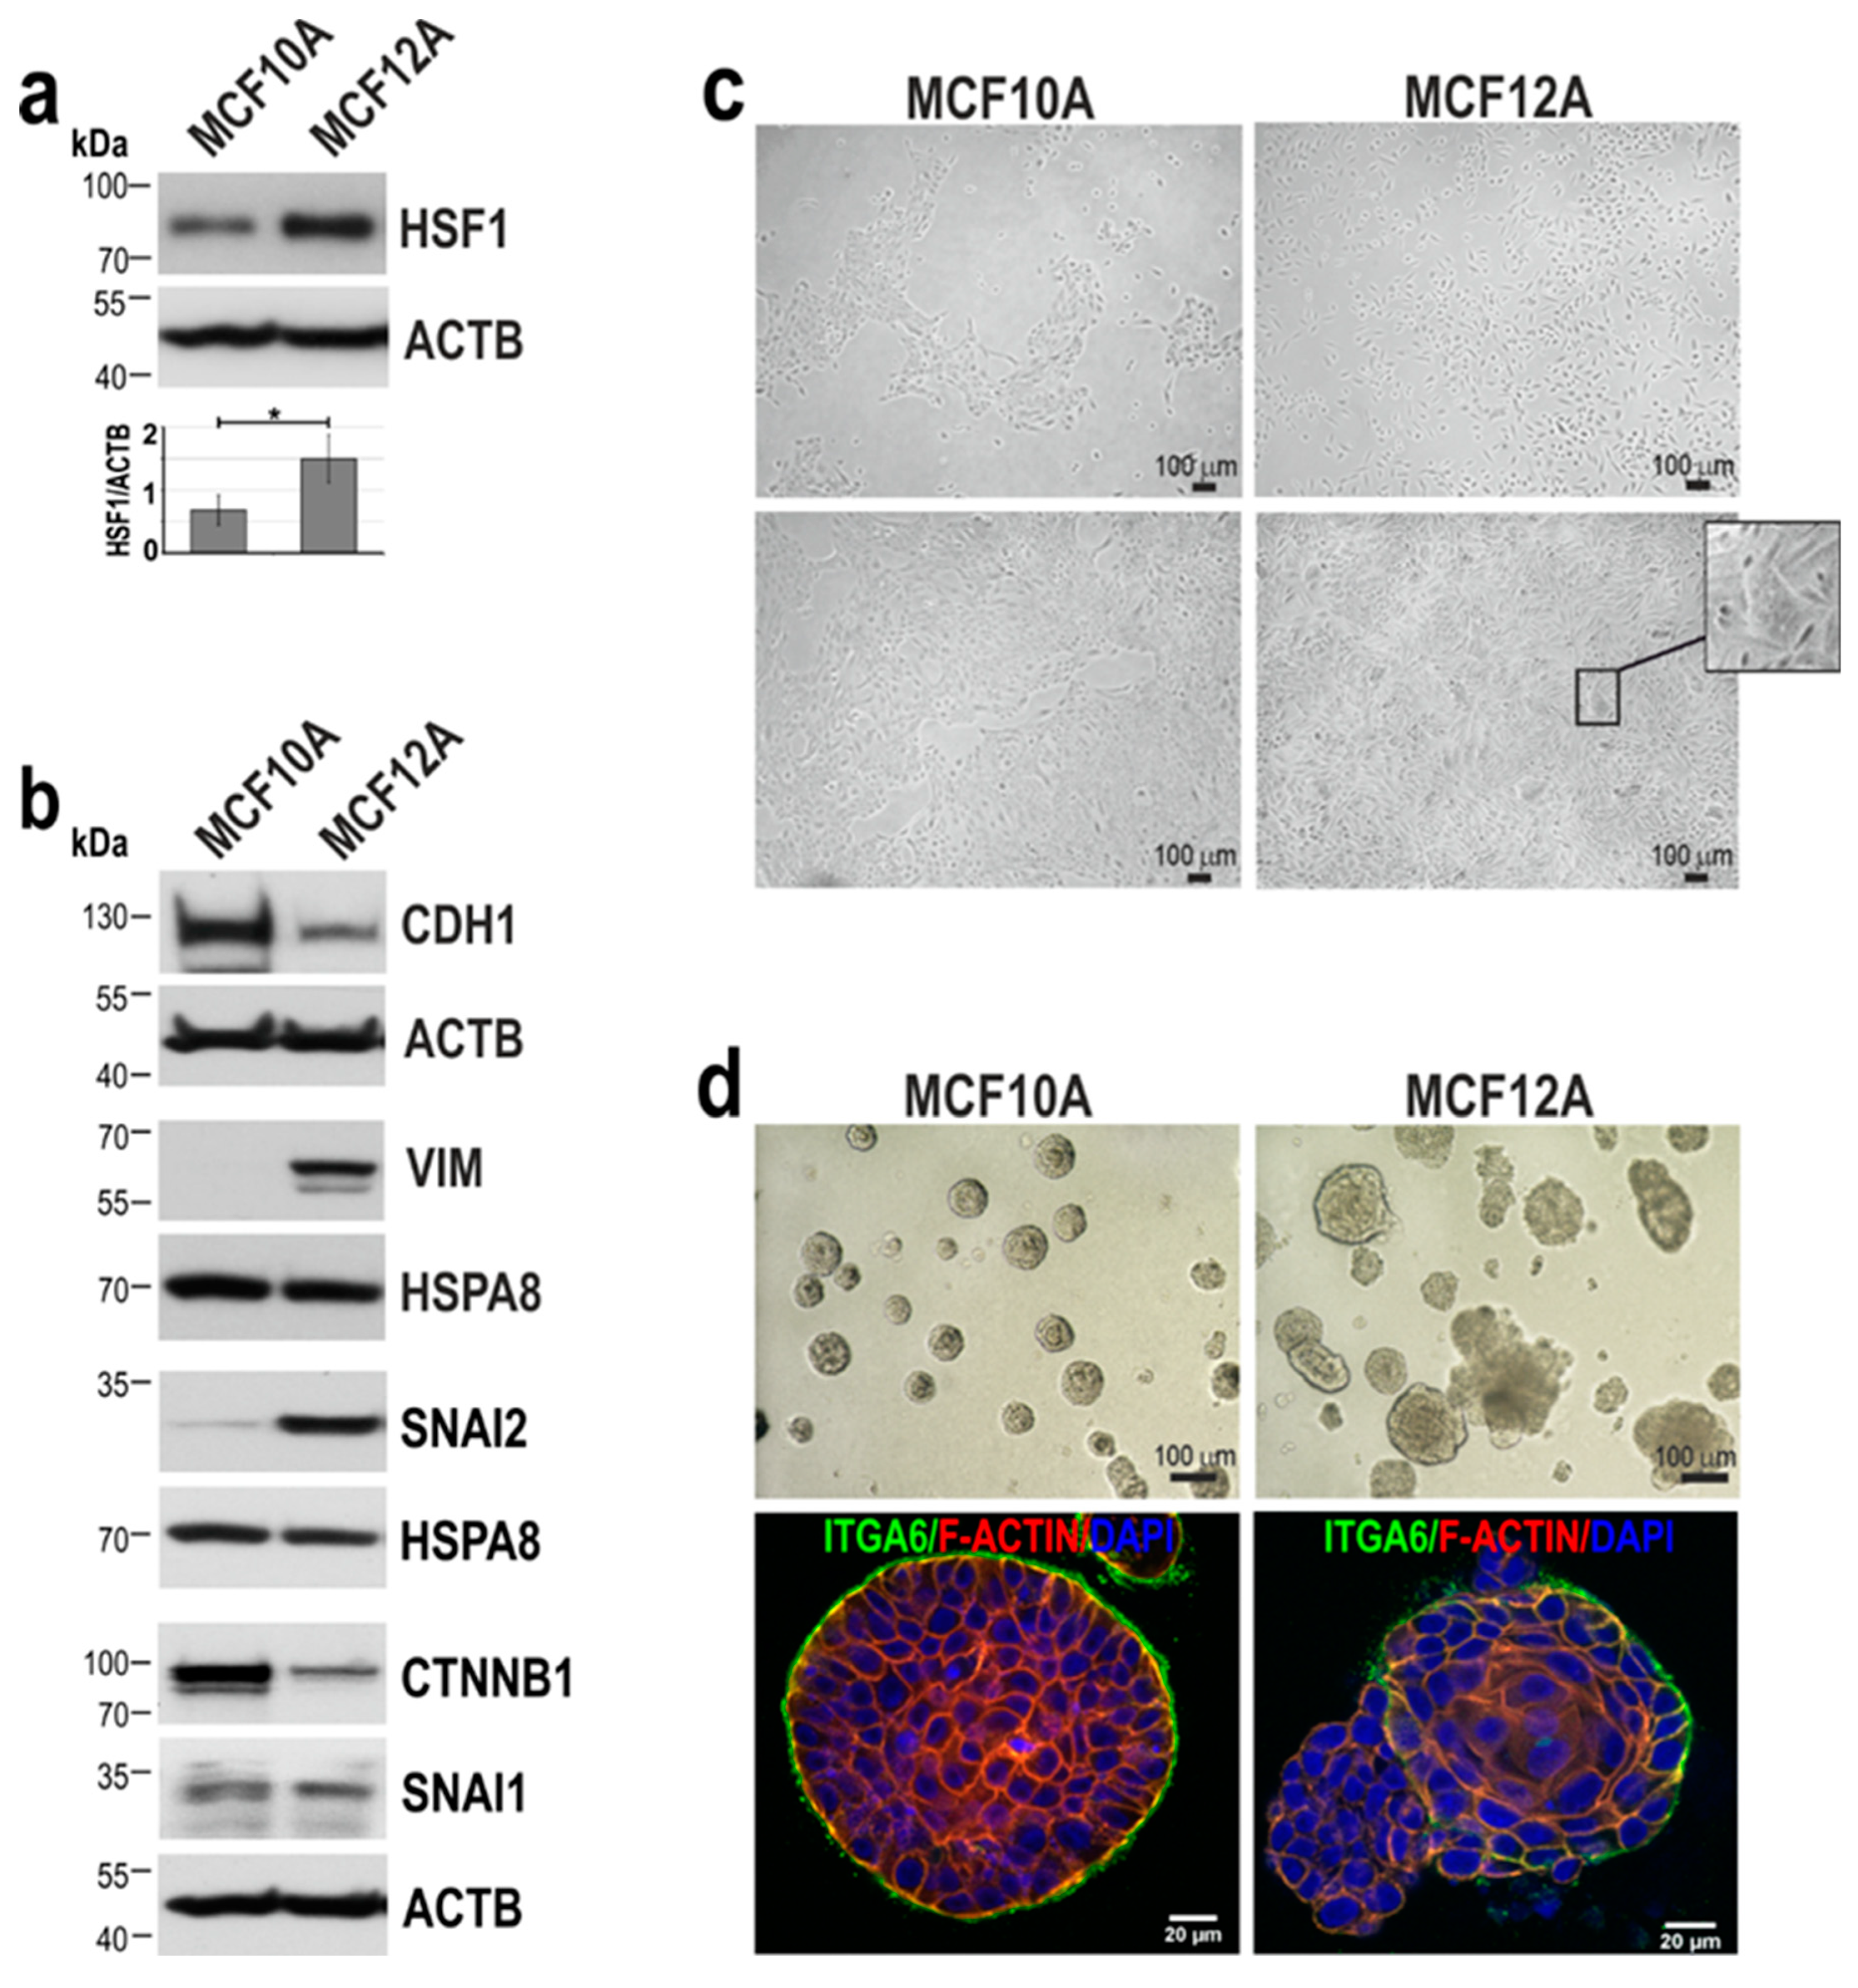
Figure 2.
Effect of HSF1 down-regulation on the growth and ability to differentiate of MCF10A and MCF12A cells. (a) Western blot analysis of HSF1 expression in either unmodified (WT) cells, transduced with lentiviruses containing control (sh.CTRL) or specific for HSF1 (sh1.HSF1, sh2.HSF1) shRNAs. Actin (ACTB) was used as a protein loading control. The graphs below show the results of densitometric analyses (n = 3). (b) Proliferation rates (assessed by crystal violet staining) of MCF10A (n = 5) and MCF12A (n = 3) cell variants. (c) The number of Ki-67 positive cells in MCF10A cell variants (n = 3). (d) Senescence-associated β-galactosidase activity (yielding blue color) analyzed in MCF10A cell variants (n = 3). Scale bar 50 μm. Morphology of MCF10A (e) MCF12A (g) cell variants cultured in 2D (upper panels) and matrigel (middle and bottom panels). Phase-contrast images (upper and middle panels; scale bar 100 µm) and confocal images of spheroids stained for ITGA6 and DNA (bottom panel; scale bar 20 µm). Arrows point to representative acini with disruptive morphology, and arrowheads – representative acini with multi-acinar morphology. (f) The volume of spheroids formed in matrigel by MCF10A cell variants. Boxplots represent the median, upper and lower quartiles, maximum, and minimum. Statistically significant differences between unmodified, cells with empty vector or overexpressing HSF1 are marked: ***p<0.0001 (significance of differences). (h) Morphology of spheroids formed by MCF12A cell variants was distinguished as normal, disruptive, and multi-acinar as described by [20]. *p<0.05 (significance of differences).
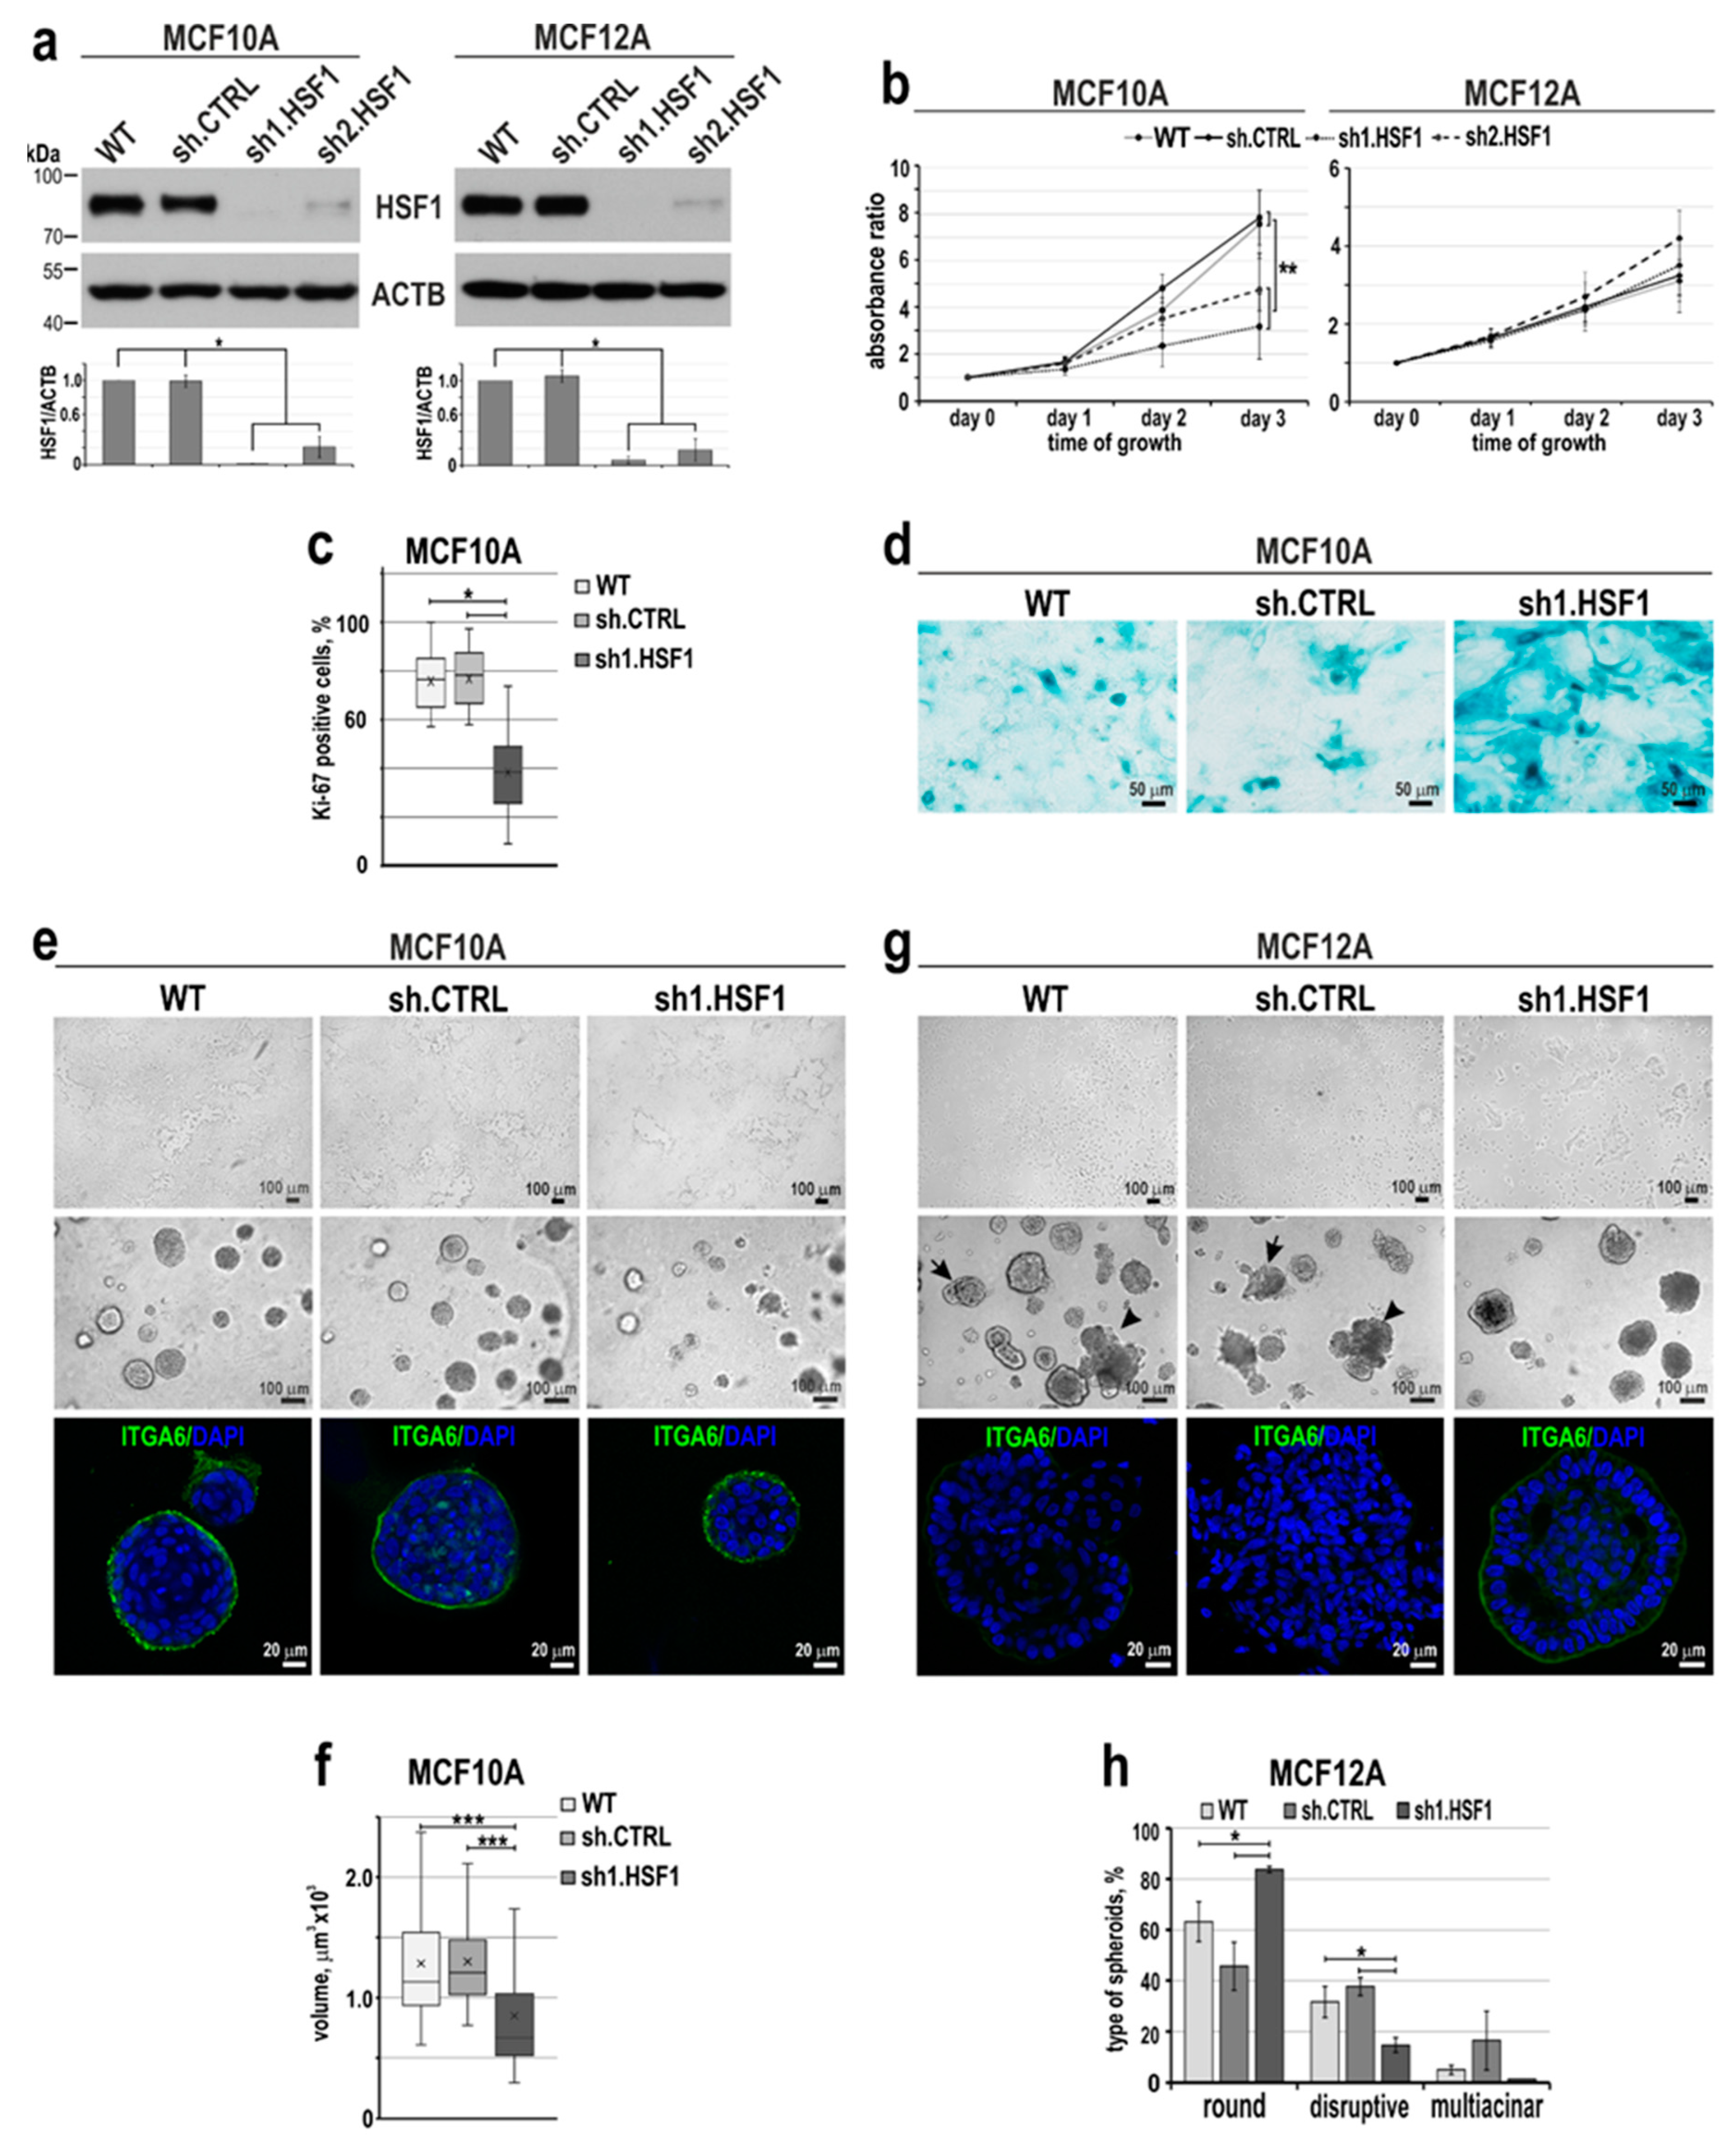
Figure 3.
HSF1 levels affect the expression of EMT markers and phenotype of MCF10A and MCF12A cells. (a) Western blot analysis of HSF1 and EMT markers in cells with overexpression (MCF10A) or knockdown (MCF12A) of HSF1. WT, unmodified cells; pLVX or shCTRL, cells transduced with lentiviruses containing the empty vector or control shRNA; HSF1-pLVX or sh1.HSF1, cells transduced with lentiviruses containing the HSF1 cDNA or shRNA targeting HSF1. ACTB and HSPA8 were used as loading controls. Graphs show the results of densitometric analyses (n = 3). *p<0.05 (significance of differences). (b) Proliferation rates assessed by crystal violet staining in MCF10A cell variants (n = 5). (c) Morphology of MCF10A cell variants in 2D culture (upper panel) and matrigel (middle and bottom panels). Phase-contrast images (upper and middle panels; scale bar 100 µm) and confocal images of spheroids stained for ITGA6 and DNA (bottom panel). (d) The volume of spheroids formed in the matrigel by MCF10A cell variants. Boxplots represent the median, upper and lower quartiles, maximum, and minimum. ***p<0.0001 (significance of differences). (e, f) Confocal images of spheroids grown in matrigel for 14 or 21 days and stained for CDH1 and DNA (scale bar 20 µm and 50 µm, respectively). (g) Migratory capacity of MCF10A cell variants analyzed by Boyden chamber assay (n = 3). **p<0.001, *p<0.05 (significance of differences). (h) Time of cell detachment from the plastic surface by trypsinization. Boxplots represent the median, upper and lower quartiles, maximum, and minimum. *p<0.05 (significance of differences).
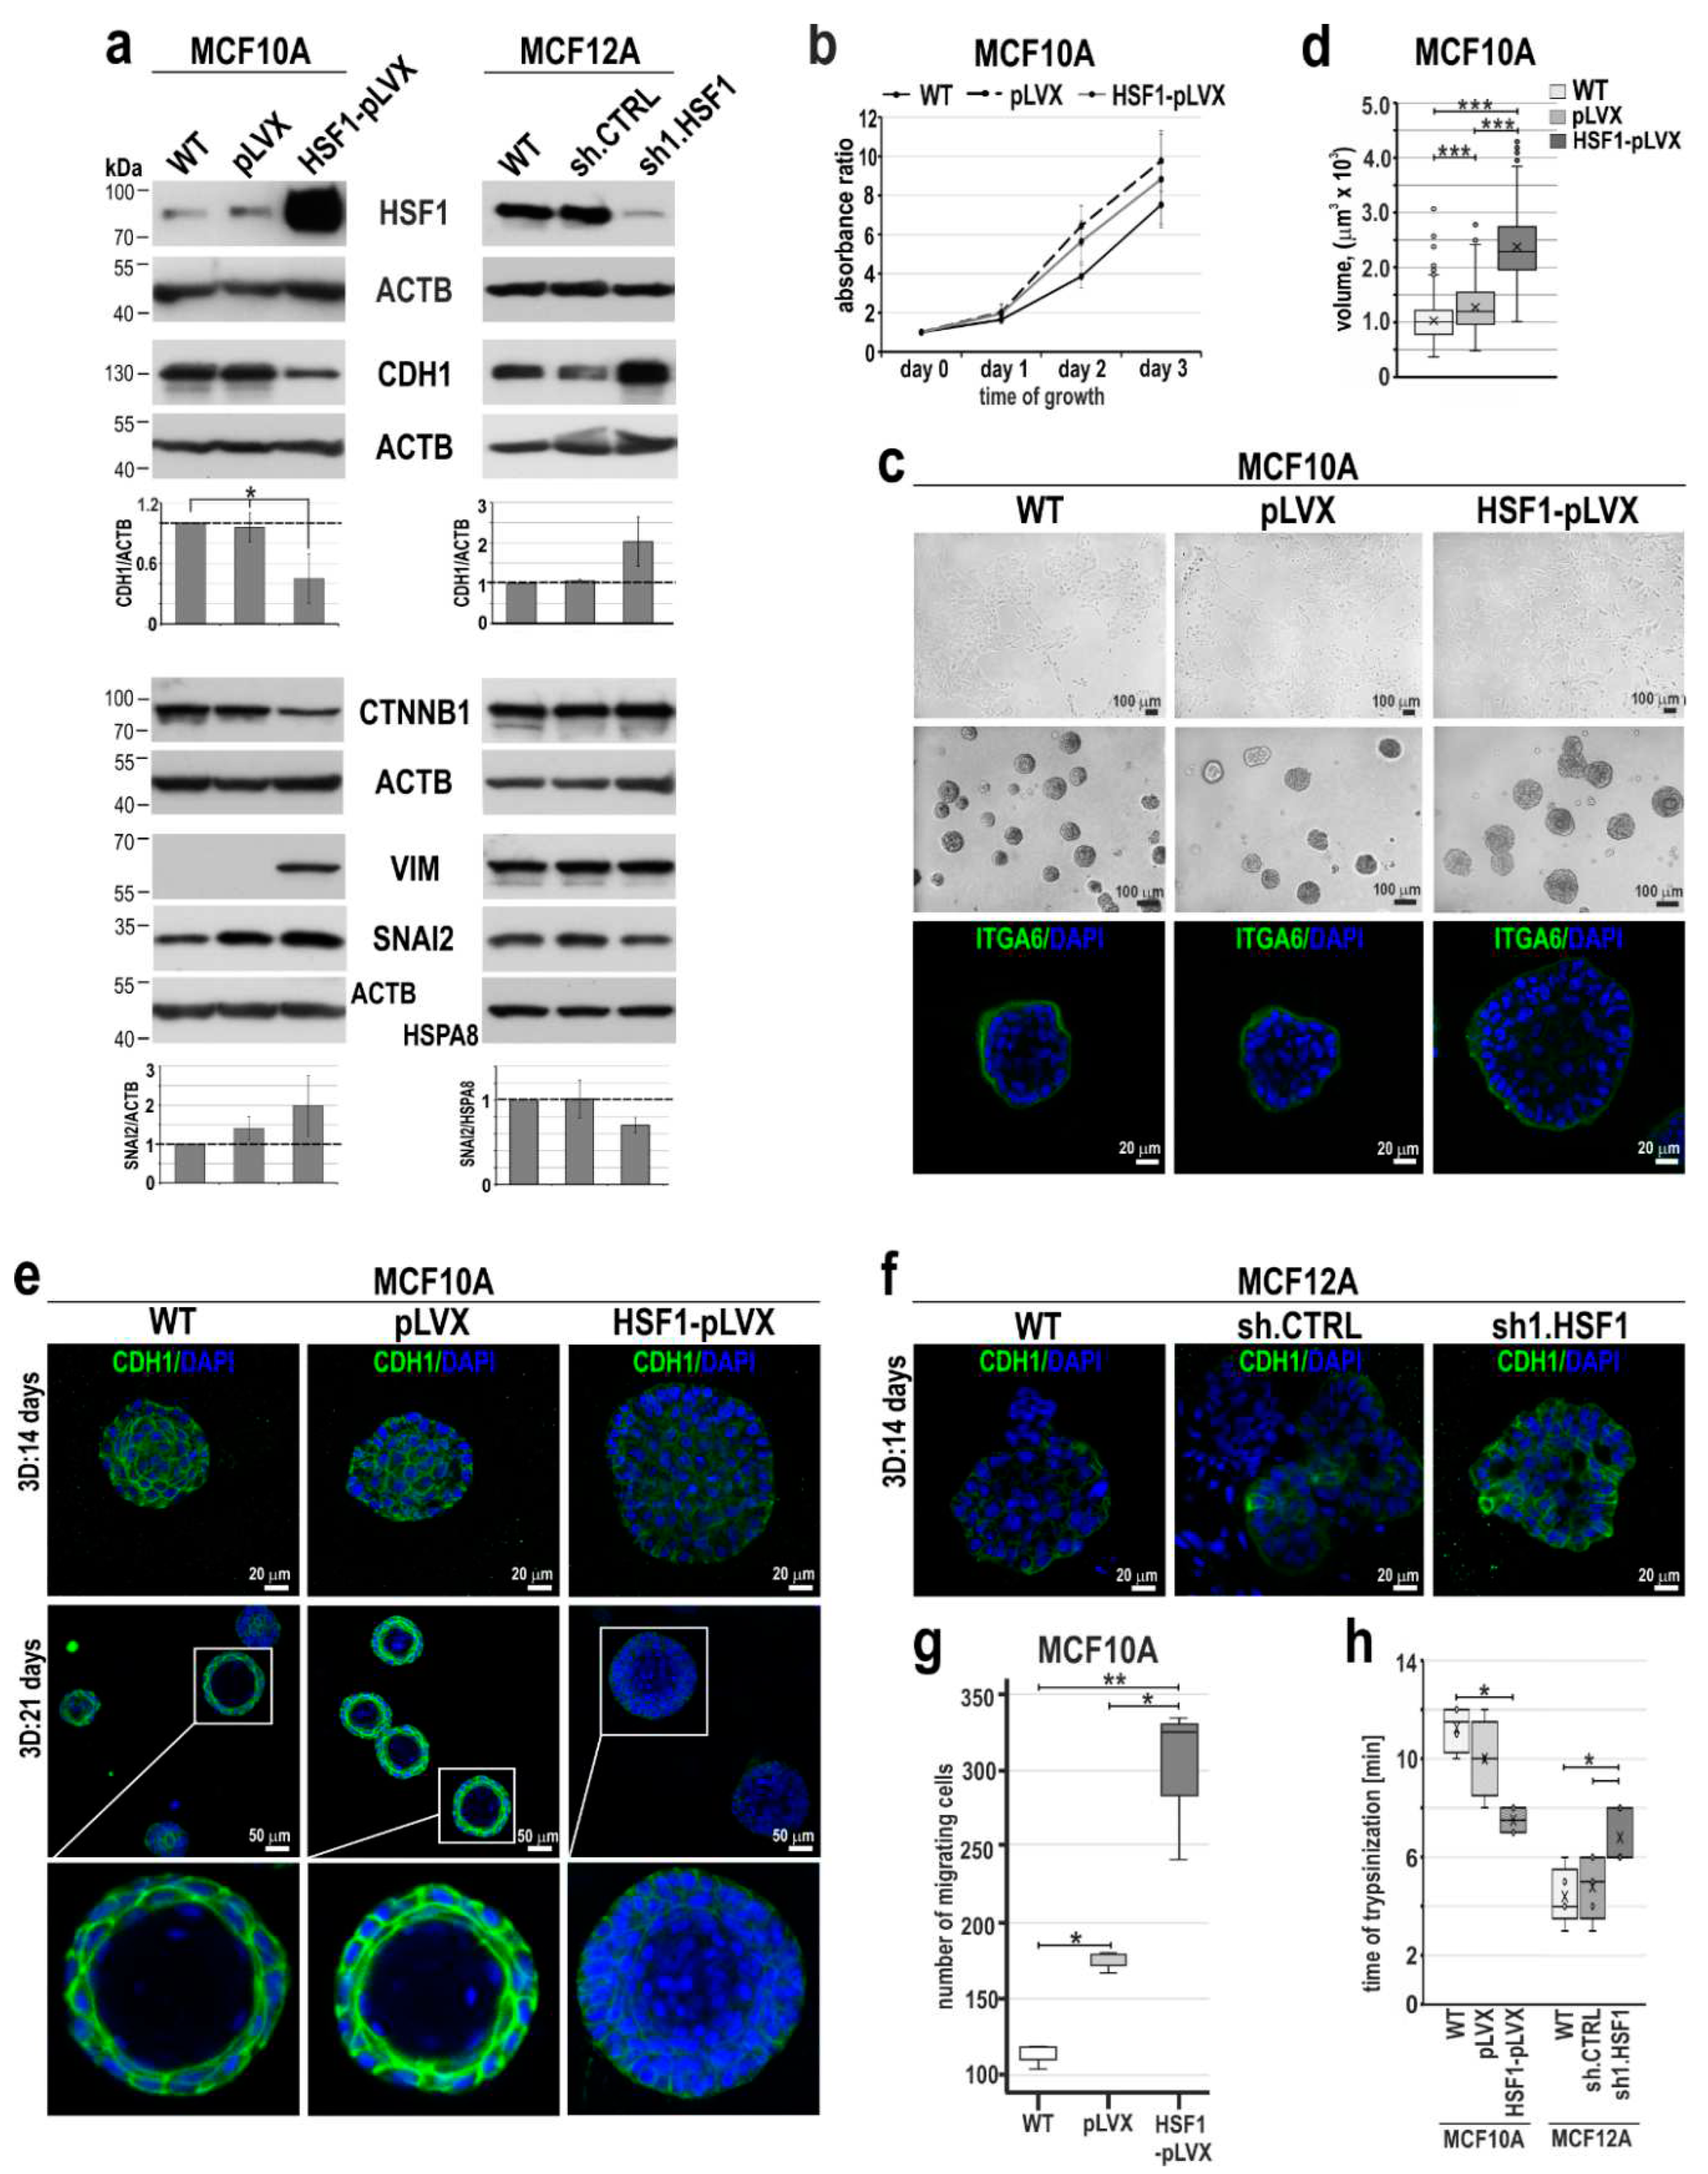
Figure 4.
Mesenchymal and stem cell-like characteristics of MCF10A and MCF12A cell variants with altered HSF1 expression. (a) Subpopulations defined by expression of EPCAM and ITGA6 or (b) CD24 and CD44 using flow cytometry. Isotype controls were performed (not shown). The percentages of subpopulations shown in the bar graphs are the mean±SEM of three independent experiments. Ovals point out cell populations that are enriched when HSF1 expression levels are altered.
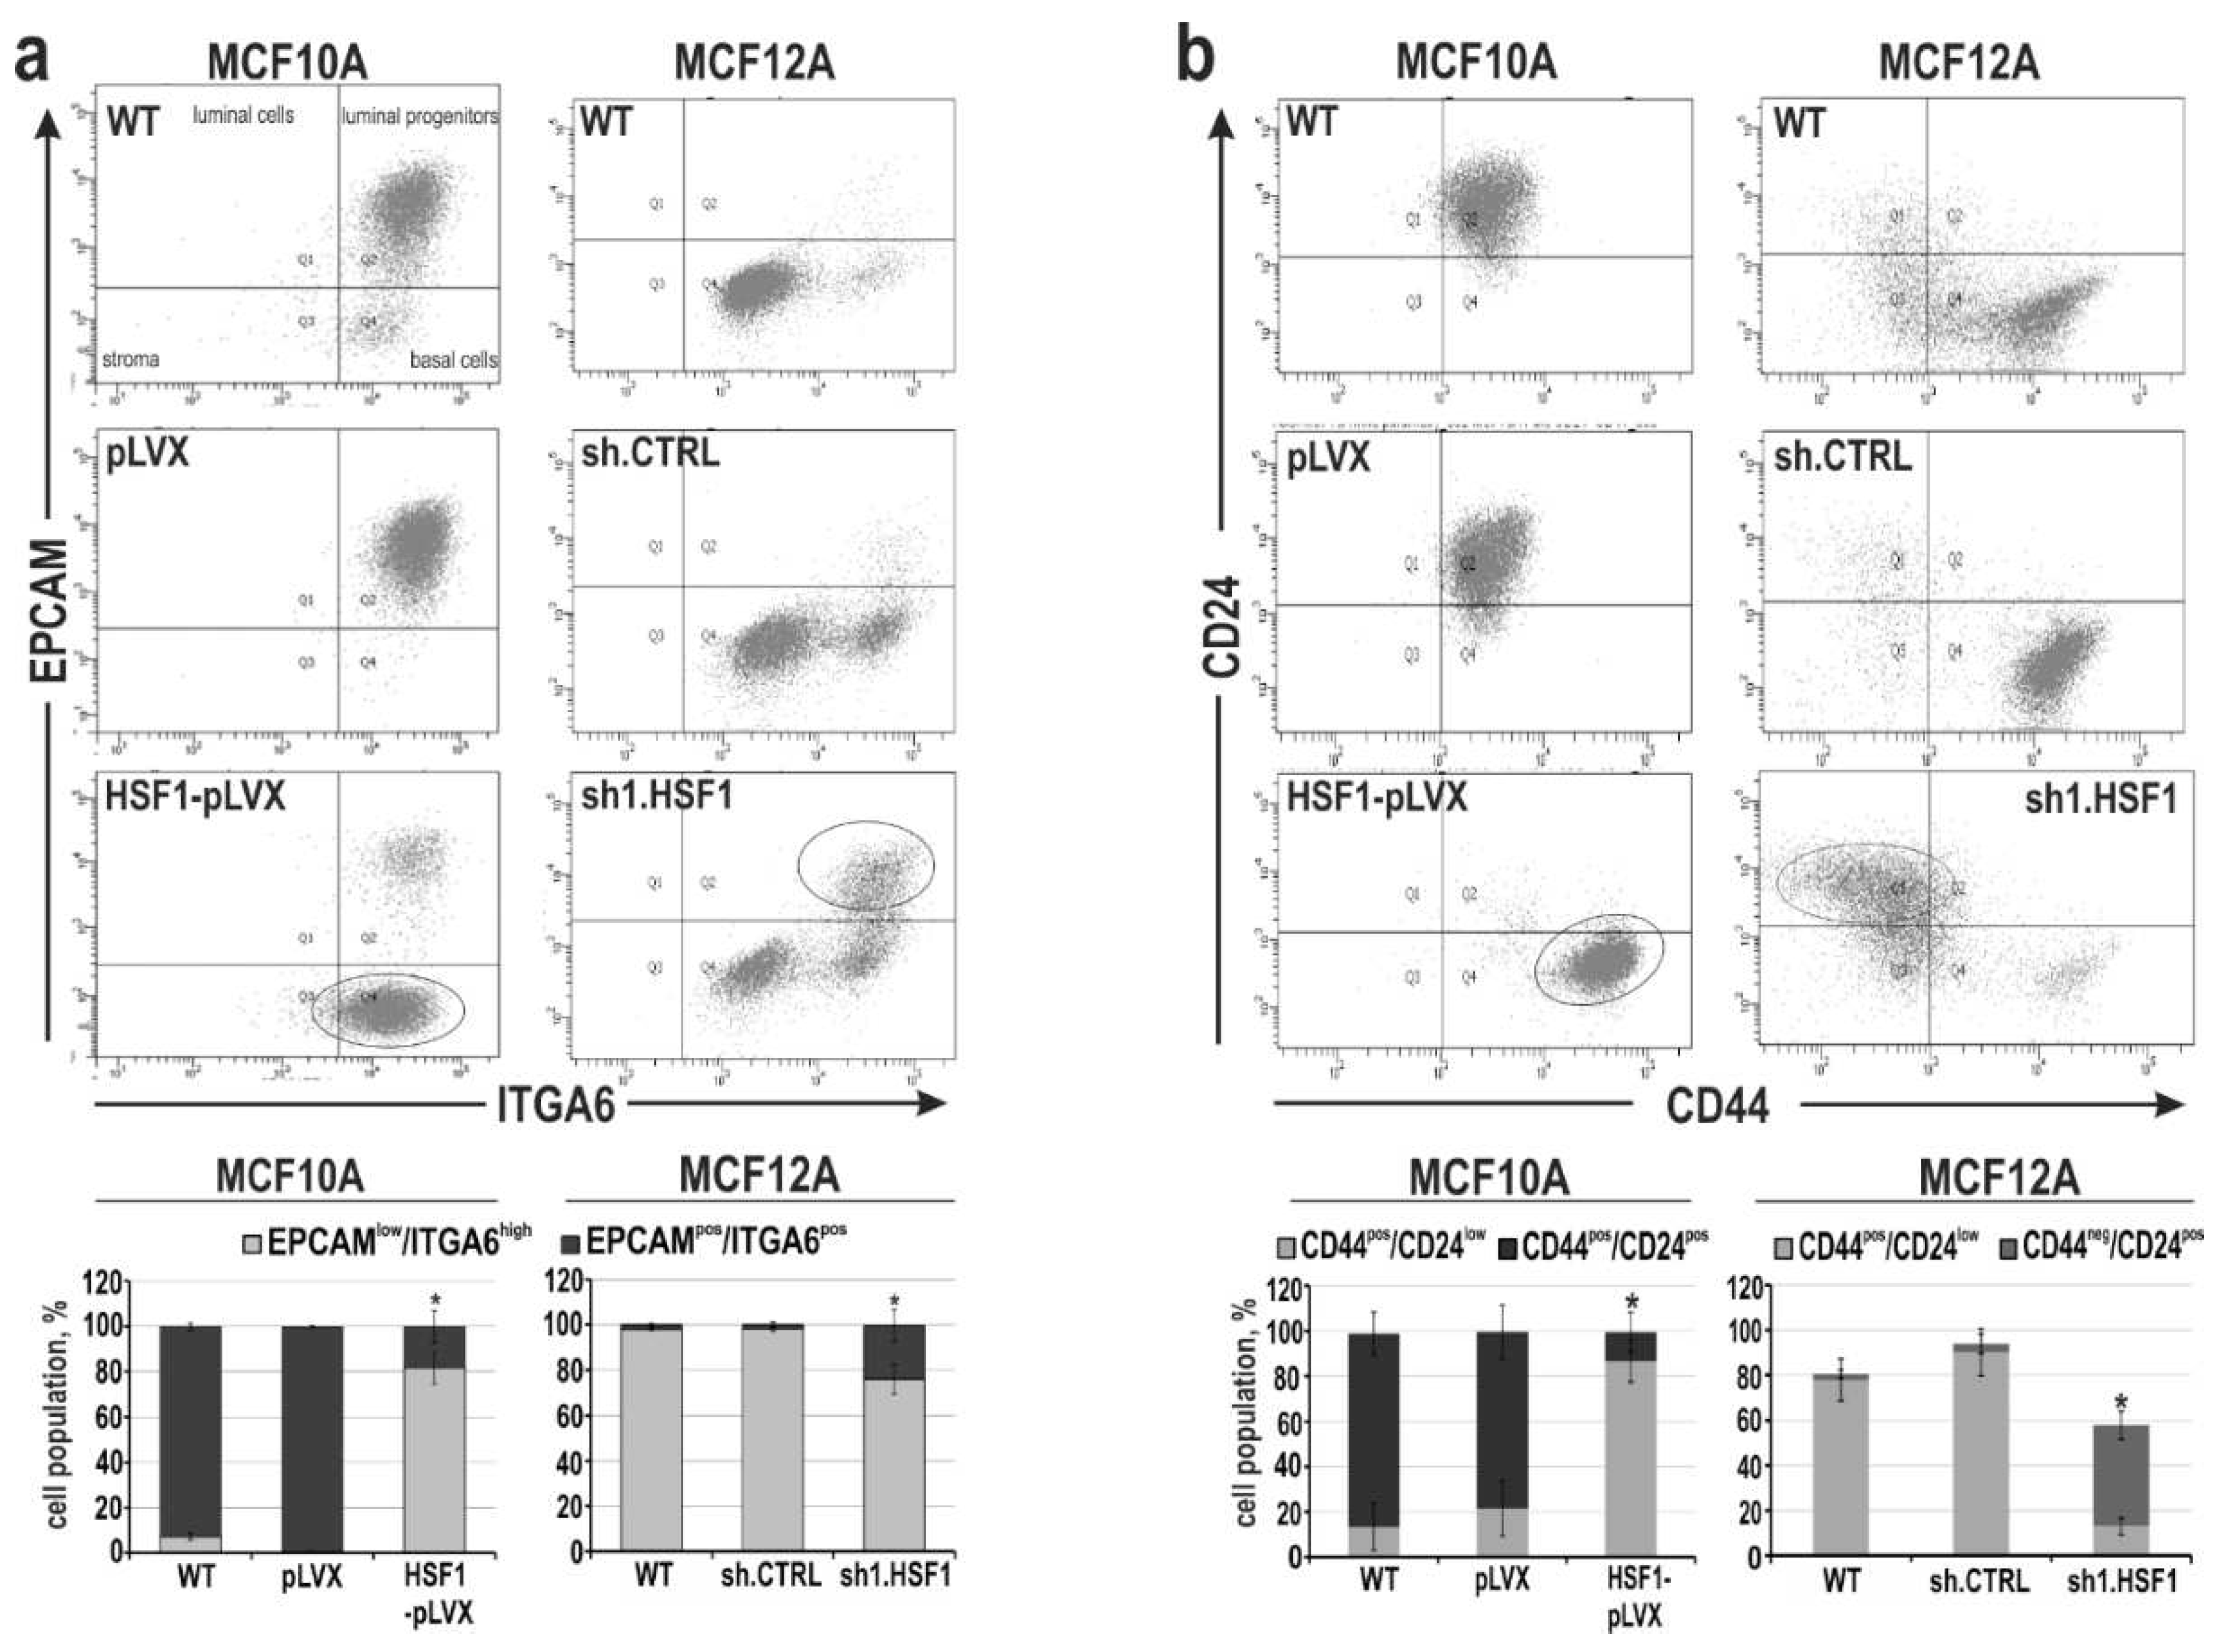
Figure 5.
HSF1 levels in triple-negative breast cancer cell lines positively correlate with the acquisition of invasive phenotype in matrigel. (a) Western blot analysis of HSF1 and (b) EMT markers. ACTB was used as a loading control. The graph shows the results of the densitometric analyses (n = 3). *p<0.05, ***p<0.001 (significance of differences). (c) Subpopulations defined by the expression of CD24 and CD44 using flow cytometry. The percentages of subpopulations shown on the bar graphs are the mean±SEM of three independent experiments. (d) Cell migration ability analyzed using the Boyden chamber assay (n = 3). *p<0.05, **p<0.001 (significance of differences). (e) Morphology of cells grown in the matrigel (ranked from most regular to most diffuse). Phase-contrast images (upper panel) and confocal images of spheroids stained for F-actin and DNA (bottom panel).
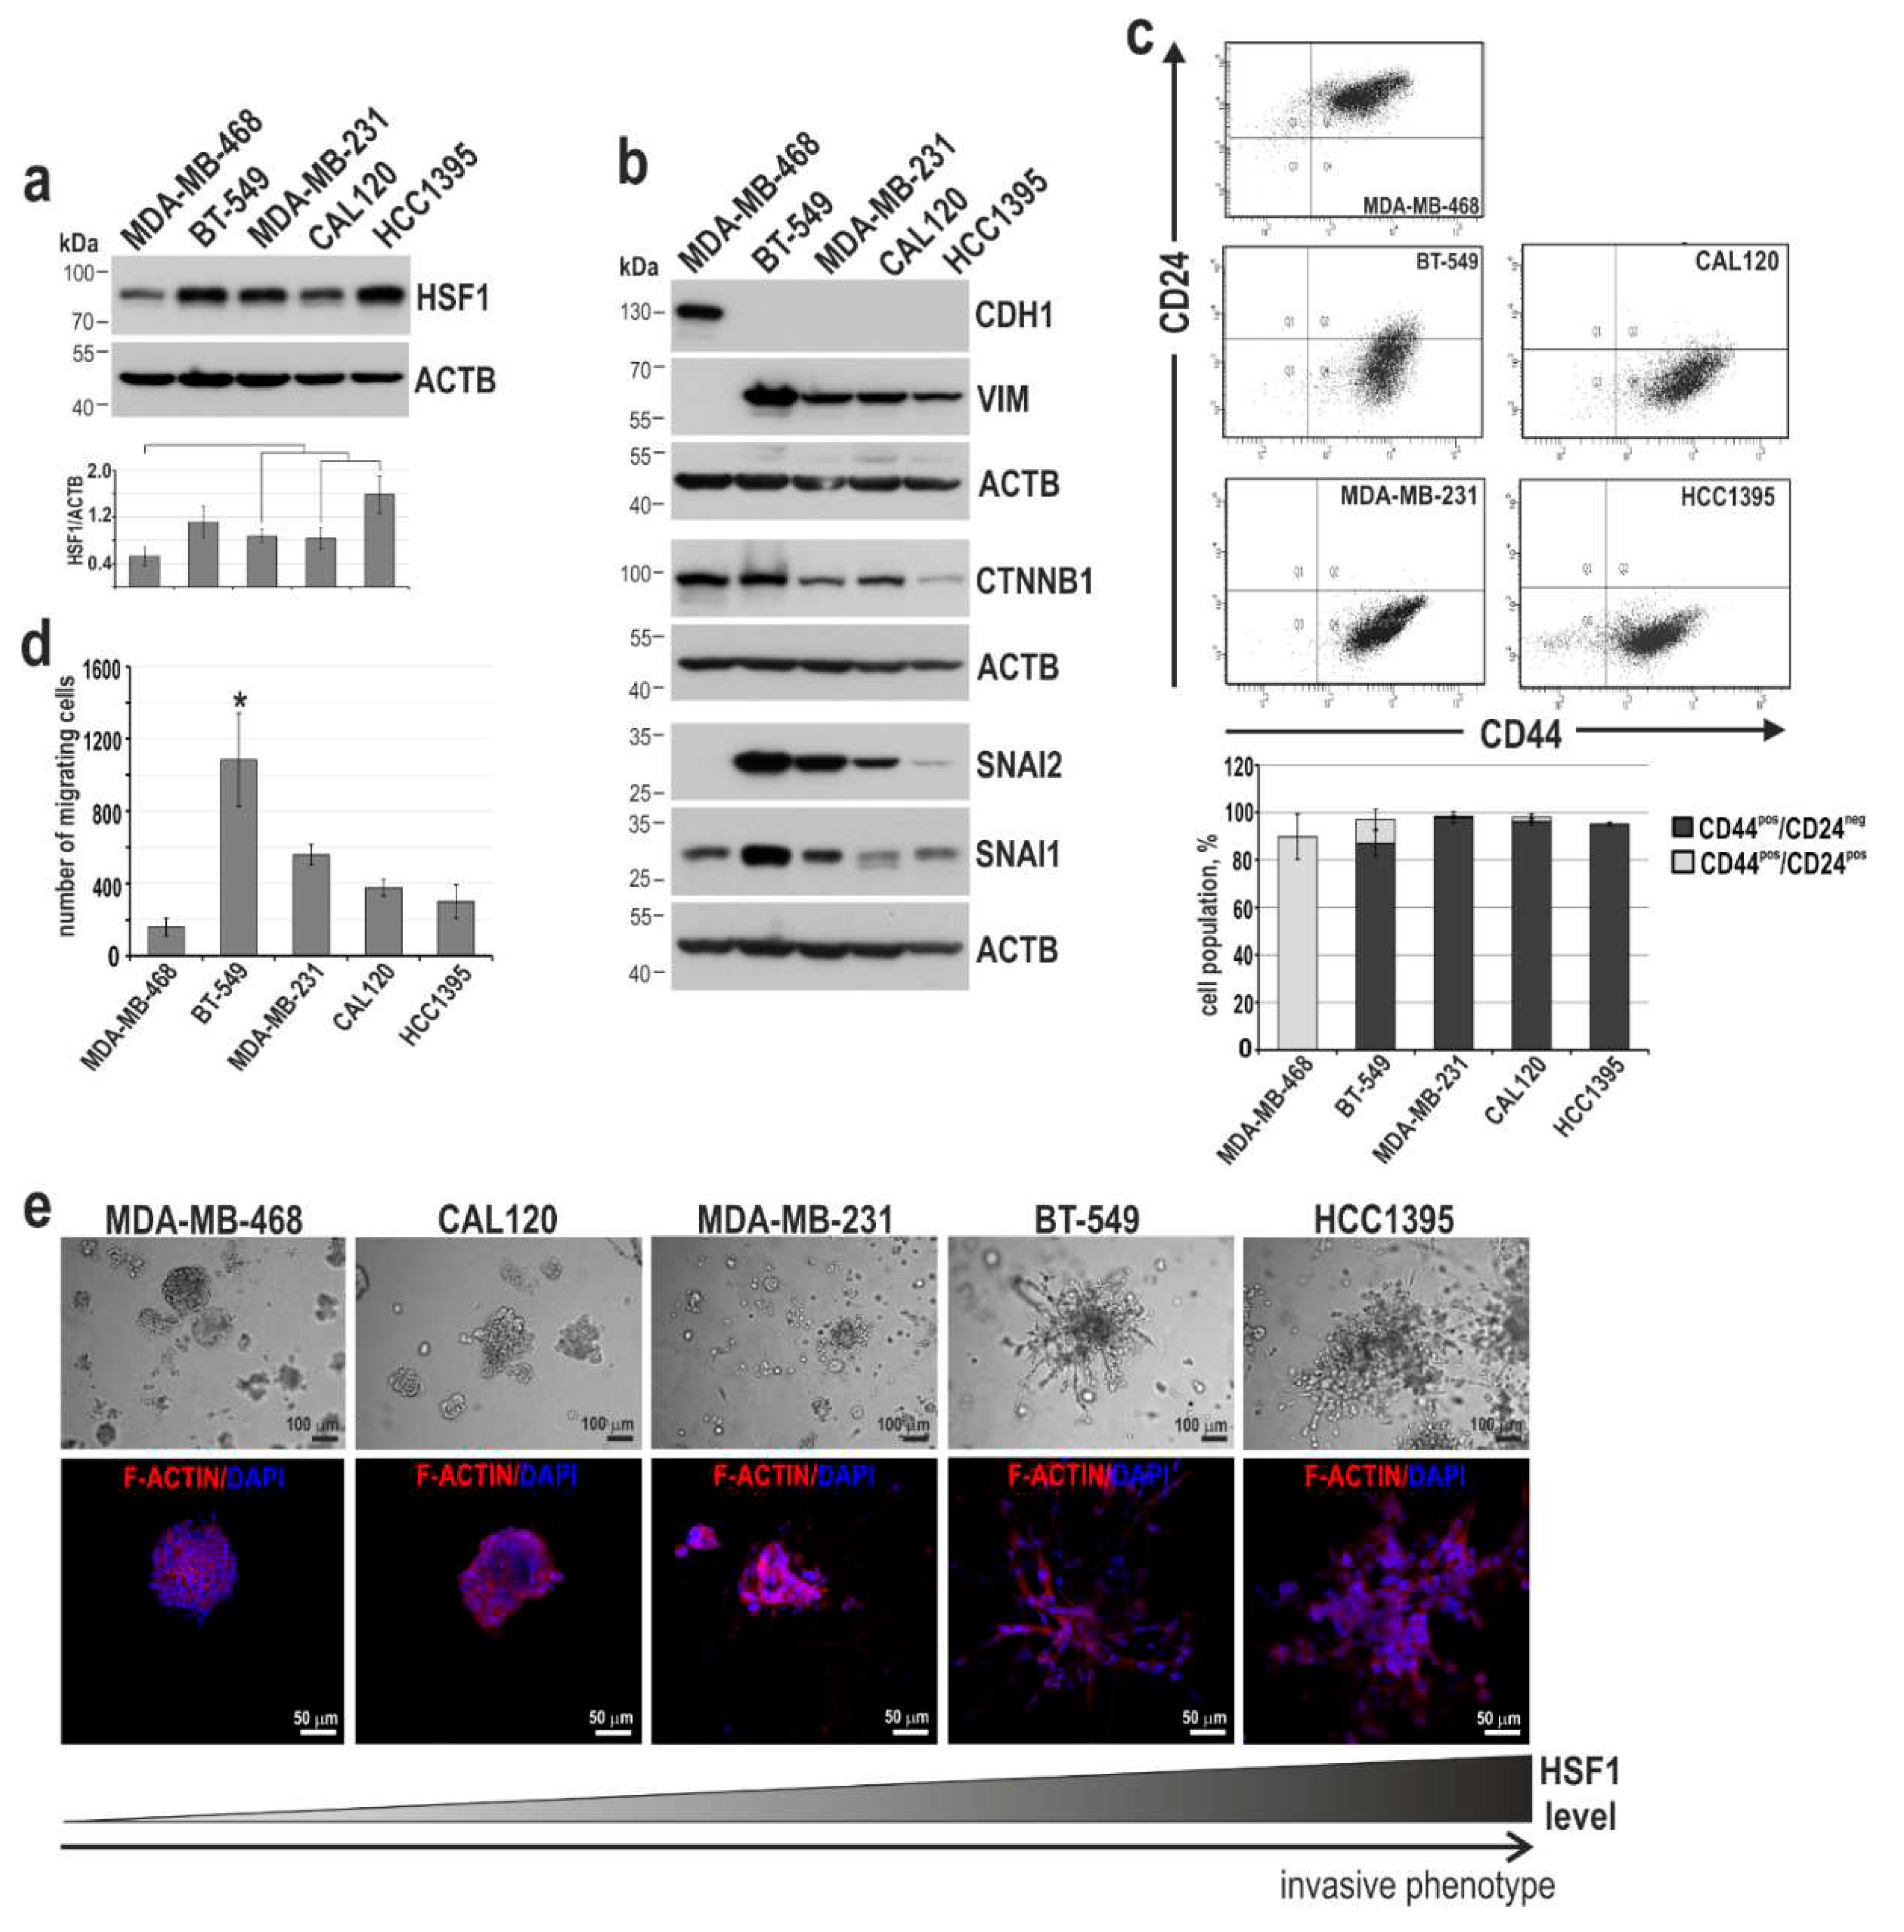
Figure 6.
Characterization of MDA-MB-468 cells overexpressing HSF1. (a) Western blot analysis of HSF1 and EMT markers. WT, unmodified cells; pLVX, cells transduced with lentiviruses containing the empty vector; HSF1-pLVX, cells transduced with lentiviruses containing the HSF1 cDNA. ACTB was used as a loading control. (b) Percentages of the CD24+/CD44+ subpopulations in cell variants defined by flow cytometry (the mean±SEM of three independent experiments). (c) The cell migration ability was analyzed by the Boyden chamber assay (n = 3). (d) The morphology of cell variants grown in matrigel for 7 or 14 days; phase-contrast images (scale bar 100 µm). (e) Confocal images of spheroids grown in matrigel for 14 days and stained for CDH1, F-actin, and DNA (scale bar 20 µm).
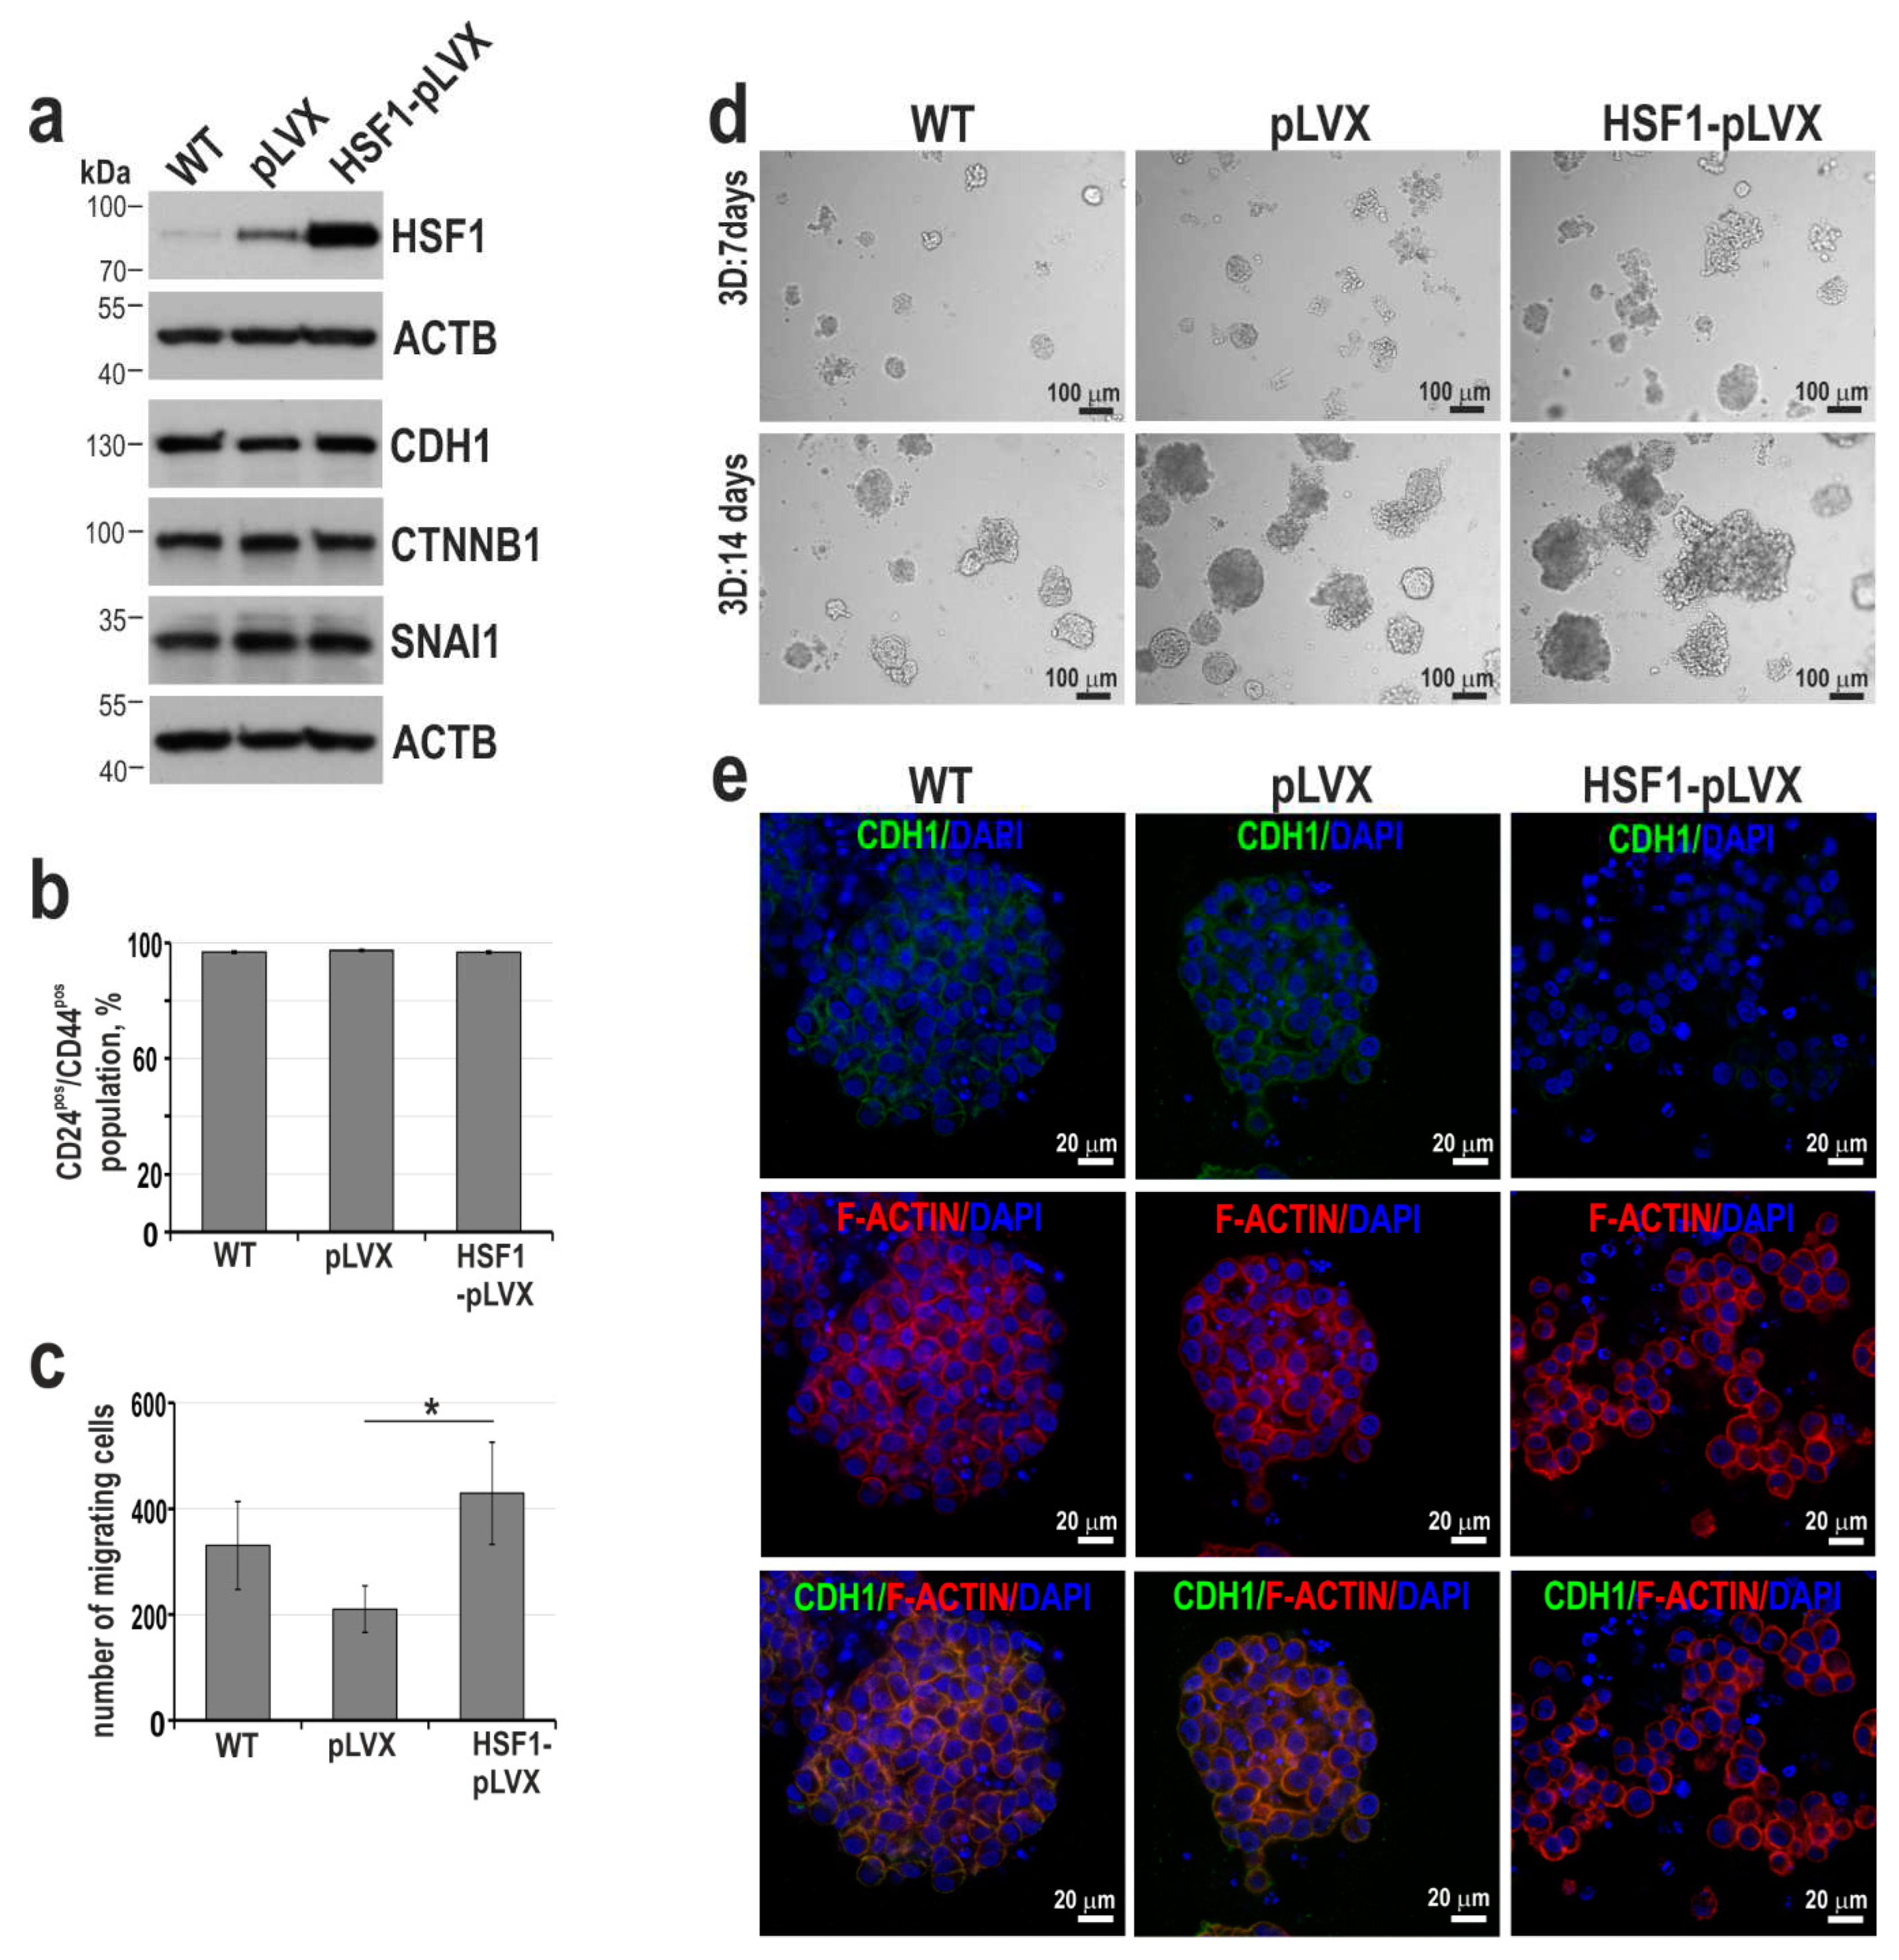
Figure 7.
The effect of HSF1 inhibitor, DTHIB, on BT-549 cell proliferation and growth in matrigel. (a) Viability of cells treated with DTHIB for 72 hours and assessed by MTS. IC50 plots and values were generated with the Quest Graph IC50 Calculator. (b) Western blot analysis of HSF1 expression in cells treated with DTHIB for 48 hours. ACTB was used as a loading control. The graphs below show the results of densitometric analyses (n = 3). (c) Western blot analysis of HSPA1 expression in cells pretreated with 5 μM DTHIB for 48 hours before heat shock (HS, 43°C for 1 hour and recovery at 37°C for 6 hours). ACTB was used as a loading control. The graph shows the results of densitometric analyses (n = 3). *p<0.05 (significance of differences). (d) The morphology of cells grown in matrigel for 7-21 days in the presence of DTHIB; phase-contrast images. The bottom panels are confocal images of spheroids grown in matrigel for 21 days and stained for F-actin and DNA (scale bar 50 µm).
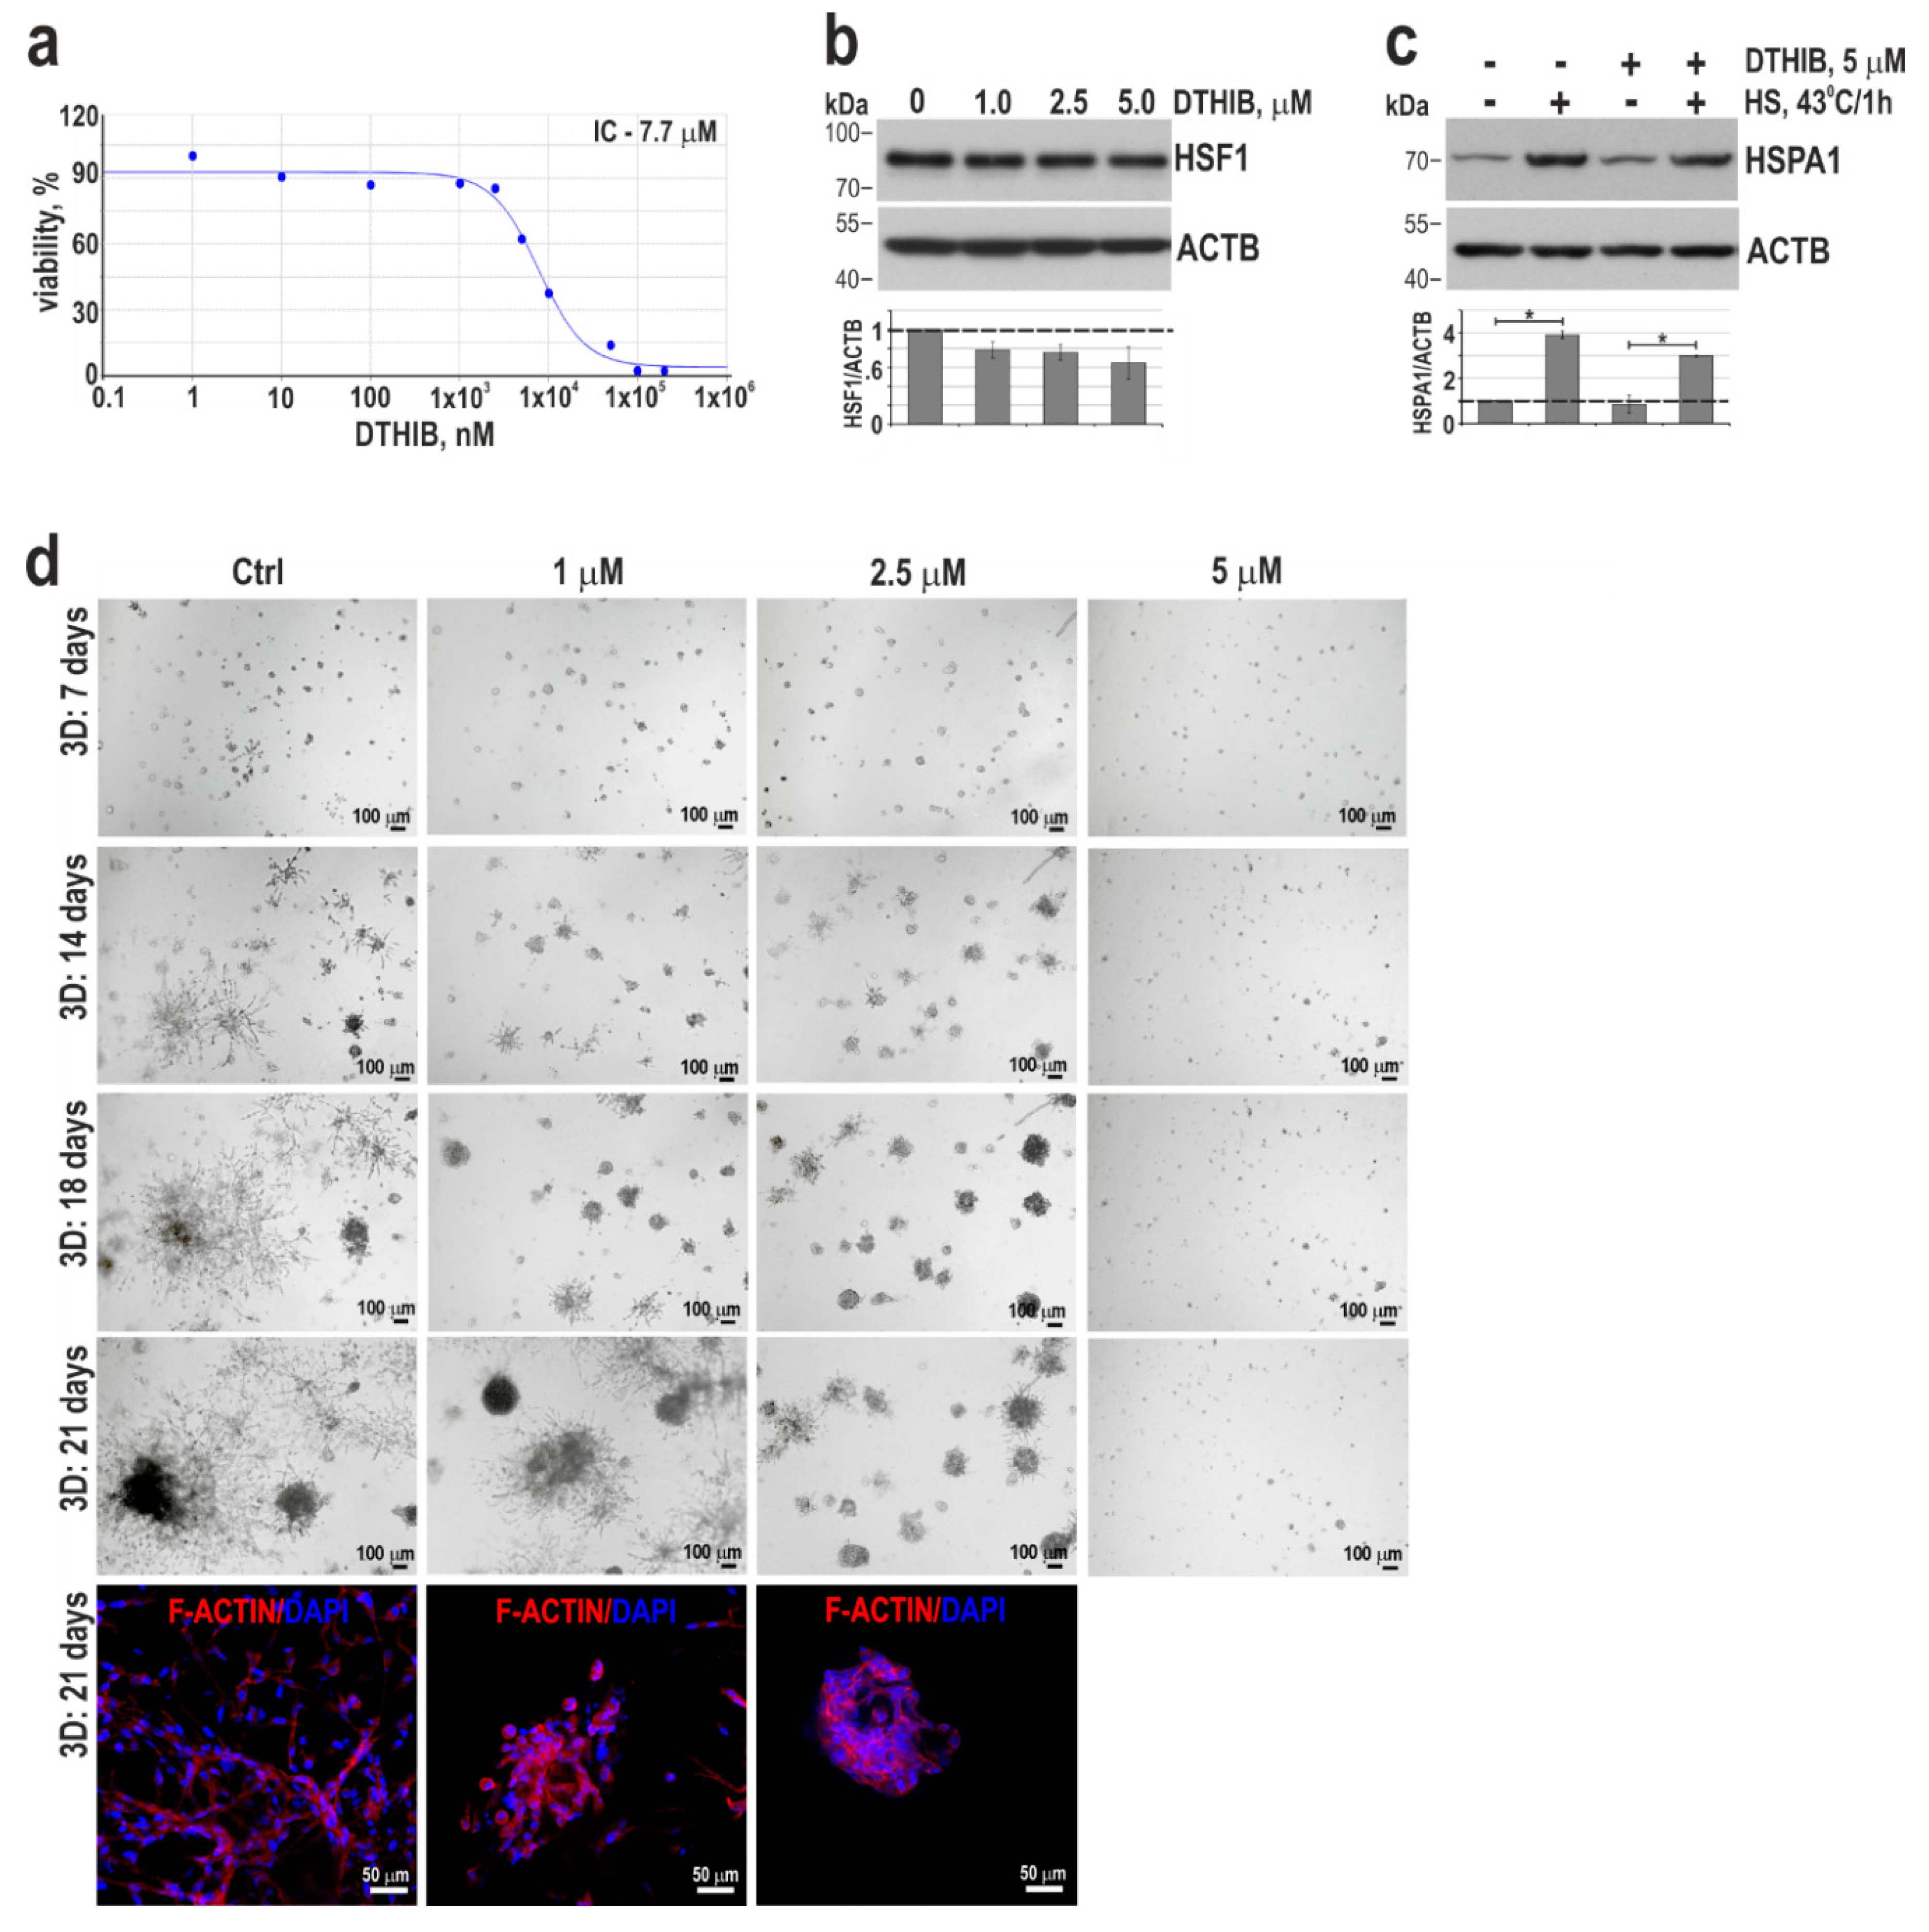

Table 1.
The enrichment of pathways in sets of genes down-regulated and up-regulated at least 2-fold (RNA-Seq analysis) in MCF10A cells overexpressing HSF1 in relation to wild-type cells was tested in PANTHER Pathways using the PANTHER Overrepresentation Test (PANTHER version 17.0 released 2022-02-22). Test Type: FISHER, Correction: FDR.
| PANTHER Pathways | No. of genes in the reference set | No. of affected genes | Fold enrichment | Raw P-value | FDR | |
|---|---|---|---|---|---|---|
| observed | expected | |||||
| Down-regulated (total: 1397) | ||||||
| Cadherin signaling pathway (P00012) | 166 | 33 | 11.14 | 2.96 | 2.98E-07 | 2.39E-05 |
| Alzheimer disease-presenilin pathway (P00004) | 131 | 24 | 8.79 | 2.73 | 3.81E-05 | 2.03E-03 |
| Wnt signaling pathway (P00057) | 314 | 40 | 21.08 | 1.90 | 3.50E-04 | 1.40E-02 |
| Up-regulated (total: 1106) | ||||||
| Serine glycine biosynthesis (P02776) | 6 | 4 | .32 | 12.31 | 1.13E-03 | 3.63E-02 |
| DNA replication (P00017) | 29 | 13 | 1.57 | 8.28 | 1.03E-07 | 1.64E-05 |
| p53 pathway feedback loops 2 (P04398) | 51 | 10 | 2.76 | 3.62 | 1.02E-03 | 4.06E-02 |
| p53 pathway (P00059) | 89 | 14 | 4.82 | 2. 90 | 7.89E-04 | 4.21E-02 |
| Up and down-regulated (total: 2503) | ||||||
| DNA replication (P00017) | 29 | 13 | 3.51 | 3.70 | 3.28E-04 | 1.31E-02 |
| Alzheimer disease-presenilin pathway (P00004) | 131 | 34 | 15.86 | 2.14 | 2.06E-04 | 1.65E-02 |
| Cadherin signaling pathway (P00012) | 166 | 40 | 20.09 | 1.99 | 2.53E-04 | 1.35E-02 |
Disclaimer/Publisher’s Note: The statements, opinions and data contained in all publications are solely those of the individual author(s) and contributor(s) and not of MDPI and/or the editor(s). MDPI and/or the editor(s) disclaim responsibility for any injury to people or property resulting from any ideas, methods, instructions or products referred to in the content. |
© 2023 by the authors. Licensee MDPI, Basel, Switzerland. This article is an open access article distributed under the terms and conditions of the Creative Commons Attribution (CC BY) license (http://creativecommons.org/licenses/by/4.0/).
Copyright: This open access article is published under a Creative Commons CC BY 4.0 license, which permit the free download, distribution, and reuse, provided that the author and preprint are cited in any reuse.


