
Submitted:
15 September 2023
Posted:
18 September 2023
You are already at the latest version
Abstract
Brugada syndrome (BrS) is an inherited disease characterized by right precordial ST-segment elevation on electrocardiograms (ECGs), and a high risk of life-threatening ventricular arrhyth-mia and sudden cardiac death. In BrS patients, except for SCN5A, mutations in other responsible genes are poorly elucidated. We identified a new missense mutation, c.1189C>T (p.R397C), in the KCNH2 gene in asymptomatic male proband with diagnosed BrS. We performed patch-clamp analysis on I(Kr) reconstituted with this KCNH2 mutation in Chinese hamster ovary cells and compared the phenotype with the wild type. We found that the R397C mutation increased the I(Kr) density. In silico modeling demonstrated that this missense mutation potentially leads to the shortening of action potential in the heart.
Keywords:
Brugada syndrome
; BrS
; KCNH2
; Kv11.1
; IKr
; patch-clamp
; inherited channelopathy
; gain-of-function
1. Introduction
Brugada syndrome (BrS) is characterized by ST-segment elevation in V1-V3 leads, negative T-wave on standard ECG, and a high risk of life-threatening ventricular arrhythmias and sudden cardiac death (SCD). This is an inherited disorder with a strong genetic background. Many familial cases fit with autosomal dominant inheritance, but recent studies suggest that the multifactorial model also has relevance [1]. The first genetic variation associated with BrS was identified with the loss-of-function mutations in the SCN5A gene encoding the α-subunit of the myocardial voltage-gated sodium channel (Nav1.5) [2,3] Mutations in this gene were later found in over 30% of patients with BrS [4]. To date, this is the only gene included in all guidelines for the routing genetic testing in BrS patients [5]. Nowadays more than 20 additional causative genes associated with the development of this cardiac pathology have been identified [6]. Mutations in the genes encoding potassium channels with a gain-of-function (GoF) mechanism lead to increased repolarizing potassium currents (Ito, If, IKs, IK-ATP), and can realize in the relative shortening of QTc interval and the Brugada pattern on ECG [7]. However, the causative role for mutations in other genes requires more evidence from clinical and functional data.
Among them a loss-of-function mutation in the Cav1.2 channel [8] and mutation in KCNAB2, which encodes the voltage-gated K+ channel β2-subunit (Kvβ2-R12Q) [9]. Several gain-of-function mutations in the HERG cardiac channel have also been identified [10]. Altogether, more than 450 mutations have been discovered that lead to various forms of BrS, but the phenotype-genotype correlation is still not completely understood and a vast majority of cases remain genetically unexplained [11,12].
We detected a novel genetic variant c.1189C>T (p.R397C) in the KCNH2 gene in asymptomatic male proband diagnosed with BrS. This variant was classified as a variant of uncertain significance (VUS) in 2013, and then re-classified based on current functional analysis to “Likely Pathogenic” (Class IV), according to ACMG (2015) criteria. We performed electrophysiological experiments and in silico modeling, which revealed that this is a gain-of-function mutation, which potentially leads to the shortening of action potential in ventricular myocardium.
2. Results
2.1. Clinical Case
Male proband, 18 y.o., competitive athlete (basketball), asymptomatic, was referred to the hospital because of detection of a spontaneous Brugada-like pattern during ECG screening before competition. Checkup included general examination, routine blood and electrolytes tests, repetitive resting ECG, 24-hours Holter monitoring, EchoCG, genetic counseling, and DNA testing.
Repetitive ECG test revealed ST segment elevation for 1-2 mm in V1-V3 leads, negative T-wave in V1 lead, relatively short QTc 380-388 ms, and increased QRS amplitude with a normal duration (Figure 1a). Slightly increased LV mass and thickness of LV wall up to 11 mm was considered as an athletic heart syndrome. At the time of first contact, his family history was unremarkable: both parents had no cardiac complaints. Resting ECG in mother was normal. Father (45 y.o. on the first contact) had Brugada-like changes in V1-V2 leads (Figure 1b) at resting ECG and a high-amplitude QRS complex. Examination with EchoCG was recommended for proband’s father, but he refused any further examination.
Genetic testing for proband’s DNA was performed using IonTorrent PGM platform (ThermoFisher Scientific, WA, USA). Panel of genes included 12 genes (KCNQ1, KCNH2, KCNJ2, KCNE1, KCNE2, SCN5A, SCN2B, SCN4B, SNTA1, CAV3, and RANGNFR) responsible for the most common repolarization disorders known in 2013. Novel genetic variant c.1189C>T (p.R397C) was found in the KCNH2 gene and confirmed by control capillary Sanger sequencing (Figure 1e). Mother was not a carrier of this variant (tested), father refused genetic testing. Thus, the variant was presumed to be of paternal or de novo origin. At the time of detection (2013), this finding was reported to the patient as a rare genetic variant of unknown significance (VUS). No treatment was prescribed, annual ECG testing, and elimination of environmental risk-factors (such as overheating, alcohol, some medications) was recommended.
In 2023, proband and family members were invited for genetic counseling to share results of the experimental study and to update clinical data. Pedigree was updated with new events that had happened in a family (Figure 1d): proband’s father died suddenly before 50 y.o. (alcohol intake cannot be excluded); and proband’s daughter was born normally, with normal milestones of physical, mental, and emotional development. Proband discontinued professional sport, but continued to participate in recreational exercise. He remained asymptomatic, and his resting ECG continued to present a spontaneous Brugada-pattern, along with increased QRS amplitude (Figure 1c).
2.2. Expression and Subcellular Localization
To check if this point mutation affects the Kv11.1 channel expression, we analyzed the protein levels by immunoblot. The point mutation was introduced into the KCNH2 cDNA, cloned into the appropriate vector, and expressed in Chinese hamster ovary cells (CHO-K1). An equal number of cells (60,000) were resuspended in PBS (10 uL) and loaded onto polyacrylamide gel. Cellular alpha-tubulin was used as loading control. Immunoblot analysis (Figure 2) showed clear differences in the Kv11.1 protein expression levels in the whole-cell lysates of CHO-K1 cells expressing wild-type (WT) or the R397C mutant. Mutated channel’s expression levels (homozygous expression) were significantly smaller (about 3 times), compared to the wild type channel. The heterozygous expression showed intermediate levels between WT and R397C mutant.
We also checked the membrane expression of the Kv11.1 channel using fluorescent microscopy of HEK297 cells expressing WT and R397C mutant channels, as well as heterozygous expression (Figure 3). All channel proteins showed substantial membrane localization. These data indicate that the mutation does not disturb the expression and membrane trafficking of the mutant Kv11.1 protein.
Electrophysiological properties
Next, we performed patch-clamp analysis on I(Kr) reconstituted with this KCNH2 mutation in CHO-K1 cells and compared the phenotype with a wild type. Both in the group of cells transfected only with plasmid containing p.R397C mutation and in the group transfected with mutated and WT plasmid in 1:1 ratio, the tail IKr current density was not significantly different from cells transfected with WT plasmid only (Figure 4 a,b). However, in both groups transfected with the p.R397C plasmid, the half-maximal potential (V50) of the steady-state activation curve was significantly shifted negatively by 4 and 2.3 mV, respectively (Table 1, Figure 4 c). In turn, the V50 of the steady-state inactivation curve was significantly shifted positively by 14.3 and 21.6 mV, respectively (Table 1, Figure 4 d).
Modeling of the Influence of Mutation on Simulated Human Ventricular AP
The effect of R397C mutation-induced remodeling of the IKr on the AP was evaluated by mathematical modeling methods. Models were generated based on the ionic model of human ventricular cardiomyocytes TP2006. The parameters of these models were obtained by individually fitting the activation, inactivation, and I-V curves for each experimental IKr record in each group.
Figure 5 (top row) shows the medians and interquartile range of AP in the homozygous R397C (left, red shadow) and heterozygous R397C+WT (right, green shadow) groups compared with the WT group (blue). The means and STDs for the APD50 and APD90 are shown in the bottom row of Figure 5. In both groups simulating the effect of the R397C mutation on IKr, the AP was shorter than in the control (WT). The mean APD50 and APD90 in the R397C group were lower than the control by 6.7% and 7.11%, and in R397C+WT by 11.74% and 11.89%, respectively. The differences in APD50 and APD90 between the R397C and WT groups and the R397C+WT and WT groups were significant (p < 0.05), whereas no statistically significant differences were found between the R397C and R397C+WT groups.
3. Discussion
We followed a proband diagnosed with BrS, carrying a R397C variant in the KCNH2 gene (Figure S1) considered as VUS, for 10 years. To the best of our knowledge, this variant has never been reported in BrS. To clarify the relationship between the R397C variant and the clinical phenotype, we inserted this substitution into the channel sequence and performed experimental investigations. We expressed WT and mutated channels in the heterologous expression system and found the strong influence of the mutated variant on the total protein expression level (Figure 2), but not on membrane distribution (Figure 3). It was shown before that alterations in KCNE2 expression have been linked to cardiac arrhythmia in diseased hearts [13].
Amino acid R397 belongs to the proximal N-terminal part of the hERG channel. Interestingly, the deletion of the proximal N-terminus in this channel has been shown to accelerate the time course of activation [14], suggesting that this region in the hERG channel is important for stabilizing its closed state [15].
Electrophysiological experiments showed that the p.R397C mutation, even as a heterozygote, when co-transfected with the WT gene, facilitates the activation of HERG channels, but hampers their inactivation, suggesting that p.R397C is a gain-of-function mutation. Thereby, this mutation can potentially lead to the enhancement of IKr and the subsequent shortening of cardiac action potentials, which is one of the prerequisites for BrS-associated arrhythmias. Remarkably, the expression levels of Kv11.1 were less for both homo- and heterozygous p.R397C mutant levels, comparing to WT channels. Nevertheless, the activated Myocardial areas (predominantly endocardium), with a preserved plateau in phase 2, have a long AP duration and can depolarize and reactivate an area that has a short AP (predominantly epicardium), forming premature ventricular complexes, which in turn can trigger polymorphic ventricular tachycardia (VT) and/or ventricular fibrillation (VF) [16]. Thus, the endocardium may become a source of re-excitation of prematurely repolarized epicardium. Antzelevitch and colleagues named such a mechanism of arrhythmia development "phase 2 reentry" [17]. Different repolarization rates in epi- and endocardial sections of the right ventricle provide conditions for the occurrence of ventricular arrhythmias by the reentry mechanism [18].
We performed modeling of the AP Groups of models WT, R397C and R397C+WT were generated and the effect of the R397C mutation on IK was simulated. We found that gain of function of the Ito current of both homo- and heterozygote R397C mutations lead to a shift of the epicardial AP to the left (Figure 5). This result possibly explains the Brugada phenotype and may predispose to phase 2 reentry and fatal ventricular arrhythmias [19].
As a conclusion, clinical and electrophysiological data are crucial in determining the pathogenic role of a genetic variant, particularly those characterized as VUS. As a result of our physiological studies, our proband was characterized as low risk for arrhythmic events.
4. Materials and Methods
Clinical and Genetic Evaluation
A clinical and genetic evaluation was performed in accordance with the principles of the Declaration of Helsinki and with the written informed consent of adult family members. Instrumental examination included general examination, collection of personal and family history, general biochemical blood tests, resting and standing ECG 24 h Holter ECG monitoring, and echocardiography (EchoCG). A genetic study for proband was performed on DNA samples isolated from venous blood leukocytes, according to standard protocol.
Genetic investigation was performed by NGS sequencing based on the IonTorrent platform (ThermoFisher Scientific, Waltham, Massachusetts, USA) of 11 genes encoding cardiac ion channels (SCN5A, SCN1B, SCN2B, SCN3B, SCN4B, KCNQ1, KCNH2, KCNJ2, KCNE1, KCNE2, CAV3, and RANGRF).
The primary processing of the reads was performed using the Ion Proton Software (Thermo Fisher Scientific). The reference DNA sequence of the hg19 version was aligned using the BWA 0.7.9 software. The evaluation of the pathogenicity of the identified variants was performed using the ACMG2015 pathogenicity criteria (Richards et al., 2015). All identified variants of III-V pathogenicity classes were confirmed by an independent method, direct Sanger bi-directional sequencing on an ABI 3730XL DNA Analyzer (Thermo Fisher Scientific, Waltham, Massachusetts, USA).
Introduction of a Point Mutation into a Channel Sequence
In a coding sequence for hERG, silent mutations were inserted to generate specific enzyme restriction sites over 3478 bp. This optimized sequence was subcloned in the pcDNA5/FRT/TO vector (Invitrogen, MA, USA) and was used as a model for the directed mutagenesis of this ion channel.
We constructed missense mutation of interest using the Gibson assembly strategy (NEBuilder HiFi DNA Assembly Master Mix E2621S, New England BioLabs, MA, USA). To insert the mutation, we amplify mutated overlapping fragments between two optimized restrictions sites (Q5 Hot start High-Fidelity DNA polymerase M0493S, New England BioLabs, MA, USA). For each construct, four primers were designed. Two external primers overlapped the sequences of two adjacent unique enzyme restriction sites and two internal primers, containing the mutation to be introduced, covered the mutated nucleotide sequence in the forward and reverse directions (KpnI to R397C, forward: CACCTCGGACTCCGACCTC; reverse: GGATGGTCCAGCaGTGGA; R397C to NsiI, forward:CCGCGCATCCACtGCTGG, reverse: GTTGCCGATGGCGTACCAG). Using the plasmid template digested by the selected enzymes and the two mutated amplified fragments, the Gibson's assembly process was used for the production of the mutated plasmid. The plasmids were amplified using the NEB 10-beta competent E.coli C3019H bacterial strain (New England BioLabs, MA, USA) and the sequences were confirmed by Sanger sequencing.
Cell Culture and Transfection
The wild type and mutated plasmids were transfected into CHO-K1 cells. The cells were grown in Petri dishes in DMEM medium with alanyl-glutamine (PanEco, Russia) with the addition of 10% bovine fetal serum (Biosera, France) in an atmosphere of 5% CO2 at 37°C.
For western blotting and fluorescent microscopy, a cell culture of the line HEK293 cells was used. The cells were seeded 24 hrs before transfection and raised to 70-80% confluency. The culture medium was replaced with a fresh one before transfection. To prepare transfection mixture to a solution containing 10 μg of plasmid DNA and 0.25 M CaCl2 in TE buffer (10 mM Tris-Cl, 1 mM EDTA, pH 7.4), a solution of 2x HEPES-BS buffer (0.28 M NaCl, 0.05 M HEPES, 1.5 mM Na2HPO4, pH 7.05) was added. The mixture was incubated for 1 min at room temperature to form colloidal crystals of calcium phosphate, then gently digested into a cup, stirred by rocking.
Fluorescent Microscopy
Forty-eight hrs after the transfection, the cells were fixed with 1.5% paraformaldehyde, permeabilized with 0.1% triton X-100 in PBS, blocked with 1% BSA in PBST, and stained with the primary polyclonal antibody against the HERG channel (PA3-860). Secondary antibody are Goat Anti-Rabbit IgG H&L Alexa Fluor® 555 conjugated antibodies (Abcam, Waltham, MA, USA). Nuclei were stained with DAPI.
Immunoblotting
Wild type and mutant protein expression were analyzed by SDS–PAGE and immunoblotting with anti-hERG primary antibodies (KCNH2 Polyclonal Antibody, PA3860, Thermo Scientific, 1:10000). The signal of the target protein was normalized using anti-α-tubulin antibodies (TUBA1A Monoclonal Antibody, CUSABIO, 1:10000). We used peroxidase-conjugated secondary antibodies (Goat Anti-Mouse IgG (H + L)-HRP Conjugate and Goat Anti-Rabbit IgG (H + L)-HRP Conjugate, Bio-Rad, 1:10000). The expression levels were estimated using ImageLab software (BioRad, Hercules, CA, USA).
Electrophysiology
Electrophysiological recordings of integral rapid delayed rectifier K+ current (IKr) were performed using the standard whole-cell patch clamp. A cover glass with CHO-K1 cell culture was placed in the experimental chamber (RCP-10T, Dagan, Maryland, MI, USA, volume 150 µL) and superfused at the rate of about 1.5 ml min-1 at room temperature with external K+-based physiological saline solution containing (in mmol L-1) NaCl 150, KCl 5.4, NaH2PO4 0.4, MgSO4 1.5, CaCl2 1.8, glucose 10 and HEPES 10 at pH 7.6 (adjusted with NaOH). Ionic currents were recorded in the voltage-clamp mode of the whole-cell patch-clamp technique using the Axopatch 200B amplifier (Molecular Devices, CA, USA) and WinWCP v.4.8.7 software (University of Strathclyde, UK). Patch pipettes of 2-2.5 MΩ resistance were pulled from borosilicate glass (Sutter Instruments, USA). Pipette capacitance, access resistance, and whole cell capacitance were routinely compensated.
For recording of IKr, the standard external K+-based physiological solution was used in combination with pipettes filled with K+-based electrode solution containing (in mmol l-1): 140 KCl, 1 MgCl2, 5 EGTA, 4 MgATP, 0.3 Na2GTP and 10 HEPES with pH adjusted to 7.2 with KOH. To obtain the I-V curve and steady-state activation curve, IKr was elicited by a double-pulse protocol (one sweep every 10 s) from the holding potential of −80 mV. An initial 2-s depolarization from −60 to +60 mV (in 10 mV steps) was followed by a 2-s repolarization to −40 mV allowing to measure tail current (see Figure 4 inset). To obtain a steady-state inactivation curve, the cell was depolarized (one sweep, each 5 s) to +40 mV for 1 s, then briefly (15 ms) hyperpolarized to potentials from +30 to -120 mV in 10 mV steps and depolarized again to +40 mV for 0.5 s in order to obtain a peak current after release of C-type inactivation by 15 ms hyperpolarization (see Figure 4 inset). IKr activation and inactivation curves were obtained from the tail currents and fitted by Boltzmann equations.
Computer Simulations of Human Ventricular Action Potential
The ionic cellular model of human ventricular cardiomyocyte TP2006 (endocardial version) was used to simulate the effect of the R397C mutation on the action potential (AP) [20]. The TP2006 model is based on the classical formulation of Hodgkin and Huxley (1952) [21] and is a set of nonlinear ordinary differential equations. It has been widely used in many studies [22,23,24], the evaluation of the effect of mutation-induced remodeling of transmembrane channels on the electrophysiological properties of cardiomyocytes [25,26] and the heart [27,28]. This model contains a description of 12 major K+, Ca2+ and Na+ transmembrane currents, exchangers and pumps, including the rapid delayed rectifier K+ current (IKr) with two gating variables: activation and inactivation [29]. Intracellular calcium dynamics are represented by the single-component sarcoplasmic reticulum, the calcium uptake into it by SR Ca2+-ATPase, and the calcium release from it by the ryanodine receptors.
The TP2006 model is based primarily on data obtained at physiological temperatures (about 37°C). When they were unavailable, model developers used data obtained at room temperatures, but extrapolated to physiological temperatures using Q10 factors (e. g., for time constants) and linear extrapolation (e. g., for V50) [29]. Since the experimental IKr records in this study were obtained at room temperatures, we performed the following transformations before using them to fit the models. First, activation and I-V curves were translated to the left (toward more negative voltages) by 15.05 mV. Second, the inactivation curves were shifted to the right (towards less negative voltages) by 13.25 mV. These translations are consistent with the literature data on the effect of temperature on V50 activation [30] and inactivation [31], respectively. Note also that increasing the room temperature to physiological values, according to the same sources, does not change the slope of the activation [30] and inactivation curves [31]. Another important transformation of the data is attributed to the fact that the current density obtained in the heterologous expression system in absolute values is greater than the density in the native cardiomyocyte. To eliminate this difference, the I-V curves were scaled using a common multiplicative coefficient for all groups, selected so that the average density in the WT group was equal to the IKr density at +40 mV in the original TP2006 model.
Each transformed experimental record was used to fit the IKr parameters using the least squares method. At first, the steady-state IKr activation and inactivation curves in the model were matched to the experimental ones by fitting the corresponding V50 and slope parameters. Then these kinetic parameters were substituted into the model and the maximum conductivity IKr (gKr) was fitted so that the simulated I-V curve corresponded to the experimental one. The cellular models obtained as described above differed from each other by five IKr parameters and, according to them, were divided into homozygous WT, R397C, and heterozygous R397C+WT groups corresponding to the eponymous experimental groups.
The AP for each model was recorded after reaching a steady state at a stimulation frequency of 1 Hz. To reach the steady state, 100 APs were calculated. The following characteristics of the simulated AP were measured: AP duration at 50% (APD50) or 90% (APD90) repolarization. СVODE solver (absolute tolerance = 1 × 10⁻⁶, relative tolerance = 0.0001) [32] and the Myokit software package [33] were used to solve the cell model equations.
Statistics
Normality of distribution and equality of variances were checked using the Shapiro–Wilk normality test and Bartlett's test, respectively. The simulated APD50 and APD90 were compared using the one-way ANOVA with Dunnett’s T3 post hoc test (for unequal variance). Statistical analysis was performed with statistical programming language R (version 4.3.0) [34] and the PMCMRplus package (version 1.9.6) [35].
Supplementary Materials
The following supporting information can be downloaded at the website of this paper posted on Preprints.org, Figure S1: Heterozygous variant NM_000238:c.1189C>T (p.R397C) in the KCNH2 gene found by NGS sequencing based on IonTorrent PGM platform (ThermoFisher Scientific, USA). Visualization made in the Integrative Genome Viewer. Heterozygous variant is marked by arrow.
Author Contributions
Conceptualization, O.S.S. and E.Z.; methodology, D.V.A., A.S. and G.L.; software, T.N.; formal analysis, T.N.; investigation, B.L., H.Z. and E.K.; writing—original draft preparation, O.S.S.; writing—review and editing, O.S.S., D.V.A. and E.Z.; visualization, H.Z.; supervision, E.Z., O.S.S.; funding acquisition, O.S.S. All authors have read and agreed to the published version of the manuscript.
Funding
This research was funded by the Russian Science Foundation, grant number 22-14-00088.
Institutional Review Board Statement
Clinical and genetic evaluation was performed in accordance with the principles of the Declaration of Helsinki.
Informed Consent Statement
Informed consent was obtained from all subjects involved in the study.
Acknowledgments
Authors thank Dr. Gildas Loussouarn for fruitful discussions. BL and HZ acknowledge Shenzhen Municipal Government and Shenzhen MSU-BIT University support.
Conflicts of Interest
The authors declare no conflict of interest.
References
- Cerrone, M.; Costa, S.; Delmar, M. The Genetics of Brugada Syndrome. Annual review of genomics and human genetics, 2022, 23, 255–274. [Google Scholar] [CrossRef]
- Chen, Q.; Kirsch, G.E.; Zhang, D.; Brugada, R.; Brugada, J.; Brugada, P.; et al. Genetic basis and molecular mechanism for idiopathic ventricular fibrillation. Nature. 1998, 392, 293–296. [Google Scholar] [CrossRef]
- Brugada, J.; Campuzano, O.; Arbelo, E.; Sarquella-Brugada, G.; Brugada, R. Present Status of Brugada Syndrome: JACC State-of-the-Art Review. J Am Coll Cardiol. 2018, 72, 1046–1059. [Google Scholar] [CrossRef] [PubMed]
- Priori, S.G.; Napolitano, C.; Schwartz, P.J.; Bloise, R.; Crotti, L.; Ronchetti, E. The elusive link between LQT3 and Brugada syndrome: the role of flecainide challenge. Circulation. 2000, 102, 945–947. [Google Scholar] [CrossRef] [PubMed]
- Wilde AA, M.; Semsarian, C.; Márquez, M.F.; Shamloo, A.S.; Ackerman, M.J.; Ashley, E.A.; Sternick, E.B.; Barajas-Martinez, H.; Behr, E.R.; Bezzina, C.R.; Breckpot, J.; Charron, P.; Chockalingam, P.; Crotti, L.; Gollob, M.H.; Lubitz, S.; Makita, N.; Ohno, S.; Ortiz-Genga, M.; Sacilotto, L.; et al. European Heart Rhythm Association (EHRA)/Heart Rhythm Society (HRS)/Asia Pacific Heart Rhythm Society (APHRS)/Latin American Heart Rhythm Society (LAHRS) Expert Consensus Statement on the state of genetic testing for cardiac diseases. EP Europace : EHJ arrhythmias, and cardiac electrophysiology 2022, 24, 1307–1367. [Google Scholar] [CrossRef]
- Zhang, J.; Sacher, F.; Hoffmayer, K.; O’Hara, T.; Strom, M.; Cuculich, P.; et al. Cardiac electrophysiological substrate underlying the ECG phenotype and electrogram abnormalities in Brugada syndrome patients. Circulation 2015, 131, 1950–1959. [Google Scholar] [CrossRef] [PubMed]
- Campuzano, O.; Fernandez-Falgueras, A.; Lemus, X.; Sarquella-Brugada, G.; Cesar, S.; Coll, M.; Mates, J.; Arbelo, E.; Jordà, P.; Perez-Serra, A.; Del Olmo, B.; Ferrer-Costa, C.; Iglesias, A.; Fiol, V.; Puigmulé; M; Lopez, L.; Pico, F.; Brugada, J.; Brugada, R. Short QT Syndrome: A Comprehensive Genetic Interpretation and Clinical Translation of Rare Variants. Journal of clinical medicine, 2019, 8, 1035. [CrossRef]
- Béziau, D.M.; Barc, J.; O'Hara, T.; Le Gloan, L.; Amarouch, M.Y.; Solnon, A.; Pavin, D.; Lecointe, S.; Bouillet, P.; Gourraud, J.B.; Guicheney, P.; Denjoy, I.; Redon, R.; Mabo, P.; le Marec, H.; Loussouarn, G.; Kyndt, F.; Schott, J.J.; Probst, V.; Baró, I. Complex Brugada syndrome inheritance in a family harbouring compound SCN5A and CACNA1C mutations. Basic Res Cardiol. 2014, 109, 446. [Google Scholar] [CrossRef]
- Portero, V.; Le Scouarnec, S.; Es-Salah-Lamoureux, Z.; Burel, S.; Gourraud, J.B.; Bonnaud, S.; Lindenbaum, P.; Simonet, F.; Violleau, J.; Baron, E.; Moreau, E.; Scott, C.; Chatel, S.; Loussouarn, G.; O'Hara, T.; Mabo, P.; Dina, C.; Le Marec, H.; Schott, J.J.; Probst, V.; Baró, I.; Marionneau, C.; Charpentier, F.; Redon, R. Dysfunction of the Voltage-Gated K+ Channel β2 Subunit in a Familial Case of Brugada Syndrome. J Am Heart Assoc. 2016, 5, e003122. [Google Scholar] [CrossRef] [PubMed]
- Wang, Q.I.; Ohno, S.; Ding, W.G.; Fukuyama, M.; Miyamoto, A.; Itoh, H.; Makiyama, T.; Wu, J.; Bai, J.; Hasegawa, K.; Shinohara, T.; Takahashi, N.; Shimizu, A.; Matsuura, H.; Horie, M. Gain-of-function KCNH2 mutations in patients with Brugada syndrome. J Cardiovasc Electrophysiol. 2014, 25, 522–530. [Google Scholar] [CrossRef]
- Martínez-Barrios, E.; Grassi, S.; Brión, M.; Toro, R.; Cesar, S.; Cruzalegui, J.; Coll, M.; Alcalde, M.; Brugada, R.; Greco, A.; Ortega-Sánchez, M.L.; Barberia, E.; Oliva, A.; Sarquella-Brugada, G.; Campuzano, O. Molecular autopsy: Twenty years of post-mortem diagnosis in sudden cardiac death. Front Med (Lausanne). 2023, 2013, 1118585. [Google Scholar] [CrossRef]
- Popa, I.P.; Șerban, D.N.; Mărănducă, M.A.; Șerban, I.L.; Tamba, B.I.; Tudorancea, I. Brugada Syndrome: From Molecular Mechanisms and Genetics to Risk Stratification. Int J Mol Sci. 2023, 24, 3328. [Google Scholar] [CrossRef] [PubMed]
- Jiang, M.; Zhang, M.; Tang, D.G.; Clemo, H.F.; Liu, J.; Holwitt, D.; Kasirajan, V.; Pond, A.L.; Wettwer, E.; Tseng, G.N. KCNE2 protein is expressed in ventricles of different species, and changes in its expression contribute to electrical remodeling in diseased hearts. Circulation. 2004, 109, 1783–1788. [Google Scholar] [CrossRef] [PubMed]
- Alonso-Ron, C.; de la Peña, P.; Miranda, P.; Dominguez, P.; Barros, F. Thermodynamic and kinetic properties of amino-terminal and S4-S5 loop HERG channel mutants under steady-state conditions. Biophys. J. 2008, 94, 3893–3911. [Google Scholar] [CrossRef]
- Cheng, Y.M.; Claydon, T.W. Voltage-dependent gating of HERG potassium channels. Front Pharmacol. 2012, 3, 83. [Google Scholar] [CrossRef]
- Morita, H.; Zipes, D.P.; Morita, S.T.; et al. Differences in arrhythmogenicity between the canine right ventricular outflow tract and anteroinferior right ventricle in a model of BrS. Heart Rhythm 2007, 4, 66–74. [Google Scholar] [CrossRef]
- Antzelevitch, C.; Brugada, P.; Borggrefe, M.; Brugada, J.; Brugada, R.; Corrado, D.; et al. Brugada syndrome: report of the second consensus conference: endorsed by the Heart Rhythm Society and the European Heart Rhythm Association. Circulation 2005, 111, 659–670. [Google Scholar] [CrossRef] [PubMed]
- Szél, T.; Antzelevitch, C. Abnormal repolarization as the basis for late potentials and fractionated electrograms recorded from epicardium in experimental models of Brugada syndrome. J Am Coll Cardiol. 2014, 63, 2037–2045. [Google Scholar] [CrossRef]
- Calloe, K.; Cordeiro, J.M.; Di Diego, J.M.; Hansen, R.S.; Grunnet, M.; Olesen, S.P.; et al. A transient outward potassium current activator recapitulates the electrocardiographic manifestations of Brugada syndrome. Cardiovasc Res 2009, 81, 686–694. [Google Scholar] [CrossRef] [PubMed]
- Ten Tusscher, K.H.; Panfilov, A.V. Alternans and spiral breakup in a human ventricular tissue model. American Journal of Physiology-Heart and Circulatory Physiology, 2006, 291, H1088–H1100. [Google Scholar] [CrossRef]
- Hodgkin, A.L.; Huxley, A.F. A quantitative description of membrane current and its application to conduction and excitation in nerve. The Journal of physiology, 1952, 117, 500. [Google Scholar] [CrossRef]
- Maleckar, M.M.; Myklebust, L.; Uv, J.; Florvaag, P.M.; Strøm, V.; Glinge, C.; Jabbari, R.; Vejlstrup, N.; Engstrøm, T.; Ahtarovski, K.; et al. Combined In-Silico and Machine Learning Approaches Toward Predicting Arrhythmic Risk in Post-Infarction Patients. Front. Physiol. 2021, 12, 745349. [Google Scholar] [CrossRef]
- Lopez-Perez, A.; Sebastian, R.; Izquierdo, M.; Ruiz, R.; Bishop, M.; Ferrero, J.M. Personalized cardiac computational models: from clinical data to simulation of infarct-related ventricular tachycardia. Frontiers in physiology, 2019, 10, 580. [Google Scholar] [CrossRef]
- Regazzoni, F.; Dedè, L.; Quarteroni, A. Biophysically detailed mathematical models of multiscale cardiac active mechanics. PLoS computational biology, 2020, 16, e1008294. [Google Scholar] [CrossRef] [PubMed]
- Du, C.; Rasmusson, R.L.; Bett, G.C.; Franks, B.; Zhang, H.; Hancox, J.C. Investigation of the Effects of the Short QT Syndrome D172N Kir2.1 Mutation on Ventricular Action Potential Profile Using Dynamic Clamp. Front. Pharmacol. 2022, 12, 794620. [Google Scholar] [CrossRef]
- Karlova, M.; Abramochkin, D.V.; Pustovit, K.B.; Nesterova, T.; Novoseletsky, V.; Loussouarn, G.; Sokolova, O.S. Disruption of a conservative motif in the C-terminal loop of the KCNQ1 channel causes LQT syndrome. International Journal of Molecular Sciences, 2022, 23, 7953. [Google Scholar] [CrossRef] [PubMed]
- Adeniran, I.; Whittaker, D.G.; El Harchi, A.; Hancox, J.C.; Zhang, H. In silico investigation of a KCNQ1 mutation associated with short QT syndrome. Scientific reports, 2017, 7, 8469. [Google Scholar] [CrossRef]
- Jeong, D.U.; Lee, J.; Lim, K.M. Computational Study to Identify the Effects of the KCNJ2 E299V Mutation in Cardiac Pumping Capacity. Comput. Math. Methods Med. 2020, 7194275. [Google Scholar] [CrossRef]
- Ten Tusscher, K.H.; Noble, D.; Noble, P.J.; Panfilov, A.V. A model for human ventricular tissue. American Journal of Physiology-Heart and Circulatory Physiology, 2004, 286, H1573–H1589. [Google Scholar] [CrossRef] [PubMed]
- Zhou, Z.; Gong, Q.; Ye, B.; Fan, Z.; Makielski, J.C.; Robertson, G.A.; January, C.T. Properties of HERG channels stably expressed in HEK 293 cells studied at physiological temperature. Biophysical journal, 1998, 74, 230–241. [Google Scholar] [CrossRef] [PubMed]
- Vandenberg, J.I.; Varghese, A.; Lu, Y.; Bursill, J.A.; Mahaut-Smith, M.P.; Huang CL, H. Temperature dependence of human ether-a-go-go-related gene K+ currents. American Journal of Physiology-Cell Physiology, 2006, 291, C165–C175. [Google Scholar] [CrossRef] [PubMed]
- Hindmarsh, A.C.; Brown, P.N.; Grant, K.E.; Lee, S.L.; Serban, R.; Shumaker, D.E.; Woodward, C.S. SUNDIALS: Suite of nonlinear and differential/algebraic equation solvers. ACM Trans. Math. Softw. TOMS 2005, 31, 363–396. [Google Scholar] [CrossRef]
- Clerx, M.; Collins, P.; de Lange, E.; Volders, P.G. Myokit: A simple interface to cardiac cellular electrophysiology. Prog. Biophys. Mol. Biol. 2016, 120, 100–114. [Google Scholar] [CrossRef] [PubMed]
- R Core Team. R: A language and environment for statistical computing. 2015. Available online: https://www.R-project.org/ (accessed on 26 April 2023).
- Pohlert T. PMCMRplus: calculate pairwise multiple comparisons of mean rank sums extended. R package version 1.4.0. 2018. Available from: https://CRAN.R-project.org/package=PMCMRplus. Accessed April 26, 2023. 26 April.
Figure 1.
(a) ECG of the proband at 18 y.o. (2013). HR 57-64 bpm, QTc 380-388 ms, QRS 80 ms, high-amplitude QRS, spontaneous Brugada-pattern is marked by arrow. (b) ECG of the proband’s father at 45 y.o. (2013). HR 62-69 bpm, QRS 90 ms, QTc 385-392 ms, spontaneous Brugada-like pattern at the V1 is marked by arrow. (c) ECG of the proband at 28 y.o. (2023). HR 69-81 bpm, QTc 350-368 ms, QRS 80 ms, high-amplitude QRS, spontaneous Brugada-pattern is marked by arrow. (d) Pedigree of the family CHD15. Proband is marked by arrow. Open symbols represent healthy family members, closed symbols represent family members with Brugada-like ECG. SCD – sudden cardiac death. (e) Fragment of the capillary Sanger sequencing of the exon 6 in the KCNH2 gene. Heterozygous c.1189C>T substitution (p.R397C) is marked by red arrow.
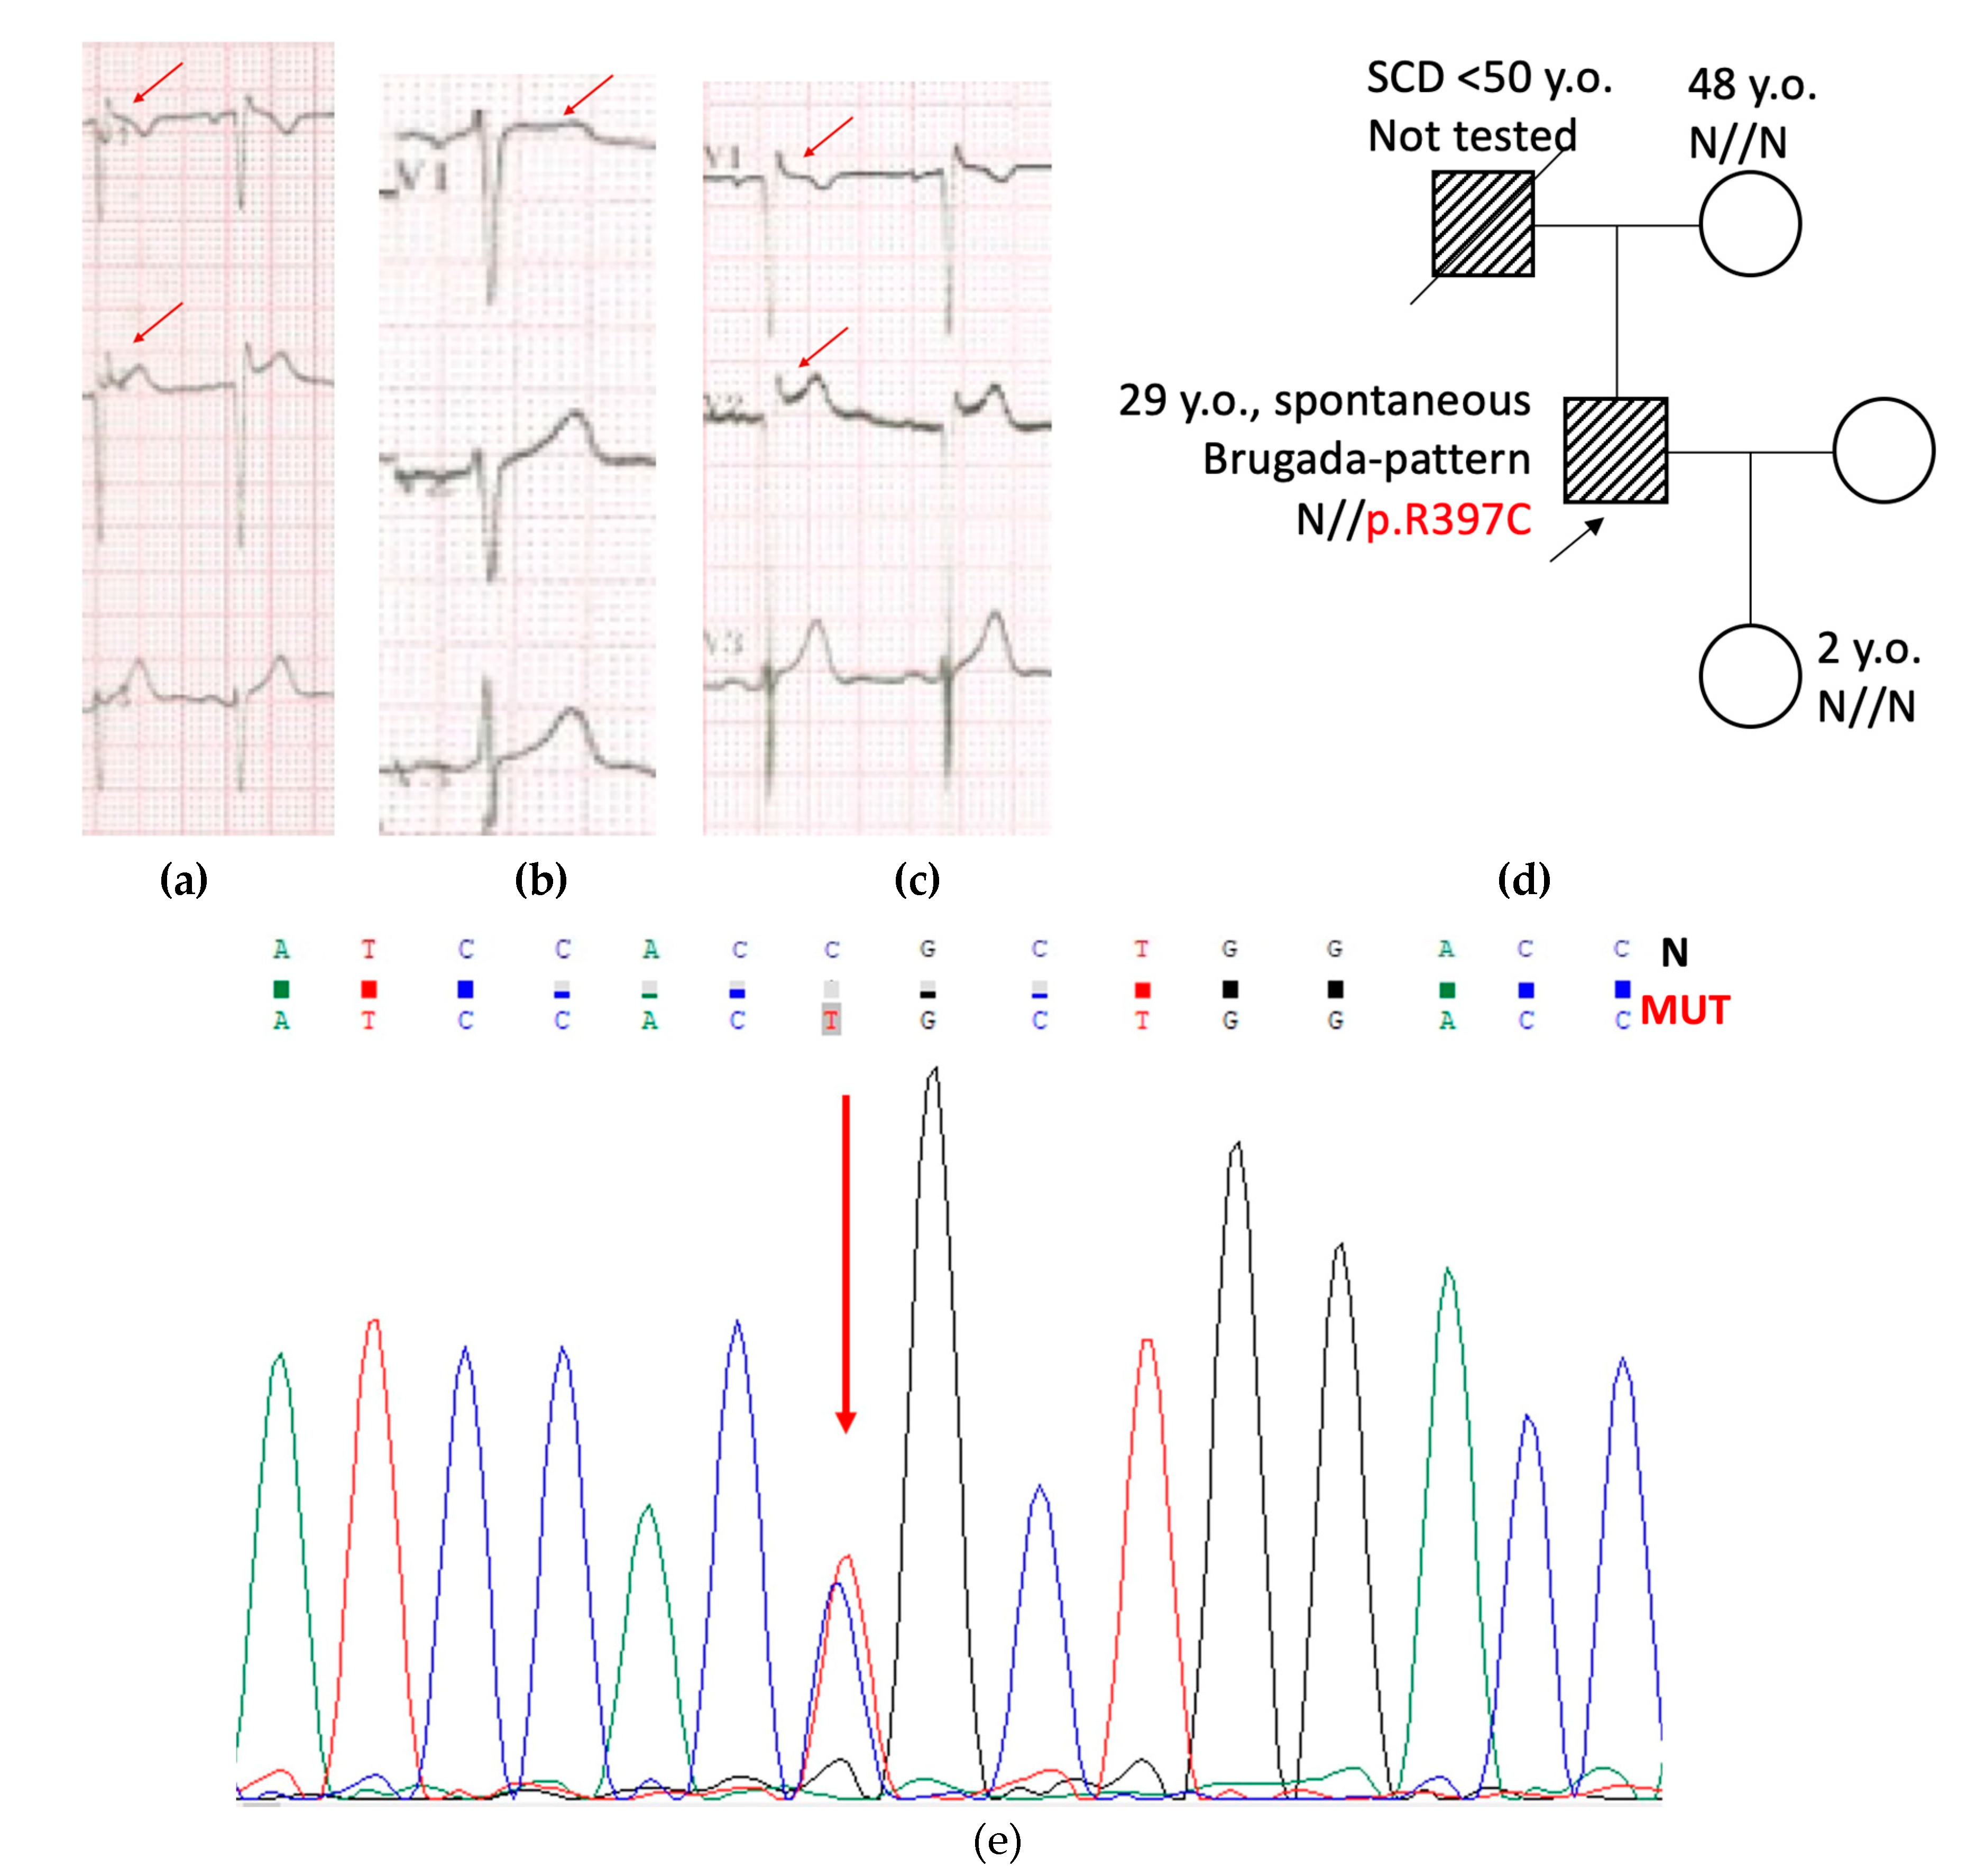
Figure 2.
Immunoblot analysis of hERG2 expression in whole-cell lysates. (top) western blot; (bottom) expression levels of WT and mutant channel in HEK293T cells.
Figure 2.
Immunoblot analysis of hERG2 expression in whole-cell lysates. (top) western blot; (bottom) expression levels of WT and mutant channel in HEK293T cells.
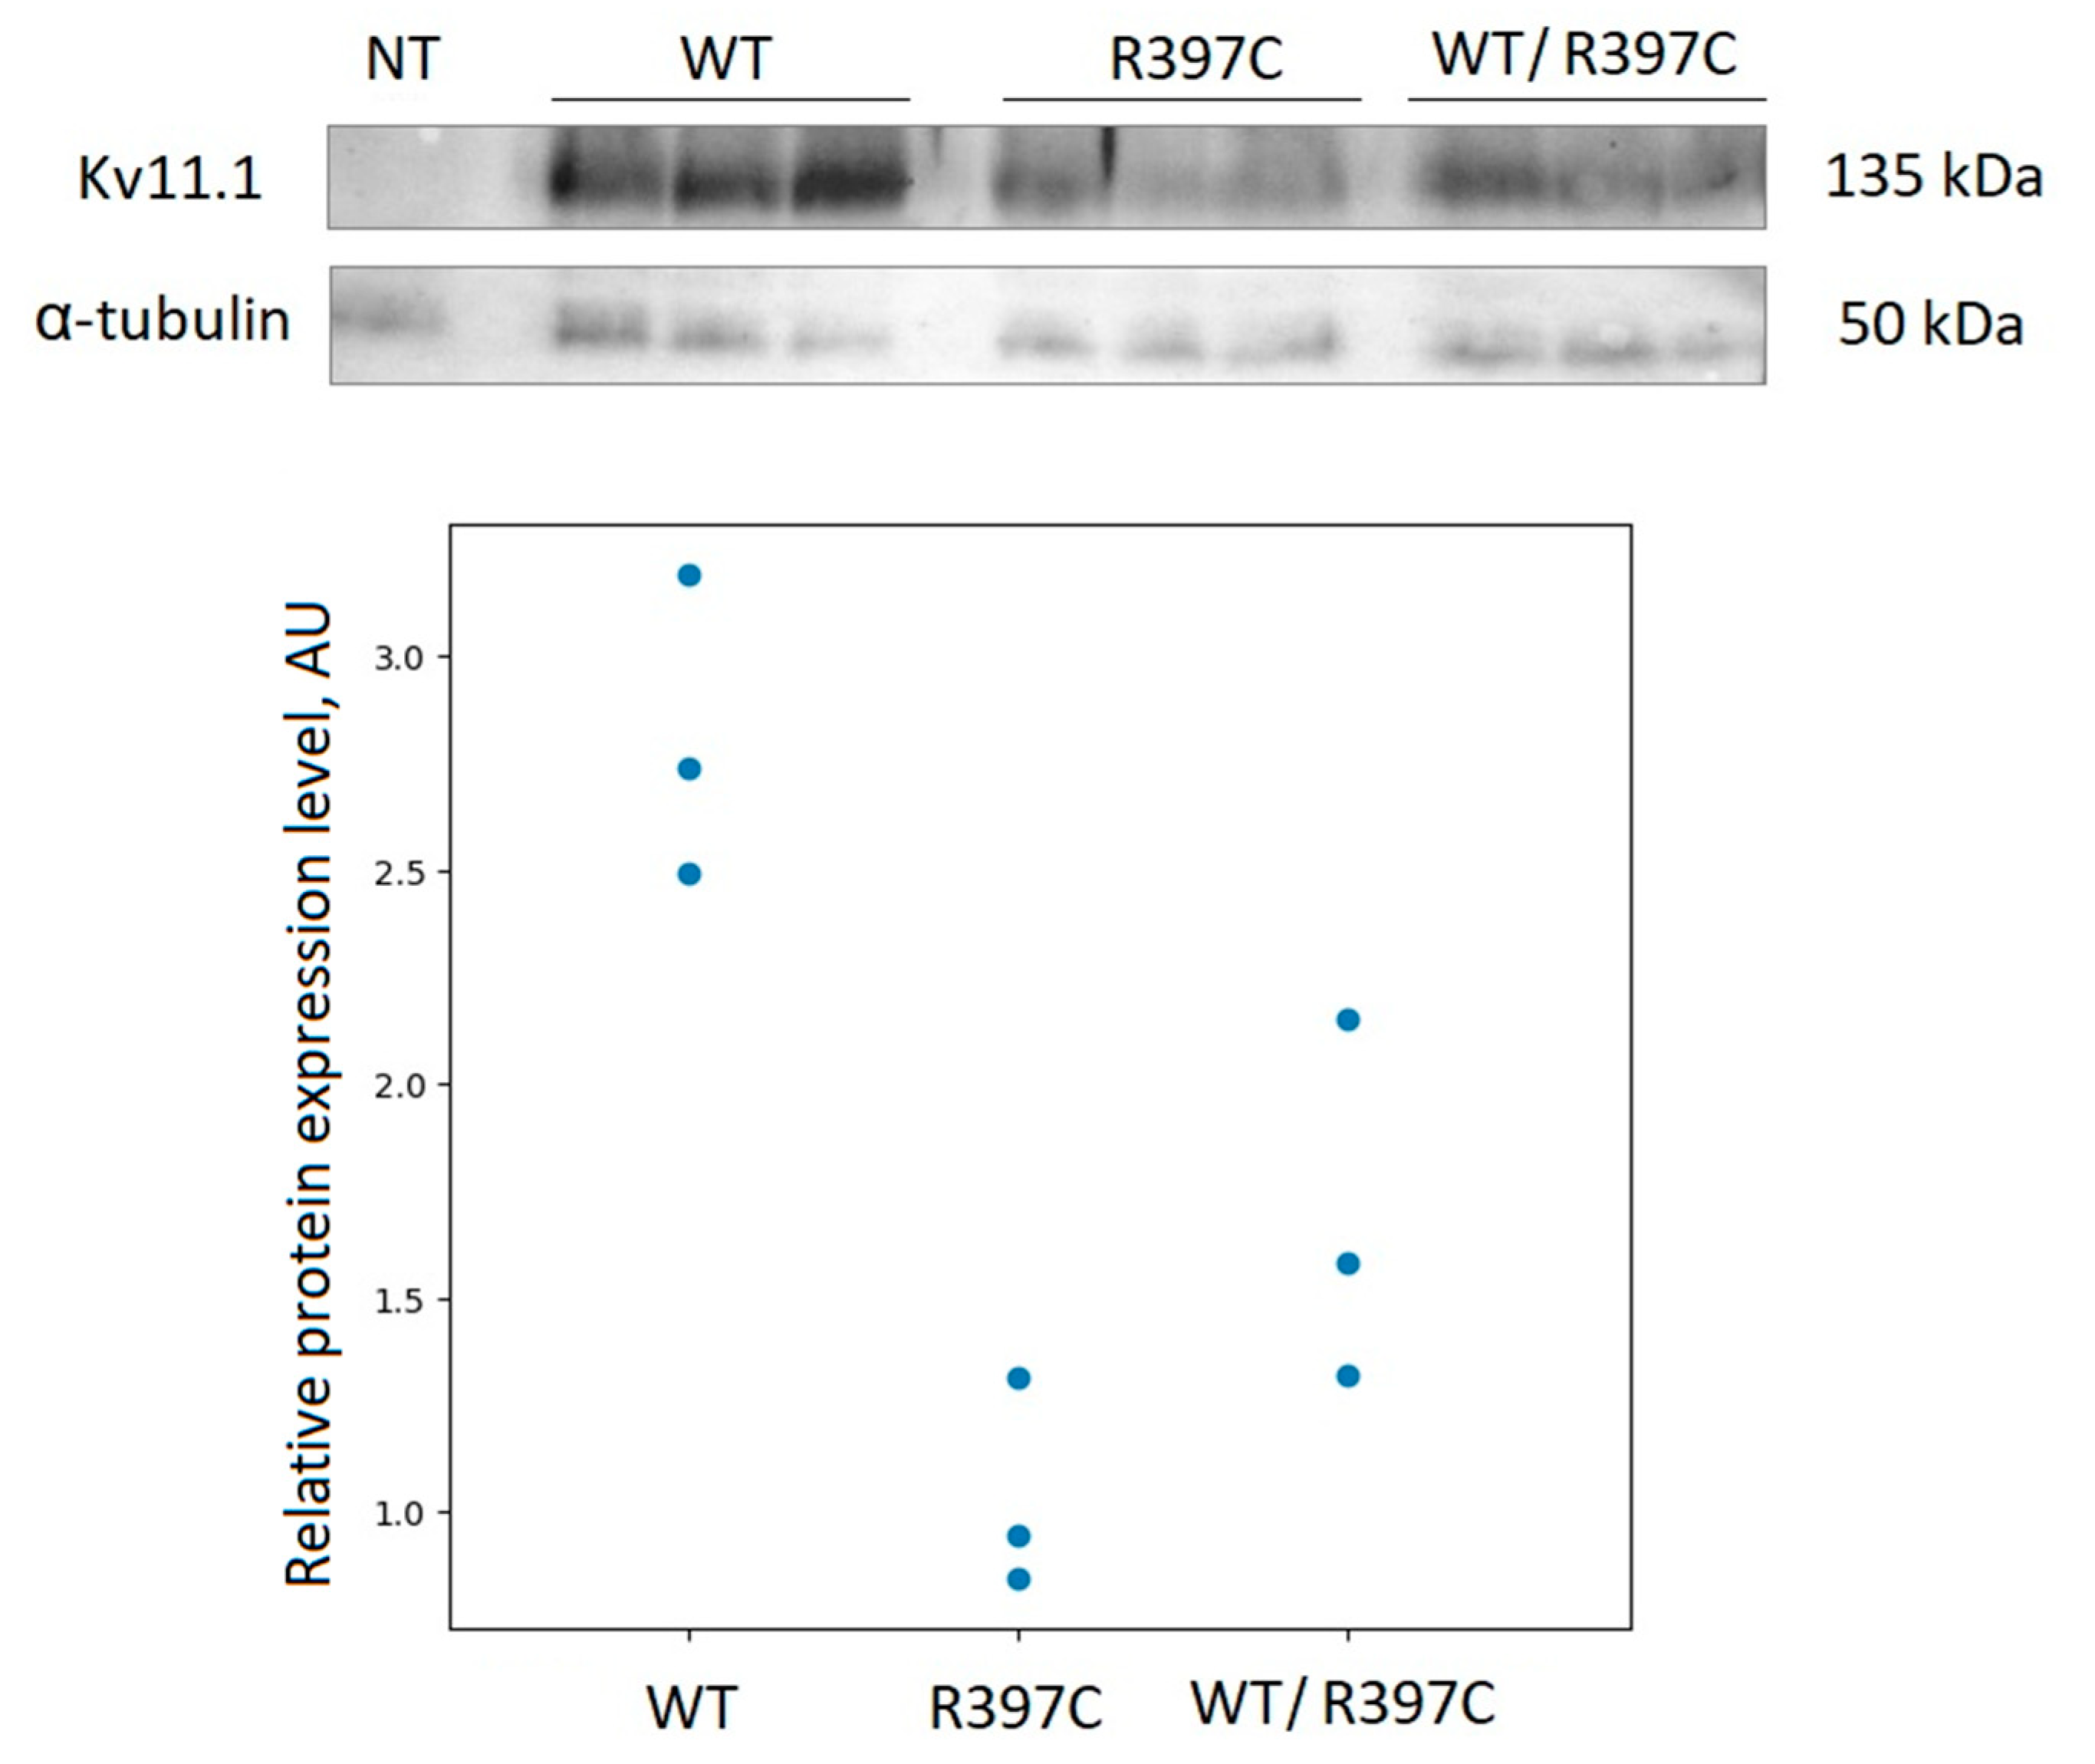
Figure 3.
Immunofluorescence staining of HEK 293T cells. (a) Cells after transfection with WT channel DNA. (b) Cells after co-transfection with WT channel and R397C mutant channel (1:1) DNA. (c) Cells after transfection with the R397C mutant channel DNA. The blue color is DAPI. Red – secondary antibodies labeled with Alexa Fluor® 555.
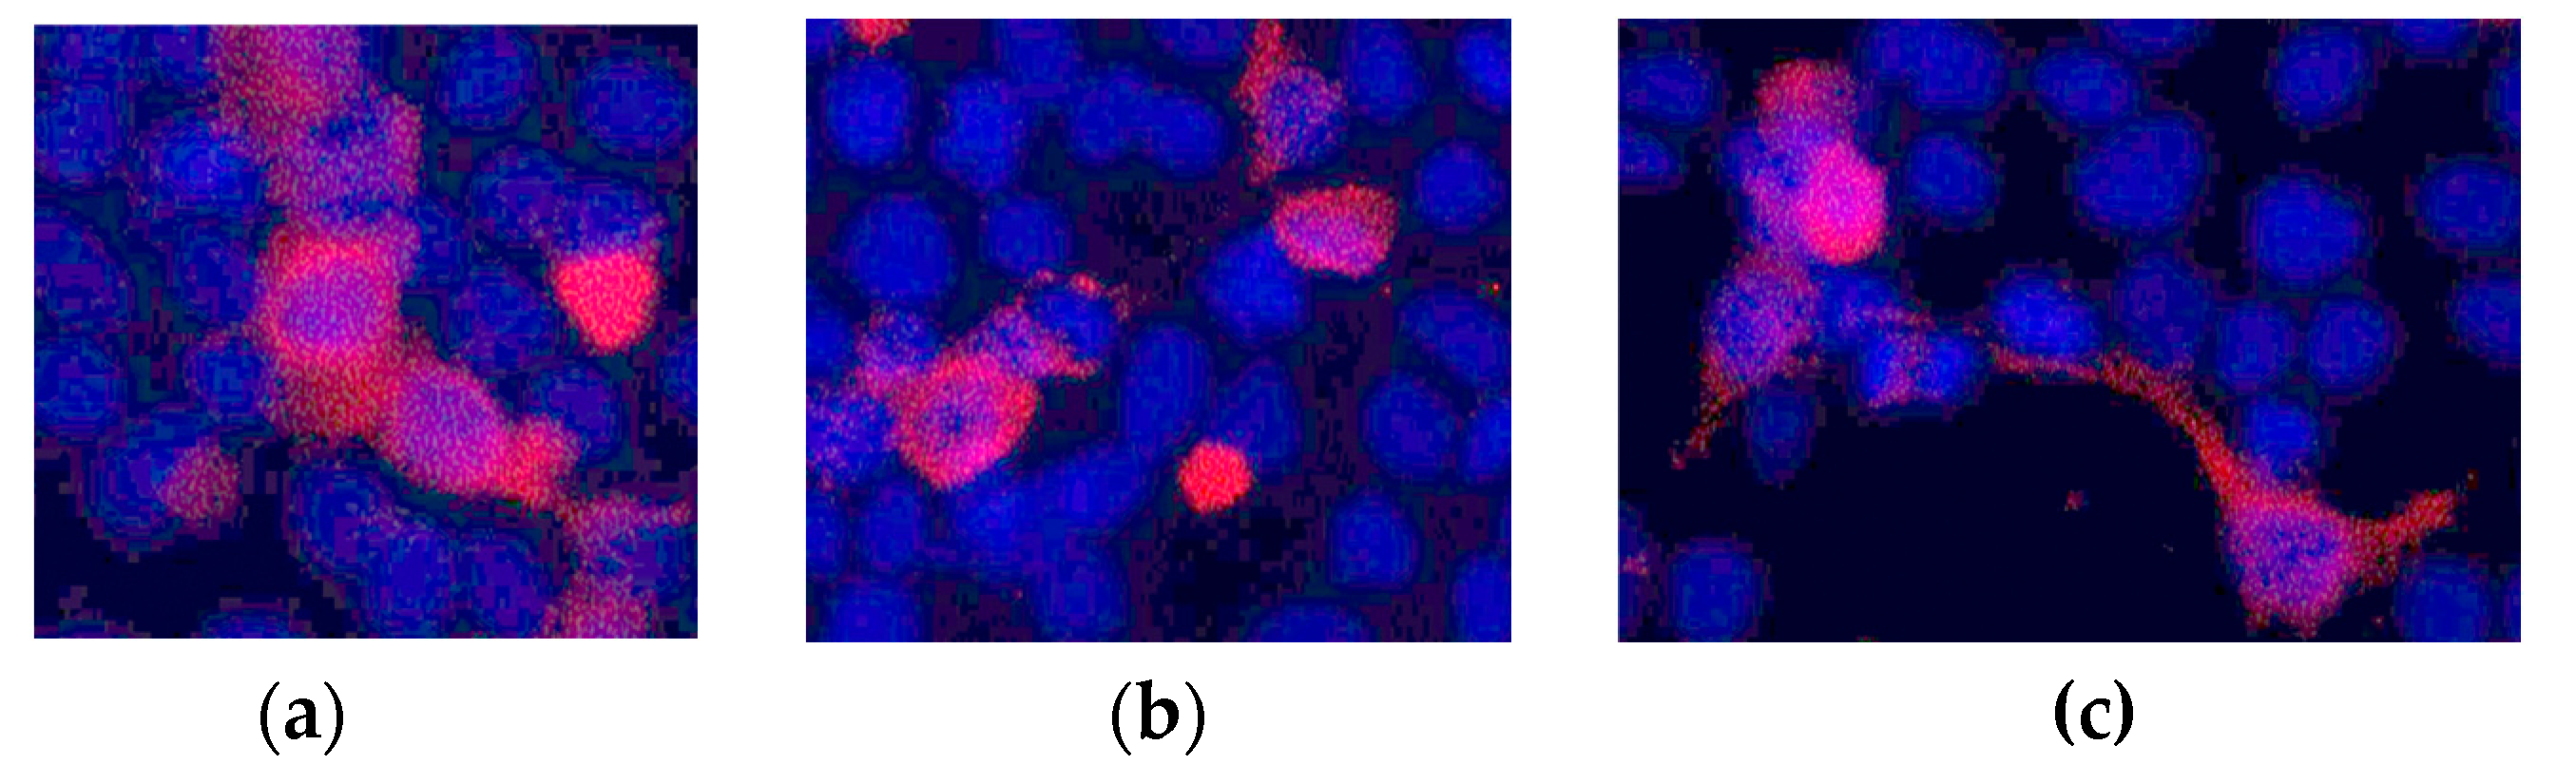
Figure 4.
Electrophysiological study of the R397C mutation. (a) Representative, superimposed recordings of the IKr current in cells transfected with WT hERG gene only (WT), by mutant hERG gene only (R397C) or co-transfected with both genes in a 1:1 ratio (R397C+WT). Left: activation voltage protocol used (one sweep, every 10 s). (b) Comparison of mean±s.m.e. I-V curves of tail IKr current obtained from 3 groups of cells. (c) Activation curves obtained from tail currents using the protocol shown in a, in 3 groups of cells. (d) Inactivation curves obtained in 3 groups of cells. Inset: inactivation voltage protocol used (one sweep, every 5 s, first pulse = 1 s, second pulse = 15 ms, third pulse = 0.5 s).
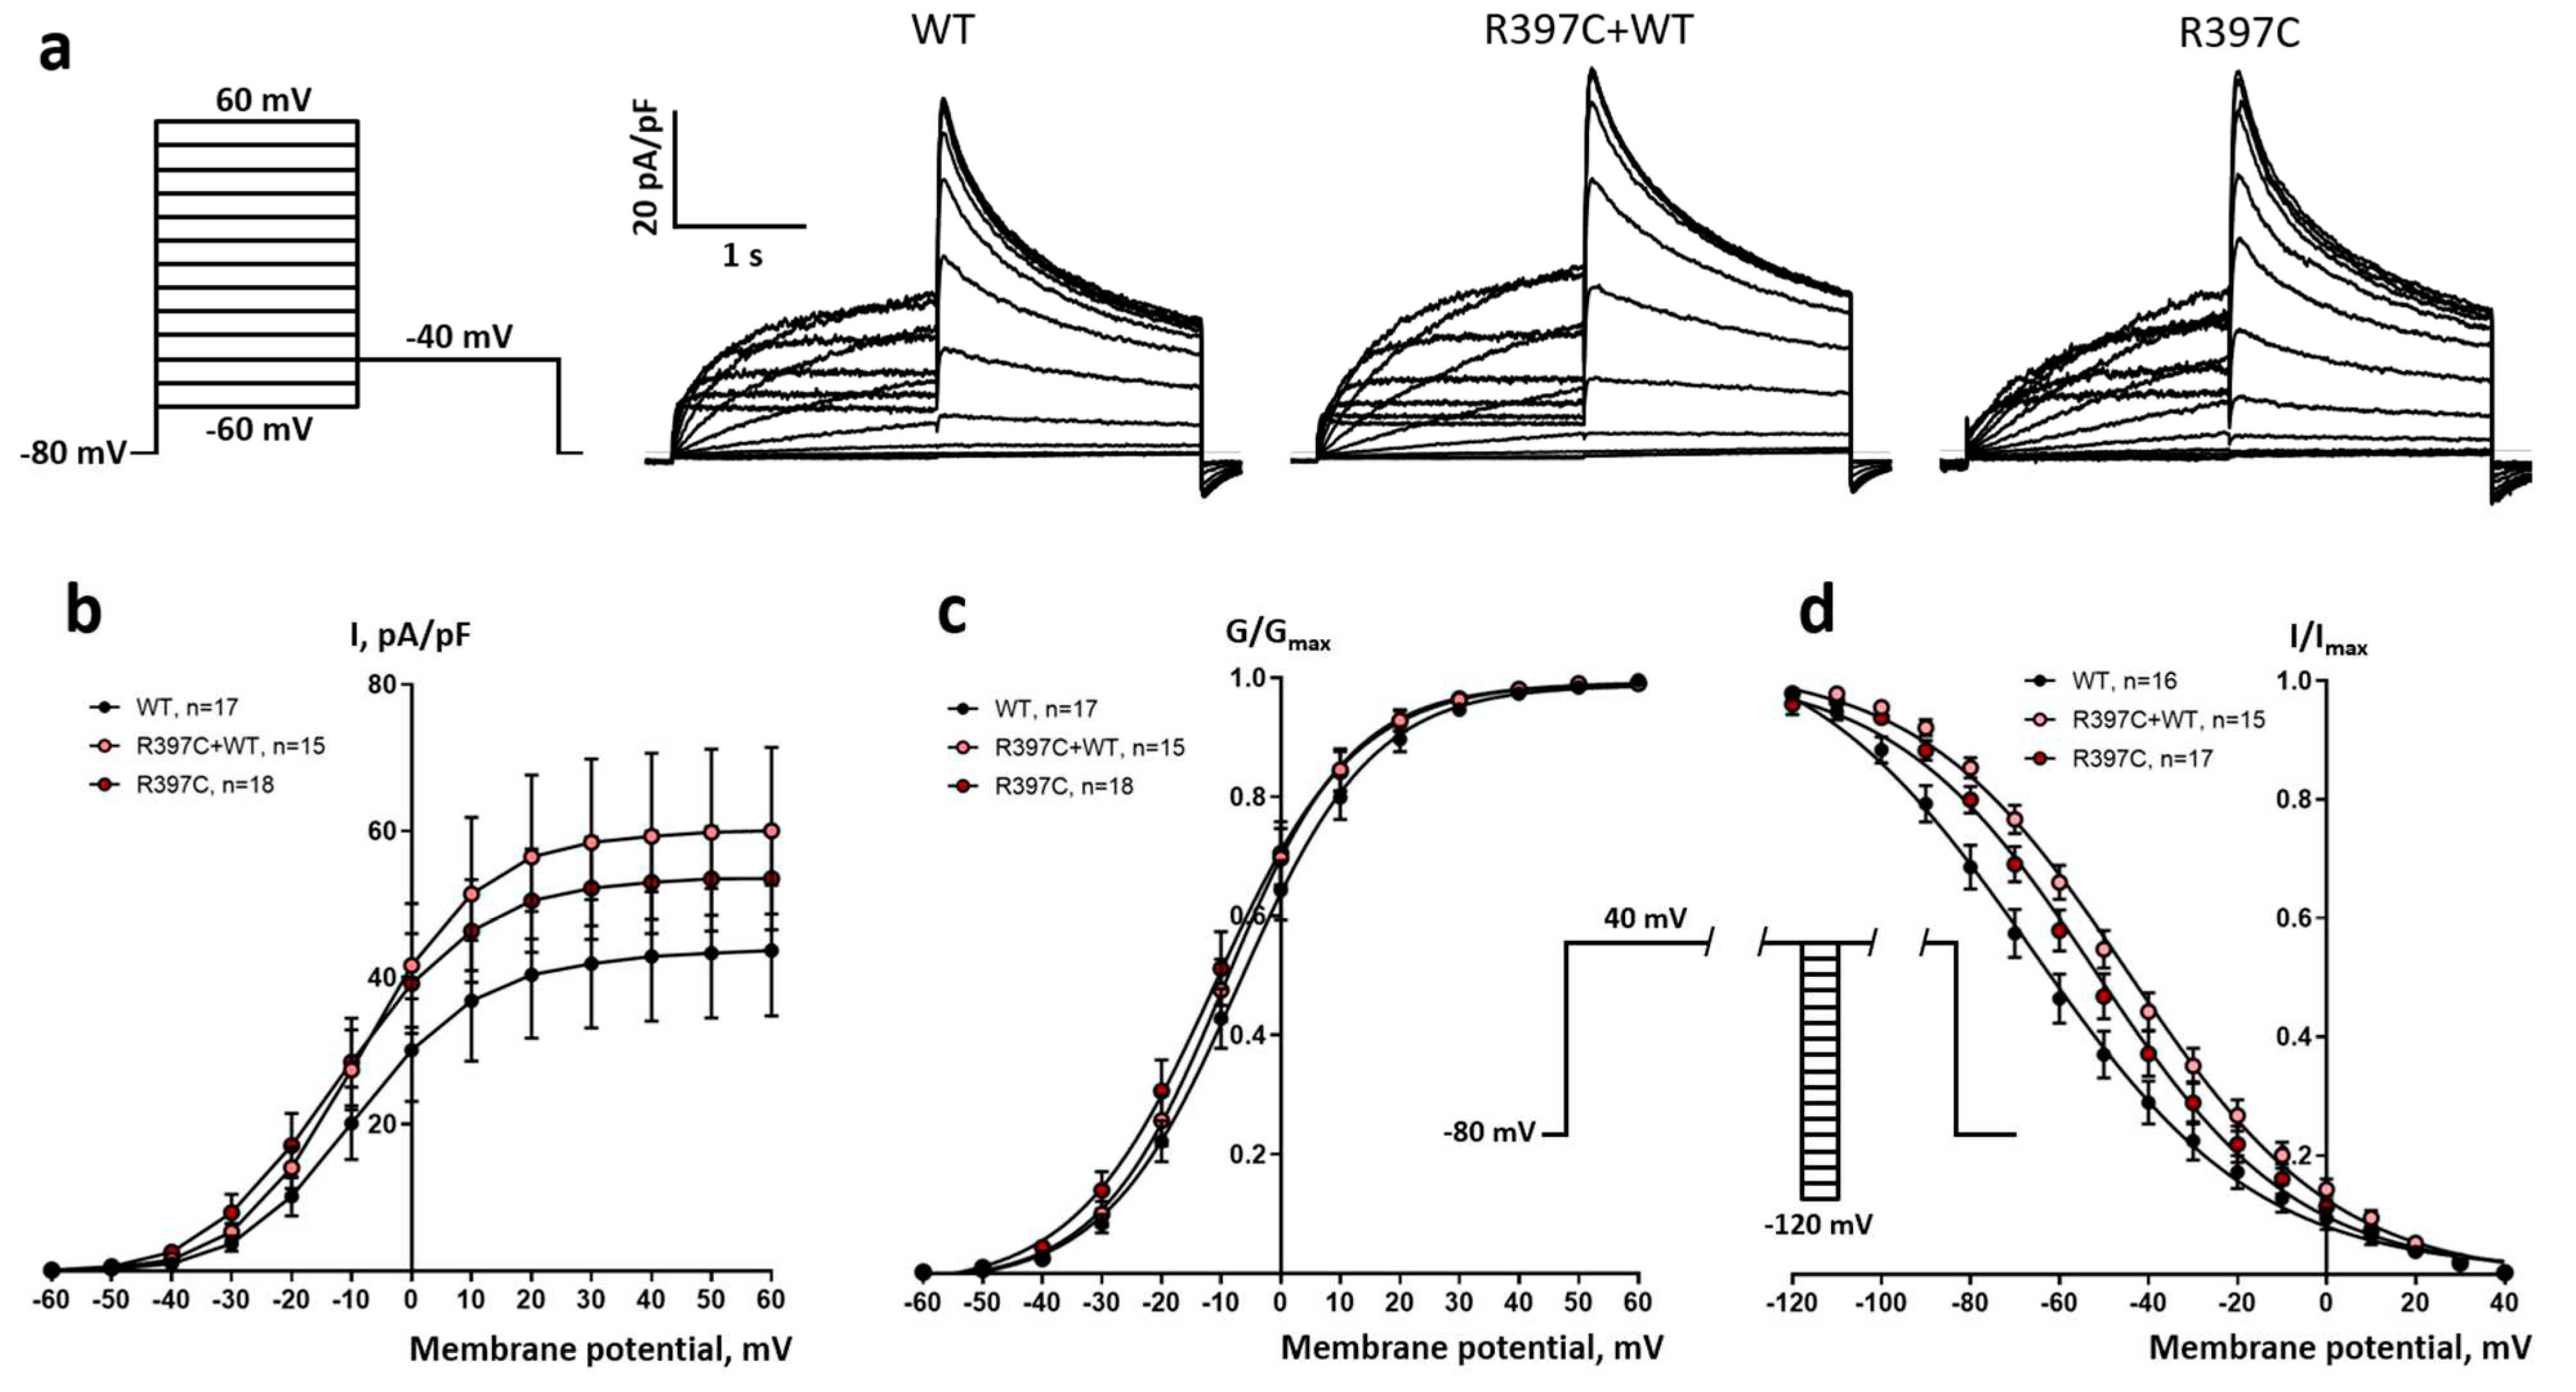
Figure 5.
AP simulations in the WT (n=13, blue), R397C (n=15, red), and R397C+WT (n=15, green) model groups. Top row: APs in R397C vs WT (left) and in R397C+WT vs WT (right). Bold solid lines indicate medians, shaded areas show interquartile (Q1-Q3) ranges of AP values in the groups calculated in 1-ms time steps. Bottom row: average APD50 (left) and APD90 (right). Data are the mean ± STD. * Significant difference from WT group, p < 0.05 one-way ANOVA with Dunnett’s T3 post hoc test.
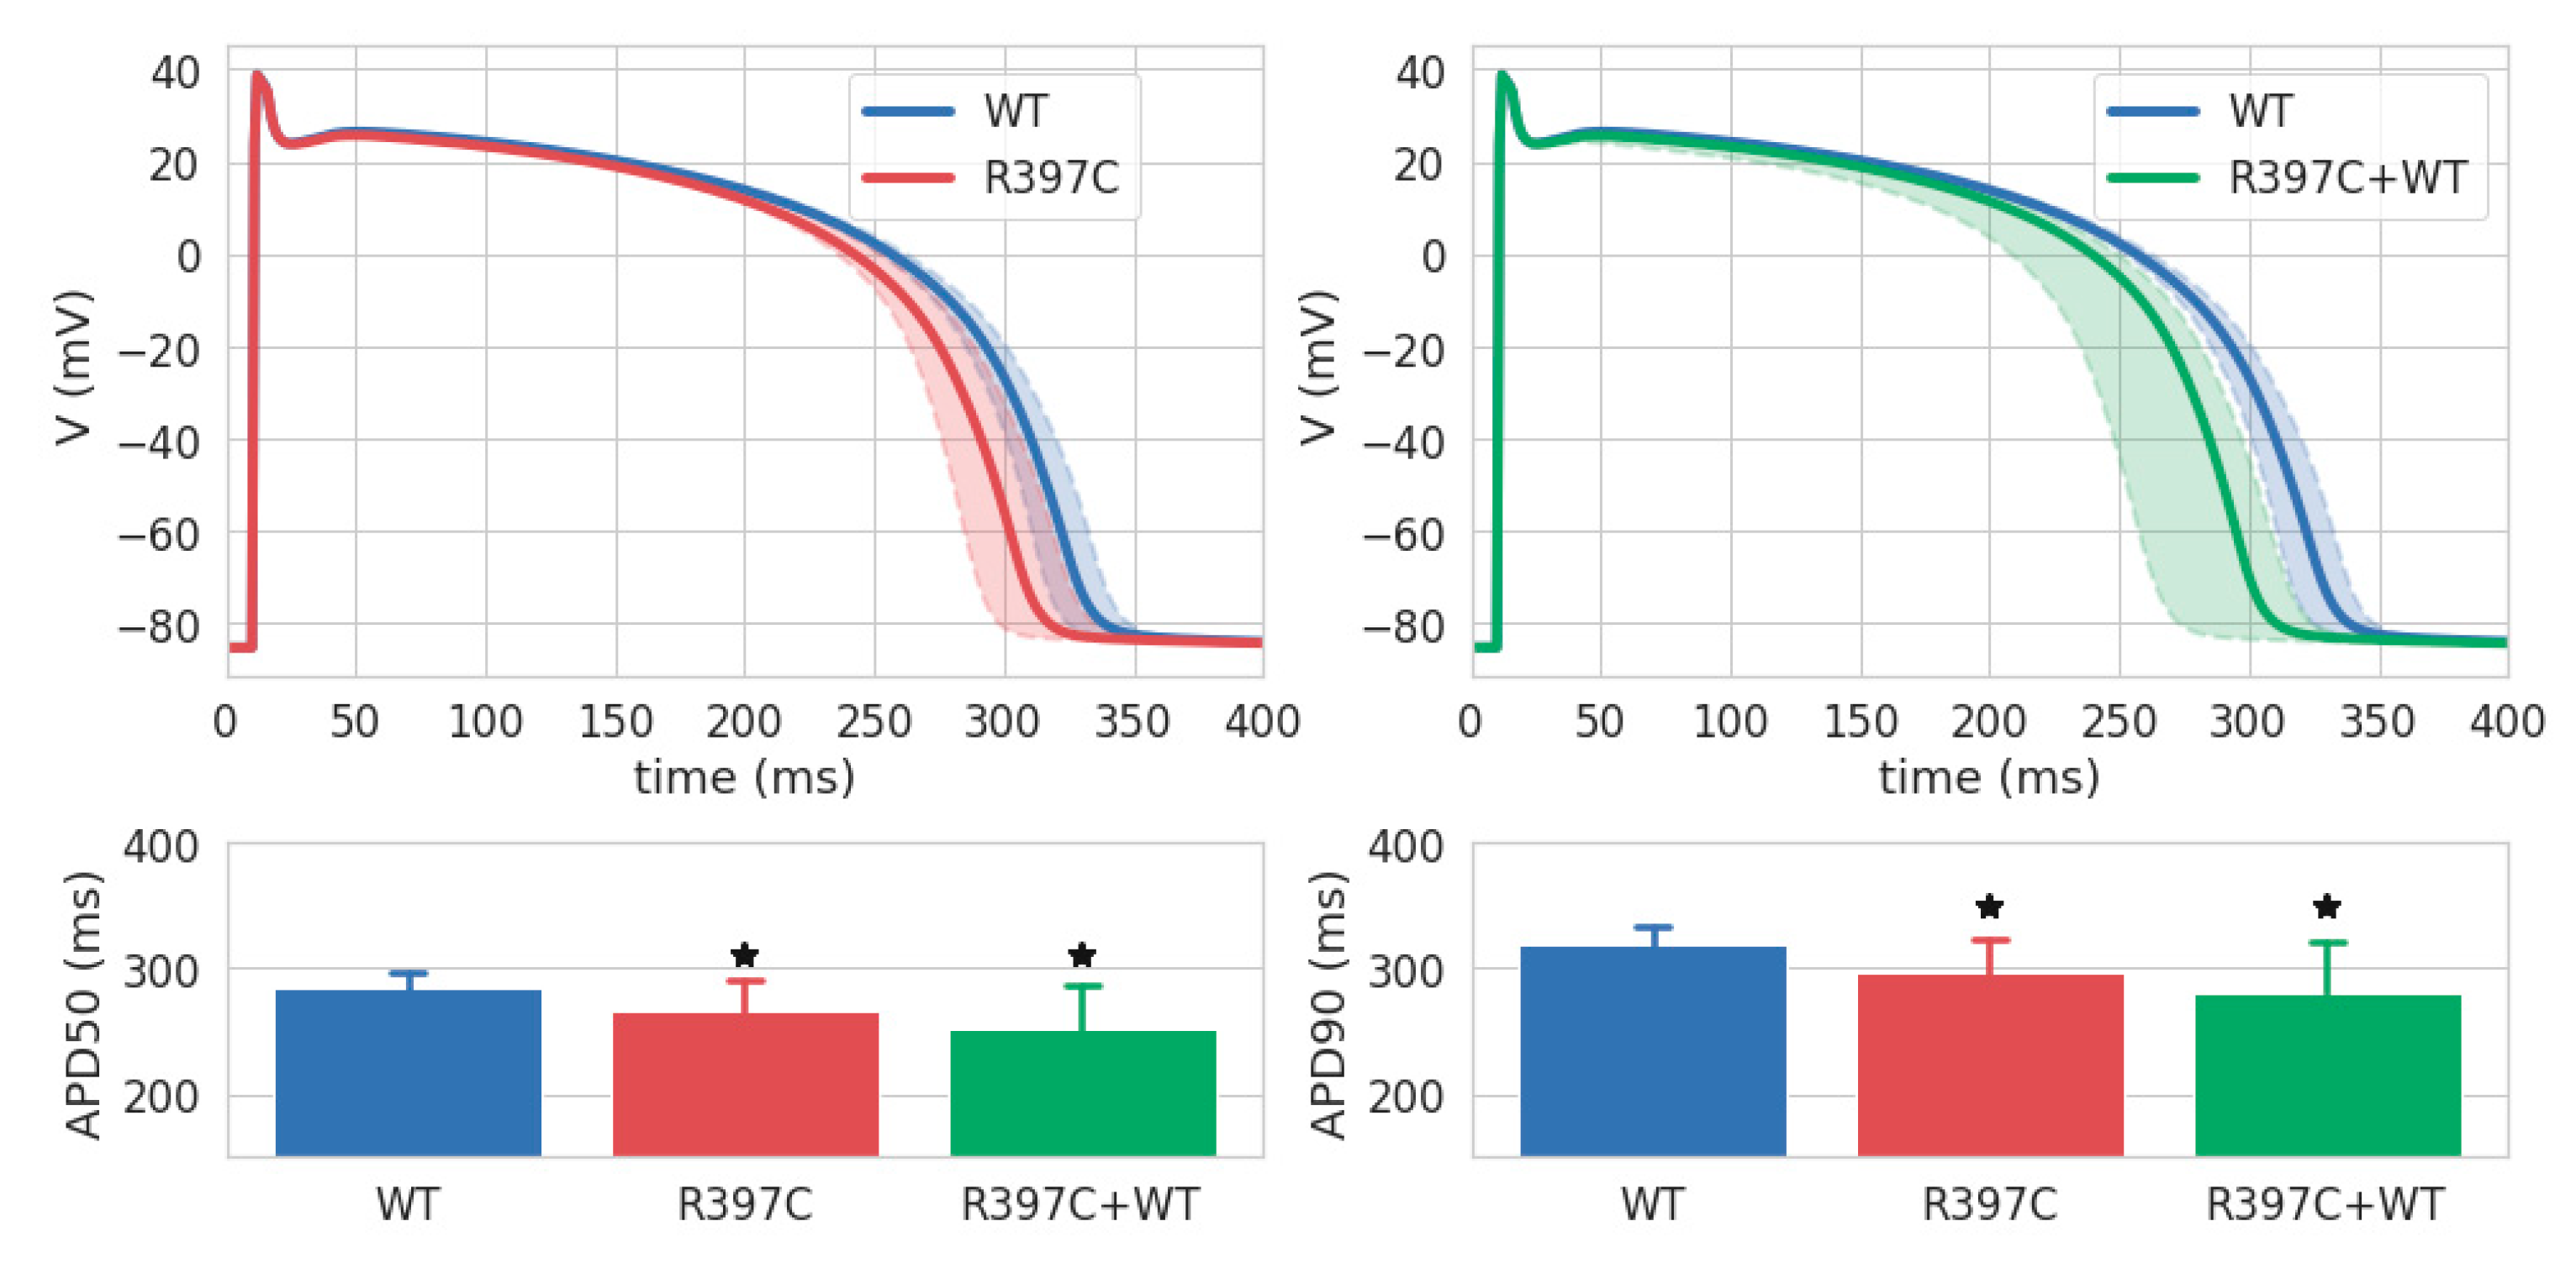

Table 1.
Parameters of steady-state activation and inactivation curves in 3 experimental groups. * - significant difference from WT (p<0.05, one-way ANOVA with Dunnett’s post-hoc test).
Table 1.
Parameters of steady-state activation and inactivation curves in 3 experimental groups. * - significant difference from WT (p<0.05, one-way ANOVA with Dunnett’s post-hoc test).
| WT | R397C+WT | R397C | |
|---|---|---|---|
| V50 activation | -7.04±0.94, n=17 | -9.34±0.92, n=15 | -11.04±1.19*, n=18 |
| V50 inactivation | -66.23±2.38, n=16 | -44.67±1.34*, n=15 | -51.94±1.64*, n=17 |
| Slope, activation | 11.23±0.87, n=17 | 10.52±0.84, n=15 | 11.68±1.1, n=18 |
| Slope, inactivation | -25.6±2.3, n=16 | -23.4±1.5, n=15 | -22.7±1.72, n=17 |
Disclaimer/Publisher’s Note: The statements, opinions and data contained in all publications are solely those of the individual author(s) and contributor(s) and not of MDPI and/or the editor(s). MDPI and/or the editor(s) disclaim responsibility for any injury to people or property resulting from any ideas, methods, instructions or products referred to in the content. |
© 2023 by the authors. Licensee MDPI, Basel, Switzerland. This article is an open access article distributed under the terms and conditions of the Creative Commons Attribution (CC BY) license (http://creativecommons.org/licenses/by/4.0/).
Copyright: This open access article is published under a Creative Commons CC BY 4.0 license, which permit the free download, distribution, and reuse, provided that the author and preprint are cited in any reuse.


