Submitted:
12 September 2023
Posted:
14 September 2023
You are already at the latest version
Abstract
To explore the forage quality of wild oat populations under different growth environments, the basic nutrient composition and forage quality of five wild oat populations in Israel were compared. Ash, crude protein, and soluble sugar content of oats were significantly (P<0.05) related to some forage quality and possible environment of population origin. Among them, the environmental factors of origin had significant effects on the indicators of ash, crude protein, and soluble sugars of oat straw, but less on the contents of crude fat, total phosphorus, and total potassium. Meanwhile, the annual rainfall and the number of days of rainfall in the country of origin greatly influenced the cellulose content. Finally, we investigated the similarity of feeding values of different populations using PCA analysis. The results showed that, in conclusion, the higher variability of wild oat populations may be a new possibility brought by feeding oats.
Keywords:
wild oats
; feeding value
; Germplasm resource
; environmental factor
; origin
1. Introduction
Oats are important annual forage and food crop of the genus oats in the family Gramineae, divided into two types: naked oats (Avena nuda) and leather oats (A. Sativa), which are grown all over the world. Oat cultivation in China is mainly distributed in northeast, north, and southwest China (Masood et al., 2008), and is recognized as one of the world's eight major food crops and an excellent forage crops (Masood et al., 2008). Oat seeds are very rich in protein, fat and other nutrients and can be an excellent dietary product, with a protein content of more than 15.0% and a fat content of 8.8%(Meen et al., 2017; Masood et al., 2008) Oats do not have harsh growing conditions, and can be grown in poor and arid areas, but also because of its advantages high yield is often planted in pasture or high Beit-Orenude areas as livestock feed(Li et al., 2013; Li et al., 2011; Xiao et al., 2017). It is also often grown as livestock feed in pastoral areas or at high Beit-Orenudes for its high yield. About 73% of the world's oat production is forage, mainly for processing and eating only 12%, so oats are an important forage quality raw material in the world(Biel et al., 2020; Suttle et al., 2004.; Varma et al., 2016; Wang et al., 2002).
The nutritional content of crude protein, crude fat, starch, and β-glucan varied somewhat between oat varieties, and the starch pasting characteristics and thermodynamic properties were influenced by different source environments Chen et al., 2020; John, 1995; Francis W & Associates, 2011). The forage quality of oats is influenced by different factors, and the available studies show that: oats require a large amount of water during the growing period, and the water supply status has an important influence on the growth and development, yield, and quality formation of oats(Sojka et al., 1998; Sui et al., 2018). The water requirements of oats are different in different fertility stages. Fixed drip irrigation can effectively increase the crude protein, crude fat, and glucan content of oats(Enciso et al., 2007; Ngouajio et al., 2007; Oktem et al., 2003; Wu et al., 2009). It has also been shown that the selection of the appropriate sowing stage has a positive impact on the quality of oats. It has also been shown that the selection of suitable sowing and mowing periods can improve the yield and nutritional quality of oats(Li et al., 1996; Li et al., 2015; Ma et al., 2010a, 2010b; Yue & Wang, 2019). The increase in cumulative temperature during the growing period had a significant effect on the growth of oat forage(Akhtar et al., 2006; Costa et al., 2014; Du et al., 2008), and the increase in cumulative temperature from nodulation to tiller was not conducive to the formation of oat forage yield and quality( Robertso et al.,2004), but the increase in cumulative temperature between seedling and tiller could improve the content of crude fat and acidic detergent fiber(Li et al., 2001; Zhang et al., 2002; Zhou et al., 2021). However, the increase in temperature between seedling and tillering increased crude fat and acidic detergent fiber content. Israel is one of the origins of wheat crops (including oats), and its wild oats have rich genetic diversity and are excellent genetic resources for improving forage oat varieties. Previous studies have shown that oats from Israel vary greatly in nutritional composition between groups, presumably due to their genetics and differences in the growth environment(Loskutov et al., 2017; Welch et al., 1997; Xu et al., 2020; Zong et al., 2017). However, further research is needed on the differences in nutrients such as ash, crude fat, etc. between groups.
Currently, there have been many studies on the nutritional quality of oat forage, but there are fewer studies on the nutritional composition and forage quality of different oat populations in their places of origin. In this study, we analyzed the nutritional composition and forage quality of 18 genotypes of oats from six oat populations and explored the potential relationship between them based on the environmental factors of different populations' origins to provide a reference for oat forage quality improvement and breeding.
2. Materials and methods
2.1. Test materials
A total of six oat populations were used in this experiment. Five wild oat populations were collected from Israel by Prof. Yan Jun of Chengdu University, and one cultivated oat population was provided by Prof. Hu Yinguang of Northwest Agriculture and Forestry University of Science and Technology, respectively. The ecogeographic data of different populations are shown in Table 2.
2.2. Test methodology
The experiment was conducted on 2018.10-2019.03,2019.10-2020.03,2020.10-2021.03 with 60 seeds of uniform size and intact shape from each of six cultivated oat varieties and 18 wild oat genotypes. Seeds were sown in strips using a randomized partitioned design with 20 seeds per row, a row length of 1.5 m, row spacing of 50 cm, setting three replications, and making protected rows. Oats were mowed in January 2019-January 2021 during the tasseling period, harvested and killed at 105°C for 15 min, dried at 75°C to constant weight, crushed with a plant grinder, passed through a 40 mesh sieve, and stored in self-sealing bags at room temperature, protected from light.
2.3. Measurement indicators and methods
Crude protein (CP), crude fat (Ether extract, EE), ash content (Ash)(Li et al., 2016; Yuan et al., 2021), neutral detergent fiber (NDF)(Rohwede &Barnes, 1978), acid detergent fiber (ADF)(Rohweder & Barnes, 1978) of oats were The content of crude fat (EE)(Li et al., 2016), ash content (Ash), neutral detergent fiber (NDF), and acid detergent fiber (ADF) were determined using a FOSS NIR quality analyzer.
Water soluble carbohydrates (WSC) was extracted by anthrone colorimetry and then measured by UV spectrophotometer; Total phosphorus (TP) was measured by ammonium molybdate spectrophotometry; Total calcium (TK) was measured by atomic absorption spectrometry. Total phosphorus (TP) was determined by ammonium molybdate spectrophotometry; Total kalium (TK) was determined by atomic absorption spectrometry(Guo et al., 2003); Inorganic phosphorus (IP) was measured spectrophotometrically(Zheng et al., 2017).
Relative feeding quality is calculated using the equation, see equation (2.1) and equation (2.2)(Zhu et al., 2019).
Relative Feeding Quality (RFQ)
RFQ = TDN(%DW) × DMI(%BW)/1.23 (2.1)
The prediction model equation for total digestible nutrients (TDN) is.
TDN (%DM) = 82.38 - (0.7515 x ADF) (2.2)
2.4. Data analysis
Data were collated using Excel, Turkey-Kramer HSD (P<0.05) using JMP Pro to detect the significance of differences, and Spielman rank correlation coefficient and ANOVA were used to analyze the correlation between oat nutrient content, forage quality, and place of origin.

Table 1.
Oat material and its origin.
| Community | Type | Place of Origin | Community | Type | Place of Origin |
| Tabigha | wild oats | Israeli | Evolution Canyon | wild oats | Israeli |
| Nahef | wild oats | Israeli | Beit-Oren | wild oats | Israeli |
| Sede Boqer | wild oats | Israeli | Hu | Cultivated oats | Hebei, China |
Table 2.
Ecogeographic data on the origin of the six oat origin.
| Population | Ln/° | Lt/° | Al/m | Tm/°C | Ta/°C | Tj/°C | Td/°C | Tdd/°C | Ev/mm | Rn/mm | Rd/d | Hu14/% | Huan/% |
| Tabigha | 35.5 | 32.9 | 0.0 | 23.6 | 31.9 | 14.3 | 17.4 | 10.3 | 164.0 | 437.0 | 49.0 | 43.8 | 58.2 |
| Nahef | 35,3 | 32.9 | 275.0 | 15.3 | 23.5 | 8.3 | 15.7 | 8.9 | 156.4 | 662.0 | 53.0 | 50.0 | 62.1 |
| Sede Boqer | 34,9 | 32.5 | 10.0 | 20.1 | 25.9 | 13.4 | 13.5 | 8.9 | 132.0 | 539.0 | 45.0 | 66.2 | 72.3 |
| Evolution Canyon | 34.6 | 32.4 | 90.0 | 22.7 | 27.2 | 14.1 | 13.2 | 9.2 | 144.0 | 602.0 | 50.2 | 65.9 | 65.4 |
| Beit-Oren | 35.0 | 32.7 | 50.0 | 20.2 | 26.2 | 12.7 | 13.0 | 9.0 | 133.0 | 507.0 | 48.2 | 65.5 | 72.5 |
| Hu | 114.5 | 40.5 | 1300.0 | 9.2 | 23.3 | -8.2 | 31.2 | 14.2 | 18.7 | 31.9 | 6.4 | 13.0 | 15.2 |
Note: Ln: longitude; Lt: latitude; Al: Beit-Orenude; Tm:three-year annual mean temperature; Ta: three-year August mean temperature; Tj: three-year January mean temperature; Td: three-year seasonal temperature difference; Tdd: three-year diurnal temperature difference; Ev: three-year annual evaporation; Rn: three-year annual rainfall; Rd: three-year annual number of days of rainfall; Hu14%: three-year 14:00 mean fitness; Huan: three-year annual mean humidity, same below.
3. Results and analysis
3.1. Nutritional content analysis of different oat populations
In this study, six oat populations with 18 genotypes sown in fall 2018, fall 2019, and fall 2021 were tested for nutrients such as ash, crude fat, crude protein, soluble sugars, total phosphorus, and total potassium (Table 3). The results showed that the ash content of the Sede Boqer and Evolution Canyon oat populations was significantly higher than the other populations, reaching 9.25% and 9.04% (average data of 3 years), respectively. the crude fat content of the Beit-Oren (9.82%) was significantly lower than the other five wild populations, differing by 8.24% from the Tabigh, which had the highest crude fat content. The crude protein content of Hu, Nahef was lower, differing by 11.96% and 18.96% from the Evolution Canyon population, which had the highest content. In terms of soluble sugars, the Tabigha population had the highest content of 21.39%; the Huhad the lowest content of 10.51%, with a difference of 50.87% and a significant difference between populations. In terms of total phosphorus, the Nahef population had the lowest total phosphorus content of 0.31%. Total potassium and total phosphorus contents did not differ significantly among the six populations. The breeding components of evolved canyon oat populations differed significantly among the six populations with the highest content of each indicator, which could be potentially useful.
To investigate the differences in nutrient composition among populations in more depth, the genotypic nutrient composition among populations was studied. Eighteen genotypes from six populations were analyzed for nutrient content, and data were analyzed for the five genotypes with the highest mean and the five genotypes with the lower mean (Figure 1). The results showed that the five genotypes with higher ash content, Ecg13, Ecg12, Ecg1, Se13, and Se16, were all around 10%, about 1.07% higher than the mean. The ash content of wild oats Evolution Canyon and Sede Boqer was higher. There was no significant difference in the crude fat content of oats, suggesting that the effect of stock origin on crude fat may be minimal. Nah1, which had the lowest crude protein content, was 7.39% lower than Ecg12. The crude protein content between Be1 and Ecg1 was close, at 11.32% and 11.44%, respectively. The XO-1-3 genotype of oats had nearly 40% lower soluble sugar content than the highest Se6. Nah10 had 0.89% total phosphorus content, much higher than the average value of 0.43%. XO-1-60 had a lower total potassium content of 2.4%, while Nah2 had the highest total potassium content of 4.15%.
3.2. Feed value analysis of different oat populations
Fresh-to-dry ratio, neutral detergent fiber, acid detergent fiber, lignin, and cellulose are five important indicators of oat forage quality. The analysis of forage quality data from six populations of oats (Table 4) revealed that. In terms of the first fresh-to-dry ratio, the Tabigha population had a significantly higher fresh-to-dry ratio than the other populations at 4.76% (average data of three years). The difference data of Hu(20.7%) which is the lowest neutral detergent fiber content and the Tabigha(26.61%) with the highest neutral detergent fiber content is 5.91%. The acidic detergent fiber of the artificially cultivated oat population Hu was significantly higher than other wild oat populations in all three years, reaching 5.99%, 29.93%, and 27.39%, respectively. In terms of lignin content, the Evolution Canyon population had the same amount as the Tabigha population at 1.15% in 2018, and the Hu had the highest amount in three years at 3.31% (average data). In terms of cellulose content, the Huhad significantly higher content than the other five populations at 71.88% (average data of three years), which was about eight times higher than the lowest content Sede Boqe. It is note worth that there was no variability among the Tabigha, Nahef, Sede Boqer, and Evolution Canyon in lignin and cellulose in 2018 and 2019.
The forage quality of the 18 genotypes was analyzed (Figure 2) and the results showed that, in terms of moisture, the Se13 genotype had the highest content of 75.28%, while the XO-1-3 genotype had the lowest content of 59.05%. The fresh-to-dry ratio of the Be1 genotype of oats was 1.52%, which was significantly lower than the other 17 genotypes, while the Tg11 genotype had the highest content of 3.74%. In terms of lignin content, the XO-1-3 genotype had the highest content of 5.34%, while the Be1 genotype had the lowest content, with a difference of 4.49% between the two genotypes. XO-1-3 genotype had the highest cellulose content of 89.15% in all, and its cellulose content was 4.6 times higher than the mean value; Se 9, XO-1-3 and XO-1-60 genotypes of lignin content were close to each other, roughly 2.75%. This shows that the oat origin has a greater effect on lignin and cellulose and a smaller effect on other forage quality indicators. The six targets of XO which is planted by a human is smallest than other population. The forage value of cultivated oats is the lowest, and wild oats may have great forage potential.
3.3. The nutritional content of oat populations correlated with a place of origin
Analysis of oat population and ecogeographical factors revealed (as in Table 5) that nutrients such as crude protein, ash, and soluble sugars were significantly influenced by factors such as origin mile. Among them, crude protein was significantly positively correlated with Hul14, Huan, Tj, and Tm; while it was significantly negatively correlated with Ln, Td, and Tdd. Ash showed a significant positive correlation with Huan, while a significant negative correlation with Ev, Ln, Td, and Tdd. Soluble sugars showed significant positive correlations with Hul14, Ta, and Tm; and significant negative correlations with Al, Ln, and Lt. However, it is noteworthy that no significant correlations were observed for crude fat, total phosphorus, and total potassium in oats with factors such as ground mile of origin. The temperature at the origin of the oat population has a large effect on crude protein, ash, and soluble sugar, after which breeding can control seasonal temperature differences and diurnal temperature differences to enhance the nutrient content.
3.4. Correlation between feed value and place of origin in oat populations
The analysis of oat populations and eco-geographic factors revealed (as in Table 6) that the indicators of lignin, cellulose, acidic detergent fiber, neutral detergent fiber, moisture, and the fresh-to-dry ratio of oat populations may be influenced by geographic environmental factors at the place of origin. Among them, lignin was significantly positively correlated with Ln, Lt, Al, and Td, while it was significantly negatively correlated with Tm, Tj, and Rn. Cellulose was negatively correlated with Tm, Tj, Ev, Rn, Ta, Rd, Hul14, and Huan; and positively correlated with Ln, Lt, Td, and Tdd. The acid detergent fiber was positively correlated with Lt and Al and negatively correlated with Rn and Rd; while neutral detergent fiber content was significantly influenced by only two geographic environmental factors, Rn and Rd, in a significant positive correlation, and was not significantly related to other influencing factors. In addition, we found that plant moisture and fresh-to-dry ratio could be influenced by Tm, Ta, Td, and other factors.
3.5. Principle component analysis (PCA)
Principal component analysis (PCA) helps to study the analysis of nutritional content and forage quality among different populations, to select the best oat population, and to analyze the variability of oat population genes in nutritional content and forage quality in different origins. Figure 3 (A) shows the PCA of six oat populations in six nutritional content parameters studied, and Figure 3 (B) examines the populations in six forage quality parameters.
In the PCA analysis of feed value, the Hu population was significantly different from the other five populations, with the three genotypes XO-1-3, XO-1-33, and XO-1-60 of the Hu population positively correlated with variability in component 1 and the remaining five populations negatively correlated. In PC1 total variability was 55.50% and they were positively correlated with acidic detergent fiber (0.47), lignin (0.50 and cellulose (0.52) and negatively correlated with primary moisture (-0.48), fresh-to-dry ratio (-0.17) and neutral detergent fiber (-0.05).PC2 total variability was 25.1% and they were positively correlated with neutral detergent fiber, acidic detergent fiber, and fresh-to-dry ratio correlated,0.36, 0.62, and 0.68, respectively, and negatively correlated with primary moisture (-0.08), lignin (-0.07), and cellulose (-0.06).
From the analysis of nutritional content, there was no significant variability in forage quality among the five groups except for the Nahef group. the contribution of PC1 and PC2 was 33.75% and 61.63%, respectively, with a total coefficient of variation of 33.8% and PC2 of 27.9%. In PC1, the Evolution population genotype was positively correlated with variability, and the remaining five population genotypes were partly negatively and partly positively correlated. In PC1, there was a positive correlation with nutritional content in all six oat populations. PC2 was negatively correlated with Ash and CP, -0.42 and -0,29 respectively, but positively correlated with EE (0.52), WSC (0.02), TP (0.36), and TK (0.58).
The forage quality of cultivated oats Hu and the other five wild oats groups were far apart in Figure 4(A), and the five wild oats groups were more similar. Moreover, in the components of PC1, the variability of cultivated oats showed a positive correlation and the variability of wild oats showed a negative correlation. In terms of nutritional value Figure 4 (B), there is little convergence between cultivated and wild oats. the variability of Nah and Tab groups is greater, and Hu variability is less, probably the nutritional value of wild oats has more potential to be explored. The genetic diversity of the cultivated oat population decreased and was more homogeneous, however, the diversity and coefficient of variation were richer in the wild.
3.6. Cluster plotting
The Wards method was used in performing the clustering analysis. From the feed value analysis, at a distance of 25%, the six oat populations were divided into two lineages, a Hu population from Zhangjiakou in Hebei, and five populations from Israel (Tabigha, Nahef, Sede Boqer, Evolution Canyon, and Beit-Oren). Within a distance of about 1.00%, they were further subdivided into five sub-clusters. The clustering results of the feeding value of the six groups are very clear, and wild oats have closer relatives and are completely independent of Chinese cultivated oats, which indicates that the feeding value of wild oats is unique.
In terms of nutritional content, there are two line segments at 25% dividing the six oat groups into two parts, one for Nahef and another part with four groups (Sede Boqer, Evolution Canyon, and Beit-Oren). The distance was further subdivided into two subgroups at 6.02%, c except for Beit-Oren, where there was variability in the other three groups at very small distances. However, the Hu oat group from China was less differentiated from Nahef at a 1% distance. Therefore, it is speculated that the nutritional structure of the Naf oat population may be closer to that of cultivated oats, which is consistent with Figure 4.
4. Discussion
Wild oats are an important grass crop that is widely distributed in natural ecosystems around the world. Compared with cultivated oats, wild oats have higher nutritional quality and forage potential and therefore have received increasing attention(Nevo et al., 1984; Turpeinen et al., 2001). In the article, we will discuss the higher nutritional quality and forage potential of wild oats in protein content, crude fat, fiber content, and acid-detergent fiber.
Firstly, wild oats are rich in high-quality protein. A study found that the protein content and quality of wild oats were significantly better than that of cultivated oats. In a study, Australian scientists Harris and Mares found that the protein content of wild oats was higher than that of cultivated oats and that the amino acid composition of wild oats was more complete(Harris & Mares, 1974). Among them, wild oats have a higher content of essential amino acids, such as lysine, tryptophan, and isoleucine. These results indicate that wild oats have higher nutritional quality and can provide better nutritional security for humans. The experimental results of this study showed that the content indexes of various nutrients in the Evolution Canyon oat group from Israel were significantly higher than those in the other five oat groups, indicating that this wild group has a higher nutritional quality and may have potential value in forage utilization. The difference between the Tg11 genotype with the highest total potassium content and the Nah1 genotype with the lowest content was 0.21%, while the difference between the Nah2 genotype with the highest total phosphorus content and the XO-1-60 genotype with the lowest content was 1.77%. The present study further used Spearman's rank correlation analysis to conclude that the geographical environmental factors of the origin of the oat population had less influence on the nutrient composition of oats, and mainly had a more significant effect on ash, crude protein, and soluble sugars (p<0.05) Crude protein was significantly positively correlated with Hu14, Huan, Tj, and Tm; while it was significantly negatively correlated with Ln, Td, and Tdd, which is consistent with Liu Wenting et al. study(Gao et al., 2015; Haitao et al., 2019; Peterson & David, 2004; Peltonen-Sainio et al., 2004). However, there was no significant correlation between total potassium, total phosphorus, and ecogeographic factors of the place of origin for oats, suggesting that these indicators may be less influenced by the environment.
Secondly, the cellulose content in wild oats is also relatively high. One study found that wild oats had a higher cellulose content than cultivated oats, with a relatively low content of neutral detergent fiber and a higher content of acid detergent fiber. This implies that wild oats are more digestible and can provide better feed value for animals(Wang et al., 2019; Zhang et al., 2019; Zheng et al., 2013). In addition, wild oats also contain higher levels of polyphenolic compounds, which are important for the prevention of intestinal diseases and the protection of cardiovascular health(Demirbas, 2005; Martinez et al., 2010). In this study, this study found that there were large differences between the forage quality of the oat groups, and the moisture, fresh-to-dry ratio, and neutral detergent fiber contents of the Hu group was significantly lower than those of the other five wild groups, indicating that the five oat groups from Israel had higher forage value. The Hu cellulose content and lignin content were both higher than those of the other groups, at 71.88% and 3.11% (average data of three years), respectively. This suggests that the water use efficiency of wild oats in Israel may be higher. The genotypes with significantly higher cellulose content were all from the Hu population in Zhangjiakou, Hebei, suggesting that cultivated oats may be more “chewy” and less palatable. This study showed that the fiber content of different genotypes differed significantly, so the selection of forage oats for different groups should be carefully screened. Spearman’s rank significant correlation analysis revealed that several forage quality components were significantly influenced by geographic environmental factors of origin, and cellulose content was significantly influenced by 12 geographic environmental factors, which were negatively correlated with Tm, Tj, Ev, Rn, Ta, Rd, Hul14, and Huan; and positively correlated with Ln, Lt, Td, and Tdd, which is consistent with the study. (Zhang et al., 2016). In this study, the higher nutritional quality and forage potential of wild oats were investigated in terms of initial moisture, fresh-to-dry ratio, cellulose lignin content, neutral detergent fiber, and acid detergent fiber.
The forage potential of wild oats is also of interest. One study found that wild oats have a higher forage potential than cultivated oats. An Australian study found that wild oats grow faster and can produce high-quality forage in a short period. In addition, the biomass and nutritional value of wild oats were higher than that of cultivated oats( Robertson et al. 2004). Comparative studies have shown that the dry matter yield and forage dry matter yield of wild oats are about 30% higher than that of cultivated oats(Aanchaldeep et al., 2022; Buttar et al., 2018), while wild oats have higher crude protein, neutral detergent fiber, and acid detergent fiber content(Bhatta et al., 2003). In addition, wild oats have other physiological functions and nutritional values. For example, wild oats are rich in a variety of bioactive components, such as polyphenols, alkaloids, and flavonoids, which have various physiological functions such as antioxidant, antitumor, hypoglycemic, and hypolipidemic(Qin et al., 2019). These physiological functions and nutritional values make wild oats a natural resource with wide application value. In this experiment, we found that the differences between different genotypes of wild oats were greater than those of cultivated varieties, and the genetic diversity and population structure of wild oats were richer than those of cultivated ones( Montilla-Bascón et al., 2013; Kshitiz et al., 2022; Mohammad et al., 2022). This indicates that wild oats have greater potential for exploration.
In conclusion, wild oats have higher nutritional quality and forage potential compared to cultivated oats. Exploring protein content, amino acid composition, fiber content, and acid detergent fiber, wild oats have higher protein content, more complete amino acid composition, and higher fiber content, which can provide better feed value for animals. Wild oats also have a variety of physiological functions and nutritional values, so it has a wide range of application prospects in the field of food, medicine, and health products.
5. Conclusion
Oats have a very high nutritional quality and forage quality. The results of this experiment show that the protein content of wild oat populations (the average of five populations) in three-year cultivation can reach 9.35%, fat content of 7.86%. Higher than other wheat and corn, with high dietary fiber content, wild oats got a Cellulose content of only 9.57%, significantly lower than the cultivated population Hu (71.88%). Net milk energy production is also higher, and it is the most promising high-quality hay in the world for industrial production and a high-quality concentrate for various livestock. In this experiment, five oat populations and one cultivated population in Israel were studied, and the results showed that the ash, soluble sugar, and total potassium contents of the Sede Boqer population were significantly higher than those of the cultivated population. In terms of forage quality release, Hu showed significantly higher lignin and cellulose content than wild oat populations, indicating that cultivated oats are more resistant to stress, but also resulting in less palatability. Climatic analysis of Spearman rank correlations between populations and origin showed that several forage quality components were significantly influenced by geographic environmental factors of origin, and cellulose content was significantly influenced by 12 geographic environmental factors, including negative correlations with Tm, Tj, Ev, Rn, Ta, Rd, Hul14 and Huan; and positive correlations with Ln, Lt, Td, and Tdd. Genetic variability of wild oats may be higher in the extreme arid weather and different latitudes and longitudes of origin in Israel. It has higher nutrient content than cultivated oats, offering greater possibilities for feed quality. In conclusion, this study provides important source material for fodder development and utilization of wild oats and good seed selection, and a better basis for further research on wild oats as an important fodder crop.
Funding
National Natural Science Foundation of China (31860412), Talent Initiation Funding Project of Chengdu University (2081923007), Open Project Program of Irradiation Preservation Technology Key Laboratory of Sichuan Province, Sichuan Institute of Atomic Energy (FZBC206704), Ministry of Finance and Ministry of Agriculture and Rural Affairs: National Oat Buckwheat Industry Technology System (CARS-07-B-1).
Data availability statement
Data are available from the corresponding author on reasonable request.
Acknowledgments
The authors thank Chengdu University for technical assistance and the Institute of Evolution, the University of Haifa for providing oat seed resources, and especially Liang Zou and Yu Fan for their role in facilitating this research. We thank, Li Xiaolong, Wang Junzhen,Li Yang, Yang Qiaohui, Xiang Dabing, Wan Yan, Eviatar Nevo, and Yan Jun for their work in the field and laboratory.
Confliction of interest statement
The authors declare no conflict of interest.
References
- Aanchaldeep Kaur, M. G.; Kaur, M.; Mahal, A.K. Interactive effect of planting dates and development stages on digestibility, qualitative traits and yield of forage oat (Avena sativaL.) genotype. Cereal Research Communications 2022, 50, 1237–1247. [Google Scholar] [CrossRef]
- Akhtar M, C. M. S., Jamil M. Effect of sowing time on wheat wheat genotypes for important traits in wheat. Agricultural Research 2006, 44, 255–259.
- Bhatta, R.; Shinde, A. K.; Vaithiyanathan, S.; Ravindra, J. P.; Singh, D. In vitro ruminal fermentation and in sacco evaluation of tropical feedstuffs: I. Forage biomass and tree leaves. Animal Feed Science and Technology 2003, 109, 173–187. [Google Scholar]
- Biel, W.; Kazimierska, K.; Bashutska, U. Nutritional value of wheat, triticale barley, and oat grains. Acta Scientiarum Polonorum Zootechnica 2020, 19(12), 19–28. [Google Scholar] [CrossRef]
- Buttar PS, K. P., Singh SP. Effect of sowing dates, irrigation, and mulching on growth and yield of wheat. Journal of Agricultural Research 2018, 55, 243–250. [CrossRef]
- Changlin, X. Comparative study on growth characteristics of different oat varieties in alpine pasture. Journal of Grass Industry 2012, 21, 280–285. [Google Scholar]
- Chen Zhenjia, W. M., Chen Li, Lu Yadong, Wang Yu. Analysis of nutritional composition attributes of oat varieties of different origins. Agricultural products processing 2020, 24, 43-45+48.
- Costa, R. P., Nuno; Almeida, Almeida, Ana Sofia ; Gomes, Conceicao;Coutinho, Jose; Coco, Joao; Costa, Armindo ; Macas, Benvindo. Effect of sowing date and seeding rate on bread wheat yield and test weight under Mediterranean conditions. Journal of Food and Agriculture 2014, 25, 95–961.
- Demirbas, A. β-Glucan and mineral nutrient contents of cereals grown in Turkey. food chemistry 2005, 773–777. [Google Scholar] [CrossRef]
- Du Yanping, M. J., Chang Keqin. Cultivation techniques for productive naked oats in the southern Ningxia mountains. Inner Mongolia Agricultural Science and Technology 2008, 12, 103–104.
- Enciso, U. y., Wiedenteld B. Subsurface drip irrigation of on-ons:Efects of drip tape emitter spacing on yield and quality. Agrc Water Manage 2007, 92, 126–130. [Google Scholar] [CrossRef]
- Montilla-Bascón, J. S.-M., N. Rispail, D. Rubiales, L. Mur, T. Langdon, I. Griffiths, C. Howarth & E. Prats. Genetic Diversity and Population Structure Among Oat Cultivars and Landraces. Plant Molecular Biology Reporter 2013, 31, 1305–1314. [Google Scholar] [CrossRef]
- Gao Xusheng, T. Z. Effect of different N and K fertilizer ratios on yield and quality of oats. Qinghai Agriculture and Forestry Technology 2015, 4, 5–8. [Google Scholar]
- Guoqing, Z. Determination of inorganic and organic phosphorus in feedstuffs. Feed Industry 2003, 7, 33–34. [Google Scholar]
- Haitao, L. W. Y. C. Z. X. B. J. Y. X. L. T. Z. Reconstruction of early summer drough tindicesin mid- northregion of China after1500usingtreeringchronologies. Quaternary Research 2019, 151–155. [Google Scholar]
- Harris, P. J.; Mares, D. J. The content and composition of the protein of oats and barley. Journal of the Science of Food and Agriculture 1974, 25. [Google Scholar]
- Hoffmann, L. A. World production and use of oats. The Oat Crop—Production and Utilization 1995, 34–61. [Google Scholar]
- John, V. Naked oatsin the oat crop. Production and Utilization, 1995, 504–532. [Google Scholar]
- Kshitiz Pokhrel, L. K. r., Katerina Pazderů, Ivana Capouchova, Matej Bozik. (2022). Lipid content and fatty acid profile of various European and Canadian hulled and naked oat genotypes Journal of Cereal Science.
- Li Fengxia, S. L. Study on the suitable sowing period of oats in alpine pasture in Qinghai. Grass science 1996, 13, 32–34. [Google Scholar]
- Li Sheng, A. P., Wang Fangtian, Li XueMin,Liu Yi. Farmers' initiative on adaptation to climate change in the Northern Agro-pastoral Ecotone. International Journal of Disaster Risk Reduction 2015, 278–284. [Google Scholar]
- Li Xilai, Y. L., Zhang Guosheng. Effect of different sowing periods on the production characteristics of oats in "circle nests" in highland family pastures. Grass science 2001, 18, 14–17. [Google Scholar]
- Li Ying, M. P. Progress of research on germplasm resources of oats. Anhui Agricultural Science 2013, 41, 72–76. [Google Scholar]
- Li Yongfeng, Z. Y., Mu Lanhai. Comparative trials of oat introduction. Inner Mongolia Agricultural Science and Technology 2011. [Google Scholar]
- Liying, Z. (2016). Feed analysis and feed quality testing technology. China Agricultural University Press.
- Loskutov I G, S. T. V. K. A. V. The metabolomic approach to the comparative analysis of wild and cultivated speries of oats (Avena L.). Russian Journal of Genetics:Applied Research 2017, 12, 501–508. [Google Scholar]
- Peterson & David. (2004). Oat-a mulifunctional grainlAl. In C.-S. P. o.-H. M (Ed.), (pp. 21-26).
- Ma Xueqin, Z. G., Gong Jianjun. Effect of sowing date and nitrogen fertilization on growth characteristics of oats in alpine pasture. Grass science 2010, 63–67. [Google Scholar]
- Ma Xueqin, Z. G., Gong Jianjun. Effect of sowing date and nitrogen fertilizer on the components of oat seed yield. Grass science 2010, 88–92. [Google Scholar]
- MartinezM F, A. M., WehrhahneLN. Grain yield,nutrient content and lipid profile of oat genotypes grown in a semiarid environment. Field Crops Researc 2010, 116, 92–100. [Google Scholar] [CrossRef]
- Masood, S. B.; Muhammad, T.-N.; Iqbal, K. M. K.; Rabia, S.; S, B. M. Oat: unique among the cereals. J European journal of nutrition 2008, 47. [Google Scholar]
- MeenNarayan, J. B. R. K. oat is a multifunctional cereal crop. Innov. Farm. 2017, 2, 114–116. [Google Scholar]
- Mohammad Ihsan, M. N., Nausheen Nazir, Muhammad Zahoor b, Atif Ali Khan Khalil,Abdul Ghafoor, Arshad Khan, Riaz Ullah, Nisar Ahmad. Genetic diversity in nutritional composition of oat (Avena sativa L.) germplasm reported from Pakistan. Saudi Journal of Biological Sciences 2022, 1487–1500. [Google Scholar]
- Nevo E, B. A. Y. Genetic resources of wildcereals in lsrael and the vicinity:Phenotypic variation within andbetween populations of wid barley Hordeum spontaneum. Euphvtica 1984, 33, 737–756. [Google Scholar]
- Ngouajio, M.W.G.; Goldy, R. Withholding of drip irrigation between transplanting and flowering increases the vield offield-arown tomato under plastic mulch. Agric Water Manage 2007, 87, 285–291. [Google Scholar] [CrossRef]
- Oktem, A.S. M.; Oktem, A.G. Deficit irrigation efects on sweet corn(Zea mays saccharata Sturt)with drip irigation system ina semi-arid region. Agric Water Manage 2003, 61, 63–74. [Google Scholar] [CrossRef]
- Peltonen-Sainio, P.K. M.; Rajala, A. Impact dehuling oat grain to improve quality of on-farm produced feed:1.Hullability and associated changes in nutritive value and energy content. Agriculture food science 2004, 13, 18–28. [Google Scholar] [CrossRef]
- Qin, X.; Li, Y.; Li, L.; Zhang, Y.; Song, Y.; Shi, X. The comparison of the phytochemical profiles and antioxidant activities of different parts of oats. Journal of Food Science and Technology 2019, 56(10), 4738–4747. [Google Scholar]
- Robertson M J, H. J.F, B. R. Response of canola and Indian mustard to sowing in the grain belt of northeastern Australia. Australian Experimental Agronomy Journal 2004, 44, 43–52. [Google Scholar] [CrossRef]
- Francis W&Associates. Oats: Chemistry and technology. Journal of Cereal Science 2011, 53, 51-10. [Google Scholar]
- Rohweder D A.Barnes R F, J. N. Proposed hay grading standards based on laboratory analyses for evaluating quality. Journal of Animal Science 1978, 47, 747–759. [Google Scholar] [CrossRef]
- Sojka R E, L. R. D., Westerman D T. Water and erosion man-agement with multiple application of polvacrylamide in furow irriation. Soil Sci Soc Am 1998, 62, 1672–1680. [Google Scholar] [CrossRef]
- Sui Hua, D. J., Li Xiaogang,Liu Qing,Sun Xiuhua),Zheng Shuqing,Xing Peiyi. Effects of drolght-control and water-retention agent on wheat growth. Tianin Agricuture University 2018, 15, 11–13. [Google Scholar]
- Suttle J M, R. S. G. ( 2004.). Fodder oats: a world overview. Rome: Publishing Management Service.
- Turpeinen T, T. T., Manninen. Microsatellite diversity associated with ecological factors in Hordeum spontaneum populations in lsrael. Mol. Ecol 2001, 10, 1577–1591. [Google Scholar] [CrossRef] [PubMed]
- Varma, P., H. Bhankharia and S. Bhatia. Oats: A multi-functional grain. Journal of Clinical and Preventive Cardiology 2016, 5, 9–17. [Google Scholar] [CrossRef]
- Wang, S. J. J. X. Y. W. G. Evaluation of forage yield and nutritional value of introduced oat germplasm resources. Journaof Triticeae Crops 2019, 39, 1063–1071. [Google Scholar]
- Wang S P, W. Y. F. Effects of nitrogen and sulphur fertilization on oats yield, quality and digestibility and nitrogen and Sulphur metabolism of sheep in the Inner Mongolia Steppes of China. Nutrient Cycling in Agroecosystems 2002, 62, 195–202. [Google Scholar] [CrossRef]
- Welch R W, L. J. M. Nitrogen content,oil content and oil composition of oat Cultivars (A.sativa) and wild avian species in relation to nitrogen fertility yield and partitioning of assimilates. Journal of Cereal Science 1997, 26, 321–328. [Google Scholar]
- Wu Na, Z. B. Effect of water retention agent dosage on yield and quality of naked oats under two types of irrigation. Journal of Crop Science 2009, 35, 1552–1557. [Google Scholar]
- Xiao Xuejun, Z. Q., Chen youjun. Effect of seed sowing on the production performance and photosynthetic characteristics of Linnaean oats in alpine grazing areas. Grass science 2017, 34, 761–771. [Google Scholar]
- Xu Xinran, L. J., Wang Ming, Yu Liangyou, Liu Siyuan, Cheng Xiaobin, Zhao Gang, Yan Jun. Analysis of wild oats forage value and ecogeographic factors of origin in Israel. Feed Research 2020, 43(09), 102–106. [Google Scholar]
- Yuan Changmei, H. X., Ma Liyan. Research progress of phytic acid and its detection method. Food Industry 2021, 42, 396–400. [Google Scholar]
- Yue Zhanga, L. Z., Ning Yangb, Neil Huthc, Enli, & Wangd, W. v. d. W., Jochem B. Everse, Qi Wanga, Dongsheng Zhanga, Ruonan Wanga, Hui Gao, Niels P.R. Antene. Optimized sowing time windows mitigate climate risks for oats production under cool semi-arid growing condition. Agricultural and Forest Meteorology 2019, 184–197. [Google Scholar]
- Zhang G Y, W. J. W., Zhang H R. Comparative study on production performance and nutritional quality of eight importeooat varieties in the Shioatse redion of Tibet. China. Pratacultural Science 2019, 36, 1117–1125. [Google Scholar]
- Zhang Guosheng, L. X., Ma Zongtai. Study on the effect of sowing period and sowing density on the yield of oats in the "circle nest". Grass science 2002, 21–24. [Google Scholar]
- Zhang Ying, C. Z., Zhang Xiaona, Song Shuhong, Yang Zhuo, Yang Yungui. Effect of different mowing periods on hay yield and quality of spring and autumn sown oats. Grass Science 2016, 25, 124–135. [Google Scholar]
- Zheng MNA, L. Y., Liang XZ. Grey correlation analysis and comprehensive evaluation of introduced alfalfa varieties in northern Jinjiang. Grass Science 2017, 22, 631–637. [Google Scholar]
- Zheng X, W. Z. W., Wu Z N. Adaptability evaluation of different Avena sativa varieties in the Yangzhou Area. Grass Science 2013, 21, 272–279. [Google Scholar]
- Zhou Lei, W. L., Zhao Baoping, Mi Junzhen, Wang Fengwu, Liu Jinghui, Zhang Dan, Liu Yeh-Kun. Effects of different sowing and mowing periods on yield and quality of oat forage in the northern agro-pastoral interlacing area. Grass Science 2021, 29, 2363–2364. [Google Scholar]
- Zhu Hongfu, W. L., Lin Yufan. Research on the production performance and feeding value of foreign forage sorghum varieties in Ningxia Yellow Irrigation Region. Chinese Journal of Grassland 2019, 41, 40–46. [Google Scholar]
- Zong Wen, Z. D. Z. Foreign introduction and utilization of oat germplasm resources in China. Journal of Plant Genetic Resources 2017, 18, 1001–1005. [Google Scholar]
Figure 1.
Average of Nutrient content in 3 years of different genotypes of oat.
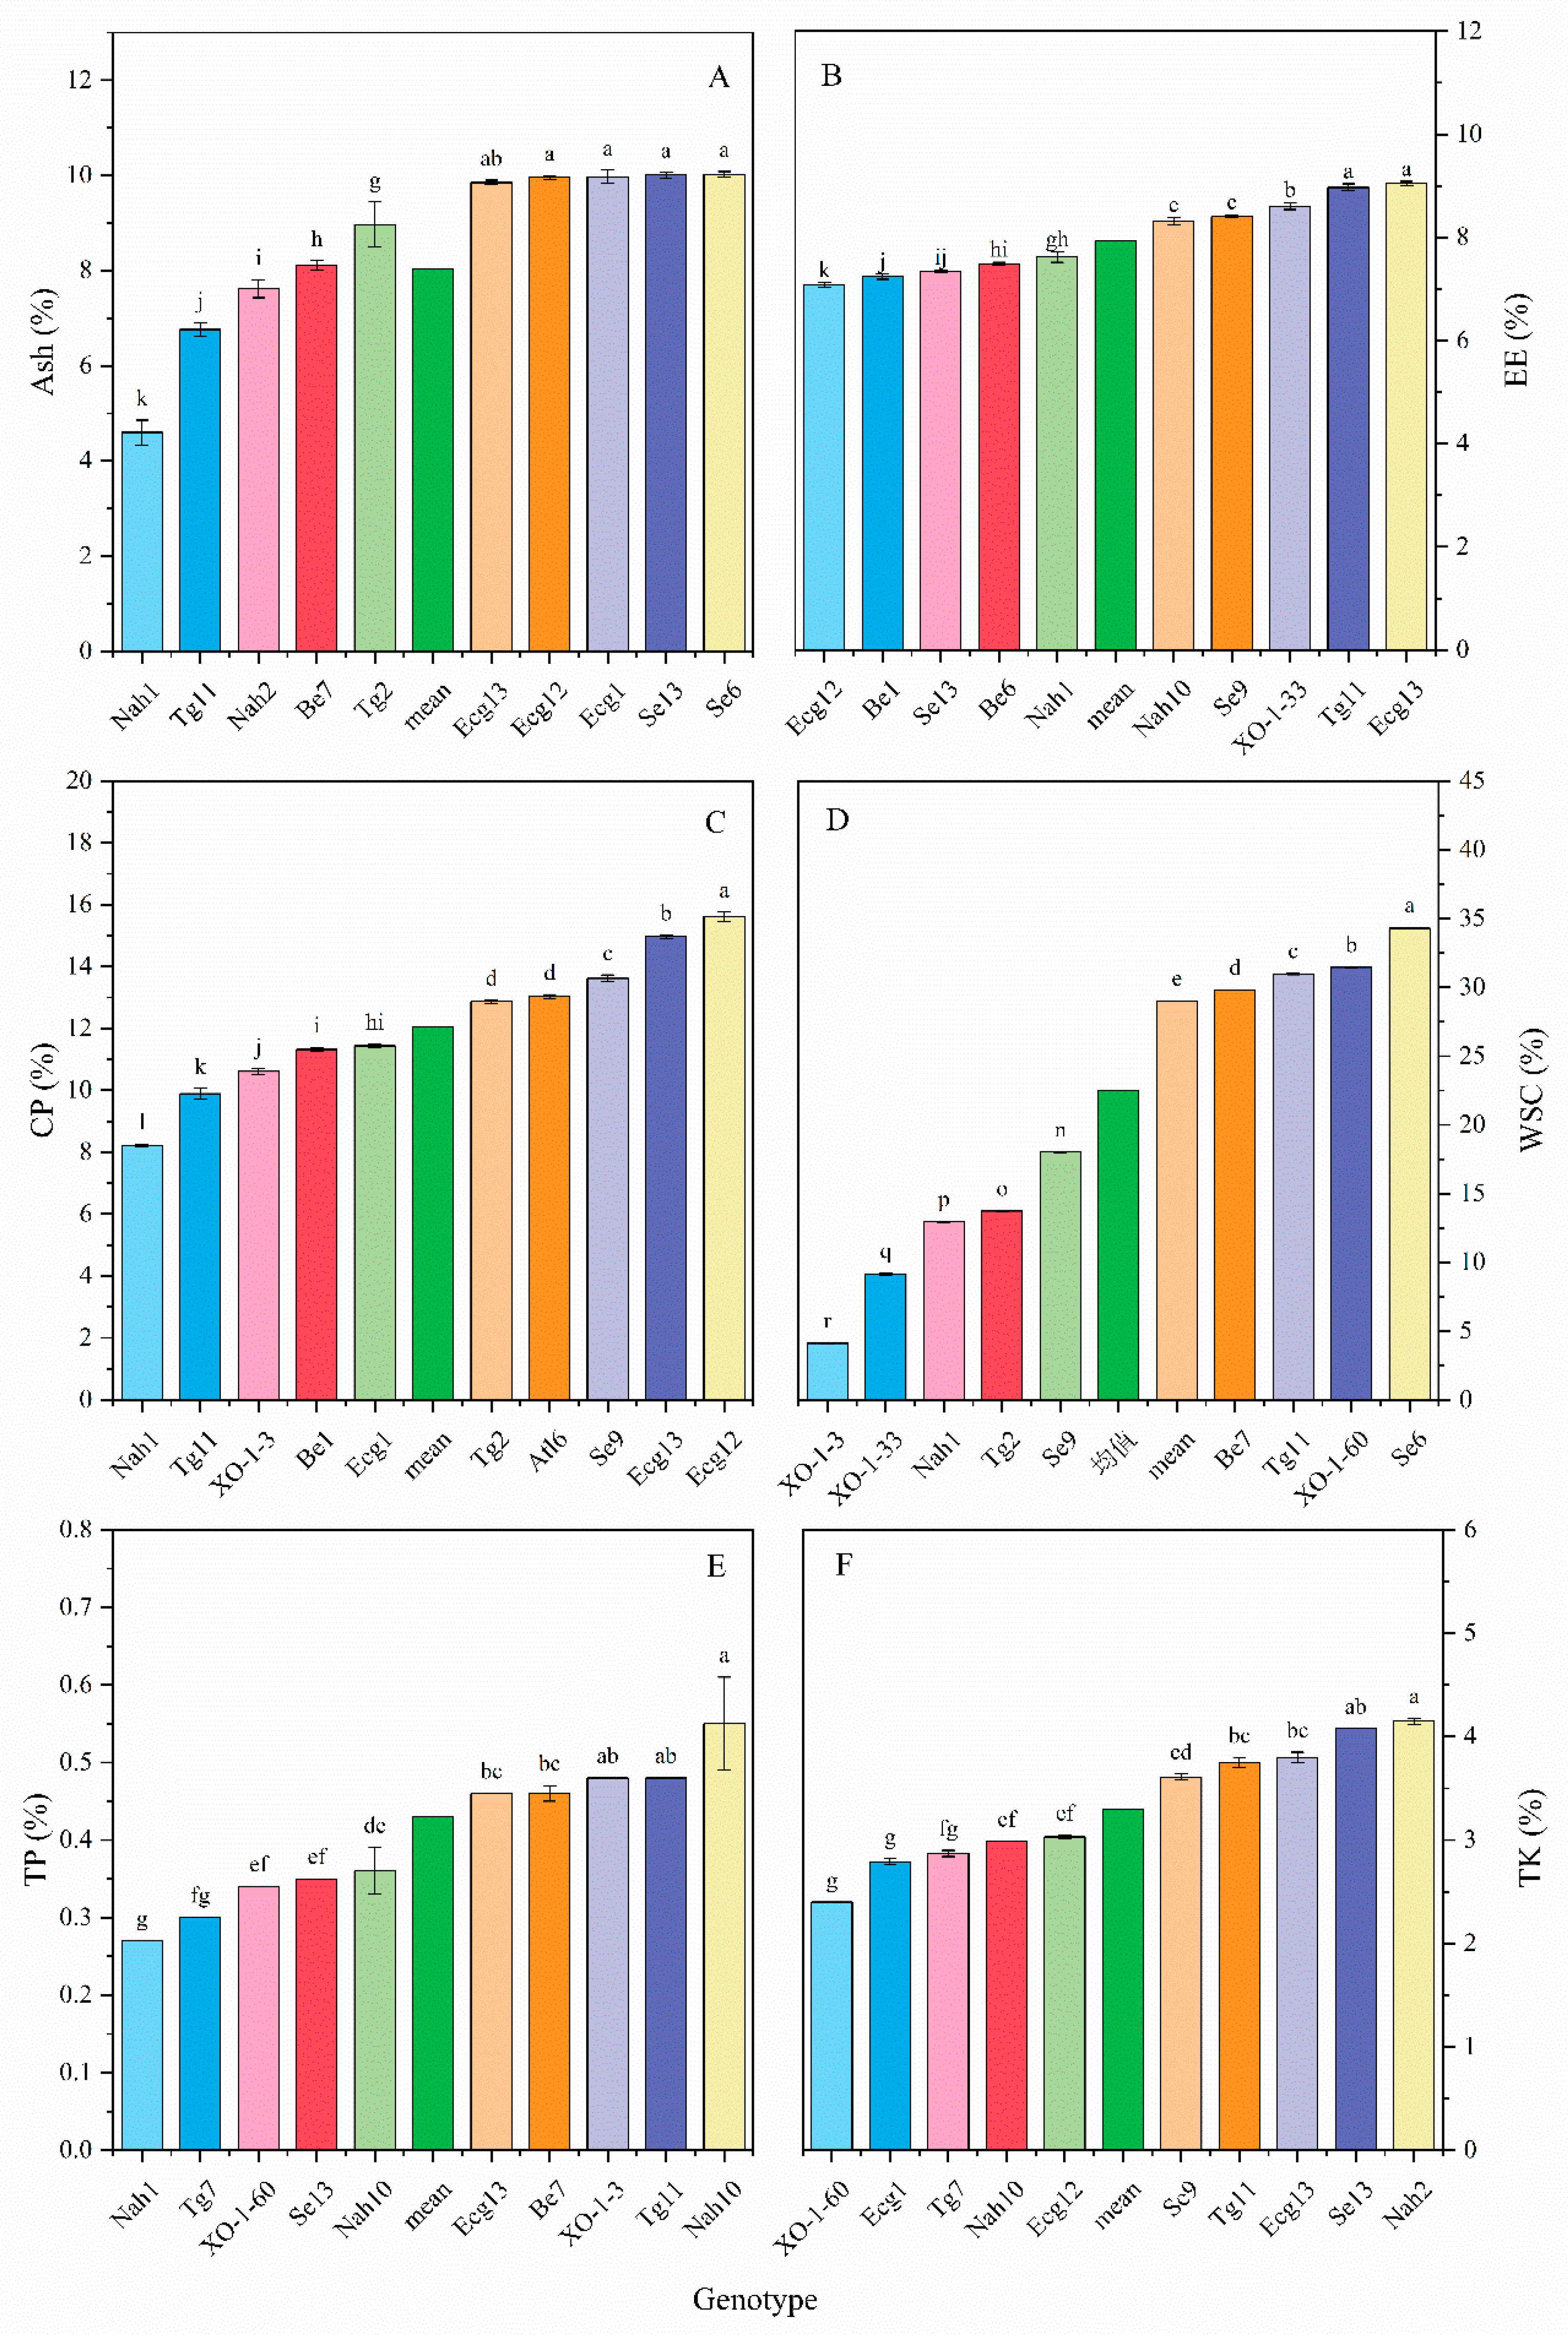
Figure 2.
Average data of Feed value in 3 years of different oat genotypes.
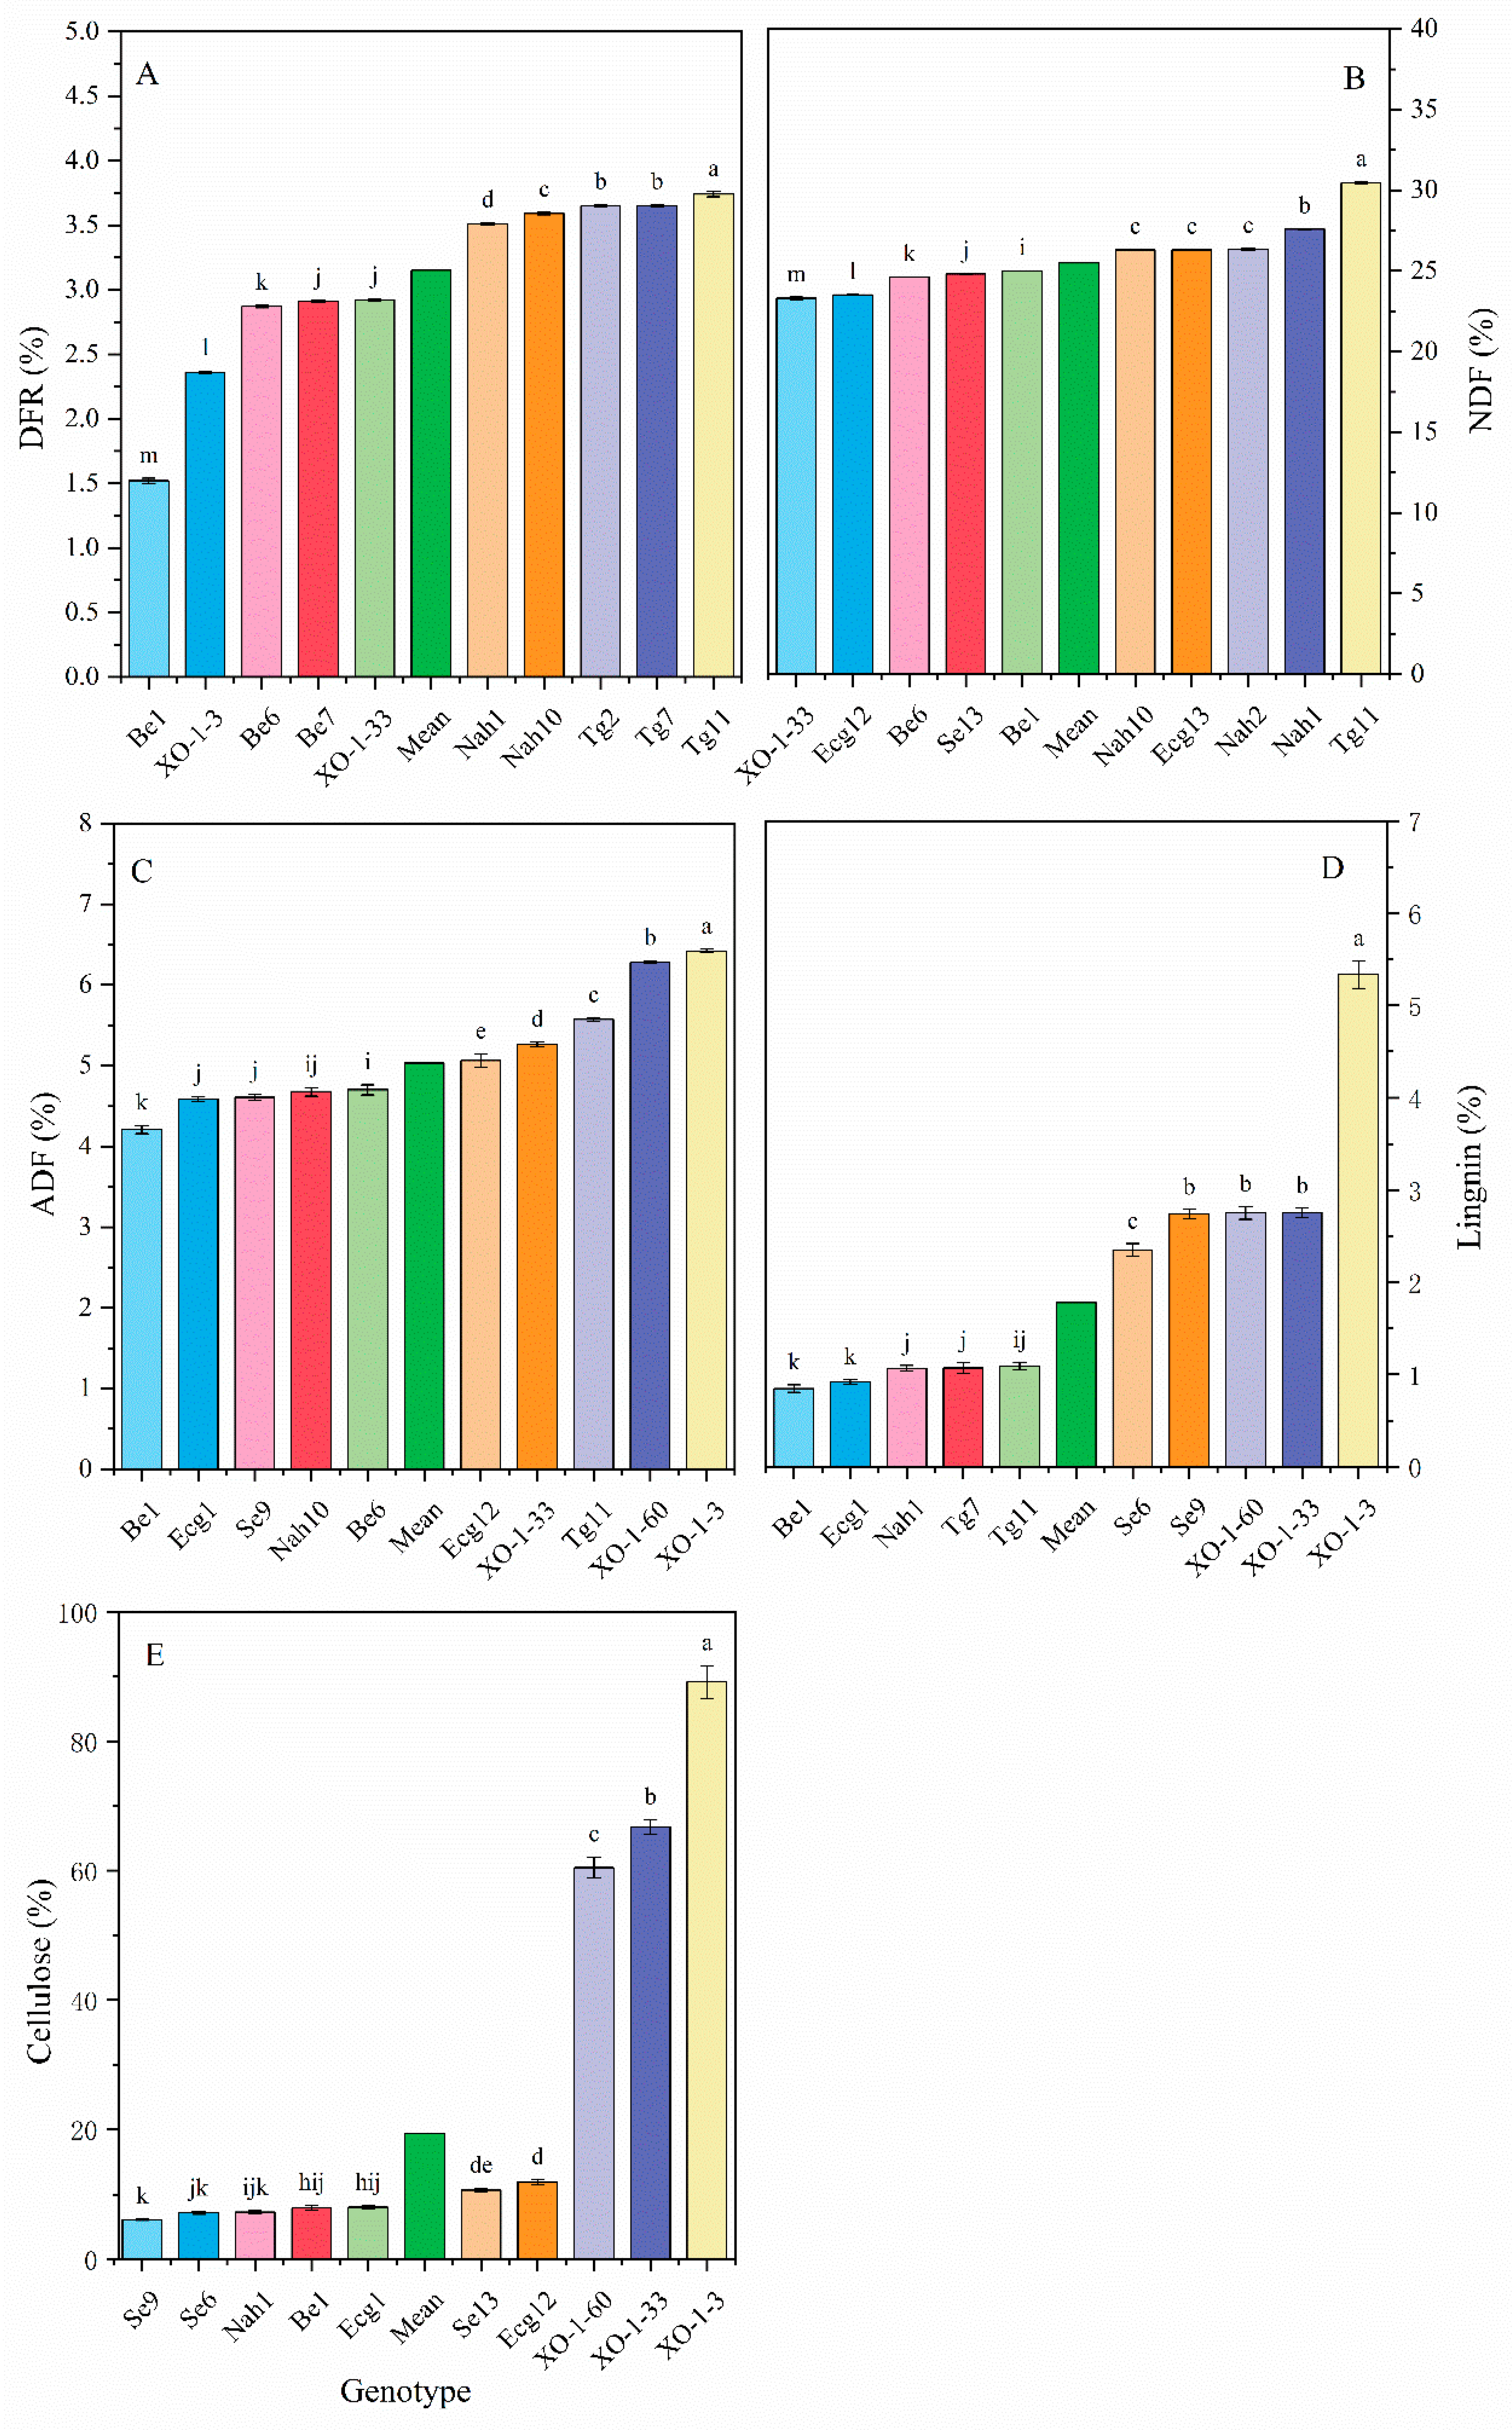
Figure 3.
Principle component analysis (PCA).
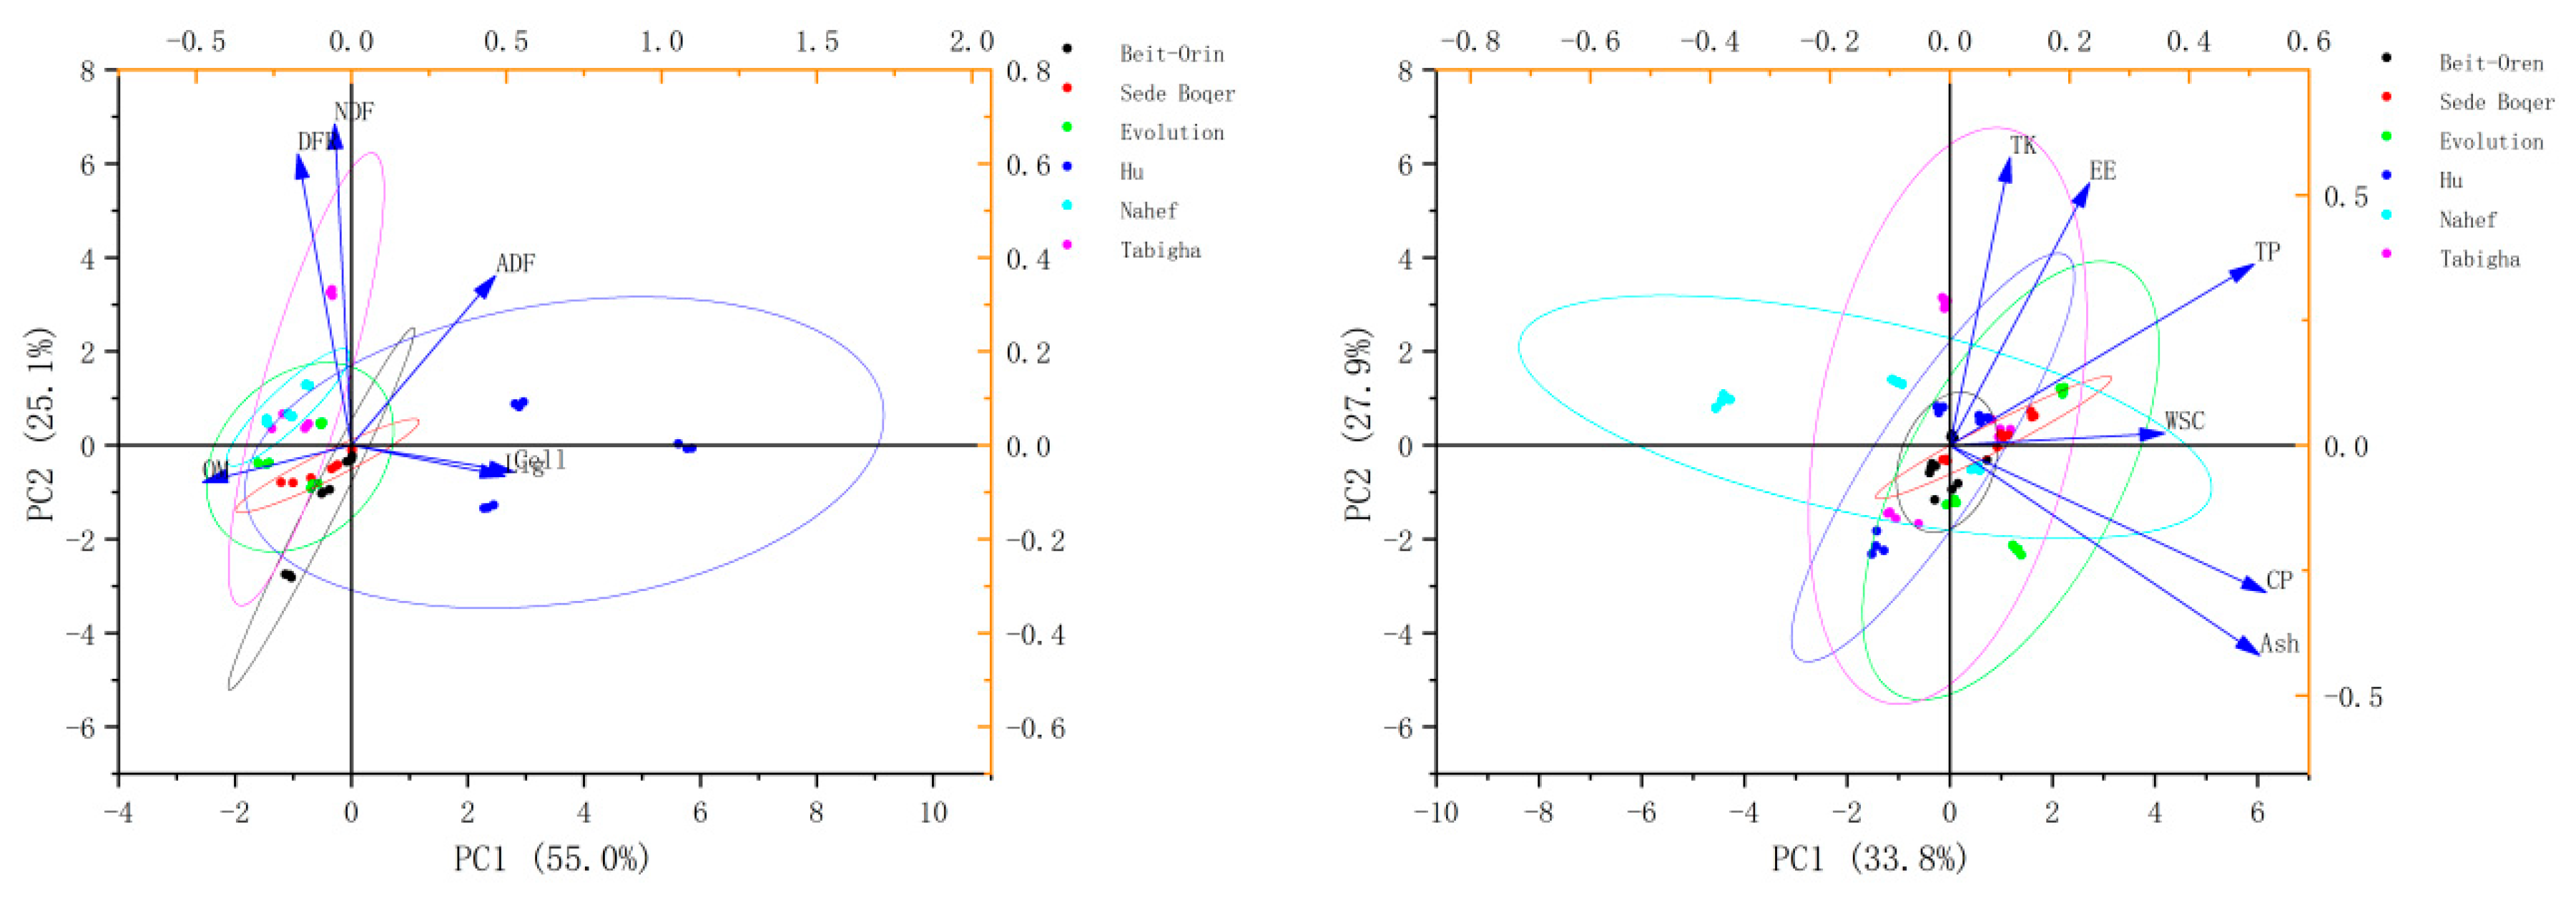
Figure 4.
Cluster plotting of different communication.
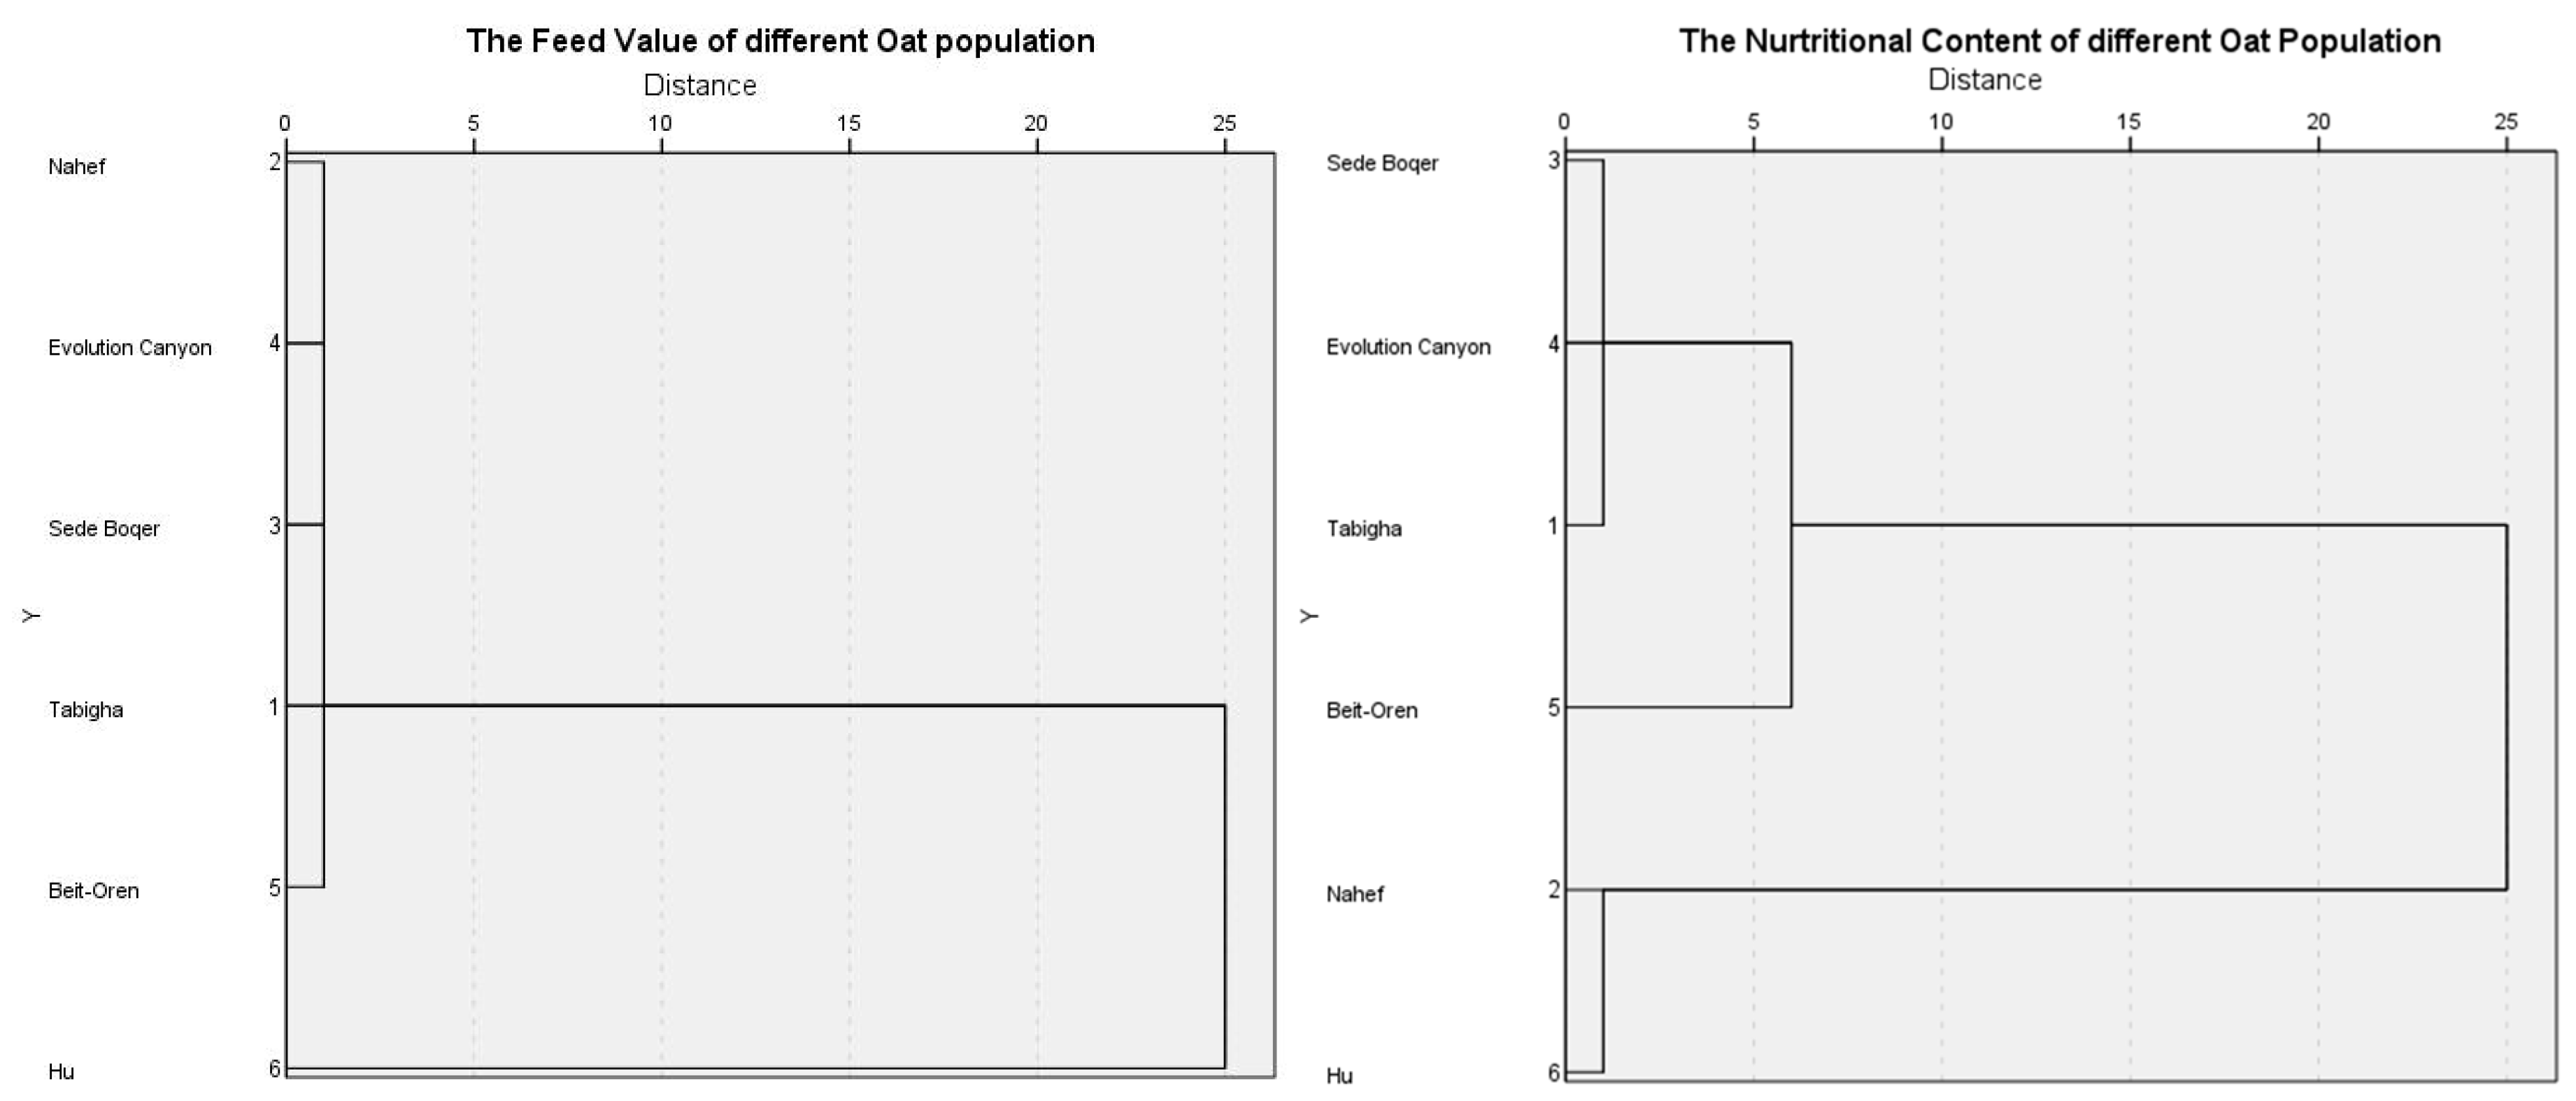
Table 3.
Analysis of nutritional content of different oat populations.
| Year | Population | Ash/% | EE/% | CP/% | WSC/% | TP/% | TK/% | |
| 2018.10- | Tabigha | Mean | 8.33±1.21 cd | 8.25±0.58 a | 11.52±1.39 b | 26.63±4.20 a | 0.40±0.08 b | 3.37±0.39 a |
| 2019.01 | Range | 6.67~9.42 | 7.57~9.04 | 9.67~12.92 | 27.76~31.48 | 0.30~0.48 | 2.84~3.80 | |
| CV/% | 13.71% | 6.63% | 11.37% | 14.86% | 18.28% | 10.97% | ||
| Nahef | Mean | 7.35±2.27 d | 7.89±0.14 bc | 10.80±1.99 b | 13.91±4.59 b | 0.52±0.51 a | 3.52±0.51 a | |
| Range | 4.43~9.96 | 7.26~8.18 | 8.19~12.68 | 9.12~19.68 | 0.27~1.86 | 2.99~4.17 | ||
| CV/% | 29.15% | 3.82% | 17.41% | 31.14% | 16.58% | 13.63% | ||
| Sede Boqer | Mean | 9.84±0.26 a | 7.96±0.48 a | 12.68±0.71 ab | 25.67±3.22 a | 0.41±0.046 b | 3.78±1.13 a | |
| Range | 9.47~10.06 | 7.34~8.38 | 12.04~13.68 | 21.37~28.36 | 0.35~0.45 | 0.35~4.08 | ||
| CV/% | 2.48% | 5.73% | 5.32% | 11.84% | 10.54% | 7.18% | ||
| Evolution Canyon | Mean | 9.23±0.10 a | 7.98±0.27 a | 14.01±1.95 a | 26.26±6.21 a | 0.41±0.04 b | 3.21±0.46 a | |
| Range | 9.81~10.08 | 7.03~9.08 | 11.39~15.79 | 17.94~30.97 | 0.27~0.46 | 2.76~3.48 | ||
| CV/% | 0.92% | 10.21% | 13.14% | 22.30% | 8.74% | 13.49% | ||
| Beit-Oren | Mean | 8.75±0.49 bc | 7.46±0.18 d | 12,01±0.79 ab | 20.94±13.32 abc | 0.43±0.04 b | 3.20±0.21 ac | |
| Range | 7.99~9.21 | 7.19~7.67 | 11.24~13.10 | 4.11~34.35 | 0.38~0.49 | 2.67~3.48 | ||
| CV/% | 5.25% | 2.34% | 6.22% | 59.99% | 7.61% | 6.15% | ||
| Hu | Mean | 9.39±0.23 ab | 8.00±0.49 ab | 10.35±0.63 b | 14.28±12.52 b | 0.40±0.06 b | 3.12±0.54 a | |
| Range | 9.07~9.76 | 7.36~8.67 | 9.51~11.32 | 0.08~29.97 | 0.34~0.48 | 3.12±0.54 ab | ||
| CV/% | 2.34% | 5.68% | 5.21% | 82.66% | 13.65% | 16.33% | ||
| 2019.10- | Tabigha | Mean | 8.28±0.71 cd | 8.27±0.28 a | 6.12±0.53 b | 19.76±1.18 b | 0.33±0.13 ab | 2.55±0.24 b |
| 2020.01 | Range | 6.64~9.52 | 7.45~9.01 | 5.48.75 | 17.78~21.56 | 0.19~0.49 | 2.28~2.85 | |
| CV/% | 13.71% | 6.55% | 8.15% | 9.18% | 36.71% | 9.02% | ||
| Nahef | Mean | 7.35±2.27 d | 7.91±0.32 ab | 5.82±0.78 b | 11.37±2.69 b | 0.27±0.08 b | 2.91±0.39 a | |
| Range | 4.43~9.96 | 7.53~8.32 | 4.77~6.44 | 8.18~14.51 | 0.20~0.37 | 2.61~3.44 | ||
| CV/% | 29.15% | 3.79% | 12.57% | 22.29% | 26.58% | 12.54% | ||
| Sede Boqer | Mean | 9.87±0.44 a | 7.93±0.28 ab | 9.02±2.87 a | 11.59±5.82 b | 0.34±0.10 ab | 2.92±0.41 a | |
| Range | 9.38~10.11 | 7.31~8.44 | 5.55~12.23 | 6.71~19.30 | 0.20~0.41 | 2.45~3.40 | ||
| CV/% | 2.48% | 5.73% | 29.97% | 47.35% | 27.35% | 13.25% | ||
| Evolution Canyon | Mean | 9.93±0.10 a | 7.86±0.16 a | 8.51±2.88 a | 13.53±2.27 b | 0.27±0.01 ab | 2.44±0.25 b | |
| Range | 9.81~10.08 | 7.03~9.08 | 5.79~12.23 | 11.31~16.47 | 0.26~0.29 | 2.10~2.69 | ||
| CV/% | 0.92% | 10.21% | 31.88% | 15.83% | 4.01% | 9.73% | ||
| Beit-Oren | Mean | 8.77±0.23 bc | 7.47±0.12 b | 6.78±0.80 b | 12.07±1.17 b | 0.33±0.05 ab | 2.64±0.14 ab | |
| Range | 7.99~9.21 | 7.08~7.87 | 5.97~7.80 | 11.04~13.74 | 0.326~0.38 | 2.47~2.84 | ||
| CV/% | 5.25% | 2.34% | 11.11% | 9.66% | 15.51% | 4.89% | ||
| Hu | Mean | 9.49±0.32 ab | 8.07±0.49 a | 7.44±0.70 ab | 9.50±4.25 a | 0.35±0.05 a | 2.57±0.30 b | |
| Range | 9.18~9.77 | 7.37~8.66 | 6.72~8.33 | 3.00~14.67 | 0.28~0.40 | 2.17~2.82 | ||
| CV/% | 2.27% | 5.73% | 8.81% | 44.42% | 12.89% | 11.13% | ||
| 2020.10- | Tabigha | Mean | 7.51±0.55 b | 8.36±0.50 a | 11.38±0.42 a | 17.78±1.37 a | 0.20±0.00 a | 2.63±0.09 a |
| 2021.01 | Range | 7.00~8.32 | 7.66~8.88 | 10.84~11.84 | 8.07~12.47 | 0.19~0.20 | 2.53~2.76 | |
| CV/% | 6.95% | 5.62% | 3.52% | 11.98% | 2.35% | 3.27% | ||
| Nahef | Mean | 7.85±0.85 ab | 7.98±0.89 ab | 9.54±0.56 c | 18.08±5.31 a | 0.14±0.03 bc | 2.28±0.27 b | |
| Range | 6.71~8.58 | 6.89~8.98 | 8.77~10.01 | 13.10~26.72 | 0.10~0.16 | 1.94~2.56 | ||
| CV/% | 10.16% | 10.47% | 5.57% | 27.69% | 18.16% | 11.00% | ||
| Sede Boqer | Mean | 8.07±0.38 a | 7.88±0.23 ab | 9.36±0.22 c | 17.82±2.51 a | 0.12±0.01 c | 2.06±0.08 c | |
| Range | 7.63~8.63 | 7.56~8.10 | 9.03~9.59 | 14.24~22.03 | 0.11~0.13 | 1.96~2.16 | ||
| CV/% | 4.44% | 2.75% | 2.25% | 13.30% | 6.37% | 3.81% | ||
| Evolution Canyon | Mean | 7.95±0.52 ab | 7.21±1.47 b | 9.78±0.31 c | 16.00±4.19 ab | 0.14±0.01 bc | 2.28±0.09 b | |
| Range | 7.24~8.74 | 6.05~9.21 | 9.35~10.08 | 7.66~20.79 | 0.13~0.15 | 2.16~2.38 | ||
| CV/% | 6.20% | 19.19% | 2.95% | 24.71% | 5.96% | 3.67% | ||
| Beit-Oren | Mean | 7.74±0.38 ab | 7.91±0.90ab | 7.64±0.08 d | 14.79±1.48 b | 0.07±0.01 d | 1.85±0.16 d | |
| Range | 7.21~8.29 | 6.64~8.84 | 7.51~7.77 | 13.01~16.80 | 0.05~0.10 | 1.65~2.03 | ||
| CV/% | 4.63% | 10.70% | 0.99% | 9.43% | 24.13% | 8.06% | ||
| Hu | Mean | 7.99±0.40 ab | 8.39±0.91 a | 10.66±1.53 b | 10.51±1.77 c | 0.17±0.08 ab | 2.23±0.30 bc | |
| Range | 7.65~8.71 | 7.17~9.23 | 8.66~12.18 | 9.09~13.56 | 0.07~0.26 | 1.85~2.56 | ||
| CV/% | 4.64% | 10.18% | 13.50% | 15.87% | 42.06% | 12.75% |
Table 4.
Analysis of feed value of different oat populations.
| Year | Population | DFR/% | NDF/% | ADF/% | Lignin/% | Cellulose/% | |
| 2018.10- | Tabigha | Mean | 3.68±0.04 ab | 27.29±2.37 ab | 5.09±0.38 b | 1.15±0.11 c | 8.55±0.37 b |
| 2019.03 | Range | 3.64~3.75 | 25.56~30.55 | 4.68~5.58 | 1.02~1.32 | 7.99~9.10 | |
| CV/% | 1.15% | 8.20% | 7.06% | 8.67% | 4.10% | ||
| Nahef | Mean | 3.54±0.02 a | 26.74±0.43 a | 4.87±0.14 bcd | 1.21±0.26 c | 9.10±2.08 b | |
| Range | 3.50~3.60 | 26.30~27.61 | 4.63~5.02 | 1.06~1.43 | 7.07~10.96 | ||
| CV/% | 1.10% | 2.23% | 3.05% | 10.80% | 15.29% | ||
| Sede Boqer | Mean | 3.13±0.02 a | 25.36±0.43 a | 4.74±0.14 cd | 2.42±0.26 b | 7.98±2.08 b | |
| Range | 3.10~3.16 | 24.77~25.84 | 4.56~4.94 | 2.11~2.79 | 5.99~10.86 | ||
| CV/% | 0.53% | 1.60% | 2.68% | 10.27% | 24.63% | ||
| Evolution Canyon | Mean | 3.24±0.04 a | 25.08±1.24 a | 4.90±0.24 bc | 1.11±0.15 c | 9.71±1.73 b | |
| Range | 3.18~3.28 | 23.49~26.34 | 4.56~5.13 | 0.89~1.26 | 7.78~12.16 | ||
| CV/% | 1.11% | 4.66% | 4.62% | 12.56% | 16.78% | ||
| Beit-Oren | Mean | 2.43±0.69 b | 25.12±0.49 b | 4.58±0.29 d | 1.15±0.23 c | 9.01±0.87 b | |
| Range | 1.50~9.92 | 24.62~25.81 | 4.15~4.86 | 0.81~1.35 | 7.56~9.90 | ||
| CV/% | 26.60% | 1.82% | 5.94% | 18.66% | 9.15% | ||
| Hu | Mean | 2.88±0.43 c | 24.97±1.29 c | 5.99±0.55 a | 3.61±1.29 a | 72.11±13.16 a | |
| Range | 2.35~3.37 | 23.23~26.20 | 5.24~6.43 | 2.68~5.48 | 58.71~91.64 | ||
| CV/% | 14.23% | 4.87% | 8.61% | 33.75% | 17.21% | ||
| 2019.10- | Tabigha | Mean | 6.48±0.76 a | 30.51±1.82 a | 11.20±0.79 c | 1.16±0.07 d | 10.07±0.63 bc |
| 2020.03 | Range | 5.50~7.62 | 28.15~32.81 | 9.82~12.36 | 1.04~1.28 | 8.92~10.81 | |
| CV/% | 11.77% | 6.51% | 6.65% | 5.82% | 5.89% | ||
| Nahef | Mean | 4.45±0.40 b | 18.85±1.38 c | 10.66±1.03 cd | 1.45±0.21 c | 9.45±1.09 bc | |
| Range | 4.06~4.96 | 16.73~21.26 | 9.18~12.37 | 1.14~1.66 | 7.98~11.23 | ||
| CV/% | 8.40% | 6.89% | 9.12% | 13.31% | 10.88% | ||
| Sede Boqer | Mean | 4.64±0.54 b | 19.37±1.21 c | 10.677±1.34 cd | 1.17±0.49 d | 9.23±0.51 bc | |
| Range | 4.20~5.37 | 18.13~21.56 | 9.37~13.02 | 0.76~1.92 | 8.50~10.24 | ||
| CV/% | 11.64% | 5.26% | 9.66% | 24.31% | 4.68% | ||
| Evolution Canyon | Mean | 4.24±0.20 b | 19.12±1.23 c | 9.89±0.85 d | 1.23±0.30 cd | 8.78±0.51 c | |
| Range | 3.92~4.57 | 17.63~21.05 | 8.83~11.10 | 0.99~1.66 | 8.14~9.58 | ||
| CV/% | 4.44% | 6.05% | 8.07% | 23.15% | 5.43% | ||
| Beit-Oren | Mean | 2.93±0.72 c | 23.05±1.28 b | 14.36±0.67 b | 1.95±0.32 b | 11.73±0.38 b | |
| Range | 2.29~4.21 | 21.07~24.94 | 13.45~15.40 | 1.54~2.35 | 11.07~12.33 | ||
| CV/% | 23.32% | 5.24% | 4.39% | 15.50% | 3.06% | ||
| Hu | Mean | 4.02±2.07 b | 18.64±4.53 d | 26.93±2.09 a | 2.34±0.10 a | 74.84±7.03 a | |
| Range | 2.09~6.66 | 14.53~22.99 | 24.48~30.66 | 2.20~2.49 | 67.28~86.81 | ||
| CV/% | 51.449% | 24.30% | 7.33% | 3.99% | 8.86% | ||
| 2020.10- | Tabigha | Mean | 4.12±0.12 a | 22.02±1.32 a | 13.44±0.52 b | 1.97±0.44 b | 10.67±0.36 b |
| 2021.03 | Range | 4.01~4.28 | 20.20~24.59 | 12.37~14.13 | 1.43~2.53 | 10.27~11.39 | |
| CV/% | 2.67% | 5.66% | 3.62% | 20.81% | 3.22% | ||
| Nahef | Mean | 3.76±0.18 bc | 19.93±0.78 cd | 11.33±0.71 cd | 1.64±0.08 c | 9.98±0.56 bc | |
| Range | 3.50~3.95 | 18.96~21.72 | 10.31~12.36 | 1.51~1.80 | 9.23~10.92 | ||
| CV/% | 4.75% | 3.93% | 6.23% | 5.04% | 5.57% | ||
| Sede Boqer | Mean | 3.56±0.08 cd | 18.73±2.24 d | 10.78±1.92 d | 1.51±0.30 c | 8.99±1.55 c | |
| Range | 3.45~3.65 | 15.78~22.09 | 8.08~12.85 | 1.10~1.78 | 6.82~10.65 | ||
| CV/% | 2.12% | 11.27% | 16.83% | 18.45% | 16.23% | ||
| Evolution Canyon | Mean | 3.78±0.12 b | 20.73±1.42 bc | 12.28±0.85c | 1.61±0.16 c | 10.44±0.30 b | |
| Range | 3.64~3.94 | 19.31~23.07 | 11.13~13.38 | 1.39~1.880 | 9.67~11.33 | ||
| CV/% | 3.05% | 6.47% | 6.54% | 9.39% | 4.76% | ||
| Beit-Oren | Mean | 3.19±0.13 e | 20.25±1.13 c | 11.63±0.75 cd | 1.43±0.28 c | 9.90±0.76 bc | |
| Range | 3.05~3.40 | 18.43~21.69 | 10.69~12.77 | 1.07~1.82 | 8.89~11.00 | ||
| CV/% | 4.14% | 5.57% | 6.45% | 19.30% | 7.66% | ||
| Hu | Mean | 3.51±0.44 d | 18.49±2.01 d | 27.39±1.29 a | 3.97±0.33 a | 68.70±2.44 a | |
| Range | 3.13~4.09 | 16.92~20.36 | 25.21~29.32 | 3.59~4.50 | 65.28~72.91 | ||
| CV/% | 11.78% | 10.87% | 4.45% | 7.92% | 3.35% |
Table 5.
Significant Spearman's rank correlation between nutritional content and ecogeographic factors in oat populations.
Table 5.
Significant Spearman's rank correlation between nutritional content and ecogeographic factors in oat populations.
| Nutrient content | Geographical environmental factors |
Relevance | Prob>|ρ| |
| CP | Hu14 | 0.4965 | 0.0001 |
| Huan | 0.3983 | 0.0029 | |
| Ln | -0.5003 | 0.0001 | |
| Td | -0.4465 | 0.0007 | |
| Tdd | -0.3726 | 0.0055 | |
| Tj | 0.2741 | 0.0449 | |
| Tm | 0.2832 | 0.0380 | |
| Ash | Ev | -0.3417 | 0.0115 |
| Huan | 0.3166 | 0.0197 | |
| Ln | -0.5034 | 0.0001 | |
| Td | -0.3449 | 0.0106 | |
| Tdd | -0.3438 | 0.0109 | |
| WSC | Al | -0.4227 | 0.0015 |
| Hu14 | 0.2700 | 0.0483 | |
| Ln | -0.2787 | 0.0413 | |
| Lt | -0.3558 | 0.0083 | |
| Ta | 0.4893 | 0.0002 | |
| Tm | 0.4916 | 0.0002 |
Table 6.
Significant Spearman's rank correlation between feed value and ecogeographic factors in oat populations.
Table 6.
Significant Spearman's rank correlation between feed value and ecogeographic factors in oat populations.
| Feed indexes | Geographical environmental factors |
Relevance | Prob>|ρ| |
| Lignin | Ln | 0.2985 | 0.0283 |
| Lt | 0.3172 | 0.0194 | |
| Al | 0.2996 | 0.0278 | |
| Tm | -0.4948 | 0.0001 | |
| Tj | -0.3205 | 0.0182 | |
| Td | 0.285 | 0.0367 | |
| Rn | -0.382 | 0.0044 | |
| Cellulose | Ln | 0.3705 | 0.0058 |
| Lt | 0.3946 | 0.0032 | |
| Tm | -0.4783 | 0.0003 | |
| Tj | -0.3246 | 0.0166 | |
| Td | 0.4129 | 0.0019 | |
| Tdd | 0.4979 | 0.0001 | |
| Ev | -0.3778 | 0.0049 | |
| Rn | -0.3308 | 0.0146 | |
| Ta | -0.4544 | 0.0006 | |
| Rd | -0.2698 | 0.0485 | |
| Hu14 | -0.4159 | 0.0018 | |
| Huan | -0.4675 | 0.0004 | |
| OM | Lt | -0.4783 | 0.0003 |
| Tm | 0.3573 | 0.008 | |
| Ta | 0.3223 | 0.0175 | |
| Td | -0.4406 | 0.0009 | |
| Ev | 0.4488 | 0.0007 | |
| Huan | 0.3966 | 0.003 | |
| DFR | Tm | 0.4333 | 0.0011 |
| Ta | 0.3994 | 0.0028 | |
| Tj | 0.2871 | 0.0353 | |
| Td | 0.3672 | 0.0063 | |
| Rd | 0.4566 | 0.0005 | |
| Huan | -0.402 | 0.0026 | |
| ADF | Lt | 0.501 | 0.0001 |
| Al | 0.3863 | 0.0039 | |
| Rn | -0.3991 | 0.0028 | |
| Rd | -0.2724 | 0.0463 | |
| NDF | Rn | 0.2807 | 0.0398 |
| Rd | 0.4234 | 0.0014 |
Disclaimer/Publisher’s Note: The statements, opinions and data contained in all publications are solely those of the individual author(s) and contributor(s) and not of MDPI and/or the editor(s). MDPI and/or the editor(s) disclaim responsibility for any injury to people or property resulting from any ideas, methods, instructions or products referred to in the content. |
© 2023 by the authors. Licensee MDPI, Basel, Switzerland. This article is an open access article distributed under the terms and conditions of the Creative Commons Attribution (CC BY) license (http://creativecommons.org/licenses/by/4.0/).
Copyright: This open access article is published under a Creative Commons CC BY 4.0 license, which permit the free download, distribution, and reuse, provided that the author and preprint are cited in any reuse.


