Submitted:
12 September 2023
Posted:
13 September 2023
You are already at the latest version
Abstract
In the last years, various changes and enhancements have been made to the technical structure of the substituted boreholes in comparison to the old boreholes. Increasing production capabilities from an individual borehole and/or a borehole field has engineering significant and economic value. Unfortunately, we are unable to change the composition of the aquifer lithology and its hydraulic properties and therefore, increasing the extraction capabilities from an individual borehole is possible by using technical improvements in drilling methods, in borehole design and in its final structure. This is illustrated through examples from two different aquifer basins, where substituted boreholes were drilled adjusted to the old borehole and in the same yard. The substituted boreholes were drilled to similar depth and to the same lithology as those in the old boreholes. That is, any discrepancies in hydraulic parameters attributable to changes and improvements in the borehole design and structure.
Keywords:
Borehole design
; drilling methods enhancements
; pumping tests
; drilling enhancements ranking
1. Introduction
Water supply for both drinking and agricultural purposes globally relies heavily on extracting water from aquifers via boreholes. In some regions, boreholes serve as the sole source, while in others, they complement other sources such as reservoirs, surface water, desalinated water, and wastewater reuse.
Enhancing the production capacity of individual boreholes or borehole fields holds both engineering and economic significance. While we are unable to change the composition of the aquifer lithology and its hydraulic properties and therefore, we can boost extraction capabilities from an individual borehole by adopting technical enhancements in drilling methods, in borehole design and in its final structure.
Throughout the years, boreholes have gone out of operation due to various technical issues such as fine sand entrance and gravel as a result of presence of holes in the casing and screen. Additionally, hydrological and hydrochemical factors like declining water levels and mineral incrustation have played a role in their discharge reduction. To sustain the production capabilities, substituted boreholes are drilled in proximity to the old boreholes.
In recent time in Israel, several technical modifications have been introduced in the substituted boreholes, leading to enhanced specific yield compared to the old borehole.
2. Technical modifications
The technical enhancements are divided into several areas:
Drilling diameter: The drilling diameter of the aquifer section in the substituted borehole has been expanded from 14-18" to 22-24".
Screen diameter: The screen diameter in the substituted borehole is between 14-16", whereas in the old boreholes, the screen diameter was between 12¾” and 8 5/8”.
Utilizing a larger casing and screen diameter offers several advantages, including enhanced flexibility during pump depth installation and a wider array of options for potential future rehabilitation. For instance, this could involve the installation of a new inner lining within the borehole.
Screen material type: In the past two decades, stainless-steel 316L type, have been utilized in all new boreholes. Previously, certain older boreholes were equipped with steel slotted bridge screens, while others featured with stainless-steel 304L type. As per discussions with the Head of Corrosion and Materials Engineering Department at Mekorot - Israeli National Water Company, both 304L and 316L stainless-steel alloys are robust materials with excellent mechanical properties. However, the 316L stainless-steel grade offers superior corrosion resistance in water with chloride content exceeding 100 ppm (mainly Crevice Corrosin). Given that the chloride content in many Israel’s unconsolidated aquifers surpasses 100 ppm chloride, the decision was made to exclusively employ 316L stainless-steel casing and screens.
Screen length: In some substituted boreholes the overall length of the screen has been increased. In a separate pilot in unconsolidated formations, involving two separated boreholes in the same yard and within the same lithology [3]. One borehole for pumping and another for injection of surplus water. Notably, the total screen length in the injection borehole was nearly double (Figure 1). The outcomes from step drawdown tests clearly indicate that the dynamic drawdown in the injection borehole was smaller compared to the pumping borehole. In both boreholes there is a continuity in the line trend of the well loss coefficient (C), indicating similarity in the drawdown caused by the well loss coefficient. However, the dynamic drawdown caused by the aquifer loss coefficient (B) in the injection borehole is significantly smaller than that in the pumping borehole. The larger screen length in the injection borehole elucidated the improvement observed in the aquifer coefficient (B) in the injection borehole compared to the pumping borehole (Figure 2).
Open area (%): The percentage of the open screen area is another important parameter because it influences on the water flow efficiency and the borehole performance in conjunction with other factors. In some examples in this article, we will see that some substituted boreholes have a smaller percentage of screen open area compared to the old boreholes yet exhibit enhanced hydraulic performance.
Muni-Pak: Pre-packed Muni-Pak screen is known and is used in various countries. In Israel, the utilization of the Muni-Pak screen commenced a few years ago. The standard configuration of the pre-packed Muni-Pak, as outlined in the Johnson Screen specifications [13], features a 2” space between the inner and outer screen tubes. In our assessment, we believe that this 2” gap is insufficient for effectively preventing the entrance of fine sand, especially in dual-purposed boreholes. Consequently, we have designed a new Muni-Pak configuration [14], and in this updated design, we have a larger space between the inner and outer tubes. This particular configuration of Muni-Pak screen pipes, in sizes of 20”x16” or 18”x14” are relatively uncommon choice in the field of groundwater exploration drilling. The gap between the inner and outer tubes is filled with glass beads.
The cases of using Muni-Pak screen in Israel are where the top of unconsolidated aquifer's is relative deep and the formation comprises layers of fine sand, along with instances where a step exists inside the borehole due to a variation in drilling diameter. In such scenarios, the process of introducing a gravel pack into the lower sections of the aquifer becomes intricate and challenging. Also, in new dual-purposed borehole (injection and pumping) in the Coastal Aquifer. Through our experimentation, we found that integrating the new Muni-Pak screen configuration into the dual purposed borehole along with glass beads gravel pack, totally removed the sand entrance problem (a well-known problem in dual purposed boreholes). As a result, the pumped water was without sand. Muni-Pak screen is also a viable solution for boreholes experiencing artesian flow, where the feasibility of introducing a gravel pack becomes unattainable.
Gravel pack: Traditionally, due to its abundance, low cost, and proven effectiveness, sorted quartz gravel was for years the only material used to as a gravel packed to fill the space between the borehole wall and the screens. Since 2016, “Mekorot” Israel National Water Company (and afterward also few private drilling companies) transitioned to utilizing glass beads as gravel pack in the screen section. Recent research proposes have suggested that using glass beads instead of quartz sorted gravel could yield several benefits. Glass beads are spherical, and uniform in size, with a smooth surface and excellent roundness that allows for high porosity and permeability. They are made from recycled glass, which makes them a more sustainable and environmentally friendly option. The smooth surface of glass beads also diminishes frictional resistance to water flow, resulting in heightened hydraulic conductivity compared to traditional gravel pack materials. The price differential is further mitigated due to the shorter time required for filling the borehole with glass beads and reduced time needed for development (surging, jetting, and/or pumping). Consequently, in the overall summary, employing glass beads emerges as a cost-effective alternative to using traditional sorted quartz gravel.
Numerous studies [8] have demonstrated the substantial enhancement of borehole hydraulic properties through the utilization of glass beads as a gravel pack material.
In Israel, due to the high cost of glass beads compared to traditional quartz sorted gravel, it has become customary in the new boreholes to fill again the space above the uppermost screen section with quartz sorted gravel.
It is crucial to emphasize that, in our understanding, a gravel pack is essential and necessary in unconsolidated aquifers to prevent the entrance of sand into the borehole and ensure sand-free water. Therefore, even in wells equipped with Muni-Pak pipes, the decision was made to additionally install a gravel pack around the screen.
3. Pumping tests analyses
The principal objective of the pumping test is to obtain adequate information to determine the safe yield (discharge) of a borehole and the optimal depth for setting the pump. Proper pump sizing and depth selection can provide considerable savings to a water system over the lifetime of the borehole, through reduced power consumption and maintenance expenses.
The combination of the step drawdown and recovery test provides a range of specific capacities of the borehole [1]. The data obtained from the step drawdown test and recovery test [4] encompass various parameters: Pumping Rate (Q), Aquifer loss coefficient (B), Well loss coefficient (C), Well Efficiency (v), Transmissivity (T), Specific Capacity / yield (SC). The aquifer’s hydraulic parameters play a vital role in the water discharge during the pumping procedure, as well as on the cone of influence of the pumping wells [9]. A strong correlation exists between the permeability and the expected water pumping rate for each individual borehole.
The total drawdown in a pumping borehole can be divided into two components, which are functions of the discharge rate Q. The first component, called “Aquifer loss coefficient (B),” and the second component is the “Well loss coefficient (C).” The term “aquifer loss coefficient” represents the head losses caused by laminar flow in the aquifer and is proportional to the discharge (i.e., BQ: aquifer loss). The term “well loss coefficient” is non-linear and represents turbulent flow in the vicinity of the well and in the well itself. Notably, the well loss coefficient can become a significant fraction of total drawdown when pumping rates are substantial. Jacob (1950) [4] proposed a model where the well loss is directly proportional to the square of the discharge rate (expressed as CQ2).
The efficiency of pumping borehole expresses the relationship between the theoretical drawdown attributed to aquifer loss and the total measured drawdown in the borehole. The well efficiency denotes as V, is defined as follow:
In general, a well efficiency of 70% or more is usually considered acceptable. The relative weight of the two coefficients on the total dynamic drawdown provides further insight into the well efficiency as will be elucidated in the forthcoming chapter.
4. Results
In this chapter we will present results from two distinct aquifer basins (Figure 3), where substituted boreholes were drilled adjust to the old borehole and within the same yard. The substituted boreholes were drilled to similar depth and to the same lithology as those in the old boreholes. That is, it can be said with great confidence that the lithological composition is the same in both boreholes (old and substituted) and the differences in hydraulic parameters are attributed to alterations and enhancements introduced in the borehole design and structure.
4.1. Coastal Aquifer
The coastal aquifer of Israel has a shape of a sedimentary prism, which is about 100 km long and 15 to 30 km wide. Its thickness diminishes gradually from about 190-220 at the coastline in the west to 0 at its eastern boundary. The aquifer comprises Quaternary alternating units of sand, calcareous sandstones, loams and clays, usually overlying a thick Pliocene shaley aquiclude [7]. The entire system is subdivided into four sub-aquifers near the coastline, and up to about 3-4 km inland. The subdivision is due to the presence of marine shale intercalations, which merge westward below the coastal shelf and implying that at least the lower sub-aquifers are probable confined. Most of the pumping is from the second sub-aquifer (sub-aquifer B) that in some places is unconfined and in others confined.
The three pair of boreholes that will present herein (Figure 3) are part of the reclamation pumping regime of the Dan Region Reclamation Plant (Shafdan). They are pumping reclaim water from sub-aquifer B, after secondary treatment effluents have been injected into the coastal aquifer via a Soil Aquifer Treatment (SAT) system with a retention time that has been estimated at 2-18 months. The reclaimed water [6] is then pumped through a series of boreholes and transported southward to the northern part of the Negev desert, where it is used for unrestricted agricultural irrigation.
The hydraulic conductivity (permeability) of the aquifer, calculated from many boreholes located at the same region of the three “sample” boreholes is between 20-40 meters per day.
4.1.1. Boreholes description
- a. YN-203 & YN-203a
The old borehole denotes as YN-203 was drilled in the year 1986 and the substituted borehole referred to as YN-203a was drilled in 2020. The lithology and the borehole structures are presented in Figure 4. The old borehole was fitted with Johnson steel slotted screen featuring a slot width of 1.0 mm. In contrast, the substituted borehole is outfitted with a stainless-steel screen 316L type characterized by a narrower slot width of 0.5 mm.
The outcomes of the pumping tests afford a discernible insight into the proportional significance of each coefficient contributing to the overall drawdown in the old YN-203 borehole as juxtaposed with the substituted YN-203a borehole, as shown in Figure 5.
Through the combination between the boreholes structure and the step drawdown tests results, the following observations can be gathered:
- Screen length: The screen lengths in both boreholes are the same- 21 meters.
- Screen diameter: The screen diameter in YN-203a is 16”, whereas in YN-203 it is 12¾” (Figure 4).
- Screen open area (%): in YN-203 it is 21%, whereas in YN-203a it is only ~12%.
- Gravel Pack: Sorted quartz gravel in YN-203, whereas glass beads in YN-203a.
- Step drawdown test results: Enhancement in the aquifer loss coefficient (B) and in the well loss coefficient (C) in YN-203a compared to the YN-203 (Table 1).
The lithological composition and the screen length are identical in both boreholes. However, in the substituted borehole the percentage of the screen open area is approximately half of the old borehole. Notwithstanding, the specific yield in the substituted borehole is higher (smaller dynamic drawdown). This observed enhancement prompts us to assume that the improvement in this case is primary attributed to two factors: firstly, the use of larger screen diameter and secondly, the use of glass beads as a gravel pack instead of regular sorted quartz gravel.
- b. YN-219 & YN-219a
The old borehole denotes as YN-219 was drilled in the year 1986 and the substituted borehole referred to as YN-219a was drilled in 2020. The lithology and the borehole structures are presenting in Figure 6. The old borehole was fitted with a steel slotted bridge screen featuring a slot width of 1.2 mm. In contrast, the substituted borehole is outfitted with a stainless-steel screen 316L type characterized by a narrower slot width of 0.5 mm.
The results derived from the pumping tests afford a discernible insight into the proportional significance of each coefficient contributing to the overall drawdown in the old YN-219 borehole and its substituted YN-219a counterpart, as shown in Figure 7.
Through the combination between the two boreholes structure and the step drawdown tests results, the following insights can be learnt:
- Screen length: The screen length in both boreholes is similar- 27 & 28 meters.
- The screen diameter: The screen diameter in YN-219a is 16” and in YN-219 is 10¾” (Figure 6).
- Screen open area (%): The screen open area in YN-219 is ~16%, whereas in YN-219a is only 12%.
- Gravel Pack: In YN-219 the gravel pack is built from sorted quartz, whereas in YN-219a the gravel pack in the aquifer section is built from glass beads.
- Step drawdown test results: Improvement in the aquifer loss coefficient (B) and in the well loss coefficient (C) in YN-219a compared to the YN-219 (Table 2).
In both boreholes, the lithology and the length of the screen is the same. However, in the substituted borehole the percentage of the screen open area is smaller than the old borehole. Despite this discrepancy, the specific yield in the substituted borehole is higher (smaller dynamic drawdown). We assume that the enhancement in this case is primarily attributed to the use of larger screen diameter in conjunction with the use of glass beads as a gravel pack instead of regular sorted quartz gravel.
- c. YN-210 & YN-210a
The old borehole denotes as YN-210 was drilled in the year 1986 and the substituted borehole referred to as YN-210a was drilled in 2020. The lithology and the borehole structures are presented in Figure 8. The old borehole was fitted with a steel slotted screen featuring a slot width of 1.0 mm. In contrast, the substituted borehole is outfitted with a stainless-steel screen 316L type characterized by a narrower slot width of 0.5 mm.
The outcomes of the pumping tests afford a discernible insight into the proportional significance of each coefficient contributing to the overall drawdown in the old YN-210 borehole as juxtaposed with the substituted YN-210a borehole, as shown in Figure 9.
- A comprehensive comprehension between the two boreholes structure and the step drawdown tests results, the following observations can be gathered:
- Screen length: In YN-210 the screen length is about 33 meters distributed across three sections. In contrast, YN-210a has a screen of approximately 24 meters segregated into two sections. A reduction of 28% on the screen length.
- Screen diameter: The screen diameter in YN-210a is 16”, while in YN-210 it was 10¾” (Figure 8).
- Screen open area (%): The screen open area in YN-210 is 21%, whereas in YN-210a is only 12%.
- Gravel Pack: Sorted quartz gravel in YN-210, whereas glass beads in YN-210a.
- Step drawdown test results: The enhanced performance of the well loss coefficient (C) in borehole YN-210a, as opposed to the older borehole YN-210, can be attributed to the utilization of glass beads as a gravel pack in conjunction with enlargement in the screen diameter. In contrast, the calculated dynamic drawdown attributable to the aquifer loss coefficient (B) is higher in borehole YN-210a compared to the older borehole due to the shorter total screen length in the substituted borehole, as illustrated in Figure 8 and in Table 3.
This case study serves as an excellent demonstration of the substantial impact of screen length (i.e., the length of the open aquifer section) expressed by the aquifer coefficient (B) on dynamic drawdown, as depicted also in Figure 2. Conversely, it also highlights the effectiveness of employing glass beads and enlarging the screen diameter in reducing the drawdown attributed to the well coefficient (C).
4.2. Arava Valley
The Arava Valley is located in the southern part of Israel. The valley stretches for 170 kilometers from the Dead Sea in the north to the Red Sea in the south (City of Eilat). It is an arid zone with an average annual rainfall between 30 to 50 mm/year and yearly evaporation between 2500-3500 mm/year. The water supply is coming from two regional aquifers that their replenishment appeared few thousand years ago ("fossil water") when the climate at the recharge area was a moderate climate [10].
Additionally, a third regional aquifer is the Alluvial Aquifer located within the valley itself and is composed of thick sediment section of sand, gravel with interbedded clay layers. The total thickness is a few thousand meters, but the operational aquifer is solely in the upper section only (200±50 meters depth). Below this depth the water is saline.
The examples that will be presented below are boreholes that utilize groundwater from the Alluvial aquifer (Figure 3).
The water source of the Alluvial Aquifer is mainly comes from leakage of seasonal flush floods from the mountains in both sides of the valley [11]. Today, irrigation return flow producing in the cultivation areas that are located on the Alluvial Aquifer, are the new additional water source and salinization too [12].
The calculated hydraulic conductivity (permeability) from many boreholes located at the Arava Valley and pumped from the Alluvial Aquifer is between 3-10 meter/day.
4.2.1. Boreholes description
- a. ID-7 and ID-7a
The old borehole, herein designated as ID-7 was drilled in the year 2001and the substituted borehole, herein referred to as ID-7a in 2018. The lithology and the borehole structures are presented in Figure 10. The old borehole was fitted with 304L stainless-steel screen featuring a slot width of 1.0 mm. In contrast, the substituted borehole is outfitted with a stainless-steel screen 316L type characterized a similar slot width of 1.0 mm. Borehole ID-7 was drilled to a depth of 185 meters, while the substituted borehole ID-7a was drilled to a depth of 163 meters.
The outcomes of the pumping tests provide a discernible insight into the proportional significance of each coefficient contributing to the overall drawdown in the old ID-7 borehole as juxtaposed with the substituted ID-7a borehole, as shown in Figure 11.
A comprehensive comprehension between the two boreholes structure and the step drawdown tests results, the following observations can be learned:
- Screen length: In borehole ID-7 the screen length is about 37 meters distributed in three sections and in borehole ID-7a the screen length is 41 meters also distributed in three sections. It is noteworthy, that the placement of the screens sections varies between the two boreholes. In the substituted borehole, the decision was to open an upper aquifer horizon that wasn’t utilized in the old borehole. Simultaneously, to give up the lower aquifer horizon which was believed to be the origin of the relatively high salinity observed in the old borehole.
- Screen diameter: The screen diameter in ID-7a is 16”, in contrast to its old borehole, ID-7, wherein the screen diameter is 8 5/8” (Figure 10).
- Screen open area (%): Both boreholes exhibit similar open area percentage of 21%
- Gravel Pack: The gravel pack in ID-7 borehole was sorted quartz, whereas in ID-7 the gravel pack is glass beads.
- Step drawdown test results: Enhancement in Aquifer Loss coefficient (B) and Well Loss coefficient (C) in the substituted borehole ID-7a compared to the old borehole ID-7 (Table 4).
In both boreholes, the lithology is similar and the difference in the total screen length is minor. But their placements in the aquifer section are different as presented in Figure 10. The screen diameter in the substituted borehole (ID-7a) is 16” which is larger than the old borehole’s 8 5/8”, as delineated in Figure 10. Both have comparable screen open areas (similar slot width).
The gravel pack used in the old borehole was sorted quartz and in the substituted borehole the gravel pack against the screen section is glass beads.
Interestingly, the specific yield in the substituted borehole is higher (smaller dynamic drawdown). The improvement in the specific yield in ID-7a compared to ID-7 is attributed to the changes in the screen placements together with the use larger screen diameter and the use of glass beads as an alternative gravel pack.
The enhancement in the well coefficient (C), as depicted in Figure 11 and detailed in Table 4, is not associated with alterations in screen placement. Instead, it is an outcome of improvements in the technical structure, which, as previously mentioned, encompass the utilization of glass beads in conjunction with an increase in screen diameter.
- b. HZ-12 and HZ-12a
The old borehole, designated as HZ-12 was drilled in the year 1997, while the substituted borehole, labeled HZ-12a was drilled in 2018. The lithology and the borehole structures are presented in Figure 12. The old borehole was drilled in Percussion method, and the substituted borehole was drilled in direct rotary method. The old borehole has been equipped with a 304L stainless-steel screen featuring a 1.0 mm slot width. It is enveloped within a basket filled with gravel ranging from 2.5 to 4 mm in size. This basket is a basic Pre-Packed type that was used in some boreholes during the 1970s and 1980s, to prevent the entry of fine sand. In contrast, the substituted borehole is outfitted with a stainless-steel screen 316L type characterized by a narrower slot width of 0.5 mm.
The outcomes derived from the step drawdown pumping tests results offer a clear insight of the proportional significance attributed to each coefficient from the overall drawdown in the old borehole compared to the substituted borehole, as visually seen in Figure 13.
We can learn from the combination between the two boreholes structure and the step pumping tests the following points:
- Screen length: In HZ-12 the total length of the screen is about 27 meters, distributed in four segments and in the substituted borehole HZ-12a the total length is 39 meters, distributed in six segments. In the substituted borehole there are two additional screen segments in upper aquifer horizons at a depth between 93 meters to 106 meters. This horizon wasn’t employed in the old borehole.
- Screen diameter: The screen diameter in HZ-12a is 16” and in ID-7 the diameter is 10¾” (Figure 12).
- Screen open area (%): The screen open area in HZ-12 is 21%, whereas in HZ-12a is only 12%.
- Gravel Pack: The gravel pack material in HZ-12 was sorted quartz (in the baskets and outside), whereas in HZ-12a the gravel page is glass beads.
- Step drawdown test results: Enhancement in Aquifer Loss coefficient (B) and Well Loss coefficient (C) in the substituted borehole HZ-12a compared to the old borehole HZ-12 (Table 5).
In both boreholes, the lithology is similar. The screen diameter in the substitute borehole (HZ-12a) is 16” and is larger than in the old borehole that is 10¾. In the substituted borehole the percentage of the screen open area is only 12%, almost half of the percentage in the old borehole (21%). The difference is also in the total screen length and in their placement across the aquifer section. Like in the previous examples, the gravel pack used in the old borehole was sorted quartz and in the substituted borehole the gravel pack against the screen section is glass beads.
The technical differentiations manifest in the pumping test results. The specific yield in the substituted borehole is higher (smaller dynamic drawdown) than in the old borehole.
We assume that the enhancement in the specific yield in HZ-12a compared to HZ-12 is primary attributed to the alterations in the total screen length together with the additional screen combined with the placement in upper aquifer horizon. The utilization of glass beads as an alternative to conventional gravel pack along with the enlargement of the diameter of the screen also contributes to the improvements of the hydraulic parameters. The influence of the decreased screen open area percentage in the substituted borehole on the improvement of the hydraulic parameters appears to be lesser significance than the impact of the other aforementioned factors.
- c. SM-113 and SM-113a
The old borehole, designated as SM-113 was drilled in 2006, while the substituted borehole denoted as SM-113a was drilled in 2020. The lithology and the borehole structures are presented in Figure 14. The two boreholes were drilled in a direct rotary method.
The old borehole lacked a gravel pack. To prevent any entry of fine sand into the borehole, a screen with a small slot width of 0.375 mm was installed. However, the concept of creating a “natural” gravel pack by using screen with a smaller slot width proved, in this case, to be unsuccessful. For years, the borehole suffered from fine sand issues which eventually led to the necessity of drilling a substituted borehole.
This example illustrates the significance of a gravel pack in preventing sand from entering the borehole and ensuring that the pumped water remains free of sand.
The outcomes from the pumping tests provide valuable insights into the comparative significance of each coefficient contributing to the total drawdown observed in the old borehole opposed to the substituted borehole (Figure 15).
By combining between boreholes structure and the pumping tests results, several key observations can be derived:
- Screen length: In SM-113 the total length is about 49 meters distributed in two segments and in SM-113a the total length is 68 meters distributed in four segments. In the substituted borehole there is an additional screen segment in upper aquifer horizons at a depth between 101 meters to 125 meters. This horizon wasn’t employed in the old borehole.
- Screen diameter: The screen diameter in SM-113a (Figure 14) is Muni-Pak screen 316-L type 16” x 20” (20” outer diameter and 16” inner diameter). The space is replete with glass beads. In contrast, SM-113 employs a screen diameter of 8 5/8”.
- Screen open area (%): In SM-113 the percentage of the open area is 10% only. The absence of gravel pack and the presence of fine sand along the aquifer section, force us to use screen with smaller slot width of 0.375 mm. The use of Muni-Pak screen type in the substituted borehole made it possible to increase the slot width to 0.8 mm and to obtain a larger open area of about 18%
- Gravel Pack: In SM-113 gravel pack wasn’t installed. The creating of “natural” gravel pack didn’t prevent the entrance of fine sand. While, in the substituted borehole SM-113a, gravel pack consisting of glass beads was incorporated supplementing to the glass beads lining between the inner and outer Muni-Pak screen pipe. The use of gravel pack in the substituted borehole solved the fine sand problem and the pumped water does not contain sand.
- Step drawdown test results: Enhancement in Aquifer Loss coefficient (B) and Well Loss coefficient (C) in the substituted borehole SM-113a compared to the old borehole SM-113 (Table 6).
Both boreholes have similar lithology. However, the contemporary structure design employed in the establishment of the substituted borehole (SM-113a) has led to noteworthy enhancements in hydraulic characteristics when contrasted with the older borehole (SM-113). These advancements include the utilization of a large diameter Muni-Pak screen type, an extended screen length, the incorporation of glass beadss as a gravel pack, and the introduction of an upper supplementary aquifer horizon.
The technological refinements are manifestly evident in the results of the pumping test (depicted in Figure 15). Particularly, the specific yield within the substituted borehole exceeds that of the old borehole, leading to a smaller dynamic drawdown phenomenon.
In this case specifically, it is difficult to determine which parameter among the parameters introduced in the substituted borehole is the significant and dominant factor in the improvement in the hydraulic parameters as obtained in the pumping test.
As in the previous examples, we estimate that the enhancement in the well coefficient (C) is linked to the improvements introduced in the technical structure of the substituted borehole. These improvements include a larger screen diameter, the installation of a Muni-Pak screen with a wider slot width, an increase in open area from 10% to 18%, and the introduction of glass beads as a gravel pack. The improvement in the aquifer coefficient (B) is primarily associated with the increase in the total length of the screens and their placement within the aquifer.
5. Discussion and conclusion
Borehole design and its hydraulic properties are crucial factors that determine the efficiency and effectiveness of groundwater extraction through boreholes. The ability to exert influence over the lithological attributes remains limited. Therefore, technical enhancement in the borehole structure emerges as a significant impact on the pumping test results. Particularly on the estimation of the Aquifer Loss (B) and Well Loss (C) coefficients. Such enhancements conduce to better well efficiency, higher specific yield, and lower dynamic drawdown.
All examples presented herein, are boreholes (old and substituted) that were drilled in the same yard and therefore, it can be said with unequivocally ascertainable that the lithological profile of the aquifer section is the same in both boreholes (old and substituted). The enhancements in the hydraulic properties (higher specific yield and lower dynamic drawdown) are predominantly results of technical refinements in the substituted borehole structure.
The technical modifications in the substituted borehole structure are:
Drilling diameter: Enlarging the drilling diameter to a range of 22-24” to allow installing larger casing and screen line (16” in most cases) and pouring glass beads.
Screen diameter: The diameter of the casing and the screen in the substituted borehole is mostly 16". This configuration offers several advantages, including enhanced flexibility during pump depth installation and a wider array of options for potential future rehabilitation.
Screen material type: Moving to 316L stainless-steel grade offers superior corrosion resistance in water with chloride content exceeding 100 ppm (Crevice Corrosion). Given that the chloride content in many Israel’s unconsolidated aquifers surpasses 100 ppm chloride, the decision was made to exclusively employ 316L stainless-steel casing and screens.
Screen length: Elongation of the screen section is a pivotal factor that contributes to the improvement of the hydraulic properties of the substituted borehole. Insights gleaned from step drawdown tests undertaken within the framework of a case study involving both pumping and injection boreholes located at the same geological context, reveal a pronounced discrepancy in dynamic drawdown magnitude attributed to the aquifer loss coefficient (B) between the injection and pumping boreholes. The larger length of the screen section in the injection borehole (nearly double) constitutes the crucial factor underpinning the enhancements observed in the aquifer coefficient (B) in the injection borehole compared to the pumping borehole (Figure 2).
Open area (%): It is widely acknowledged that a large percentage of the open screen area has discernible influence over water flow efficiency and borehole performance.
Among the examples elucidated earlier, some substituted boreholes have a greater open screen area percentage than their old counterparts, while other examples show opposite pattern with small percentage of the open screen area in substituted borehole. The enhancements of the hydraulic parameters in borehole characterized by great open screen percentage area are inherently comprehensible and lucid. However, achievement an enhancement in the hydraulic parameters in substituted borehole where the open screen area percentage is smaller than in the old borehole underscores that this single factor, the open screen area percentage, does not singularly suffice to explicate the enhancements in the hydraulic parameters.
Gravel pack: The major insight from the examples described above is that using glass beads as a gravel pack emerged as a principal contributor driving improvements in the hydraulic parameters of the substituted boreholes. Glass beads are spherical, and uniform in size, with a smooth surface texture that allows for high porosity and permeability. Due to its physical properties, pouring glass beads as gravel pack is faster and more efficient than pouring sorted quartz gravel. Gravel pack is essential to prevent sand from entering the borehole and ensuring that the pumped water remains free of sand.
Aquifer conductivity (permeability): Along with the technical constituents underpinning the enhancement of the hydraulic parameters, we found that the aquifer conductivity (permeability) is also an important element that effect on the intensity of the improvement observed in the hydraulic parameters in the substituted boreholes compared to their parameters in the old boreholes.
In three examples (YN-203a, Yn-219a, YN-210a) located in the central coastal aquifer of Israel, composed of sand, calcareous sandstones, loams and clays, the calculated hydraulic conductivity (permeability) in their region ranges between 20-40 meter/day. In this aquifer, high hourly discharge and high specific yield were observed also in old boreholes that were constructed based on drilling technologies that were commonly used in the seventies and eighties of the 20th century. The technical enhancements resulting in an improvement in the specific yield and in reduction of the dynamic drawdown in the substituted borehole is small. The hourly discharge remains relatively invariant in the face of these improvements.
In the other three examples (ID-7a, HZ-12a, SM-113a) that are exploiting groundwater from the Alluvial Aquifer located within the Arava Valley, composed of sand, gravel and interbedded of clay layers, the calculated hydraulic conductivity (permeability) from many boreholes pumped from this aquifer is within the range of 3 to10 meter/day. In those cases, implementation of technical enhancements has yielded a significant improvement in the hourly discharge and in the specific yield (higher hourly discharge with a smaller dynamic drawdown).
Finally, while a distinct comparative analysis was not systematically undertaken across all technical constituents expounded within the article, our comprehensive professional experience, implied us to endeavor a qualitative ranking of the technical components based on their significance and subsequent influence on the enhancement of hydraulic parameters and pumping efficiency.
The prioritization of significance is delineated as follow:
- Screen length: longer screen section is a pivotal factor that contributes to the improvement of the hydraulic properties of the substituted borehole.
- Gravel pack type: using glass beads as a gravel pack emerges as a principal contributor driving improvements in the hydraulic parameters of the substituted boreholes.
- Screen diameter: enlarging the diameter increases the flexibility during the pump installation and future rehabilitation.
- Percentage of screen open area: achievement an enhancement in the hydraulic parameters in substituted borehole where the open screen area percentage is smaller than in the old borehole underscores that this factor, does not singularly suffice to explicate the enhancements in the hydraulic parameters.
- Screen material Type: the transition to 316L is notable.
The examples show clearly that proper design and constructing of a pumping borehole have discernible influence on the hydraulic parameters, particularly in the realm of quantifying the aquifer loss (B) and well loss (C) coefficients. The determination of these coefficients, in conjunction with the assessment of transmissivity are important parameters for understanding the aquifer behavior and for optimal management of the single borehole and the whole pumping well field.
Finally, introducing innovation in the design and construction of boreholes can be the key differentiator between a borehole with medium hydraulic performance and one with excellent hydraulic performance.
Author Contributions
Conceptualization, Dr. Joseph Guttman. and Eng. Zigmund Barenblat.; methodology, Dr. Joseph Guttman. and Eng. Zigmund Barenblat.; writing—original draft preparation, Dr. Joseph Guttman; writing—review and editing, Dr. Joseph Guttman & Eng. Zigmund Barenblat.
Funding
This research received no external funding.
Data Availability Statement
All data are drilling, and pumping test results carried out in the field by “Mekorot” Isarel National Water Company with our supervision and involvement.
Acknowledgments
To our colleagues from the Hydrology and Drilling departments in “Mekorot” Israel National Water Company.
Conflicts of Interest
The authors declare no conflict of interest.
References
- Cooper, H.H., Jr.; Jacob, C.E. A generalized graphical method for evaluating formation constants and summarizing well-field history. Transactions. American Geophysical Union 1946, 27, 4. [Google Scholar] [CrossRef]
- Driscoll, F.G. (1989). Groundwater & Wells (Second Edition); A comprehensive guide for the design, installation, and maintenance of water well. Johnson Filtration Systems Inc., St. Paul, Minnesota.
- Guttman, J.; Negev, I.; Rubin, G. Design and Testing of Recharge Wells in a Coastal Aquifer: Summary of a Field Scale Pilot Tests. Water 2017, 9, 53. [Google Scholar] [CrossRef]
- Jacob, CE. (1950). Flow of groundwater. In: Rouse H (ed) Engineering hydraulics. Wiley, New York, pp 321–386.
- Lok, M.J. (2018). Analysis and improvement of well capacities in fine grained sand aquifers. Master Thesis Universiteit Utrecht, Nederland.
- Kloppmann, W., Negev, I. Guttman, J., Goren, O., Guerrot, C., Flehoc, C., Pettenati, M., Burg, A. (2018). Monitoring a man-made water cycle by multi-isotope tracers (B, S, O, H). Journal Science of the Total Environment 2018, 619–620, 272–280.
- Negev, I.; Guttman, J.; Kloppmann, W. The Use of Stable Water Isotopes as Tracers in Soil Aquifer Treatment (SAT) and in Regional Water Systems. Water 2017, 9, 73. [Google Scholar] [CrossRef]
- Nutter, N.; Gin, G. (2016). Aquifer storage and recovery wells systems. Factory pump injection testing: Is this necessary? ISMAR9 conference, Mexico. Topic Theme M13.
- Pfannkuch, H-O, Mooers, H.D, Siegel, D.I, Quinn, J.J, Rosenberry, D.O, Alexander, S.C, (2021). Review: “Jacob’s Zoo”-how using Jacob’s method for aquifer testing leads to more intuitive understanding of aquifer characteristics. Hydrogeology Journal (2021) 29: 2001-2015. [CrossRef]
- Ram, R., Burg, A., Zappala, J.C, Yokochi, R., Yechieli, Y., Purtschert, R., Jiang, W., Lu Zheng-Tian, Mueller, P., Bernier, R., Adar, E. (2020). Identifying recharge processes into a vast “fossil” aquifer based on dynamic groundwater 81Kr age evaluation. Journal of Hydrology 587 (2020) 124946. [CrossRef]
- Rosenthal, E.; Adar, E.; Issar, A.S.; Batelaan, O. definition of groundwater flow by environmental traces in the multiple aquifer system Southern Arava Valley, Israel. Journal of Hydrology 1990, 117, 339–368. [Google Scholar] [CrossRef]
- Shalev, N.; Burg, A.; Gavrieli, I.; Lazar, B. Nitrate contamination sources in aquifers underlying cultivated fields in an arid region- The Arava Valley, Israel. Applied Geochemistry 2015, 63, 322–332. [Google Scholar] [CrossRef]
- Jhonson Screens-Muni-Pak screen specifications. https://www.environmental-expert.com/products/johnson-screens-muni-pak-screens-622023.
- Paparelli Alessandro e Figlio S.R.L. https://www.paparelliscreens.com/en.
Figure 1.
Pumping and injection boreholes structures.
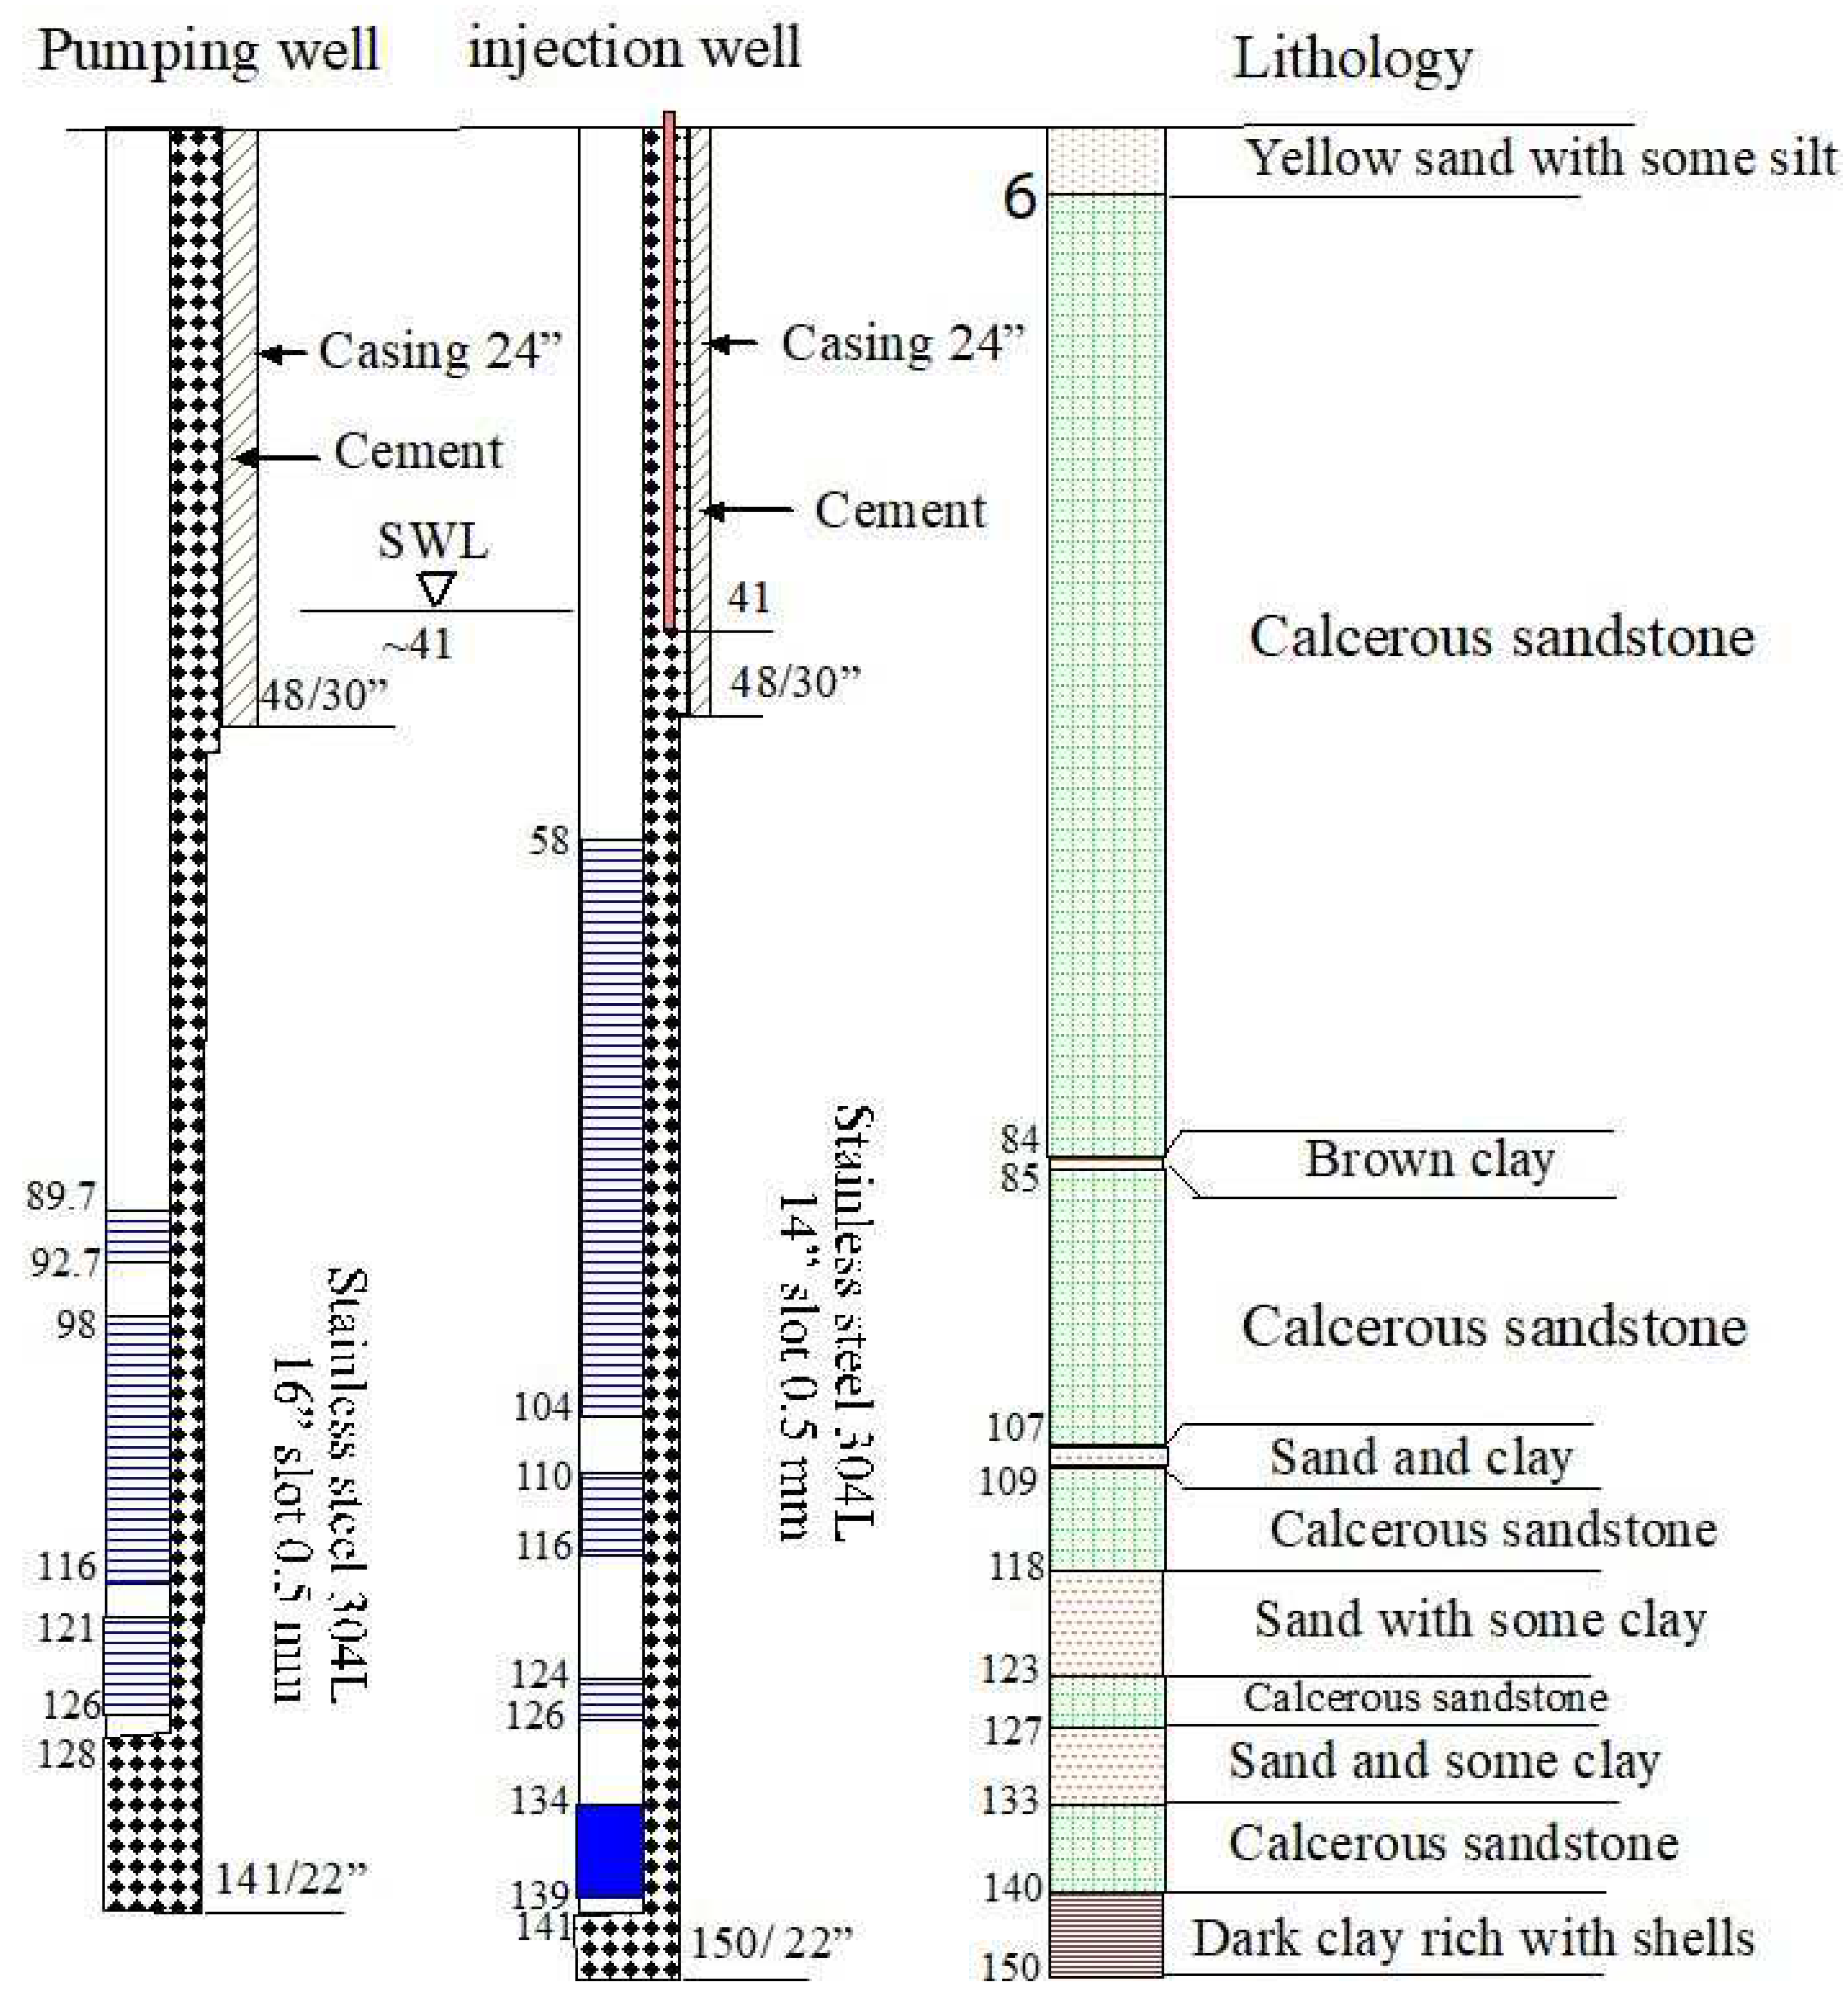
Figure 2.
The aquifer and well coefficients in those boreholes.

Figure 3.
Locations of the boreholes.

Figure 4.
YN-203 and YN-203a borehole description and design.
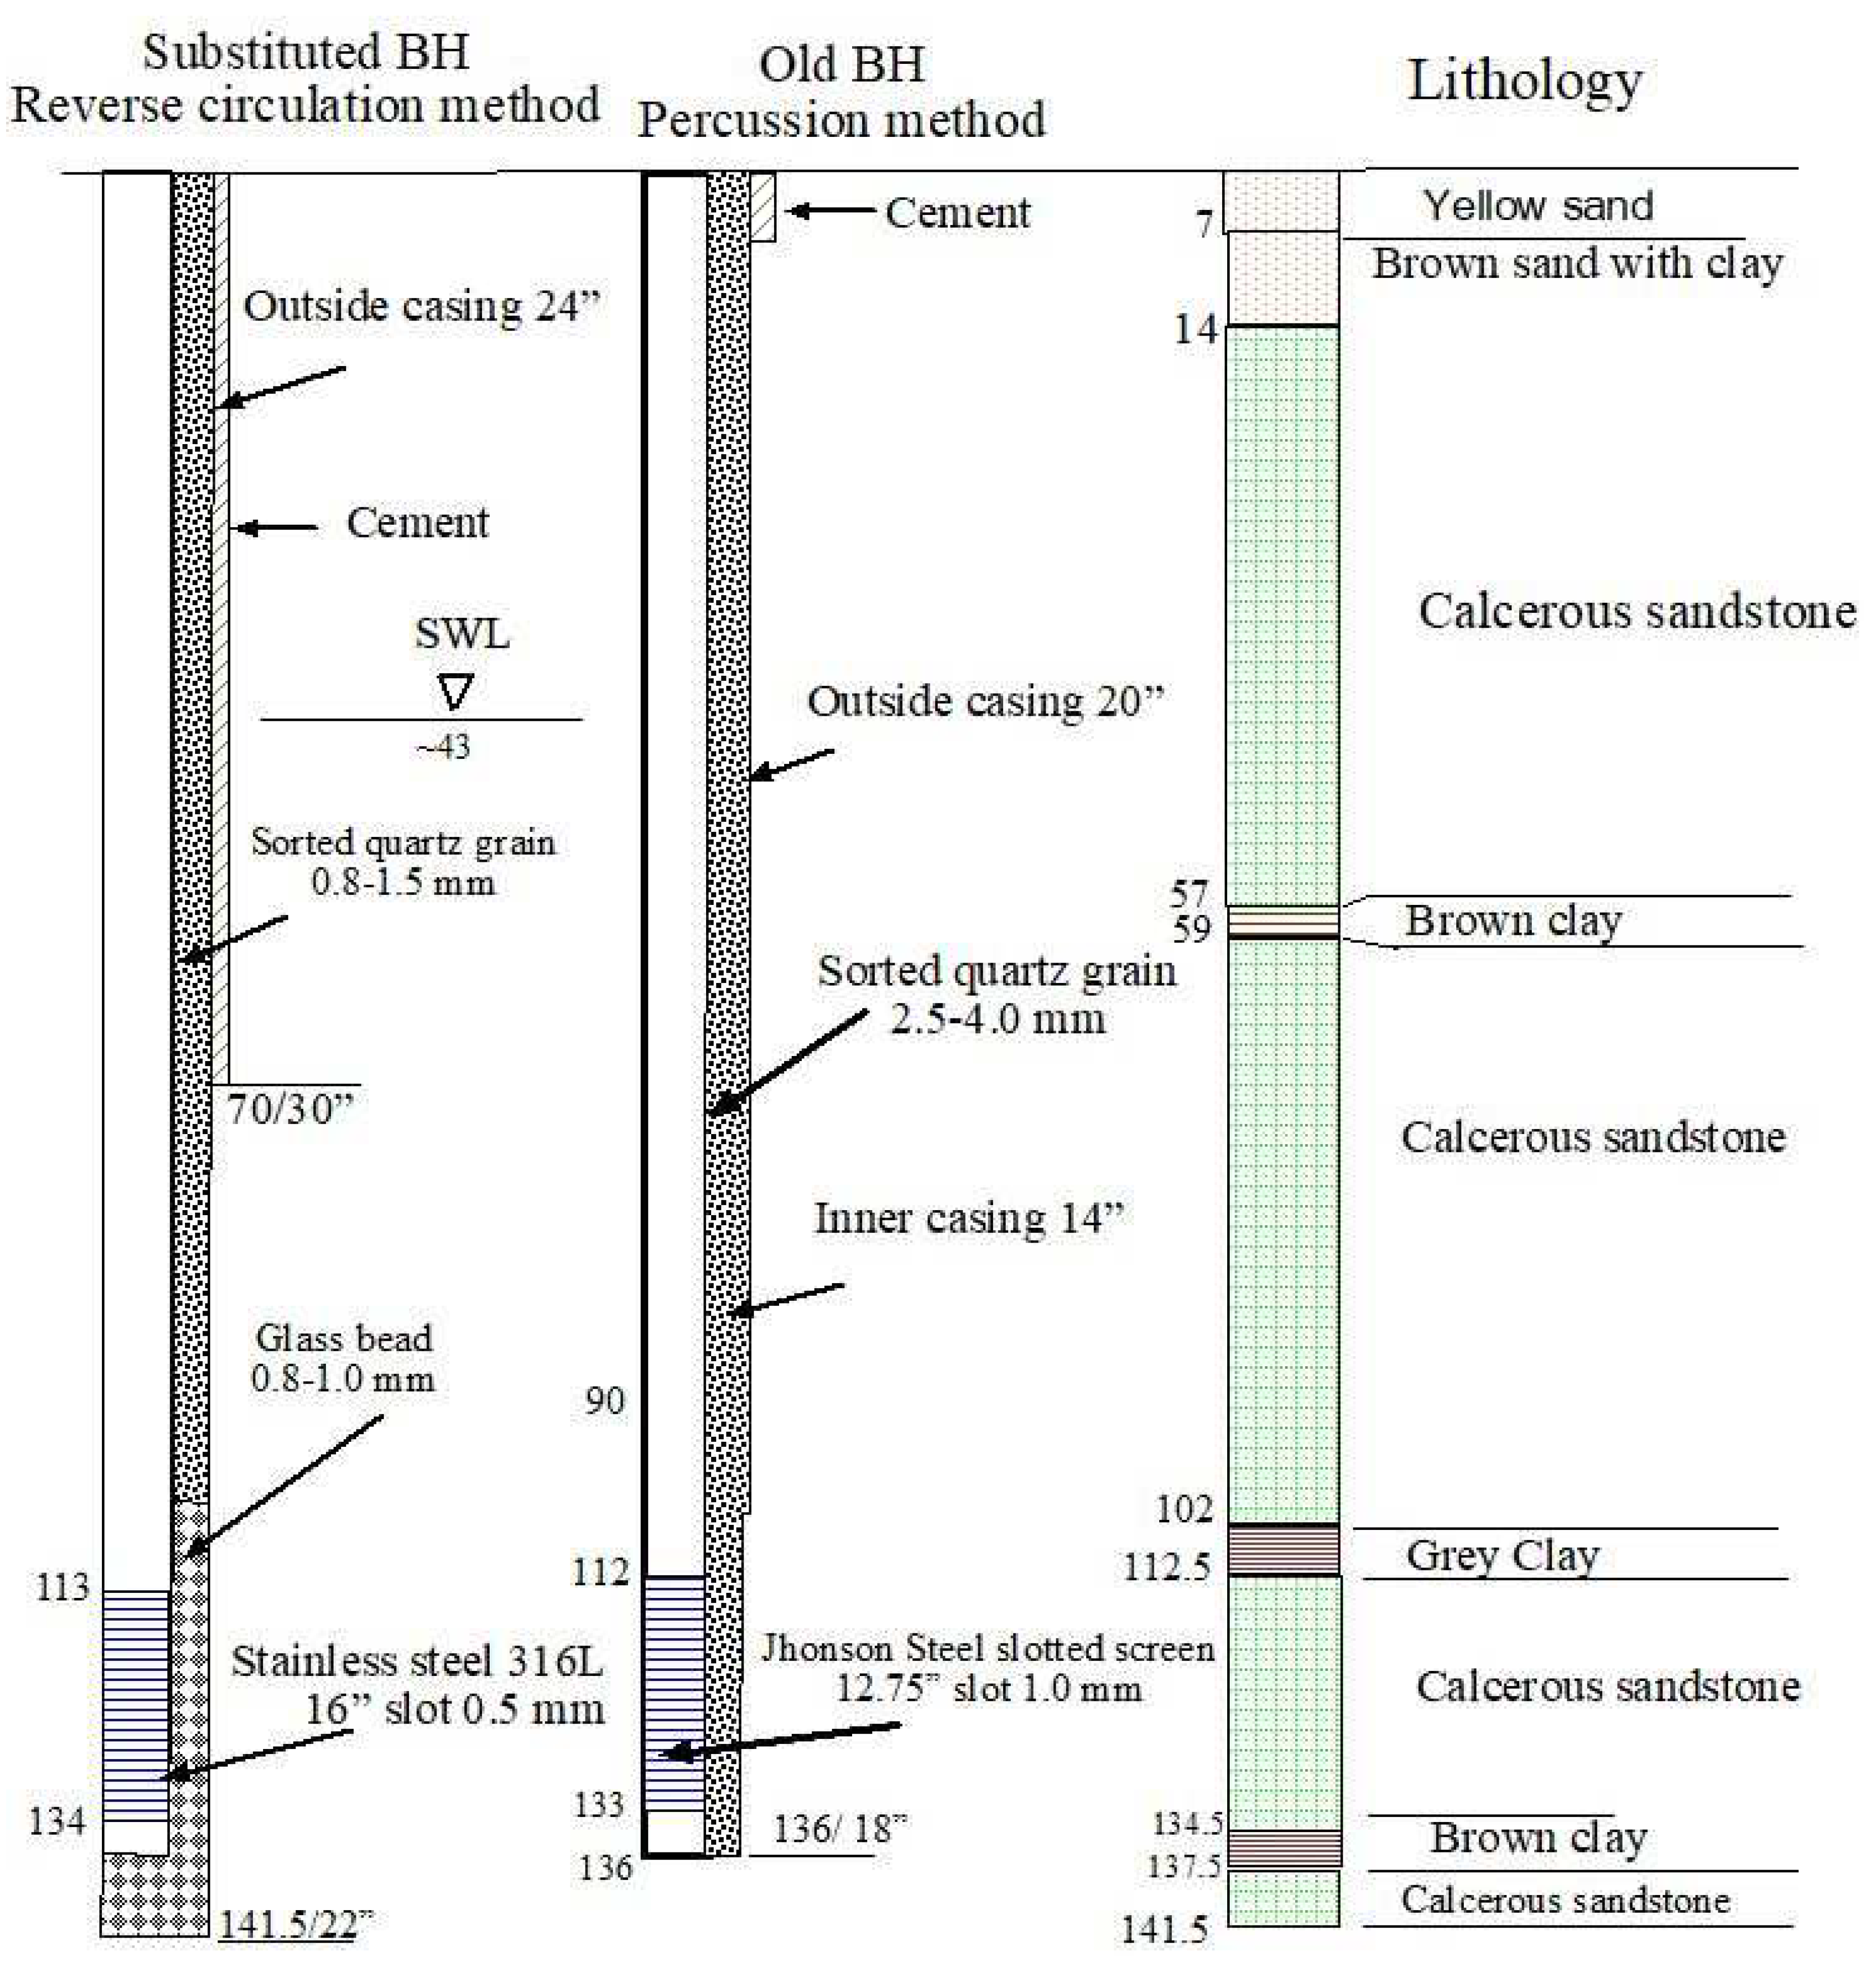
Figure 5.
The aquifer and well coefficients in YN-203 and YN-203a.
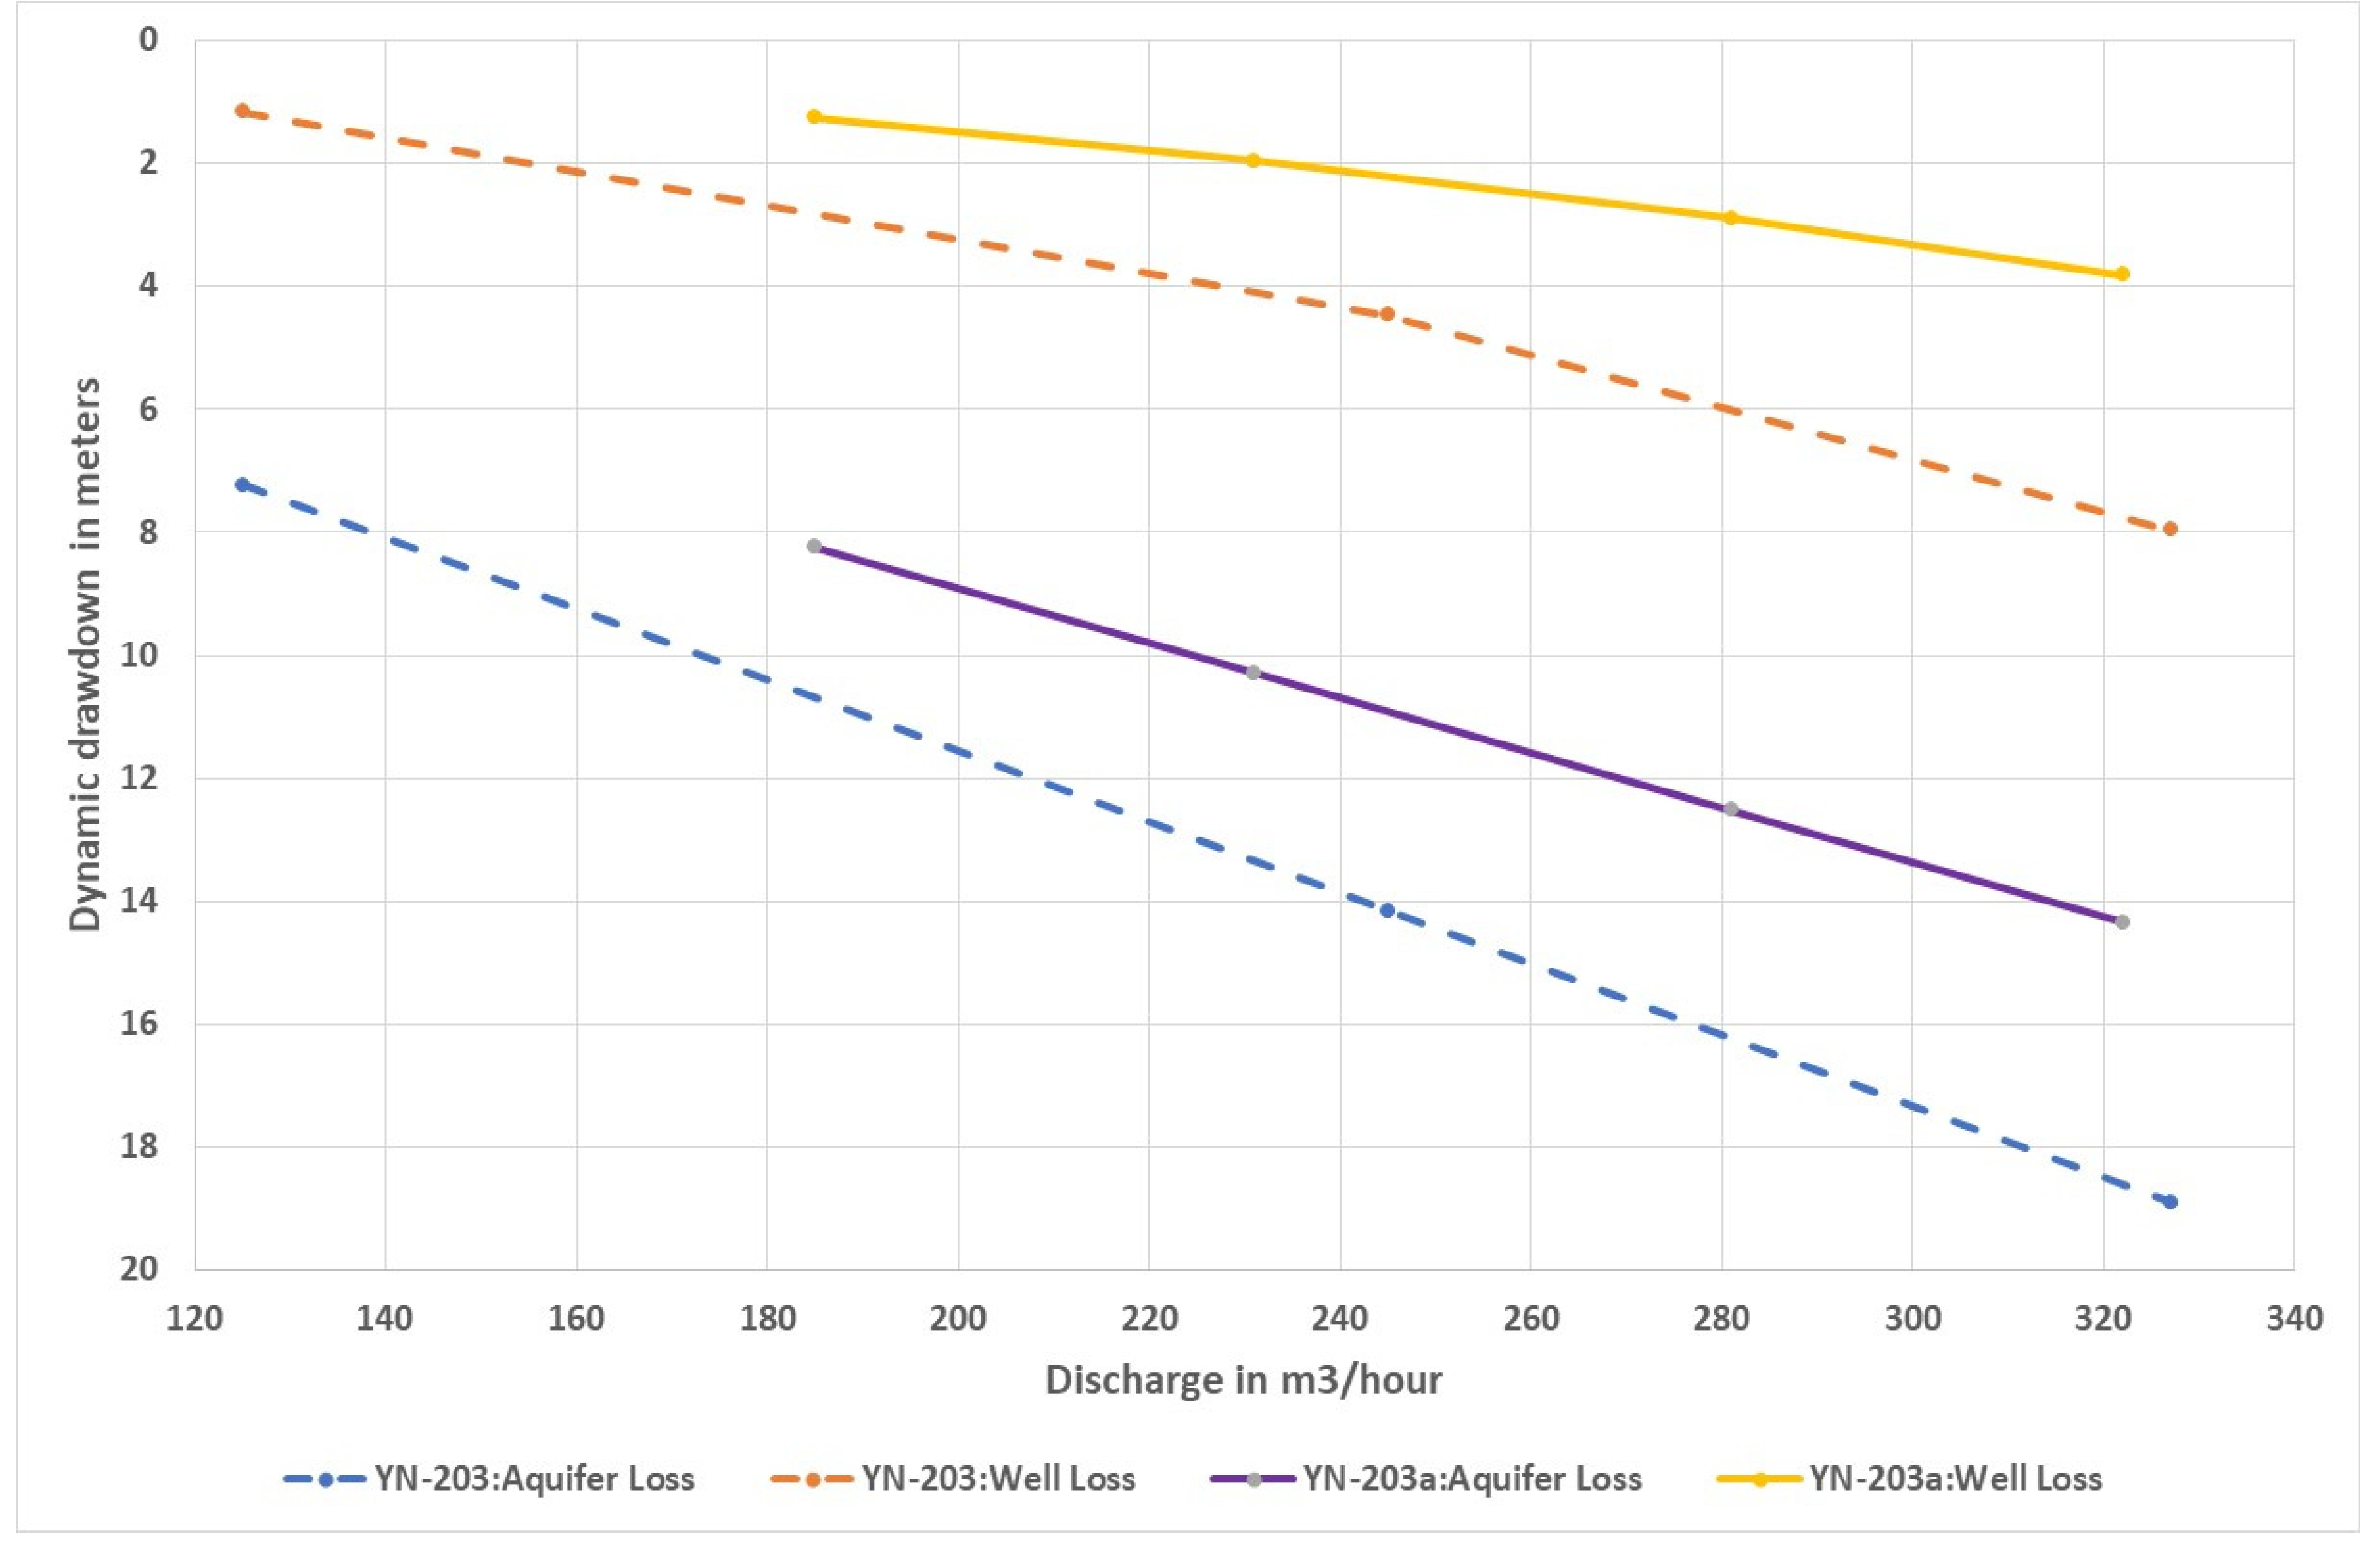
Figure 6.
YN-219 and YN-219a borehole description and design.
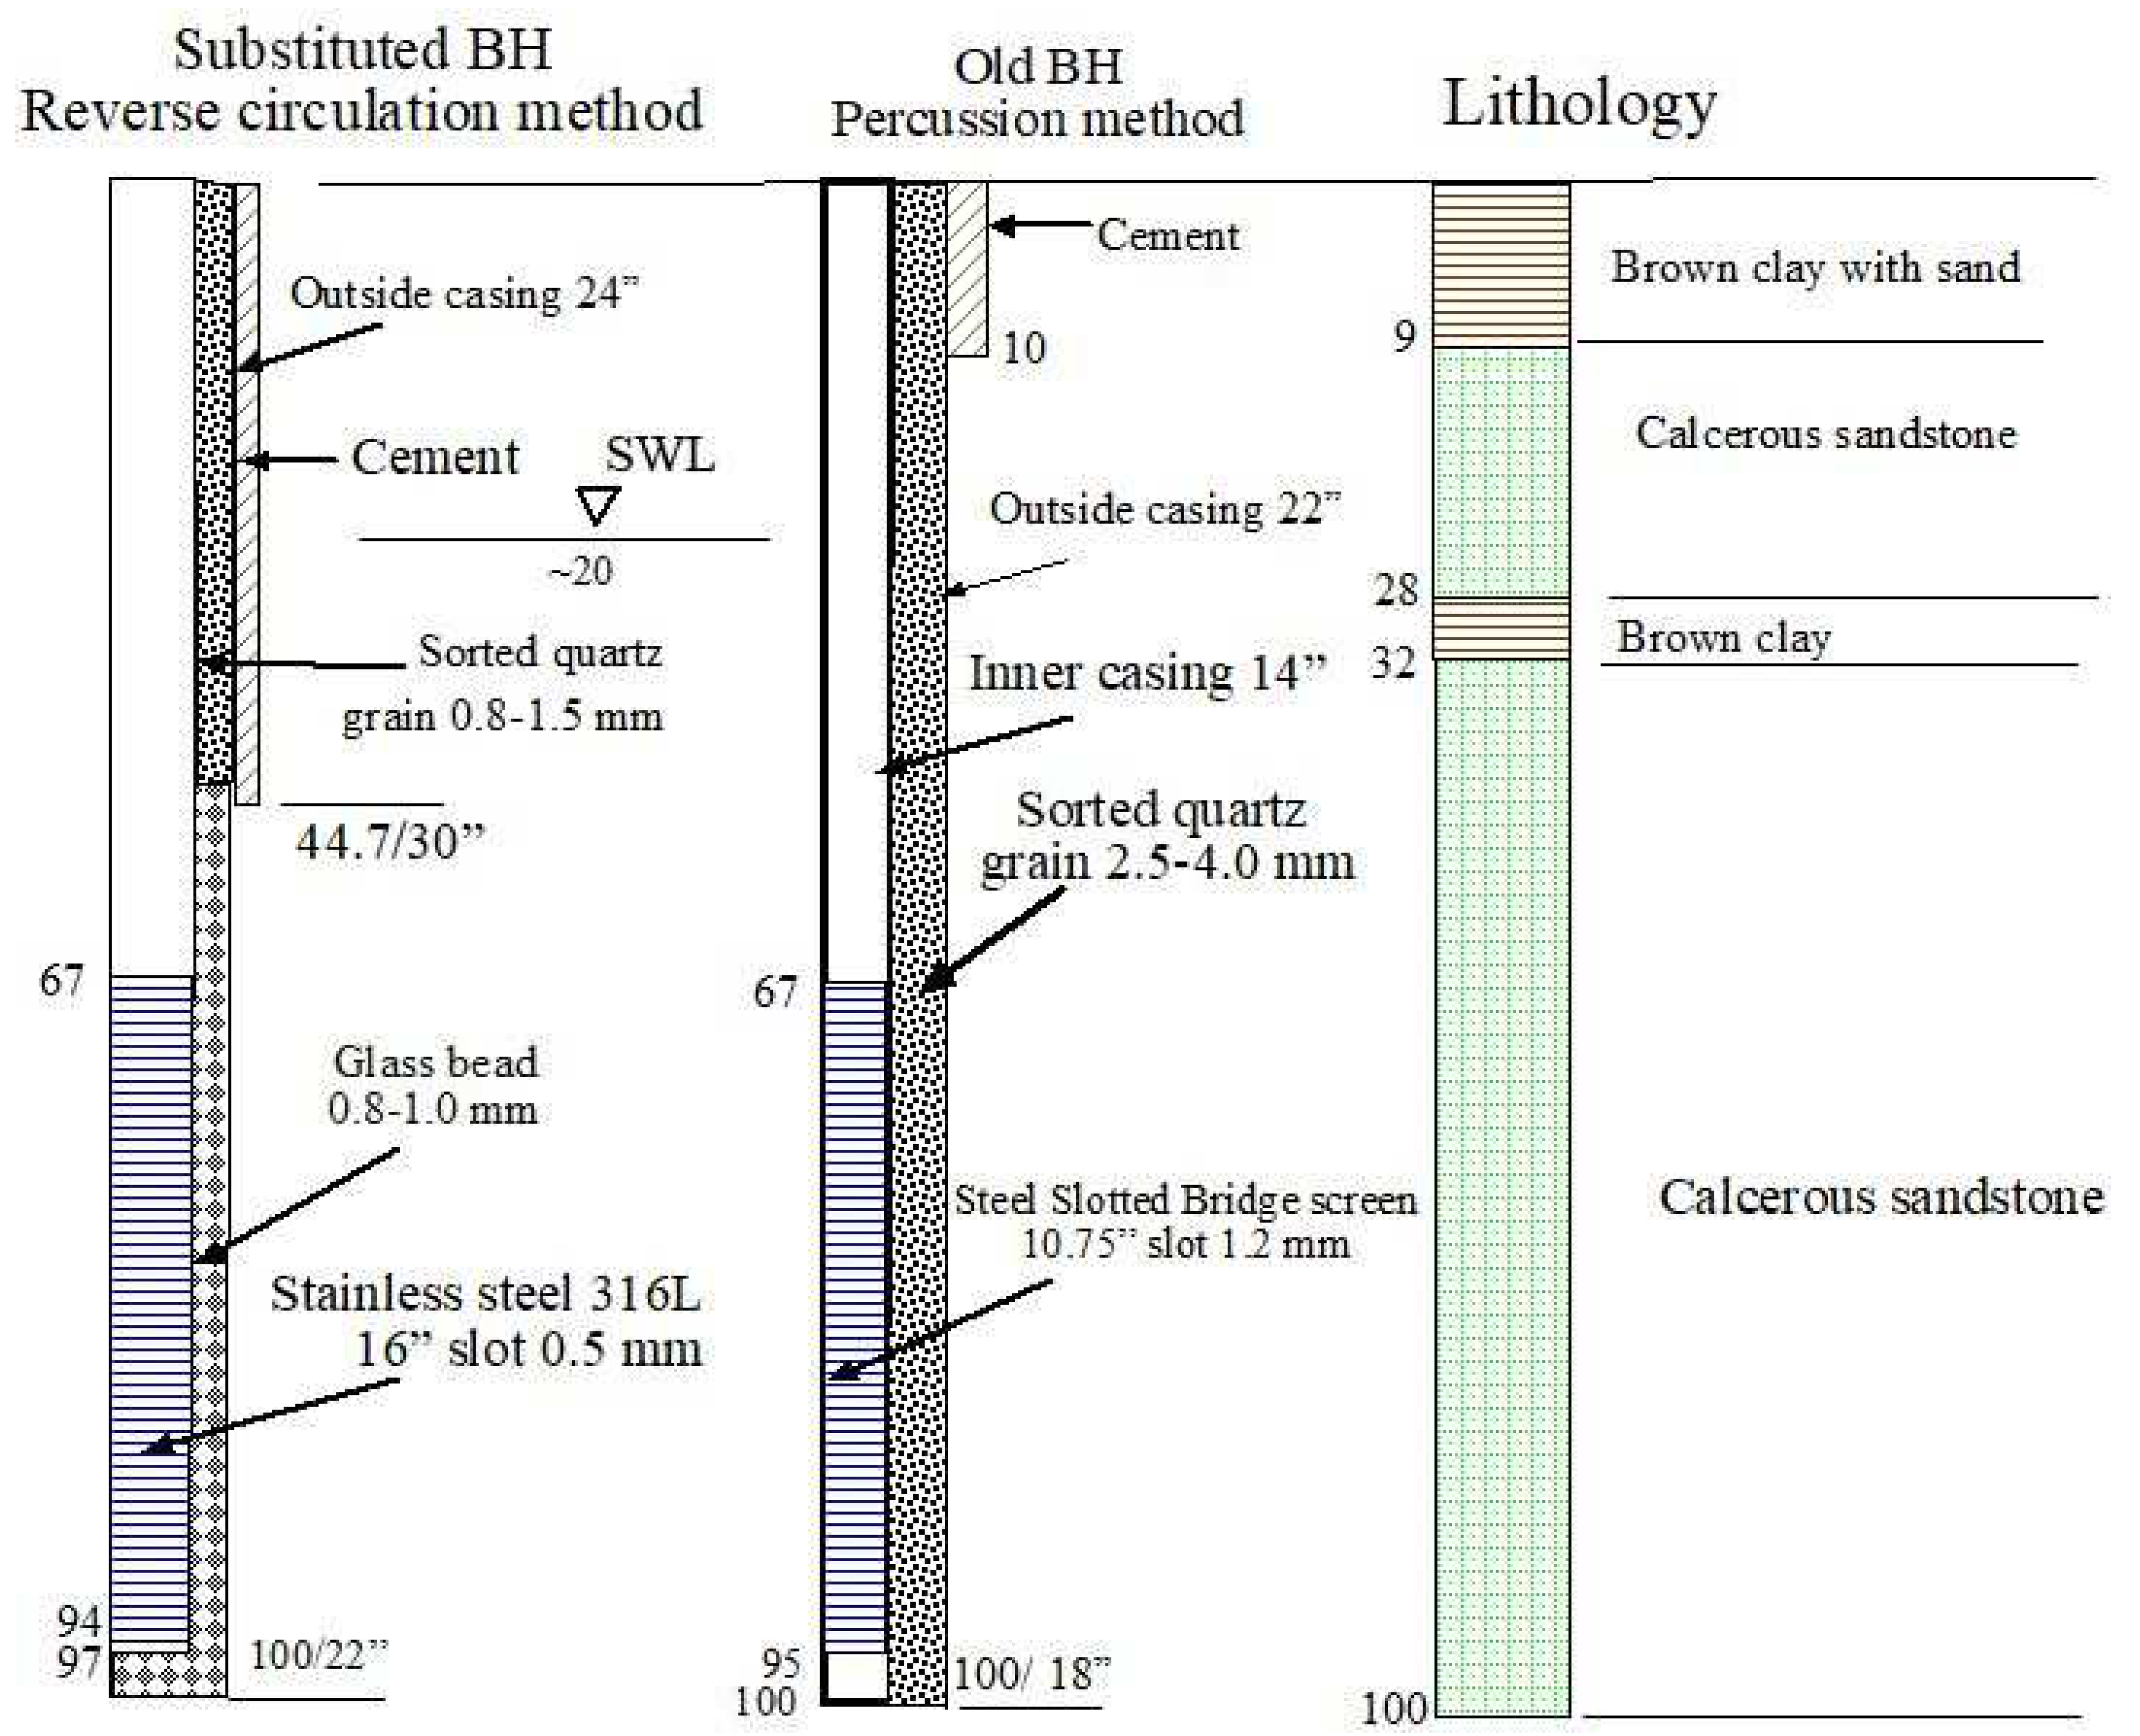
Figure 7.
The aquifer and well coefficients in YN-219 and YN-219a.

Figure 8.
YN-210 and YN-210a borehole description and design.
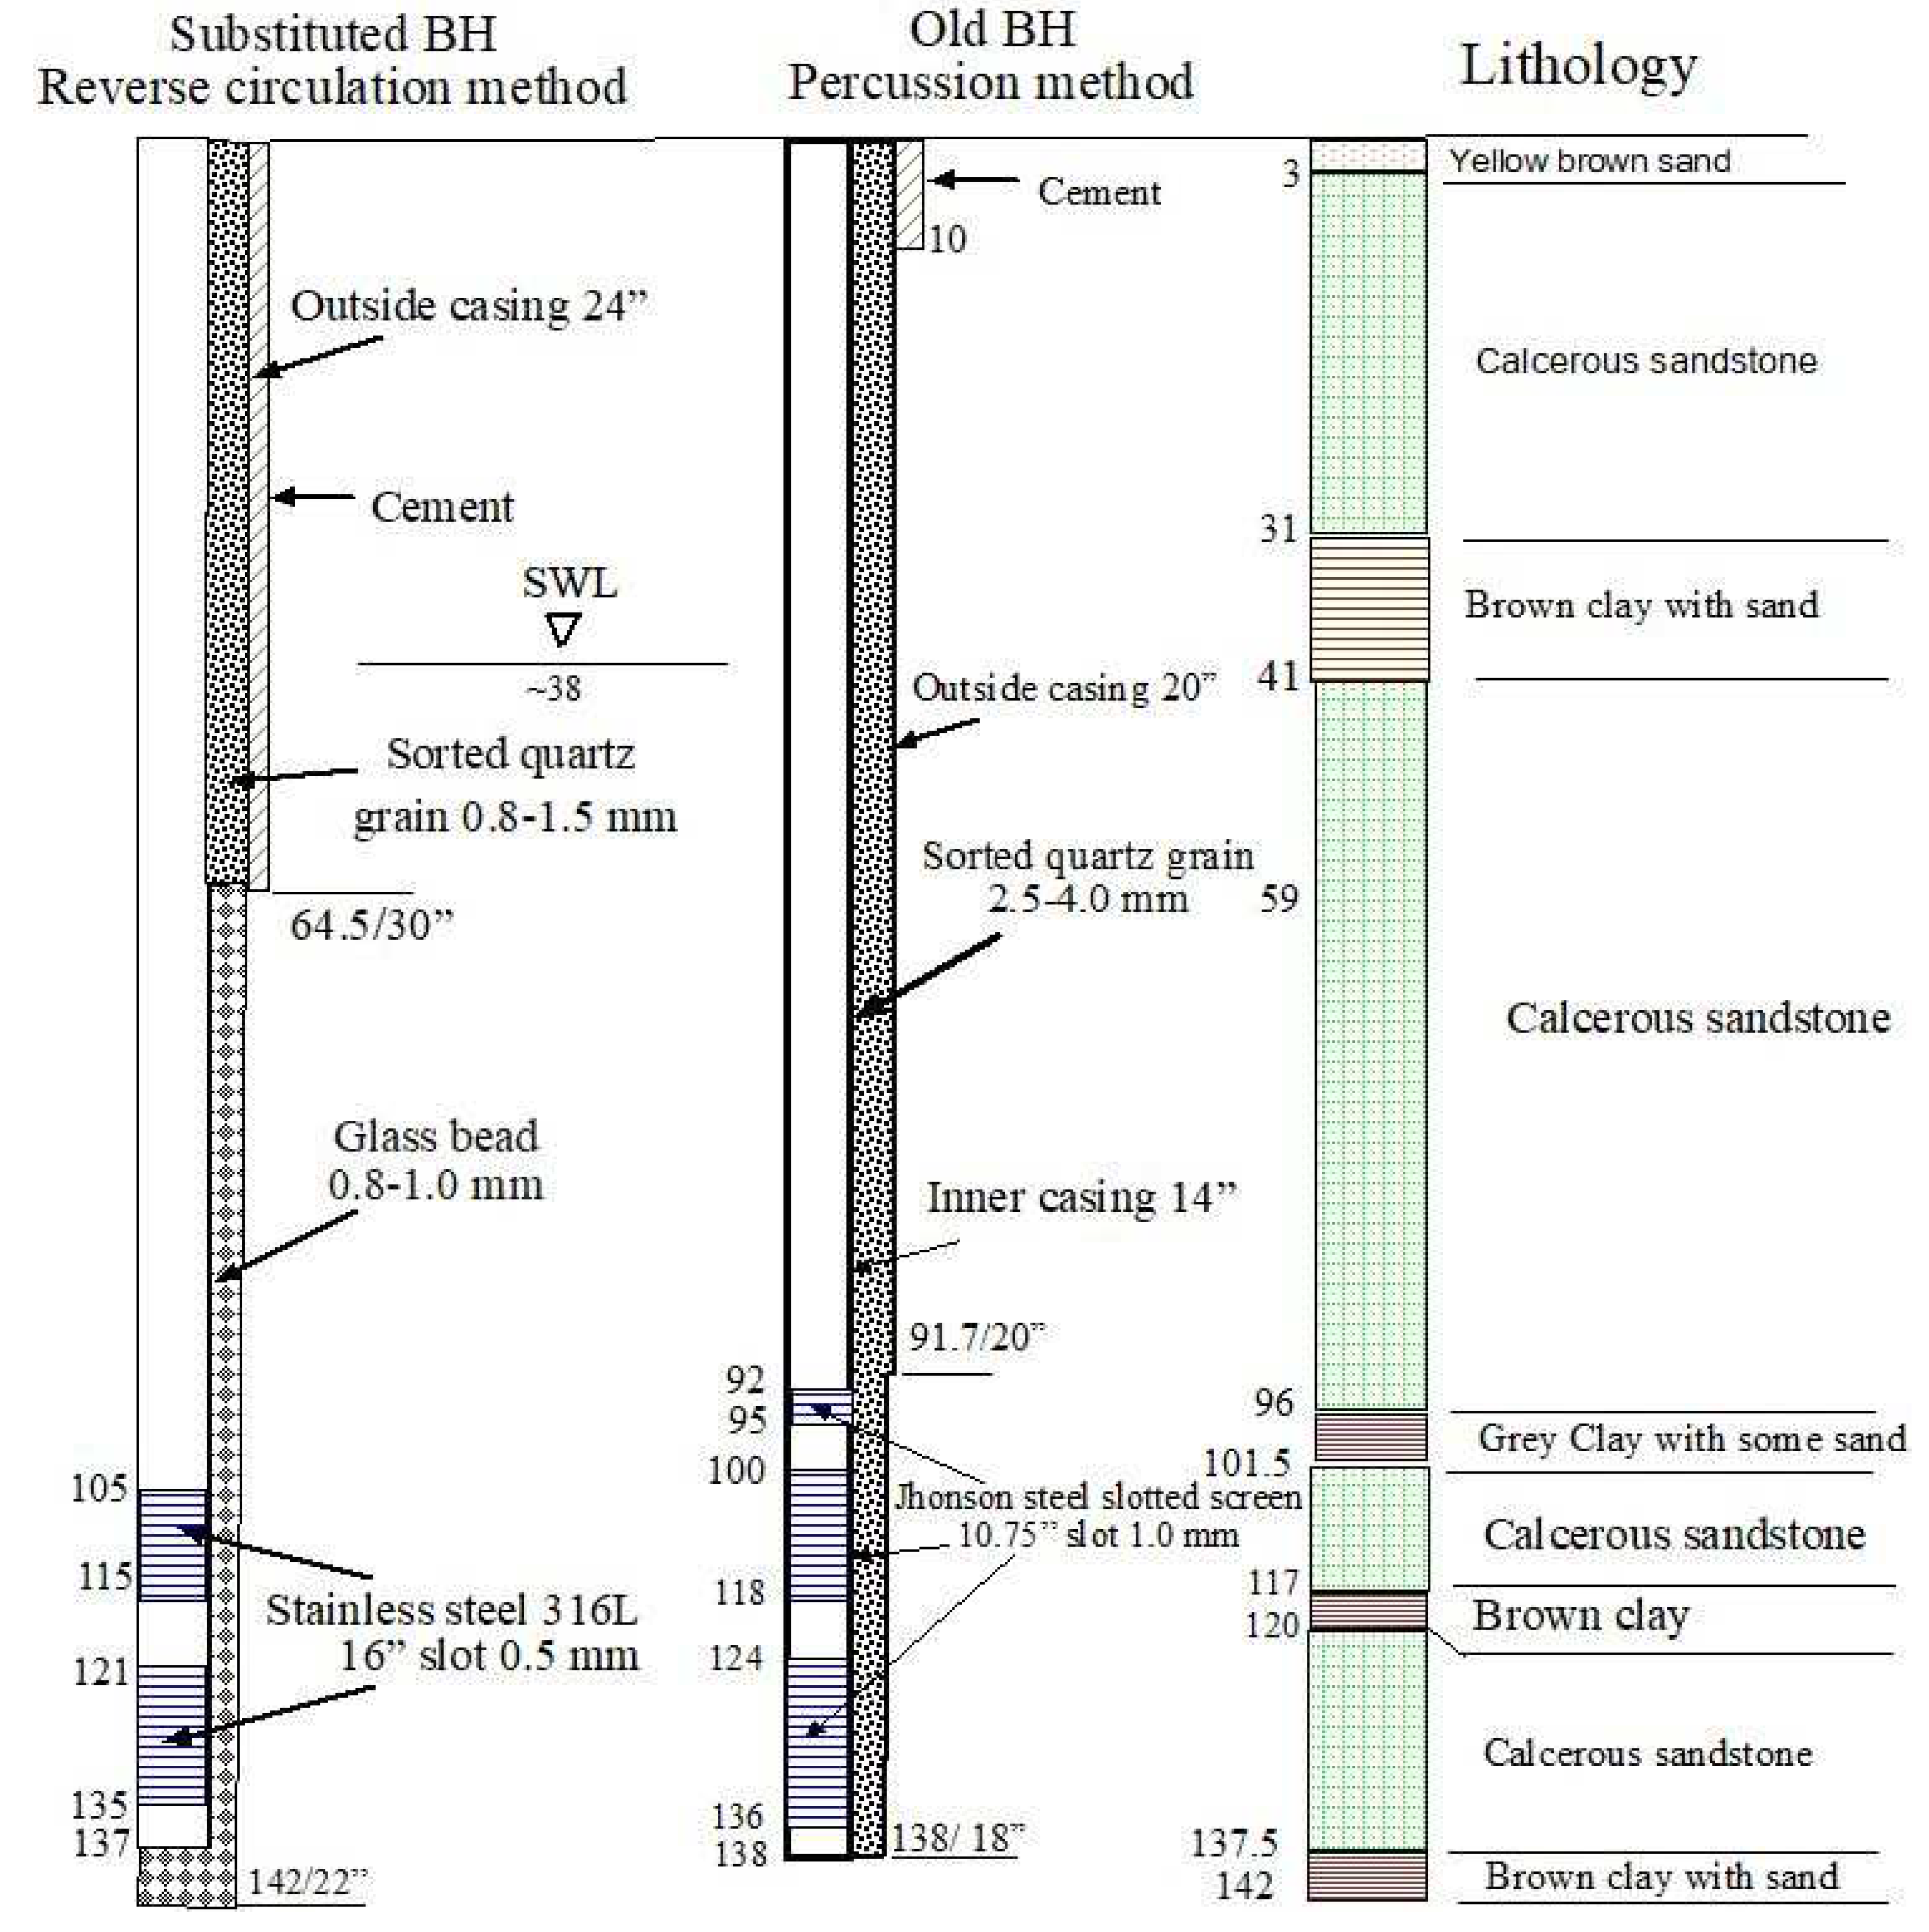
Figure 9.
The aquifer and well coefficients in YN-210 and YN-210a.
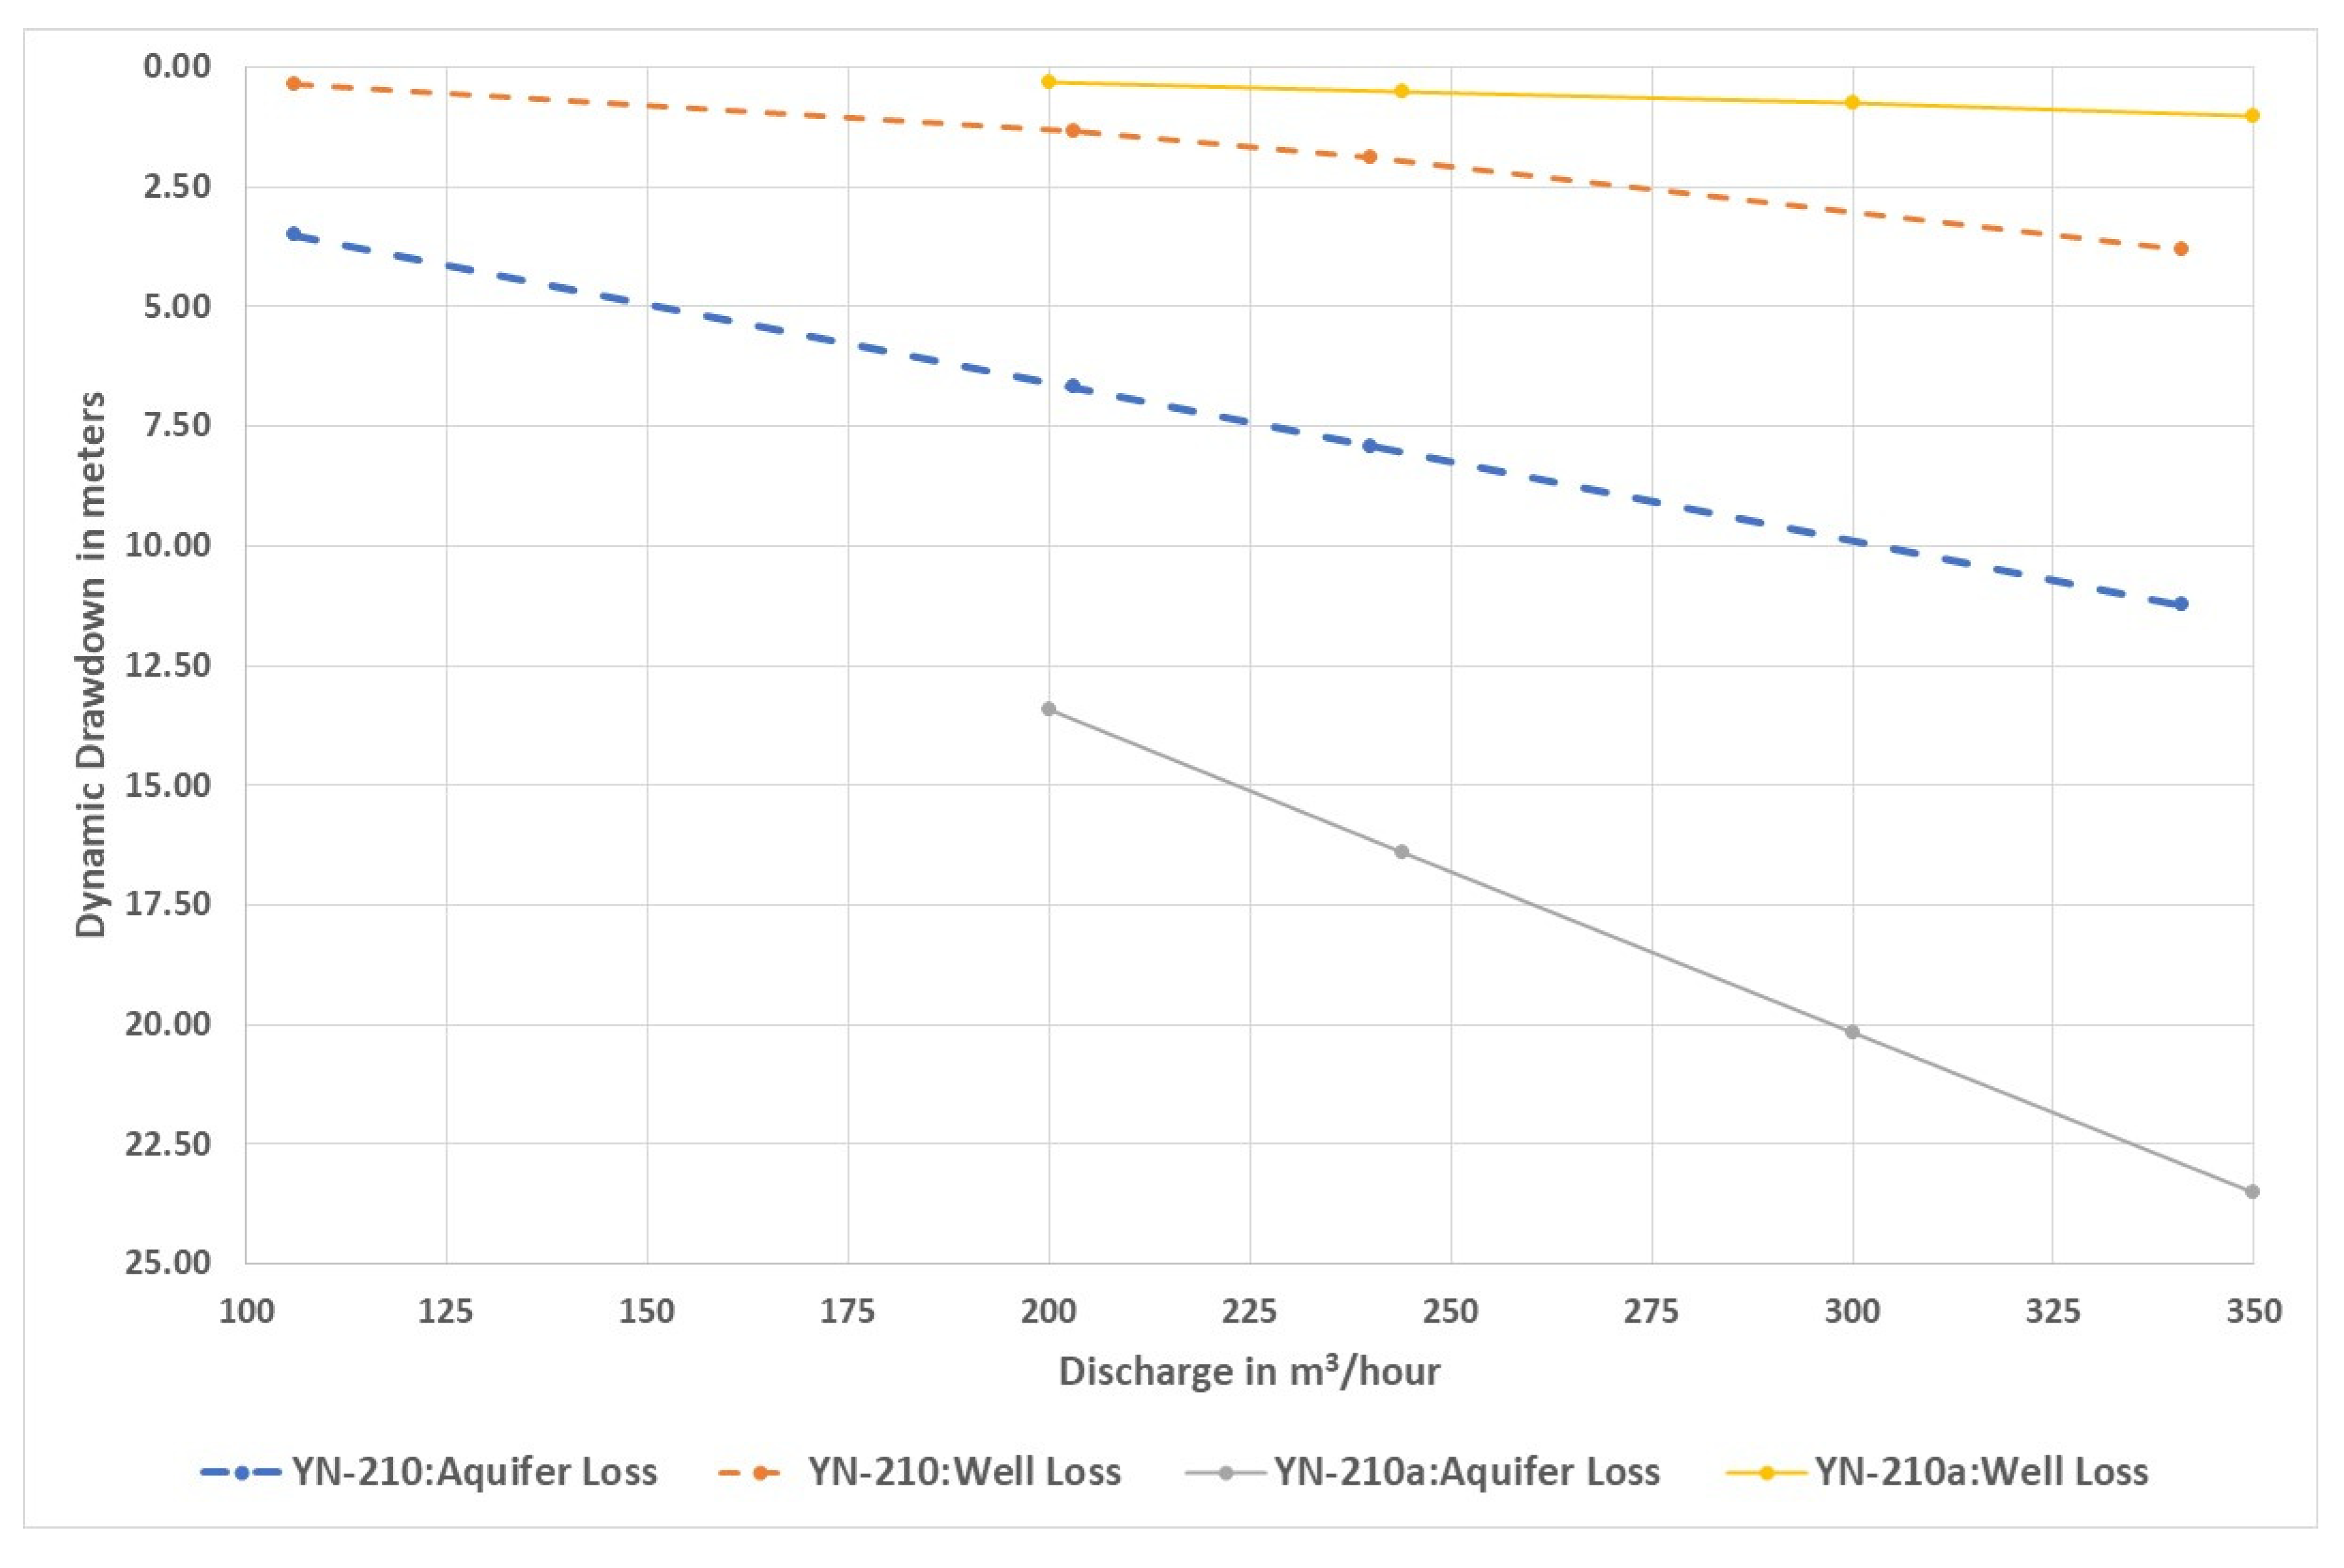
Figure 10.
ID-7 and ID-7a borehole description and design.
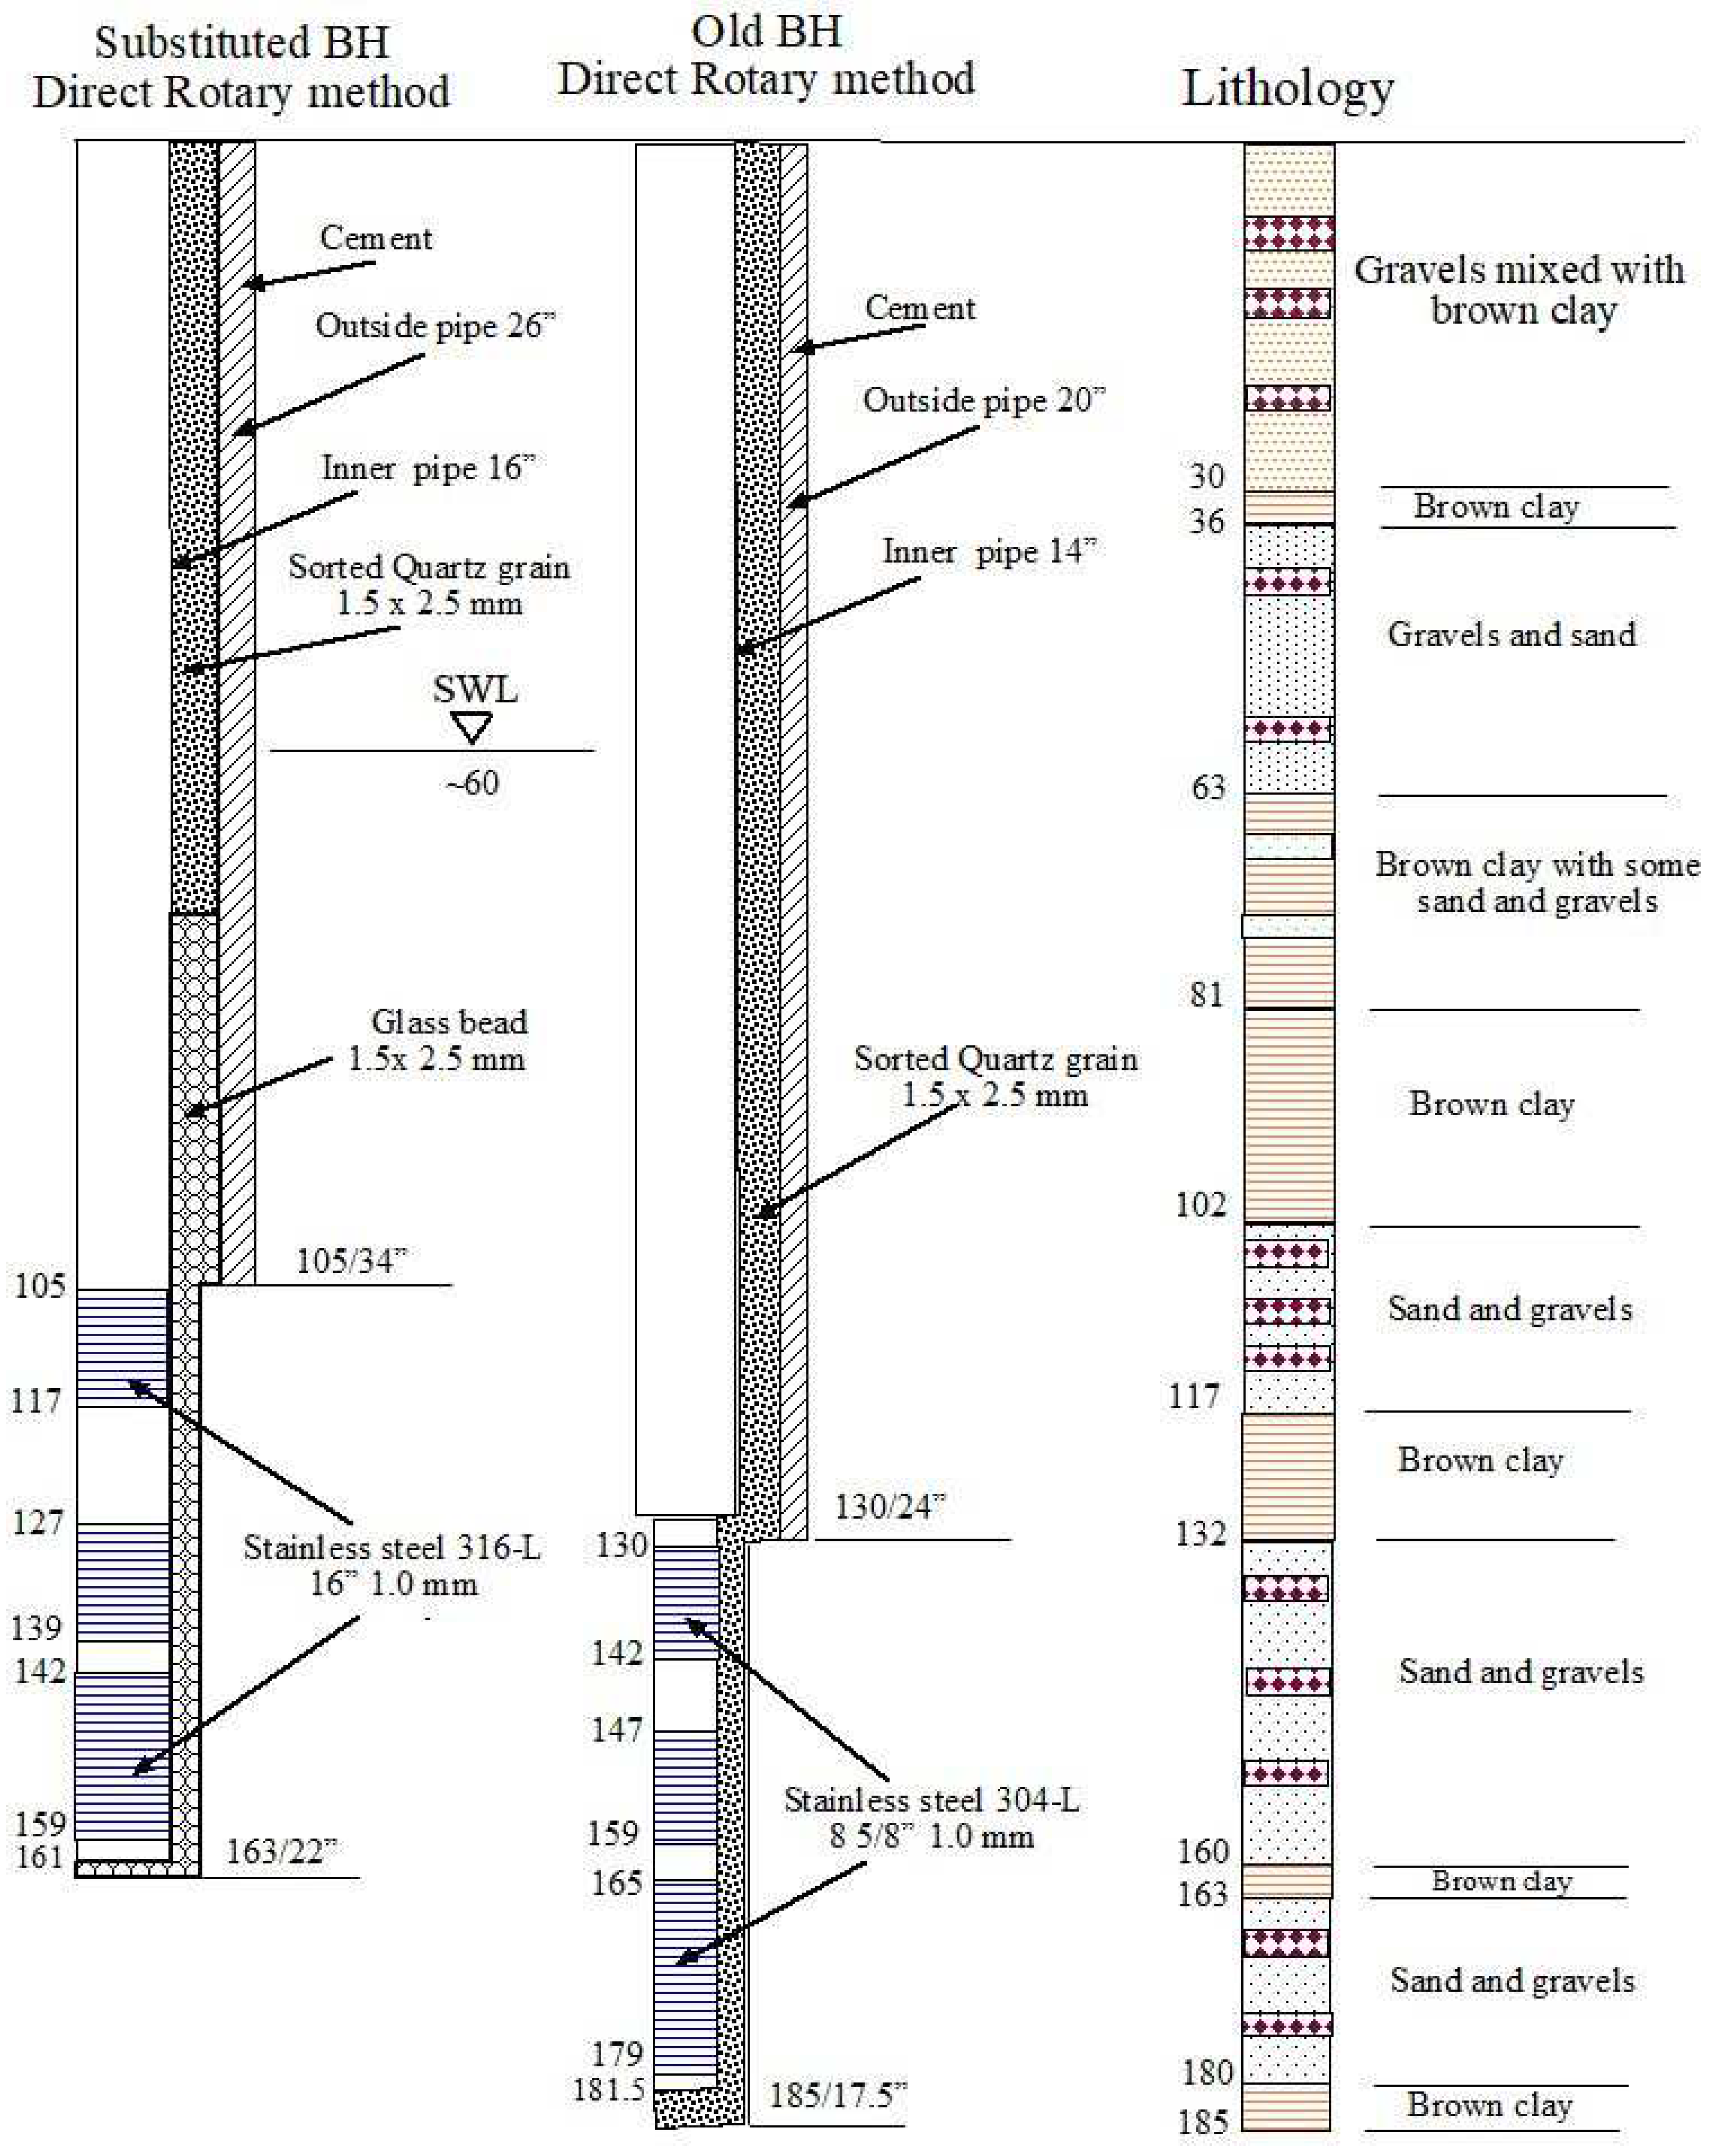
Figure 11.
The aquifer and well coefficients in ID-7 and ID-7a.
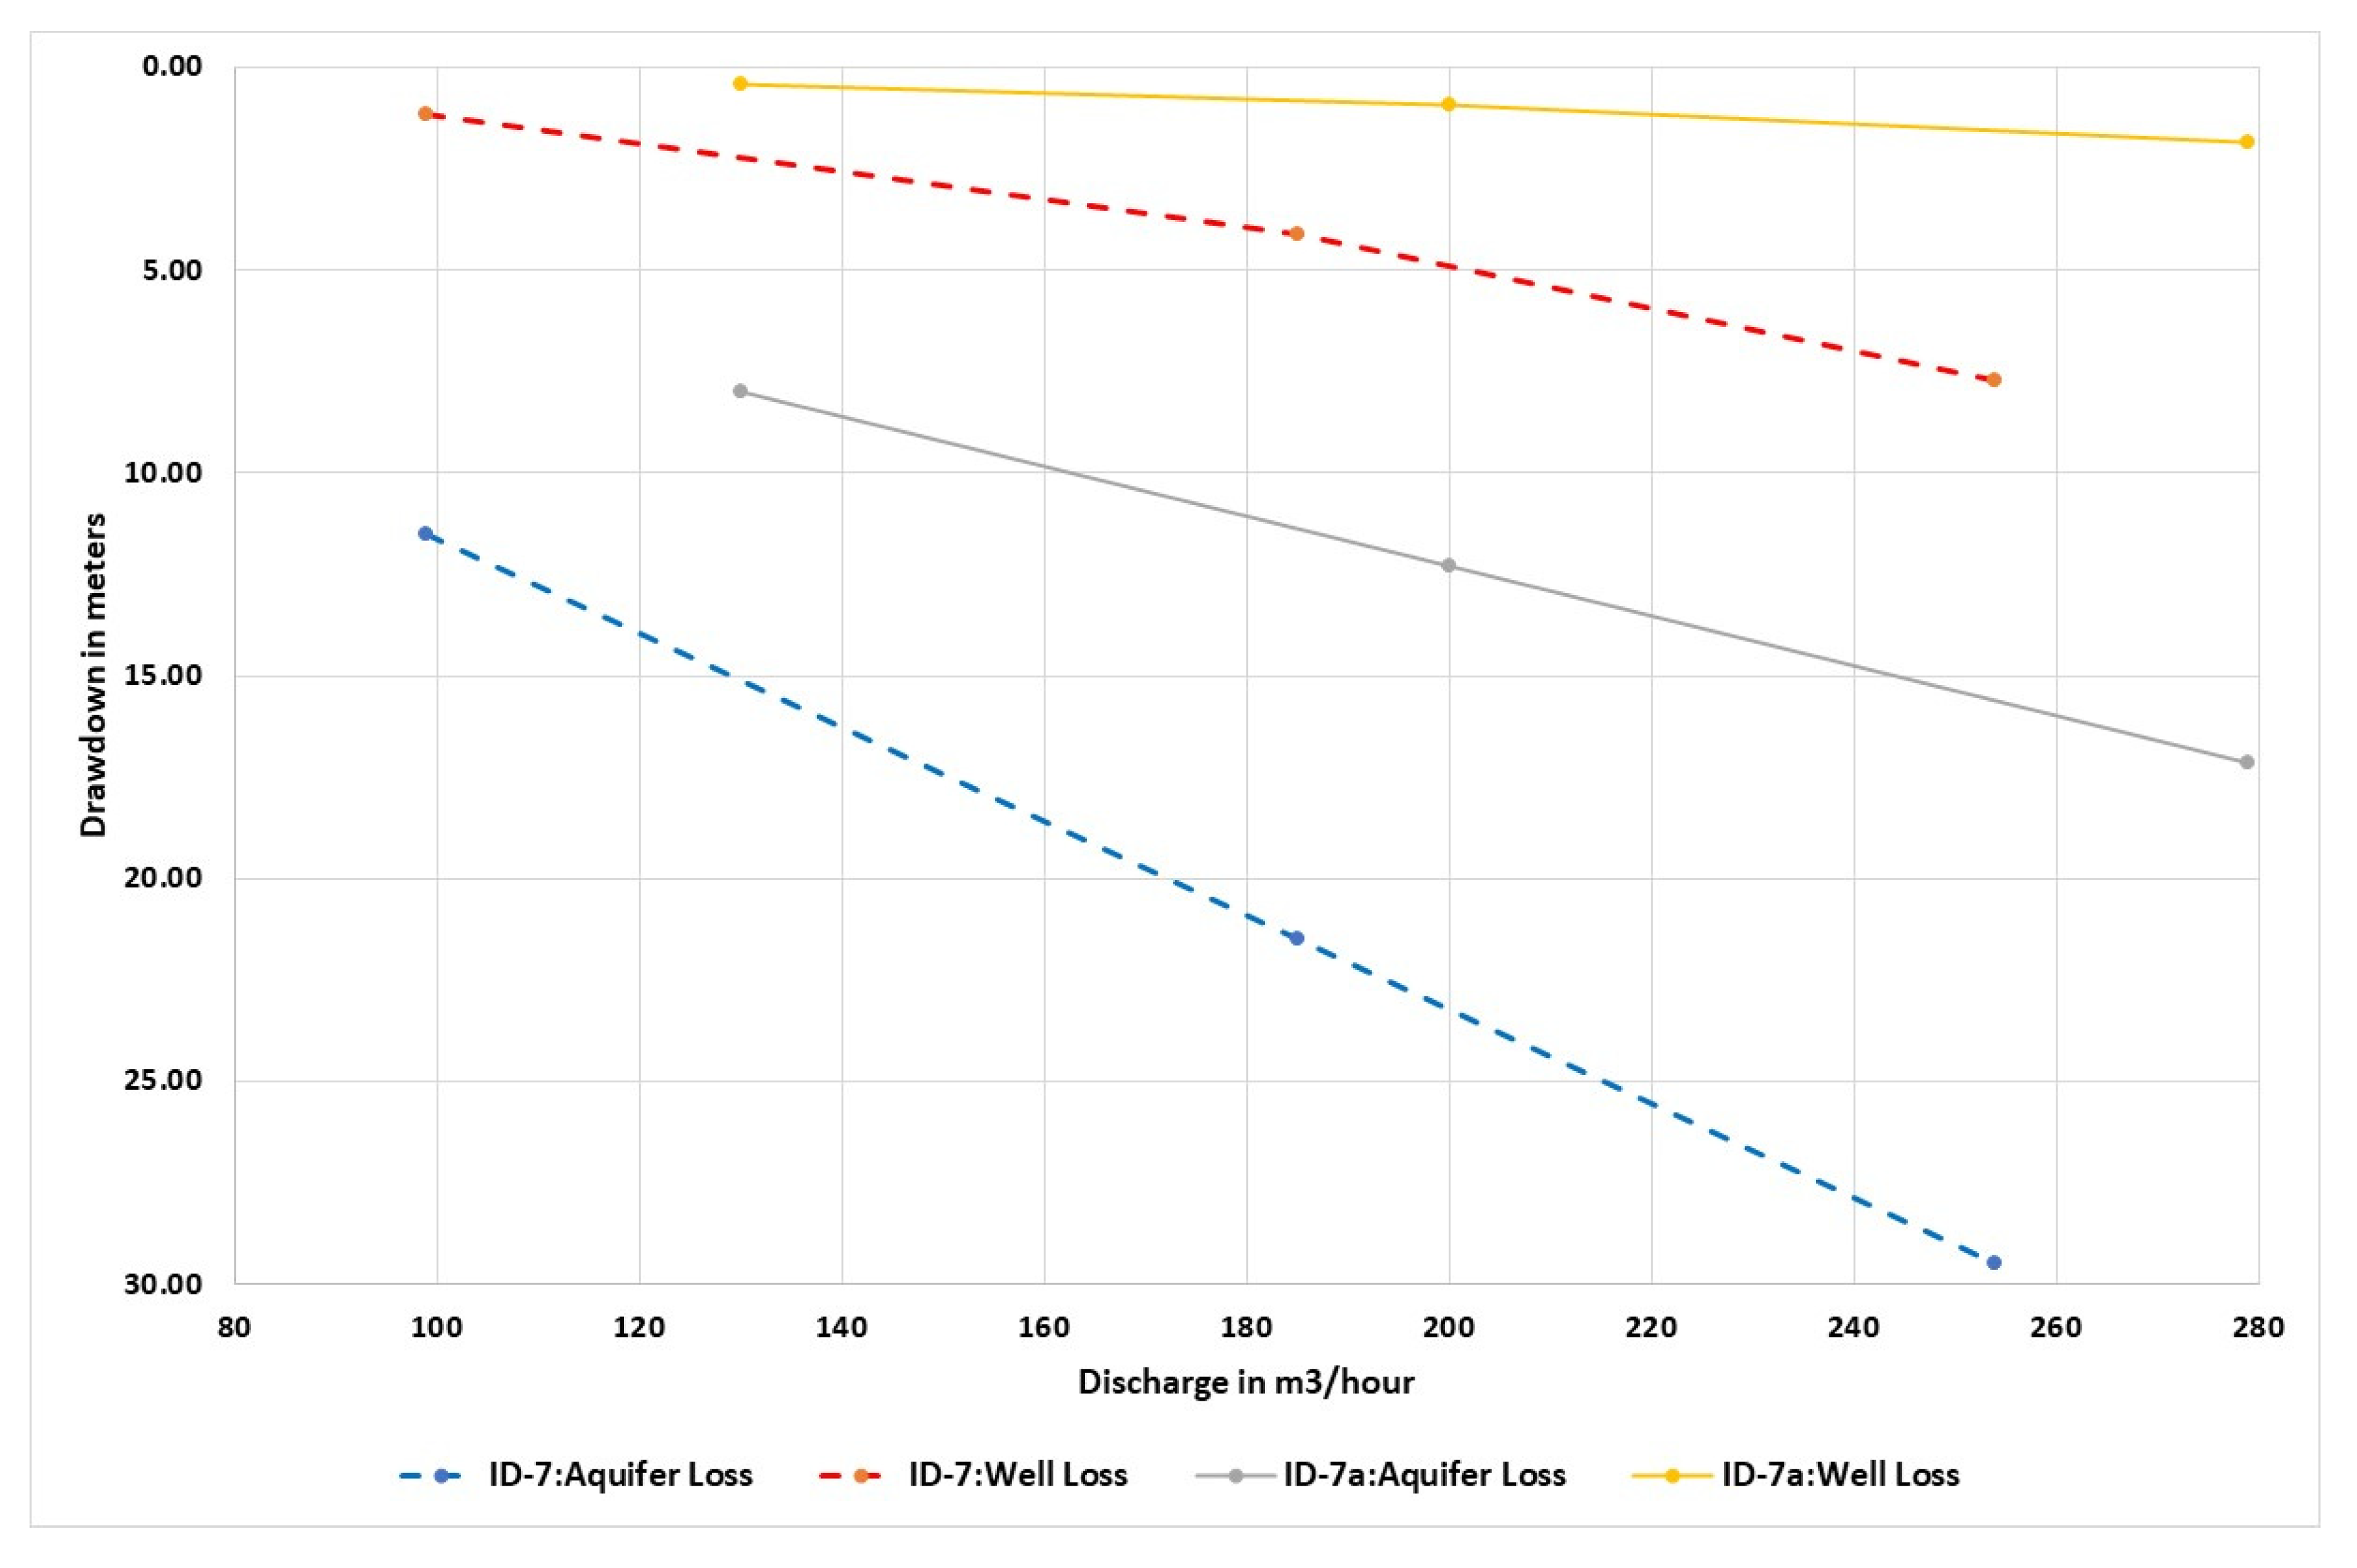
Figure 12.
HZ-12 and HZ-12a borehole description and design.
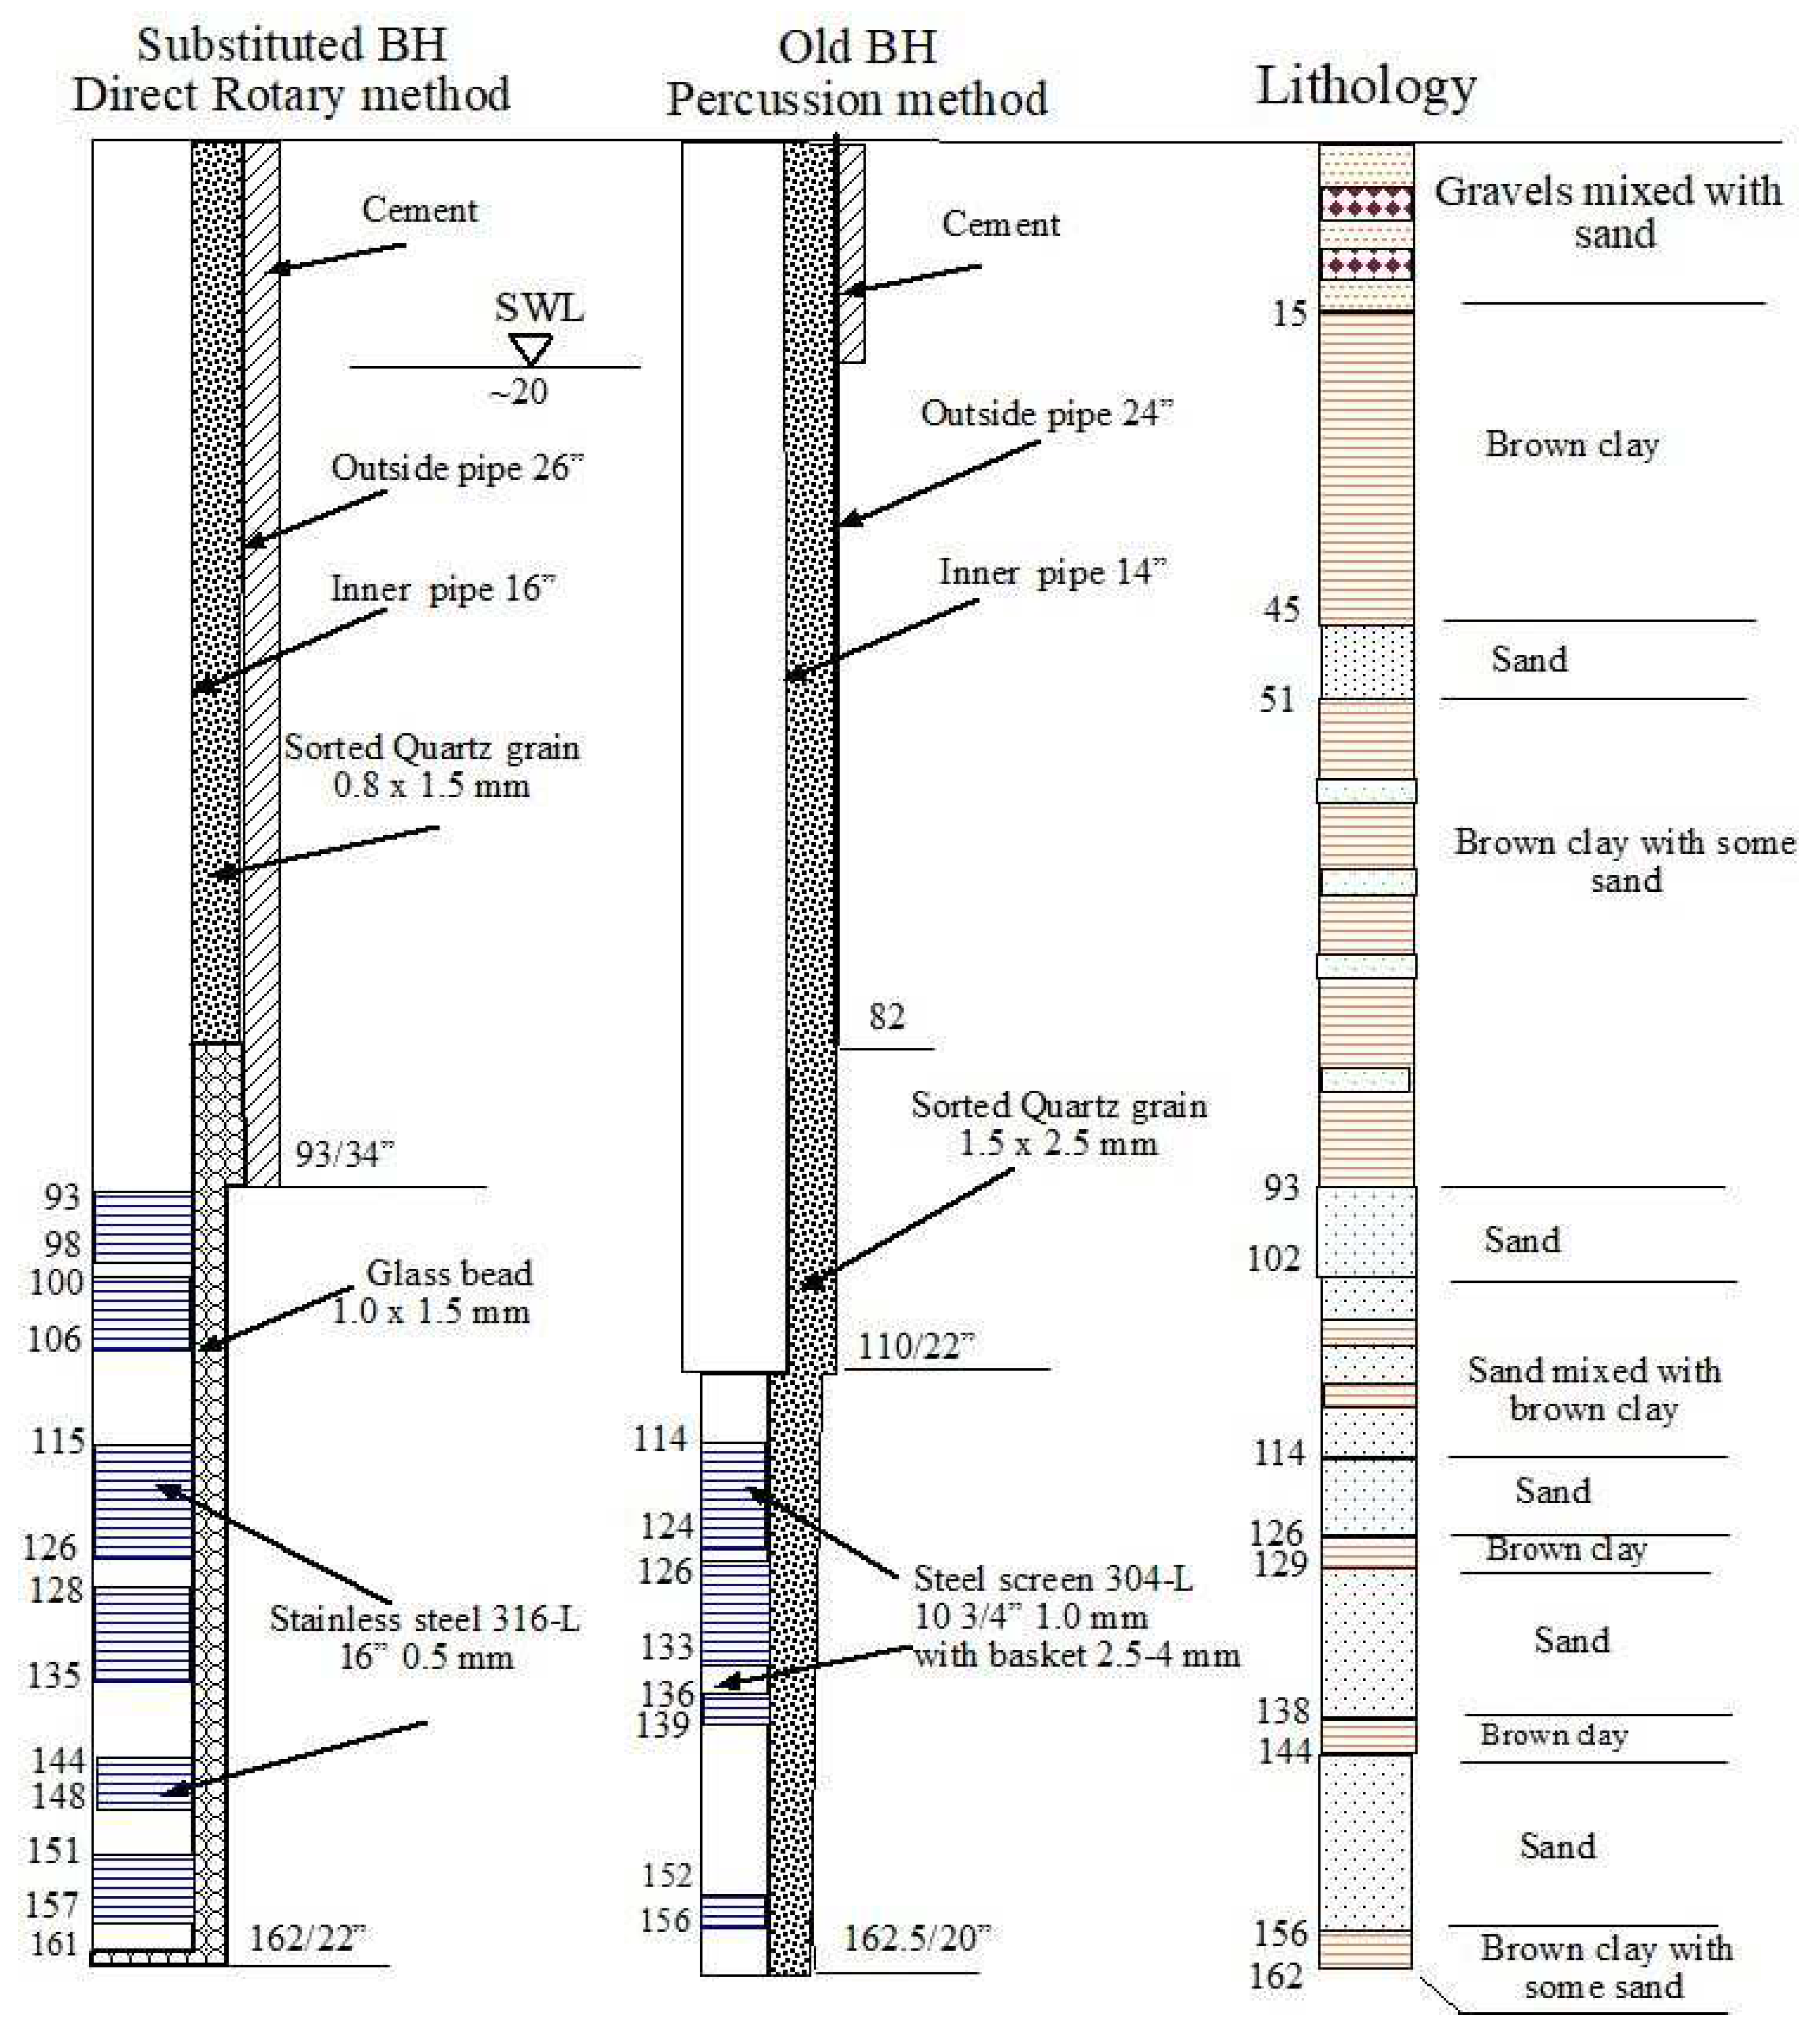
Figure 13.
The aquifer and well coefficients in HZ-12 and HZ-12a.
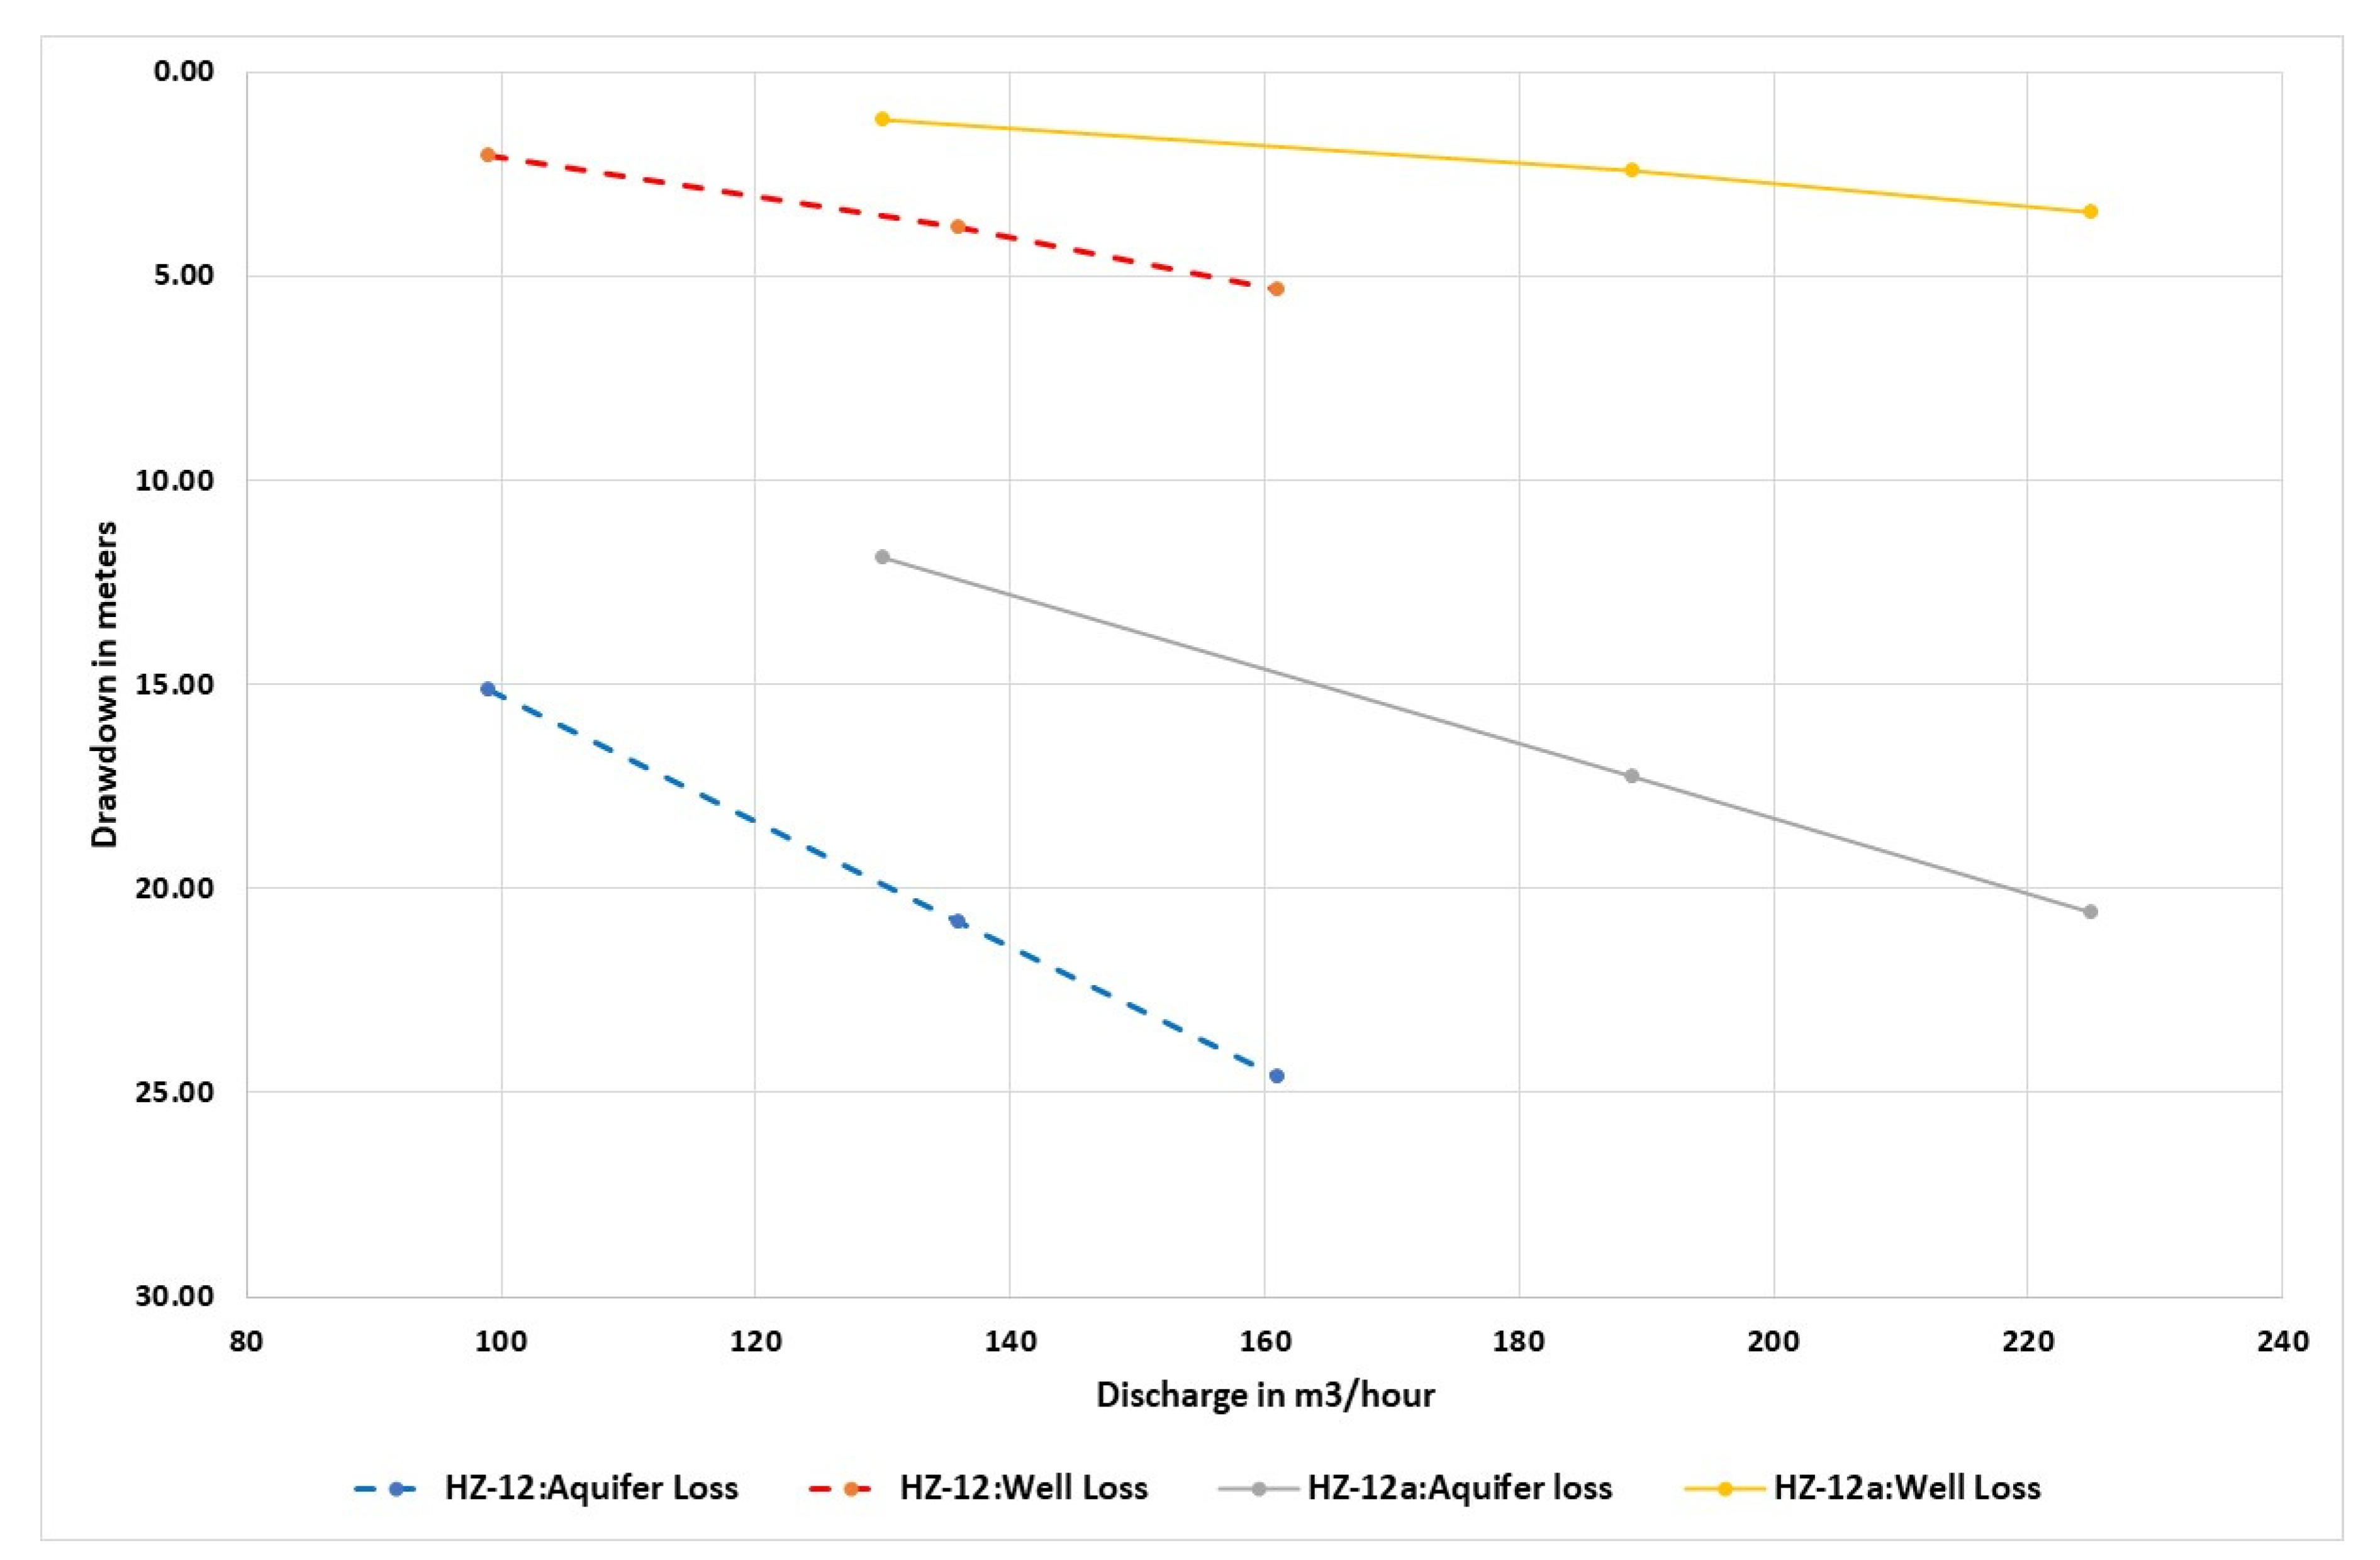
Figure 14.
SM-113 and SM-113a borehole description and design.
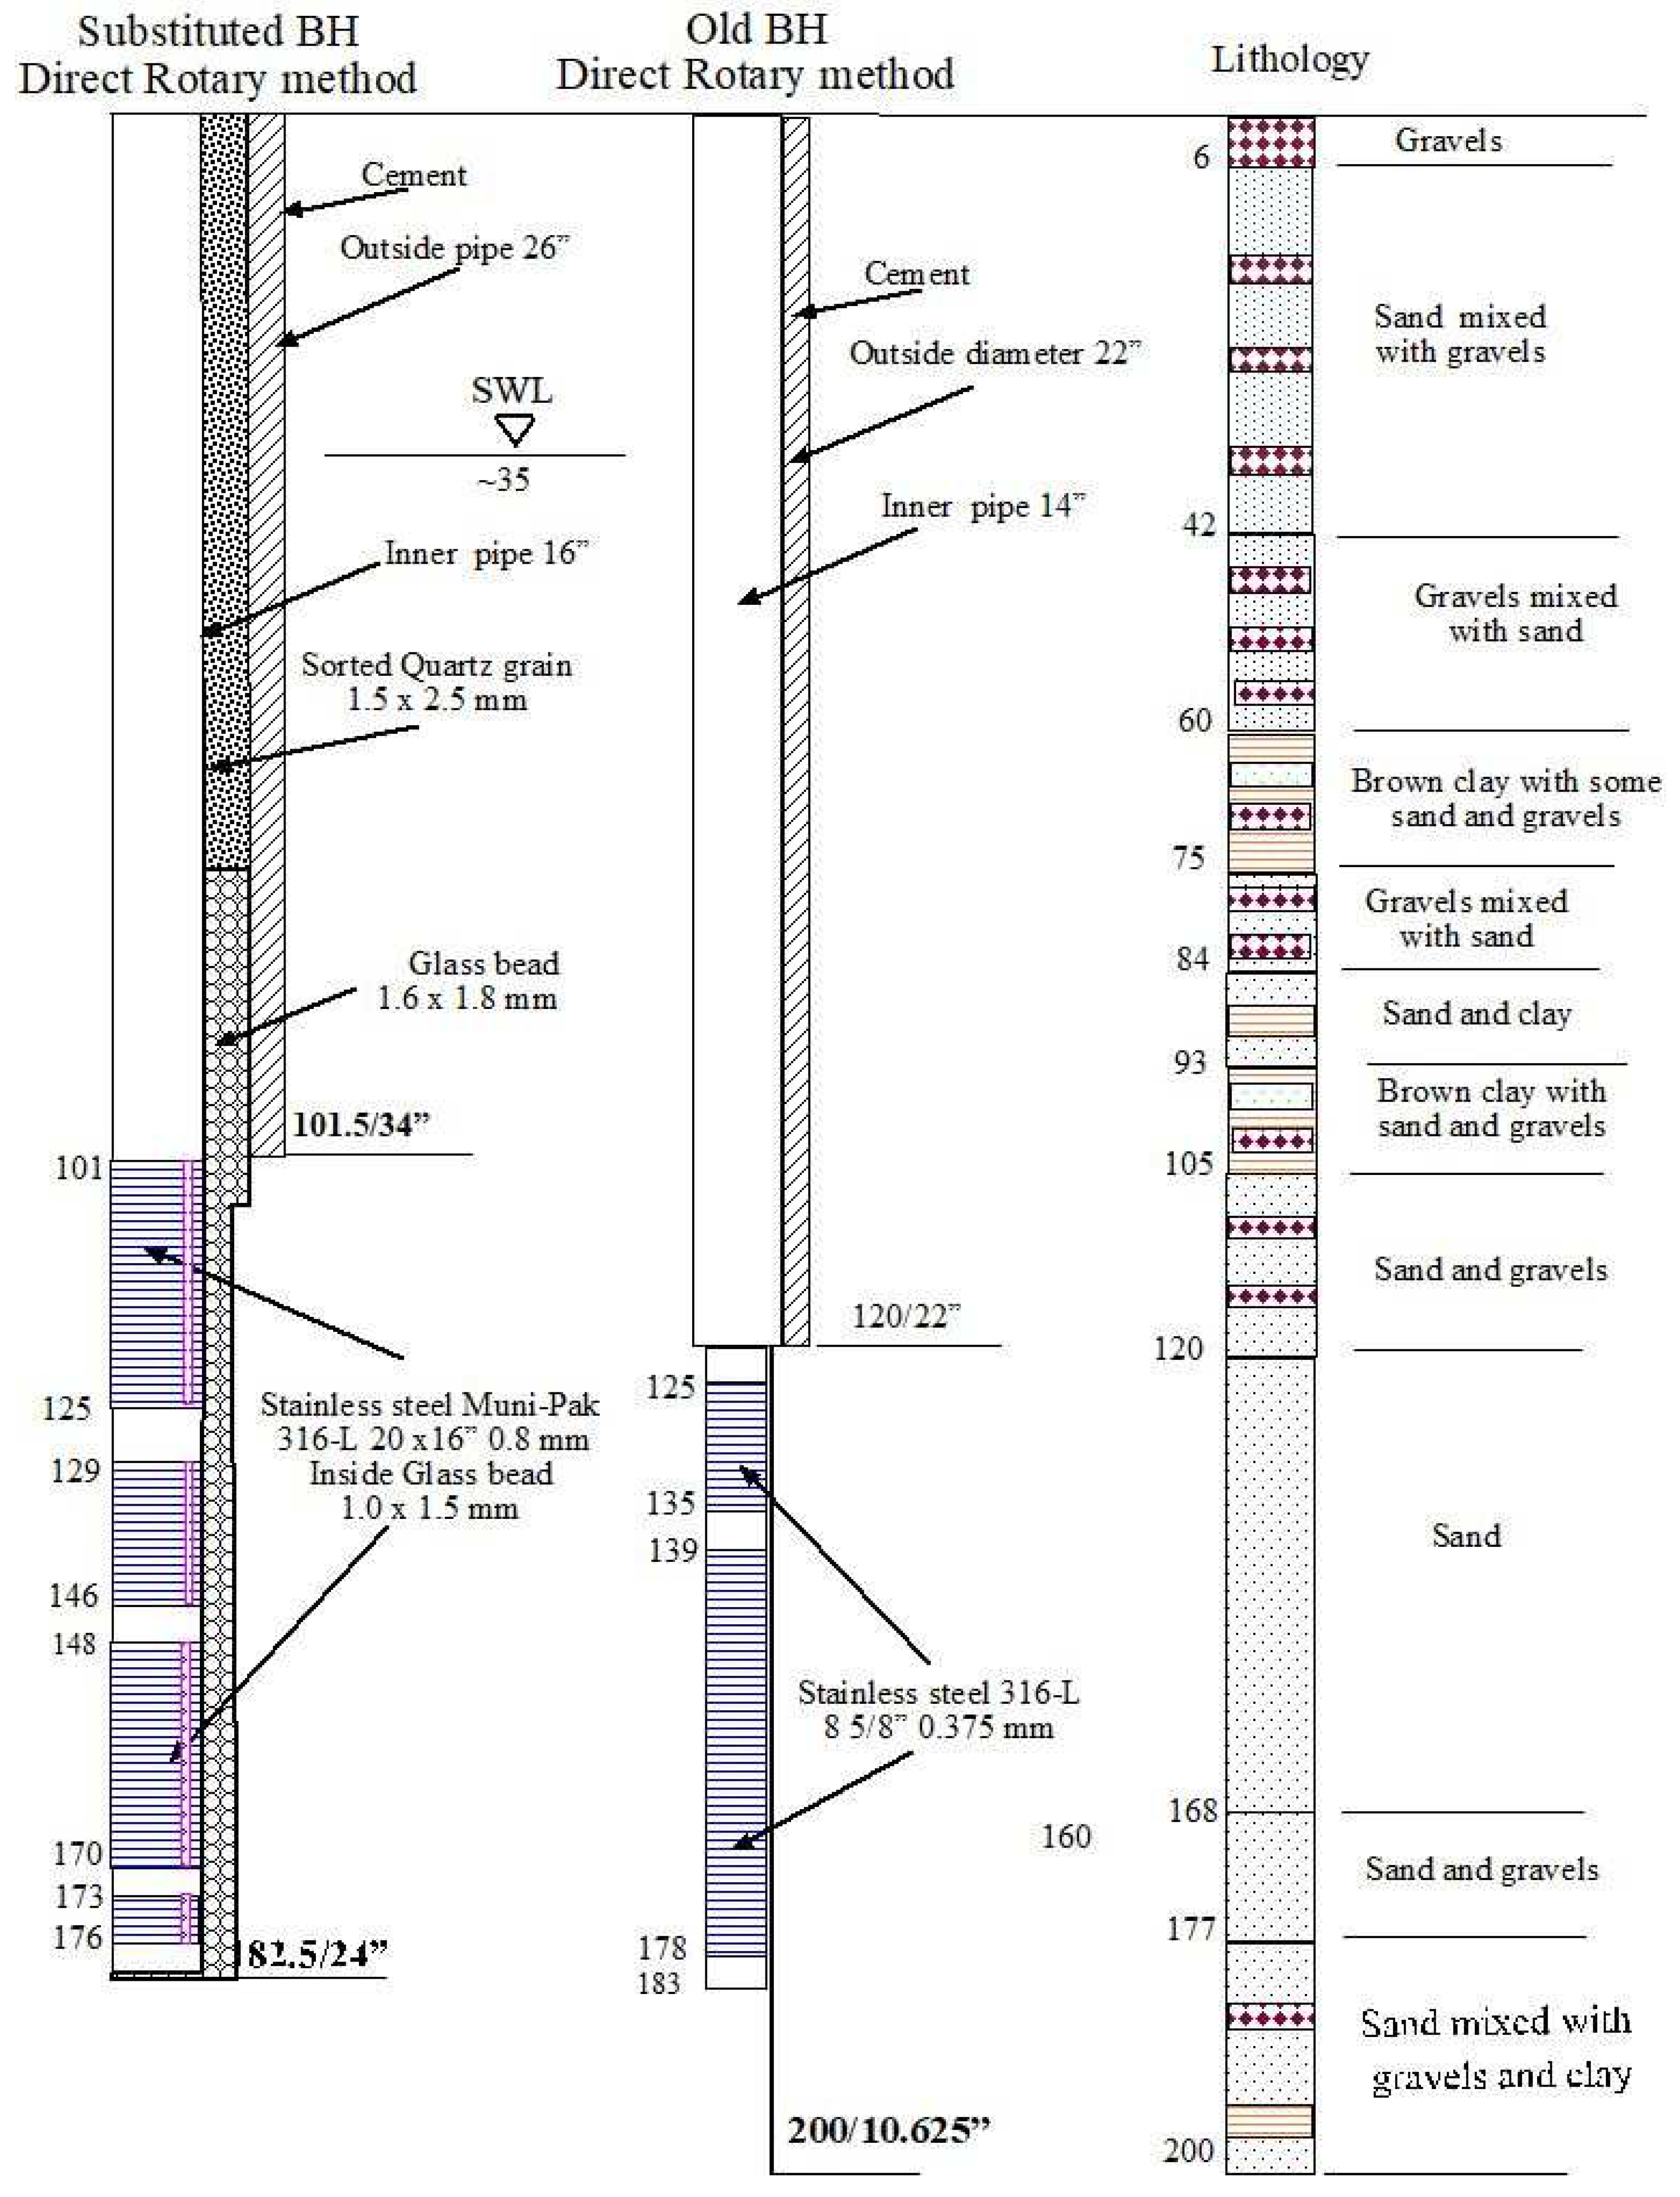
Figure 15.
The aquifer and well coefficients in SM-113 and SM-113a.
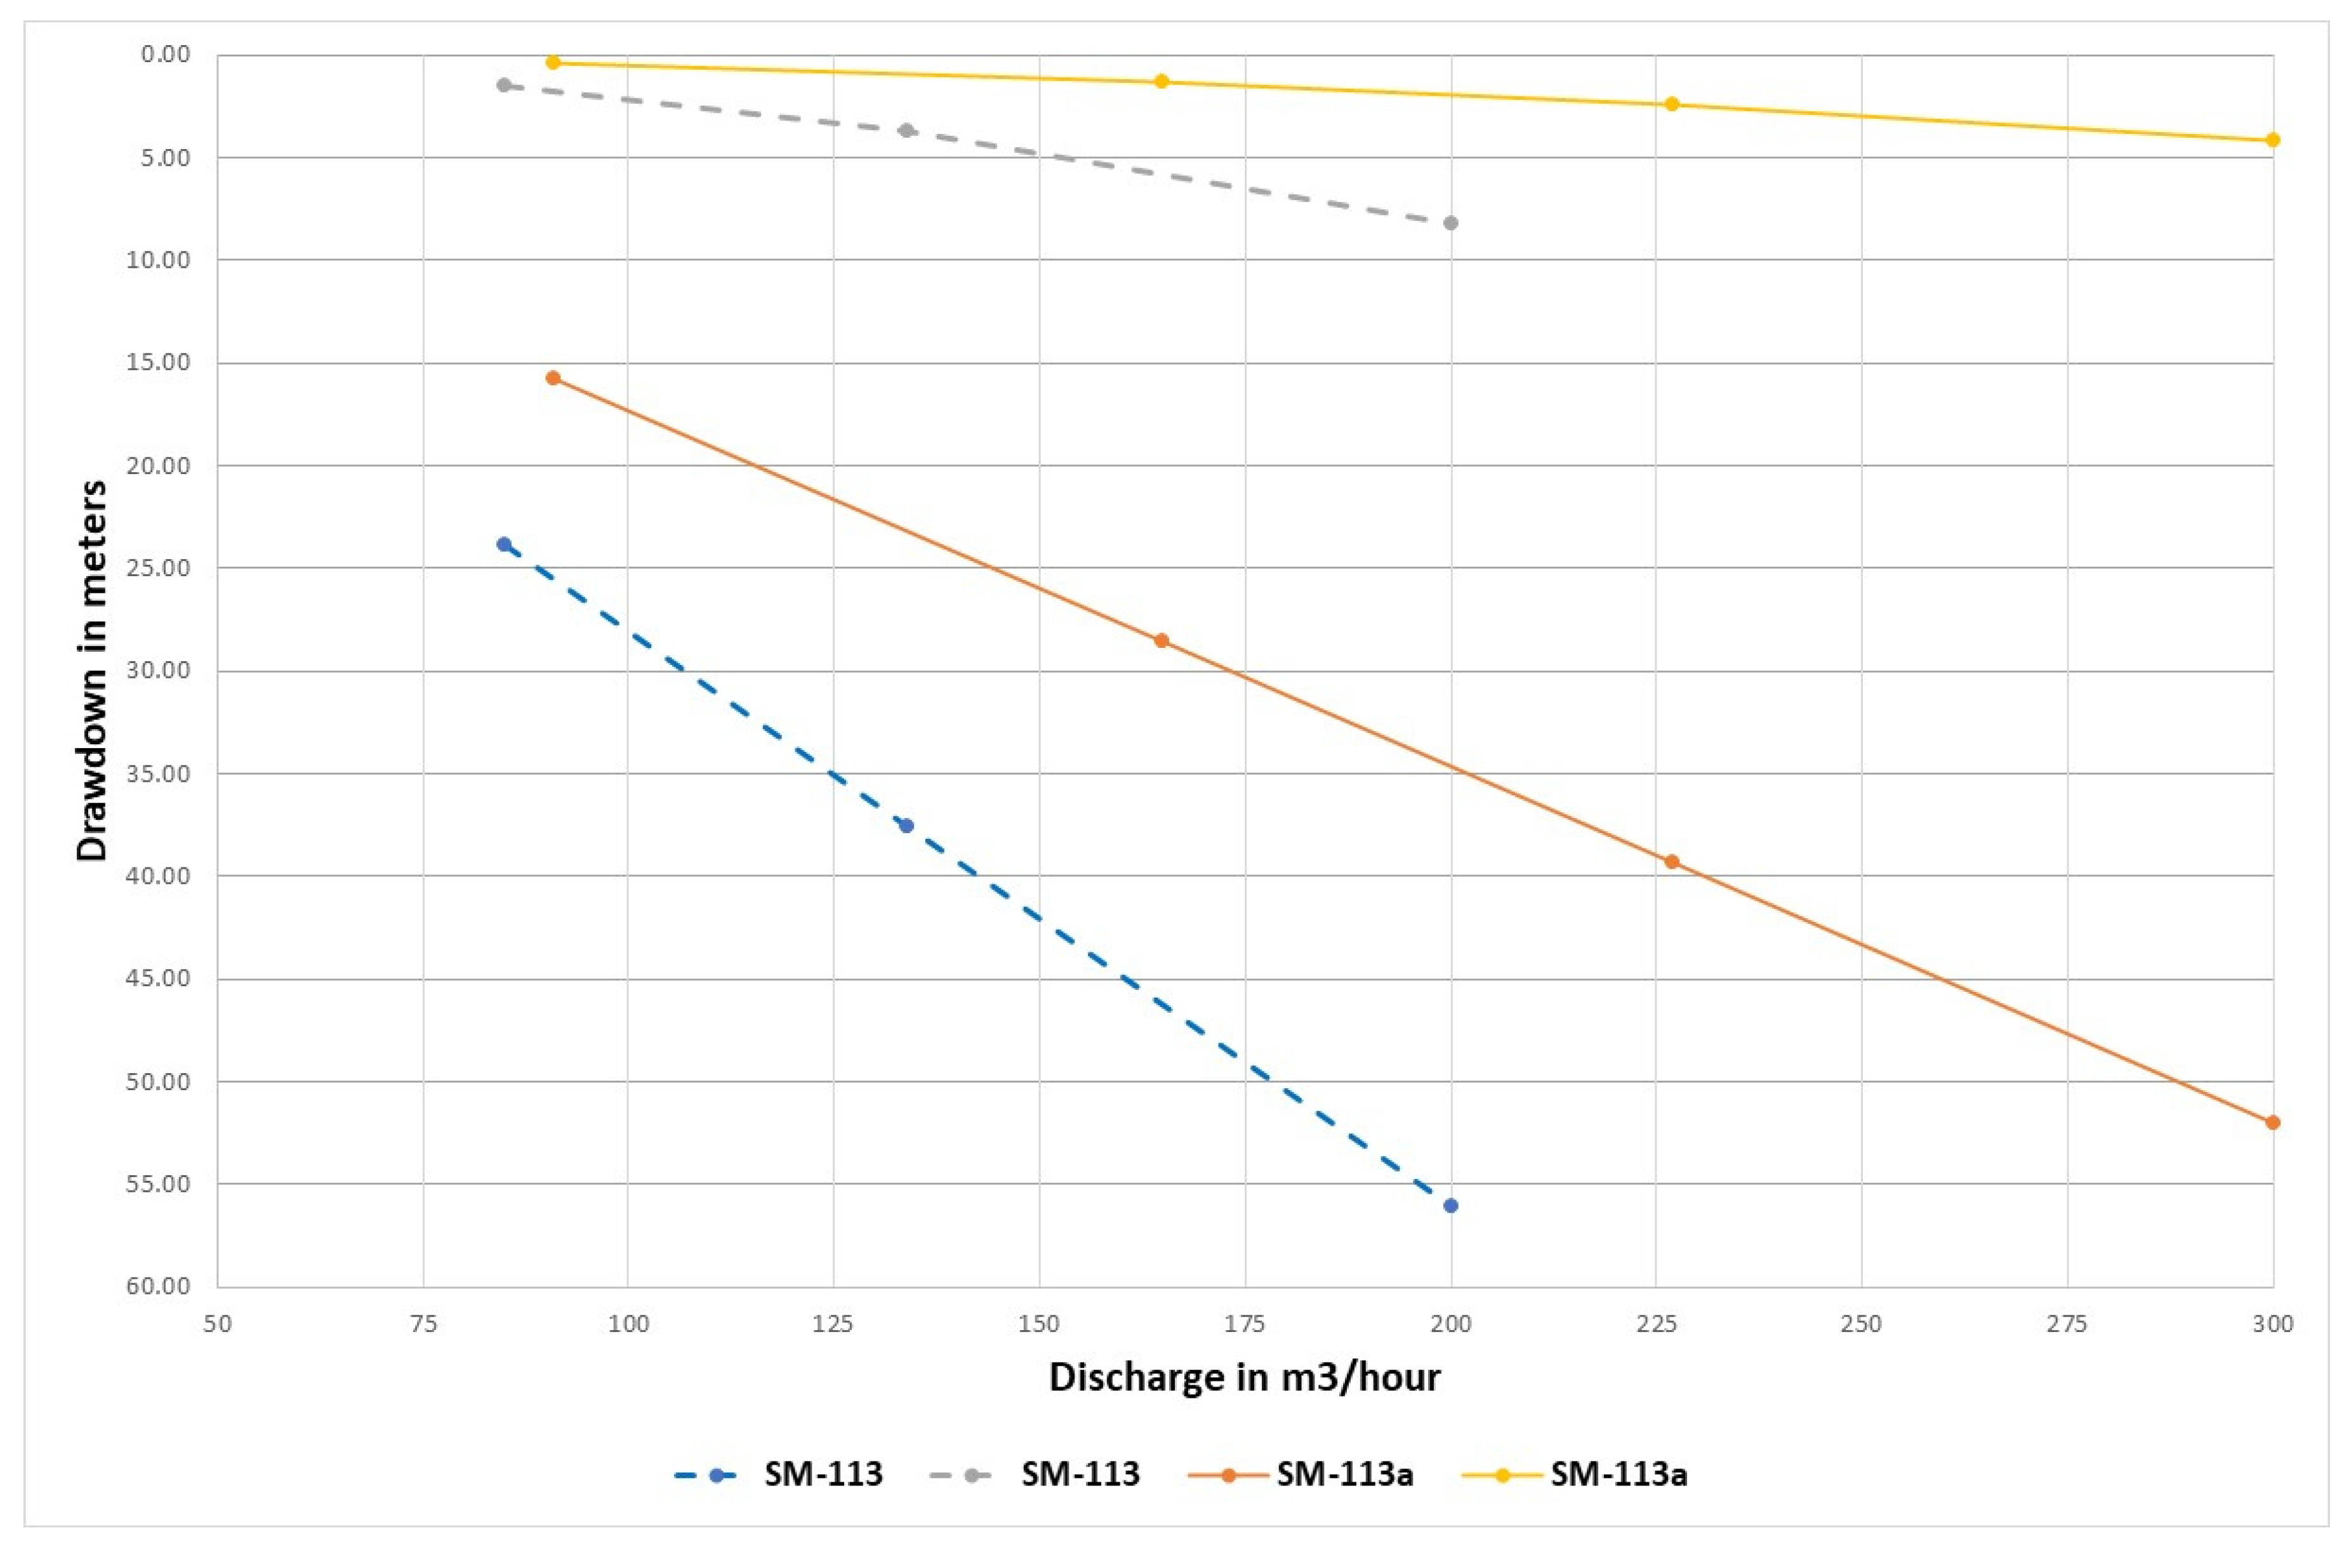

Table 1.
Comparison between the Step Drawdown Tests (SDT).
| YN-203 | |||||
| Discharge (m3/hour) | Drawdown (meter) | Specific yield (m3/hour/m) | Aquifer Loss: B (meter) | Well Loss: C (meter) | Efficiency (%) |
| 125 | 8.45 | 14.79 | 7.22 | 1.16 | 86.13 |
| 245 | 18.30 | 13.39 | 14.15 | 4.47 | 76.01 |
| 327 | 27.10 | 12.07 | 18.89 | 7.96 | 70.37 |
| YN-203a | |||||
| 185 | 9.55 | 19.37 | 8.24 | 1.26 | 86.77 |
| 231 | 12.12 | 19.06 | 10.28 | 1.96 | 84.01 |
| 281 | 15.44 | 18.20 | 12.51 | 2.90 | 81.19 |
| 322 | 18.17 | 17.72 | 14.33 | 3.80 | 79.03 |
Table 2.
Comparison between the Step Drawdown Tests (SDT).
| YN-219 | |||||
| Discharge (m3/hour) | Drawdown (meter) | Specific yield (m3/hour/m) | Aquifer Loss: B (meter) | Well Loss: C (meter) | Efficiency (%) |
| 98 | 9.05 | 10.83 | 8.75 | 0.34 | 96.24 |
| 160 | 15.30 | 10.46 | 14.29 | 0.91 | 94.01 |
| 242 | 23.70 | 10.21 | 21.61 | 2.08 | 91.21 |
| 338 | 34.20 | 9.88 | 30.19 | 4.07 | 88.13 |
| YN-219a | |||||
| 160 | 10.16 | 15.75 | 9.63 | 0.51 | 94.97 |
| 212 | 13.59 | 15.60 | 12.76 | 0.90 | 93.44 |
| 260 | 17.04 | 15.26 | 15.65 | 1.35 | 92.07 |
| 312 | 20.71 | 15.07 | 18.78 | 1.94 | 90.64 |
Table 3.
Comparison between the Step Drawdown Tests (SDT).
| YN-210 | |||||
| Discharge (m3/hour) | Drawdown (meter) | Specific yield (m3/hour/m) | Aquifer Loss: B (meter) | Well Loss: C (meter) | Efficiency (%) |
| 106 | 3.82 | 27.75 | 3.49 | 0.37 | 90.45 |
| 203 | 8.05 | 25.22 | 6.69 | 1.35 | 83.19 |
| 240 | 10.00 | 24.00 | 7.91 | 1.89 | 80.17 |
| 341 | 14.88 | 22.92 | 11.24 | 3.81 | 74.65 |
| YN-210a | |||||
| 200 | 13.72 | 14.58 | 13.44 | 0.33 | 97.59 |
| 244 | 16.95 | 14.40 | 16.39 | 0.49 | 97.08 |
| 300 | 20.96 | 14.31 | 20.16 | 0.75 | 96.43 |
| 350 | 24.46 | 14.31 | 23.52 | 1.02 | 95.86 |
Table 4.
Comparison between the Step Drawdown Tests (SDT).
| ID-7 | |||||
| Discharge (m3/hour) | Drawdown (meter) | Specific yield (m3/hour/m) | Aquifer Loss: B (meter) | Well Loss: C (meter) | Efficiency (%) |
| 99 | 12.60 | 7.86 | 11.49 | 1.17 | 90.74 |
| 185 | 25.80 | 7.17 | 21.46 | 4.09 | 83.98 |
| 254 | 37.00 | 6.86 | 29.47 | 7.72 | 79.25 |
| ID-7a | |||||
| 130 | 8.40 | 15.48 | 7.99 | 0.40 | 95.27 |
| 200 | 13.20 | 15.15 | 12.30 | 0.94 | 92.91 |
| 279 | 19.00 | 14.68 | 17.15 | 1.83 | 90.38 |
Table 5.
Comparison between the Step Drawdown Tests (SDT).
| HZ-12 | |||||
| Discharge (m3/hour) | Drawdown (meter) | Specific yield (m3/hour/m) | Aquifer Loss: B (meter) | Well Loss: C (meter) | Efficiency (%) |
| 99 | 17.16 | 5.77 | 15.14 | 2.01 | 88.26 |
| 136 | 24.59 | 5.53 | 20.80 | 3.80 | 84.56 |
| 161 | 29.96 | 5.37 | 24.63 | 5.32 | 82.22 |
| HZ-12a | |||||
| 130 | 13.10 | 9.92 | 11.88 | 1.14 | 91.24 |
| 189 | 19.40 | 9.74 | 17.28 | 2.41 | 87.75 |
| 225 | 24.20 | 9.30 | 20.57 | 3.42 | 85.75 |
Table 6.
Comparison between the Step Drawdown Tests (SDT).
| SM-113 | |||||
| Discharge (m3/hour) | Drawdown (meter) | Specific yield (m3/hour/m) | Aquifer Loss: B (meter) | Well Loss: C (meter) | Efficiency (%) |
| 85 | 24.60 | 3.46 | 23.81 | 1.48 | 94.13 |
| 134 | 40.00 | 3.35 | 37.54 | 3.69 | 91.05 |
| 200 | 60.75 | 3.29 | 56.03 | 8.22 | 87.21 |
| SM-113a | |||||
| 91 | 16.01 | 5.68 | 15.77 | 0.39 | 97.61 |
| 165 | 30.52 | 5.41 | 28.59 | 1.27 | 95.75 |
| 227 | 41.11 | 5.52 | 39.94 | 2.40 | 94.25 |
| 300 | 56.30 | 5.33 | 51.99 | 4.19 | 92.54 |
Disclaimer/Publisher’s Note: The statements, opinions and data contained in all publications are solely those of the individual author(s) and contributor(s) and not of MDPI and/or the editor(s). MDPI and/or the editor(s) disclaim responsibility for any injury to people or property resulting from any ideas, methods, instructions or products referred to in the content. |
© 2023 by the authors. Licensee MDPI, Basel, Switzerland. This article is an open access article distributed under the terms and conditions of the Creative Commons Attribution (CC BY) license (http://creativecommons.org/licenses/by/4.0/).
Copyright: This open access article is published under a Creative Commons CC BY 4.0 license, which permit the free download, distribution, and reuse, provided that the author and preprint are cited in any reuse.


