

Submitted:
11 September 2023
Posted:
13 September 2023
You are already at the latest version
Abstract
(1) Background: A history of TB is a known risk factor for long-term respiratory impairment affecting lung functions in both restrictive and obstructive lung disease. (2) Methods: We analyzed data from the NHANES 1 Epidemiologic Follow-up Study (NHEFS), a longitudinal study conducted on non-institutionalized adult US population, ages 25-74 years. Approximately 93 percent (n=13,383) of the cohort was successfully traced by the end of the survey period and was available for analysis. The final adjusted model included age groups, gender, family income, lifetime smoking, BMI, and frequency of alcohol consumption as potential confounders. (3) Results: Estimated hazards ratio of developing Emphysema during follow-up in individuals that had a past diagnosis of TB was 54% lower (95% CI = 0.35, 0.61) as compared to individuals with no past TB, after controlling for potential confounders and using proportional hazards regression appropriate to the complex sample design. The association, however, was not statistically significant (HR = 0.862, p-value = 0.38) when only self-reported history of TB was considered as the exposure. (4) Conclusion: Tuberculosis (self-reported or LTBI) was strongly (but inversely) associated with Emphysema incidence. The association was not statistically significant with only self-reported history of TB as exposure.
Keywords:
Tuberculosis (TB)
; emphysema
; Latent Tuberculosis Infection (LTBI)
; NHANES
1. Introduction
Pulmonary emphysema is a pathological term to describe abnormal and permanent dilatation of the airspaces distal to the terminal bronchioles and is often accompanied by destruction of the airspace walls and airflow limitation.[1] It is a subtype of Chronic Obstructive Pulmonary Disease (COPD) along with chronic bronchitis and can lead to persistent respiratory symptoms.[1] Tobacco smoking is known to be a major known cause of both Emphysema and COPD. Genetic factors such as α1-antitrypsin protein deficiency and telomere length have also been implicated,[2] although a 10-year case-control study found no association between emphysematous changes in lungs and telomere length. [3] The group of older (> 60 years of age), asymptomatic individuals with subclinical pulmonary emphysema were generally male, and smokers with low body mass index suggesting that age, sex, and BMI are important risk factors for subclinical emphysema.[3]
Tuberculosis (TB) is an infectious disease caused by Mycobacterium tuberculosis complex and can cause disease in almost any area of the body, but primarily affects the lungs. Although history of TB is a known risk factor for long-term respiratory impairment affecting lung functions in both restrictive and obstructive lung disease [4], there is minimal research associating it specifically to emphysema. The proposed pathological basis for the impairment of lung function and possible development of emphysema and COPD is chronic long-standing inflammatory response along with anatomical changes that occur with TB. [5,6]
Data from the annual Korean National Health and Nutrition Examination Surveys for adults 40 years and older was analyzed by Jung and colleagues. They found that a past history of physician-diagnosed prior pulmonary TB (mean of 29.0 years) was independently associated with impaired pulmonary lung function after adjusting for other risk factors such as age, gender, asthma diagnosis and smoking.[7] Similarly, Willcox and colleagues found evidence of airway obstruction in 48 (68.0%) of 71 subjects that had been successfully treated for TB up to 16 years prior to being assessed for pulmonary functions.[8] Another retrospective review of 1,784 COPD patients by Park et al. found that Tuberculosis negatively affects severity of obstructive lung disease. [9] Thus, most prior studies have assessed the association between symptomatic TB and emphysema or COPD.
Not everyone infected with Mycobacterium tuberculosis develops TB disease. Individuals with non-infectious Latent TB (LTBI) are asymptomatic and are identified only with a positive reaction to the Tuberculin Skin Test (TST) or interferon-γ release assay (IGRA) tests. The prevalence of LTBI as determined by TST measurements collected as part of the National Health and Nutrition Examination Survey (NHANES, 1999-2000) was estimated to be 4.2% in the non-institutionalized civilian population in United states. [10] In 2019, there were 8,916 reported TB cases in the United States alone, with an estimated 13 million people living with LTBI, and COPD remained the fourth common cause of death.[11] With the knowledge that the lifetime risk for LTBI individuals developing TB disease is known to be 5 to 10 percent [12], any association between history of TB (clinical or latent) and emphysema has clinical implications.
The objective of this analyses was to assess if a history of Tuberculosis (self-reported, or a diagnosis of LTBI at the time of initial interview and examination) was associated with increased risk of being diagnosed with Emphysema in the follow-up period while adjusting for commonly known confounders. We also assessed if there was association between the subgroup of self-reported TB (excluding LTBI) and development of emphysema. To our knowledge this is the first large retrospective cohort study using a well-established non-institutionalized cohort of US adults to study the association between history of clinical TB and/or presence of LTBI with development of emphysema during a 20-year follow-up period.
2. Materials and Methods
2.1. Study population
The NHANES I Epidemiologic Follow-up Study (NHEFS) is a longitudinal study conducted on the baseline adult population, ages 25 to 74 years who were examined in the first National Health and Nutrition Examination Survey (NHANES I). Approximately 93 percent (n=13,383) of the cohort was successfully traced by the end of the survey period. Comprising of four follow-up surveys, the first wave of data collection, the 1982-84 NHEFS, included all adults between 25 and 74 years at their NHANES I examination (n=14,407). The second wave of data collection in the 1986 NHEFS, included members of the NHEFS cohort who were 55-74 years at their baseline examination and not known to be deceased at the 1982-84 NHEFS (n=3,980). The 1987 NHEFS, was conducted for the entire non-deceased NHEFS cohort (n = 11,750). The final 1992 follow-up included the entire non-deceased cohort (n = 11,195).
The NHANES I (1971-1974) collected data from a national probability sample of the noninstitutionalized civilian United States population between the ages of 1 and 74 and includes standardized questionnaires and medical examination covering various health-related topics. Although the original sample was augmented in 1974-75, baseline medical examination and related information was available for only 14,407 (70 percent) and this was the cohort that was used in this study.
2.2. Identification of Emphysema cases at baseline for exclusion
The NHANES 1 survey and medical examination recorded chest x ray, spirometry, and self-reported emphysema where the subject reported having been told by their doctor that they had chronic bronchitis or emphysema. Individuals with the following criteria were identified as prevalent cases of emphysema and excluded from analysis at the beginning of the follow up period.
- An explicit presumptive diagnosis of emphysema on chest X ray readings.
- Possible evidence of emphysema with chest x ray findings combined with spirometry results not suggestive of restrictive lung disease.
- An obstructive pattern on spirometry with self-reported chronic bronchitis/emphysema
- All self-reported cases who reported they still have the condition, when the report could be corroborated with chest x ray.
A restrictive pattern on spirometry ruled out a diagnosis of emphysema. A detailed workflow diagram explaining this criterion is available in Supplemental Figure S1.
2.3. Identification of past or current Tuberculosis at baseline
The NHANES I survey asked the survey respondents about past or current Tuberculosis. Tuberculin tests were given only to a subset of the sample (n = 6,913). Participants with a history of a positive reaction tuberculosis, or Isoniazid (INH) prophylaxis were not given the tuberculin skin tests; it was assumed that persons in this group would have had a positive reaction if the test had been given. The simultaneous skin testing with the PPD-S tuberculin antigen and PPD-B antigen permitted differentiation between reactivity caused by infection with M. tuberculosis and the other Mycobacteria.[13] A positive tuberculin test is a reaction to PPD-S equal to or greater than 10 mm. in diameter, or a reaction to PPD-S of 5-9 mm. with the reading of PPD-S at least 2 mm. greater than the PPD-B reading. [13] 501 (3.8%) of the baseline cohort were thus identified as having past or current TB.
2.4. Other covariates measured at baseline
Of the characteristics measured at the NHANES 1 interview and examination, age, gender, race, family income, education level and number of individuals per room per household (proxy for overcrowding), urban vs. rural (proxy to air pollution) were some of the demographic variables analyzed as covariates. We also analyzed current/lifetime smoking and frequency of alcohol consumption. There are several risk factors such as a history of respiratory conditions during childhood, Vitamin D intake, occupational exposure to mineral and cotton dust that have been associated with obstructive lung disease, TB or both. These were not assessed in this study since this information was unavailable in the NHANES data. Although not directly associated with emphysema, some studies have found substantial correlations between airway obstruction and physical activity while other studies have been unable to establish the same relationship. [14,15]
2.5. Identification of incident cases
Incident cases of Emphysema were ascertained using response from interview, health care facility medical records for those that reported having had an overnight stay in a health care facility after their initial interview or examination, and death certificates. The followed-up cohort excluded individuals with emphysema diagnosis at the time of their initial survey or medical exam.
For the 1982-84 follow up interview, interviews with the participant or a proxy were completed for 12,220 (85 % of the original cohort). If the subject self-reported being told they have emphysema, they were asked for the year they were first told they had the condition and if, since 1970, they had stayed overnight in a hospital for the condition (emphysema in this case). The question was not asked on the 1986, 1987 or 1992 follow-up interviews. Emphysema cases for these years were determined using information available in facility files or death certificates. Incidence in our study population was similar to other estimates. [16,17]
To extract cases of Emphysema from the health care facility files, we conducted a character string search for “Emphysema” on all condition codes. On the death records, incidence cases were individuals identified with emphysema as an underlying cause of death (ICD-9 codes of 492, 496). Any individual with a date of diagnosis after the first initial interview and examination was included as an incidence case.
2.6. Analytical methods
Data was analyzed using SAS 9.4 (SAS institute Inc., Cary, NC) software for all analyses. Proc survey logistic method was used to calculate populate estimates. Sample weights, stratification, and clustering, given the complex survey design of NHANES I, were used to calculate population estimates and their standard errors. [18] All two-tailed p-values for the bivariate analysis are based on population estimates; a value of 0.05 or less was considered significant. For continuous variables, after testing for normality, the means in the groups were compared using the t tests. To generate p-values for categorical variables we used either Chi-square or the CMH (Cochran–Mantel–Haenszel) depending on the number of levels of the independent variable.
Past or current of TB was determined at baseline. For incidence cases of Emphysema, length of follow-up was calculated in months between diagnosis date and date of initial exam. Censoring time was date of death when the subject died due to an underlying cause other than emphysema or last date of follow up when lost to follow up. Individuals whose follow-up period ended before Jan 1st, 1992, were coded as censored. The final vital status as of the 1992 interview is shown on Table 1 [19]
The “Other” race category had only 5 cases of emphysema and was combined with the “African American” race category. For each predictor variable, the group with the lowest risk category was used as the reference group. The covariates considered for inclusion during model building were race (reference =“White”), age groups in 10-year increments (reference = “25-34 years”), education level (reference = “One year college or more”), lifetime smoking of greater than 100 cigarettes, BMI category (reference = “Normal”), Gender activity (reference = “Male”), family income (reference = “$25,000 and over”) and region (reference =“Northeast”). Confounding at the stage of analysis was controlled using a multivariable Cox proportional hazards regression model using the SAS SURVEYPHREG procedure that incorporated the complex survey design and sampling weights. Backward and stepwise selection methods were employed to determine which variable to include in the final model. Terms were included in the final model if they were statistically significant at p <0.05 or if the goodness of fit statistics decreased by a significant amount. The variables in the final model were explored for possible confounding and effect modification.
The adjusted model included age groups, gender, family income, lifetime smoking, BMI and alcohol consumption frequency categorized as heavy drinking versus moderate/rare drinking and a reference group of individuals that reported never drinking. Interaction was explored by utilizing appropriate interaction terms within the proportional hazards model. The interaction term was retained in the final model only if it was significant with a p-value of < 0.05.
3. Results
The final sample size after excluding 1,067 prevalent cases of emphysema was 13,340. Using the criteria described in detail in the methods section, 994 new cases of emphysema were identified during the 20 years follow up period ending in 1992. The number of new cases by year of follow-up is shown in Table 2. The mean length of follow up was 221.8 months with standard error of ± 0.3 months. (Data not shown)
Characteristics on Table 3 reflect the population-based estimated percentages for categorical variables incorporating survey design specifications (adjusted weights, stratification, multistage cluster sampling) including oversampling of certain population in the NHANES cohort. The group that developed emphysema during follow-up includes significantly higher proportion of whites (94.3% vs. 88.5%) and a significantly lower proportion of African Americans (5.4% vs. 10.2%). They were also slightly older, reported more lifetime smoking (77.6% vs.59.8%), were lesser educated with less reported family income than the group that did not develop emphysema. The groups were not significantly different by gender, urban versus rural, region, type of living quarters (housing units or other). The groups were similar in the proportion of individuals diagnosed with past or current TB (3.6% vs. 2.9%, p-value = 0.418). Number of people per room per household was used as a proxy for overcrowding and individuals living in house with a range or cookstove as a proxy for indoor air pollutant exposure. However, a fifth of the responses in both these categories were missing. Majority (> 99.0%) of the individuals who did respond said yes to having a range/cooking stove at home, thus reducing the likelihood of pollution from that source. Similarly, the median number of people per household was 3 and hence we concluded that household crowding was not a major factor in our analysis. These variables during bivariate analysis were therefore not included in the multivariable analysis.
The unadjusted model exploring the association between TB and new diagnosis of emphysema was significant (Hazard ratio =0.51; p-value <0.0001). The association was significant even after adjusting for all relevant factors (Hazard ratio = 0.46). The association, however, was no longer statistically significant (HR = 0.862, p-value = 0.38) when only self-reported history of TB was considered as the exposure.
Based on multivariable proportional hazards regression for complex survey design, the population-estimated hazards ratio of developing Emphysema during follow-up in individuals that had a past diagnosis of TB was 54% lower (95% CI = 0.35, 0.61) as compared to individuals with no past TB, after controlling for gender, age, family income, lifetime smoking (>100 cigarettes), alcohol consumption and BMI. (Table 4) Females had a 19% greater likelihood of developing emphysema compared to males and individuals who reported smoking at least 100 or more cigarettes in their lifetime were 12 % more likely to develop emphysema compared to individuals who smoked lesser than 100 cigarettes. Having a family income of less than $25,000 was associated with a lower hazard of developing emphysema, even in families in the lowest income category. Alcohol consumption was not a significant predictor for emphysema risk. However, adding it to the model reduced the goodness of fit statistics by a significant amount, so the variable was included in the final model. Heavy drinking was defined as drinking every day, just about every day or 2-3 times a week. Heavy drinking is known to reduce levels of glutathione, an antioxidant that protect your lungs from smoke damage. Besides, regular drinking can also damage the muco-ciliary transport system, which impedes clearing of mucus other contaminants.[20]
Low BMI (<18.5 lb./inch2) was associated with reduced hazard of being diagnosed with emphysema in the future by 56% (HR = 0.44, 95% CI = 0.38, 0.51). High BMI (>25 lb./inch2) on the other hand increased the risk slightly by 11% (HR = 1.11, 95% CI = 1.02, 1.21). Subjects in the age group 45-54 years were slightly protected with a hazard ratio of 0.89(95% CI = 0.82,0.97) and subjects in the age group 65 and older at baseline were at slightly higher risk when compared to the youngest age group of 25-34 years. This risk distribution makes sense since the risk of emphysema due to a TB diagnosis will remain high in younger age groups that may be diagnosed with TB disease at a younger age. None of the other age groups displayed statistically significant difference in the risk of emphysema.
We observed a significant interaction between BMI category and past TB. Figure 1 depicts the survival probability of event (develop emphysema) by BMI categories. As seen in the figure individuals with a lower BMI developed Emphysema significantly later than those who were normal, overweight or obese. Since weight loss can sometimes improve breathing, this is one way that the clinical diagnosis may be delayed. However, further analysis on this effect heterogeneity is necessary to understand the biological mechanism behind the effect.
4. Discussion
Tuberculosis (self-reported or LTBI) was strongly (but inversely) associated with Emphysema incidence in non-institutionalized adult US population after adjusting for factors including lifetime smoking exposure, age, gender, family income, alcohol consumption and BMI. The direction of association seems to contradict our prior knowledge of the biological basis of developing obstructive/ restrictive lung disease after developing TB. Several population-based studies have demonstrated that a history of TB increases risk for airflow obstruction and COPD. [6,21] Our findings may partially reflect the heterogeneity in lung damage seen after TB that is attributed to host immune response to the infection. [22] Pulmonary function testing in individuals with TB demonstrate variable patterns as well as severity of impairment.[22]
Another possible explanation for this finding could be that a large majority (63.3%) of the 567 TB cases at baseline were latent TB infection (LTBI) diagnosed based on tuberculin testing rather than clinical symptoms or chest x-ray findings. Survey respondents that self-reported being told they have or had TB, did not have a higher risk of developing Emphysema when compared to those who reported never being told they have or had TB (HR = 0.862, p-value = 0.38).
Pasipanodya et al. conducted a prospective case-control study comparing pulmonary function tests for 107 patients with pulmonary tuberculosis who had completed at least 20 weeks of therapy, and a control group of 210 individuals with LTBI. [23] Interestingly, after adjusting for several risk factors, they found that the group with TB were 5.4 times more likely to have abnormal pulmonary function test results when compared to the LTBI group (p > 0.001; 95% CI = 2.98 to 9.68). What was also interesting was that their findings indicated that older subjects born in the United States were more likely to have lung function impairment than were younger or foreign-born subjects.[23] It is possible that the very diagnosis of LTBI may promote behavioral modifications to decrease exposure to noxious stimuli that might further decrease any lung functionality. There is also the possibility of residual confounding from smoking. Although lifetime smoking was adjusted for in the final model, current smoking and smoking exposure in the follow-up period just prior to the diagnosis of emphysema was not assessed.
Subjects who reported having smoked at least 100 or more cigarettes in their lifetime were at higher risk of developing emphysema at follow-up after controlling for the other factors. Information on family history of lung diseases and exposure to secondhand smoking were not available in NHANES 1. Given that secondhand smoke exposure and its effects on lung function are poorly defined and understood, we decided to not use secondhand smoke in our analysis.
We were also limited by being unable to study the presence of α1-antitrypsin protein deficiency which are now known to be implicated with an earlier onset of COPD, disproportionate to their smoking history and other genetic factors such as telomere length.[2] Telomeres are nucleoprotein structures at the end of each chromosome that protect the chromosomal ends from degradation. Although the length is genetically determined, there is progressive shortening with cell division and short telomeres are considered a marker of aging in cells. A 2011 study in mice indicated that short telomeres lower the threshold of smoking induced lung damage, thus raising the potential for telomere length as a genetic susceptibility factor in age-related onset of emphysema.[24]
TB cases beyond the baseline interview and examination were not assessed. We assumed that even if there were a few individuals diagnosed with TB during follow-up, it likely would not affect their risk of being diagnosed with emphysema during the follow-up period ending in 1992. It is a slow and variable process from the initial pathophysiological response from TB leading to the development to destruction of the lung tissue eventually resulting in emphysema.
Another limitation is incomplete ascertainment of outcome since follow-up questionnaire did not ask the specific question about self-reported emphysema or TB after the 1986-87 follow up. Events of emphysema diagnosis after the 1986-87 survey were ascertained using medical records from an overnight stay at a health care facility. So, we were only able to capture cases of emphysema that were severe enough to require at least an overnight stay. Very few incidence cases of emphysema are diagnosed by a visit to health care facility and attempting to identify new cases via just a health care facility data is an underestimate of the actual incidence. As mentioned in a previous section, data for 7,180 COPD patients obtained from the 2012 Behavioral Risk Factor Surveillance System (BRFSS) survey revealed that among diagnosed COPD patients, only 16.5% had ED visits or hospitalization in the previous year.[16] However, the incidence in our population (7.4%) is close to, or even slightly higher than the 2018 US CDC estimated combined prevalence of chronic bronchitis and emphysema (5.2%) based on self-reporting. [17]
This study has several strengths. To our knowledge this is one of the first population based follow up large case cohort study of its kind to assess this association. The NHANES I data provide a wealth of information on the prevalence of health conditions and risk factors, and the NHEFS data is extremely useful when investigating the association between factors measured at the baseline and the development of specific health conditions during the 20-year follow-up information available. The NHANES I and NHEFS have been designed and documented extensively, with every step taken to reduce loss to follow-up thus minimizing bias. The spirometry, chest x ray, tuberculin testing and other factors based on body measurements and laboratory data were all conducted with standardized and validated methods to the extent possible.
Females were 1.19 times more likely to develop emphysema during follow-up. As per CDC, there are several reasons why COPD might affect women differently than men. Delayed diagnosis in females and their greater vulnerability to the effects of tobacco and other harmful substances, such as indoor air pollution are just a few possible explanations for the effect. Women who smoke tend to get COPD at younger ages and with lower levels of smoking than men who smoke. [25] Delayed diagnoses associated with more advanced disease at diagnosis and less effective treatment strategies may also explain the reason for differential response to treatment and higher mortality in females. [25]
Significant interaction by BMI category requires further research to explore and explain the role of BMI as an effect modifier for the association of TB and Emphysema. Undernutrition is a known risk factor for development of TB, and conversely, active TB itself causes wasting. [26] Similarly, individuals who develop emphysema are prone to weight loss leading to low BMI (<18.5kg/m2). [27] Being overweight and obese, however, is not a predisposing factor for the development of emphysema. [27]
This study has implications beyond Emphysema incidence in the US population. The burden of TB disease is extremely high in countries outsides US. The bacteria have survived for over 10s and 1000s of years [28] and in 2017, estimated to have infected nearly 2 billion people worldwide. More than 10 million new cases of TB are diagnosed each year, and a large proportion of the world’s population are latent carriers with risk for developing active disease in the future. [28] With ever increasing air pollution, increasing respiratory illnesses in childhood, any association between history of TB and emphysema has clinical implications. In countries and communities where TB, pollution and undernutrition are prevalent, the cases of obstructive lung diseases attributable to TB can be substantial and need to be addressed urgently.
Supplementary Materials
The following supporting information can be downloaded at the website of this paper posted on Preprints.org, Supplementary Figure S1: Decision tree model depicting how prevalent cases of emphysema were determined at baseline, combining self-reporting, chest X-ray findings, and spirometry results.
Author Contributions
Conceptualization, A.J.; methodology A.J.; formal analysis, A.J.; writing—original draft preparation, A.J.; critical review and editing, A.J., LJ Su, MS O. All authors have read and agreed to the published version of the manuscript.
Funding
This research received no external funding.
Institutional Review Board Statement
Not applicable.
Informed Consent Statement
Not applicable.
Data Availability Statement
Analyzed datasets can be made available upon approval, if required. Publicly available NHANES 1 and NHEFS datasets were used for the analysis and can be accessed at:. Publicly available datasets were analyzed in this study. This data can be found here: NHANES I (1971-1974) (cdc.gov) and NHANES I - Epidemiologic Followup Study (NHEFS) (cdc.gov).
Acknowledgments
The authors would like to acknowledge and thank Manish Joshi (Professor, Pulmonary and Critical Care Medicine, UAMS) for his clinical input relevant to the study.
Conflicts of Interest
The authors declare no conflict of interest.
Appendix A
| Rule -based decision mapping for Emphysema combining information from chest X-ray findings, spirometry results and self-reporting to determine if the individual subjects had Emphysema at the time of study initiation. |
|
|
|
|
References
- Global Strategy for the Diagnosis, Management, and Prevention of Chronic Obstructive Pulmonary Disease 2006 Global Initiative for Chronic Obstructive Lung Disease. Available online: www.goldcopd.org (accessed on 29 October 2021).
- Needham, M.; Stockley, R.A. Alpha 1-Antitrypsin deficiency·3: Clinical manifestations and natural history. Thorax 2004, 59, 441–445. [Google Scholar] [CrossRef] [PubMed]
- Buendia-Roldan, I.; Palma-Lopez, A.; Chan-Padilla, D.; Herrera, I.; Maldonado, M.; Fernández, R.; Martínez-Briseño, D.; Mejia, M.; Selman, M. Risk factors associated with the detection of pulmonary emphysema in older asymptomatic respiratory subjects. BMC Pulm Med 2020, 20, 1–6. [Google Scholar] [CrossRef]
- Ravimohan, S.; Kornfeld, H.; Weissman, D.; Bisson, G.P. Tuberculosis and lung damage: from epidemiology to pathophysiology. Eur Respir Rev. 2018, 27. [Google Scholar] [CrossRef]
- Jin, J.; Li, S.; Yu. W.; Liu, X.; Sun, Y. Emphysema and bronchiectasis in COPD patients with previous pulmonary tuberculosis: Computed tomography features and clinical implications. Int J COPD 2018, 13, 375–384. [Google Scholar] [CrossRef]
- Amaral, A.F.S.; Coton, S.; Kato, B.; Tan, W. C.; Studnicka, M.; Janson, C.; Gislason, T.; Mannino, D.; Bateman, E. D.; Buist, S.; Burney, P. G.; BOLD Collaborative Research Group. Tuberculosis associates with both airflow obstruction and low lung function : BOLD results. The European respiratory journal 2016, 46, 1104–1112. [Google Scholar] [CrossRef]
- Jung, J.W.; Choi, J.C.; Shin, J.W.; Kim, J.Y.; Choi, B.W.; Park, I.W. Pulmonary impairment in tuberculosis survivors: The Korean National Health and Nutrition Examination Survey 2008-2012. PLoS One. 2015, 10, e0141230. [Google Scholar] [CrossRef]
- Willcox, P.A.; Ferguson, A.D. Chronic obstructive airways disease following treated pulmonary tuberculosis. Respir Med. 1989, 83, 195–198. [Google Scholar] [CrossRef]
- Park, H.J.; Byun, M.K.; Kim, H.J.; Ahn, C.M.; Kim, D. K.; Kim, Y. I.; Oh, J. Y.; Yoon, H. K.; Yoo, K. H.; & Jung, K. S.; & Jung, K. S. History of pulmonary tuberculosis affects the severity and clinical outcomes of COPD. Respirology 2018, 23, 100–106. [Google Scholar] [CrossRef]
- Bennett, D.E.; Courval, J.M.; Onorato, I.; Agerton, T.; Gibson, J. D.; Lambert, L.; McQuillan, G. M.; Lewis, B.; Navin, T. R.; Castro, K. G. Prevalence of tuberculosis infection in the United States population: The national health and nutrition examination survey, 1999-2000. Am J Respir Crit Care Med. 2008, 177, 348–355. [Google Scholar] [CrossRef]
- Kochanek, K.D.; Xu, J.; Arias, E. Key findings Data from the National Vital Statistics System How long can we expect to live? 2019 Available online:. Available online: https://www.cdc.gov/nchs/products/index.htm. (accessed on 29 October 2021).
- Data & Statistics | TB | CDC. Available online: https://www.cdc.gov/tb/statistics/default.htm (accessed on 23 September 2021).
- Engel, A.; Roberts, J. Vital and Health Statistics. Tuberculin Skin Test Reaction Among Adults 25-74 Years: United States, 1971–1972. National Center for Health Statistics. Vital Health Stat, July 1977 Series 11 (Number 204). P88-228119. PC A03 MF A01.
- Zuwallack, R.; Esteban, C. Understanding the impact of physical activity in COPD outcomes: moving forward. The European respiratory journal 2014, 44, 1107–1109. [Google Scholar] [CrossRef]
- Mihaltan, F.; Adir, Y.; Antczak, A.; Porpodis, K.; Radulovic, V.; Pires, N.; de Vries, G.J.; Horner, A.; De Bontridder, S.; Chen, Y.; Shavit, A.; Alecu, S.; Adamek, L. Importance of the relationship between symptoms and self-reported physical activity level in stable COPD based on the results from the SPACE study. Respir Res. 2019, 20. [Google Scholar] [CrossRef]
- National Center for Health Statistics Center for Disease Control and Prevention. Analytic and Reporting Guidelines 2006. The National Health and Nutrition Examination Survey (NHANES). Available online: http://www.cdc.gov/nchs/nhanes/nhanes2003-2004/analytical_guidelines.htm.
- NHANES I Epidemiologic Followup Study, 1992 Vital and Tracing Status. Public Use Data Tape Documentation Available online:NHANES I - Epidemiologic Followup Study(NHEFS)(cdc.gov).
- National Emphysema Foundation - How Alcohol is Linked to COPD. Available online: https://www.emphysemafoundation.org/index.php/news-and-events/archives/83-copd-emphysema-articles/482-how-alcohol-is-linked-to-copd (accessed on 26 November 2021).
- Byrne, A.L.; Marais, B.J.; Mitnick, C.D.; Lecca, L.; Marks, G.B. Tuberculosis and chronic respiratory disease: a systematic review. Int J Infect Dis. 2015, 32, 138–146. [Google Scholar] [CrossRef]
- Hunter, R.L. Pathology of post primary tuberculosis of the Lung: An illustrated critical review. Tuberculosis (Edinb) 2011, 91, 497. [Google Scholar] [CrossRef]
- Pasipanodya, J.G.; Miller, T.L.; Vecino, M.; Munguia, G.; Garmon, R.; Bae, S.; Drewyer, G.; Weis, S. E. Pulmonary Impairment After Tuberculosis. Chest. 2007, 131, 1817–1824. [Google Scholar] [CrossRef]
- Alder, J.K.; Guo, N.; Kembou, F.; Parry, E.M.; Anderson, C.J.; Gorgy, A.I.; Walsh, M.F.; Sussan, T.; Biswal, S.; Mitzner, W.; Tuder, R.M.; Armanios, M. Telomere Length Is a Determinant of Emphysema Susceptibility. Am J Respir Crit Care Med. 2011, 184, 904–912, Epub 2011 Jul 14. PMID: 21757622 PMCID:PMC3208661. [Google Scholar] [CrossRef]
- Kumbhare, S.D.; Beiko, T.; Wilcox, S.R.; Strange, C. Characteristics of COPD patients using United States emergency care or hospitalization. Chronic Obstr Pulm Dis (Miami) 2016, 3, 539–548. [Google Scholar] [CrossRef]
- COPD Prevalence | American Lung Association. Available online: https://www.lung.org/research/trends-in-lung-disease/copd-trends-brief/copd-prevalence (accessed on 26 November 2021).
- CDC - Basics About COPD - Chronic Obstructive Pulmonary Disease (COPD). Available online: https://www.cdc.gov/copd/basics-about.html (accessed on 5 December 2021).
- Lonnroth, K.; Williams, B.G.; Cegielski, P.; Dye, C. A consistent log-linear relationship between tuberculosis incidence and body mass index. Int J Epidemiol 2010, 39, 149–155. [Google Scholar] [CrossRef]
- Guerra, S.; Sherrill, D.L.; Bobadilla, A.; Martinez, F.D.; Barbee, R.A. The relation of body mass index to asthma, chronic bronchitis, and emphysema. Chest. 2002, 122, 1256–1263. [Google Scholar] [CrossRef]
- Barberis, I.; Bragazzi, N.L.; Galluzzo, L.; Martini, M. The history of tuberculosis: from the first historical records to the isolation of Koch’s bacillus. J Prev Med Hyg. 5: online 2017, 2017; 58, E9–E12. [Google Scholar]
Figure 1.
Survival probability (risk of developing Emphysema) by BMI category.
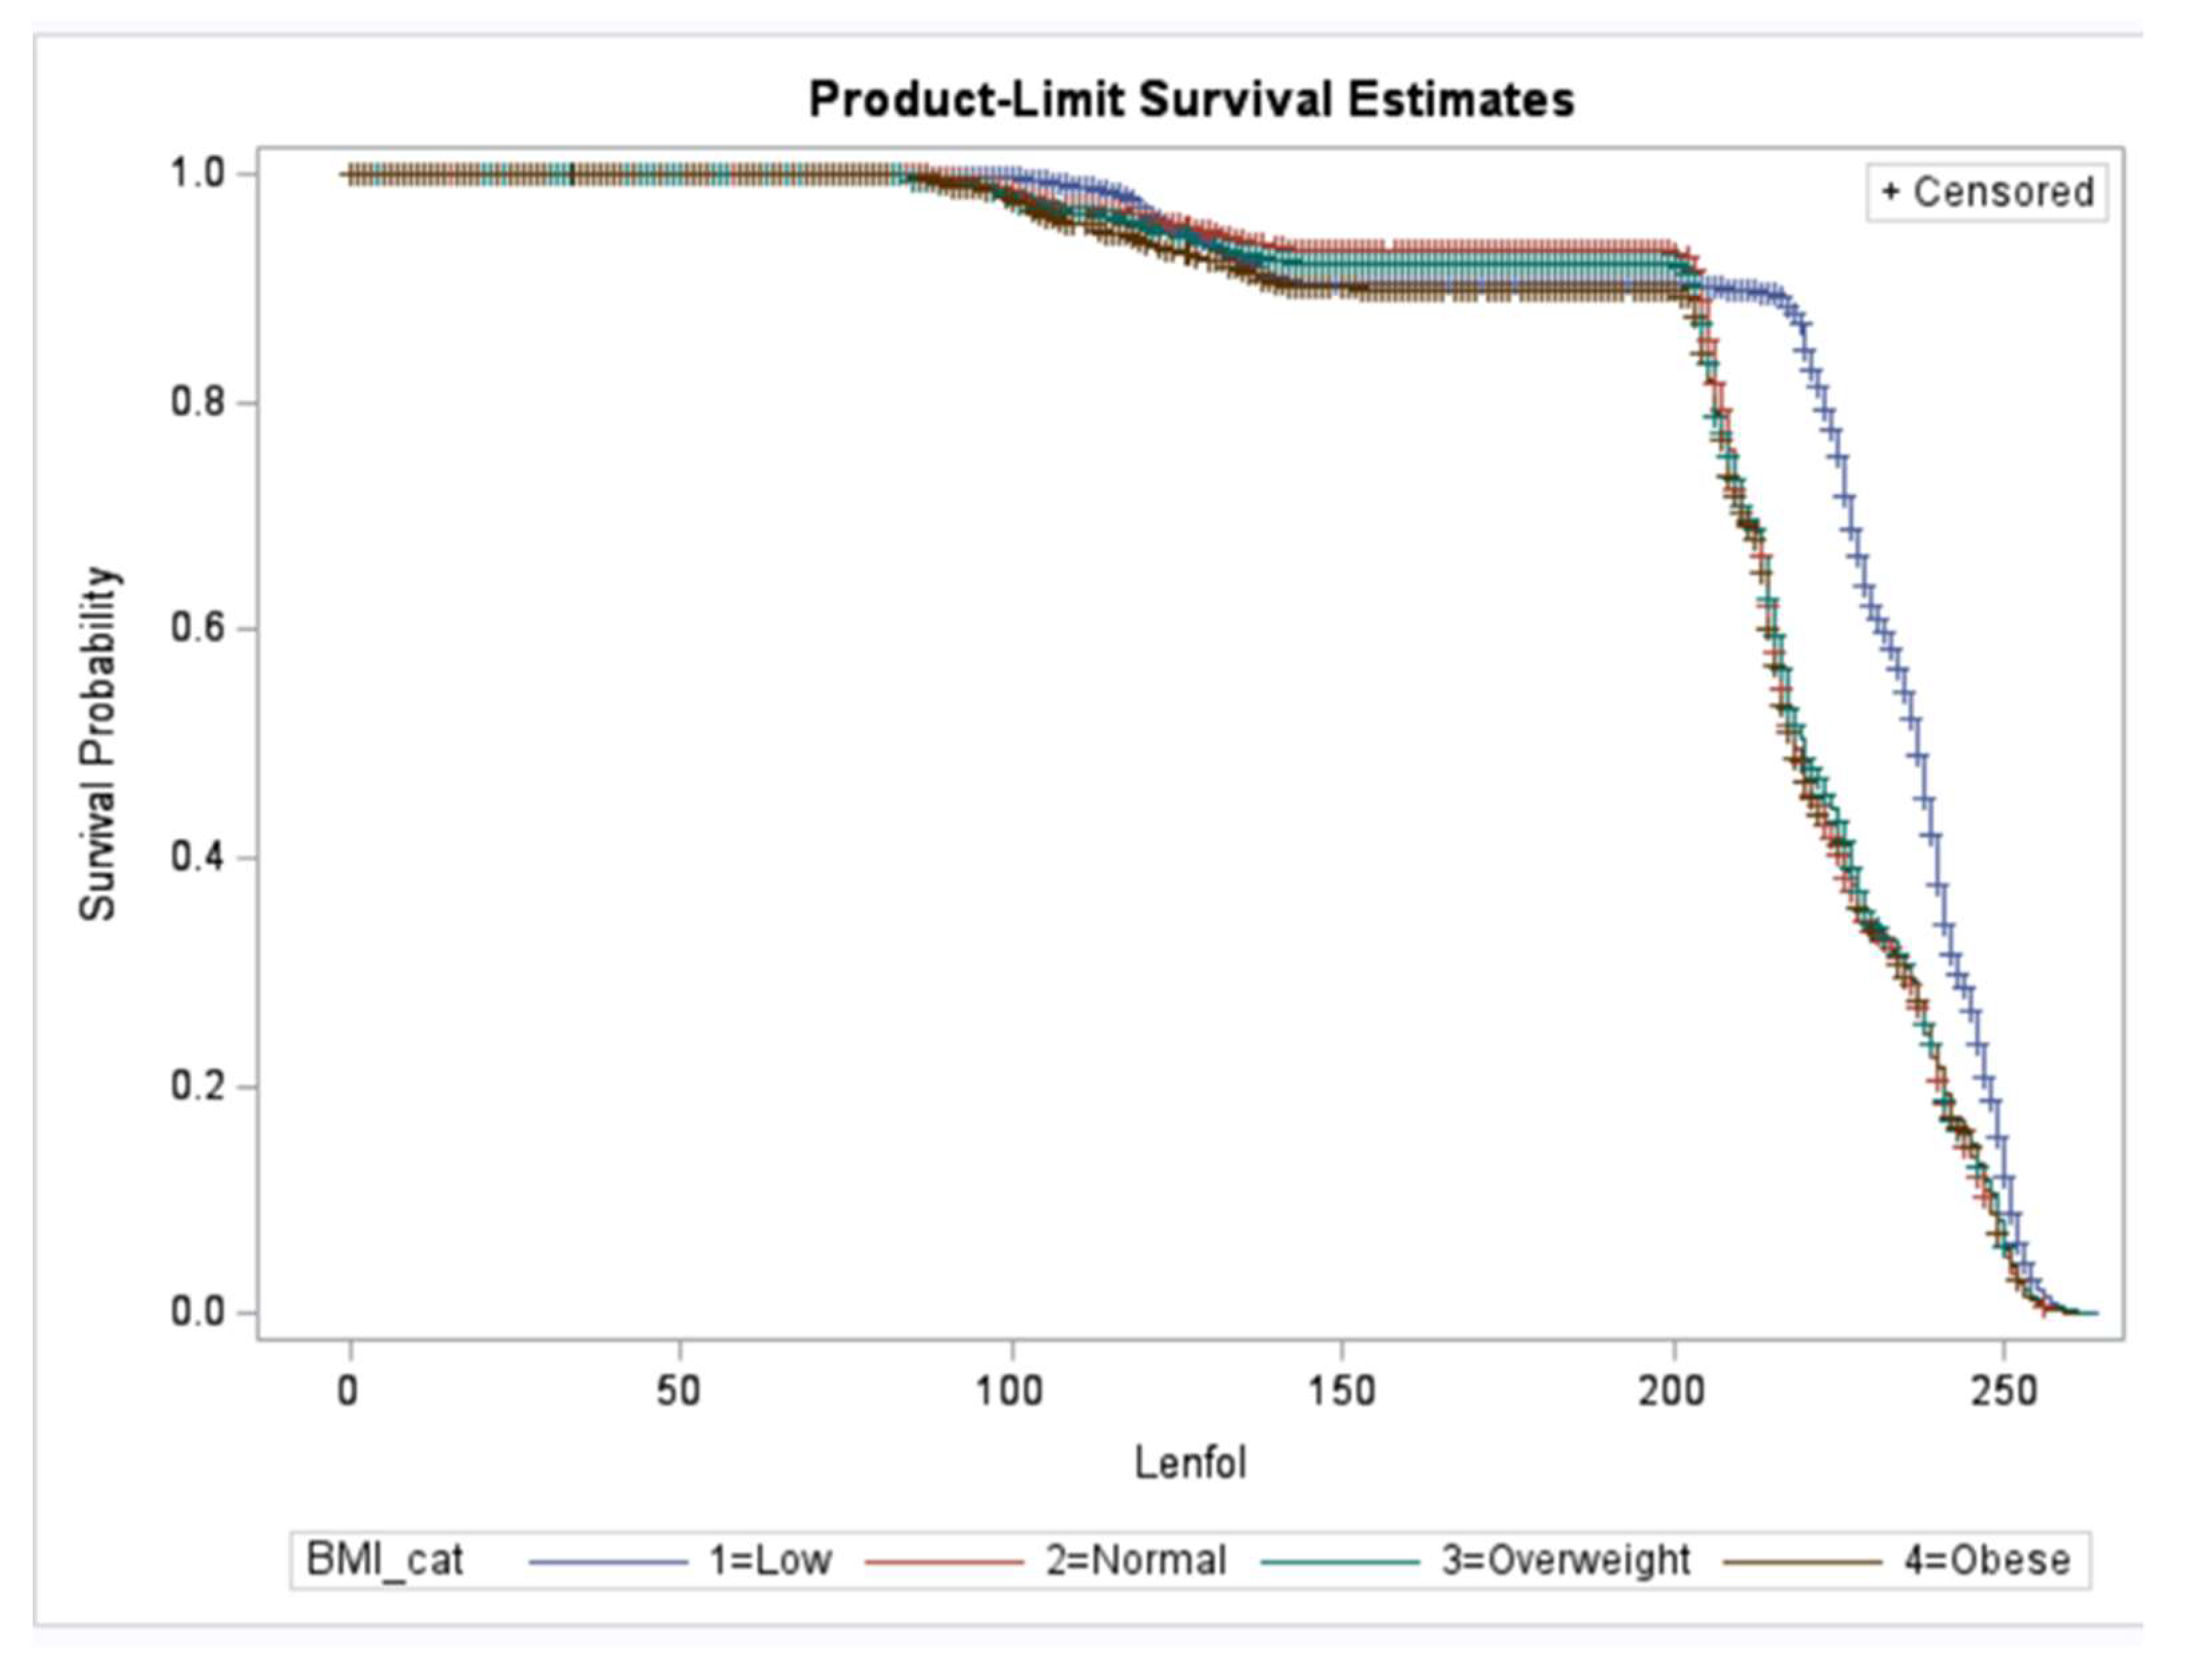

Table 1.
Current Vital status of subjects in 1992 by year of follow-up.
| VITAL STATUS (1992) | (Year of follow up and “Last known alive”) | |||||
|---|---|---|---|---|---|---|
| 1982-84 | 1986 | 1987 | 1992 | Inapplicable* | Total | |
| Alive | 47 | 5 | 356 | 7,926 | 0 | 8,334 |
| Dead | 1,758 | 557 | 496 | 1,244 | 0 | 4,055 |
| Unknown | 0 | 0 | 0 | 0 | 519 | 519 |
| Traced -directly | 5 | 1 | 2 | 237 | 0 | 245 |
| Traced -indirectly | 0 | 0 | 124 | 63 | 0 | 187 |
| Total | 1,810 | 563 | 978 | 9,470 | 519 | 13,340 |
* Subject’s vital status unknown in all eligible follow-up surveys.
Table 2.
New Emphysema diagnosis by year of last follow-up. (Includes self-reported and medical/death records indicating diagnosis).
Table 2.
New Emphysema diagnosis by year of last follow-up. (Includes self-reported and medical/death records indicating diagnosis).
| Year of Diagnosis ¥ | Incident cases of Emphysema |
|---|---|
| 1973 - 1975 | 4 |
| 1977 - 1981 | 8 |
| 1982 | 160 |
| 1983 | 775 |
| 1984 | 20 |
| 1985 - 1987 | 13 |
| 1988 - 1992 | 14 |
| Total incident cases | 994 |
¥ Years have been combined for reporting purposes only.
Table 3.
Characteristics (population-estimated percentages a) of participants who developed Emphysema during follow up (n=994), 1971 - 1992 and those who did not (n=12,346).
Table 3.
Characteristics (population-estimated percentages a) of participants who developed Emphysema during follow up (n=994), 1971 - 1992 and those who did not (n=12,346).
| Characteristics | Individuals who developed Emphysema (N = 994) | Individuals who did not develop Emphysema (N =12,346) | p value | ||
|---|---|---|---|---|---|
| % | 95% CI | % | 95% CI | ||
| Race | <0.001 | ||||
| Whites | 94.3% | 92.4, 96.2 | 88.5% | 86.8, 90.1 | |
| African American | 5.4% | 3.5, 7.3 | 10.2% | 8.6, 11.8 | |
| Other | 0.3% | 0.0, 0.8 | 1.3% | 0.9, 1.7 | |
| Gender | 0.74 | ||||
| Male | 47.6% | 42.4, 52.8 | 46.7% | 45.1, 48.2 | |
| Age group (in years) | <0.001 | ||||
| 25-34 | 17.9% | 13.8, 22.0 | 29.1% | 27.8, 30.4 | |
| 35-44 | 16.6% | 13.5, 19.8 | 21.8% | 20.6, 22.9 | |
| 45-54 | 23.7% | 20.4, 27.1 | 21.9% | 20.9, 22.9 | |
| 55-64 | 26.2% | 22.2, 30.2 | 16.4% | 15.4, 17.5 | |
| >= 65 | 15.5% | 11.8, 19.2 | 10.8% | 10.2, 11.4 | |
| Urban vs. rural | 0.93 | ||||
| Urban | 68.3% | 63.6, 72.9 | 68.5% | 64.9, 72.1 | |
| Rural | 31.7% | 27.1, 36.4 | 31.5% | 27.9, 35.1 | |
| Region | 0.83 | ||||
| Northeast | 26.3% | 19.4, 33.3 | 24.2% | 21.3, 26.9 | |
| Midwest | 24.4% | 19.4, 29.5 | 25.5% | 22.2, 28.9 | |
| South | 24.0% | 19.6, 28.5 | 23.7% | 19.4, 27.9 | |
| West | 25.2% | 20.1, 30.4 | 26.6% | 22.3, 30.9 | |
| Type of living quarters | 0.63 | ||||
| Living in housing units | 99.3% | 98.2, 100.0 | 99.5% | 99.2, 99.7 | |
| Other units | 0.7% | 0.0, 1.8 | 0.5% | 0.33, 0.76 | |
| Individuals living in house with a range or cookstoveb | 0.02 | ||||
| Yes | 99.7% | 99.4, 100.0 | 99.1% | 98.8, 99.4 | |
| Number of people per room per household b | <.0001 | ||||
| 1 | 93.5% | 91.5, 95.4 | 91.3% | 90.2, 92.5 | |
| 2 | 6.0% | 4.0, 8.0 | 8.4% | 7.3, 9.5 | |
| 3 | 0.5% | 0.0, 1.2 | 0.2% | 0.1, 0.4 | |
| 4 - 5 | 0.1% | 0.0, 0.2 | 0.0% | 0.0, 0.0 | |
| Family Income (in dollars) c, d | <.0001 | ||||
| Less than $5,000 | 21.2% | 17.5, 24.8 | 17.5% | 16.0, 18.9 | |
| $5,000 - $10,000 | 33.1% | 29.1, 37.1 | 26.6% | 24.9, 28.3 | |
| $10,000 - $24,999 | 40.2% | 35.4, 45.0 | 45.3% | 43.3, 47.4 | |
| $25,000 and over | 3.1% | 1.8, 4.4 | 6.9% | 5.9, 7.9 | |
| Missing | 2.4% | 1.1, 3.8 | 3.8% | 3.2, 4.4 | |
| Educational attainment | <.0001 | ||||
| High school or less | 66.5% | 61.9, 70.9 | 54.1% | 51.4, 56.8 | |
| At least a year college | 33.1% | 28.6, 37.6 | 45.1% | 42.4, 47.8 | |
| Missing | 0.4% | 0.0, 0.8 | 0.8% | 0.5, 1.0 | |
| Physical activity (recreational or otherwise) | 0.01 | ||||
| Very active | 44.4% | 40.0, 48.7 | 49.1% | 47.5, 50.6 | |
| Moderately active | 46.5% | 42.2, 50.8 | 43.7% | 42.2, 45.1 | |
| Quite inactive | 9.2% | 6.1, 12.3 | 7.2% | 6.3, 8.0 | |
| Missing | 0.0% | 0.0, 0.0 | 0.1% | 0.0, 0.2 | |
| Have or Had Tuberculosis | 0.42 | ||||
| Yes | 3.6% | 1.9, 5.2 | 2.9% | 2.2, 3.7 | |
| Lifetime smoking (smoked at least 100 or more) d | <.0001 | ||||
| Yes | 77.6% | 73.7, 81.4 | 59.8% | 58.2, 61.2 | |
| Frequency of alcohol consumption e | 0.03 | ||||
| Everyday/Just about… | 16.8% | 13.1, 20.6 | 15.9% | 14.5, 17.3 | |
| About 2-3 times a week | 12.1% | 9.4, 14.8 | 14.3% | 13.2, 15.3 | |
| About 1-4 times a month | 23.9% | 19.7, 28.2 | 26.6% | 25.2. 28.1 | |
| >= 3 but < 12 times a year | 10.3% | 7.7, 12.8 | 9.4% | 8.6, 10.1 | |
| <= 2 or 3 times a year | 12.7% | 9.9, 15.6 | 11.3% | 10.4, 12.1 | |
| Do not drink | 23.1% | 19.3, 27.0 | 22.4% | 20.3, 24.5 | |
| Missing | 0.0% | 0.0, 2.5 | 0.2% | 0.1, 0.3 | |
| BMI f | 0.03 | ||||
| Low (<18.5) | 37.4% | 29.7, 45.2 | 31.9% | 25.2, 38.5 | |
| Normal (18.5 - <25) | 25.9% | 21.4, 30.4 | 31.6% | 28.0, 35.1 | |
| Overweight (25 - <30) | 23.8% | 18.5, 29.2 | 25.0% | 22.5, 27.5 | |
| Obese (>=30) | 12.8% | 9.8, 15.9 | 11.6% | 10.1, 13.2 | |
| Mean | SE | Mean | SE | p value | |
| Age at initial interview, in years | 52.8 | 0.5 | 47.9 | 0.1 | <.0001 |
| People in household (number) | 3.1 | 1.8 | 3.6 | 1.9 | <.0001 |
| Years since TB diagnosis g | 13.2 | 2.8 | 7.9 | 0.7 | 0.07 |
a Data shown are population based estimated percentages for categorical variables incorporating survey design specifications (adjusted weights, stratification, multistage cluster sampling). Of the 14,407 individuals in the entire NHEFS cohort, 1,067 prevalent cases of Emphysema (at first interview) were excluded, leaving 13,340 for follow-up. b 20.1% of the responses in both these categories were missing. Number of people per room per household was used as a proxy for overcrowding. The median household size for the study population was 3.0 (range = 1,19). The number was calculated by dividing the total number of people in household by the total rooms in the household. These variables were not included in the analysis. Majority of the individuals who did respond said yes to having a range/cooking stove at home, thus reducing the likelihood of pollution from that source. Similarly, the median number of people per household was 3 and hence we concluded that household crowding was not a major factor in our analysis. c An income of $10,000 in 1973 dollars is equivalent to an income of $60,556.57 in 2020 (https://www.bls.gov/data/inflation_calculator.htm) d At baseline, smoking information was obtained only for subjects in the detailed examination, the follow-up questions from 1982 interview were used to reconstruct smoking status at baseline for the subjects who were not in the detailed sample. e Frequency of alcohol consumption – Three different categories for alcohol consumption were assigned based on responses to the question “How often do you drink?”. The question was asked to all individuals who said “Yes” to having at least one drink of beer, wine, or liquor in the past year. f Weight (lb.)/height (inch)2 g The Median of years since diagnosis of TB was 0 years with a range of 0 to 68. Many of individuals were diagnosed with TB (positive PPD) at the time of initial exam.
Table 4.
Population-estimated Hazard Ratios for the relation of Incidence with past Tuberculosis and other risk factors among US Adults, NHANES I Epidemiologic Follow-up study, 1971 - 1992 a, b.
Table 4.
Population-estimated Hazard Ratios for the relation of Incidence with past Tuberculosis and other risk factors among US Adults, NHANES I Epidemiologic Follow-up study, 1971 - 1992 a, b.
| Characteristics | Adjusted Hazard Ratio | 95% Confidence Interval |
|---|---|---|
| Have or Had Tuberculosis | ||
| Yes | 0.46 | 0.35, 0.61 |
| No | 1 | Reference |
| Gender | ||
| Female | 1.19 | 1.11, 1.28 |
| Male | 1 | Reference |
| Age group (in years) | ||
| 25-34 | 1 | Reference |
| 35-44 | 0.94 | 0.86, 1.02 |
| 45-54 | 0.89 | 0.82, 0.97 |
| 55-64 | 0.95 | 0.85, 1.06 |
| >= 65 | 1.17 | 1.00, 1.36 |
| Family Income (in dollars) | ||
| Less than $5,000 | 0.72 | 0.61, 0.83 |
| $5,000 - $10,000 | 0.69 | 0.59, 0.80 |
| $10,000 - $24,999 | 0.81 | 0.71, 0.94 |
| $25,000 and over | 1 | Reference |
| Lifetime smoking (smoked at least 100 or more) | ||
| Yes | 1.12 | 1.05, 1.20 |
| No | 1 | Reference |
| Frequency of alcohol consumption b | ||
| Frequent drinkers | 0.93 | 0.81, 1.06 |
| Moderate/Rare drinkers | 0.90 | 0.79, 1.02 |
| Never drinkers | 1 | Reference |
| BMI category c | ||
| Low BMI (<18.5) | 0.44 | 0.38, 0.51 |
| Normal BMI | 1 | Reference |
| Overweight/Obese (>=25) | 1.11 | 1.02, 1.21 |
a Results are based on multivariable Cox proportional hazards regression analysis using the SAS SURVEYPHREG procedure. Terms were included in the final model if they were statistically significant at p <0.05 or if the goodness of fit statistics decreased by a significant amount. b Alcohol consumption did not meet criteria for inclusion in the final model if only a cut-off of P < 0.05 is applied. However, adding it to the model reduced the goodness of fit statistics by a significant amount. Heavy drinking was defined as drinking every day, just about every day or 2-3 times a week. c Individuals with low BMI have decreased hazard of being diagnosed with emphysema in the future whereas individuals who were overweight or obese were at higher risk of developing emphysema; risk was similar in the overweight and obese categories, and they combined for analysis.
Disclaimer/Publisher’s Note: The statements, opinions and data contained in all publications are solely those of the individual author(s) and contributor(s) and not of MDPI and/or the editor(s). MDPI and/or the editor(s) disclaim responsibility for any injury to people or property resulting from any ideas, methods, instructions or products referred to in the content. |
© 2023 by the authors. Licensee MDPI, Basel, Switzerland. This article is an open access article distributed under the terms and conditions of the Creative Commons Attribution (CC BY) license (http://creativecommons.org/licenses/by/4.0/).
Copyright: This open access article is published under a Creative Commons CC BY 4.0 license, which permit the free download, distribution, and reuse, provided that the author and preprint are cited in any reuse.


