Submitted:
08 September 2023
Posted:
12 September 2023
You are already at the latest version
Preprints on COVID-19 and SARS-CoV-2
Abstract
Coronavirus disease (COVID-19) and its outcomes remain one of the most challenging problems today. COVID-19 in children could be asymptomatic but can result in a fatal outcome, therefore, prediction of the disease severity is important. The goal was to investigate the human genetic factors that could be associated with COVID-19 severity in children. Single nucleotide polymor-phisms of the following genes were studied: ACE2 (rs2074192), IFNAR2 (rs2236757), TYK2 (rs2304256), OAS1 (rs10774671), OAS3 (rs10735079), CD40 (rs4813003), FCGR2A (rs1801274) and CASP3 (rs113420705). In the case-control study were 30 children with mild or moderate course of the disease; 30 with severe COVID-19 symptoms and multisystem inflammatory syndrome in children (MIS -C) and 15 healthy who did not have COVID-19 infection (PCR negative, Ig G negative). The study revealed that ACE2 rs2074192 (allele T), IFNAR2 rs2236757 (allele A), OAS1 rs10774671 (allele A), CD40 rs4813003 (allele C), CASP3 rs113420705 (allele C) and male sex contribute to severe course COVID-19 infection, and MIS-C in 85.6% of cases. The World Health Organization reported new COVID-19 variants may cause previously unseen symptoms in chil-dren. Although the study has limitation due to cohort size, the findings can help provide a better understanding of SARS-CoV-2 infection and proactive pediatric patient management.
Keywords:
ACE2
; IFNAR2
; TYK2
; OAS1
; OAS3
; CD40
; FCGR2A
; CASP3
; COVID-19
; children
1. Introduction
Coronavirus disease (COVID-19) and its outcomes remain one of the most pressing problems today. In July 2023, the total count of confirmed COVID-19 cases reached 768 million worldwide. Notwithstanding vaccination, the mortality rate is still high. Thirteen billion persons were vaccinated against SARS-CoV-2; 66.06% of adults completed the primary series of vaccinations; 31.8% of the world population received booster or additional dosage, but during the first month of 2023, more than 220 thousand deaths related to COVID-19 were registered [1]. Despite the thought, that COVID-19 in children and adolescents has an asymptomatic course, fatal outcome is also noticed in the pediatric population. Based on UNICEF Data, in July 2023 there were 17,400 COVID-19 deaths among children and adolescents — 53% were registered in the age group 10−19 and 47% in children aged 0−9 years [2]. COVID-19 in childhood can also lead to multisystem inflammatory syndrome in children (MIS-C). Data from the USA reported an MIS-C frequency of 316 cases per million confirmed SARS-CoV-2 episodes in persons aged <21 [3]. Recent studies underline that critical illness or even death among children with COVID-19 is most commonly seen in patients with comorbidities (respiratory, cardiovascular disorders, obesity, neurological or oncological disease) and the presence of co-infections [3,4,5]. In addition, age is an important risk factor for disease severity — premature babies, infants and adolescents are at greater risk for poor COVID-19 outcomes [3,5,6].
The course of any viral infection as well as COVID-19 will depend on the characteristics of the pathogen (its structure, viral load and the site of penetration into the host’s cells), the type of host immune response and transmission environment with its influencing factors [6,7]. It must be mentioned that external factors (stress, sleep, nutrition and microbiota type) can undergo correction, but the host genetic factor cannot be corrected or changed and has a very significant impact on the course of the viral infection [6].
Therefore, the research goal was to investigate human genetic factors that could be associated with COVID-19 severity in the pediatric population. Single nucleotide polymorphisms (SNPs) of the next genes were studied: ACE2 (rs2074192); IFNAR2 (rs2236757); TYK2 (rs2304256); OAS1 (rs10774671); OAS3 (rs10735079); CD40 (rs4813003); FCGR2A (rs1801274) and CASP3 (rs113420705).
The angiotensin converting enzyme 2 (ACE2) gene has several single nucleotide polymorphisms that are associated with communicable and noncommunicable diseases. ACE2 alleles are the risk factors for cardiovascular diseases (hypertension, coronary artery disease, heart failure, atherosclerosis), respiratory diseases (pulmonary hypertension, chronic obstructive pulmonary disease, asthma, acute lung injury, acute respiratory distress syndrome, lung cancer, pulmonary sarcoidosis), endocrine diseases (type 2 diabetes mellitus, obesity) [8,9,10]. Since 2019, SARS-CoV-2 infection has become the most commonly discussed communicable disease related to ACE2 gene expression. Current studies show that intronic SNP rs2074192 (variant g42403) is related to COVID-19 severity as well as concomitant comorbidities [11].
The interferon system is extremely powerful in the context of antiviral defense. The type I interferon action is mediated by interaction with interferon alpha and beta receptor subunit 1 (IFNAR1) and interferon alpha and beta receptor subunit 2 (IFNAR2) receptors. The expression of IFNAR2 is regulated by the corresponding genes. Recent studies suggest the influence of IFNAR2 gene polymorphism on the course and severity of SARS-CoV-2 infection, especially its risk allele A [12,13].
The interferon system is closely related to tyrosine kinase 2 (TYK2). TYK2, as the part of Jak-family, is discussed as one of the key pathogenetic substances in immune-mediated inflammatory disease development [14]. Current knowledge suggests that changes in TYK2 regulation lead to deviations in interferons α and β response. Downregulation of TYK2 with other Jak-family members (Jak1, Jak2, Jak3) has a linkage with cytokines action — IL-6, IL-10, IL-11, IL-12, IL-19, IL-20, IL-22 and IL-23 [14,15]. The consequences of the TYK2 gene’s (rs2304256) influence on COVID-19 are still controversial. Previous research showed discordant results. Dieter C. et al. and Benmansour R. with colleagues demonstrated a tendency in the association of the AA genotype TYK2 gene (rs2304256) with severe and lethal outcomes in adult patients with COVID-19 [16,17]. At the same time, Risi et al. reported an association of A allele carrier with mild disease course and underlined its protective properties [18]. Therefore, the influence of genotypes and alleles of the TYK2 gene (rs2304256) is still a point of concern.
Among interferon-induced enzymes, 2′,5′-oligoadenylate synthetase (OAS) must be mentioned as it has a magnitude role in antiviral immunity. Continuous researches suggest that OAS1 rs10774671 with the risk allele A has a dominant role in the regulation of OAS enzymatic activity and SARS-CoV-2 elimination [19]. Single nucleotide variant rs10735079 (A > G) is responsible for gene clusters OAS1, OAS2 and OAS3 and is among COVID-19 genes [12,20]. Studies in the adult population suggest the association of rs10735079 (risk allele G) with the severity of SARS-CoV-2 infection (odds ratio (OR) = 1.3) [12,21].
MIS-C and Kawasaki disease (KD) have similarities in their pathogenesis (autoimmune pattern), clinical course (fever, rash, no purulent conjunctivitis, cardiovascular involvement) and laboratory findings (elevated pro-inflammatory markers and evidence of coagulopathy) [22]. Therefore, in differential diagnosis we assessed genome-wide significant variants associated with KD susceptibility [22]. Current studies suggest 63 genes associated with KD [23]. Among them, four groups of genes that are related to KD susceptibility were formed: 1) genes that enhance T cell activation (ITPKC, ORAI1, STIM1); 2) genes related to dysregulation of B cell signaling (CD40, BLK, FCGR2A); 3) genes associated with decreased apoptosis (CASP3) and 4) genes related to altered transforming growth factor beta signaling (TGFB2, TGFBR2, MMP, SMAD) [23,24]. All listed genes have different risk allele frequencies in the European and Asian populations; therefore, we have focused on the genes that have a higher frequency in Europe — CD40 (CD40 molecule), Fc gamma receptor IIa (FCGR2A) and caspase 3 (CASP3) [22]. In addition, these genes are among the important regulators of antiviral immune response [25]. CD40 as the costimulatory surface receptor is expressed on B-cells, macrophages, monocytes, platelets, dendritic cells and non-hematopoietic cells — vascular endothelial cells, epithelial cells, myofibroblasts and fibroblasts [26,27,28]. Therefore, CD40 contributes to cellular and humoral immunity as well as to vascular remodeling [26,27,29]. FCGR2A (Fc fragment of immunoglobulin G, low-affinity IIa, receptor) is also discussed in the context of immune response and vascular remodeling [30]. Polymorphism FCGR2A rs1801274 is associated with the substitution of histidine by arginine at position 131 (H131R) [30]. As a result, binding affinity with different immunoglobulins G subclasses is changed and the autoimmune response is activated [30]. Caspase-3 is a well-known protein involved in apoptosis and it is encoded by the CASP3 gene. Activation of caspase-3 in COVID-19 patients can be caused by the enhanced production of reactive oxygen species in the presence of oxidative stress. At the same time, cytokine storm in SARS-CoV-2 infection is described as the result of apoptosis-related cellular death [31].
Therefore, CD40, FCGR2A and CASP3 genes are discussed as the genetic predispose factors of KD as well as severe COVID-19 and MIS-C in children.
Despite the number of genetic studies related to COVID-19 severity and outcome, results are controversial with different findings and associations presented. However, no previous analysis regarding the role of genetic factors in SARS-CoV-2 severity in children was reported. Therefore, it became the focus of our research.
2. Materials and Methods
A total number of 75 children were involved in the case-control study — 30 persons with mild or moderate course of the disease; 30 children with severe COVID-19 and multisystem inflammatory syndrome and 15 healthy children who did not have COVID-19 (PCR negative, Ig G negative).
Criteria of the Italian Society of Pediatric Infectious Disease [32,33] and COVID-19 Treatment Guidelines (National Institutes of Health) [34] were used to define disease severity. Mild disease severity was diagnosed in cases when upper airway symptoms without radiological/ultrasound findings were present despite the temperature level. Children with pneumonia diagnosed by imaging studies or persons with upper airway symptoms with respiratory distress were defined as patients with moderate disease severity. When patients had a fever or cough with one of the following criteria — saturation <92% in room air; severe respiratory distress or systemic symptoms (drowsiness, lethargy, seizures, dehydration) — severe disease course was diagnosed.
Diagnosis of MIS-C was done based on the World Health Organization (WHO) criteria [35]: fever duration greater than three days in children and adolescents (0–19 years) plus two of the following: 1) Rash or bilateral nonpurulent conjunctivitis or mucocutaneous inflammation signs (oral, hands or feet); 2) Hypotension or shock; 3) Features of myocardial dysfunction, pericarditis, valvulitis or coronary abnormalities (including ECHO findings or elevated Troponin/N-Terminal Pro–B-Type Natriuretic Peptide [NT-proBNP]); 4) Evidence of coagulopathy (by prothrombin time, partial thromboplastin time, elevated d-Dimers) or 5) Acute gastrointestinal problems (diarrhea, vomiting or abdominal pain). Other evaluations in MIS-C diagnosis included elevated markers of inflammation such as erythrocyte sedimentation rate, C-reactive protein or procalcitonin, and no other obvious microbial cause of inflammation, including bacterial sepsis, staphylococcal or streptococcal shock syndromes as well as evidence of COVID-19 (real-time reverse transcription polymerase chain reaction, antigen test or serology positive) or likely contact with patients with COVID-19.
The study was conducted and performed under the principles of the Declaration of Helsinki. Bioethics Committee of I. Horbachevsky Ternopil National Medical University approved this study (Protocol No 71, dated October 25, 2022). Informed consent was obtained from all children’s caregivers.
Venous blood samples for genomic study were collected in tubes with ethylenediamine tetraacetic acid. The blood sample volume for clinical care and research did not exceed the recommended WHO limit [36]. The Thermo Scientific™ GeneJET™ Whole Blood Genomic DNA Purification Mini Kit Cat. No K0781 (Thermo Fisher Scientific, USA) was used for genomic DNA extraction according to the manufacturer’s instructions. Predesigned TaqMan™ SNP Genotyping Assays, Cat. No. 4351379 (Thermo Fisher Scientific, USA) were used for next SNPs — ACE2 rs2074192, IFNAR2 rs2236757, TYK2 rs2304256, OAS1 rs10774671, OAS3 rs10735079, CD40 rs4813003, FCGR2A rs1801274 and CASP3 rs113420705. TaqMan™ Universal Master Mix II, no UNG, 1 x 5 ml, Cat. No 4440040 was used for DNA amplification using real-time polymerase chain reaction.
Statistical analysis was done with the computer software IBM SPSS Statistics 21.0. Quantitative values were presented as number (n) and frequency (%). Frequency tables 2 x 3 were compared using the chi-square test (χ2), while for tables 2 x 2 two-tailed, Fisher exact test was used; the level of significance for each test was calculated — p-value and pF, respectively. Correspondence for Hardy-Weinberg equilibrium was assessed for each gene. With the assumption that gene frequency corresponds to the population, one was done in a case when p > 0.05 in the chi-square test. For outcome prediction, OR with its 95% confidence interval (95% CI) was calculated. Logistic regression was done to determine the key predictors of COVID-19 and its severity in the pediatric population. A level of statistical significance was assumed with a p-value < 0.05. GeneMANIA was used to assess the network cooperation between studied genes [37].
3. Results
3.1. Study Group’s Characteristic
Demographic characteristic of children involved in the study is presented in Table 1. There was no sex difference in the studied group, while age difference was revealed. Children with mild or moderate COVID-19 were significantly younger compared to the control group. Age among COVID-19 patients did not vary (Table 1).
3.2. Correspondence to Hardy-Weinberg Equilibrium
Frequency of ACE2 rs2074192, IFNAR2 rs2236757, OAS3 rs10735079, FCGR2A rs1801274 and CASP3 rs113420705 genotypes did not follow Hardy-Weinberg equilibrium (p < 0.05) due to the directional selection in our study (focusing on patients with COVID-19). In COVID-19 group, TYK2 rs2304256, OAS1 rs10774671, CD40 rs4813003 and FCGR2A rs1801274 homozygotes and heterozygotes frequencies were in accordance with Hardy-Weinberg principle (p > 0.05). Notably, genotype frequencies in healthy children (control group) correspond to Hardy-Weinberg proportions (p > 0.05) (Table 2.1, Table 2.2 and Table 2.3).
3.3. Genotype and Allele Frequencies
3.3.1. ACE2 rs2074192
Genotype frequencies did not vary in the studied group in the codominant model (Figure 1). While analysis of dominant, recessive and overdominant models demonstrates that children with severe COVID-19 or MIS-C more often are the carriers of TT genotype ACE2 rs2074192. Genotype TT rs2074192 increases the risk of having a severe course of SARS-CoV-2 infection by 4.57 times (OR = 4.57; 95% CI 1.07−19.57; p = 0.041) (Table 3.1).
Children with severe COVID-19 course and MIS-C significantly often are the allele T carriers ACE2 rs2074192 compared to healthy persons (p = 0.017). Risk allele T increases of severe disease course by 3.45 times (p = 0.009); while allele C has protective properties (OR = 0.29; 0.12−0.73) (Table 4).
Comparison of our results with data from the project “ALFA: Allele Frequency Aggregator” [38] showed that the frequency of alleles C and T in healthy children corresponds to the European population frequency (p = 0.061), while patients with COVID-19 often were the carriers of risk allele T compared to the general population (0.54 versus 0.45; p = 0.048) (Table 5).
Notably, the genotype frequency varied significantly between girls and boys in the COVID-19 group — boys have genotype TT more often compared to girls. In healthy children, such sex difference was not revealed (Table 5). At the same time, a comparison of healthy boys and boys with COVID-19 showed a significant difference in ACE2 rs2074192 genotype frequencies (χ2 = 6.94; p = 0.031); healthy and infected by SARS-CoV-2 girls did not differ by genotype frequencies (χ2 = 0.68; p = 0.711) (Table 6). Allele T frequency varied between groups — in 60.26% of infected boys compared to 14.29% of noninfected boys (p = 0.002) (Table 5).
3.3.2. IFNAR2 rs2236757
Rare homozygous AA was seen in 40% of patients with severe COVID-19 and MIS-C, while in the control group it was observed in 13.33% of cases. Despite the higher frequency, this difference did not reach the level of statistical significance (p = 0.071) (Figure 1). In the recessive inheritance model, genotype AA IFNAR2 rs2236757 showed a tendency to increase disease severity more than four times (OR = 4.33; 95% CI 0.83−22.75; p = 0.083) (Table 3.2).
IFNAR2 rs2236757 risk A allele was revealed significantly more often among patients with severe COVID-19 and MIS-C compared to the control group — 56.67% vs. 33.33% (p = 0.046). Carriers of risk allele A are more prone to suffer from severe COVID-19 or MIS-C (OR = 2.62; p = 0.039) (Table 4).
It is important to emphasize that allele A is registered significantly more often in children with COVID-19 compared to data in the general European population (p < 0.001), while alleles G and A frequencies in healthy children correspond to it (p = 0.497) (Table 5).
There were no sex differences in genotype or allele frequencies in the COVID-19 group and control group (p > 0.05). But comparison via the same sex demonstrates a higher frequency of risk allele A in boys with SARS-CoV-2 compared to healthy boys — 50% and 21.43% (p = 0.049); in girls such difference was not revealed (p = 0.365) (Table 6).
3.3.3. TYK2 rs2304256
There were no differences in TYK2 rs2304256 genotype frequencies via codominant, dominant, recessive and overdominant models (p > 0.05) (Figure 1, Table 3.3).
Alleles C and A frequencies also did not vary between groups of different COVID-19 severity and healthy children (Table 4). Risk allele A was seen in 23.33% of healthy persons vs. 41.67% in patients with severe COVID-19/MIS-C and 26.67% in the mild/moderate group (p > 0.05). Allele frequencies in the COVID-19 group were similar to population frequency (Table 5).
TYK2 rs2304256 genotype and allele frequencies were similar between boys and girls as well as between infected and noninfected children of the same sex (p > 0.05) (Table 6).
3.3.4. OAS1 rs10774671
The codominant model’s study revealed differences in genotype frequencies for gene OAS1 rs10774671 (p < 0.05) (Figure 1). Genotype AA OAS1 rs10774671 was registered in 35% of patients infected by SARS-CoV-2, while in healthy children it was not noticed (p = 0.022). Study results demonstrate that homozygous GG is more than five times less likely to have a severe COVID-19 course (OR = 0.18) compared to carriers of allele A (heterozygous GA and homozygous AA) — OR = 5.71 (p < 0.05) (Table 3.4).
Patients with COVID-19 often were the carrier of allele A (56.67%) compared to healthy children (23.33%) (p = 0.001) (Table 4). Notably, allele A OAS1 is associated with severe COVID-19 course (OR = 4.60; 95% CI 1.71−12.37; p = 0.003). It should be noted that patients in the control group did not correspond to the European population according to OAS1 rs10774671 allele G and A frequencies (Table 5).
Genes located on the autosome OAS1 rs10774671 genotype and allele frequencies were similar for both sexes (Table 6).
3.3.5. OAS3 rs10735079
There were no statistical differences between OAS3 rs10735079 genotypes and allele frequencies between children with different COVID-19 severity and healthy kids (Figure 1, Table 3.5). Nevertheless, it should be noticed that frequencies of allele G and genotypes with allele G (GG + GA) are two times higher in persons with severe COVID-19 course compared to the control group — 43.33% vs. 23.33% for alleles (p = 0.065) and 60% vs. 33.33% for genotypes (p = 0.095).
3.3.6. CD40 rs4813003
The research did not reveal significant differences in codominant, dominant, recessive and overdominant models between study groups for gene CD40 rs4813003 (Figure 1, Table 3.6). Importantly, genotype CC was typical for 90% of children with severe COVID-19 and MIS-C, while in a healthy group it was registered in 66.67% of cases (p = 0.056). Correspondingly, allele C significantly dominates in the COVID-19 group compared to noninfected children — 94.17% vs. 80% (p = 0.024). Based on our study results, allele C increases the risk of severe COVID-19 course or MIS-C in 4.75 times (p = 0.037) (Table 4).
It is important to note that allele C and T frequencies were significantly different compared not only to the control but also to the general European population (p = 0.011). In noninfected children, both allele C and T frequencies correspond to the general population frequency (p > 0.05) (Table 5).
Comparison between boys and girls did not show any difference in genotype and allele frequency (p > 0.05) (Table 6).
3.3.7. FCGR2A rs1801274
Analysis of all genetic models of inheritance did not reveal significant changes in FCGR2A rs1801274 genotype frequencies between those infected by the SARS-CoV-2 virus and noninfected persons (Figure 1, Table 3.7).
Allele A and G frequencies in patients with COVID-19 did not differ significantly from the control group as well as from the general population (p > 0.05) (Table 4 and Table 5). At the same time, our study results demonstrated a deviation in allele frequencies between healthy children and the European population (p < 0.05) (Table 5)
Genotype and allele frequencies in the male group correspond to the same parameters in the female group in COVID-19 patients and healthy children (p > 0.05) (Table 6).
3.3.8. CASP3 rs113420705
CASP3 rs113420705 genotype TT was registered significantly more often among healthy children (46.67%) compared to patients with COVID-19 of different severity (10%) (p < 0.05) (Figure 1). Notably, TT genotype rs113420705 is protective against severe COVID-19 or MIS-C in the pediatric population (OR = 0.13; p = 0.010) (Table 3.8). Carriers of allele C in both heterozygous TC and rare homozygous CC have an increasing risk of severe SARS-CoV-2 infection (OR = 7.88) (Table 3.8). Important to note is that despite the absence of a statistically significant difference between COVID-19 groups and control, the study noted a significantly higher prevalence of allele C in COVID-19 pediatric patients and European alleles’ frequencies (Table 4 and Table 5).
Sex differences were not typical for CASP3 rs113420705 genotypes and allele frequencies (Table 6).

Table 4.
Allele frequencies for genes ACE2 rs2074192, IFNAR2 rs2236757, TYK2 rs2304256, OAS1 rs10774671, OAS3 rs10735079, CD40 rs4813003, FCGR2A rs1801274, CASP3 rs113420705 in children with different COVID-19 severity and noninfected children.
Table 4.
Allele frequencies for genes ACE2 rs2074192, IFNAR2 rs2236757, TYK2 rs2304256, OAS1 rs10774671, OAS3 rs10735079, CD40 rs4813003, FCGR2A rs1801274, CASP3 rs113420705 in children with different COVID-19 severity and noninfected children.
| Gene | Allele | Mild/ Moderate COVID-19 |
Severe COVID-19/ MIS-C | Control | χ2, p-value |
OR (95% CI) |
p-value for OR |
|---|---|---|---|---|---|---|---|
| ACE2 rs2074192 | C | 33 (55.00) | 22 (36.67) | 20 (66.67) | χ2 = 8.20; p = 0.017* | 0.29 (0.12−0.73) | 0.009* |
| T | 27 (45.00) | 38 (63.33) | 10 (33.33) | 3.45 (1.37−8.69) | |||
| IFNAR2 rs2236757 | G | 31 (51.67) | 26 (43.33) | 20 (66.67) | χ2 = 4.36; p = 0.113 |
0.38 (0.15−0.95) | 0.039* |
| A | 29 (48.33) | 34 (56.67) | 10 (33.33) | 2.62 (1.05−6.53) | |||
| TYK2 rs2304256 | C | 44 (73.33) | 35 (58.33) | 23 (76.67) | χ2 = 4.40; p = 0.111 |
0.43 (0.16−1.15) | 0.091 |
| A | 16 (26.67) | 25 (41.67) | 7 (23.33) | 2.35 (0.87−6.31) | |||
| OAS1 rs10774671 | G | 27 (45.00) | 25 (41.67) | 23 (76.67) | χ2 = 10.80; p = 0.005* | 0.22 (0.08−0.58) | 0.003* |
| A | 33 (55.00) | 35 (58.33) | 7 (23.33) | 4.60 (1.71−12.37) | |||
| OAS3 rs10735079 |
A | 40 (66.67) | 34 (56.67) | 23 (76.67) | χ2 = 3.67; p = 0.159 |
0.40 (0.15−1.07) | 0.068 |
| G | 20 (33.33) | 26 (43.33) | 7 (23.33) | 2.51 (0.94−6.75) | |||
| CD40 rs4813003 |
C | 56 (93.33) | 57 (95.00) | 24 (80.00) | χ2 = 6.19; p = 0.045* | 4.75 (1.10−20.57) | 0.037* |
| T | 4 (6.67) | 3 (5.00) | 6 (20.00) | 0.21 (0.05−0.91) | |||
| FCGR2A rs1801274 |
A | 36 (60.00) | 31 (51.67) | 21 (70.00) | χ2 = 2.85; p = 0.241 |
0.46 (0.19−1.16) | 0.100 |
| G | 24 (40.00) | 29 (48.33) | 9 (30.00) | 2.18 (0.86−5.54) | |||
| CASP3 rs113420705 |
T | 28 (46.67) | 27 (45.00) | 20 (66.67) | χ2 = 4.20; p = 0.122 |
0.41 (0.165−1.02) | 0.056 |
| C | 32 (53.33) | 33 (55.00) | 10 (33.33) | 2.44 (0.98−6.10) |
Abbreviations: χ2 − chi-squared test, p-value – level of its significance; OR – odds ratio (calculated for the outcome “Severe COVID-19/MIS-C”; 95% CI – 95% confidence interval (severe COVID-19/MIS-C – outcome in OR calculation). * − statistically significant result.
Table 5.
Comparison of allele frequencies in children infected by SARS-CoV-2 compared to the general European population.
Table 5.
Comparison of allele frequencies in children infected by SARS-CoV-2 compared to the general European population.
| Gene | Allele | Allele Frequency | pCOVID-19-EUR |
pControl- EUR | ||
|---|---|---|---|---|---|---|
| Children with COVID-19 | Healthy children |
European population |
||||
| ACE2 rs2074192 | C | 0.46 | 0.67 | 0.55 | 0.048* | 0.061 |
| T | 0.54 | 0.33 | 0.45 | |||
| IFNAR2 rs2236757 | G | 0.48 | 0.67 | 0.71 | <0.001* | 0.497 |
| A | 0.52 | 0.33 | 0.29 | |||
| TYK2 rs2304256 | C | 0.66 | 0.77 | 0.72 | 0.144 | 0.390 |
| A | 0.34 | 0.23 | 0.28 | |||
| OAS1 rs10774671 | G | 0.43 | 0.77 | 0.36 | 0.110 | <0.001* |
| A | 0.57 | 0.23 | 0.64 | |||
| OAS3 rs10735079 | A | 0.62 | 0.77 | 0.63 | 0.818 | 0.024* |
| G | 0.38 | 0.23 | 0.37 | |||
| CD40 rs4813003 |
C | 0.94 | 0.80 | 0.86 | 0.011* | 0.342 |
| T | 0.06 | 0.20 | 0.14 | |||
| FCGR2A rs1801274 |
A | 0.56 | 0.70 | 0.51 | 0.271 | 0.039* |
| G | 0.44 | 0.30 | 0.49 | |||
| CASP3 rs113420705 |
T | 0.46 | 0.67 | 0.72 | <0.001* | 0.542 |
| C | 0.54 | 0.33 | 0.28 | |||
Abbreviations: pCOVID-19-EUR – level of statistical significance for comparison of COVID-19 group with general European population; pControl- EUR − level of statistical significance for the comparison control group (healthy children) with general European population. * − statistically significant result.
Table 6.
Sex differences in genotype frequencies among those infected with SARS-CoV-2 and noninfected children.
Table 6.
Sex differences in genotype frequencies among those infected with SARS-CoV-2 and noninfected children.
| Gene |
Genotype/ Allele | COVID-19 (n = 60) | χ2, p/ pF |
Control (n = 15) | χ2, p/ pF |
||
|---|---|---|---|---|---|---|---|
| Boys | Girls | Boys | Girls | ||||
| ACE2 rs2074192 | CC | 13 (39.13) | 8 (38.10) | χ2 = 6.95; p = 0.031* |
5 (71.43) | 3 (37.50) | χ2 = 3.45; p = 0.178 |
| CT | 5 (12.82) | 8 (38.10) | 2 (28.57) | 2 (25.00) | |||
| TT | 21 (53.85) | 5 (23.81) | 0 | 3 (37.50) | |||
| C | 31 (39.74) | 24 (57.14) | pF = 0.085 | 12 (85.71) | 8 (50.00) | pF = 0.058 | |
| T | 47 (60.26)# | 18 (42.86) | 2 (14.29) | 8 (50.00) | |||
| IFNAR2 rs2236757 | GG | 12 (30.77) | 6 (28.57) | χ2 = 0.97; p = 0.615 |
4 (57.14) | 3 (37.50) | χ2 = 2.09; p = 0.352 |
| GA | 15 (38.46) | 6 (28.57) | 3 (42.86) | 3 (37.50) | |||
| AA | 12 (30.77) | 9 (42.86) | 0 | 2 (25.00) | |||
| G | 39 (50.00) | 18 (42.86) | pF = 0.566 | 11 (78.57) | 9 (56.25) | pF = 0.260 | |
| A | 39 (50.00) | 24 (57.14) | 3 (21.43) | 7 (43.75) | |||
| TYK2 rs2304256 | CC | 20 (51.28) | 8 (38.10) | χ2 = 1.25; p = 0.536 |
5 (71.43) | 4 (50.00) | χ2 = 1.25; p = 0.535 |
| CA | 13 (33.33) | 10 (47.62) | 2 (28.57) | 3 (37.50) | |||
| AA | 6 (15.38) | 3 (14.29) | 0 | 1 (12.50) | |||
| C | 53 (67.95) | 26 (61.90) | pF = 0.548 | 12 (85.71) | 11 (68.75) | pF = 0.399 | |
| A | 25 (32.05) | 16 (38.10) | 2 (14.29) | 5 (31.25) | |||
| OAS1 rs10774671 | GG | 8 (20.51) | 5 (23.81) | χ2 = 0.10; p = 0.953 |
4 (57.14) | 4 (50.00) | pF = 1.000 |
| GA | 17 (43.59) | 9 (42.86) | 3 (42.86) | 4 (50.00) | |||
| AA | 14 (35.90) | 7 (33.33) | 0 | 0 | |||
| G | 33 (42.31) | 19 (45.24) | pF = 0.847 | 11 (78.57) | 12 (75.00) | pF = 1.000 | |
| A | 45 (57.69) | 23 (54.76) | 3 (21.43) | 4 (25.00) | |||
| OAS3 rs10735079 |
AA | 19 (48.72) | 9 (42.86) | χ2 = 1.06; p = 0.588 |
4 (57.14) | 6 (75.00) | χ2 = 0.67; p = 0.715 |
| AG | 10 (25.64) | 8 (38.10) | 2 (28.57) | 1 (12.50) | |||
| GG | 10 (25.64) | 4 (19.05) | 1 (14.29) | 1 (12.50) | |||
| A | 48 (61.54) | 26 (61.90) | pF = 1.000 | 10 (71.43) | 13 (81.25) | pF = 0.675 | |
| G | 30 (38.46) | 16 (38.10) | 4 (28.57) | 3 (18.75) | |||
| CD40 rs4813003 |
CC | 34 (87.18) | 19 (90.48) | pF = 1.000 | 5 (71.43) | 5 (62.50) | χ2 = 1.94; p = 0.379 |
| CT | 5 (12.82) | 2 (9.52) | 1 (14.29) | 3 (37.50) | |||
| TT | 0 | 0 | 1 (14.29) | 0 | |||
| C | 73 (93.59) | 40 (95.24) | pF = 1.000 | 11 (78.57) | 13 (81.25) | pF = 1.000 | |
| T | 5 (6.41) | 2 (4.76) | 3 (21.43) | 3 (18.75) | |||
| FCGR2A rs1801274 |
AA | 12 (30.77) | 10 (47.62) | χ2 = 3.00; p = 0.223 |
5 (71.43) | 3 (37.50) | χ2 = 2.65; p = 0.266 |
| AG | 18 (46.15) | 5 (23.81) | 2 (28.57) | 3 (37.50) | |||
| GG | 9 (23.08) | 6 (28.57) | 0 | 2 (25.00) | |||
| A | 42 (53.85) | 25 (59.52) | pF = 0.570 | 12 (85.71) | 9 (56.25) | pF = 0.118 | |
| G | 36 (46.15) | 17 (40.48) | 2 (14.29) | 7 (43.75) | |||
| CASP3 rs113420705 |
TT | 3 (7.69) | 3 (14.29) | χ2 = 2.05; p = 0.358 |
4 (57.14) | 3 (37.50) | χ2 = 0.75; p = 0.687 |
| TC | 27 (69.23) | 16 (76.19) | 2 (28.57) | 4 (50.00) | |||
| CC | 9 (23.08) | 2 (9.52) | 1 (14.29) | 1 (12.50) | |||
| T | 33 (42.31) | 22 (52.38) | pF = 0.339 | 10 (71.43) | 10 (62.50) | pF = 0.709 | |
| C | 45 (57.69) | 20 (47.62) | 4 (28.57) | 6 (37.50) | |||
Abbreviations: χ2 − chi-squared test, p-value – level of its significance. * − statistically significant result.
3.3.9. Alleles Associations and Interrelationships in Children with COVID-19
Our research revealed that children noninfected by SARS-CoV-2 often are the carriers of two or three risk alleles (p < 0.001). However, 30% of COVID-19 patients are carriers of 7–8 risk alleles, which was not typical for healthy children (p = 0.034) (Table 7).
Logistic regression model for COVID-19 prediction based on the child’s sex and alleles was statistically significant (χ2 = 45.96; p < 0.001*) (Table 8). The proposed model explained 41.7% (Nagelkerker R Square) of the variation of COVID-19 susceptibility and correctly predicted 85.3% of cases. Therefore, based on the model the key component of COVID-19 susceptibility in childhood are alleles of genes IFNAR2 rs2236757, OAS1 rs10774671, OAS3 rs10735079, CD40 rs4813003 and CASP3 rs113420705.
Such indicators as male sex, ACE2 rs2074192 allele T, IFNAR2 rs2236757 allele A, OAS1 rs10774671 allele A, CD40 rs4813003 allele C and CASP3 rs113420705 allele C can predict severe COVID-19 course and MIS-C in the pediatric population in 85.6% of cases (Table 9). The proposed model is significant (χ2 = 56.85; p < 0.001) and demonstrates strong goodness of fit — Nagelkerke R square 0.65.
4. Discussion
4.1. Genes Interactions
Conducted research suggests the importance of host genetic factors in the antiviral immunity against SARS-CoV-2 in children. For sure, genetic patterns are stable during whole life; despite this, influence of SNPs on COVID-19 severity was studied first. We focused on the key genes, which play the most significant role in the immune response in COVID-19 and we studied genes related to Kawasaki disease. Network data from GeneMANIA [37] confirmed the interrelationship between studied genes (Figure 2). It should be emphasized that in immune protection many genes are involved. With the exception of eight studied genes (ACE2, IFNAR2, TYK2, OAS1, OAS3, CD40, CASP3, FCGR2A), we also must be focused on the next genes: angiotensin I converting enzyme (ACE), angiotensinogen (AGT), collectrin, amino acid transport regulator (CLTRN), ghrelin and obestatin prepropeptide (GHRL), 2’-5’-oligoadenylate synthetase 2 (OAS2), 2’-5’-oligoadenylate synthetase like (OASL), poly(A) polymerase beta (PAPOLB), poly(A) polymerase gamma (PAPOLG), terminal nucleotidyltransferase 4B (TENT4B), TNF receptor associated factor 2 (TRAF2), TNF receptor associated factor 3 (TRAF3), CASP8 and FADD like apoptosis regulator (CFLAR), thioredoxin (TXN), neogenin 1 (NEO1), glycoprotein VI platelet (GP6), NADH: ubiquinone oxidoreductase core subunit S1 (NDUFS1), Janus kinase 1 (JAK1), Janus kinase and microtubule interacting protein 1 (JAKM1P1), receptor for activated C kinase 1 (RACK1), interleukin 12 receptor subunit beta 1 (IL12RB1) (Figure 2).
Physical interactions between genes in the proposed network model were registered in 35.92% of cases, co-expression in 30.46%, shared protein domains in 17.70%, co-localization in 4.55% and predicted functional relationships between genes in 11.37% of cases (Table 10).
Our study results confirmed genes’ interrelationship in order to predict course of SARS-CoV-2 infection. Regression analysis showed that COVID-19 susceptibility in children increases in cases of interactions of IFNAR2 rs2236757, OAS1 rs10774671, OAS3 rs10735079, CD40 rs4813003 and CASP3 rs113420705. While crucial patterns for development of severe COVID-19 or MIS-C are sex (male gender), ACE2 rs2074192, IFNAR2 rs2236757, OAS1 rs10774671, CD40 rs4813003 and CASP3 rs113420705.
More often pediatric patients with COVID-19 were the carriers of a combination of seven or eight risk alleles. Noninfected children were more likely to be the carriers of three or less risk alleles compared to patients with COVID-19 of different severity.
Importantly, our study has demonstrated the significant prevalence of risk alleles among pediatric COVID-19 group compared to relevant data in European population. These frequency differences were revealed for four studied genes — ACE2 rs2074192 allele T (54% vs. 45%), IFNAR2 rs2236757 allele A (52% vs. 29%), CD40 rs4813003 allele C (94% vs. 86%) and CASP3 rs113420705 allele C (54% vs. 28%). This finding is of great importance for confirmation of genetic susceptibility to SARS-CoV-2 infection.
4.2. ACE2 rs2074192
Gene ACE2 encodes cognominal type 1 membrane protein ACE2 [8]. ACE2 gene is located on the X chromosome (Xp22.2), locus NG_012575 [39,40]. Numerous studies suggest that single-nucleotide polymorphisms (SNPs) in the gene ACE2 are related to the expression of ACE2 and the following binding affinity of SARS-CoV-2 [41,42]. Virus binding to the transmembrane ACE2 protein leads to the interruption of the whole ACE2/Ang1-7/MasR axis and impairs ACE2 enzyme activity. In such conditions, upregulation of ACE/AngII/AT1R is noticed, which leads to the vasoconstriction and activation of pro-inflammatory state [9].
Our research revealed sex differences in risk allele T frequency — boys are more often the carriers of it; and therefore, are more susceptible to SARS-CoV-2 infection. Such sex differences can be explained by the location of ACE2 rs2074192 on the X chromosome. The study suggests that such Xp22 gene location encompasses an area, which is not under the physiological X-inactivation [8]. X-inactivation normally happens in females to ensure population basis gene distribution. Escaping from X-inactivation leads to different phenotypic patterns and sex tissue-specific differences [8].
Allele T of ACE2 rs2074192 shows higher frequency in symptomatic COVID-19 patients compared with the asymptomatic group and it is more often associated with severe outcomes [43]. Previous meta-analyses done by K. Gupta et al. demonstrated genotype contrast between TT vs. CT genotype ACE2 rs2074192 in severe COVID-19 prediction in adult population, but no allele differences [44]. Our research received similar results — genotype differences between studied groups with TT genotype prevalence in children with severe COVID-19/MIS-C. However, our study also demonstrated allele differences and risk allele T influence on the SARS-CoV-2 infection course in children. While in L. E. Martinez-Gomez et al. study codominant, dominant and recessive model study did not reveal significant differences between severe and critical COVID-19 patients [45]. Research in Spain demonstrates protective effect of ACE2 rs2074192 regarding female hospitalization during COVID-19 [40].
Therefore, data regarding ACE2 rs2074192 impact on SARS-CoV-2 are still controversial and future studies must be carried out.
4.3. IFNAR2 rs2236757
SARS-CoV-2 virus has a direct stimulatory effect on interferon stimulated genes (ISG), and also causes the activation of immune cells. ISGs cause an increase in the expression of pro-inflammatory genes. Type I interferon response is among key pathogenetic basis for antiviral host defense. The course of COVID-19 is characterized by reduced production of IFN-I in the early stages of the disease, which in turn causes excessive viremia, which leads to an increase in the virulence of the pathogen. Increased viral replication is a trigger factor for excessive production of pro-inflammatory cytokines. At the same time, studies emphasized the role of the interferon system in inducing a “cytokine storm” by activating the synthesis of TNF/IL-1β [46]. Hadjadj et al. demonstrated that patients with severe COVID-19 have downregulation of IFN-stimulated genes (MX1, IFITM1 and IFIT2) compared to patients with mild and moderate disease severity [47,48,49]. Research suggested that low type I IFN response manifests with worsening of clinical condition up to critical state [17,47]. At the same time, endogenous or exogenous steroids can suppress IFN signaling that manifest in impaired antiviral immune response and increasing disease severity. It is crucial for understanding SARS-CoV-2 course, because glucocorticoids are used in the medical management of MIS-C, acute respiratory distress syndrome and sepsis [50]. Therefore, INF pathway and its genetic control should be assessed in pediatric population.
Intron variant IFNAR2 rs2236757 is located on chromosome 21q22.1 (chr21:34,624,917) [12]. Fricke-Galindo et al. showed association of IFNAR2 rs2236757 with disease severity and mortality risk in adults with COVID-19 [13]. Study of genetic mechanisms of critical COVID-19 also underlined that low expression of IFNAR2 is associated with life-threatening disease, while its high expression has reduced odds of severe COVID-19 [12]. Association of AA genotype rs2236757 with intensive care admission was shown in adult patients infected by SARS-CoV-2 [16,17].
Despite the fact that mortality rate and intensive care unit admission were not in the focus of our research, our findings in pediatric population were in line with public data regarding disease severity — allele A increases the risk of severe COVID-19 and MIS-C in single-gene study and in cases of multigene interaction.
4.4. TYK2 rs2304256
Tyrosine kinase 2 (TYK2) is a protein functioning as Janus kinase/signal transducer and activator of transcription (Jak-STAT) pathways [14]. The Jak-STAT pathway has an important role in the intracellular cell conduction of signals as well as in cytokine release and response [14]. The role of TYK2 in the immune response regulation is confirmed by the experiments, which prove that TYK2 deficiency is associated with an imbalance in the IL-12 and IFN-α/β system [15]. TYK2 activation is carried out by IFN-α, which leads to the phosphorylation of STAT1 and STAT2 and the subsequent dimerization of activated STATs. Subsequent translocation of dimerized STATs in the cell nucleus leads to induction of interferon-stimulated gene expression and activation of antiviral defense [15,51]. TYK2 also stimulates nontraditional pathways of antiviral protection, such as NF-κB signaling and the mitogen-activated protein kinase pathway [51]. The role of TYK2 in macrophage activation is also important. At the same time, TYK2 regulates the activity and function of T-helpers of type 1 and T-helpers of type 17 through a functional connection with IL-12 and IL-23 [15,52]. The differentiation of CD4+ T cells, activated by the interaction of IL-23 with TYK2/Jak2, occurs with the participation of IL-6, IL-1β and TGF-β, which is extremely important in the context of the cytokine storm of COVID-19 [52]. Research showed that the pathogenetic connection of IL-23 with TYK2 also supports the subsequent release of pro-inflammatory cytokines as IL-17 and IL-22. In turn, IL-17 stimulates neutrophils and keratinocytes with the subsequent activation of dendritic cells and release of IL-23, which forms a “closed circle” in the inflammatory process that has arisen [52]. Based on current studies, TYK2 is of great importance in the context of antiviral protection and cytokine releasing.
TYK2 (rs2304256) is a gene that encodes a non-receptor tyrosine-protein kinase; it is a nonsynonymous variant that is located on chromosome 19 in exon 8 (chr19:10,350,533-10,380,608) [53,54]. It is suggested that TYK2 gene is associated with susceptibility to inflammatory and autoimmune disorders [53]. In European population the protective role of minor allele A was demonstrated in systemic lupus erythematosus, type 1 diabetes, psoriasis and idiopathic inflammatory myopathies [53]. Association with autoimmune diseases can be explained by rs2304256-related modification of expression of less common disease variants rs34536443 (P1104A) and rs12720356 (I684S) [53].
Our research did not find any differences in genotype or allele frequencies in TYK2 rs2304256 depending on COVID-19 severity. It can be explained by previously reported absence of altered TYK2 function after acid substitution caused by rs2304256 [53]. Therefore, based on our study TYK2 did not impact COVID-19 outcome or the autoimmune regulatory mechanism that can be defined in MIS-C, but studies are ongoing and other regulatory pathways could be found.
4.5. OAS1 rs10774671 and OAS3 rs10735079
OAS gene family are closely related with interferon stimulated genes (ISG) [46]. OAS genes are located on chromosome 12 (12q24.13 region) and encode the synthesis of oligoadenylate OAS1, OAS2 and OAS3 [19].
Activated by viral RNA (mainly double-stranded) oligoadenylate catalyzes ATP polymerization and activation of ribonuclease latent (RNase L) [55]. Direct Rnase L action leads to viral RNA destruction [19,56]. OAS–Rnase L cleaves viral messenger-RNA and as the result, next viral replication is impossible [55]. RNase L activation leads to the ribosomal and mitochondrial RNA degradation and next apoptosis [57]. It should be emphasized that expression of oligoadenylate synthetases (OAS) is induced by IFN [57]. In turn, OAS-RNase L leads to the amplification of IFN signaling, which again confirms OAS-IFN interaction [57].
Last studies suggest that single-gene inborn errors of the OAS-RNase L leads to the uncontrolled production of pro-inflammatory cytokines by mononuclear phagocytes, which can predispose MIS-C development [58]. Lee et al. revealed that approximately 1% of patient with MIS-C had autosomal recessive deficiencies of OAS1, OAS2 or RNase L [58].
Results of our study demonstrated protective effect of GG genotype OAS1 (rs10774671) in dominant inheritance model regarding severe SARS-CoV-2 (OR = 0.18; p < 0.05), while carriers of allele A have higher risk for worse COVID-19 outcome (OR = 5.71; p < 0.05). Influence of allele A OAS1 rs10774671 in COVID-19 susceptibility and its severe course were confirmed by two logistic models. Our data corresponds to the previously presented data in adult population where involvement of rs10774671 in SARS-Co-V-2 pathogenesis was demonstrated [55]. Presence of allele A is associated with two mRNA variants — p48 and p52 with low OAS activity. While allele G leads to the production of p46 form with high OAS activity [55].
Studies show that the presence of the risk allele G rs10735079 gene leads to decrease in the OAS1 level, which proves the existence of a negative inverse relationship between the severity of the course of COVID-19 and the level of OAS1 [21]. The level of OAS1 is directly related to the hospitalization frequency in cases of diagnosed pneumonia [5,21]. However, the role of oligoadenylate synthases in the elimination of single-stranded viral RNAs remains debatable and requires further study. Still now, current results regarding OAS3 rs10735079 are controversial. Horowitz et al. have performed comparisons between COVID-19 positive patients vs. COVID-19 negative or unknown and reported that allele G was the effecting allele in COVID-19 pathogenesis [59]. At the same time, Pairo-Castineira et al. as well as Pietro et al. presented the allele A rs10735079 influence on COVID-19 manifestations in adults and in children [5,12].
Our study did not reveal any differences in the genetic models between OAS3 rs10735079 studied groups. However, in case of gene interaction, significant impact of OAS3 rs10735079 was shown on COVID-19 susceptibility, but it was not involved in the prediction of MIS-C or severe COVID-19 development. Importantly, that minor allele G frequency in our research was significantly lower in healthy children compared to the European population. This diversity can be explained by small group sample in control group (n = 15). Therefore, next comparisons between allele’s frequencies in infected and noninfected groups were difficult.
4.6. CD40 rs4813003
CD40 is a 48-kDa type I transmembrane protein and belongs to the tumor necrosis factor (TNF) receptor (TNFR) family [26]. It was revealed that cytokine production is stimulated by the CD40 engagement on the surface of dendritic cells [26]. Cell immunity is also mediated through CD40 signaling and as a result, T-cell activation and differentiation are achieved [26]. It is reported that CD40-CD40L interaction leads to the development of CD8+ cytotoxic T lymphocytes, which is crucial in antiviral and anticancer immunity [60]. CD40L is a natural ligand for CD40 also known as CD154 and it is a type II, 39-kDa transmembrane glycoprotein [60,61]. At the same time, CD40 is involved in the regulation of the humoral immune response. B-cell activation by CD40 stimulates immunoglobulin (Ig) isotype switching and Ig somatic hypermutation [26]. As a result, the affinity of Ig to antigen is increased. CD40-CD40L pathway is known as the regulator of the production of IL-10 and IL-12 by monocytes and macrophages [61]. Notwithstanding this, CD40-CD40L signaling is related to the formation of memory B cells and long-lived plasma cells and their survival [26,60]. Also, CD40 has an important role in maintaining the life cycle of B cells, dendritic cells and endothelial cells [26]. Therefore, dysregulation of CD40 is associated with impaired immune response and autoimmune processes. Based on the current knowledge, autoimmunity can be caused by impaired CD40 expression or its abnormal function and as a result the expansion of autoreactive B cells instead of their elimination [61]. It is also shown that activation of the CD40-CD40L pathway is related to sepsis, cardiovascular disease, kidney graft rejection, inflammageing, cancer and cognitive decline [61].
CD40 molecule is encoded by intergenic variant rs4813003 and is located on chromosome 20 (20:46134645; cytogenetic region 20q13.12) [62]. Current research suggest rs4813003 TT genotype reduces the risk to have KD (OR = 0.64), while genotypes CC and CT increase it [28]. Studies confirmed the association of CD40 with KD is mainly related to the East Asian population where risk allele C increased the risk of KD by 1.41 times [23,27,63]. In our research, CD40 rs4813003 genotype frequencies did not differ between study groups and control, while allele C was seen significantly more often among patients with COVID-19 compared with control (p < 0.05). Our study results also demonstrate significant impact of allele C on severe COVID-19 course or MIS-C in both single allele analysis (OR = 4.75; p = 0.037) and in case of allele interactions (OR = 264.57; p = 0.004).
Risk allele C increases not only CD40 function but also increases expression of its ligand CD40L [23,26]. Soluble CD40L is associated with vasculitis and vascular remodeling [64]. Most of the soluble sCD40L is of platelet origin, which indicates the activation of platelets in the lungs’ microcirculation during SARS-CoV-2 infection. sCD40L is able to locally activate endothelial cells, pericytes and smooth muscle cells, stimulate the expression of FGF-2 and, as a result the vascular wall remodeling happened [64]. In this regard, the study of the CD40 rs4813003 polymorphism is important in COVID-19 and MIS-C because cardiovascular system involvement is typical for both of them, especially MIS-C.
4.7. FCGR2A rs1801274
Missense variant rs1801274 encodes transmembrane glycoprotein Fc gamma (γ) receptor IIa and is located on chromosome 1 (1:161505430-161524013, cytogenetic region 1q23.3) in the EC2 domain [62,65,66].
Fc γ receptor (FcγR) presents on the immune cells and can bind with specific antibodies. Complex FcγR and Ig G stimulate the release of cytokines, the production of reactive oxygen species as well as antibody-dependent cellular cytotoxicity and phagocytosis [65,66]. Based on the affinity to different Ig G subtypes, FcγR is divided into three types: FCGR1, FCGR2 and FCGR3. FCGR2 has the lowest affinity to Ig G. Three different subtypes of FCGR2 were revealed — A, B and C. FCGR2 is presented on a variety of immune competent cells, such as natural killers, macrophages and neutrophils [65]. Variable response to infection depends on the Ig F binding affinity. Polymorphism in the rs1801274 variant leads to the formation of two different isoforms of FCGR2 — FcγRIIA-Arg and FcγRIIA- His [66]. These two forms can be made via the substitution of histidine for arginine at position 131 of the FCGR2A protein [67]. FcγRIIA- His have a higher affinity to Ig G1 and Ig G2 compared to FcγRIIA-Arg, while the binding capacity of Ig G3 and Ig G4 is almost the same in both isoforms [66]. Therefore, any deviations in FCGR2A expression can lead to the implicated Ig G binding affinity and, consequently, to immune dysregulation. It is suggested that FCGR2A is responsible for the modulation of severity of infection and autoimmune response, it is not only the marker of KD [66]. It was also proposed to use genetic studies of FCGR in disease management, especially in the case of the prescription of therapeutic antibodies [66].
Study results showed that risk allele G of gene FCGR2A rs1801274 increase the risk of KD either under the homozygous (AA) or heterozygous (AG) model in Asian and Caucasian populations, while allele A has a protective effect [65,68]. At the same time, controversial results were demonstrated by Zhang et al. that the estimation of the association between the FCGR2A rs1801274 polymorphism in Asian and Caucasian populations revealed that risk allele A is related to KD (OR = 1.41; p < 0.001) [69]. Research of adults of European ancestry demonstrated that allele G carriers (FcγRIIA-Arg) are more prone to have lethal outcome firm COVID-19 compared to homozygous AA (OR = 2.2; p = 0.01) [66]. Greek colleagues (Chatzikyriakidou et al.) did not reveal any genotype or allele differences between groups that suffered from KD and healthy control [30]. Cardiovascular events were also not related to rs1801274 polymorphism [30]. Analysis of the previous thirteen case-control studies did not reveal a significant association between FCGR2A rs1801274 and overall pneumonia risk [67].
Our results correspond to European studies. The absence of difference between the control group and the COVID-19 group, as well as the absence of difference between COVID-19 patients and European FCGR2A allele frequencies, demonstrate that this gene is not related to disease severity.
4.8. CASP3 rs113420705
Caspase 3 (CASP3) is a protein in the cysteine-aspartic acid protease (Caspase) family [66]. CASP3 with caspase-2, -6, -7, -8, -9 belongs to the apoptotic caspases [70]. Apoptosis is a well-known mechanism of programmed cell death [70]. Apoptosis is crucial in the viral life cycle; both RNA and DNA viruses cause apoptosis in infected cells to maintain their replication [70]. Pathogen-induced apoptosis may increase apoptosis and viral pathogenicity [71]. Simultaneously, host organisms through IFN-stimulated genes expression try to overcome viral-induced apoptosis as well as maintain antiviral immune defense [70]. An increase in CASP3 level is associated with increased apoptosis [70]. CASP3 could restrain IFN production. CASP3 deficiency is related to enhanced type I IFN secretion and stimulation of innate immune response and as a result, makes cells virally resistant [70]. CASP3 is also responsible for cell growth and differentiation as well as for cytokine expression [68,72].
The CASP3 is the gene located on chromosome 4 (4:184627696-184650062; cytogenetic region 4q35.1) that encodes protein caspase 3 [62]. Alteration in CASP3 expression leads to increased susceptibility to KD in European American and Asian populations [68]. A case-control study in North India demonstrates that persons with CT genotype rs113420705 of CASP3 are more prone to have KD and carriers of minor allele C most often have coronary artery aneurysm compared with T allele carriers [73]. Our study showed significantly higher frequency of allele C rs113420705 in children with COVID-19 compared to European ancestry data.
CASP3 gene is also important for injury prevention caused by viral infection (SARS-CoV-2, hepatitis C virus, Enterovirus 71 infection, H-1 parvovirus) because CASP3 maintains cellular homeostasis and viability [72]. Therefore, it is suggested that caspase’s level and its gene expression could predict viral disease severity. In addition, hematological and immunological parameters in COVID-19 can be associated with dysregulated caspase activation [69]. In COVID-19 patients, CASP3 activity is upregulated in red blood cells and platelets cell death can also be related to CASP3 [71].
Results of our study showed significant impact of CASP3 rs113420705 on the COVID-19 susceptibility and a worse outcome development in children.
5. Conclusions
SARS-CoV-2 infection in children has different severity and outcomes. The clinical course varies from asymptomatic, mild forms to severe COVID-19 symptoms, even MIS-C. Among the influencing factors, genetics is one of the most important. The allele T ACE2 rs2074192 (OR = 3.45; p = 0.009), allele A IFNAR2 rs2236757 (OR = 2.62; p = 0.039), allele A OAS1 rs10774671 (OR = 4.60; p = 0.003), allele C CD40 rs4813003 (OR = 4.75; p = 0.037) are associated with severe illness of COVID-19 and could advance to MIS-C. In the multifactorial model, it was shown that males in addition to ACE2, IFNAR2, OAS1, CD40 genes, as well as CASP3 rs113420705 gene (allele C) make the clinical outcome of COVID-19 worse. The carriers of pathogenic risk alleles are more prone to suffer from severe illness of COVID-19. These findings can help in the management of SARS-CoV-2 infections in children and in COVID-19 prevention.
Author Contributions
Conceptualization, K.K., H.P., S.G.V.; methodology, K.K., S.G.V., A.K.; software, K.K.; investigation, resources, K.K., H.P.; data curation, writing—original draft preparation, K.K.; writing—review and editing, K.K., S.G.V., H.P., A.K., O.S.; visualization, K.K.; supervision, S.G.V., M.K.; project administration, S.G.V., O.S., M.K. A.K., K.K.; funding acquisition, K.K., A.K. All authors have read and agreed to the published version of the manuscript.
Funding
This research was funded by RECOOP Fusion Grant # 030 “COVID-19 Severity and Gene Polymorphism in Children and Adults.”
Institutional Review Board Statement
The study was conducted in accordance with the Declaration of Helsinki and approved by the Bioethics Committee of I. Horbachevsky Ternopil National Medical University (Protocol No 71, dated October 25, 2022).
Informed Consent Statement
Informed consent was obtained from all subjects involved in the study.
Data Availability Statement
Data is contained within the article or supplementary material.
Acknowledgments
We thank the Cedars- Sinai Medical Center International Research and Innovation in Medicine Program, and the Association for Regional Cooperation in the Fields of Health, Science and Technology (RECOOP HST Association) for their support.
Conflicts of Interest
The authors declare no conflict of interest.
References
- World Health Organization. Available online: https://covid19.who.int/.
- UNICEF. Available online: https://data.unicef.org/topic/child-survival/covid-19/.
- Nathanielsz, J.; Toh, Z. Q.; Do, L. A. H.; Mulholland, K.; Licciardi, P. V. SARS-CoV-2 Infection in Children and Implications for Vaccination. Pediatr. Res. 2023, 93, 1177–1187. [Google Scholar] [CrossRef] [PubMed]
- Kozak, K. V; Pavlyshyn, H. A.; Avramenko, I. Y.; Dyvonyak, O. M.; Hlushko, K. T. SARS-CoV-2 Infection and Thyroid Dysfunction in Children. Ukr. Biochem. J. 2023, 95, 12–21. [Google Scholar] [CrossRef]
- Di Pietro, G. M.; Ronzoni, L.; Meschia, L. M.; Tagliabue, C.; Lombardi, A.; Pinzani, R.; Bosis, S.; Marchisio, P. G.; Valenti, L. SARS-CoV-2 Infection in Children: A 24 Months Experience with Focus on Risk Factors in a Pediatric Tertiary Care Hospital in Milan, Italy. Front. Pediatr. 2023, 11, 1–12. [Google Scholar] [CrossRef] [PubMed]
- Leonardi, L.; Rivalta, B.; Leone, F.; Cancrini, C.; Caffarelli, C.; Marseglia, G. L.; Cardinale, F. Host Defenses to Viruses: Lessons from Inborn Errors of Immunity. Med. 2022, 58, 1–11. [Google Scholar] [CrossRef] [PubMed]
- Sánchez-González, M. T.; Cienfuegos-Jiménez, O.; Álvarez-Cuevas, S.; Pérez-Maya, A. A.; Borrego-Soto, G.; Marino-Martínez, I. A. Prevalence of the SNP Rs10774671 of the OAS1 Gene in Mexico as a Possible Predisposing Factor for RNA Virus Disease. Int. J. Mol. Epidemiol. Genet. 2021, 12, 52–60. [Google Scholar]
- Burrell, L. M.; Harrap, S. B.; Velkoska, E.; Patel, S. K. The ACE2 Gene: Its Potential as a Functional Candidate for Cardiovascular Disease. Clin. Sci. 2013, 124, 65–76. [Google Scholar] [CrossRef]
- Gintoni, I.; Adamopoulou, M.; Yapijakis, C. The Impact of ACE and ACE2 Gene Polymorphisms in Pulmonary Diseases Including COVID-19. In Vivo (Brooklyn). 2022, 36, 13–29. [Google Scholar] [CrossRef]
- Fernández-de-las-Peñas, C.; Arendt-Nielsen, L.; Díaz-Gil, G.; Gómez-Esquer, F.; Gil-Crujera, A.; Gómez-Sánchez, S. M.; Ambite-Quesada, S.; Palomar-Gallego, M. A.; Pellicer-Valero, O. J.; Giordano, R. Genetic Association between ACE2 (Rs2285666 and Rs2074192) and TMPRSS2 (Rs12329760 and Rs2070788) Polymorphisms with Post-COVID Symptoms in Previously Hospitalized COVID-19 Survivors. Genes (Basel). 2022, 13, 1935. [Google Scholar] [CrossRef]
- Ong, S. Y. Q.; Flyamer, I. M.; Bickmore, W. A.; Biddie, S. C. From Bedside to Bench: Regulation of Host Factors in SARS-CoV-2 Infection. Exp. Mol. Med. 2021, 53, 483–494. [Google Scholar] [CrossRef]
- Pairo-Castineira, E.; Clohisey, S.; Klaric, L.; Bretherick, A. D.; Rawlik, K.; Pasko, D.; Walker, S.; Parkinson, N.; Al, E. Genetic Mechanisms of Critical Illness in COVID-19. Nature 2021, 591, 92–98. [Google Scholar] [CrossRef]
- Fricke-Galindo, I.; Martínez-Morales, A.; Chávez-Galán, L.; Ocaña-Guzmán, R.; Buendía-Roldán, I.; Pérez-Rubio, G.; Hernández-Zenteno, R. de J.; Verónica-Aguilar, A.; Alarcón-Dionet, A.; Aguilar-Duran, H.; Gutiérrez-Pérez, I. A.; Zaragoza-García, O.; Alanis-Ponce, J.; Camarena, A.; Bautista-Becerril, B.; Nava-Quiroz, K. J.; Mejía, M.; Guzmán-Guzmán, I. P.; Falfán-Valencia, R. IFNAR2 Relevance in the Clinical Outcome of Individuals with Severe COVID-19. Front. Immunol. 2022, 13, 1–9. [Google Scholar] [CrossRef] [PubMed]
- Rusiñol, L.; Puig, L. Tyk2 Targeting in Immune-Mediated Inflammatory Diseases. Int. J. Mol. Sci. 2023, 24, 3391. [Google Scholar] [CrossRef] [PubMed]
- Muromoto, R.; Oritani, K.; Matsuda, T. Current Understanding of the Role of Tyrosine Kinase 2 Signaling in Immune Responses. World J. Biol. Chem. 2022, 13, 1–14. [Google Scholar] [CrossRef]
- Dieter, C.; de Almeida Brondani, L.; Lemos, N. E.; Schaeffer, A. F.; Zanotto, C.; Ramos, D. T.; Girardi, E.; Pellenz, F. M.; Camargo, J. L.; Moresco, K. S.; da Silva, L. L.; Aubin, M. R.; de Oliveira, M. S.; Rech, T. H.; Canani, L. H.; Gerchman, F.; Leitão, C. B.; Crispim, D. Polymorphisms in ACE1, TMPRSS2, IFIH1, IFNAR2, and TYK2 Genes Are Associated with Worse Clinical Outcomes in COVID-19. Genes (Basel). 2023, 14, 29. [Google Scholar] [CrossRef] [PubMed]
- Benmansour, R.; Tagajdid, M. R.; Elkochri, S.; Aabi, R.; Elannaz, H.; Laraqui, A.; Mchichi, B. El; Touil, N.; Ennibi, K.; Amine, I. L. Genetic Susceptibility to Severe Forms of COVID-19: What We Learned in 2022. Saudi J. Pathol. Microbiol. 2023, 8, 90–98. [Google Scholar] [CrossRef]
- Zabihi Rizi, F.; Ghorbani, A.; Zahtab, P.; Darbaghshahi, N. N.; Ataee, N.; Pourhamzeh, P.; Hamzei, B.; Dolatabadi, N. F.; Zamani, A.; Hooshmand, M. TYK2 Single-Nucleotide Variants Associated with the Severity of COVID-19 Disease. Arch. Virol. 2023, 168, 119. [Google Scholar] [CrossRef]
- Rouf Banday, A.; Stanifer, M. L.; Florez-Vargas, O.; Onabajo, O. O.; Papenberg, B. W.; Zahoor, M. A.; Mirabello, L.; Ring, T. J.; Lee, C.-H.; Albert, P. S.; Andreakos, E.; Arons, E.; Barsh, G.; Biesecker, L. G.; Boyle, D. L.; Brahier, M. S.; Burnett-Hartman, A.; Carrington, M.; Chang, E.; Gyun Choe, P.; Chisholm, R. L.; Colli, L. M.; Dalgard, C. L.; Dude, C. M.; Edberg, J.; Erdmann, N.; Feigelson, H. S.; Fonseca, B. A.; Firestein, G. S.; Gehring, A. J.; Guo, C.; Ho, M.; Holland, S.; Hutchinson, A. A.; Im, H.; Irby, L.; Ison, M. G.; Joseph, N. T.; Bin Kim, H.; Kreitman, R. J.; Korf, B. R.; Lipkin, S. M.; Mahgoub, S. M.; Mohammed, I.; Paschoalini, G. L.; Pacheco, J. A.; Peluso, M. J.; Rader, D. J.; Redden, D. T.; Ritchie, M. D.; Rosenblum, B.; Elizabeth Ross, M.; Sant Anna, H. P.; Savage, S. A.; Sharma, S.; Siouti, E.; Smith, A. K.; Triantafyllia, V.; Vargas, J. M.; Vargas, J. D.; Verma, A.; Vij, V.; Wesemann, D. R.; Yeager, M.; Yu, X.; Zhang, Y.; Boulant, S.; Chanock, S. J.; Feld, J. J.; Prokunina-Olsson, L. Genetic Regulation of OAS1 Nonsense-Mediated Decay Underlies Association with COVID-19 Hospitalization in Patients of European and African Ancestries. Nat. Genet. 2022, 54, 1103–1116. [Google Scholar] [CrossRef]
- Raza, R. Z.; Abbasi, S. W. An Evolutionary Insight Into the Heterogeneous Severity Pattern of the SARS-CoV-2 Infection. Front. Genet. 2022, 13, 1–6. [Google Scholar] [CrossRef]
- Steffen, B. T.; Pankow, J. S.; Lutsey, P. L.; Demmer, R. T.; Misialek, J. R.; Guan, W.; Cowan, L. T.; Coresh, J.; Norby, F. L.; Tang, W. Proteomic Profiling Identifies Novel Proteins for Genetic Risk of Severe COVID-19: The Atherosclerosis Risk in Communities Study. Hum. Mol. Genet. 2022, 31, 2452–2461. [Google Scholar] [CrossRef]
- Sancho-Shimizu, V.; Brodin, P.; Cobat, A.; Biggs, C. M.; Toubiana, J.; Lucas, C. L.; Henrikson, S. E.; Belot, A.; Tangye, S. G.; Milner, J. D.; Levin, M.; Abel, L.; Bogunovic, D.; Casanova, J. L.; Zhang, S. Y. SARS-CoV-2-Related MIS-C: A Key to the Viral and Genetic Causes of Kawasaki Disease? J. Exp. Med. 2021, 218, e20210446. [Google Scholar] [CrossRef]
- Kumrah, R.; Vignesh, P.; Rawat, A.; Singh, S. Immunogenetics of Kawasaki Disease. Clin. Rev. Allergy Immunol. 2020, 59, 122–139. [Google Scholar] [CrossRef] [PubMed]
- Onouchi, Y. The Genetics of Kawasaki Disease. Int. J. Rheum. Dis. 2018, 21, 26–30. [Google Scholar] [CrossRef] [PubMed]
- Chaudhary, H.; Nameirakpam, J.; Kumrah, R.; Pandiarajan, V.; Suri, D.; Rawat, A.; Singh, S. Biomarkers for Kawasaki Disease: Clinical Utility and the Challenges Ahead. Front. Pediatr. 2019, 7, 1–10. [Google Scholar] [CrossRef] [PubMed]
- Elgueta, R.; Benson, M. J.; De Vries, V. C.; Wasiuk, A.; Guo, Y.; Noelle, R. J. Molecular Mechanism and Function of CD40/CD40L Engagement in the Immune System. Immunol. Rev. 2009, 229, 152–172. [Google Scholar] [CrossRef] [PubMed]
- Chen, M. R.; Chang, T. Y.; Chiu, N. C.; Chi, H.; Yang, K. D.; Chang, L.; Huang, D. T. N.; Huang, F. Y.; Lien, Y. P.; Lin, W. S.; Lin, C. L.; Chang, L. Y.; Lee, Y. J. Validation of Genome-Wide Associated Variants for Kawasaki Disease in a Taiwanese Case–Control Sample. Sci. Rep. 2020, 10, 11756. [Google Scholar] [CrossRef]
- Lou, J.; Zhong, R.; Shen, N.; Lu, X. Z.; Ke, J. T.; Duan, J. Y.; Qi, Y. Q.; Wang, Y. J.; Zhang, Q.; Wang, W.; Gong, F. Q.; Miao, X. P. Systematic Confirmation Study of GWAS-Identified Genetic Variants for Kawasaki Disease in A Chinese Population. Sci. Rep. 2015, 5, 8194. [Google Scholar] [CrossRef]
- Hara, T.; Yamamura, K.; Sakai, Y. The Up-to-Date Pathophysiology of Kawasaki Disease. Clin. Transl. Immunol. 2021, 10, 1–14. [Google Scholar] [CrossRef]
- Chatzikyriakidou, A.; Aidinidou, L.; Giannopoulos, A.; Papadopoulou-Legbelou, K.; Kalinderi, K.; Fidani, L. Absence of Association of FCGR2A Gene Polymorphism Rs1801274 with Kawasaki Disease in Greek Patients. Cardiol. Young 2015, 25, 681–683. [Google Scholar] [CrossRef]
- Uzuncakmak, S. K.; Dirican, E.; Naldan, M. E.; Can, F. K.; Halıcı, Z. Investigation of CYP2E1 and Caspase-3 Gene Expressions in COVID-19 Patients. Gene. Rep. 2022, 26, 101497. [Google Scholar] [CrossRef]
- Venturini, E.; Montagnani, C.; Garazzino, S.; Donà, D.; Pierantoni, L.; Vecchio, A. Lo; Krzysztofiak, A.; Nicolini, G.; Bianchini, S.; Galli, L.; Villani, A.; Gattinara, G. C. Treatment of Children with COVID-19: Update of the Italian Society of Pediatric Infectious Diseases Position Paper. Ital. J. Pediatr. 2021, 47, 199. [Google Scholar] [CrossRef]
- Dona’, D.; Montagnani, C.; Di Chiara, C.; Venturini, E.; Galli, L.; Lo Vecchio, A.; Denina, M.; Olivini, N.; Bruzzese, E.; Campana, A.; Giacchero, R.; Salvini, F.; Meini, A.; Ponzoni, M.; Trapani, S.; Rossi, E.; Lombardi, M. H.; Badolato, R.; Pierri, L.; Pruccoli, G.; Rossin, S.; Colomba, C.; Cazzato, S.; Pacati, I.; Nicolini, G.; Pierantoni, L.; Bianchini, S.; Krzysztofiak, A.; Garazzino, S.; Giaquinto, C.; Castelli Gattinara, G. COVID-19 in Infants Less than 3 Months: Severe or Not Severe Disease? Viruses 2022, 14, 2256. [Google Scholar] [CrossRef] [PubMed]
- National Institutes of Health. Available online: https://www.covid19treatmentguidelines.nih.gov/about-the-guidelines/.
- World Health Organization. Available online: https://www.who.int/news-room/commentaries/detail/multisystem-inflammatory-syndrome-in-children-and-adolescents-with-covid-19.
- Howie, S. R. C. Blood Sample Volumes in Child Health Research: Review of Safe Limits. Bull. World Health Organ. 2011, 89, 46–53. [Google Scholar] [CrossRef] [PubMed]
- GeneMANIA. Available online: https://genemania.org/.
- L. Phan, Y. Jin, H. Zhang, W. Qiang, E. Shekhtman, D. Shao, D. Revoe, R. Villamarin, E. Ivanchenko, M. Kimura, Z. Y. Wang, L. Hao, N. Sharopova, M. Bihan, A. Sturcke, M. Lee, N. Popova, W. Wu, C. Bastiani, M. Ward, J. B. Holmes, V. Lyoshin, K. Kaur, E. Mo, and B. L. K. ALFA: Allele Frequency Aggregator. National Center for Biotechnology Information, U.S. National Library of Medicine.
- Gómez, J.; Albaiceta, G. M.; García-Clemente, M.; López-Larrea, C.; Amado-Rodríguez, L.; Lopez-Alonso, I.; Hermida, T.; Enriquez, A. I.; Herrero, P.; Melón, S.; Alvarez-Argüelles, M. E.; Boga, J. A.; Rojo-Alba, S.; Cuesta-Llavona, E.; Alvarez, V.; Lorca, R.; Coto, E. Angiotensin-Converting Enzymes (ACE, ACE2) Gene Variants and COVID-19 Outcome. Gene 2020, 762, 145102. [Google Scholar] [CrossRef]
- Sabater Molina, M.; Nicolás Rocamora, E.; Bendicho, A. I.; Vázquez, E. G.; Zorio, E.; Rodriguez, F. D.; Gil Ortuño, C.; Rodríguez, A. I.; Sánchez-López, A. J.; Jara Rubio, R.; Moreno-Docón, A.; Marcos, P. J.; García Pavía, P.; Villa, R. B.; Gimeno Blanes, J. R. Polymorphisms in ACE, ACE2, AGTR1 Genes and Severity of COVID-19 Disease. PLoS One 2022, 17, e0263140. [Google Scholar] [CrossRef] [PubMed]
- Möhlendick, B.; Schönfelder, K.; Breuckmann, K.; Elsner, C.; Babel, N.; Balfanz, P.; Dahl, E.; Dreher, M.; Fistera, D.; Herbstreit, F.; Hölzer, B.; Koch, M.; Kohnle, M.; Marx, N.; Risse, J.; Schmidt, K.; Skrzypczyk, S.; Sutharsan, S.; Taube, C.; Westhoff, T. H.; Jöckel, K. H.; Dittmer, U.; Siffert, W.; Kribben, A. ACE2 Polymorphism and Susceptibility for SARS-CoV-2 Infection and Severity of COVID-19. Pharmacogenet. Genomics 2021, 31, 165–171. [Google Scholar] [CrossRef]
- Buchynskyi, M.; Oksenych, V.; Kamyshna, I.; Vari, S. G.; Kamyshnyi, A. Genetic Predictors of Comorbid Course of COVID-19 and MAFLD : A Comprehensive Analysis. Viruses. 2023, 15, 1724. [Google Scholar] [CrossRef]
- Cafiero, C.; Rosapepe, F.; Palmirotta, R.; Re, A.; Ottaiano, M. P.; Benincasa, G.; Perone, R.; Varriale, E.; D'Amato, G.; Cacciamani, A.; Micera, A.; Pisconti, S. Angiotensin System Polymorphisms’ in SARS-CoV-2 Positive Patients: Assessment Between Symptomatic and Asymptomatic Patients: A Pilot Study. Pharmgenomics. Pers. Med. 2021, 14, 621–629. [Google Scholar] [CrossRef]
- Gupta, K.; Kaur, G.; Pathak, T.; Banerjee, I. Systematic Review and Meta-Analysis of Human Genetic Variants Contributing to COVID-19 Susceptibility and Severity. Gene 2022, 844, 146790. [Google Scholar] [CrossRef]
- Martínez-Gómez, L. E.; Herrera-López, B.; Martinez-Armenta, C.; Ortega-Peña, S.; Camacho-Rea, M.; del, C.; Suarez-Ahedo, C.; Vázquez-Cárdenas, P.; Vargas-Alarcón, G.; Rojas-Velasco, G.; Fragoso, J. M.; Vidal-Vázquez, P.; Ramírez-Hinojosa, J. P.; Rodríguez-Sánchez, Y.; Barrón-Díaz, D.; Moreno, M. L.; Martínez-Ruiz, F. de J.; Zayago-Angeles, D. M.; Mata-Miranda, M. M.; Vázquez-Zapién, G. J.; Martínez-Cuazitl, A.; Barajas-Galicia, E.; Bustamante-Silva, L.; Zazueta-Arroyo, D.; Rodríguez-Pérez, J. M.; Hernández-González, O.; Coronado-Zarco, R.; Lucas-Tenorio, V.; Franco-Cendejas, R.; López-Jácome, L. E.; Vázquez-Juárez, R. C.; Magaña, J. J.; Cruz-Ramos, M.; Granados, J.; Hernández-Doño, S.; Delgado-Saldivar, D.; Ramos-Tavera, L.; Coronado-Zarco, I.; Guajardo-Salinas, G.; Muñoz-Valle, J. F.; Pineda, C.; Martínez-Nava, G. A.; López-Reyes, A. ACE and ACE2 Gene Variants Are Associated With Severe Outcomes of COVID-19 in Men. Front. Immunol. 2022, 13, 1–10. [Google Scholar] [CrossRef]
- Gao, L. J.; He, Z. M.; Li, Y. Y.; Yang, R. R.; Yan, M.; Shang, X.; Cao, J. M. Role of OAS Gene Family in COVID-19 Induced Heart Failure. J. Transl. Med. 2023, 21, 212. [Google Scholar] [CrossRef]
- Hadjadj, J.; Yatim, N.; Barnabei, L.; Corneau, A.; Boussier, J.; Smith, N.; Péré, H.; Charbit, B.; Bondet, V.; Chenevier-Gobeaux, C.; Breillat, P.; Carlier, N.; Gauzit, R.; Morbieu, C.; Pène, F.; Marin, N.; Roche, N.; Szwebel, T. A.; Merkling, S. H.; Treluyer, J. M.; Veyer, D.; Mouthon, L.; Blanc, C.; Tharaux, P. L.; Rozenberg, F.; Fischer, A.; Duffy, D.; Rieux-Laucat, F.; Kernéis, S.; Terrier, B. Impaired Type I Interferon Activity and Inflammatory Responses in Severe COVID-19 Patients. Science. 2020, 369, 718–724. [Google Scholar] [CrossRef] [PubMed]
- Buchynskyi, M.; Kamyshna, I.; Lyubomirskaya, K.; Moshynets, O.; Kobyliak, N.; Oksenych, V.; Kamyshnyi, A. Efficacy of Interferon Alpha for the Treatment of Hospitalized Patients with COVID-19: A Meta-Analysis. Front. Immunol. 2023, 14, 1069894. [Google Scholar] [CrossRef] [PubMed]
- Kamyshnyi, A.; Koval, H.; Kobevko, O.; Buchynskyi, M.; Oksenych, V.; Kainov, D.; Lyubomirskaya, K.; Kamyshna, I.; Potters, G.; Moshynets, O. Therapeutic Effectiveness of Interferon-α2b against COVID-19 with Community-Acquired Pneumonia: The Ukrainian Experience. Int. J. Mol. Sci. 2023, 24, 6887. [Google Scholar] [CrossRef] [PubMed]
- Jalkanen, J.; Khan, S.; Elima, K.; Huttunen, T.; Wang, N.; Hollmén, M.; Elo, L. L.; Jalkanen, S. Polymorphism in Interferon Alpha/Beta Receptor Contributes to Glucocorticoid Response and Outcome of ARDS and COVID-19. Crit. Care 2023, 27, 112. [Google Scholar] [CrossRef]
- Yang, L.; Xie, X.; Tu, Z.; Fu, J.; Xu, D.; Zhou, Y. The Signal Pathways and Treatment of Cytokine Storm in COVID-19. Sig. Transduct. Target. Ther. 2021, 6, 255. [Google Scholar] [CrossRef]
- Ghoreschi, K.; Augustin, M.; Baraliakos, X.; Krönke, G.; Schneider, M.; Schreiber, S.; Schulze-Koops, H.; Zeißig, S.; Thaçi, D. TYK2 Inhibition and Its Potential in the Treatment of Chronic Inflammatory Immune Diseases. J. Dtsch. Dermatol. Ges. 2021, 19, 1409–1420. [Google Scholar] [CrossRef]
- Li, Z.; Rotival, M.; Patin, E.; Michel, F.; Pellegrini, S. Two Common Disease-Associated TYK2 Variants Impact Exon Splicing and TYK2 Dosage. PLoS One 2020, 15, e0225289. [Google Scholar] [CrossRef]
- GeneCards. Available online: https://www.genecards.org/cgi-bin/carddisp.pl?gene=TYK2.
- Gokul, A.; Arumugam, T.; Ramsuran, V. Genetic Ethnic Differences in Human 2'-5'-Oligoadenylate Synthetase and Disease Associations: A Systemic Review. Genes (Basel) 2023, 14, 527. [Google Scholar] [CrossRef]
- Zhao, Y.; Kang, H.; Ji, Y.; Chen, X. Evaluate the Relationship between Polymorphisms of OAS1 Gene and Susceptibility to Chronic Hepatitis C with High Resolution Melting Analysis. Clin. Exp. Med. 2013, 13, 171–176. [Google Scholar] [CrossRef]
- Drappier, M.; Michiels, T. Inhibition of the OAS/RNase L Pathway by Viruses. Curr. Opin. Viral. 2015, 15, 19–26. [Google Scholar] [CrossRef]
- Lee, D.; Le Pen, J.; Yatim, A.; Dong, B.; Aquino, Y.; Ogishi, M.; Pescarmona, R.; Talouarn, E.; Rinchai, D.; Zhang, P.; Al, E. Inborn Errors of OAS-RNase L in SARS-CoV-2-Related Multisystem Inflammatory Syndrome in Children. Science. 2023, 379, eabo3627. [Google Scholar] [CrossRef]
- Horowitz, J. E.; Kosmicki, J. A.; Damask, A.; Sharma, D.; Roberts, G. H. L.; Justice, A. E.; Banerjee, N.; Coignet, M. V.; Yadav, A.; Leader, J. B.; Marcketta, A.; Park, D. S.; Lanche, R.; Maxwell, E.; Knight, S. C.; Bai, X.; Guturu, H.; Sun, D.; Baltzell, A.; Kury, F. S. P.; Backman, J. D.; Girshick, A. R.; O’Dushlaine, C.; McCurdy, S. R.; Partha, R.; Mansfield, A. J.; Turissini, D. A.; Li, A. H.; Zhang, M.; Mbatchou, J.; Watanabe, K.; Gurski, L.; McCarthy, S. E.; Kang, H. M.; Dobbyn, L.; Stahl, E.; Verma, A.; Sirugo, G.; Ritchie, M. D.; Jones, M.; Balasubramanian, S.; Siminovitch, K.; Salerno, W. J.; Shuldiner, A. R.; Rader, D. J.; Mirshahi, T.; Locke, A. E.; Marchini, J.; Overton, J. D.; Carey, D. J.; Habegger, L.; Cantor, M. N.; Rand, K. A.; Hong, E. L.; Reid, J. G.; Ball, C. A.; Baras, A.; Abecasis, G. R.; Ferreira, M. A. R. Genome-Wide Analysis Provides Genetic Evidence That ACE2 Influences COVID-19 Risk and Yields Risk Scores Associated with Severe Disease. Nat. Genet. 2022, 54, 382–392. [Google Scholar] [CrossRef]
- Ara, A.; Ahmed, K. A.; Xiang, J. Multiple Effects of CD40–CD40L Axis in Immunity against Infection and Cancer. Immunotargets Ther. 2018, 7, 55–61. [Google Scholar] [CrossRef] [PubMed]
- Marengo, M.; Migliori, M.; Merlotti, G.; Fabbrini, P.; Panichi, V.; Cantaluppi, V. Role of the CD40-CD40 Ligand Pathway in Cardiovascular Events, Neurological Alterations, and Other Clinical Complications of Chronic Hemodialysis Patients: Protective Role of Adsorptive Membranes. Blood Purif. 2023, 1–16. [Google Scholar] [CrossRef]
- GWAS Catalog. Available online: https://www.ebi.ac.uk/gwas/home.
- Onouchi, Y.; Ozaki, K.; Burns, J. C.; Shimizu, C.; Terai, M.; Hamada, H.; Honda, T.; Suzuki, H.; Suenaga, T.; Takeuchi, T.; Yoshikawa, N.; Suzuki, Y.; Yasukawa, K.; Ebata, R.; Higashi, K.; Saji, T.; Kemmotsu, Y.; Takatsuki, S.; Ouchi, K.; Kishi, F.; Yoshikawa, T.; Nagai, T.; Hamamoto, K.; Sato, Y.; Honda, A.; Kobayashi, H.; Sato, J.; Shibuta, S.; Miyawaki, M.; Oishi, K.; Yamaga, H.; Aoyagi, N.; Iwahashi, S.; Miyashita, R.; Murata, Y.; Sasago, K.; Takahashi, A.; Kamatani, N.; Kubo, M.; Tsunoda, T.; Hata, A.; Nakamura, Y.; Tanaka, T.; Abe, J.; Kobayashi, T.; Arakawa, H.; Ichida, F.; Nomura, Y.; Miura, M.; Ikeda, K.; Hara, T.; Fukazawa, R.; Ogawa, S.; Hamaoka, K.; Newburger, J. W.; Baker, A. L.; Rowley, A. H.; Shulman, S. T.; Melish, M. E.; Mason, W. H.; Takahashi, M.; Tremoulet, A. H. A Genome-Wide Association Study Identifies Three New Risk Loci for Kawasaki Disease. Nat. Genet. 2012, 44, 517–521. [Google Scholar] [CrossRef] [PubMed]
- Petrey, A. C.; Qeadan, F.; Middleton, E. A.; Pinchuk, I. V.; Campbell, R. A.; Beswick, E. J. Cytokine Release Syndrome in COVID-19: Innate Immune, Vascular, and Platelet Pathogenic Factors Differ in Severity of Disease and Sex. J. Leukoc. Biol. 2021, 109, 55–66. [Google Scholar] [CrossRef]
- Wang, Z.; Geng, P. L. CD32a Polymorphism Rs1801274 Affects the Risk of Kawasaki Disease. Artif. Cells Nanomed. Biotechnol. 2020, 48, 620–626. [Google Scholar] [CrossRef]
- López-Martínez, R.; Albaiceta, G. M.; Amado-Rodríguez, L.; Cuesta-Llavona, E.; Gómez, J.; García-Clemente, M.; Vázquez-Coto, D.; Alvarez, V.; Coto, E. The FCGR2A Rs1801274 Polymorphism Was Associated with the Risk of Death among COVID-19 Patients. Clin. Immunol. 2022, 236, 108954. [Google Scholar] [CrossRef]
- Shi, X.; Ma, Y.; Li, H.; Yu, H. Association between FCGR2A Rs1801274 and MUC5B Rs35705950 Variations and Pneumonia Susceptibility. BMC Med. Genet. 2020, 21, 71. [Google Scholar] [CrossRef]
- Ferdosian, F.; Dastgheib, S. A.; Hosseini-Jangjou, S. H.; Nafei, Z.; Lookzadeh, M. H.; Noorishadkam, M.; Mirjalili, S. R.; Neamatzadeh, H. Association of TNF-α Rs1800629, CASP3 Rs72689236 and FCGR2A Rs1801274 Polymorphisms with Susceptibility to Kawasaki Disease: A Comprehensive Meta-Analysis. Fetal Pediatr. Pathol. 2021, 40, 320–336. [Google Scholar] [CrossRef]
- Zhang, C.; Wang, W.; Zhang, H.; Wei, L.; Guo, S. Association of FCGR2A Rs1801274 Polymorphism with Susceptibility to Autoimmune Diseases: A Meta-Analysis. Oncotarget 2016, 7, 39436–39443. [Google Scholar] [CrossRef] [PubMed]
- Ning, X.; Wang, Y.; Jing, M.; Sha, M.; Lv, M.; Gao, P.; Zhang, R.; Huang, X.; Feng, J. M.; Jiang, Z. Apoptotic Caspases Suppress Type I Interferon Production via the Cleavage of CGAS, MAVS, and IRF3. Mol. Cell 2019, 74, 19–31.e7. [Google Scholar] [CrossRef] [PubMed]
- Premeaux, T. A.; Yeung, S. T.; Bukhari, Z.; Bowler, S.; Alpan, O.; Gupta, R.; Ndhlovu, L. C.; Tincati, C. Emerging Insights on Caspases in COVID-19 Pathogenesis, Sequelae, and Directed Therapies. Front. Immunol. 2022, 13, 842740. [Google Scholar] [CrossRef] [PubMed]
- Yildiz Gulhan, P.; Eroz, R.; Ataoglu, O.; İnce, N.; Davran, F.; Öztürk, C. E.; Gamsızkan, Z.; Balbay, O. A. The Evaluation of Both the Expression and Serum Protein Levels of Caspase-3 Gene in Patients with Different Degrees of SARS-CoV2 Infection. J. Med. Virol. 2022, 94, 897–905. [Google Scholar] [CrossRef] [PubMed]
- K, G. Das; Bhattarai, D.; Anupriya, Kaur; Kaur, A.; Rajni, Kumrah; Priyanka, Srivastava; Rawat, A.; Singh, S. Association of Single Nucleotide Polymorphism Rs113420705 of CASP3 in Children with Kawasaki Disease from North India. J. Family Med. Prim. Care 2022, 11, 5404–5409. [Google Scholar] [CrossRef]
Figure 1.
Genotype frequencies in the codominant model for genes ACE2 rs2074192, IFNAR2 rs2236757, TYK2 rs2304256, OAS1 rs10774671, OAS3 rs10735079, CD40 rs4813003, FCGR2A rs1801274 and CASP3 rs113420705 in children with COVID-19 and noninfected children (ACE 2 − angiotensin converting enzyme 2; IFNAR2 − interferon alpha and beta receptor subunit 2; TYK2 − tyrosine kinase 2; OAS1 − 2’-5’-oligoadenylate synthetase 1; OAS3 − 2’-5’-oligoadenylate synthetase 3; CD40 − CD40 molecule; FCGR2A − Fc gamma receptor IIa; CASP3 – caspase 3).
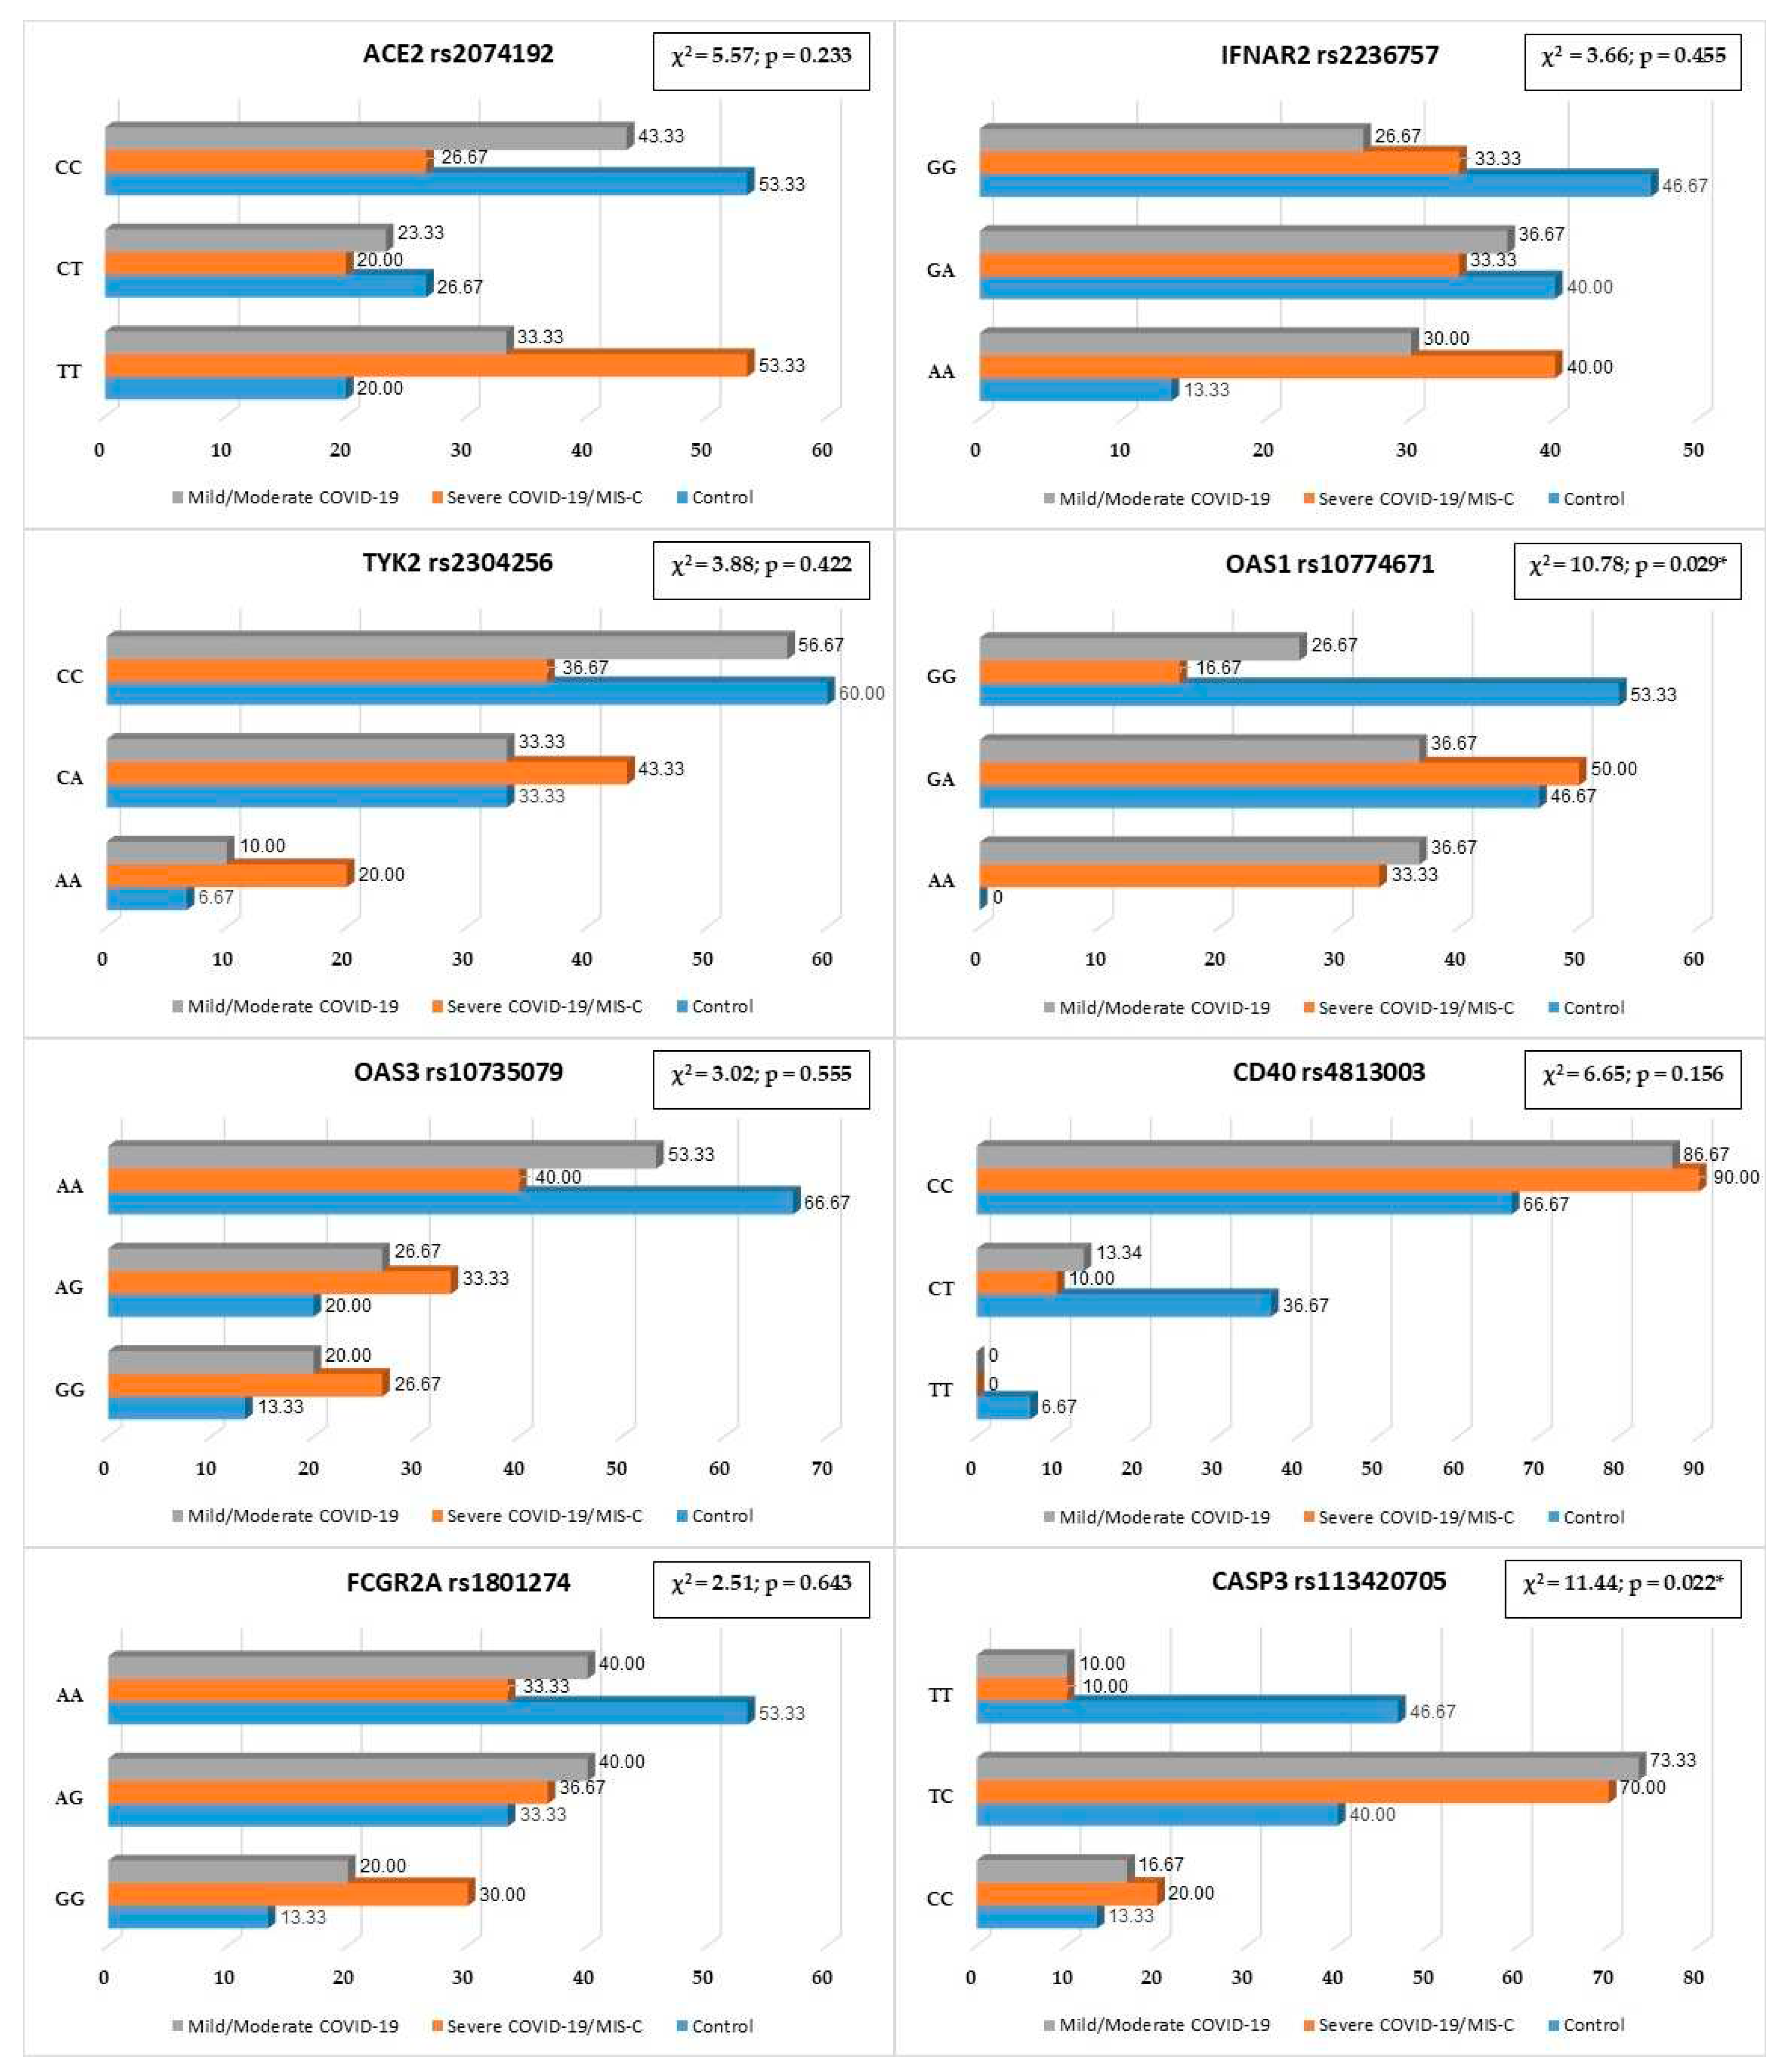
Figure 2.
Network data for gene interactions between studied genes ACE2, IFNAR2, TYK2, OAS1, OAS3, CD40, CASP3, FCGR2A and other genes generated by GeneMANIA.
Figure 2.
Network data for gene interactions between studied genes ACE2, IFNAR2, TYK2, OAS1, OAS3, CD40, CASP3, FCGR2A and other genes generated by GeneMANIA.
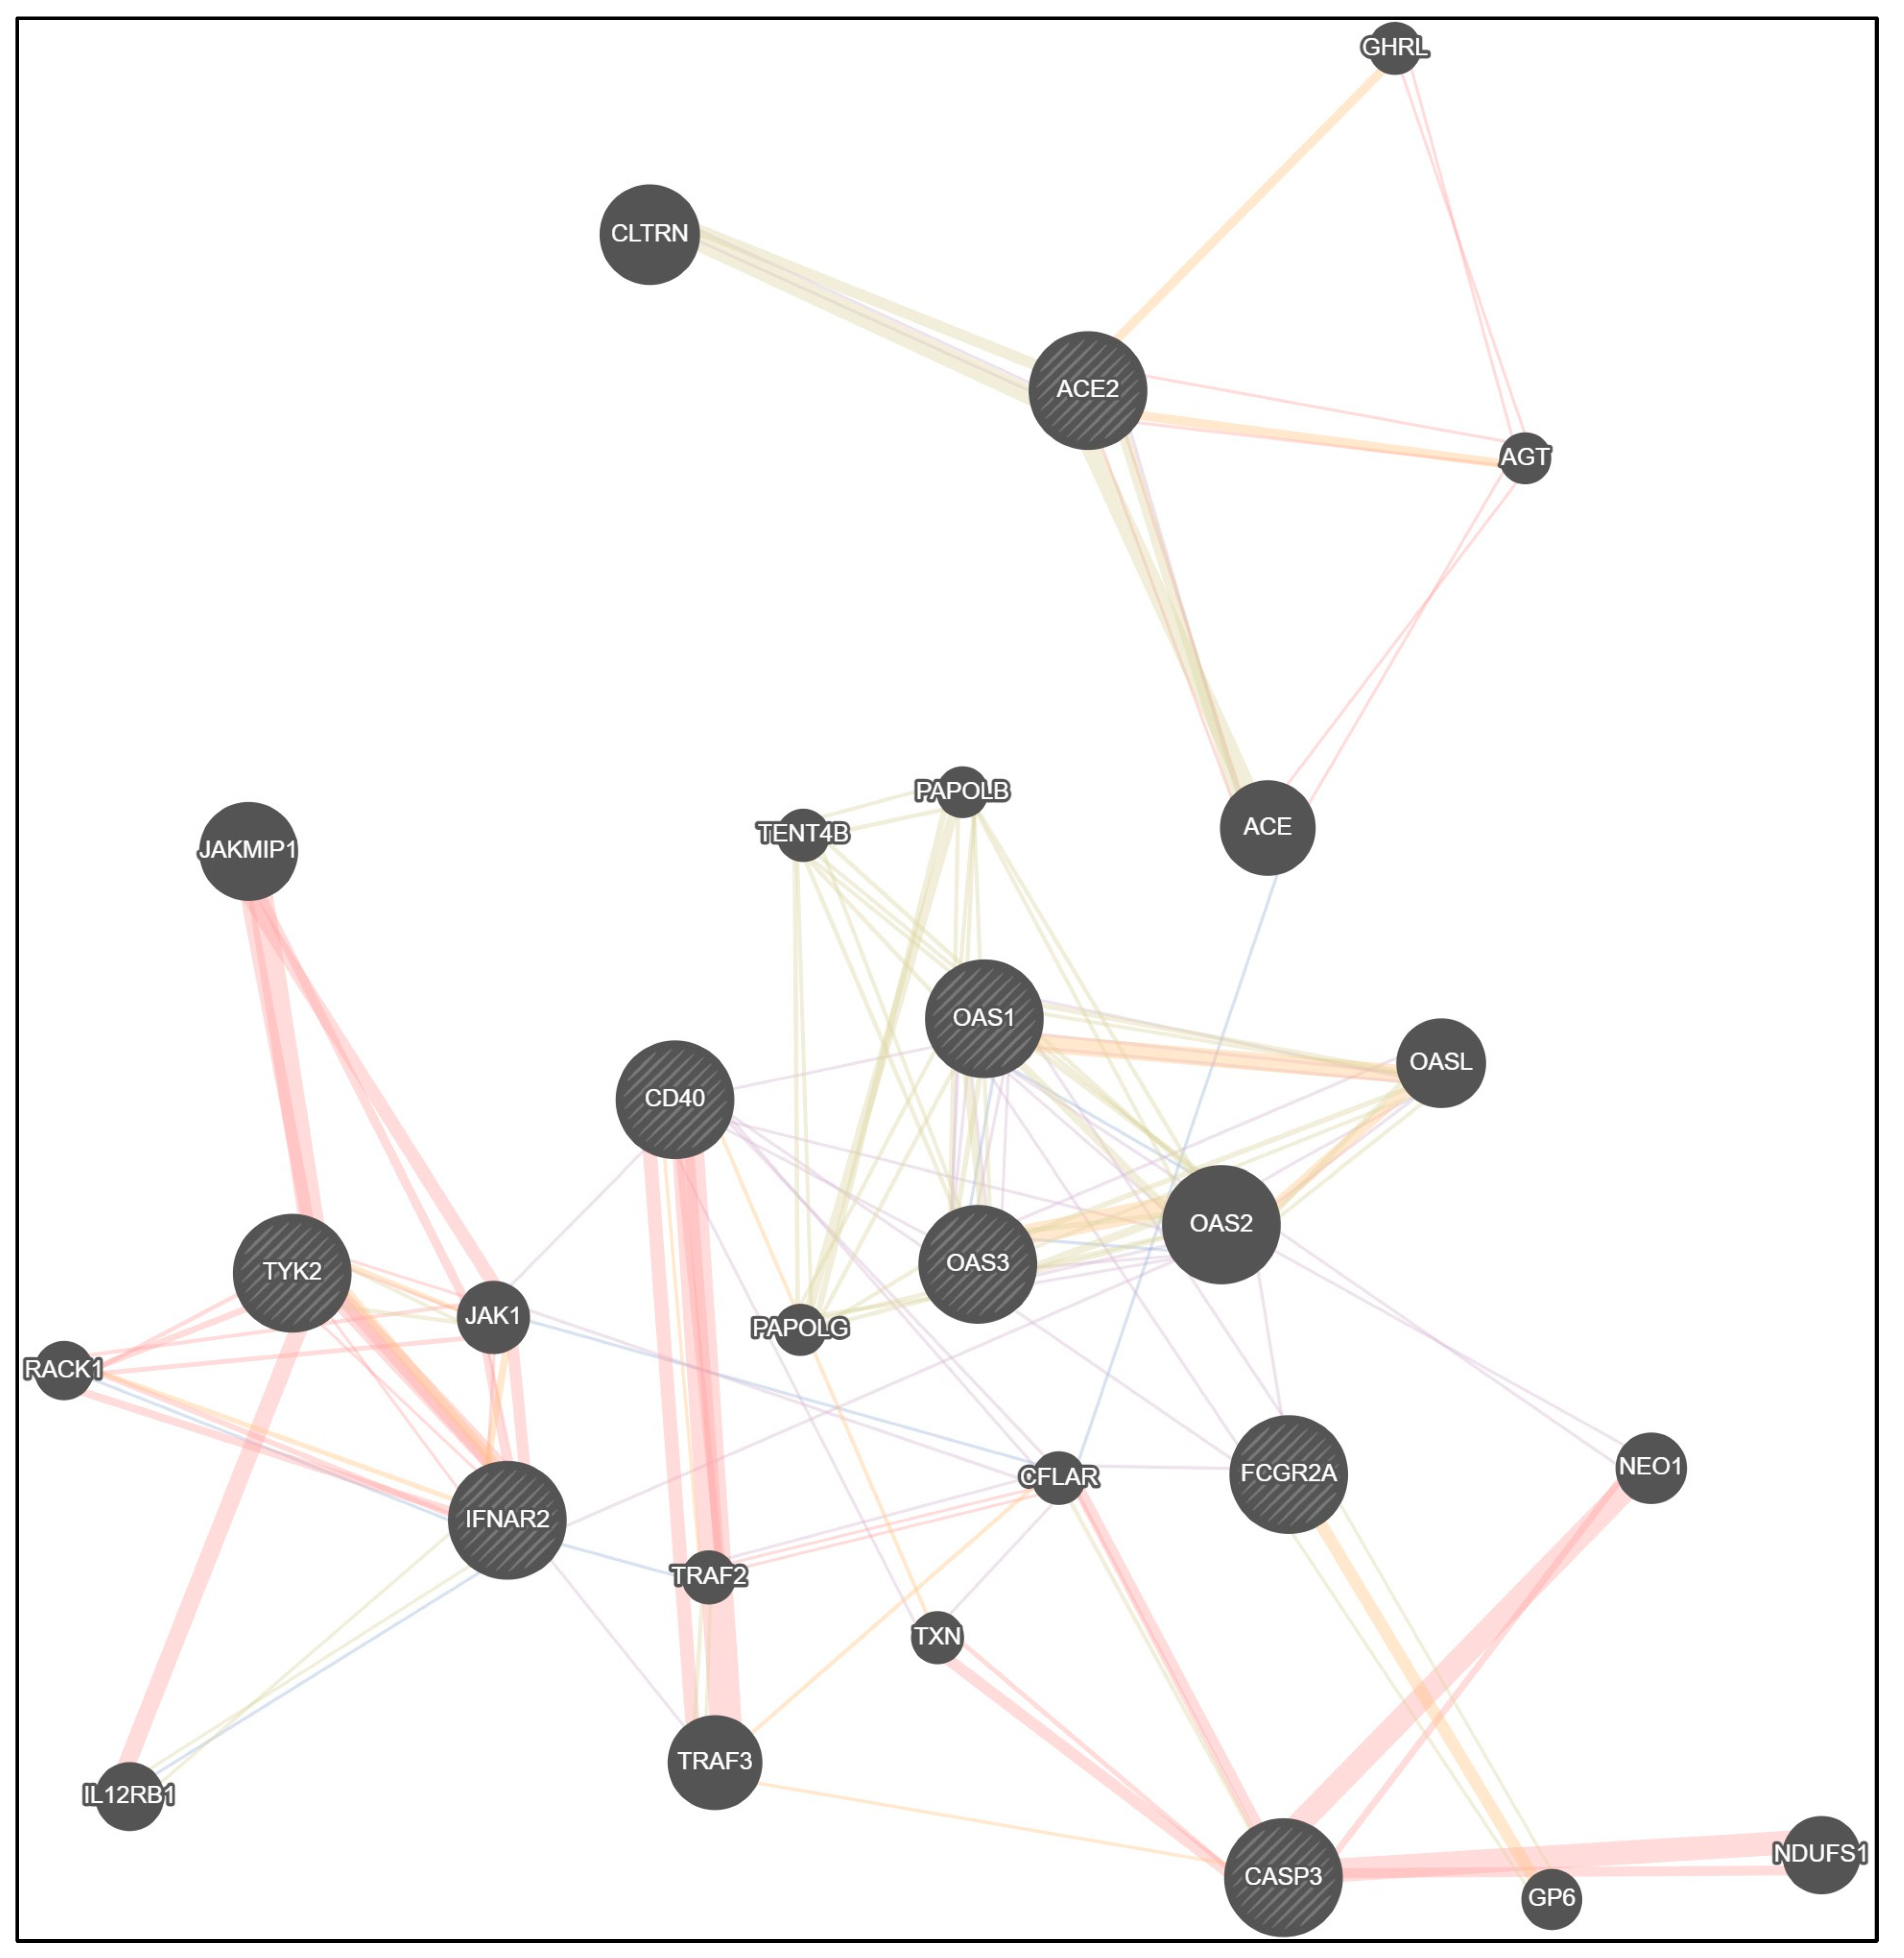
Table 1.
Demographic characteristic of children with COVID-19 (n = 60) and healthy children (n = 15).
Table 1.
Demographic characteristic of children with COVID-19 (n = 60) and healthy children (n = 15).
| Characteristic | Mild/Moderate COVID-19 (1) | Severe COVID-19/ MIS-C (2) | Control (3) | p | |
|---|---|---|---|---|---|
| Age, years | Median (Q25; Q75) | 2.5 (1.0; 7.0) | 7.0 (2.0; 14.0) | 8.0 (5.0; 13.0) | p1-2 = 0.059 p1-3 = 0.011* p2-3 = 0.943 |
| Min/Max | 0.2/17.0 | 0.1/17.6 | 2.0/16.0 | — | |
| Sex | Boys | 19 (63.33) | 20 (66.67) | 7 (46.67) | χ2 = 1.77; p = 0.413 |
| Girls | 11 (36.67) | 10 (33.33) | 8 (53.33) | ||
Abbreviations: p1-2 – statistical difference between group 1 (Mild/Moderate COVID-19) and group 2 (Severe COVID-19/MIS-C); p1-3 − statistical difference between group 1 (Mild/Moderate COVID-19) and group 3 (control); p2-3 – statistical difference between group 2 (Severe COVID-19/MIS-C) and group 3 (control); χ2 − chi-squared test, p – level of its significance. * − statistically significant result.
Table 2.1.
Test for Hardy-Weinberg equilibrium for ACE2 rs2074192, IFNAR2 rs2236757, TYK2 rs2304256.
Table 2.1.
Test for Hardy-Weinberg equilibrium for ACE2 rs2074192, IFNAR2 rs2236757, TYK2 rs2304256.
| Group | Genotype | ACE2 rs2074192 | IFNAR2 rs2236757 | TYK2 rs2304256 | |||
|---|---|---|---|---|---|---|---|
| Expected | Observed | Expected | Observed | Expected | Observed | ||
| All patients | Common Homozygotes |
19.3 | 29 | 19.8 | 25 | 34.7 | 37 |
| Heterozygotes | 37.5 | 17 | 37.5 | 27 | 32.6 | 28 | |
| Rare Homozygotes |
18.3 | 29 | 17.8 | 23 | 7.7 | 10 | |
| χ2, p-value | χ2 = 22.41; p < 0.001* | χ2 = 5.86; p = 0.016* | χ2 = 1.52; p = 0.218 | ||||
| COVID-19 patients | Common Homozygotes |
12.6 | 21 | 13.5 | 18 | 26.0 | 28 |
| Heterozygotes | 29.8 | 13 | 29.9 | 21 | 27.0 | 23 | |
| Rare Homozygotes |
17.6 | 26 | 16.5 | 21 | 7.0 | 9 | |
| χ2, p-value | χ2 = 19.06; p < 0.001* | χ2 = 5.34; p = 0.021* | χ2 = 1.31; p = 0.252 | ||||
| Control group (noninfected persons) |
Common Homozygotes |
6.67 | 8 | 6.7 | 7 | 8.8 | 9 |
| Heterozygotes | 6.67 | 4 | 6.7 | 6 | 5.4 | 5 | |
| Rare Homozygotes |
1.67 | 3 | 1.7 | 2 | 0.8 | 1 | |
| χ2, p-value | χ2 = 2.40; p = 0.121 | χ2 = 0.15; p = 0.696 | χ2 = 0.07; p = 0.791 | ||||
Abbreviations: χ2 − chi-squared test, p-value – level of its significance. * − statistically significant result.
Table 2.2.
Test for Hardy-Weinberg equilibrium for OAS1 rs10774671, OAS3 rs10735079.
| Group | Genotype | OAS1 rs10774671) | OAS3 rs10735079 | ||
|---|---|---|---|---|---|
| Expected | Observed | Expected | Observed | ||
| All patients | Common Homozygotes |
19.5 | 21 | 31.4 | 38 |
| Heterozygotes | 38.0 | 33 | 34.3 | 21 | |
| Rare Homozygotes | 18.5 | 21 | 9.4 | 16 | |
| χ2, p-value | χ2 = 1.31; p = 0.299 | χ2 = 11.25; p < 0.001* | |||
| COVID-19 patients | Common Homozygotes |
11.3 | 13 | 22.8 | 28 |
| Heterozygotes | 29.5 | 26 | 28.4 | 18 | |
| Rare Homozygotes | 19.3 | 21 | 8.8 | 14 | |
| χ2, p-value | χ2 = 0.83; p = 0.362 | χ2 = 8.01; p = 0.005* | |||
| Control group (noninfected persons) |
Common Homozygotes |
8.8 | 8 | 8.8 | 10 |
| Heterozygotes | 5.4 | 7 | 5.4 | 3 | |
| Rare Homozygotes | 0.8 | 0 | 0.8 | 2 | |
| χ2, p-value | χ2 = 1.39; p = 0.238 | χ2 = 2.92; p = 0.088 | |||
Abbreviations: χ2 − chi-squared test, p-value – level of its significance. * − statistically significant result.
Table 2.3.
Test for Hardy-Weinberg equilibrium for CD40 rs4813003, FCGR2A rs1801274, CASP3 rs113420705.
Table 2.3.
Test for Hardy-Weinberg equilibrium for CD40 rs4813003, FCGR2A rs1801274, CASP3 rs113420705.
| Group | Genotype | CD40 rs4813003 | FCGR2A rs1801274 | CASP3 rs113420705 | |||
|---|---|---|---|---|---|---|---|
| Expected | Observed | Expected | Observed | Expected | Observed | ||
| All patients | Common Homozygotes |
62.6 | 63 | 25.8 | 30 | 18.8 | 13 |
| Heterozygotes | 11.9 | 11 | 36.4 | 28 | 37.5 | 49 | |
| Rare Homozygotes |
0.6 | 1 | 12.8 | 17 | 18.8 | 13 | |
| χ2, p-value | χ2 = 0.41; p = 0.230 | χ2 = 3.97; p = 0.046* | χ2 = 7.05; p = 0.008* | ||||
| COVID-19 patients | Common Homozygotes |
53.2 | 53 | 18.7 | 22 | 12.6 | 6 |
| Heterozygotes | 6.6 | 7 | 29.6 | 23 | 29.8 | 43 | |
| Rare Homozygotes |
0.2 | 0 | 11.7 | 15 | 17.6 | 11 | |
| χ2, p-value | χ2 = 0.63; p = 0.230 | χ2 = 2.98; p = 0.084 | χ2 = 11.79; p < 0.001* | ||||
| Control group (noninfected persons) |
Common Homozygotes |
9.6 | 10 | 7.4 | 8 | 6.7 | 7 |
| Heterozygotes | 4.8 | 4 | 6.3 | 5 | 6.7 | 6 | |
| Rare Homozygotes |
0.6 | 1 | 1.4 | 2 | 1.7 | 2 | |
| χ2, p-value | χ2 = 0.42; p = 0.519 | χ2 = 0.64; p = 0.424 | χ2 = 0.15; p = 0.699 | ||||
Abbreviations: χ2 − chi-squared test, p-value – level of its significance. * − statistically significant result.
Table 3.1.
Dominant, recessive and overdominant models for ACE2 rs2074192.
| Model | Genotype | Mild/ Moderate COVID-19 |
Severe COVID-19/ MIS-C | Control | χ2, p-value |
OR (95% CI) |
p-value for OR |
|---|---|---|---|---|---|---|---|
| Dominant | CC | 13 (43.33) | 8 (26.67) | 8 (53.33) | χ2 = 3.46 p = 0.177 |
0.32 (0.09−1.16) |
0.084 |
| CT−TT | 17 (56.67) | 22 (73.33) | 7 (46.67) | 3.14 (0.86−11.50) |
|||
| Recessive | CC−CT | 21 (70.00) | 14 (46.67) | 12 (80.00) | χ2 = 5.28 p = 0.071 |
0.22 (0.05−0.93) | 0.041* |
| TT | 10 (33.33) | 16 (53.33) | 3 (20.00) | 4.57 (1.07−19.57) |
|||
| Overdominant | CC−TT | 23 (76.67) | 24 (80.00) | 11 (73.33) | χ2 = 0.27 p = 0.875 |
1.45 (0.34−6.22) |
0.613 |
| CT | 7 (23.33) | 6 (20.00) | 4 (24.67) | 0.69 (0.16−2.94) |
Abbreviations: χ2 − chi-squared test, p-value – level of its significance; OR – odds ratio (calculated for the outcome “Severe COVID-19/MIS-C”; 95% CI – 95% confidence interval (severe COVID-19/MIS-C – outcome in OR calculation). * − statistically significant result.
Table 3.2.
Dominant, recessive and overdominant models for IFNAR2 rs2236757.
| Model | Genotype | Mild/ Moderate COVID-19 |
Severe COVID-19/ MIS-C | Control | χ2, p-value |
OR (95% CI) |
p-value for OR |
|---|---|---|---|---|---|---|---|
| Dominant | GG | 10 (33.33) | 8 (26.67) | 7 (46.67) | χ2 = 1.80 p = 0.406 |
0.42 (0.11−1.52) |
0.185 |
| GA-AA | 20 (66.67) | 22 (73.33) | 8 (53.33) | 2.41 (0.66−8.81) |
|||
| Recessive | GG-GA | 21 (70.00) | 18 (60.00) | 13 (86.67) | χ2 = 3.54 p = 0.187 |
0.23 (0.04−1.21) |
0.083 |
| AA | 9 (30.00) | 12 (40.00) | 2 (13.33) | 4.33 (0.83−22.75) |
|||
| Overdominant | GG-AA | 19 (63.33) | 20 (66.67) | 9 (60.00) | χ2 = 0.20 p = 0.904 |
1.33 (0.37−4.80) |
0.660 |
| GA | 11 (36.67) | 10 (33.33) | 6 (40.00) | 0.75 (0.21−2.70) |
Abbreviations: χ2 − chi-squared test, p-value – level of its significance; OR – odds ratio (calculated for the outcome “Severe COVID-19/MIS-C”; 95% CI – 95% confidence interval (severe COVID-19/MIS-C – outcome in OR calculation).
Table 3.3.
Dominant, recessive and overdominant models for TYK2 rs2304256.
| Model | Genotype | Mild/ Moderate COVID-19 |
Severe COVID-19/ MIS-C | Control | χ2, p-value |
OR (95% CI) |
p-value for OR |
|---|---|---|---|---|---|---|---|
| Dominant | CC | 17 (56.67) | 11 (36.67) | 9 (60.00) | χ2 = 3.26 p = 0.197 |
0.39 (0.11−1.38) |
0.143 |
| CA−AA | 13 (43.33) | 19 (63.33) | 6 (40.00) | 2.59 (0.73−9.25) |
|||
| Recessive | CC−CA | 27 (90.00) | 24 (80.00) | 14 (93.33) | χ2 = 2.02 p = 0.364 |
0.29 (0.03−2.62) |
0.268 |
| AA | 3 (10.00) | 6 (20.00) | 1 (6.67) | 3.50 (0.38−32.14) |
|||
| Overdominant | CC−AA | 20 (66.67) | 17 (56.67) | 10 (66.67) | χ2 = 0.77 p = 0.681 |
0.65 (0.18−2.38) |
0.520 |
| CA | 10 (33.33) | 13 (43.33) | 5 (33.33) | 1.53 (0.42−5.58) |
Abbreviations: χ2 − chi-squared test, p-value – level of its significance; OR – odds ratio (calculated for the outcome “Severe COVID-19/MIS-C”; 95% CI – 95% confidence interval (severe COVID-19/MIS-C – outcome in OR calculation).
Table 3.4.
Dominant, recessive and overdominant models for OAS1 (rs10774671).
| Model | Genotype | Mild/ Moderate COVID-19 |
Severe COVID-19/ MIS-C | Control | χ2, p-value |
OR (95% CI) |
p-value for OR |
|---|---|---|---|---|---|---|---|
| Dominant | GG | 8 (26.67) | 5 (16.67) | 8 (53.33) | χ2 = 6.71 p = 0.035* |
0.18 (0.04−0.71) |
0.015* |
| GA−AA | 22 (73.33) | 25 (83.33) | 7 (46.67) | 5.71 (1.41−23.10) |
|||
| Recessive | GG−GA | 19 (63.33) | 20 (66.67) | 15 (100.00) | χ2 = 7.37 p = 0.025* |
0.06 (0.01−1.16) |
0.063 |
| AA | 11 (36.67) | 10 (33.33) | 0 | 15.88 (0.86−292.28) |
|||
| Overdominant | GG−AA | 19 (63.33) | 15 (50.00) | 8 (53.33) | χ2 = 1.14 p = 0.567 |
0.88 (0.25−3.03) |
0.833 |
| GA | 11 (36.67) | 15 (50.00) | 7 (46.67) | 1.14 (0.33−3.96) |
Abbreviations: χ2 − chi-squared test, p-value – level of its significance; OR – odds ratio (calculated for the outcome “Severe COVID-19/MIS-C”; 95% CI – 95% confidence interval (severe COVID-19/MIS-C – outcome in OR calculation). * − statistically significant result.
Table 3.5.
Dominant, recessive and overdominant models for OAS3 rs10735079.
| Model | Genotype | Mild/ Moderate COVID-19 |
Severe COVID-19/ MIS-C | Control | χ2, p-value |
OR (95% CI) |
p-value for OR |
|---|---|---|---|---|---|---|---|
| Dominant | AA | 16 (53.33) | 12 (40.00) | 10 (66.67) | χ2 = 2.99 p = 0.225 |
0.33 (0.09−1.22) | 0.098 |
| AG−GG | 14 (46.67) | 18 (60.00) | 5 (33.33) | 3.00 (0.82−10.99) |
|||
| Recessive | AA−AG | 24 (80.00) | 22 (73.33) | 13 (86.67) | χ2 = 1.11 p = 0.573 |
0.42 (0.08−2.30) |
0.320 |
| GG | 6 (20.00) | 8 (26.67) | 2 (13.33) | 2.36 (0.43−12.87) |
|||
| Overdominant | AA−GG | 22 (73.33) | 20 (66.67) | 12 (80.00) | χ2 = 0.93 p = 0.629 |
0.50 (0.11−2.19) |
0.357 |
| AG | 8 (26.67) | 10 (33.33) | 3 (20.00) | 2.00 (0.46−8.75) |
Abbreviations: χ2 − chi-squared test, p-value – level of its significance; OR – odds ratio (calculated for the outcome “Severe COVID-19/MIS-C”; 95% CI – 95% confidence interval (severe COVID-19/MIS-C – outcome in OR calculation).
Table 3.6.
Dominant, recessive and overdominant models for CD40 rs4813003.
| Model | Genotype | Mild/ Moderate COVID-19 |
Severe COVID-19/ MIS-C | Control | χ2, p-value |
OR (95% CI) |
p-value for OR |
|---|---|---|---|---|---|---|---|
| Dominant | CC | 26 (86.67) | 27 (90.00) | 10 (66.67) | χ2 = 4.32 p = 0.116 |
4.50 (0.90−22.40) | 0.066 |
| CT-TT | 4 (13.33) | 3 (10.00) | 5 (33.33) | 0.22 (0.04−1.11) |
|||
| Recessive | CC-CT | 30 (100.00) | 30 (100.00) | 14 (93.33) | χ2 = 4.05 p = 0.132 |
6.31 (0.24−164.57) |
0.268 |
| TT | 0 | 0 | 1 (6.67) | 0.16 (0.01−4.13) |
|||
| Overdominant | CC-TT | 26 (86.67) | 27 (90.00) | 11 (73.33) | χ2 = 2.29 p = 0.318 |
3.27 (0.63−17.09) |
0.160 |
| CT | 4 (13.33) |
3 (10.00) |
4 (26.67) |
0.31 (0.06−1.60) |
Abbreviations: χ2 − chi-squared test, p-value – level of its significance; OR – odds ratio (calculated for the outcome “Severe COVID-19/MIS-C”; 95% CI – 95% confidence interval (severe COVID-19/MIS-C – outcome in OR calculation).
Table 3.7.
Dominant, recessive and overdominant models for FCGR2A rs1801274.
| Model | Genotype | Mild/ Moderate COVID-19 |
Severe COVID-19/ MIS-C | Control | χ2, p-value |
OR (95% CI) |
p-value for OR |
|---|---|---|---|---|---|---|---|
| Dominant | AA | 12 (40.00) | 10 (33.33) | 8 (53.33) | χ2 = 1.67 p = 0.435 |
0.44 (0.12−1.55) |
0.201 |
| AG+GG | 18 (60.00) | 20 (66.67) | 7 (46.67) | 2.29 (0.64−8.11) |
|||
| Recessive | AA+AG | 24 (80.00) | 21 (70.00) | 13 (86.67) | χ2 = 1.79 p = 0.409 |
0.36 (0.07−1.93) |
0.232 |
| GG | 6 (20.00) | 9 (30.00) | 2 (13.33) | 2.79 (0.52−14.96) |
|||
| Overdominant | AA+GG | 18 (60.00) | 19 (63.33) | 10 (66.67) | χ2 = 0.20 p = 0.905 |
0.86 (0.23−3.19) |
0.826 |
| AG | 12 (40.00) | 11 (36.67) | 5 (33.33) | 1.16 (0.31−4.27) |
Abbreviations: χ2 − chi-squared test, p-value – level of its significance; OR – odds ratio (calculated for the outcome “Severe COVID-19/MIS-C”; 95% CI – 95% confidence interval (severe COVID-19/MIS-C – outcome in OR calculation).
Table 3.8.
Dominant, recessive and overdominant models for CASP3 rs113420705.
| Model | Genotype | Mild/ Moderate COVID-19 |
Severe COVID-19/ MIS-C | Control | χ2, p-value |
OR (95% CI) |
p-value for OR |
|---|---|---|---|---|---|---|---|
| Dominant | TT | 3 (10.00) | 3 (10.00) | 7 (46.67) | χ2 = 11.26 p = 0.004* |
0.13 (0.03−0.61) |
0.010* |
| TC+CC | 27 (90.00) | 27 (90.00) | 8 (53.33) | 7.88 (1.65−37.69) |
|||
| Recessive | TT+TC | 25 (83.33) | 24 (80.00) | 13 (86.67) | χ2 = 0.33 p = 0.850 |
0.62 (0.11−3.50) |
0.584 |
| CC | 5 (16.67) | 6 (20.00) | 2 (13.33) | 1.63 (0.29−9.23) |
|||
| Overdominant | TT+CC | 8 (26.67) | 9 (30.00) | 9 (30.00) | χ2 = 5.39 p = 0.068 |
0.29 (0.08−1.04) |
0.058 |
| TC | 22 (73.33) | 21 (70.00) | 6 (40.00) | 3.50 (0.96−12.78) |
Abbreviations: χ2 − chi-squared test, p-value – level of its significance; OR – odds ratio (calculated for the outcome “Severe COVID-19/MIS-C”; 95% CI – 95% confidence interval (severe COVID-19/MIS-C – outcome in OR calculation). * − statistically significant result.
Table 7.
Association of risk alleles in children with COVID-19 and healthy control.
| Combination of risk alleles | COVID-19 | Control | p | χ2, p |
|---|---|---|---|---|
| 1 risk alleles | 0 | 0 | p < 0.001* |
χ2 = 24.40; p < 0.001* |
| 2 risk alleles | 0 | 2 (13.33) | ||
| 3 risk alleles | 1 (1.67) | 4 (26.67) | ||
| 4 risk alleles | 10 (16.67) | 3 (20.00) | p = 0.750 |
|
| 5 risk alleles | 14 (23.33) | 2 (13.33) | ||
| 6 risk alleles | 17 (28.33) | 4 (26.67) | ||
| 7 risk alleles | 14 (23.33) | 0 | p = 0.034* | |
| 8 risk alleles | 4 (6.67) | 0 |
Abbreviations: χ2 − chi-squared test, p-value – level of its significance. * − statistically significant result.
Table 8.
Logistic regression analysis for COVID-19 susceptibility prediction in the pediatric population.
Table 8.
Logistic regression analysis for COVID-19 susceptibility prediction in the pediatric population.
| Variable | B | S.E. | Wald | df | p | Exp(B) | 95% CI for Exp(B) | |
|---|---|---|---|---|---|---|---|---|
| Lower | Upper | |||||||
| Constant | 4.33 | 1.28 | 11.44 | 1 | 0.001* | 75.77 | ||
| Sex Male/Female |
1.01 | 0.53 | 3.63 | 1 | 0.057 | 2.73 | 0.97 | 7.70 |
| ACE2 rs2074192 C/T |
-1.05 | 0.54 | 3.73 | 1 | 0.053 | 0.35 | 0.12 | 1.02 |
| IFNAR2 rs2236757 G/A |
-1.19 | 0.58 | 4.15 | 1 | 0.042* | 0.31 | 0.10 | 0.96 |
| TYK2 rs2304256 C/A |
-0.32 | 0.63 | 0.26 | 1 | 0.611 | 0.73 | 0.21 | 2.51 |
| OAS1 rs10774671 G/A |
-2.14 | 0.62 | 12.02 | 1 | 0.001* | 0.12 | 0.04 | 0.40 |
| OAS3 rs10735079 A/G |
-1.26 | 0.63 | 4.00 | 1 | 0.046* | 0.28 | 0.08 | 0.98 |
| CD40 rs4813003 C/T |
1.99 | 0.82 | 5.93 | 1 | 0.015* | 7.30 | 1.47 | 36.14 |
| FCGR2A rs1801274 A/G |
-0.40 | 0.55 | 0.51 | 1 | 0.475 | 0.67 | 0.23 | 1.99 |
| CASP3 rs113420705 T/C |
-2.33 | 0.64 | 13.11 | 1 | <0.001* | 0.10 | 0.03 | 0.34 |
Abbreviations: B – predictor’s logistic coefficient; S.E. – standard error for B; Wald – Wald chi-square value; df – degree of freedom; p – level of statistical significance; Exp(B) – odds ratio for indicators – sex “Male” and dominant gene’s allele; 95% CI for Exp(B) – 95% confidence interval for Exp(B). * − statistically significant result.
Table 9.
Logistic regression analysis for severe COVID-19 course and MIS-C prediction in the pediatric population.
Table 9.
Logistic regression analysis for severe COVID-19 course and MIS-C prediction in the pediatric population.
| Variable | B | S.E. | Wald | df | p | Exp(B) | 95% CI for Exp(B) | |
|---|---|---|---|---|---|---|---|---|
| Lower | Upper | |||||||
| Constant | 2.54 | 1.61 | 2.51 | 1 | 0.113 | 12.71 | ||
| Sex Male/Female |
2.68 | 1.05 | 6.48 | 1 | 0.011* | 14.59 | 1.85 | 114.80 |
| ACE2 rs2074192 C/T |
-2.08 | 0.86 | 5.82 | 1 | 0.016* | 0.13 | 0.02 | 0.68 |
| IFNAR2 rs2236757 G/A |
-2.98 | 1.06 | 7.86 | 1 | 0.005* | 0.05 | 0.01 | 0.41 |
| TYK2 rs2304256 C/A |
-0.65 | 0.93 | 0.49 | 1 | 0.486 | 0.52 | 0.08 | 3.24 |
| OAS1 rs10774671 G/A |
-2.47 | 0.98 | 6.33 | 1 | 0.012* | 0.09 | 0.01 | 0.58 |
| OAS3 rs10735079 A/G |
-1.20 | 0.82 | 2.15 | 1 | 0.143 | 0.30 | 0.06 | 1.50 |
| CD40 rs4813003 C/T |
5.58 | 1.93 | 8.36 | 1 | 0.004* | 264.57 | 6.03 | 11601.05 |
| FCGR2A rs1801274 A/G |
-1.19 | 0.89 | 1.78 | 1 | 0.182 | 0.31 | 0.05 | 1.74 |
| CASP3 rs113420705 T/C |
-3.72 | 1.11 | 11.31 | 1 | 0.001* | 0.02 | 0.01 | 0.21 |
Abbreviations: B – predictor’s logistic coefficient; S.E. – standard error for B; Wald – Wald chi-square value; df – degree of freedom; p – level of statistical significance; Exp(B) – odds ratio for indicators – sex “Male” and dominant gene’s allele; 95% CI for Exp(B) – 95% confidence interval for Exp(B). * − statistically significant result.
Table 10.
Gene network interactions.
| Co-expression | Physical interactions | Shared protein domains |
Co-localization | Predicted functional relationships |
|---|---|---|---|---|
| ACE2− ACE | ACE2 − ACE | ACE2 − ACE | ACE − CFLAR | ACE2 − AGT |
| ACE2 − CLTRN | ACE2 − AGT | ACE2 − CLTRN | IFNAR2 − IL12RB1 | ACE2 − GHRL |
| IFNAR2 − TRAF3 | AGT − ACE | IFNAR2 − IL12RB1 | IFNAR2 − RACK1 | IFNAR2 − JAK1 |
| OAS1 − OAS3 | IFNAR2 − TYK2 | TYK2 − JAK1 | IFNAR2 − TRAF2 | IFNAR2 − TYK2 |
| OAS1 − OAS2 | IFNAR2 − JAK1 | OAS1 − OAS3 | OAS1 − OAS3 | TYK2 − JAK1 |
| OAS1 − OASL | IFNAR2 − RACK1 | OAS1 − OAS2 | OAS1 − OAS2 | IFNAR2 − RACK1 |
| OAS1 − FCGR2A | TYK2 − JAK1 | OAS1 − OASL | OAS3 − OAS2 | OAS1 − OASL |
| OAS2 − OAS3 | TYK2 − RACK1 | OAS2 − OASL | JAK1 − CFLAR | OAS3 − OAS2 |
| OAS2 − OASL | TYK2 − IL12RB1 | OAS3 − OASL | OAS2 − OASL | |
| OAS2 − IFNAR2 | TYK2 − JAKMIP1 | OAS3 − OAS2 | FCGR2A − GP6 | |
| OAS2 − NEO1 | JAKMIP1 − JAK1 | OAS1 − TENT4B | CD40 − TRAF2 | |
| OAS2 − FCGR2A | RACK1− JAK1 | OAS2 − TENT4B | CD40 − TXN | |
| FCGR2A − CFLAR | CD40 − TRAF2 | OAS3 − TENT4B | CASP3 − TRAF3 | |
| FCGR2A − CD40 | CD40 – TRAF3 | OAS1 − PAPOLG | TRAF3 − CFLAR | |
| CD40 − JAK1 | CASP3 − NDUFS1 | OAS2 − PAPOLG | ||
| CD40 − TXN | CASP3 − NEO1 | OAS3 − PAPOLG | ||
| CD40 − OAS1 | CASP3 − TXN | OAS1 − PAPOLB | ||
| CD40 − OAS3 | CASP3 − CFLAR | OAS2 − PAPOLB | ||
| CD40 − CFLAR | CFLAR − TRAF2 | OAS3 − PAPOLB | ||
| CFLAR − JAK1 | PAPOLG − TENT4B | |||
| CFLAR − TXN | PAPOLB − TENT4B | |||
| CFLAR − TRAF2 | PAPOLB − PAPOLG | |||
| FCGR2A − GP6 | ||||
| CASP3 − CFLAR | ||||
| TRAF2 – TRAF3 |
Disclaimer/Publisher’s Note: The statements, opinions and data contained in all publications are solely those of the individual author(s) and contributor(s) and not of MDPI and/or the editor(s). MDPI and/or the editor(s) disclaim responsibility for any injury to people or property resulting from any ideas, methods, instructions or products referred to in the content. |
© 2023 by the authors. Licensee MDPI, Basel, Switzerland. This article is an open access article distributed under the terms and conditions of the Creative Commons Attribution (CC BY) license (https://creativecommons.org/licenses/by/4.0/).
Copyright: This open access article is published under a Creative Commons CC BY 4.0 license, which permit the free download, distribution, and reuse, provided that the author and preprint are cited in any reuse.


