Submitted:
08 September 2023
Posted:
11 September 2023
Read the latest preprint version here
Preprints on COVID-19 and SARS-CoV-2
Abstract
Using publicly available data for 28 EU/EES countries from Eurostat and Our World in Data, we investigate how the current rate of Covid vaccination in a country compares to its average rate of excess mortality (EM) in the pandemic to date. We find that, in the linear regression, the correlation between average EM and vaccination rate is strongly negative, a priori evidence to support the claim that the Covid vaccines have saved many lives. However, a closer analysis of the timeline suggests otherwise. The correlation was already strongly negative before the vaccines were rolled out and is only weakly negative thereafter. In theory, survivor bias could still explain this shift, especially since waves of EM closely align with Covid waves. However, we find in addition that about half of our 28 countries experienced higher EM in 2022 than in 2021, and all that did so have higher than average vaccination rates. This is something which survivor bias cannot explain and raises the real possibility that the vaccines have not just failed to save many lives, but may have already caused net harm. Moreover, any such harm may be ongoing since we find that EM and vaccination rates have been consistently positively correlated since April 2022. We show that all these findings are robust to several different ways of measuring EM and/or vaccination rates. Finally, using public data from Worldometers, we show that the correlation over time of official Covid mortality rates with current vaccination rates closely tracks that of EM rates, even as Covid mortality has waxed and waned and even in the post-omicron period.
Keywords:
COVID-19
; vaccination
; all-cause mortality
; excess mortality
1. Summary of paper
The possibility of there being negative effects of the novel, genetic Covid-19 vaccines has so far been largely downplayed in the mainstream, whether that be the formal academic discussion (scientific journals and conferences) or the various institutions through which this discussion is disseminated to the wider public (mainstream media, government and public health authorities etc.).
Nevertheless, concern has been voiced by many people, both of the short- and long-term adverse effects of these products on the individuals who take them [6,7,8,9,10,13], as well as the population-level effects of mass-vaccinating in the midst of a pandemic [2]. Recently, much attention has been given to the persistence of all-cause excess mortality (henceforth abbreviated to EM) in highly vaccinated first-world countries [1,3,5]. Despite the obvious difficulties in accurately measuring excess mortality, along with the equally obvious fact that this data alone proves nothing directly about its causes, all-cause EM data is considered especially important for several reasons. Firstly, only by counting all deaths can one hope to capture the overall effects of public health interventions. Secondly, one avoids having to deal with the inevitable difficulty of establishing and delineating the causes of individual deaths, such as whether deaths during the pandemic were “from” or ”with” Covid. Thirdly, all-cause mortality data tends to be publicly available and easily accessible and, at least in first world countries, generally accurate.
The phenomenon of persistent EM in highly vaccinated European countries is almost certainly real (the situation globally will be investigated in a follow-up paper). Below we will conduct cross-country comparisons, using several different measures of both pandemic-era EM and vaccination rates in the population. A robust finding is that since April 2022, rates of EM have been positively correlated with vaccination rates. In absolute terms, EM has tended to remain positive in more highly vaccinated countries and, in many cases, was higher in 2022 than in 2021. In less vaccinated countries, on the other hand, EM tended to show a marked decrease from 2021 to 2022, and has been markedly negative in the least vaccinated countries (such as Bulgaria and Romania) from late 2022 onwards. So far in 2023, EM has been somewhat lower in most countries than in 2022. However, depending on the choice of how to measure EM, it may still be positive in most of the highly vaccinated countries. Most importantly, independent of how one measures EM and vaccination rates, the correlation between the two has remained robustly positive through the first half of 2023.
Thus, the situation since April 2022, which roughly marks the end of the first omicron Covid wave, is prima facie evidence not just of vaccine failure, but of their causing net harm. An immediate rejoinder, however, is to point to the period before April 2022. Indeed, if we look at the entire period from March 2020, when the pandemic is generally acknowledged to have begun1, to the present, average rates of EM are robustly negatively correlated with current vaccination rates.
So now we have two robust findings, yielding prima facie contradictory conclusions. In an attempt to get to the truth, we decided to track over time the cross-country correlation of EM with current vaccination rates. The results are summarized in various graphs below, all of which have the same “shape”, meaning that the shifts in this correlation observed over time are robust to different ways of measuring both EM and vaccination rates.
What we consistently find is that aggregate EM rates were already significantly negatively correlated with current vaccination rates in the period from the start of the pandemic (March 2020) to when the vaccine rollout could have begun to have an effect (we choose April 2021 as the cutoff, for reasons explained in detail below). Post-rollout, the correlation is still negative, but much less so than in the pre-rollout period. Moreover, the gap between the two periods continues to widen because, as noted above, the correlation has been robustly positive since April 2022.
Now whatever the reason as to why countries which ended up being more highly vaccinated had lower EM rates prior to the rollout, it cannot have anything to do with the vaccines themselves, which then did not exist. So the shift in favour of less vaccinated countries post-rollout is, we think, indeed a cause for serious concern. The obvious rejoinder that comes to mind, is to claim that the shift is due to the well-known phenomenon of “survivor bias”. Pre-rollout, peaks of EM occurred in April 2020, November 2020 and April 2021 (as already mentioned, we will explain in detail below why we place April 2021 in the pre-rollout period). All three peaks are roughly contemporaneous with peaks of Covid waves, and the latter two affected Eastern European countries especially hard, which for the most part also ended up being those with the lowest vaccination rates. Thus, the argument goes, countries in which more of the vulnerable population had already died pre-rollout should expect to have lower morality thereafter, simply because of the greater demographic shift towards a less vulnerable population.
While it is likely that survivor bias plays at least some role in explaining the post-rollout shift in the correlation between EM rates and vaccination rates, it simply cannot explain crucial features of the data below. In particular, it cannot explain why, in absolute terms, EM would remain positive and even increase over time in many of the highly vaccinated countries. Secondly, there were two further pandemic waves post-rollout, culminating in November 2021 (delta wave) and February 2022 (first omicron wave). During the first of these, EM also peaked, as did the negative cross-country correlation with vaccination rates. Basically, this wave looked very similar to the two previous, pre-rollout waves in November 2020 and April 2021. It was only after the appearance of omicron that the shift in the above correlation really took hold, and was already apparent in the data for February 2022. Here we again see a trough in the correlation between EM rates and vaccination rates, but it is much shallower than the previous ones. By April, the correlation had turned positive and has stayed there since.
Overall, the post-rollout EM data seems to be consistent with hypotheses suggesting the vaccines have caused net harm. Firstly, the mass vaccination campaign may have contributed to why the pandemic continued beyond April 2021. Instead of yielding population-level (herd) immunity, the mass application of leaky vaccines may just have created a heightened selection pressure which promoted the appearance of escape variants and contributed to the delta wave in late 2021, caused by what was the most virulent dominant Covid variant in the pandemic to date. Then, after the highly contagious and much milder omicron variant appeared, countries with low vaccination rates may have effectively acquired herd immunity, whereas throughout 2022 and even to date, more highly vaccinated countries remain more susceptible to Covid and continue to suffer from the adverse effects of the vaccines themselves. Further support for this conclusion is the fact that, as we shall also discuss below, even official data on Covid deaths shows the same pattern as that for all-cause EM, with rates of the former becoming positively correlated with vaccination rates from April 2022 onwards.
Given the extent to which the Covid vaccines were promoted, and in many cases mandated, even a reasonable doubt as to their effectiveness should be sufficient reason for urgent public debate. Note that our conclusions go beyond just raising a reasonable doubt. While the European EM data permits a wide range of possible interpretations, we find those which suggest the vaccines have caused net harm to be more persuasive. Quantifying the harm seems very difficult, but the stakes are definitely high. As we shall see below, at the outer limit of our analysis, if the entire shift in the correlation between EM rates and vaccination rates post-rollout can be laid at the door of the vaccines themselves, then they could have raised mortality across Europe by up to which, over the 2-plus years since they were first administered, would yield approximately 2 million additional deaths.
Acknowledgements
As well as the references listed in the bibliography, we want to acknowledge the work of Igor Chudov, whose Substack article from July 24, 20222 was the first to draw our attention to issues similar to those considered here. Chudov has since written extensively on Substack on the connection between pandemic-era excess mortality and Covid vaccination. The online videos of John Campbell3 are another important source for ongoing public discussion of the topic of excess mortality. Despite the myriad of (mostly non-academic) sources, as far as we know, nobody has done work directly analogous to what we do here and, in any case, we have carried out this work independently.
2. How to measure excess mortality and vaccination rates
We want to perform comparisons between European countries in the pandemic era. There is no “right way” to do this, in particular because there is no right way to measure rates of either EM or vaccination within a country, nor any right choice of weighting between countries to take account of differences in population. Throughout the paper, we will give all countries equal weight, which differs from the approach taken in [1]. We motivate our choice as follows. Since we are doing comparisons between countries, we are already treating each country as a single unit. Hence, the only requirement for including a particular country in the analysis should be that its population be large enough for the data to be accurately representative of what would happen in the same jurisdiction as the population tended to infinity. The smallest country we include, Iceland, has a population of about 350,000. As we shall see, despite having several years of data, there are indeed some indications that the data from the smaller countries is generally more noisy, However, we think far more noise would be introduced by weighting according to population, which would effectively decrease the sample size - about 2/3 of the whole population of the 28 countries in our dataset is concentrated in just 5 of them (Germany, France, Italy, Spain and Poland). In any case, our conclusions seem to be consistent overall with those of [1], even though they studied the European EM data in a somewhat different way.
To keep the paper readable, we focus the discussion on one particular method of measuring EM and vaccination rates which we think is at least plausible. In Section 6, we consider alternative methods which address some of this one’s more obvious flaws. Of most interest are patterns in the data which are robust to the choice of different methods. We employ two sources of raw data: Eurostat and Our World in Data (henceforth abbreviated to Owid).
We use Eurostat data as our primary source for EM rates. Eurostat provides monthly EM rates for each of the 31 EU/EES countries in an easily accessible format [4]. For each month from January 2020 onwards, we have for each country a monthly figure which is the excess mortality, as a percentage, compared to the average for the same month in the years 2016-2019. For example, in the most recent month for which data is available at the time of writing, June 2023, the country with the highest EM rate was Finland at +14.4%. This means that the total number of deaths recorded in Finland during June 2023 was 14.4% higher than the average of the four numbers recorded in June 2016, 2017, 2018 and 2019. We consider March 2020 as the first month of the pandemic, hence Eurostat currently has 40 months, March 2020 - June 2023, of pandemic-era EM data. To estimate the average rate of EM in a country over a certain interval of months during that era, we simply take the average of the rates for the individual months in the interval. This is an over-simplification, since mortality will vary by month and is typically higher during the winter. However, there is no reason to expect the resulting errors to be large or systematically misleading.
Owid provides easily accessible country-level data on both EM [11] and vaccination rates [12], and it will be our only source of data for the latter. Though Owid provides data for every European country, we will only consider the EU/EES countries. As our primary measure of vaccination rates, we take the most recent Owid figure for the percentage of the population in a country that are fully vaccinated, that is, have undergone the primary course of Covid vaccination, which means two doses of Pfizer-BioNTech, Moderna or Astra-Zeneca, or one dose of Johnson-and-Johnson for example. For two countries, Liechtenstein and Switzerland, this data is missing entirely. A third, Luxembourg, stopped giving regular updates already early in the rollout. We thus omit these countries from all further analysis, leaving 28 EU/EES countries for which we have both EM and vaccination data. Even amongst these, Owid does not always provide an up-to-date number for the vaccination rate, presumably because some countries stopped publishing updated figures as the pandemic wound down post-omicron. Iceland seems to be the first to have stopped, with the most recent Owid data point being for March 29, 2022. Since this is after the end of the first omicron wave, it is unlikely that rates of full vaccination have changed much in any European country after that date. Table 1 lists the rates of full vaccination for each of our 28 countries, along with the date of the most recent update.
We are interested most of all in the correlation between EM rates and vaccination rates. We perform linear regression on each month’s data, from March 2020 to June 2023. To see how this works, Table 2 presents the list of EM rates for June 2023, as per Eurostat.
Figure 1 plots the numbers in Table 1 (x-axis) against those in Table 2 (y-axis). Since the June EM number for Iceland is missing, we used the number for May (), which will introduce a small error. The least squares fit then satisfies
In other words, in the least squares approximation, a totally unvaccinated population would have had an EM rate of about , while a fully vaccinated one would have had an EM rate of about . Thus we have a strong positive correlation of EM with vaccination rates in June 2023.
Remark 2.1.
If we instead use the Theil-Sen method to compute the best linear fit to the June data, we get the line with slope and intercept . That the line is a bit flatter than in the least-squares fit is not surprising, since lowly-vaccinated Romania is quite an outlier in Figure 1. We recomputedallthe linear regressions in this paper using the Theil-Sen approach and found no significant differences to the results presented henceforth.
Figure 2 is the key one for our analysis. On the x-axis we plot time in months from March 2020 to June 2023. Thus is March 2020 and is June 2023. We plot the points , where is the slope of the least-squares fit for the i:th month’s data, computed as in the example above using Eurostat EM data and vaccination rates in Table 1. The graph is just the piecewise-linear interpolate between these points.
We first note that the graph lies above the x-axis from onwards, meaning that EM rates have, in the linear regression, been positively correlated with vaccination rates for every month since April 2022. The persistence of this pattern is a priori evidence that the vaccines are doing significant ongoing net harm, a concern which has been raised by many others already. The immediately obvious rejoinder is to observe that, on the other hand, the graph lies below the x-axis for most of the period before April 2020 and includes a number of deep troughs. So let us first consider the whole course of the pandemic. As already stated above, we estimate the average EM rate for a country over the whole course of the pandemic by averaging the monthly numbers from March 2020 onwards. The results are presented in Table 3.
The least-squares fit is now
So, according to the least-squares approximation, over the whole course of the pandemic to date, a population that remained fully unvaccinated would have had an EM rate of about , while one that became fully vaccinated would have had an EM rate of about , or about of the rate of the former population. This is a priori evidence that, overall and to date, the vaccines have had significant net benefit.
Now, of course, it could be the case that the vaccines are doing ongoing net harm now but have still been beneficial overall to date. That in itself would be a huge departure from the dominant mainstream narrative, which continues to assert that the vaccines “saved millions of lives" and whose only concession to a more negative interpretation of more recent data is to assert that their effect may “wane over time", at least unless one keeps “up to date" with booster doses of the latest versions of the vaccines. Moreover, if the trend that has taken hold since April 2022 were to continue, then the overall correlation between EM and vaccination rates, since the pandemic began, would probably turn positive before the end of 2024. We remain cautious about the latter projection, not only because a further year and a half is still a long time during which many things could change, but also because the overall correlation between EM and vaccination rates seems to be sensitive to how one measures EM. This is further addressed in Section 6 below. However, what causes us most concern, in particular because it seems to be more robust to different methods of measuring both EM and vaccination rates, is what we observe when we compare that part of the pandemic before the vaccination rollout to that afterwards. It is to that comparison which we now turn.
3. Before versus after the vaccination rollout
If we look at that part of Figure 2 up to March 2022 (), then we see a clear peak at (April 2020), and three clear troughs at (Nov 2020, Apr 2021, Nov 2021). There is also a smaller peak at (August 2021) and a smaller trough at (February 2022).
Except for the small peak in August 2021, all the other peaks and troughs are roughly contemporaneous with the mortality peaks of Covid waves. Rates of EM itself peaked in precisely these months, see Figure 4.
The reason why there is a peak, rather than a trough, at in Figure 2 is because the first Covid wave in Spring of 2020 largely spared Eastern Europe. From Table 1 it is clear that countries belonging to Eastern Europe, as that term was used as a political designation during the Cold War, almost uniformly ended up being less vaccinated than those of the politically designated Western Europe. The geographical and political designations don’t align perfectly, but they do so well enough to make it obvious that the reason for the peak at is geographical.
Subsequent Covid waves that peaked at or around Nov 2020, Apr 2021, Nov 2021 and Feb 2022 all affected Eastern Europe as well. That all show up as troughs in Figure 2 means that these countries generally experienced higher all-cause EM than their Western counterparts during these waves. Again, this is consistent with the fact, which official Covid statistics clearly show, that Eastern Europe generally experienced higher Covid mortality during all these waves also - see Figure 8 in Section 7. Of the 3 deep troughs, all of which are deeper than the peak at , the deepest of all is at . This seems consistent with the fact that it coincided with the “delta" variant Covid wave, that being the most virulent of all the dominant Covid variants to date. The final trough in February 2022 roughly coincides with the mortality peak of the first omicron wave. That it is much shallower than previous troughs indicates that the performance of Eastern countries relative to Western ones was much improved after omicron took over, though Western countries were still doing better overall during the first omicron wave.
Since April 2022, the tables have turned completely and Eastern countries have consistently had lower EM rates. We also see a clear change in the shape of Figure 2, there are no longer any big peaks or troughs. Once more, this seems consistent with the fact that the nature of the pandemic changed dramatically post-omicron and overall rates of Covid mortality declined substantially. Moreover, it is in fact the case that even official rates of Covid mortality have been positively correlated with vaccination rates since April 2022 - see Figure 8.
Finally, the small peak at (August 2021), along with the even less prominent local maximum at (September 2020), are on the contrary roughly contemporaneous with local minima of Covid prevalence and resemble what one would expect in the aftermath of a “natural pandemic wave". In particular, the August 2021 peak comes after two Covid waves which especially affected Eastern Europe, hence one would expect these countries to perform a bit better in the aftermath as a greater part of their vulnerable populations had already died. As we now know, neither period of subsidence in the summers of 2020 and 2021 marked the end of the pandemic, as new waves crashed to shore in November of each year. But post-omicron, things have been different.
So let’s turn specifically to the role of the vaccines. They obviously can have had no effect on the first two EM peaks in April and November of 2020, since that was before they were rolled out at all. On the other hand, the peak (i.e.: trough in Figure 2) in November 2021 should obviously be placed after the rollout. Now, since the trough in Nov 2020 is considerably deeper than the peak at Apr 2020, it looks as if countries which ended up being more highly vaccinated were already doing better before the vaccine rollout which, if it is the case, must have been due to other factors. For comparison of the pre- and post-rollout periods it thus becomes crucial what we do with the trough at April 2021. I will argue in Section 5 why this wave of Covid and all-cause excess mortality was likely almost independent of the vaccines - in summary, because (i) it peaked too early in the rollout (ii) in this early stage, cross-country vaccination rates do not correlate strongly with where they later ended up (iii) this wave was highly, though not exclusively, concentrated in countries which largely escaped the first wave in Spring 2020, indicating an underlying epidemiological mechanism.
The natural cut-off between the pre- and post-rollout periods is thus April 20214. Table 4 gives the average EM rate for each country in the two periods.
Plotting against the vaccination rates in Table 1, the least-squares fits in the two periods are ( is pre-rollout), where
We see that in both periods, EM rates are negatively correlated with current vaccination rates, but the correlation is much stronger in the pre-rollout period. The difference would represent a shift in mortality rates in favour of a fully unvaccinated population over a fully vaccinated one. The worst possible interpretation of that correlation shift is that the vaccines have failed to such an extent so as to raise mortality rates by almost which, over the 2+ years since their introduction, would represent over 2 million additional deaths in the 28 countries in our dataset - that is, over 2 million additional deaths in a fully vaccinated population compared to one that remained fully unvaccinated.
Now this worst-case scenario is almost surely too pessimistic because of the role of survivor bias. Simply put, those countries which experienced higher EM rates earlier on in the pandemic should compensate by having lower EM rates later on because of the greater demographic shift towards healthier, less vulnerable populations. For sure, this phenomenon is playing some role because even amongst countries which ended up being highly vaccinated, there are several whose average EM rate is lower in the post-rollout period, namely: Belgium, France, Italy, Malta, Portugal, Spain, Sweden. With the possible exception of Malta and Portugal, all of these countries were particularly badly affected already by the first Covid wave in Spring 2020. For future purposes, I will refer to the previous group of countries as Group 1. The remaining countries in Table 4 that have lower average EM rates post-rollout are Bulgaria, Croatia, Czechia, Hungary, Lithuania, Poland, Romania, Slovakia, Slovenia. These countries form Group 2. All are in Eastern Europe and all ended up with vaccination rates below the European average. Finally, Group 3 will refer to those countries which have higher average EM rates in the post-rollout period, namely: Austria, Cyprus, Denmark, Estonia, Finland, Germany, Greece, Iceland, Ireland, Latvia, Netherlands, Norway. With the exception of Estonia and Netherlands5, all ended up with below-average vaccination rates.
That Group 3 contains any countries at all is the first indication that survivor bias cannot adequately explain the difference between the pre- and post-rollout periods. Note first that the survivor bias phenomenon is itself independent of any pharmaceutical interventions. As a natural pandemic subsides, EM rates should decline everywhere, though the bias explains why they might decline more slowly in places that were less badly affected earlier on, even to the extent that EM rates might eventually be higher in these countries as the pandemic wanes. A truly effective pharmaceutical intervention, which prevented transmission and infection of the pathogen, would simply hasten the subsidence of the pandemic, hence accentuate the survivor bias in a context where EM rates were declining everywhere. In other words, a priori the only thing that can account for EM rates increasing in some places after the vaccine rollout is if the vaccines were either unsafe and thereby caused adverse reactions, or ineffective and thereby did not prevent the continuation of the pandemic. Now, of course, the pandemic did continue. The delta-driven wave in late 2021 was of comparable severity, in terms of mortality, to the previous ones, the subsequent first omicron wave less so, even as case rates exploded. Furthermore, note that, apart from Cyprus, the Group 3 countries with the biggest post-rollout increases in EM rates are Iceland, Norway, Finland, Denmark, all Scandinavian countries which had very little Covid at all pre-omicron, thus during all of 2020 and 2021, and much higher rates of even Covid mortality in 2022 [14]. An enthusiast might at this point claim that the vaccines could have terminated the pandemic in 2021 if their uptake had been even quicker and higher. But even the official pronouncements of public health authorities in the latter part of 2021, while continuing to assert the vaccines’ safety, switched decisively from claiming that they could stop the pandemic dead in its tracks (i.e.: prevent transmission and infection) to the more modest claim that they “prevented severe Covid outcomes". Thus, it doesn’t even seem controversial at this point to assert that the vaccines have failed in the purpose that is traditionally associated with the term “vaccine", namely to being the pandemic to an end (or, in other circumstances, to prevent its reemergence). Of course, it remains possible that they behave as a (safe) treatment that has reduced mortality - precisely the issue under investigation in this paper - but the point is that the manifest failure to achieve their primary purpose is itself reason for suspicion of the more modest claim.
But even the more modest claim seems highly dubious if we compare 2021 to 2022. Table 5 lists the average EM rate for each country in both 2021 and 2022:
Every country in Group 2 experienced lower EM in 2022 than in 2021, sometimes by huge margins (e.g.: Bulgaria, Romania, Slovakia). For most countries in Group 3 it was the other way round, the exceptions being Estonia, Greece, Latvia and Netherlands, of which only Estonia and Latvia6 experienced significant declines in 2022. But the most important finding in Table 5 concerns Group 1:
Now the pandemic, as measured in terms of Covid mortality, certainly waned in 2022. At the beginning of our analysis, we observed that EM rates have been positively correlated with vaccination rates since April 2022. Survivor bias can, in theory, explain this in the context of a waning pandemic. It is also, in theory, consistent with the existence of countries in Group 3, since the most virulent Covid variant to date was dominant in the pandemic wave that occurred after the vaccine rollout, in late 2021. Indeed, we noted above that the Group 1 countries provide evidence that survivor bias played some role in the post-rollout shift of EM in favour of less vaccinated countries. However, survivor bias cannot account for the consistent increase in EM in the Group 1 countries in 2022 - in the context of a waning pandemic, the two are
contradictory !
4. Conclusions
Given the extent of the worldwide campaign for mass uptake of the novel mRNA/adenovirus vector-based Covid-19 vaccines, and especially due to the fact that this campaign often involved explicit coercion (mandates etc.), from a moral viewpoint the very least one would expect is for all-cause mortality data to show crystal clear evidence for the benefit of these products. When we look at data in the EU/EES region, such evidence is conspicuously lacking. The only real evidence in their favour is an overall modest negative correlation ( in eq. (1)) post-rollout between EM rates and vaccination rates. But this correlation was already much more strongly negative before the vaccines appeared on the scene. Already in 2021, the vaccines clearly failed in their primary purpose of bringing the pandemic to an end. Then, comparing 2021 to 2022 reveals patterns that are simply inconsistent with survivor bias, which therefore cannot fully explain the shift from pre- to post-rollout periods. Note that, if the trend which has been in place since April 2022 continues, with EM and vaccination rates robustly positively correlated, then the value of will likely turn positive before the end of 2023, while the correlation between EM and vaccination rates for the entire period after March 2020 could turn positive before the end of 2024. The latter period is long enough that one should be cautious about making such a prediction, however.
Not only is there a lack of clear evidence in favor of the vaccines, but I think the most straightforward reading of the data points in the opposite direction. From 2021 data it is already clear that the vaccines failed in their primary purpose to end the pandemic - they stopped neither viral transmission nor infection. Then, once the highly infectious but much milder omicron variant had rapidly spread across the globe, subsequent data suggests that the more highly vaccinated countries have been less successful in developing broad population-level (herd) immunity (see also Section 7 below), while adverse reactions to the vaccines themselves continue to take lives. Indeed, while the EM data cannot by itself prove any causal claims, many others have investigated the direct adverse effects of the vaccines. If they have done net harm, then quantifying how much, based on EM data alone, is very difficult. Among the myriad sources of uncertainty, here are some obvious ones:
- (a)
- While we are confident survivor bias has played some role post-rollout, and equally confident it cannot account for the overall pattern, we see no clear way to determine where we should land between these two poles.
- (b)
- We have concentrated in our analysis on overall correlations, which mask the ongoing large variations in the performances of different countries, even neighbouring ones. Such variations indicate the presence of other important factors affecting EM rates. There are indeed obvious candidates for other factors affecting pandemic-era mortality - Covid itself, non-pharmaceutical interventions, underlying demographics, economic and public health status etc - and isolating the role of just the vaccines is inevitably difficult.
Despite these difficulties, we should not be distracted from basic moral principles, the most relevant of which is contained in the Hippocratic injunction to "first do no harm". As we noted above, our analysis allows for the possibility that the vaccines have caused up to several million additional deaths in Europe alone to date. That may be an extreme conclusion, but in the absence of clear evidence for an opposite one, the lack of even an open public debate in mainstream institutions about the mass vaccination campaign appears indefensible.
5. The April 2021 EM peak
The following table ranks our 28 countries according to the percentage of the population fully vaccinated on the last day of each of the first 4 months of 2021. Data is from Owid. In a few cases, there is no data point for the exact date in question - if so, we interpolate (linearly) between the data points immediately before and after that date.
We have included the figures for the end of April in the table, but in reality for a pandemic wave that peaked in April, at best the figures for the end of March can be relevant. At that point, the average rate of full vaccination in our 28 countries (giving them equal weight) was . While it is true that those considered most vulnerable to Covid were generally vaccinated first, that percentage still seems far too low to have had meaningful impact on a wave which was already then nearing its peak. Furthermore, if we look at the ranking of countries on 31 March, then it is clear to the naked eye that there is no strong correlation with the eventual ranking in Table 1. All but a few countries are clustered in a small range between 4 and 6 percent. It is true that Bulgaria, the country with the highest average EM rate in 2021 (Table 5), is at the bottom, but so is Finland, which experienced very little Covid at all pre-omicron. Sweden, the country with the best EM numbers of all, especially after 2020, was relatively slow in ramping up its vaccination campaign. In short, I see nothing in Table 6 suggesting that the vaccination campaign had any relevance for the wave of Covid and all-cause mortality that peaked in April 2021.
What do seem to be at least somewhat relevant, on the other hand, are geography and whether or not a country was badly affected in the first Covid wave in Spring 2020. According to graphs provided by Worldometers, the countries with the most prominent peaks of Covid mortality in late Spring of 2021 are Bulgaria7, Croatia, Czechia, Greece, Hungary, Poland and Romania, all countries in Eastern Europe (geographically) and which more or less escaped the first Covid wave in Spring 2020. While it’s clear from the graphs for various European countries that there are also other factors in play, I still see nothing to suggest a significant role for the vaccines in influencing either Covid or all-cause mortality up to April 2021.
6. Alternative measures of EM and vaccination rates
Firstly, there are a number of objections one might raise to our method of measuring vaccination rates, which we refer to as Method 1 (M1):
- (a)
- Since the Owid figures are no longer being updated for certain countries, we are not quite comparing “apples with apples". To remedy this, we also considered rates of full vaccination for every country on 31/12/2021 (M2), at which time every country was still updating its numbers. In cases where there is no data point for exactly that date, we interpolate linearly between the two adjacent data points.
- (b)
- M2 deals with the “apples to apples" issue, but ignores the possible effect of booster campaigns. In most countries, these ramped up only after the omicron variant took over, and hence into the first few months of 2022. Owid also provides data on the average number of vaccine doses per person. This measure (M3), at least to some extent, addresses the possible role of booster campaigns. It suffers from the same issue as M1, namely that certain countries have stopped updating their data, but there’s not much we can do about that.
- (c)
- M1 also misses those people who took the first dose of a two-dose primary vaccination but never took the second dose. Since those who suffered adverse reactions are likely to be overrepresented in this group, it makes sense to try to include them. Owid also provides data on the percentage of the population who have to date received at least one dose. This measure M4 has the same “apples to apples" problem as M1 and M3.
Table 7 lists the numbers for each country according to each of the measures M1-M4 of vaccination rates. The numbers in columns M1, M2, M4 are percentages of the population, while those in M3 are average numbers of doses per person, times 100. Column M1 is just a copy of Table 1.

Table 7.
Four different measures of vaccination rates. Source: Owid. Data extracted 31/8/23.
| Country | M1 | M2 | M3 | M4 |
|---|---|---|---|---|
| Austria | ||||
| Belgium | ||||
| Bulgaria | ||||
| Croatia | ||||
| Cyprus | ||||
| Czechia | ||||
| Denmark | ||||
| Estonia | ||||
| Finland | ||||
| France | ||||
| Germany | ||||
| Greece | ||||
| Hungary | ||||
| Iceland | ||||
| Ireland | ||||
| Italy | ||||
| Latvia | ||||
| Lithuania | ||||
| Malta | ||||
| Netherlands | ||||
| Norway | ||||
| Poland | ||||
| Portugal | ||||
| Romania | ||||
| Slovakia | ||||
| Slovenia | ||||
| Spain | ||||
| Sweden | ||||
| Average |
In Figure 5, Plot 1 is the same as Figure 2 and Plots 2-4 are the analogous plots, but using measures M2-M4 respectively in place of M1. The plots all look extremely similar.
The analogous numbers to those in eq. (1) for measures M2-M4 are in Table 8 (we also restate the M1-derived numbers for a direct comparison).
It is clear that whether we use M1, M2 or M4 makes little difference for the discussion in this paper. Regarding M3, the numbers should of course be smaller in absolute value since those in column M3 of Table 7 are 2-3 times larger than those in the other columns. When we take account of boosters the shift from the pre- to post-rollout periods might be somewhat smaller, though still on the order of . This might suggest that additional boosters have diminishing effect compared to the primary vaccination, but this is quite speculative. The important point is that the main patterns discussed in this paper are robust to different methods of measuring vaccination rates in the population.
Next, we consider alternative methods for measuring EM. Owid uses two different methods to compute EM, and also includes 2015 in the baseline - thus, the baseline is the period 2015-2019.
The first method, just as with Eurostat, computes EM vis a vis the raw average in the baseline period. The difference is that there is one data point per week, rather than per month. The four plots in Figure 6 are analogous to those in Figure 5. For each month, we estimate the EM rate for a country by taking the average of the rates for the weeks ending in that month (of which there are thus either 4 or 5 per month). Since weeks and months don’t overlap exactly, this will introduce an additional source of error but, as with the averaging process itself, there is no reason to expect such errors to be large or systematically misleading.
The four plots all look very similar, both to one another and to those in Figure 5. The numbers in Table 9 are analogous to those in Table 8.
The numbers are a bit larger and the shifts a bit smaller than the corresponding ones in Table 8, which presumably has more to do with the inclusion of 2015 in the baseline rather than the switch to weekly from monthly raw EM data8. The differences are minor, however, and there is no reason to revise the analysis of the paper based on these numbers.
The second method employed by Owid is both more interesting and more opaque, as it relies on trying to model mortality trends based on the baseline numbers. If the model predicts rising mortality, then the raw EM numbers in the pandemic era are adjusted downwards and vice versa. I am a priori scpetical to this approach, since the whole purpose of choosing a 4- or 5-year baseline would seem to be to avoid having to model mortality trends. In other words, it represents a trade-off between a too long time frame, which would require one to take account of long-term trends, and a too short one which would leave less and hence generally noisier data.
Nevertheless, for completeness, we repeated all our calculations using these new EM numbers. The four new plots and numbers are in Figure 7 and Table 10.
Compared to Table 8, the numbers and are all shifted downwards, and the shifts are larger this time. This is a result of the fact that EM rates computed by this method are generally lower for highly vaccinated Western European countries and (to a lesser extent) higher for lower-vaccinated Eastern ones - in other words, the former generally had rising mortality already in the baseline, according to the model, whereas the for the latter it was the reverse (to a lesser extent). The average EM rates, according to this method, for all 28 countries in the pandemic era to date are presented in Table 11. In some cases, the difference from Table 3 is huge (e.g.: Lithuania, Malta, Cyprus). This seems hard to explain and may be mostly noise - the fact that the biggest changes are in countries with small populations supports this view.
What is most important, however, is that our analysis of the shift between the pre- and post-rollout periods remains essentially unchanged. Firstly, the numbers are, while smaller than before, still considerable, representing a shift of close to (as compared to in the original analysis) no matter whether we use measure M1, M2 or M4 for vaccination rates. Secondly, the partition of our 28 countries into Groups 1, 2, 3 requires only minor modifications. The numbers analogous to those in Table 4 and Table 5 are presented in Table 12 and Table 13 respectively.
Every country previously in Group 1 still has lower average EM after April 2021. For those previously in Group 2, only Croatia and Lithuania now show marginally higher average EM in the post-rollout period. In Group 3, only Netherlands now shows a modest post-rollout improvement.
Finally, when we compare 2021 to 2022, it remains the case that every country previously in Group 2 had lower EM in 2022, with Bulgaria, Romania and Slovakia still showing the most stunning decreases. For Group 3, the only country that behaves differently this time is Cyprus, which shows a modestly lower average EM in 2022. Most importantly, among Group 1 countries all but Malta continue to show higher EM in 2022 than in 2021, and for Malta the decrease is marginal.
Thus Malta, Cyprus, Lithuania and Croatia are the only countries for which the qualitiative analysis in Section 3 needs to be modified at all. We already identified the first three as those for whom this latest method of estimating EM results in the largest changes, and the small populations of all three (Croatia’s isn’t large either) casts further doubt on whether we are dealing with anything but mostly noise here. An advocate for the Covid vaccines might at this point hang their hat on the fact that Malta was the country whose vaccination campaign got off the ground quickest (Table 6) and which ended up with the highest rate of full vaccination (Table 1). But to rest one’s case on the performance of a single tiny country whose mortality data looks particularly noisy seems to be clutching at straws.
7. Covid mortality rates
In this section, we use Covid mortality data from Worldometers. Though a high quality database, it suffers from several drawbacks which seem to be unavoidable in attempting to measure Covid mortality. For example:
- (a)
- There has never been, and probably cannot be, a universal standard as to what constitutes a death due to Covid. This problem became even more acute once the generally milder, but more infectious, omicron-derived variants took over.
- (b)
- As the pandemic waned after the first omicron wave, reporting of Covid deaths in many countries became more intermittent. Some countries moved from daily to less regular (usually weekly) updates in 2022, though essentially all 28 of the EU/EES countries we’ve been considering here, bar Iceland, were still updating their data regularly throughout 2022. In 2023, however, reporting has become progressively more patchy in most places and for many EU/EES countries, Worldometers has stopped updating their numbers altogether over the last few months.
With these caveats in mind, we extracted from Worldometers, for each of our 28 countries, the total number of Covid deaths in each month from March 2020 to June 20239, and then computed the Covid death rate for the month as number of deaths per million of population, using the current figure Worldometers also provides for the population of each country10. We then computed a least-squares best fit to each month’s data, analogous to Figure 1, using the same vaccination rates as in Table 1. Doing this for each month, we get the figure below, which is the analogue of Figure 2.
What stands out, to us at least, is that Figure 2 and Figure 8 have the same basic “shape". Prior to 2022, the only notable difference is that in Figure 8 the first deep trough has been shifted one month to December 2020 (). Just as with EM rates, from April 2022 () onwards Covid mortality rates are positively correlated with vaccination rates. However, the height of this part of the graph above the x-axis, compared to the depths of the previous troughs, is much smaller than in Figure 2. This is not surprising, since (official) Covid mortality has, despite the superposition of further waves caused by new variants, generally waned after the initial omicron wave. In particular, since April 2022 Covid deaths have only been able to account, even potentially, for a small and, over time, vanishing proportion of all-cause EM. Nevertheless, as far as correlation with vaccination rates is concerned, Covid and all-cause EM have continued to track one another closely, qualitatively if not quantitatively. While this seems significant, we are not sure at this stage what conclusions to draw from it, if any, as far as the success or failure of the vaccines is concerned.
8. Final remarks
In summary, this paper presents evidence that, while average rates of excess mortality in the pandemic era to date are robustly negatively correlated with current vaccination rates across the EU/EES region, a closer analysis suggests that it would be premature to conclude that the Covid vaccines have reduced mortality and, indeed, it is more plausible that the opposite is the case. As one final piece of evidence, consider the rows M1, M2 and M4 in each of Table 8, Table 9 and Table 10. All nine of the numbers are positive. The smallest of them is , obtained from row M4 of Table 10. What this means is that, no matter which of these 9 methods we employ to measure EM and/or vaccination rates, the linear regression predicts that a fully vaccinated population would have at least ca. higher EM after the vaccine rollout than before it11. On the other hand, all 9 numbers are negative, the smallest being from row M1 of Table 10, so the regression predicts that a fully unvaccinated population would have seen EM decrease by at least in the post-rollout period. How is it possible for EM to increase in a fully vaccinated population if the vaccines are saving lives ?
References
- Aastad and O. A. Kvitastein, Is there a Link between the 2021 COVID-19 Vaccination Uptake in Europe and 2022 Excess All-Cause Mortality?, Asian Pacific Journal of Health Sciences, Vol. 10, No. 1 (2023). https://www.apjhs.com/index.php/apjhs/article/view/3017.
- Vanden Bossche and R. Rennebohm, The Inescapable Immune Escape Pandemic, Pierucci Publishing (2023).
- E. Dowd, “Cause Unknown": The Epidemic of Sudden Deaths in 2021 & 2022 (Children’s Health Defense), Skyhorse Publishing (2022).
- Eurostat: Excess mortality - statistics. https://ec.europa.eu/eurostat/statistics-explained/index.php?title=Excess_mortality_-_statistics#Excess_mortality_in_the_EU_between_January_2020_and_December_2022.
- N. Fenton and M. Neil, Where are the numbers? (Substack). https://wherearethenumbers.substack.com/t/excess-deaths.
- J. Finsterer, Neurological side effects of SARS-CoV-2 vaccinations, Acta Neurologica Scandinavica, Vol. 145, No. 1 (2022), 5–9. [CrossRef]
- R. A. K. Kadali, R. Janagama, S. Peruru and S. V. Malayala, Side effects of BNT162b2 mRNA COVID-19 vaccine: A randomized, cross-sectional study with detailed self-reported symptoms from healthcare workers, International Journal of Infectious Diseases, Vol. 106 (2021), 376–381. [CrossRef]
- O. Karlstad, P. Hovi, A. Husby, T. Härkänen, R. M. Selmer, N. Pihlström et al, SARS-CoV-2 Vaccination and Myocarditis in a Nordic Cohort Study of 23 Million Residents, JAMA Cardiology, Vol. 7, No. 6 (2022), 600–612. [CrossRef]
- M. Klugar, A. Riad, M. Mekhemar, J. Conrad, M. Buchbender, H. P. Howaldt et al, Side Effects of mRNA-Based and Viral Vector-Based COVID-19 Vaccines among German Healthcare Workers, Biology-Basel, Vol. 10, No. 8 (2021). [CrossRef]
- M. E. Oster, D. K. Shay, J. R. Su, J. Gee, C. B. Creech, K. R. Broder et al, Myocarditis Cases Reported After mRNA-Based COVID-19 Vaccination in the US From December 2020 to August 2021, JAMA, Vol. 327, No. 4 (2022), 331–340. 20 December. [CrossRef]
- Our World in Data: Excess mortality during the Coronavirus pandemic (COVID-19). https://ourworldindata.org/excess-mortality-covid.
- Our World in Data: Coronavirus (COVID-19) Vaccinations. https://ourworldindata.org/covid_vaccinations.
- M. Patone, X. W. Mei, L. Handunnetthi, S. Dixon, F. Zaccardi, M. Shankar-Hari et al, Risk of Myocarditis After Sequential Doses of COVID-19 Vaccine and SARS-CoV-2 Infection by Age and Sex, Circulation, Vol. 146, No. 10 (2022), 743–754. [CrossRef]
- Worldometers Coronavirus Tracker. https://www.worldometers.info/coronavirus.
| 1 | There is, of course, ongoing debate as to when the first Covid-19 cases actually appeared in Europe. In official data, however, the first Covid deaths are generally recorded in March 2020 and this was also the month when non-pharmaceutical public health interventions began to be applied widely across the continent. |
| 2 | |
| 3 | |
| 4 | Because both Covid and all-cause excess mortality subsided for a few months after April 2021, it wouldn’t make much difference where we placed the cutoff during this period. By late summer of 2021, large majorities of those who would eventually be fully vaccinated had already received their doses. |
| 5 | Netherlands is an outlier since, despite mounting an aggressive vaccination campaign, official statistics show it ending up with a lower than average rate of full vaccination. If we take into account boosters, however, it instead ends up above average - see column M3 of Table 7 in Section 6. Latvia is the only country to switch in the opposite direction. |
| 6 | See Footnote 5. |
| 7 | |
| 8 | The exclusion of June 2023 this time will also contribute something to reducing the shift. |
| 9 | In some cases, since a data point for the last day of a month was missing, we had to interpolate between adjacent data points to arrive at an approximate monthly total. This introduces miniscule errors. |
| 10 | Since the total population of a country isn’t constant, this introduces further tiny errors. |
| 11 | For row M3 in Table 10, we get for . A “fully vaccinated and boosted" population would have . |
Figure 1.
Excess mortality rates in June 2023 vs. vaccination rates for 28 EU/EES countries, along with the least-squares best fit.
Figure 1.
Excess mortality rates in June 2023 vs. vaccination rates for 28 EU/EES countries, along with the least-squares best fit.
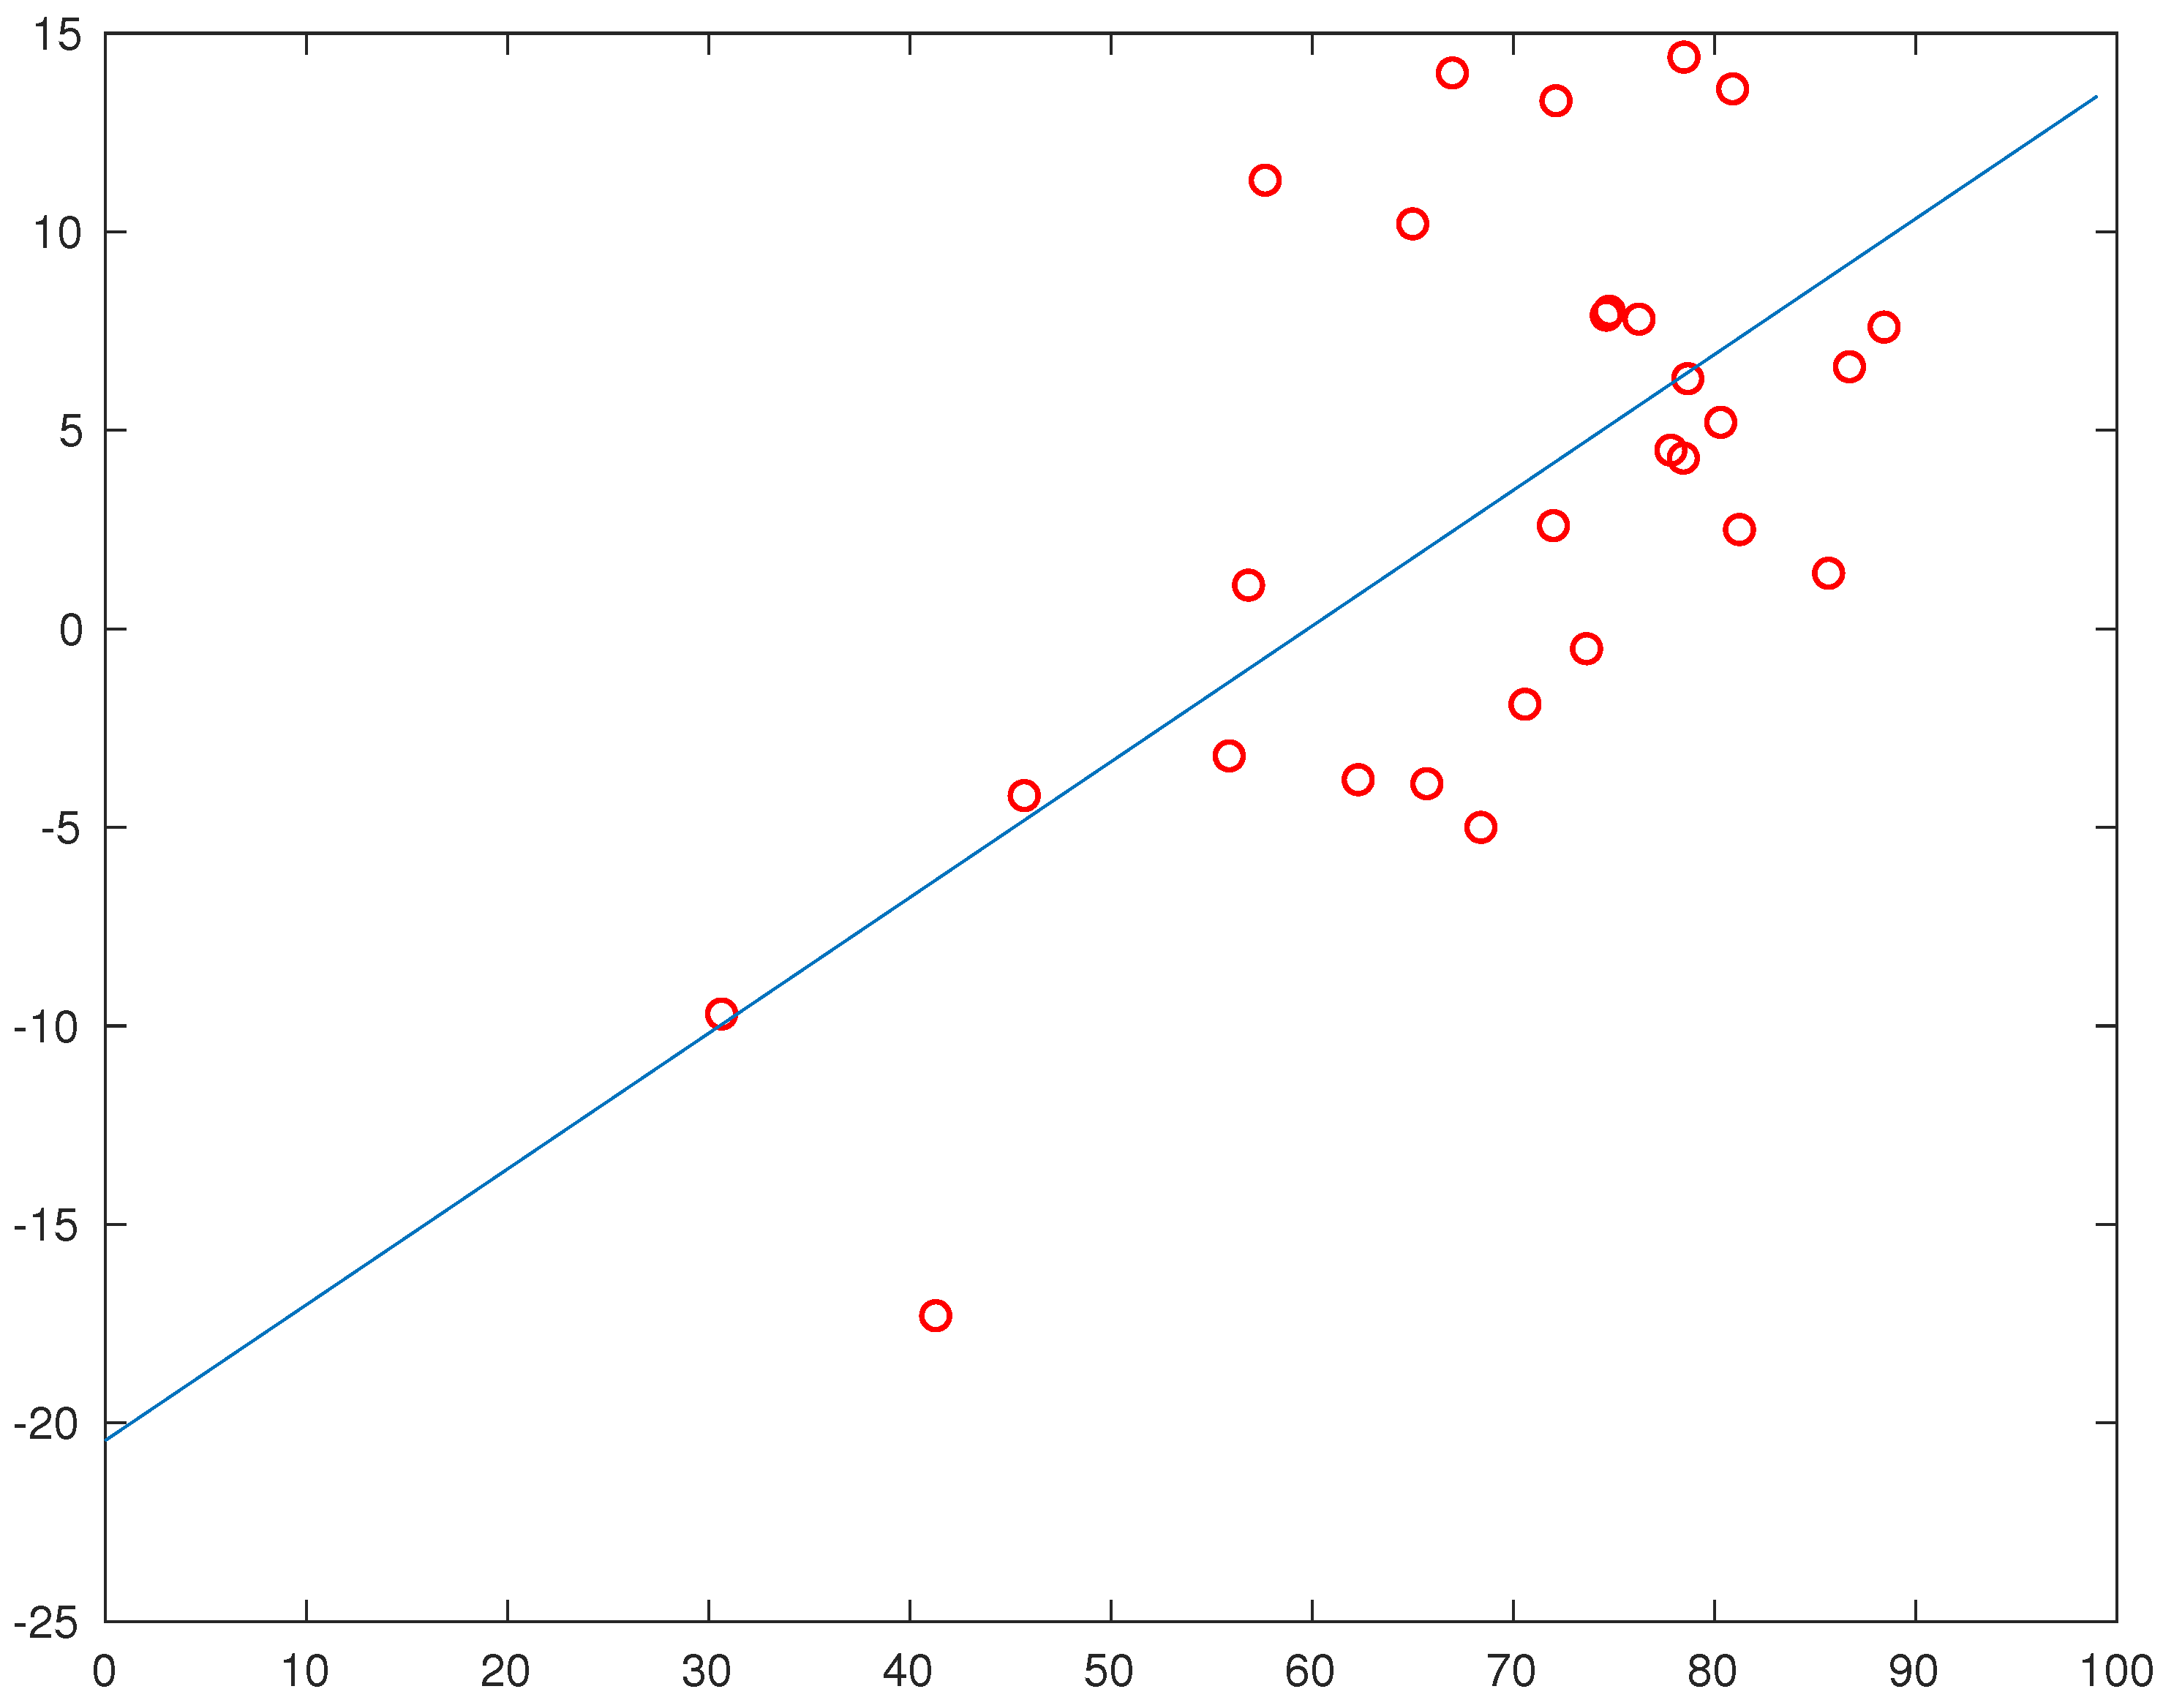
Figure 2.
The plot shows how EM rates correlate with current rates of full vaccination for every month from March 2020 to June 2023.
Figure 2.
The plot shows how EM rates correlate with current rates of full vaccination for every month from March 2020 to June 2023.
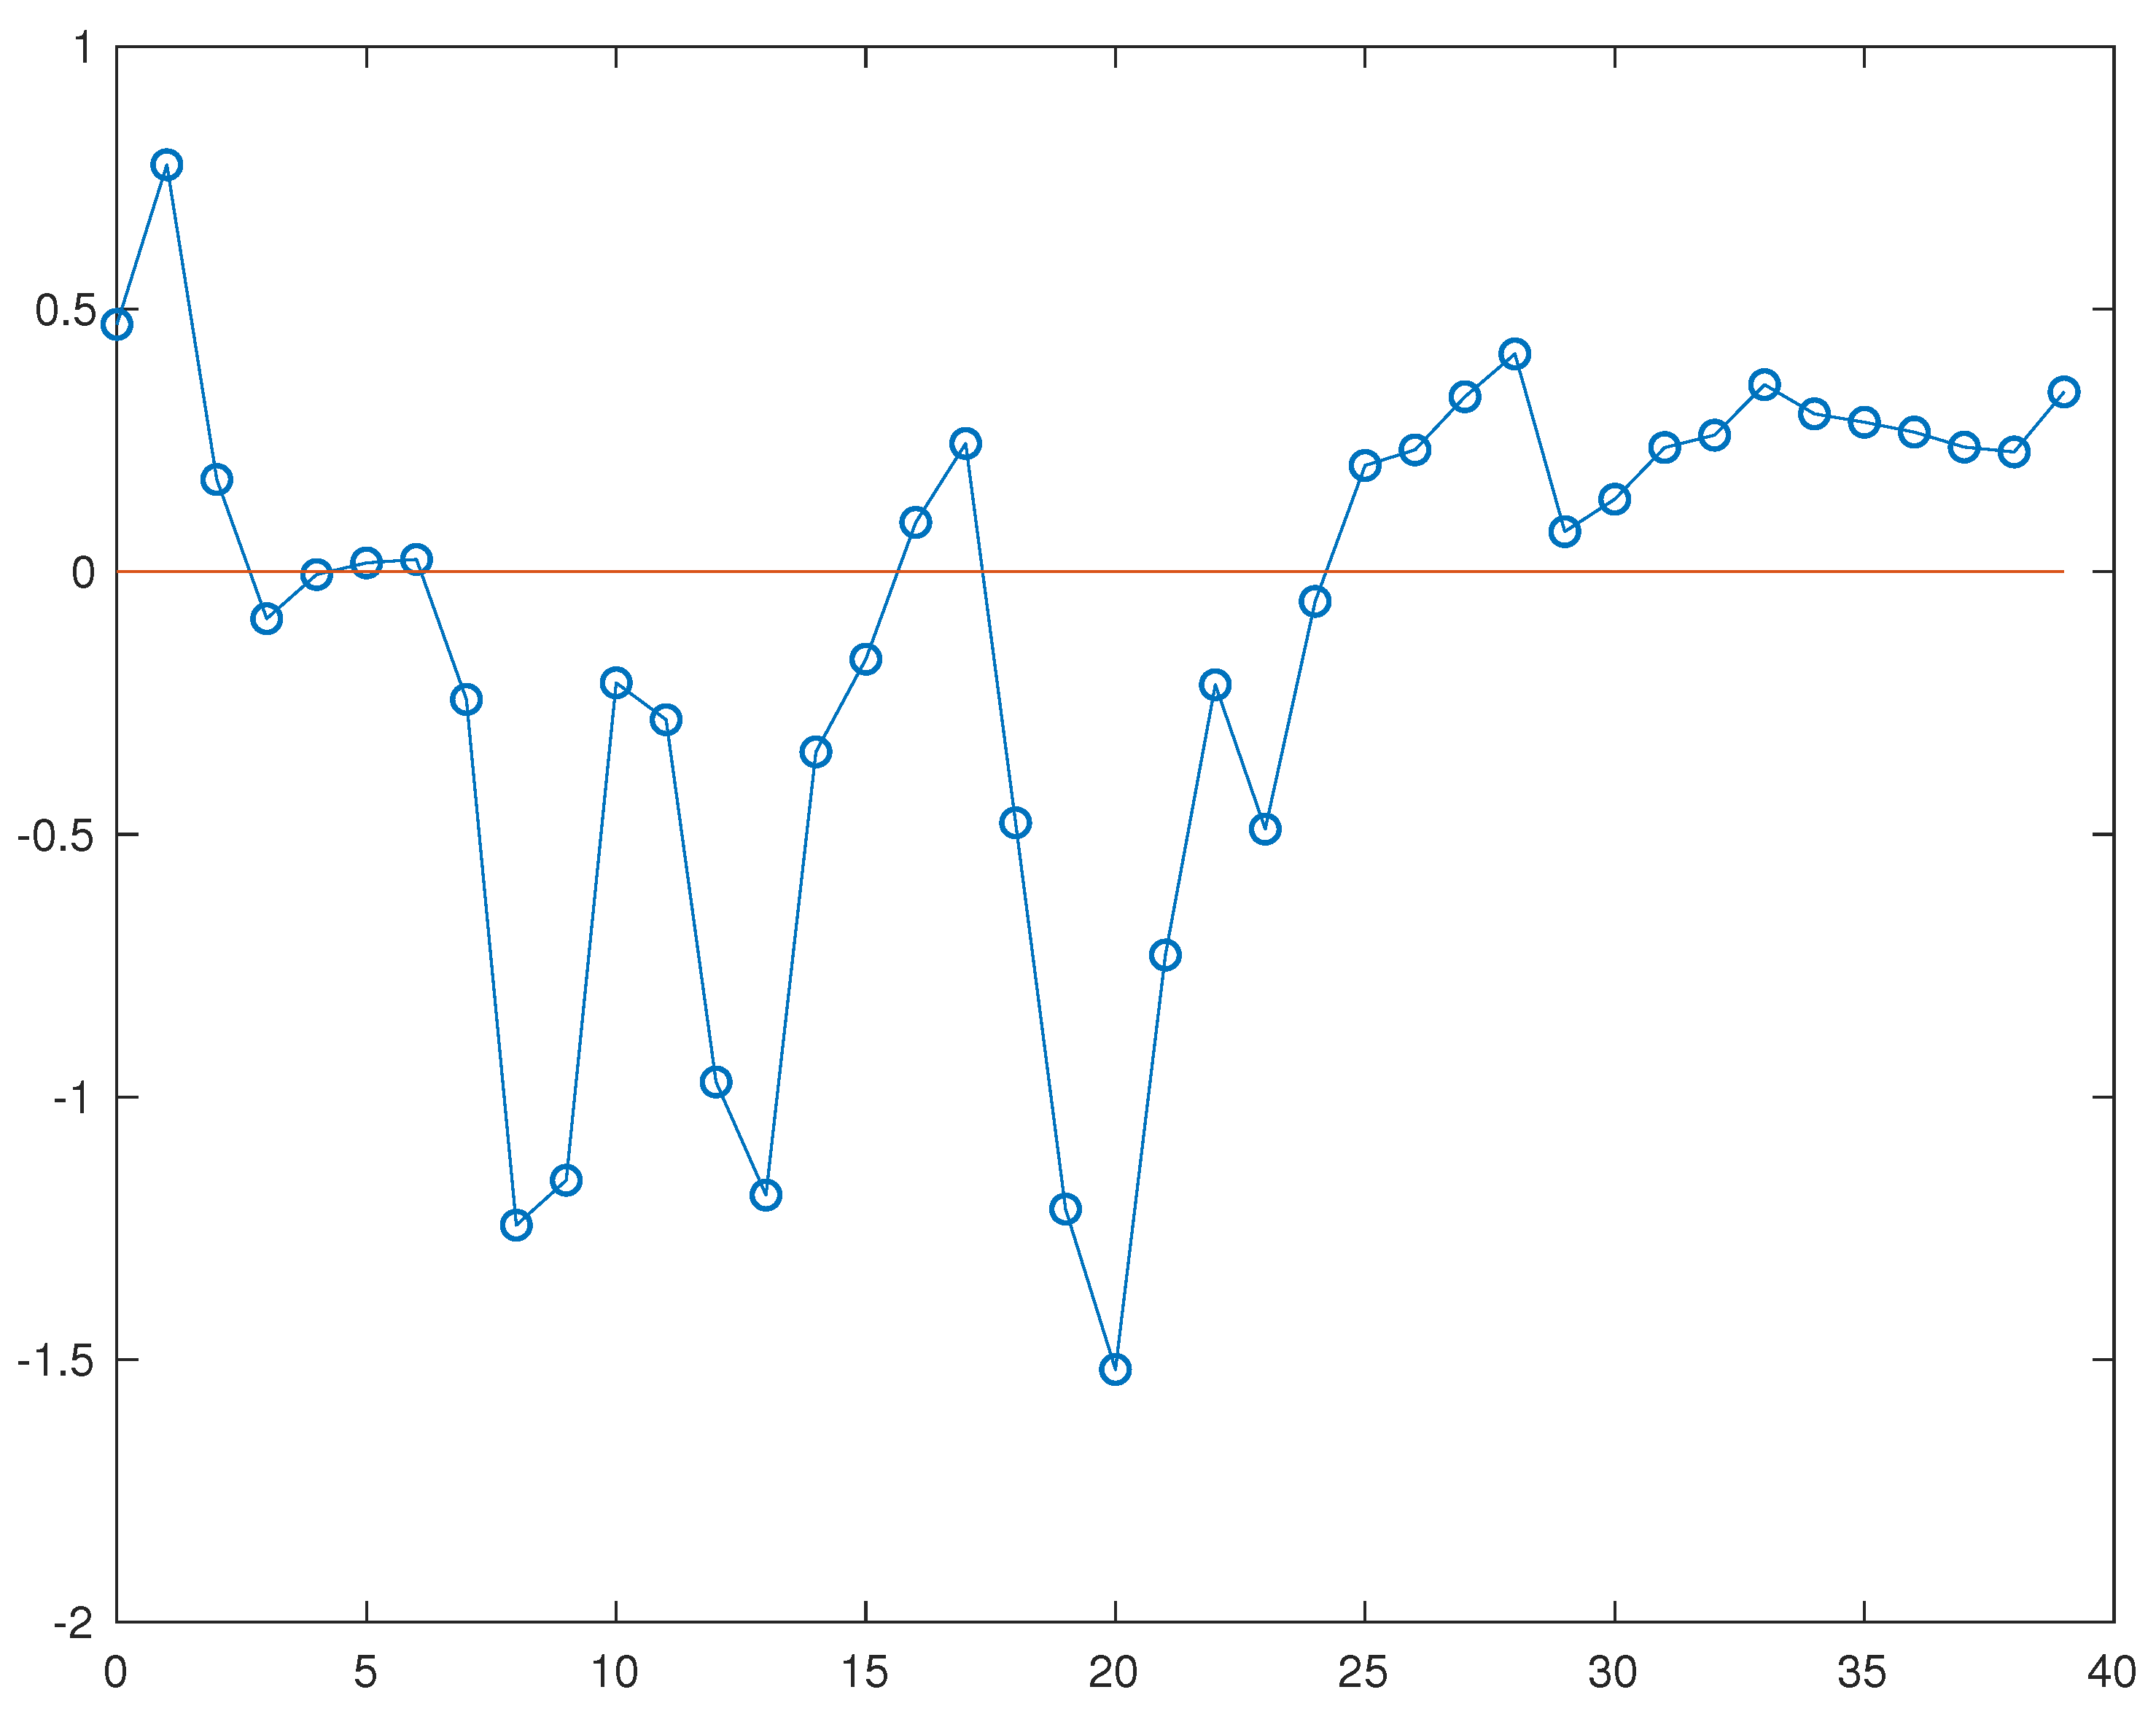
Figure 3.
Average pandemic-era excess mortality rates vs. current rates of full vaccination, along with the least-squares best fit.
Figure 3.
Average pandemic-era excess mortality rates vs. current rates of full vaccination, along with the least-squares best fit.
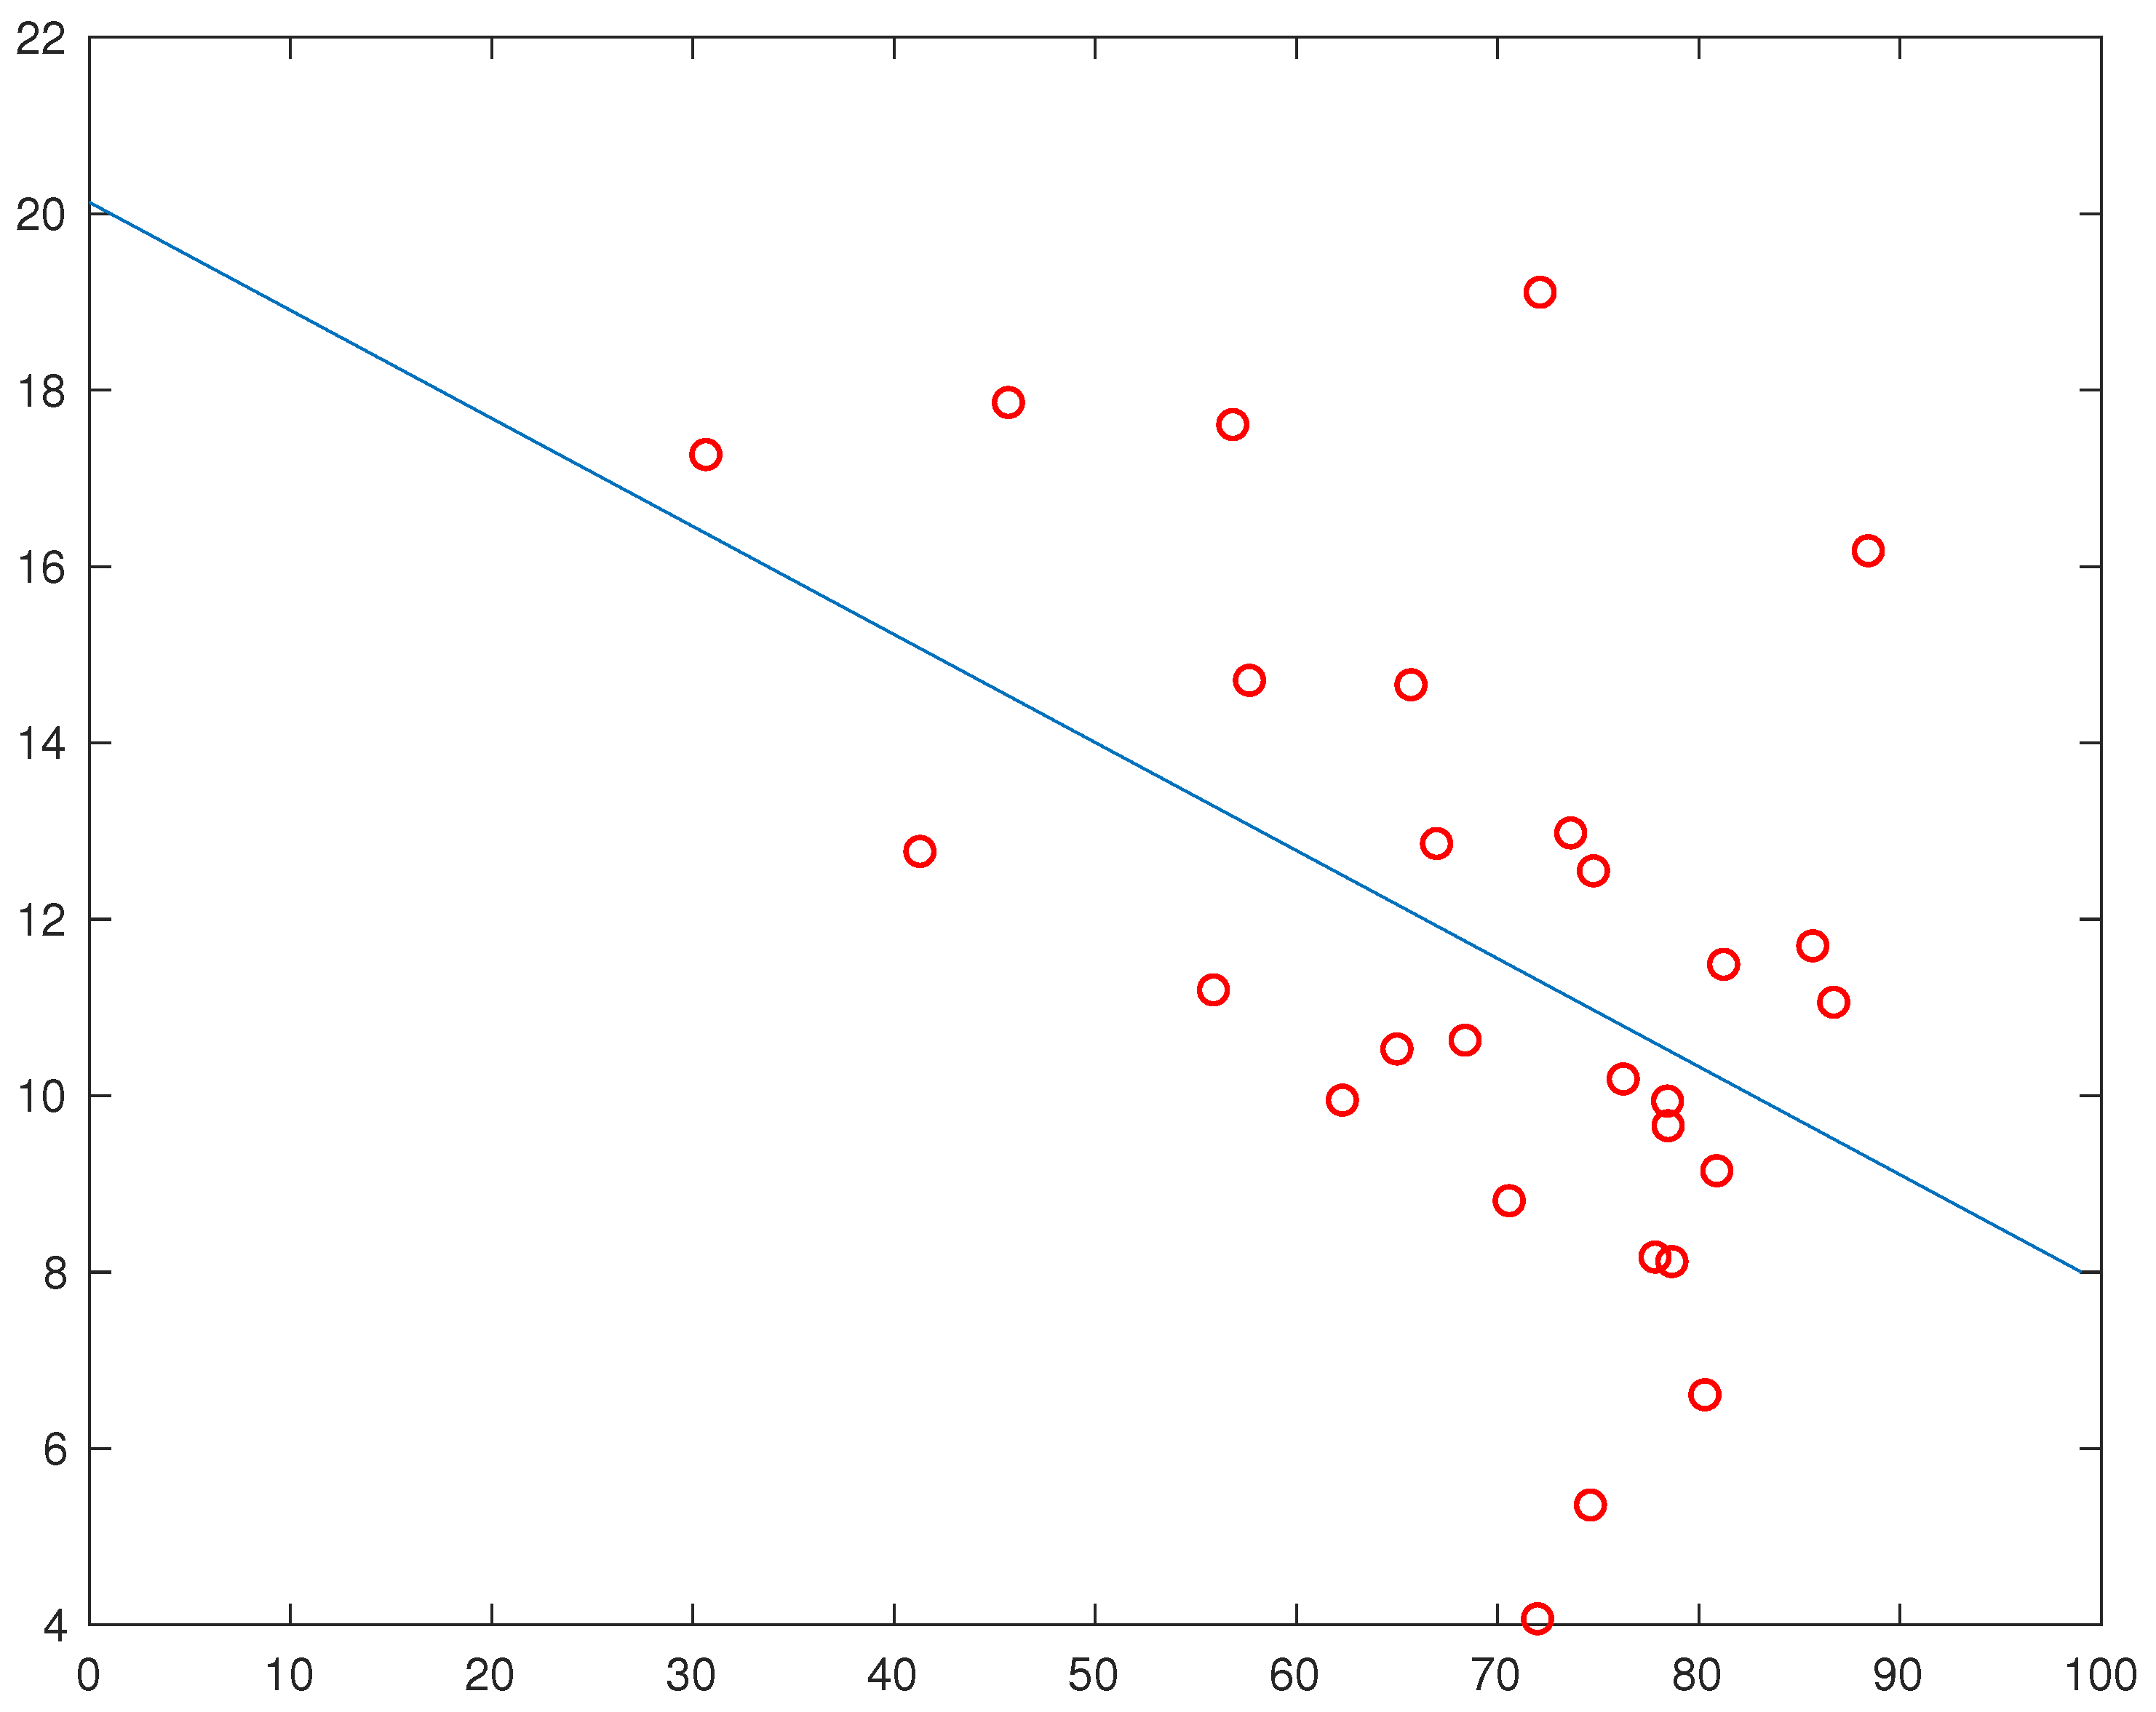
Figure 4.
Average rate of excess mortality in 28 EU/EES countries (y-axis), for each month March 2020 - June 2023 (x-axis). All countries are given equal weight. A similar figure can be found on the website [4], but for the 27 EU countries (so Norway and Iceland are excluded, but Luxembourg included), and with countries weighted by population. The two figures look very similar, in particular the locations of the EM peaks are the same.
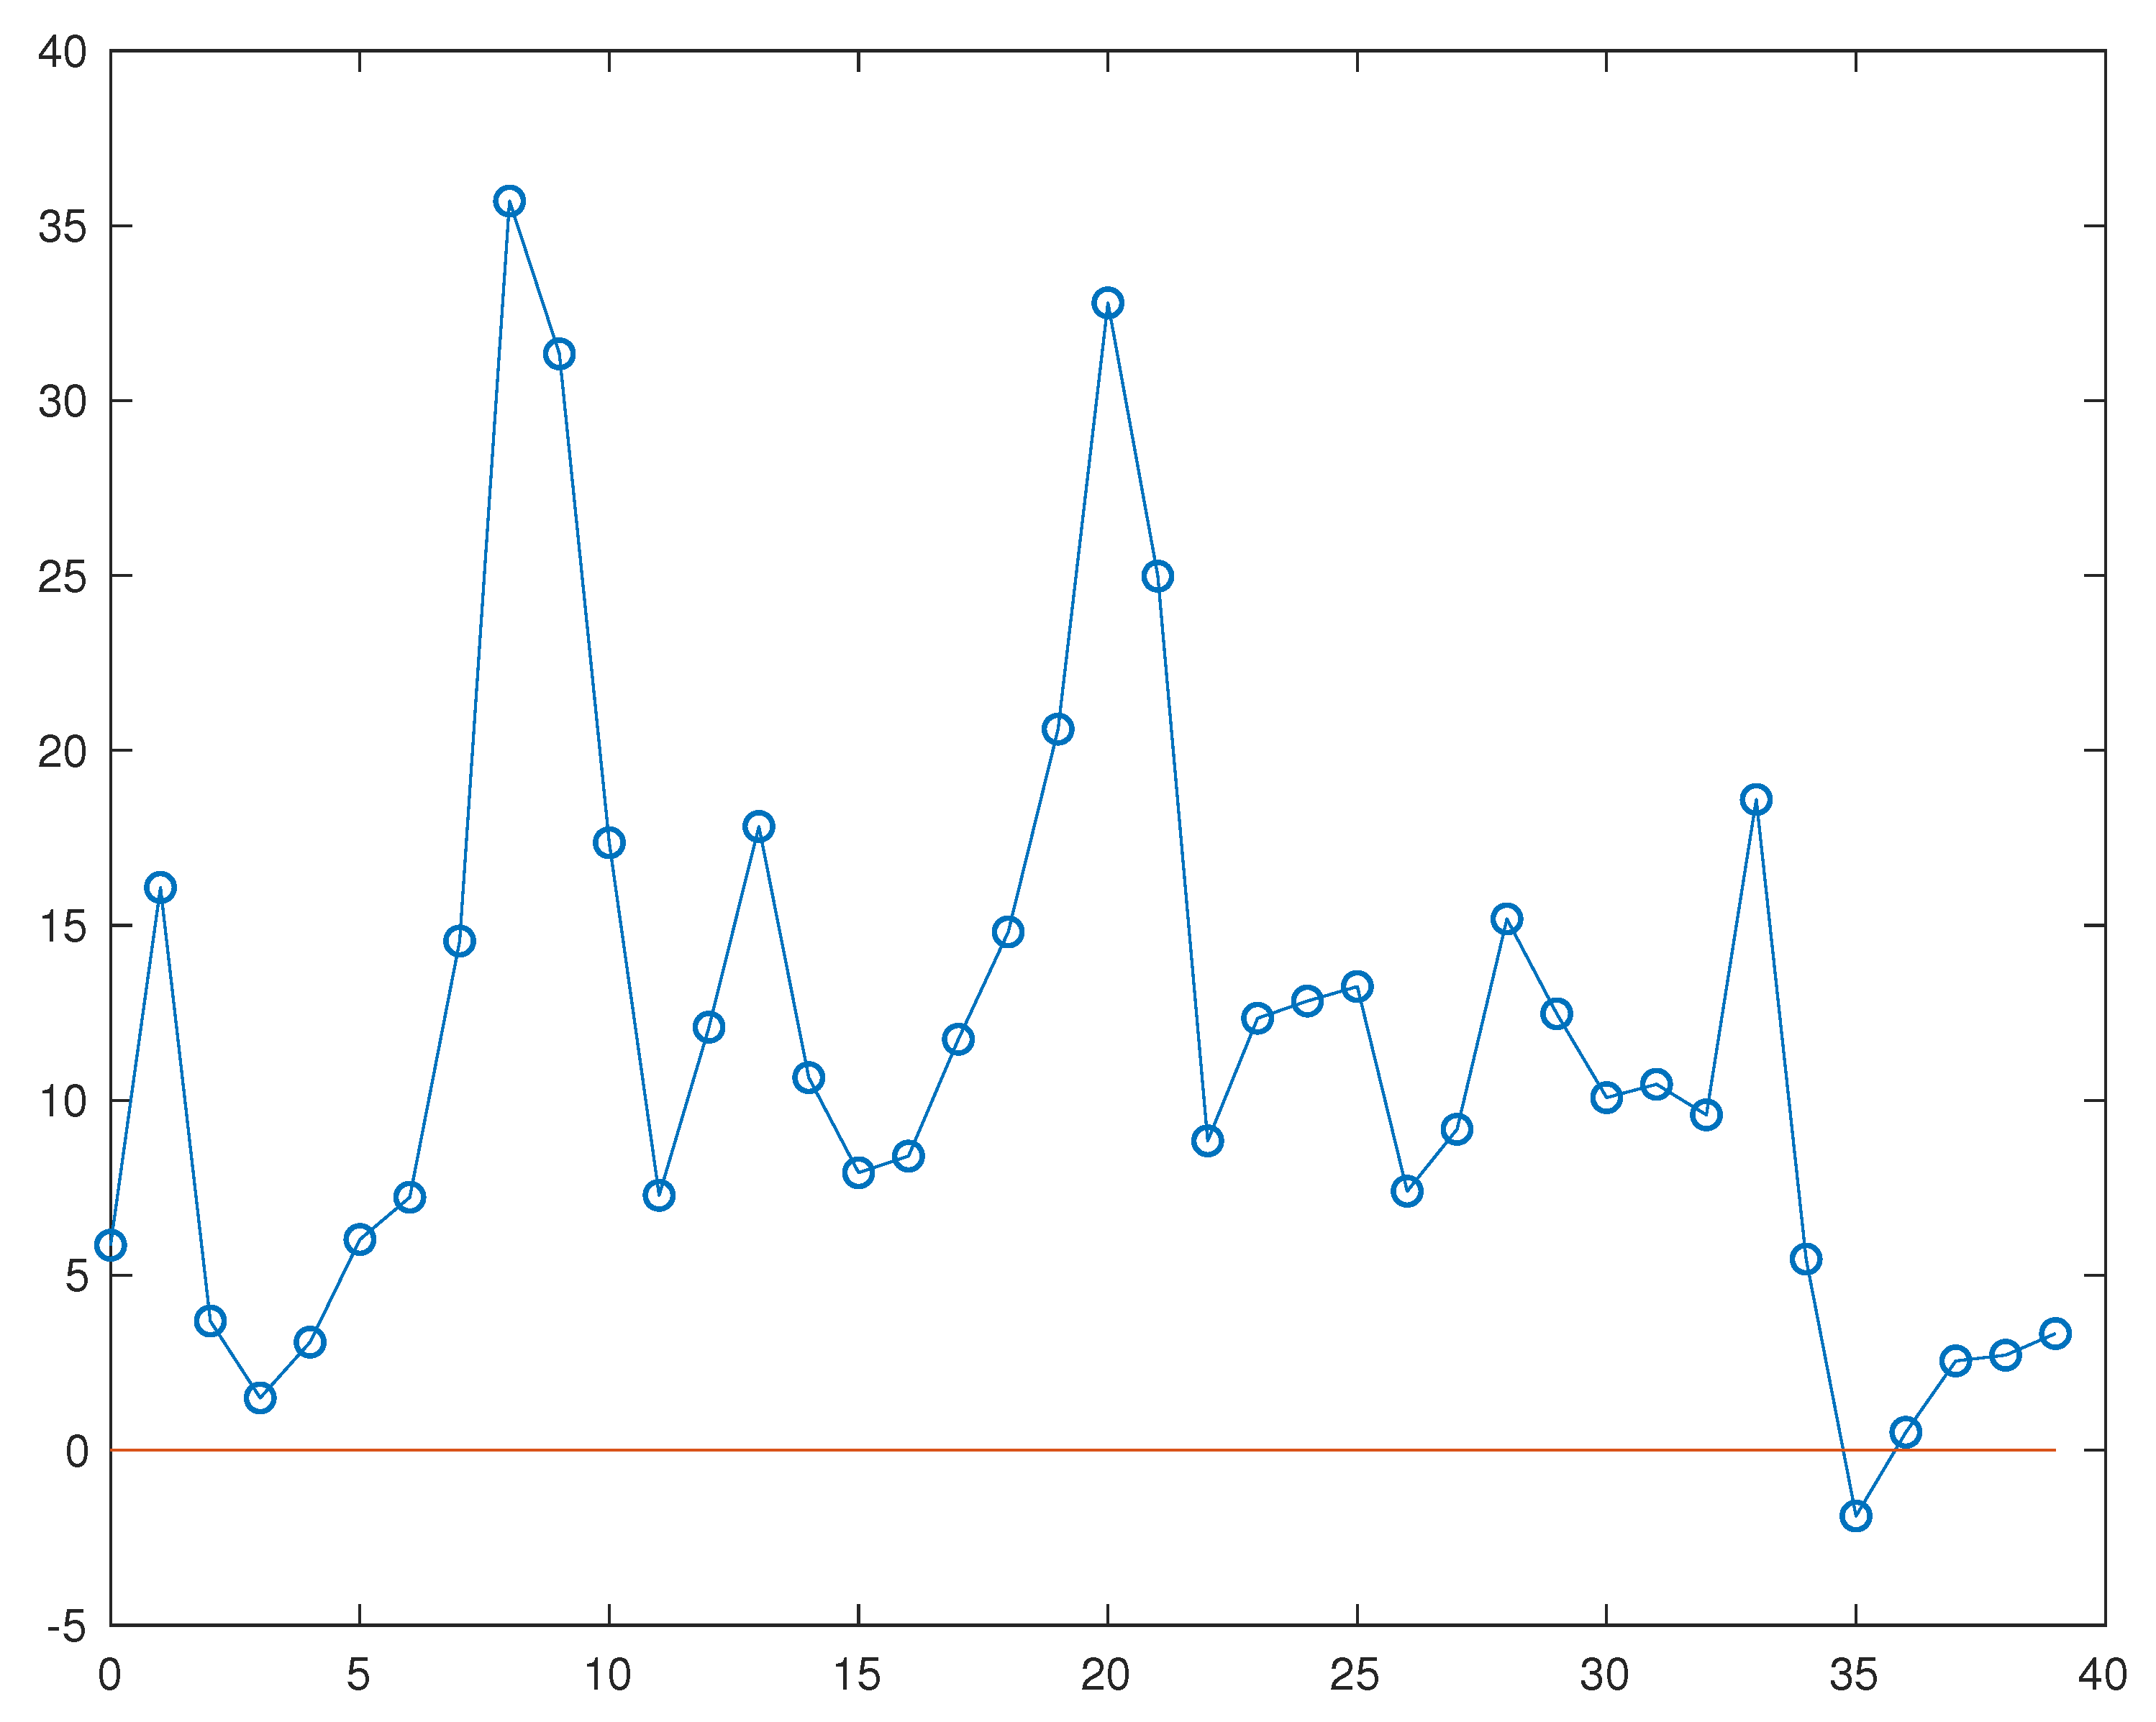
Figure 5.
Month-by-month correlation of EM and vaccination rates, for four different measures of the latter and using Eurostat EM data.
Figure 5.
Month-by-month correlation of EM and vaccination rates, for four different measures of the latter and using Eurostat EM data.
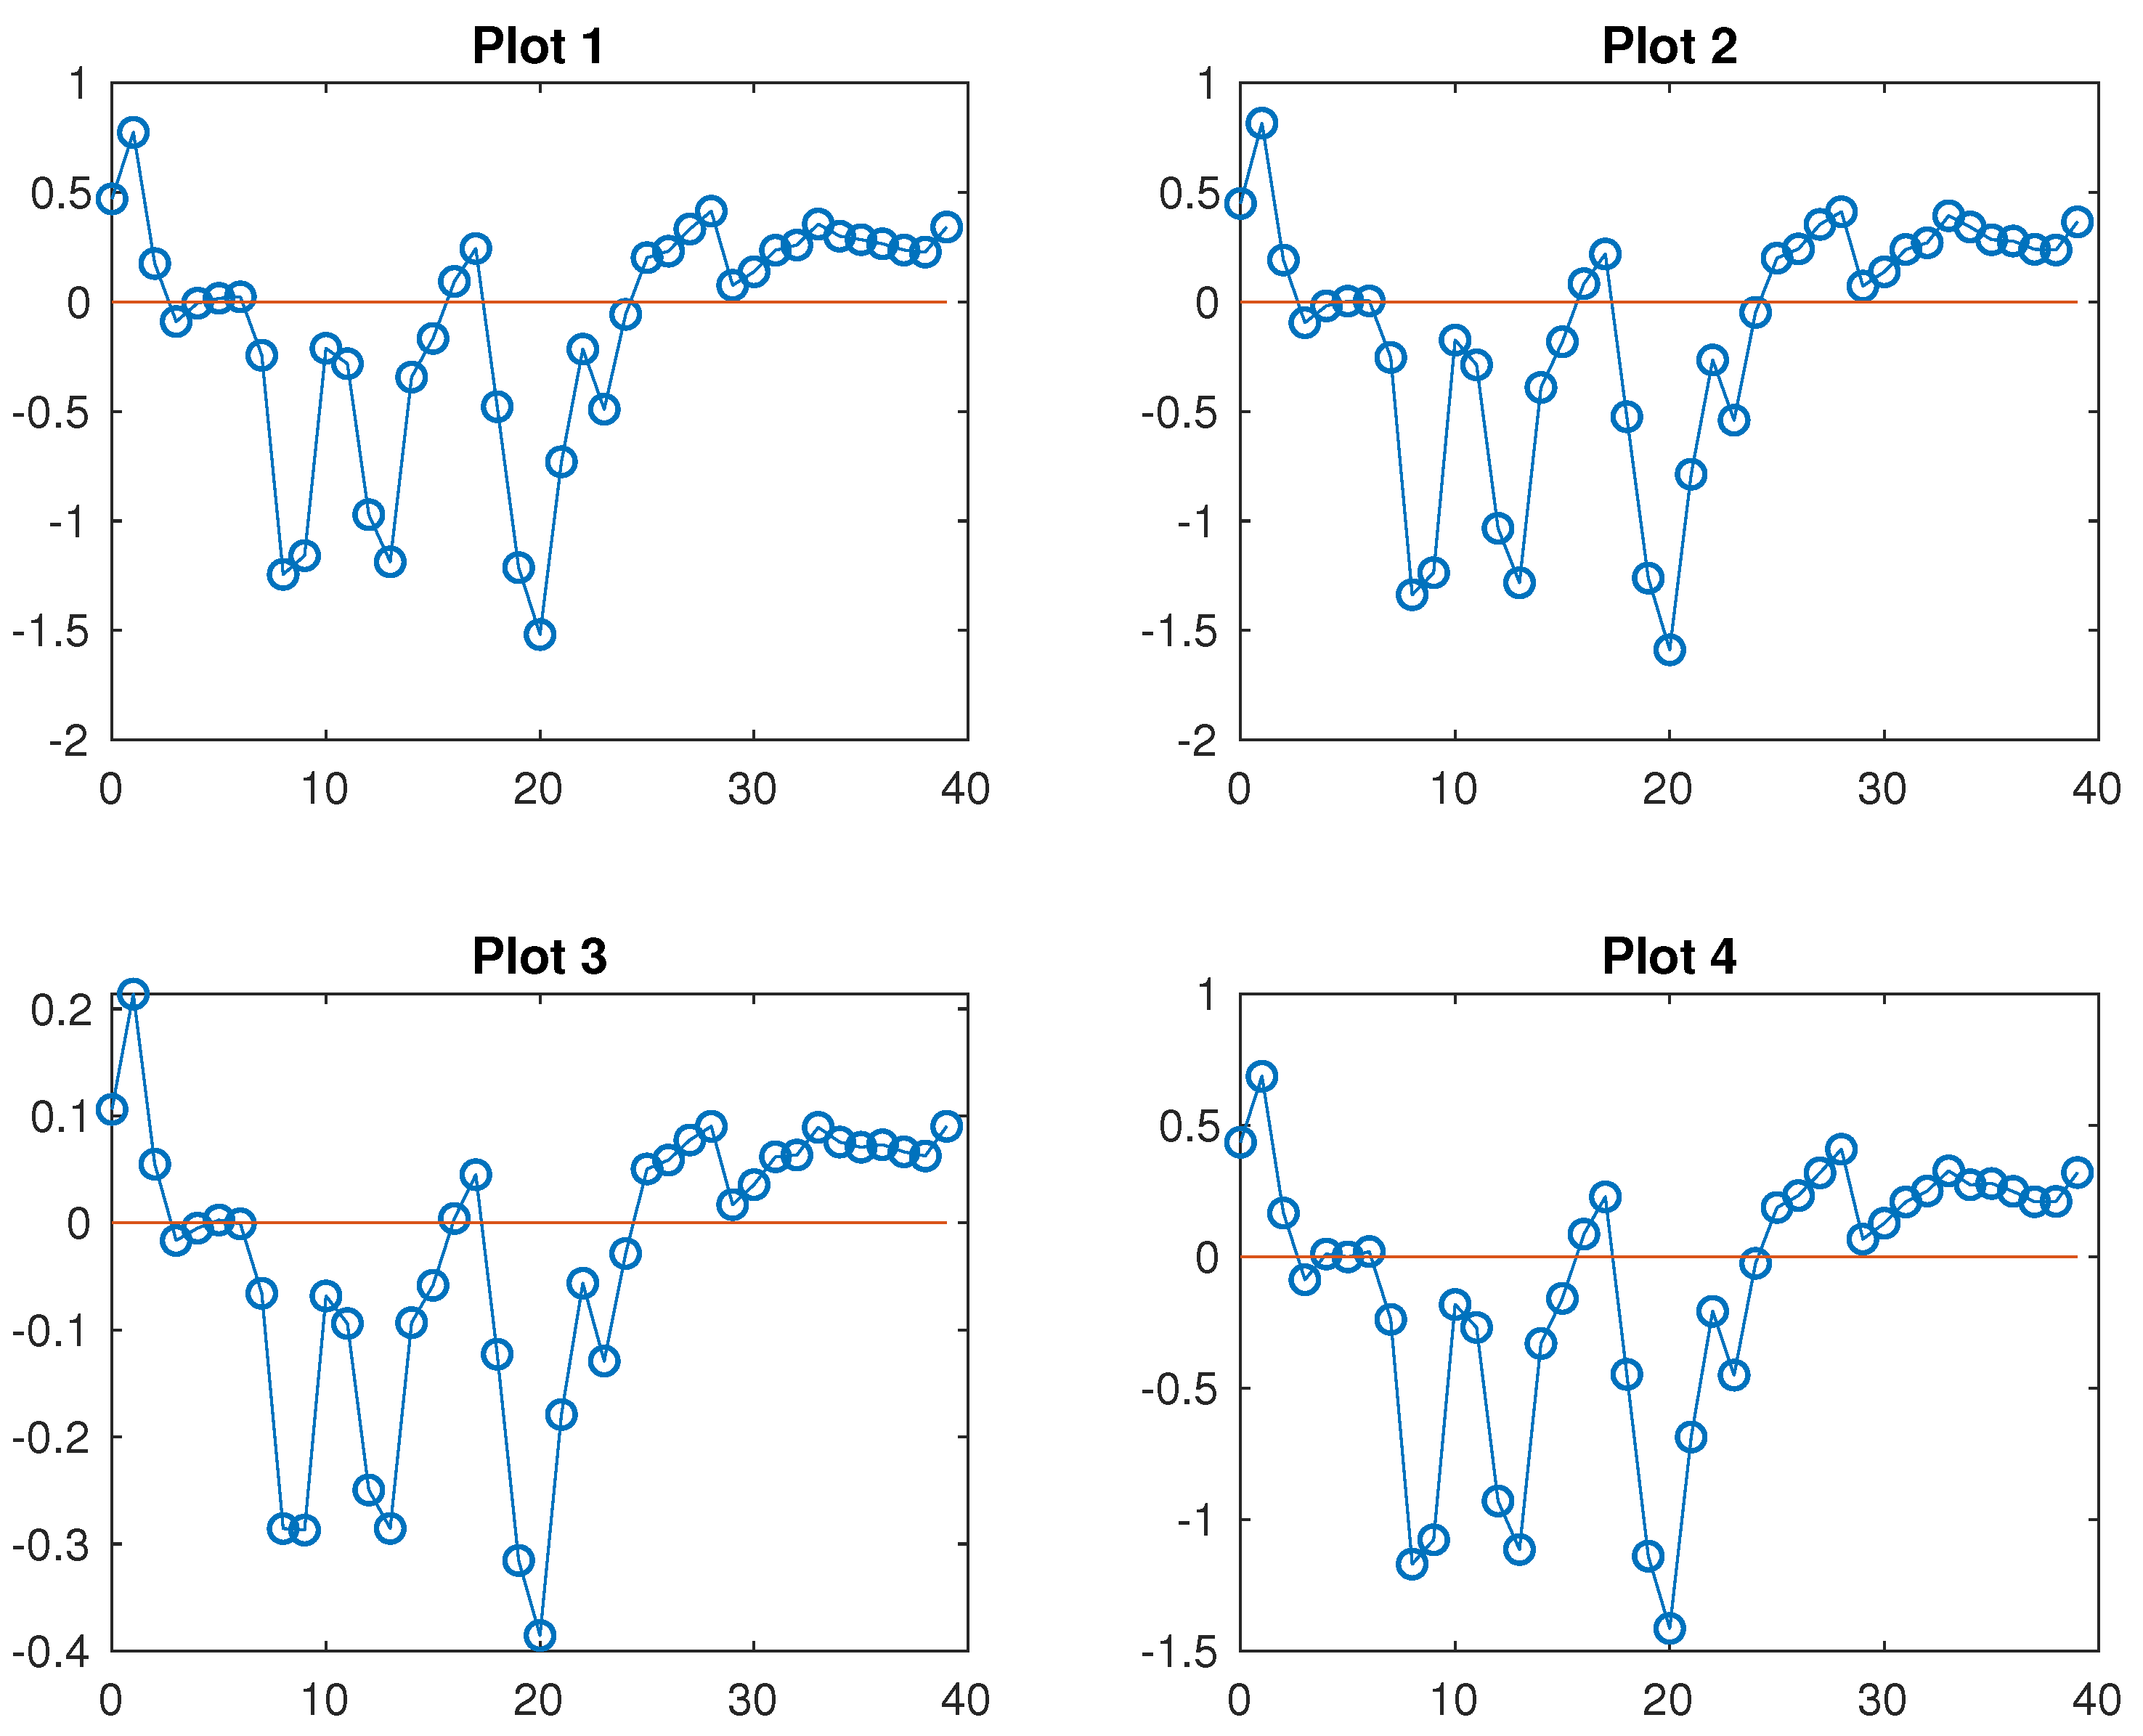
Figure 6.
Month-by-month correlation of EM and vaccination rates, for four different measures of the latter and using weekly Owid EM data. June 2023 is omitted since at the time of data extraction there was more data missing for that month than in the Eurostat data. Every country bar Sweden had data up to the week ending May 28. Sweden only had data up to the week ending April 16. We assigned to it an EM rate of zero for every subsequent week up to May 28, which introduces a miniscule error to all four figures.
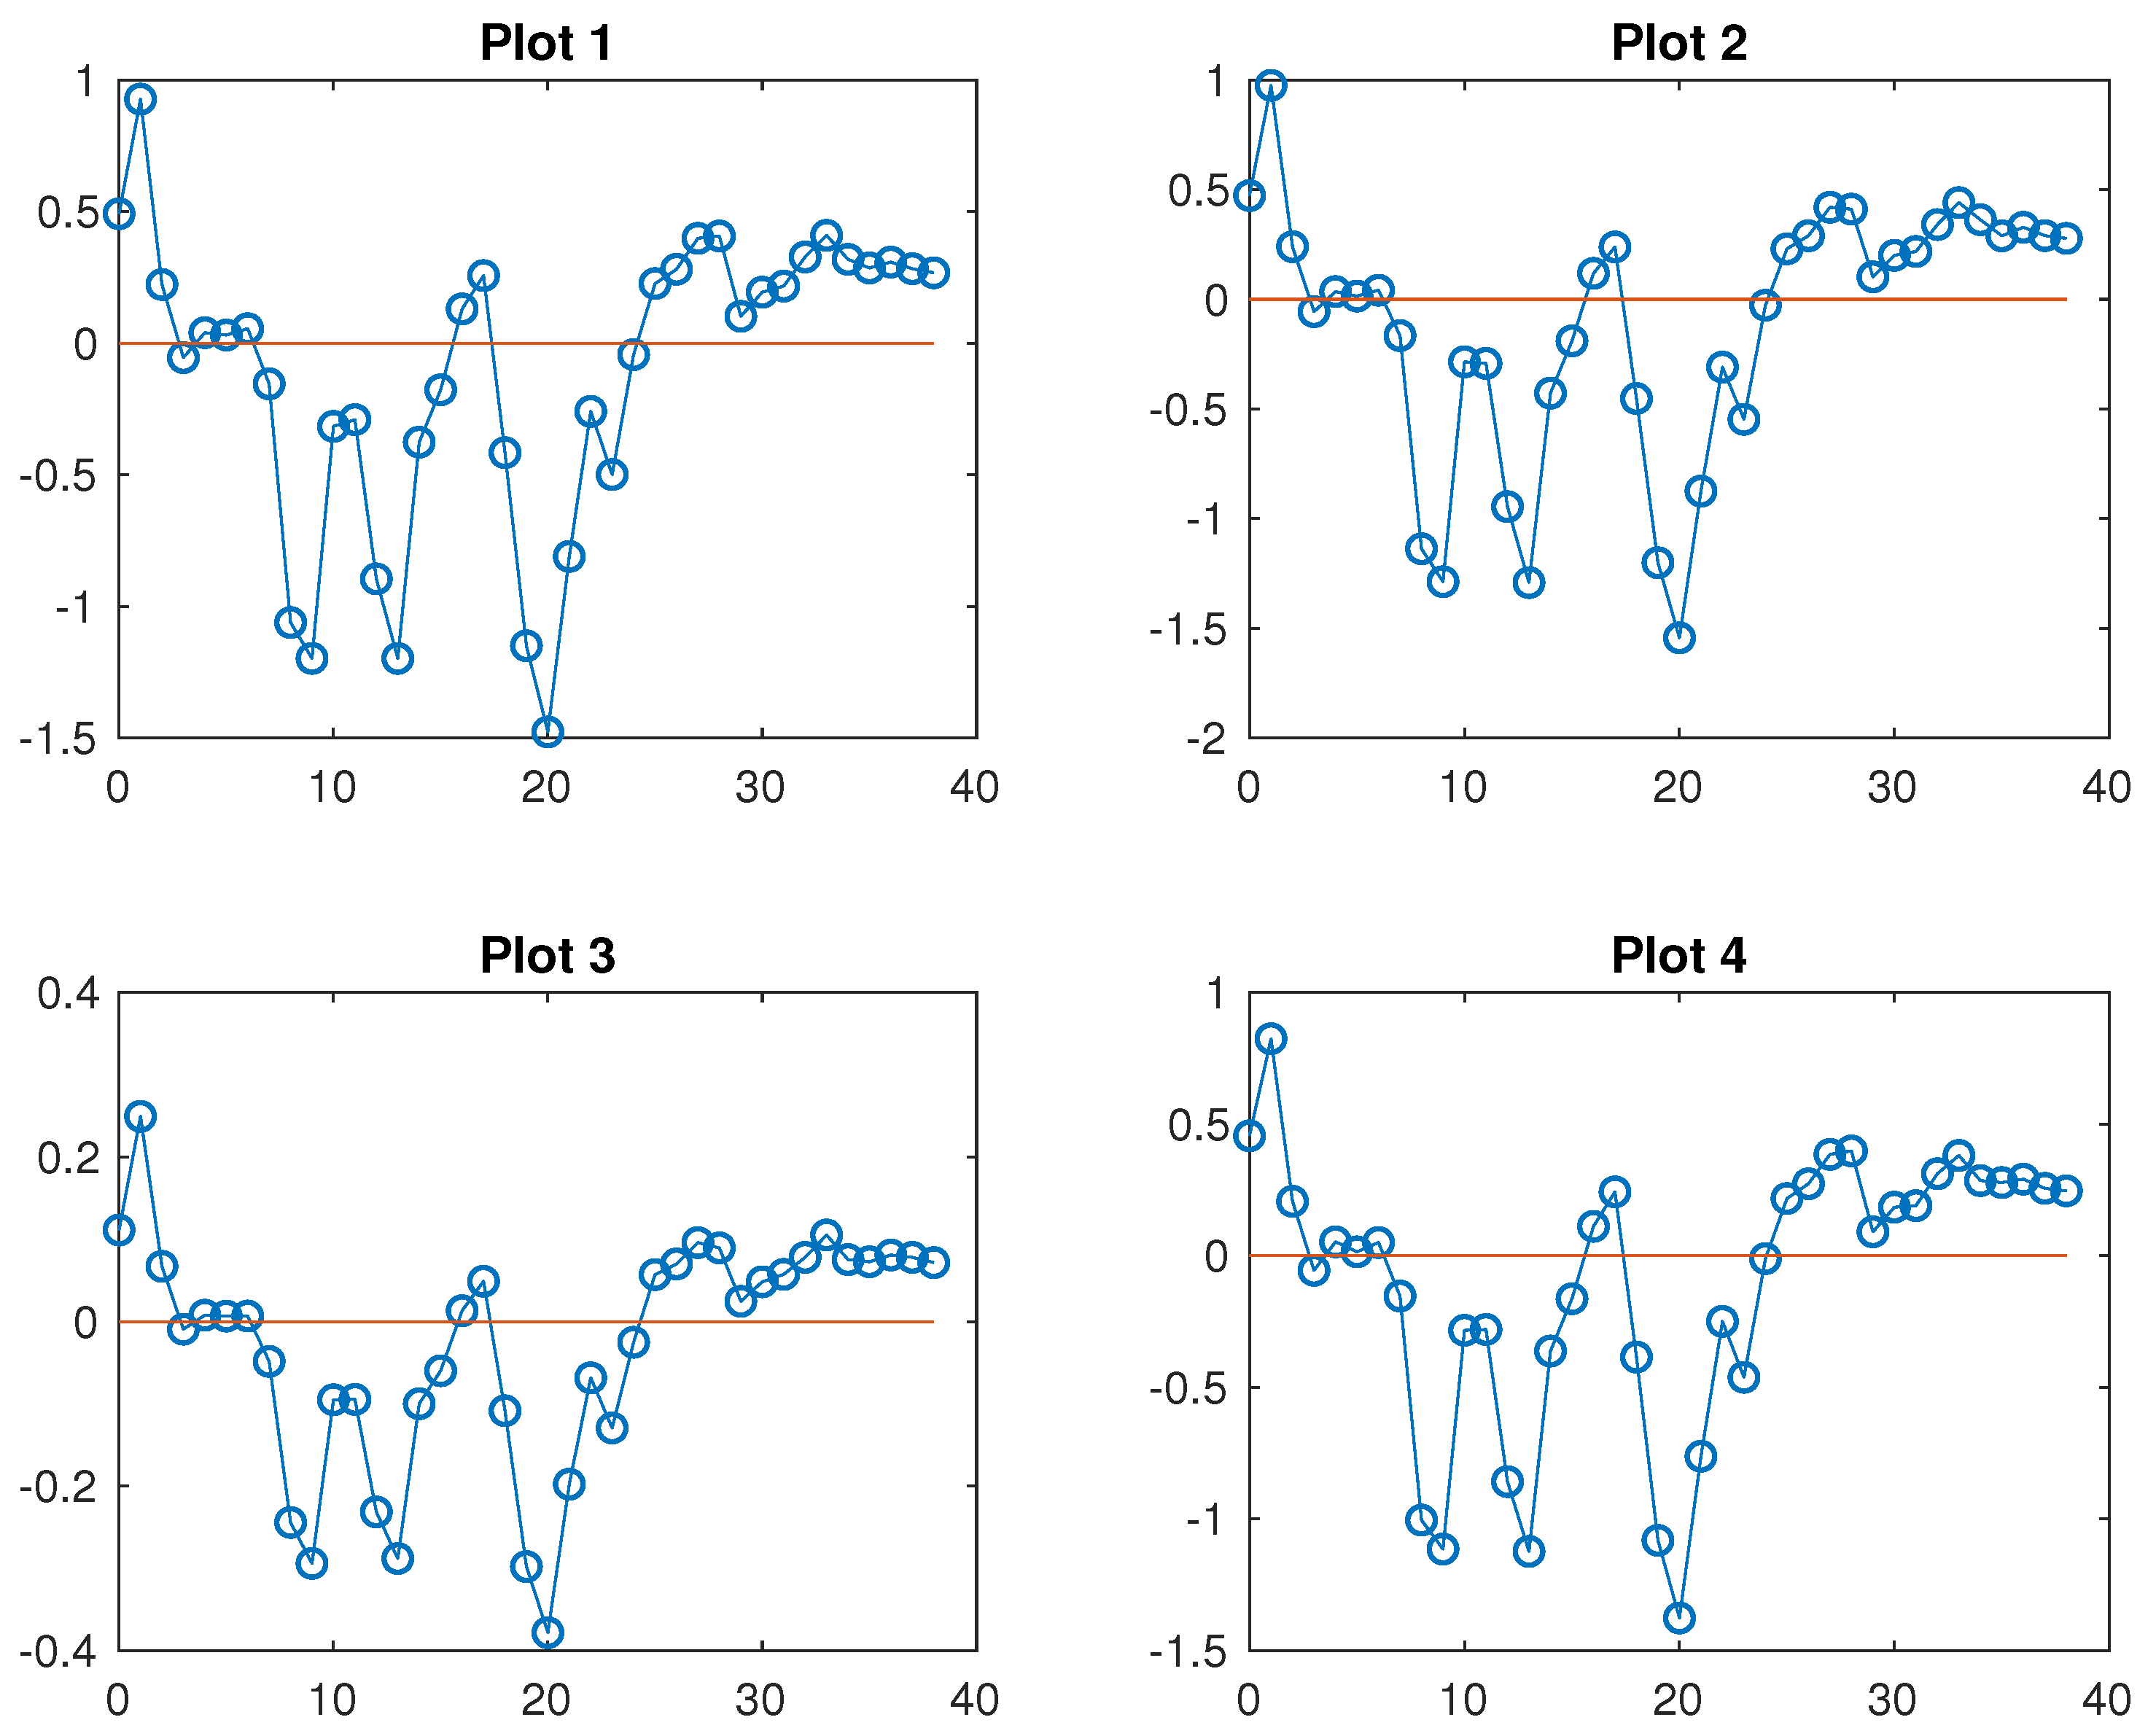
Figure 7.
Month-by-month correlation of EM and vaccination rates, for four different measures of the latter and using weekly Owid EM data. Raw EM rates have been adjusted based on a model of mortality trends extrapolated from the baseline. As before, June 2023 is omitted.
Figure 7.
Month-by-month correlation of EM and vaccination rates, for four different measures of the latter and using weekly Owid EM data. Raw EM rates have been adjusted based on a model of mortality trends extrapolated from the baseline. As before, June 2023 is omitted.
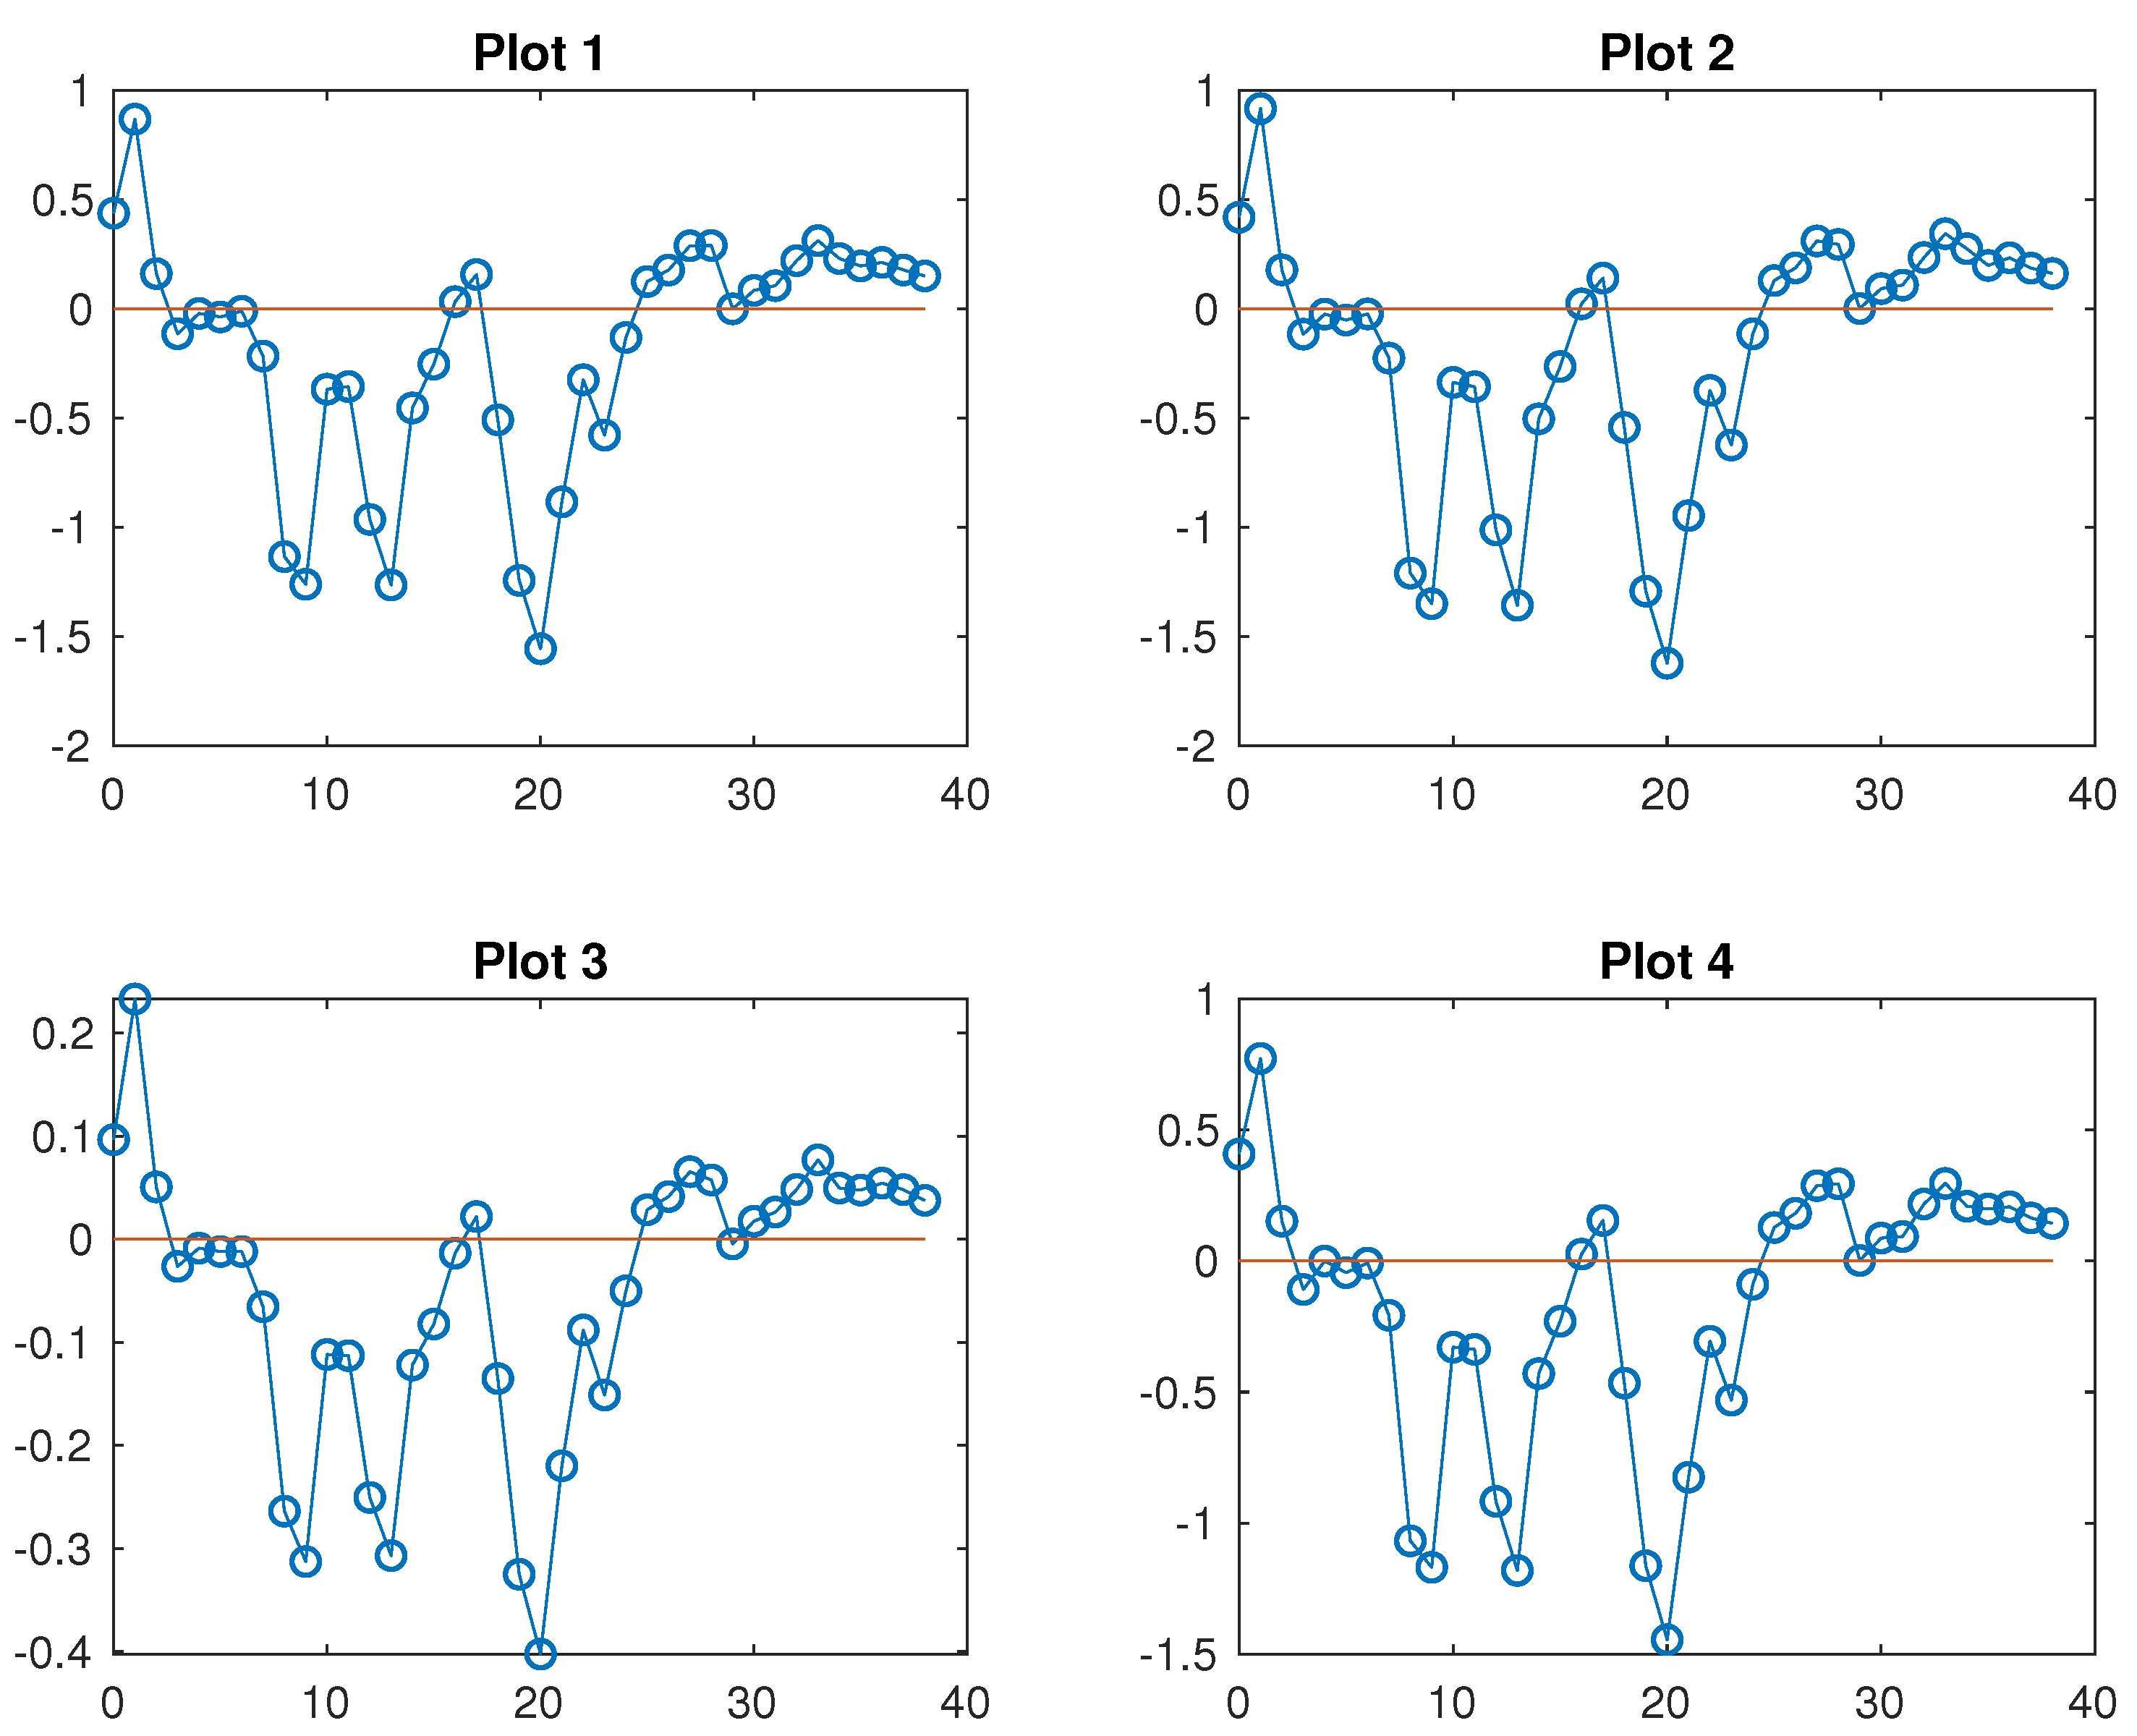
Figure 8.
The plot shows how (official) Covid mortality rates correlate with current rates of full vaccination for every month from March 2020 to June 2023. Sources: Worldometers (Covid data), Owid (vaccination data).
Figure 8.
The plot shows how (official) Covid mortality rates correlate with current rates of full vaccination for every month from March 2020 to June 2023. Sources: Worldometers (Covid data), Owid (vaccination data).
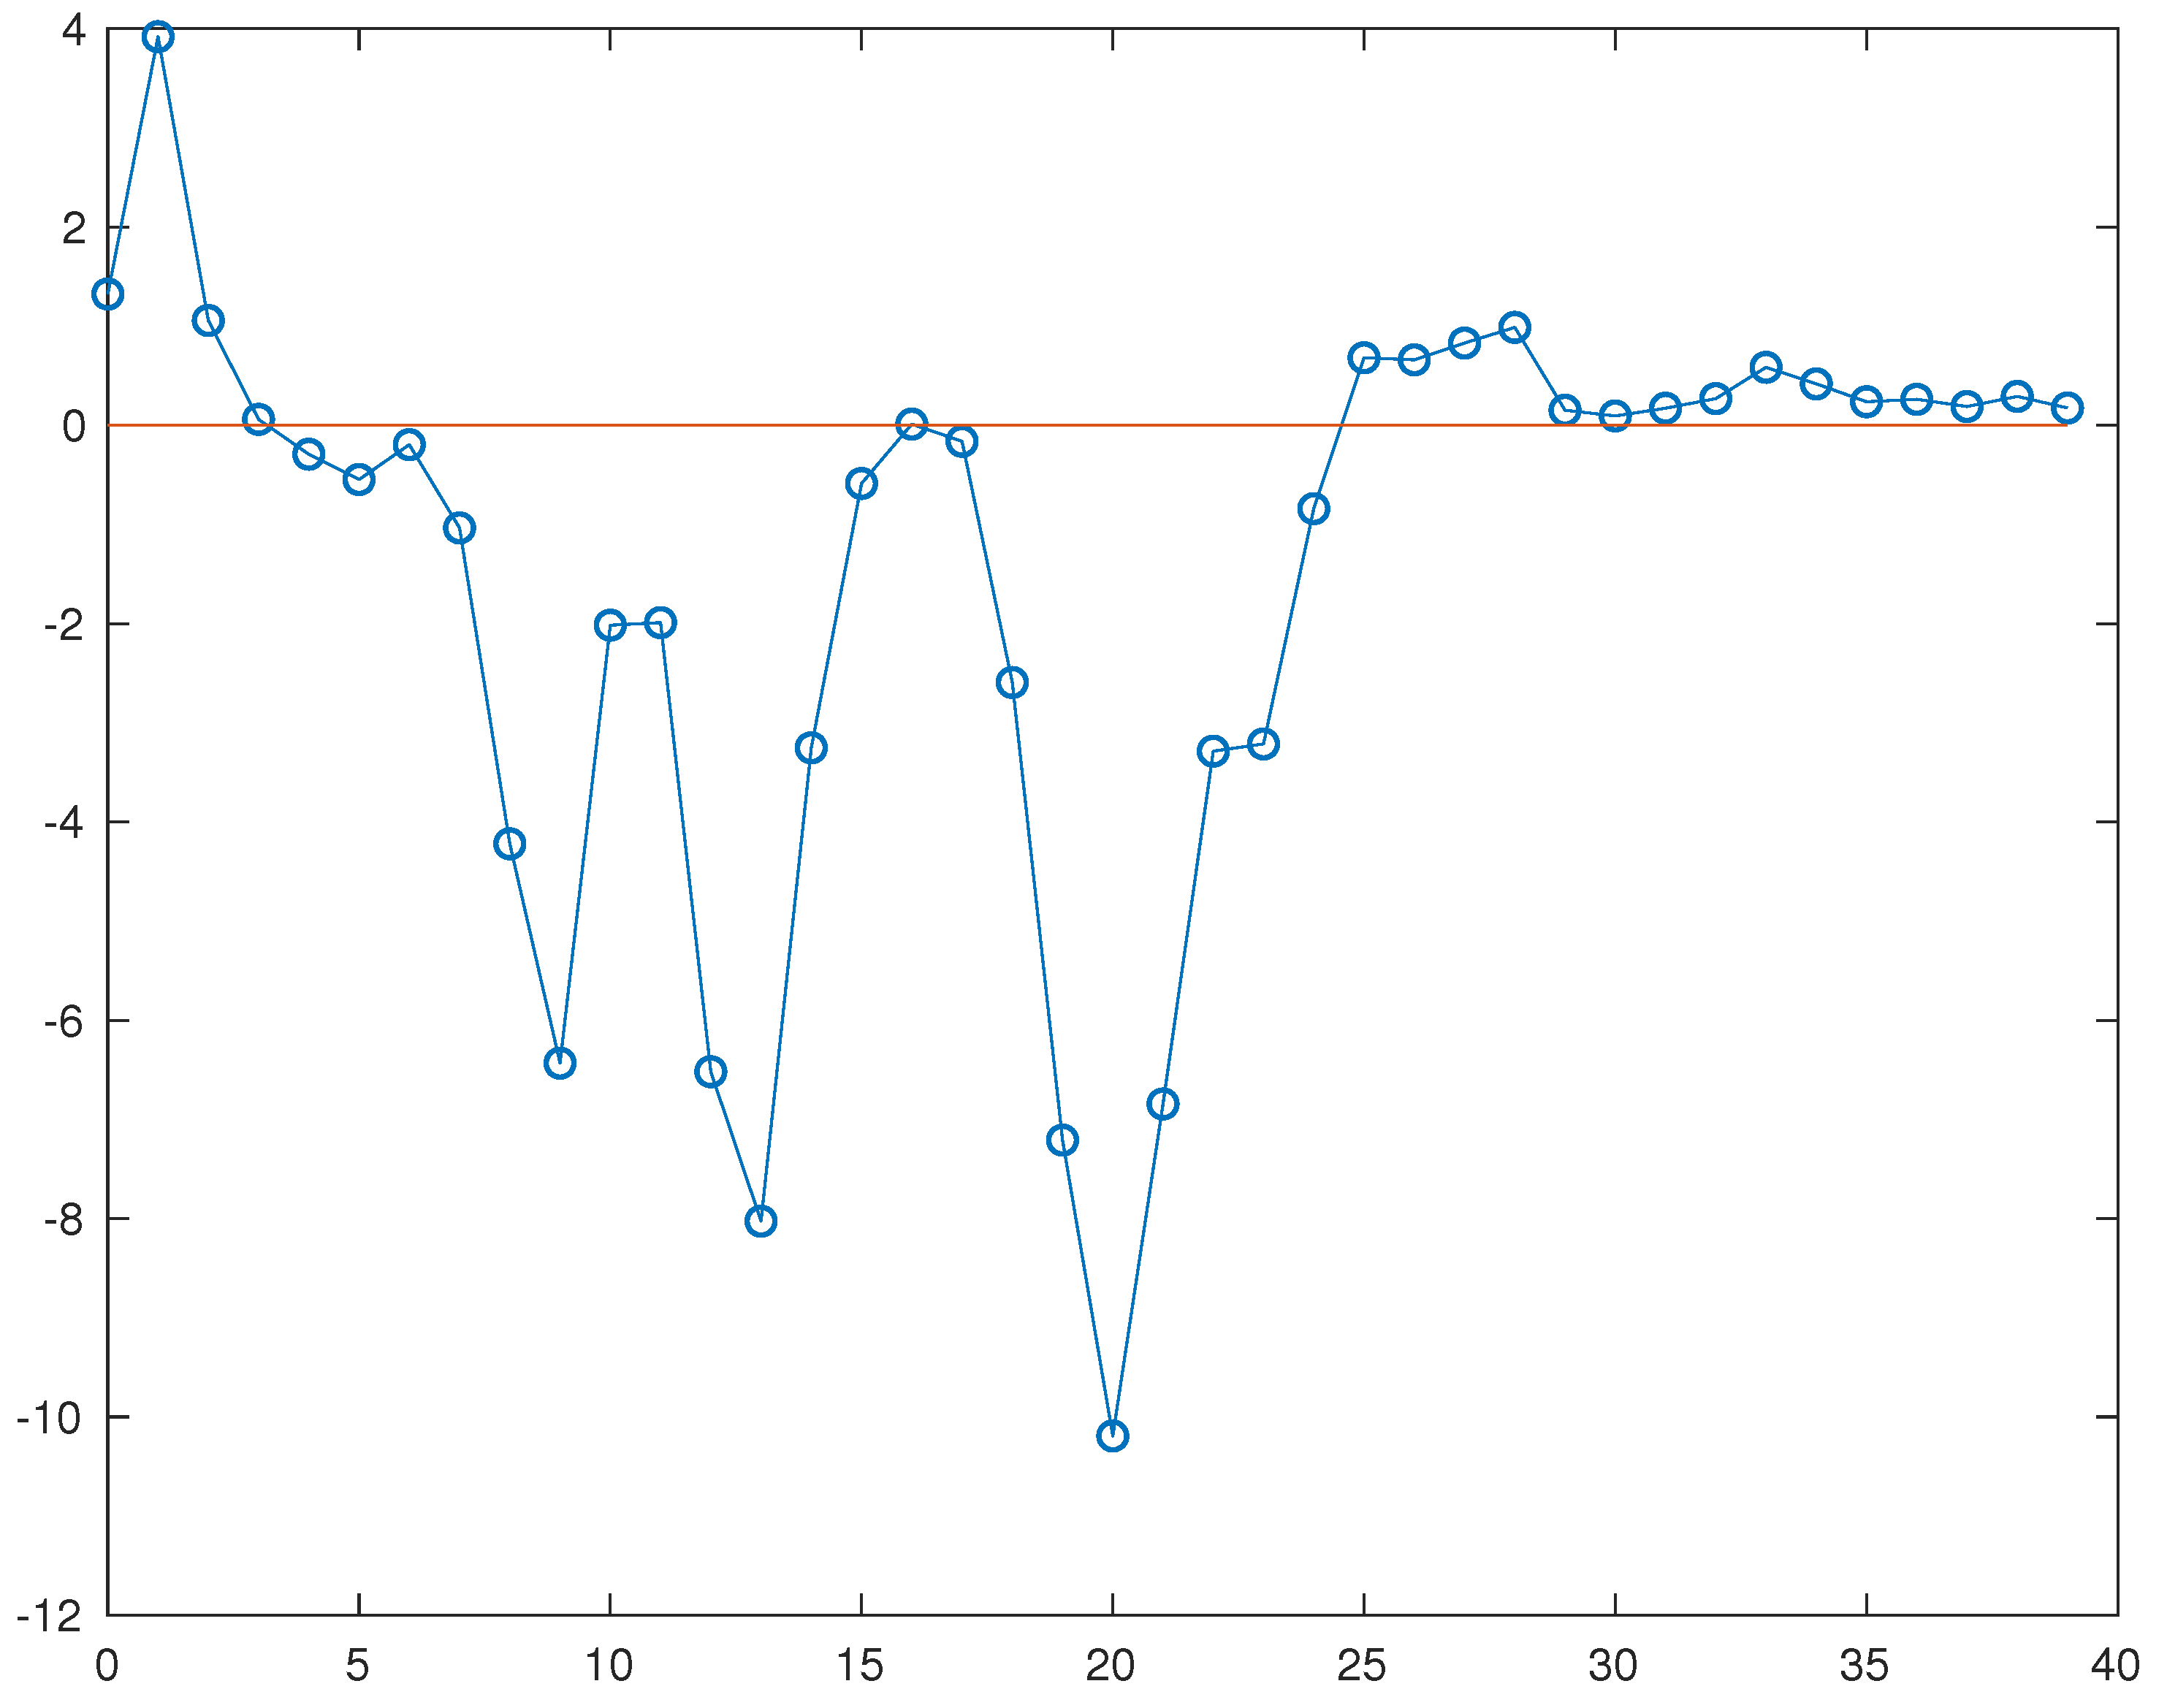
Table 1.
Most recently registered rates of full Covid vaccination, as a percentage of the population. Source: Owid. Data extracted 31/8/23.
Table 1.
Most recently registered rates of full Covid vaccination, as a percentage of the population. Source: Owid. Data extracted 31/8/23.
| Country | Country | ||||
|---|---|---|---|---|---|
| Malta | Cyprus | ||||
| Portugal | Sweden | ||||
| Spain | Latvia | ||||
| Italy | Lithuania | ||||
| Ireland | Netherlands | ||||
| Denmark | Czechia | ||||
| Belgium | Estonia | ||||
| Finland | Hungary | ||||
| France | Slovenia | ||||
| Iceland | Poland | ||||
| Germany | Croatia | ||||
| Austria | Slovakia | ||||
| Norway | Romania | ||||
| Greece | Bulgaria | ||||
| Average |
Table 2.
Excess mortality rates in June 2023, compared to 2016-2019 average. Source: Eurostat. Data extracted 31/8/23.
Table 2.
Excess mortality rates in June 2023, compared to 2016-2019 average. Source: Eurostat. Data extracted 31/8/23.
| Country | Country | Country | |||
|---|---|---|---|---|---|
| Finland | Portugal | Latvia | |||
| Netherlands | Belgium | Croatia | |||
| Ireland | Denmark | Hungary | |||
| Cyprus | France | Czechia | |||
| Slovenia | Sweden | Slovakia | |||
| Estonia | Italy | Lithuania | |||
| Austria | Spain | Bulgaria | |||
| Norway | Poland | Romania | |||
| Germany | Greece | Iceland | N/A | ||
| Malta |
Table 3.
Estimated average rates of excess mortality during the period March 2020-June 2023. For Iceland, as in Table 2 we used the same EM number for June 2023 as in May 2023. Source: Eurostat. Data extracted 31/8/23.
Table 3.
Estimated average rates of excess mortality during the period March 2020-June 2023. For Iceland, as in Table 2 we used the same EM number for June 2023 as in May 2023. Source: Eurostat. Data extracted 31/8/23.
| Country | Country | Country | |||
|---|---|---|---|---|---|
| Cyprus | Austria | France | |||
| Slovakia | Spain | Finland | |||
| Poland | Italy | Ireland | |||
| Bulgaria | Croatia | Latvia | |||
| Malta | Portugal | Iceland | |||
| Slovenia | Lithuania | Belgium | |||
| Czechia | Estonia | Denmark | |||
| Greece | Germany | Norway | |||
| Netherlands | Hungary | Sweden | |||
| Romania |
Table 4.
Average EM rates in the pre- and post-vaccine rollout periods. Source: Eurostat.
| Country | Country | ||||
|---|---|---|---|---|---|
| Austria | Ireland | ||||
| Belgium | Italy | ||||
| Bulgaria | Latvia | ||||
| Croatia | Lithuania | ||||
| Cyprus | Malta | ||||
| Czechia | Netherlands | ||||
| Denmark | Norway | ||||
| Estonia | Poland | ||||
| Finland | Portugal | ||||
| France | Romania | ||||
| Germany | Slovakia | ||||
| Greece | Slovenia | ||||
| Hungary | Spain | ||||
| Iceland | Sweden |
Table 5.
Estimated average EM rates in 2021 and 2022. Source: Eurostat.
| Country | Country | ||||
|---|---|---|---|---|---|
| 2021 | 2022 | 2021 | 2022 | ||
| Austria | Ireland | ||||
| Belgium | Italy | ||||
| Bulgaria | Latvia | ||||
| Croatia | Lithuania | ||||
| Cyprus | Malta | ||||
| Czechia | Netherlands | ||||
| Denmark | Norway | ||||
| Estonia | Poland | ||||
| Finland | Portugal | ||||
| France | Romania | ||||
| Germany | Slovakia | ||||
| Greece | Slovenia | ||||
| Hungary | Spain | ||||
| Iceland | Sweden |
Table 6.
Rates of full vaccination in the early months of the Covid vaccine rollout. Source: Owid. Data extracted 27/8/23.
Table 6.
Rates of full vaccination in the early months of the Covid vaccine rollout. Source: Owid. Data extracted 27/8/23.
| Country | Country | Country | Country | ||||
|---|---|---|---|---|---|---|---|
| Denmark | Malta | Malta | Malta | ||||
| Iceland | Iceland | Hungary | Hungary | ||||
| Slovenia | Slovakia | Iceland | Lithuania | ||||
| Italy | Norway | Lithuania | Estonia | ||||
| Ireland | Romania | Greece | Italy | ||||
| Estonia | Greece | Denmark | Spain | ||||
| Portugal | Ireland | Spain | Slovakia | ||||
| Lithuania | Poland | Austria | Denmark | ||||
| Spain | Belgium | Italy | Slovenia | ||||
| Malta | Austria | Norway | Austria | ||||
| Germany | Estonia | Slovenia | Romania | ||||
| Cyprus | Lithuania | Ireland | France | ||||
| Hungary | Denmark | Romania | Iceland | ||||
| Croatia | Cyprus | Estonia | Czechia | ||||
| Slovakia | Portugal | Portugal | Ireland | ||||
| Romania | Spain | Poland | Greece | ||||
| Austria | Germany | Germany | Portugal | ||||
| Poland | Slovenia | Cyprus | Germany | ||||
| Greece | Hungary | Czechia | Cyprus | ||||
| Norway | France | Slovakia | Belgium | ||||
| Czechia | Sweden | Belgium | Poland | ||||
| Latvia | Italy | Sweden | Norway | ||||
| Finland | Czechia | France | Netherlands | ||||
| Belgium | Netherlands | Netherlands | Sweden | ||||
| Sweden | Finland | Croatia | Croatia | ||||
| Netherlands | Croatia | Finland | Bulgaria | ||||
| Bulgaria | Latvia | Bulgaria | Finland | ||||
| France | Bulgaria | Latvia | Latvia | ||||
| Average | Average | Average | Average |
Table 8.
Correlation of EM and vaccination rates in the pre- and post-rollout periods, for four different measures of the vaccination rate and using Eurostat EM data.
Table 8.
Correlation of EM and vaccination rates in the pre- and post-rollout periods, for four different measures of the vaccination rate and using Eurostat EM data.
| Measure | ||||
|---|---|---|---|---|
| M1 | ||||
| M2 | ||||
| M3 | ||||
| M4 |
Table 9.
Correlation of EM and vaccination rates in the pre- and post-rollout periods, for four different measures of the vaccination rates and using weekly Owid EM data. June 2023 is omitted.
Table 9.
Correlation of EM and vaccination rates in the pre- and post-rollout periods, for four different measures of the vaccination rates and using weekly Owid EM data. June 2023 is omitted.
| Measure | ||||
|---|---|---|---|---|
| M1 | ||||
| M2 | ||||
| M3 | ||||
| M4 |
Table 10.
Correlation of EM and vaccination rates in the pre- and post-rollout periods, for four different measures of the vaccination rates and using weekly Owid EM data. Raw EM rates have been adjusted based on a model of mortality trends extrapolated from the baseline. As before, June 2023 is omitted.
| Measure | ||||
|---|---|---|---|---|
| M1 | ||||
| M2 | ||||
| M3 | ||||
| M4 |
Table 11.
Average EM rates during the period March 2020 - May 2023, using Owid data and modelled mortality trends.
Table 11.
Average EM rates during the period March 2020 - May 2023, using Owid data and modelled mortality trends.
| Country | Country | Country | |||
|---|---|---|---|---|---|
| Lithuania | Hungary | Ireland | |||
| Bulgaria | Austria | Finland | |||
| Slovakia | Greece | Germany | |||
| Croatia | Cyprus | Iceland | |||
| Romania | Netherlands | France | |||
| Italy | Estonia | Sweden | |||
| Czechia | Slovenia | Malta | |||
| Poland | Belgium | Norway | |||
| Latvia | Portugal | Denmark | |||
| Spain |
Table 12.
Average EM rates in the pre- and post-vaccine rollout periods, using Owid data and modelled mortality trends.
Table 12.
Average EM rates in the pre- and post-vaccine rollout periods, using Owid data and modelled mortality trends.
| Country | Country | ||||
|---|---|---|---|---|---|
| Austria | Ireland | ||||
| Belgium | Italy | ||||
| Bulgaria | Latvia | ||||
| Croatia | Lithuania | ||||
| Cyprus | Malta | ||||
| Czechia | Netherlands | ||||
| Denmark | Norway | ||||
| Estonia | Poland | ||||
| Finland | Portugal | ||||
| France | Romania | ||||
| Germany | Slovakia | ||||
| Greece | Slovenia | ||||
| Hungary | Spain | ||||
| Iceland | Sweden |
Table 13.
Average EM rates in 2021 and 2022, using Owid data and modelled mortality trends.
| Country | Country | ||||
|---|---|---|---|---|---|
| 2021 | 2022 | 2021 | 2022 | ||
| Austria | Ireland | ||||
| Belgium | Italy | ||||
| Bulgaria | Latvia | ||||
| Croatia | Lithuania | ||||
| Cyprus | Malta | ||||
| Czechia | Netherlands | ||||
| Denmark | Norway | ||||
| Estonia | Poland | ||||
| Finland | Portugal | ||||
| France | Romania | ||||
| Germany | Slovakia | ||||
| Greece | Slovenia | ||||
| Hungary | Spain | ||||
| Iceland | Sweden |
Disclaimer/Publisher’s Note: The statements, opinions and data contained in all publications are solely those of the individual author(s) and contributor(s) and not of MDPI and/or the editor(s). MDPI and/or the editor(s) disclaim responsibility for any injury to people or property resulting from any ideas, methods, instructions or products referred to in the content. |
© 2023 by the authors. Licensee MDPI, Basel, Switzerland. This article is an open access article distributed under the terms and conditions of the Creative Commons Attribution (CC BY) license (http://creativecommons.org/licenses/by/4.0/).
Copyright: This open access article is published under a Creative Commons CC BY 4.0 license, which permit the free download, distribution, and reuse, provided that the author and preprint are cited in any reuse.


