Preprint
Article

Multidimensional Valuation and Spatial Differentiation of Cultivated Land Resources at the County Scale: A Case Study of Guangxi, China

Altmetrics

Downloads

76

Views

19

Comments

0

A peer-reviewed article of this preprint also exists.

This version is not peer-reviewed

Submitted:

05 September 2023

Posted:

07 September 2023

You are already at the latest version

Alerts
Abstract
Revealing the multidimensional value of cultivated land resources, improving calculation methods, and exploring their spatial distribution characteristics and influencing factors are crucial for the enhancement of natural resource accounting system and the protection of cultivated land resources. This study take Guangxi, China as an example and construct a comprehensive multidimensional value evaluation system for cultivated land resources at the county scale. The income capitalization method, substitution market method, and value equivalent correction method were applied to calculate the economic, social, and ecological values of cultivated land resources in 111 counties. Furthermore, spatial autocorrelation analysis was employed to study their distribution characteristics and influencing factors. The results show that: (1) The total value of cultivated land resources in Guangxi reach 19,729.2 billion yuan, and the average cultivated land value is 5.3511 million yuan/hm2, of which the ratio of economic, social and ecological values is about 6:1:2; (2) The value of cultivated land has a certain distribution pattern in the global space, and the average economic and social value show the spatial distribution patterns of "low in the west and high in the east" and "low in the northwest and high in the southeast" respectively."(3) There is a significant spatial clustering effect of all values of cultivated land resources in local space, with "high-high" and "low-low" clustering. (4) Economic development level is significantly negatively correlated with the ecological value of cultivated land, while has a significant positive correlation with social value; (5) Natural conditions, economic development and agricultural development approaches are the key factors affecting the value of cultivated land resources.
Keywords: 
Subject: Environmental and Earth Sciences  -   Geography

1. Introduction

In April 2021, the General Office of the CPC Central Committee and the State Council issued the document "Opinions on Establishing a Sound Mechanism for Realizing the Value of Ecological Products", which institutionalized the "value transformation of ecological products" for the first time. It is clearly required that the value evaluation system of ecological products be established in administrative units and incorporated into the national economic accounting system. In addition, the assessment of the value of cultivated land is the basis for the formulation of cultivated land compensation standards. Therefore, a scientific and comprehensive assessment of the multidimensional value of cultivated land is important for the compilation of natural resource balance sheets and the improvement of cultivated land compensation mechanisms. However, the value of cultivated land is multidimensional and can be divided into use value and non-use value, market value and non-market value, economic value, social value and ecological value from different perspectives [1], leading to great difficulties in the full accounting for the value of cultivated land resources.
Foreign research on the market value of cultivated land began with the exploration of the theory of agricultural land rent [2]. After the 20th century, the soil production potential method, the income method, the market method and the cost method were formed. Later, influenced by the idea of sustainable development, scholars began to pay attention to the non-market value of cultivated land and formed the value assessment methods that reveal preferences (such as the cost analysis method and the travel cost method) and state preferences (such as the conditional value method, joint analysis method) [3]. With the issue of the World Natural Resources Conservation Outline in 1980 and the establishment of the International Association for Ecological Economics, the value of cultivated land ecosystem services became the focus of research by foreign scholars, and three more mature methods were formed: the equivalent factor method, the alternative market method, and the conditional value assessment method, among which the most widely accepted is the equivalent factor method of ecosystem service value proposed by Costanza [4]. Chinese scholars have also conducted abundant studies on the value of cultivated land resources. For example, Huang Xianjin [5] derived the correction coefficients and unit prices for the economic value of cultivated land in different agricultural regions in China. Yu & Cai [6] systematically elaborated on the connotation of cultivated land value, and Xie Gaodi[7] formulated a table of ecosystem service value for mainland China. The main accounting methods for economic value include the income capitalization method, market comparison method, cost approximation method [8], residual method, scoring valuation method, and benchmark plot method [9], among which the income capitalization method is the most used and mature one, and was first used for the valuation of cultivated land zoning in China [10]. The mainstream accounting method of social value is the alternative market method [11], which takes the social function of cultivated land as the starting point and then selects similar indicators to replace it. For example, some scholars used it to assess the total social value of cultivated land resources in Shenyang as 1127.5 billion yuan [12], some scholars assessed the social stability value of cultivated land resources in China by calculating the cultivated land occupation tax and reclamation fee [11]. In general, the ecological value accounting of cultivated land has developed into shadow engineering method [13], value equivalent correction method [14], conditional value assessment method or willingness survey assessment method[15], energy value analysis method[16], equivalent factor method [17] and alternative market method. For example, some scholars have used shadow engineering method, opportunity cost method and alternative cost method to construct different functional assessment models to evaluate the ecological value of cultivated land in Beijing [13]; some scholars used the equivalent factor method to measure the ecological value of cultivated land in the Yangtze River economic belt region [17]. Scholars in China generally modified the national ecosystem value scale formulated by Xie Gaodi [7] to obtain the ecological value of cultivated land in the study area.
In summary, scholars at home and abroad have done a lot of research on the connotation, composition, and accounting methods of cultivated land values. However, most of the current studies on the value of cultivated land resources have focused on the provincial and municipal levels, with relatively little emphasis on the county level, because the difficulty of getting data required increase rapidly as the scale of the study shrinks. Furthermore, there is a lack of exploration of the heterogeneity of spatial distribution and influencing factors of value. These factors have created numerous obstacles to the construction of an ecological product value evaluation system of administrative regional units, and ruined the efforts of county governments to protect cultivated land in China. Therefore, taking Guangxi as an example, this paper carried out a multi-dimensional value assessment of county cultivated land resources, conducted global and local spatial autocorrelation analysis by ArcGIS and Geoda to reveal the distribution characteristics and its influencing factors of county cultivated land, so as to provide an objective reference for establishing an ecological product value accounting system and improving the compensation mechanism for cultivated land protection in China.

2. Study area overview and data sources

2.1. Study area overview

Guangxi is located in the southern of China, which governs 14 prefecture-level cities, containing a total of 111 counties with a area of 23.76×10⁴ km2. Guangxi is predominantly characterized by a subtropical monsoon climate, with the terrain generally higher in the northwest and lower in the southeast. The topography mainly comprises mountains and hills, with fewer plains. By the end of 2020, Guangxi has a permanent resident population of 50.13 million, reginal GDP of 2215.669 billion yuan, and cultivated land area of 330.76×10⁴hm2. Approximately 70% of cultivated land is distributed in the plains, plateaus, and hilly areas of the eastern and southeastern regions, mainly paddy fields. In the mountainous dis of western and northwest Guangxi, especially in karst areas, cultivated land is scattered in valleys and mostly rain-fed. The main soil type of Guangxi's cultivated land is red soil, which is relatively infertile due to low content of organic matter and mineral element, with fewer high-quality soils [18]. The grain yield per unit area is approximately 10% lower than the national average [19].

2.2. Data sources

The basic data required for this study, including the disposable income of rural and urban residents in each county, the added value of the primary industry, the income composition of rural residents, per capita consumption expenditure and food expenditure of rural residents, the annual resident population, and the cultivated land area of each county are mainly acquired from the "Guangxi Statistical Yearbook 2021". The output value of agriculture, forestry, animal husbandry, and fishery, as well as the source of agricultural output value, are derived from the 2020 government work reports of each county. The data on grain production in the past five years are from the "Guangxi Statistical Yearbook" (2017-2021). The land fertility subsidy and grain consumption data are got from the documents released by the local agricultural bureaus and governments. The per capita minimum living allowance amount is obtained from the "List of Minimum Living Allowance Standards for Urban and Rural Areas in Guangxi in 2020" published by the Department of Civil Affairs of the Guangxi Zhuang Autonomous Region. The pension insurance and employment security funds are mainly from the websites of each county government. The consumer price index is from the statistical yearbooks of each city (2017-2021), and the deposit interest rate is sourced from the official website of the People's Bank of China (http://www.pbc.gov.cn/).

3. Research Methodology

3.1. Methodology for measuring the economic value of cultivated land resources

The economic value of cultivated land resources is the value or economic benefits of the products that human produced by investing certain materials and labor on cultivated land. We use the income capitalization method, which is a land valuation method commonly used by scholars at home and abroad [20]. Specifically, the value of cultivated land is determined according to its income in a certain period of time and a certain land concession rate. Considering that the current family land contract can be extended for another 30 years after the expiration, thus the correction coefficient of the use life is about 1, the formula can be simplified as follows:
V 1 = a r
where V1 represents the economic value of cultivated land per unit area, a represents the net income per unit area of cultivated land, and r represents the land reversion rate.

3.1.1. The formula for measuring the net income of cultivated land (a)

The net income of cultivated land is related to the total income and total costs Moreover, in recent years, the government's subsidy for cultivated land has also increased the net income of cultivated land to some extent. Therefore, we improve the original formula by incorporating the subsidy for cultivated land, make the results more closely related to the actual value of cultivated land resources. The revised formula is as follows:
a = G c G f m + L
where a represents the net income per unit area of arable land. Gc represents the total agricultural output value, Gf represents the total cost of cultivated land, and "Gc-Gf" can be replaced by the local agricultural added value. m represents the area of cultivated land, and L represents the subsidy per unit area of cultivated land.

3.1.2. The formula for measuring land reversion rate (r)

Considering the actual situation of the research area and referring to existing research results [21,22,23], we adopt the model of safety rate plus risk adjustment value to calculate the land reversion rate, as follows:
r = 1 N i = 1 i r i + t
where r represents the land reversion rate, N represents the total number of months in a year (12 months), ri represents the one-year fixed deposit interest rate for the i month within a year, and t represents the risk adjustment value, which is calculated based on the average change in the local consumer price index from 2015 to 2020.

3.2. Methodology for measuring the social value of cultivated land resources

The social value of cultivated land resources refers to the value that cultivated land provides to farmers in living, employment, and maintaining social stability. It can be divided into social security value and social stability value, of which the social security value can be further divided into pension security value and employment security value. However, farmers may also participate in non-agricultural activities to earn income, thus the income of rural residents does not only come from agricultural activities. Therefore, we use the ratio of per capita annual agricultural net income to other income as a correction factor to reflect the degree of farmers' dependence on cultivated land. The formula is as follows, V2 represents the social value of cultivated land:
V 2 = V b + V s × k
V b = V b y + V b j

3.2.1. The formula for calculating the value of social security(Vb)

Social security value(Vb) includes pension security value(Vby) and employment security value(Vbj). Due to the incomplete social security system in rural areas of China, most rural elderly people rely on cultivated land as their pension and economic source. Therefore, cultivated land plays a significant role in providing pension security value for rural residents. In this study, we use the alternative market approach to reduce the new rural residents' pension insurance benefits to the pension security value of cultivated land based on the land reversion rate, with the formula:
V b y = Y P × r
where Vby represents the amount of pension security value, Y represents the amount of new rural social pension insurance (in CNY/person), P represents the per capita cultivated land area (in hectare/ person), and r is the land restoration interest rate.
On the other hand, as most rural residents make their living by growing crops, cultivated land also plays the role of employment security. Since China's rural employment security system is not yet perfect, we refer to the urban residents' unemployment insurance system and use the ratio of urban and rural residents' disposable income to correct urban residents' unemployment insurance benefits, with the formula:
V b j = ( I 1 / I 2 × U P × r
where I1 represents the per capita disposable income of rural residents (in CNY/person/year), I2 represents the per capita disposable income of urban residents (in CNY/person/year), and U represents the unemployment insurance benefit for urban residents (inCNY/person/year). P and r are the same as those in equation (6).

3.2.2. The formula for calculating the value of Social stability(Vs)

The social stability value of cultivated land is to ensure national food security and maintain social stability. From the perspective of food security, we choose the minimum subsistence guarantee per capita for rural residents as an indicator, the formula is as follows:
V s = B r × k
where Vs represents the social stability value of cultivated land, B represents the minimum living guarantee amount per capita (in CNY/person/year), k represents the population that can be supported by cultivated land per unit area (in person/hectare), and r as the same as in equation (6).

3.3. Methodology for measuring ecological value of cultivated land resources

Xie Gaodi [7] developed a national regional land ecosystem services value assessment system. However, this system has significant limitations in studying the ecological value of cultivated land in small-scale areas (e.g., county and township areas). Therefore, we refer to existing research [8] and adopt the value equivalent correction method to adjust the social development stage coefficient and cultivated land carrying capacity coefficient. The social development coefficient reflects people's subjective understanding of the cultivated land ecosystem services value and their willingness to pay, while the cultivated land carrying capacity coefficient reflects the ecological relationship between supply and demand of cultivated land per unit area. The formula is as follows:
V = V e × D L × r
where V represents the ecological value of cultivated land resources (in CNY /hm2), Ve represents the value coefficient of farmland ecosystem services in China(5140.9 CNY /hm2), D represents the cultivated land carrying capacity coefficient, L represents the social development coefficient, r represents the land restoration interest rate.

3.3.1. The formula for calculating social development coefficient (L)

The changing process of people's subjective perception of ecological value of cultivated land and willingness to pay is very similar to that of biological growth, so this paper adopts the Peel growth curve[24]as a model for estimating the coefficient of ecological value development stages, the formula is as follows:
L = 1 1 + e ( 3 1 E n )
where L represents the coefficient of social development stage, e represents the base number of natural logarithm, and En represents the local Engel coefficient in 2020.

3.3.2. The formula for calculating carrying capacity coefficient (D)

The carrying capacity coefficient of cultivated land is measured by the ratio of local food supply (EC) [25] to demand (EF) [26], with the following equation:
D = E C / E F
E C = W P × e F
E F = T × Y P × y F
where D represents the coefficient of cultivated land carrying capacity, EC represents the ecological supply, EF represents the ecological demand, W is the local annual grain production in 2020 (kg), P represents the average annual grain production in the past five years (kg), eF means the equivalent factor of cultivated land, which follows the standard proposed by the World Wildlife Fund, i.e., 2.21. T represents the per capita annual grain consumption (kg/person), Y represents the resident population (people), and yF is the production factor, which is based on the international standard of 2.8 [26].

3.4. Spatial autocorrelation analysis method to explore the distribution of cultivated land value

3.4.1. Determination of the spatial weight matrix

The spatial weight matrix can represent the degree of association between different spatial objects, which is expressed as follows:
W = [ w 11 w 12 w 1 n w 21 w 22 w 2 n w n 1 w n 2 w n n ]
The adjacency matrix is the preferred method to create a spatial weight matrix. The adjacency matrix can be further divided into Bishop adjacency, Rock adjacency, and Queen adjacency, where Queen adjacency is a combination of Bishop adjacency and Rock adjacency, so we used the Queen weight method in the adjacency matrix as follows:
w i j = { 1 When   county   i   is   adjacent   to   county   j 0 When   county   i   is   not   adjacent   to   county   j

3.4.2. Global Moran Index

The global Moran index can be used to describe the average correlation of all small cells in the whole space with the surrounding area, and to detect spatial differences caused by spatial correlation, which is calculated as follows:
I = n S 0 × i = 1 n j = 1 n w i j ( y i y ¯ ) ( y j y ¯ ) i = 1 n ( y i y ¯ ) 2
In (16), n is the total number of spatial units, yi and yj represent the ecological value of the county i and county j respectively, y ¯ is the average ecological value of cultivated land in all counties, and wij is the spatial weight value. In addition, the global Moran index value is between -1 and 1. A value greater than 0 indicates that the attribute values of all regions have positive spatial correlation, while a negative value means negative correlation, and when the value equals to 0, the regions are randomly distributed and there is no spatial correlation.
The index for testing the global Moran index is the z-value, the formula is as follows:
Z = I E ( I ) var ( I )
where the expected value E(I) and variance Var(I) are calculated as follows:
E ( I ) = 1 n 1
V a r ( I ) = n 2 ( n 1 ) 1 2 i j ( w i j + w j i ) 2 n ( n 1 ) k ( j w k j + i w i k ) 2 2 ( i j w i j ) 2 ( n + 1 ) ( n 1 ) 2 ( i j w i j ) 2

3.4.3. Local Moran index statistics

By decomposing the global space into local or individual spaces, the local Moran index can calculate the spatial correlation of individual units in the region and the local characteristic differences existing in the distribution, and reflect the spatial heterogeneity and instability of the local region. It is usually represented by Moran scatter diagram and Lisa agglomeration diagram, the calculation formula is as follows:
I i = Z i S 2 j i n w i j z j
and
Z i = y i y ¯
Z j = y j y ¯
S 2 = 1 n ( y i y ¯ ) 2
Ii is the local Moran index of the county i, wij is the spatial weight value, n is the total number of counties, yi, yj and y ¯ are the same as above.
The formula for calculating the indicators for testing the local Moran's I index are the same as that in equations (17), (18) and (19).

4. Results and analysis of cultivated land resource value

4.1. Calculation results

The average value of cultivated land resources in 111 counties (cities, districts) in Guangxi was calculated by the income capitalization method, the r substitution approach and the value equivalent correction method. The ArcGIS software was used to output the distribution of cultivated land resource values in Guangxi at the county level using the natural breakpoint method (Fig.1).

4.2. Analysis of results

(1)The cultivated land resources in Guangxi possess enormous value, with a total value of 19.7292 trillion yuan. Economic value constitutes the largest proportion, accounting for a total of 11.5522 trillion yuan, while the social and ecological values are 2.8823 trillion yuan and 5.2946 trillion yuan, respectively. The three values are in a ratio of approximately 6:1:2. Furthermore, the economic, social, ecological, and comprehensive values of cultivated land resources per hectare are 3.3474 million yuan, 0.9186 million yuan, 1.0852 million yuan, and 5.3511 million yuan, respectively.
(2)In general, the average value of cultivated land in Guangxi counties is mainly economic value, while social and ecological value are generally low, with wide variation in the distribution of each functional value. The average economic value of land shows the spatial distribution pattern of "low in the west and high in the east". The high value areas are mainly distributed in the Nanning Basin, Yulin Basin, Xunjiang Delta and the southern part of Guilin City, which are flat and rich in water and heat resources, while the low value areas are mainly in the central and western karst mountainous area such as Hechi City and Chongzuo City;
(3)The overall spatial distribution pattern of the average social value of cultivated land is "low in the northwest and high in the southeast", which is the opposite to the terrain pattern of "high in the northwest and low in the southeast" in Guangxi. The favorable natural conditions in south of Guilin, Wuzhou and Yulin make the local rural residents mainly live on agriculture, so the social benefits of cultivated land are generally higher. Basically, cities with low social benefits of cultivated land, such as Hechi, Chongzuo and Laibin, are often economically undeveloped. However, the social security value of cultivated land is likewise low in Nanning and Liuzhou which own advanced economies, because of the developed local industries and the rural residents are mostly engaged in secondary and tertiary industrial activities, which are less dependent on cultivated land;
(4)In terms of the average of ecological value, the municipal districts of Guangxi are generally low, while the counties far from the city center have obvious ecological advantages due to their low urbanization level and high quality of cultivated land. The spatial distribution pattern of comprehensive value is similar to that of economic value. In addition, the quantity as well as the quality of cultivated land is decreasing because of the continuous urban expansion, so the comprehensive value of cultivated land in most municipal districts is lower.

5. Spatial distribution characteristics of cultivated land resource values

5.1. Global spatial autocorrelation characteristics of the value distribution

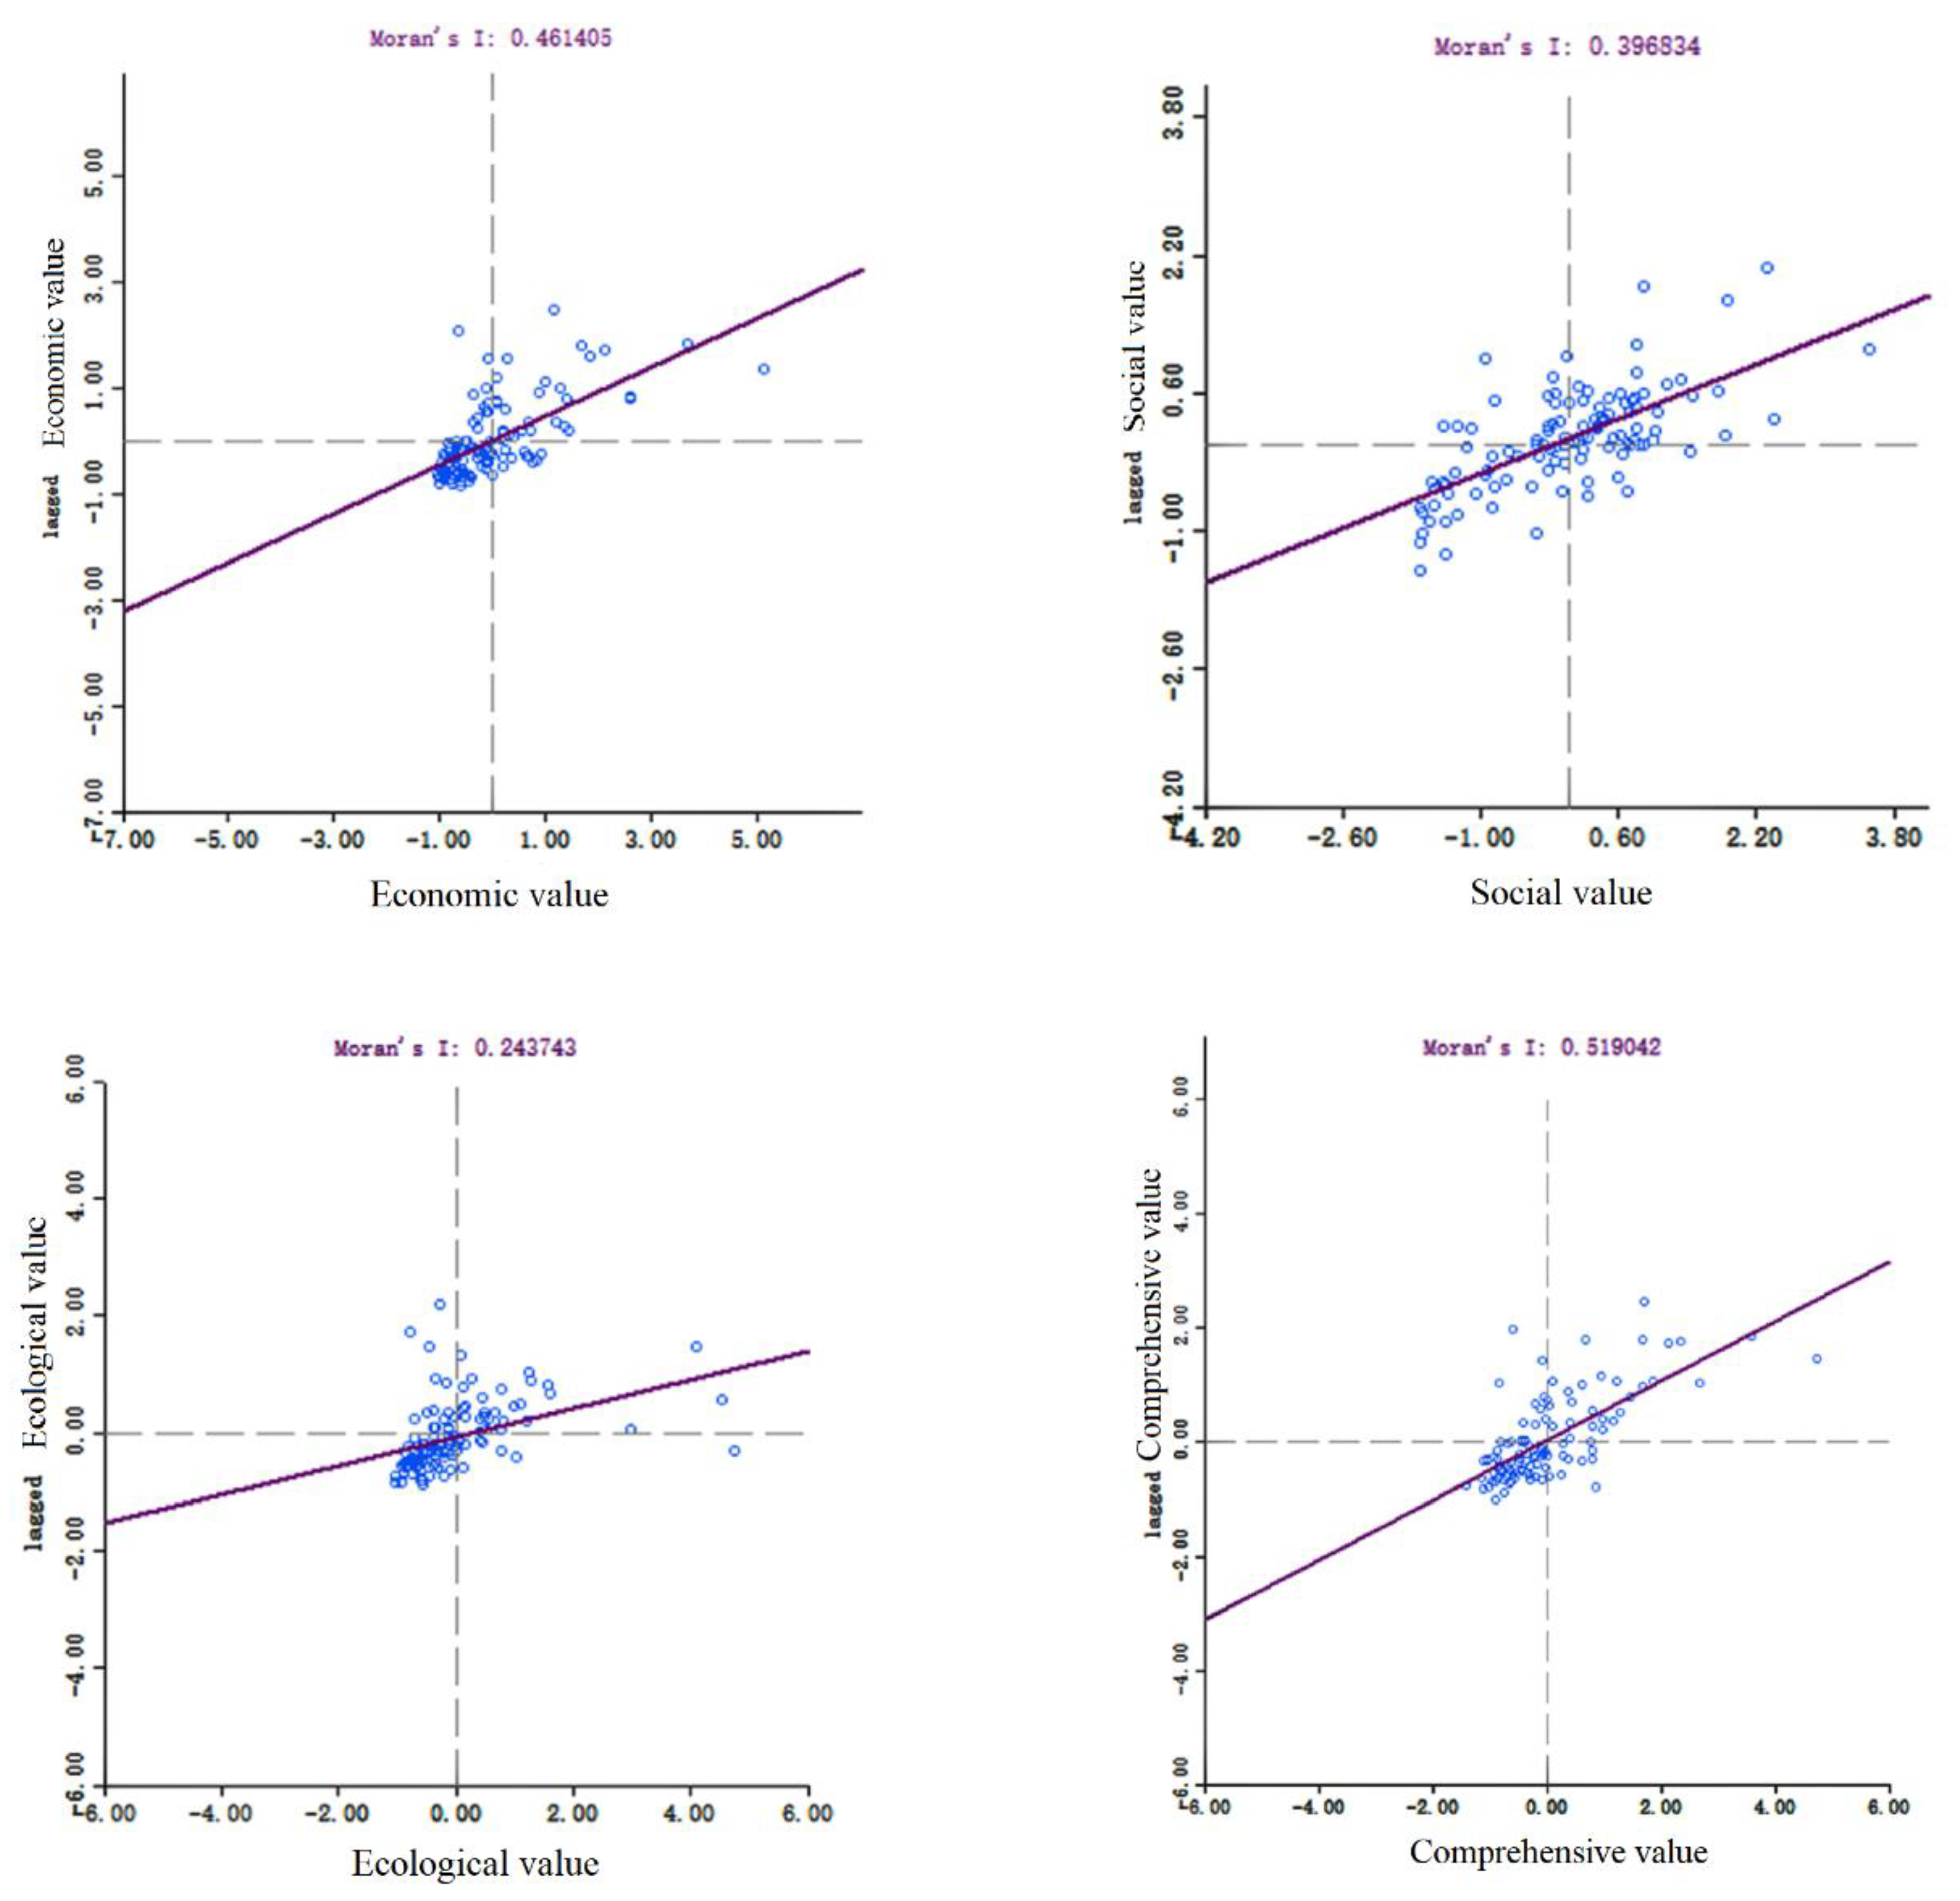
As shown in Table 1, the global Moran's I index of the four values of cultivated land resources in Guangxi are all greater than 0, and the Z-score are all greater than 1.96, indicating positive spatial correlation. Moreover, Montecarlo simulation tests all passed in the 99.9% confidence interval, showing that significant spatial agglomeration characteristics exist. Additionally, the Moran's I indices of the average of economic value and comprehensive value are significantly higher than those of the other two values, indicating that the agglomeration phenomenon of these two values is more prominent.

5.2. Local spatial autocorrelation characteristics of the value distribution

The global Moran's I index reveals the overall correlation of cultivated land resource values in Guangxi counties, but cannot identify the specific agglomeration areas. Therefore, this paper conducts local spatial autocorrelation analysis by GeoDa, and draws a local Moran scatter plot (Fig.2) at the 0.05 significance level, and counts the points in each quadrant (Tab.2). It can be seen that except the counties that are not significant, the values of cultivated land resources in Guangxi counties are unevenly distributed in the four quadrants, showing four agglomeration patterns: high-high, low-low, high-low, and low-high. Among them, the first quadrant and the third quadrant have the highest number of points, indicating that the "high-high" and "low-low" agglomeration patterns are the most common. This further confirms that the phenomenon of "polarization" between high-value areas and low-value areas is more pronounced.
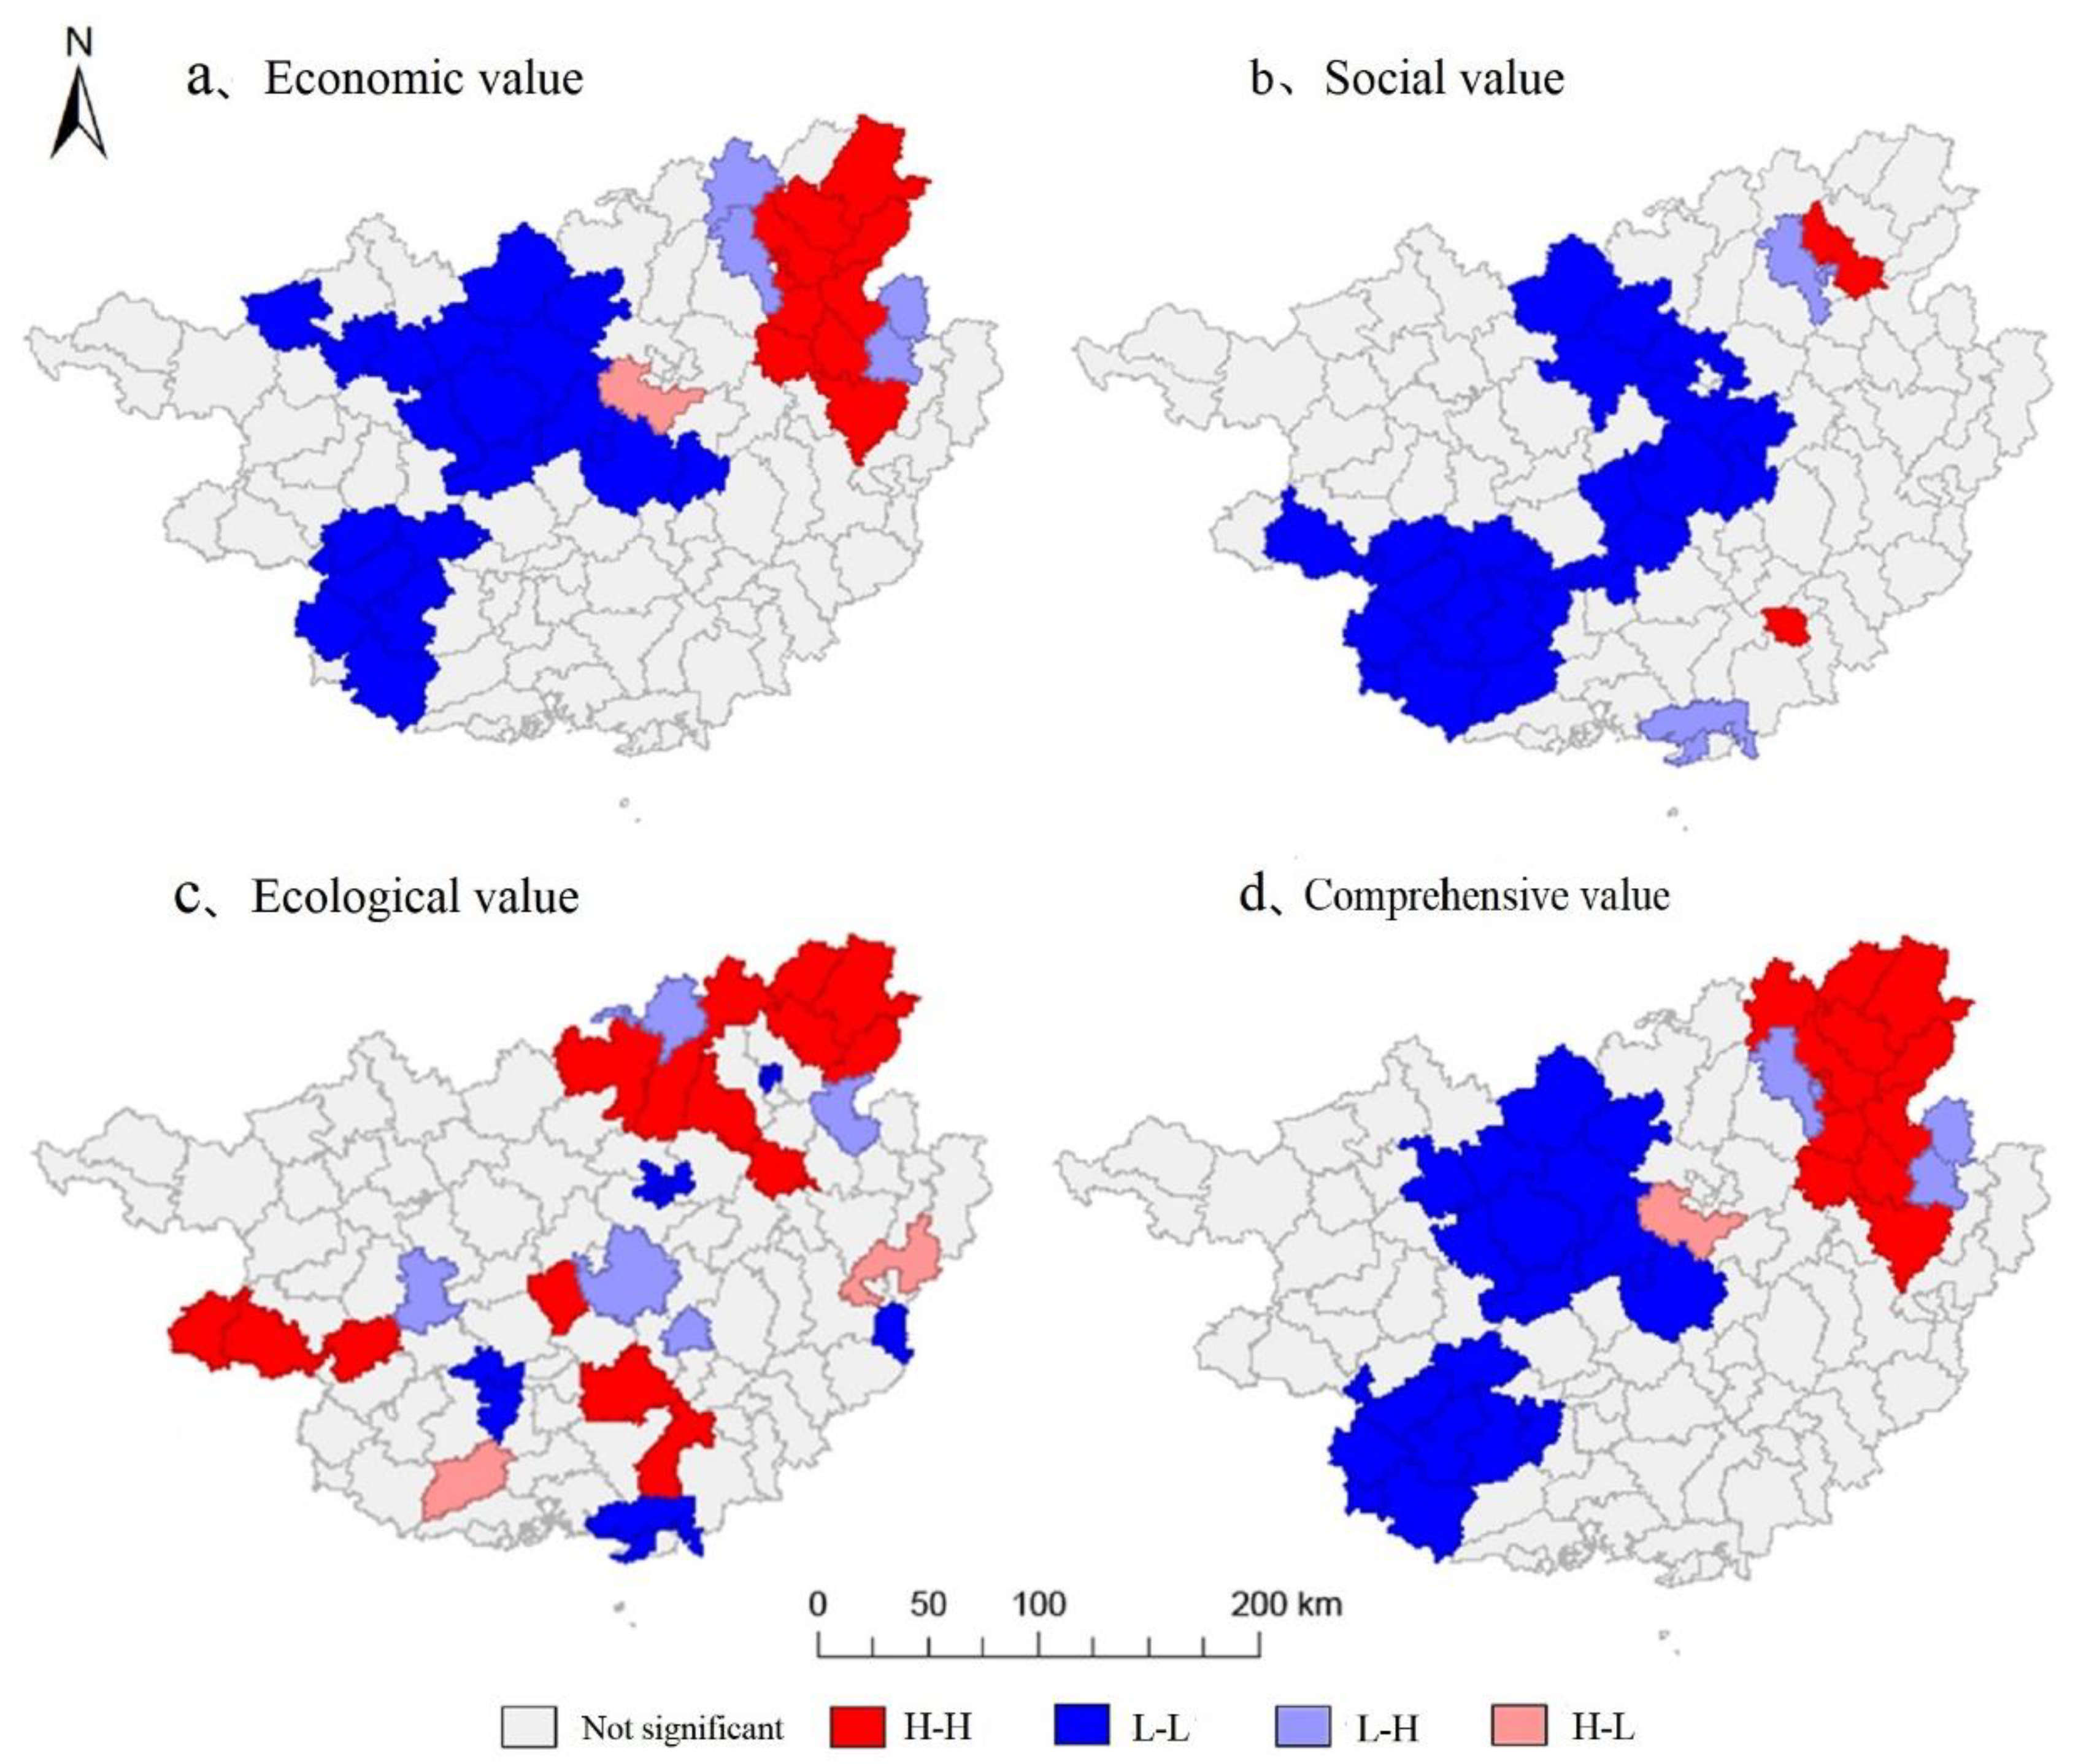
To represent the areas of value clustering more intuitively, the Lisa clustering map of cultivated land resource values was exported by GeoDa (Fig.3).
From Fig.3, we can see that the spatial clustering of each value of cultivated land resources in Guangxi varies, with the economic, social and comprehensive values clustered in "low-low" and the ecological values in "high-high". The "high-low" and "low-high" clustering areas of the four values are relatively few and show a sporadic distribution.
(1)In terms of economic value, the "high-high" agglomeration areas of economic value are concentrated in Guilin City, where has abundant water and heat resources, fertile soil, and favorable natural conditions. At the same time, the local governments and residents have actively innovated agricultural development models that are tailored to local conditions, greatly improving the economic efficiency of cultivated land. For example, Gongcheng County takes the planting of persimmons, oil tea, and plums as the leading industries, promoting the adjustment of the county's agricultural industry structure and radiating to surrounding areas. Economic value "low-low" agglomeration areas are mainly distributed in Hechi City, the western part of Chongzuo City and Laibin City. Hechi City is one of the major karst landscape areas in Guangxi, with steep slope and difficult irrigation, the small and scattered cultivated land makes the local farming condition poor; the western counties of Chongzuo City border with Vietnam, with complex terrain, poor natural conditions and traffic conditions, these counties have economy and agricultural technology both backward, farmers mainly rely on traditional farming methods, so the economic benefits of cultivated land are generally low.
(2)In terms of social value, the "high-high" agglomeration areas are mainly located in the county areas adjacent to the center of Guilin City. That is because Yangshuo County and Yanshan District of Guilin City serve as pilot areas for the integration of urban and rural subsistence allowances, with the minimum living security standard for both urban and rural residents reaching 9,000 yuan per person per year, thereby enhancing the social security value of cultivated land and having a positive radiating effect on other counties. In addition, the surrounding areas of Yulin City are also "high-high" agglomeration areas in terms of social value. Because Yulin City has always been the center of Guangxi’s large agricultural population, with rural residents' disposable income ranking first in Guangxi for four consecutive years. The local flat terrain and abundant hydrothermal resources allow the rural residents obtain relatively high economic benefits through cultivated land, which means that cultivated land has fully played its social security function. Conversely, the "low-low" agglomeration areas are mainly located in Hechi, Laibin, and Chongzuo, which are relatively backward in economy. The counties in Hechi and Chongzuo are mountainous, less flatlands, steep slopes, poor farming conditions, and backward agricultural technology. Therefore, rural residents mostly use traditional grain farming methods, resulting in low productivity of cultivated land. Laibin City's industrial structure is dominated by secondary and tertiary industries, with a large outflow of rural labor and low quality of labor force. Rural residents have less income from operating cultivated land, and cultivated land has failed to fully play its social security function.
(3)In terms of ecological value, the "high-high" ecological value clusters are distributed in a circular pattern around the center of Guilin city, and Guilin city is also the area where the "high-high" economic value and comprehensive value are clustered. Although the terrain is mainly mountainous and the cultivated land is scattered, the Guilin municipal government attaches great importance to agricultural development and continuously increases the policy of strengthening agriculture and supporting peasants, so that farmers are generally more active in planting and constantly improve the rural land fertility, build high-standard farmland and transform low-yielding fields, which increases the ecological benefits of cultivated land. In addition, the junction of Baise city, Chongzuo city and Hengxian County in Nanning City are also ecological value "high-high" clusters. These counties are rich in water and heat, far from the city center, and have good ecological environment of cultivated land, so the ecological benefits are high. The "low-low" ecological value clusters are mainly located in the old urban centers of Guilin, Liuzhou and Nanning, the coastal areas of Beihai and Fangchenggang, and the center of Wuzhou City. Among them, Guilin is dominated by tourism, Liuzhou and Nanning are highly industrialized, Beihai and Fangchenggang belong to the Beibu Gulf Economic Zone, with high level of export-oriented economy, and Wuzhou is an important channel for Guangxi to open the ASEAN market. These cities have large populations under their jurisdiction and all focus on the development of secondary and tertiary industries. The cultivated land area is small and the ecological environment is destroyed in the process of economic development, so the ecological advantage of the cultivated land is weak.
(4)In terms of comprehensive value, its spatial distribution pattern is similar to that of economic value, but the spatial agglomeration is stronger. Due to the influence of topographic conditions, the yield efficiency of cultivated land in Chongzuo and Hechi is low, and the ecological environment of cultivated land is poor due to the large slope and serious soil erosion phenomenon, so it is the main comprehensive value "low-low "agglomeration area. Although Guilin is home to widespread karst landscape which results in scattered cultivated land, as an international tourist city, it has always paid attention to the protection of ecological environment, the industrial structure is mainly based on tourism and agriculture, and the counties actively build special agricultural brands and adopt agricultural development policies according to local conditions, so the ecological and economic benefits of cultivated land are “High-High" agglomeration area.

6. Conclusions and Recommendations

6.1. Conclusions

The paper evaluated the value of cultivated land resources in 111 counties of Guangxi using the income capitalization method, the market substitution market method, and the value-equivalent correction approach, and then conducted global and local spatial autocorrelation analysis on the results. The findings indicate that:
(1)The cultivated land resources in Guangxi hold enormous value, with the total value of cultivated land resources in the region reaching 19.7292 trillion yuan. The economic value accounts for the largest proportion, with per unit economic, social, ecological, and comprehensive values of cultivated land resources being 3.3474 million yuan/hm2, 0.9186 million yuan/hm2, 1.0852 million yuan/hm2, and 5.3511 million yuan/hm2, respectively. However, there are significant internal differences in the distribution of these values, which are closely related to the complex and diverse terrain and natural geographical conditions within Guangxi.
(2)The various values of cultivated land resources in Guangxi exhibit certain spatial distribution patterns. The high-value areas of per unit economic and ecological values are mainly distributed in areas with excellent cultivation conditions far away from city centers. On the other hand, the low-value areas of per unit economic value are mainly distributed in areas with more mountains than plains and with underdeveloped economies and transportation conditions. The low-value areas of per unit ecological value are mainly distributed in the central areas of developed cities and coastal regions. The per unit social value is relatively low, exhibiting a spatial distribution pattern of "low in the northwest and high in the southeast."
(3)All values have significant clustering effects in the local spatial, with "high-high" and "low-low" clustering patterns. Among them, economic, social and comprehensive values are mainly clustered in "low-low" agglomeration, while ecological values in "high-high" agglomeration. Guilin is the city with the largest distribution of "high-high" agglomerations, and Chongzuo is the city with the largest distribution of "low-low" agglomerations.
(4)There is an obvious negative correlation between economic development and ecological value of cultivated land resources, however, economic development has an obvious positive correlation with social value. For Guangxi, in the counties with advanced economy and high urbanization level, cultivated land resources own low ecological value as well as high social value, and vice versa.

6.2. Recommendations

We concludes that, in the case of Guangxi, the social value of cultivated land is generally low due to the low business income of farmers and the massive loss of rural labor. Therefore, the government should continue to increase the policy of strengthening agriculture and enriching farmers, attracting intellectual youths to return to their hometowns to start their own businesses and employment, helping to revitalize the countryside and improving the various values of cultivated land.
For areas of low ecological value, such as counties with poor natural conditions and backward agricultural conditions, local governments should attach great importance to agricultural development, promote comprehensive improvement of farmland, water, roads, forests and villages, build high-standard farmland and renovate low and medium-yield fields, improve the quality of farmland, and on this basis introduce good varieties and agricultural technologies. Additionally, efforts should be made to improve the level of agricultural machinery and equipment, provide technical training for farmers, and improve their production enthusiasm. In counties near the city center, the local government should strictly control the occupation of cultivated land for construction, and at the same time improve the mechanism of responsibility for the ecological protection of cultivated land, build a "three-in-one" evaluation mechanism for cultivated land, and improve the ecological service value of cultivated land.
For areas with high ecological value and low economic value, the local governments should combine agriculture with secondary and tertiary industries to improve the economic benefits of cultivated land under the premise of protecting the existing ecological environment. On the one hand, local governments can build regional brands of distinctive agriculture, speeding up the establishment of ecological product certification systems. Such as the "Good Products Fair" and "Agricultural Culture and Ecological Festival", the organic connection between market and farmers can be effectively established. On the other hand, relying on cultivated land resources to promote the development of emerging industries such as "agricultural eco-tourism" can be a viable policy option. This can be achieved through various business models such as rural tourism and recreational activities at farmhouse restaurants, which can fully utilize the value of cultivated land in terms of eco-tourism, cultural experiences, health care for the elderly, and ultimately realizing value-added benefits of agricultural diversification. This can promote the transformation towards ecological agriculture, ultimately achieving a win-win situation of economic growth and environmental protection.

Author Contributions

Conceptualization, Zhantu Chen and Li Ren; Data curation, Zhantu; Formal analysis, Li Ren; Methodology, Li Ren and Qiong Xiao; Project administration, Qiong Xiao; Validation, Li Ren and Ling Xie; Visualization, Li Ren and Ling Xie; Writing – original draft, Li Ren ; Writing – review & editing, Zhantu Chen and Li Ren.

Funding

This research was funded by the Guangxi Natural Science Foundation (2021JJA150154) and Guangxi Social Science Foundation (21FYJ057).

Data Availability Statement

Not applicable.

Acknowledgments

Thank you to everyone who contributed to this study.

Conflicts of Interest

The authors declare no conflict of interest.

References

  1. Xiaoyong, Z.; Hongyi, L. Exploring the path of accounting for the value of cultivated land resources in China. China Land, 2021, 2, 41–43. (In Chinese) [Google Scholar]
  2. William Petty. Selected economic writings of William Petty. Beijing: The Commercial Press, China, 1981,45-56(In Chinese).
  3. Guangdong, L.; Daozhi, Q.; Ping,W. Assessment of non-market value of arable land in Three Gorges ecologically fragile area. Journal of Geography, 2011, 66, 562–575. (In Chinese) [Google Scholar]
  4. Robert Costanza, Ralph d’Arge, Rudolf de Groot, et al. The value of the world's ecosystem services and natural capital. Nature, 1997, 387, 253–260. [Google Scholar] [CrossRef]
  5. XianJin, H. Accounting for the value of cropland resources in China. Agricultural Economic Issues, 1997, 3, 40–42. (In Chinese) [Google Scholar]
  6. Fengqing, Y.; Yunlong,C. Exploring the value of arable land resources. China Land Science, 2003, 3, 3–9. (In Chinese) [Google Scholar]
  7. Gaogao, X.; Chunxia, L,; Yunfa, L. ; et al. Valuation of ecological assets on the Qinghai-Tibet Plateau. Journal of Natural Resources, 2003, 2, 189–196. (In Chinese) [Google Scholar]
  8. Xiaoyu, W.; Shougeng, H.; Luyi, T. The value of arable land resources and its spatial distribution in Tuanfeng County. Resource Science, 2016, 38, 206–216. (In Chinese) [Google Scholar]
  9. Shaofang, J. An overview of practical valuation of agricultural land use rights. Beijing: China Real Estate Valuation and Brokerage, 2015, 50-58.
  10. Xiping, H.; Xiaohua,Z. Accounting methods and example analysis of farmland assets. China Land Science, 1994, 6, 23–27. (In Chinese) [Google Scholar]
  11. Rong, H.; Daozhi, Q.; Deti, X.; et al. Research on asset value accounting of arable land resources in China. Journal of Southwestern University (Natural Science Edition), 2013, 35, 127–132. (In Chinese) [Google Scholar]
  12. Xiaofei,C. Exploring the social value of arable land resources--Shenyang city as an example. Jilin Agriculture, 2011, 6, 69–71. (In Chinese) [Google Scholar]
  13. Xiumei, T.; Yuchun, P.; Yu, L. Ecological value assessment and spatial and temporal change analysis of cropland in Beijing. China Agricultural Resources and Zoning, 2018, 39, 132–140. (In Chinese) [Google Scholar]
  14. Xiumei, T.; Baiming, C.; Yu, L.; et al. Analysis of the progress of research on ecological value assessment of cropland. Journal of Agricultural Machinery, 2016, 47, 256–265. (In Chinese) [Google Scholar]
  15. Jinhua, X.; Gangqiao, Y.; Jian, W.; et al. Effects of different farmland remediation models on production value and ecological value of arable land--an empirical analysis based on some farmers in Tianmen and Qianjiang. Journal of Natural Resources, 2019, 34, 2333–2347. (In Chinese) [Google Scholar] [CrossRef]
  16. Xiaoyong, Z.; Hongyi, L. A review of research on accounting methods for arable land resource value. China Land and Resources Economy, 2020, 33, 41–47. (In Chinese) [Google Scholar]
  17. Xisheng, R.; Tan, L.; Ouxiang, Z.; et al. Quantification of ecological compensation for arable land in Yangtze River Economic Zone based on ecological service value. China Agric. Resour. Zoning 2021, 42, 68–76. (In Chinese) [Google Scholar]
  18. Zhantu, C.; Li, R.; Wenfeng, L. Ecological value accounting of arable land resources in Guangxi County based on value equivalent correction method. South. Land Resour. 2021, 6, 32–36. (In Chinese) [Google Scholar]
  19. Lankang, C.; Xuyang, Z.; Zhengsong, D. , Current situation of agricultural land capacity in Guangxi and suggestions for improving it. South. Land Resour.
  20. Jinchang, Z. , The historical significance of compiling natural resources balance sheet. People's Forum 2018, 24, 74–75. (In Chinese) [Google Scholar]
  21. Shangrui, L.; Jianxin, G.; Xiaomin, L. Accounting and management of natural resource assets-an example of land resource accounting practice in County A. J. Fudan (Soc. Sci. Ed. ) 2020, 62, 165–173. (In Chinese) [Google Scholar]
  22. Jishuang, L.; Xu, Z.; Yue, H. Reasonable price measurement of grain management on an appropriate scale and land transfer--an analysis based on the perspective of new agricultural management subjects. Price Theory Pract. 2020, 7, 62–65. (In Chinese) [Google Scholar]
  23. Yan, L.; Hongji, Z.; Xiaobo, L.; et al. Research on asset value estimation of arable land resources in Sichuan Province. China Land and Resources Economy, 2021, 34, 51–57. (In Chinese) [Google Scholar]
  24. Qian, L.; Ge, L.; Chao, Z.; et al. A study on the dynamic change of ecosystem service value in Qinglong County based on coefficient correction. Chin. J. Ecol. Agric. (Engl. Chin. ) 2019, 27, 971–980. (In Chinese) [Google Scholar]
  25. Huichun, S.; Xiaojuan, S.; Lu, L.; et al. Comparison of methods and results of urban ecosystem service value assessment in Lanzhou. China Population-Resources and Environment, 2013, 23, 30–35. (In Chinese) [Google Scholar]
  26. Hongyu, X.; Lingli, W.; Xiansheng, C.; et al. Improvement and application of ecological footprint evaluation model. Beijing: Chemical Industry Press, Chna, 2008; pp. 54-60.
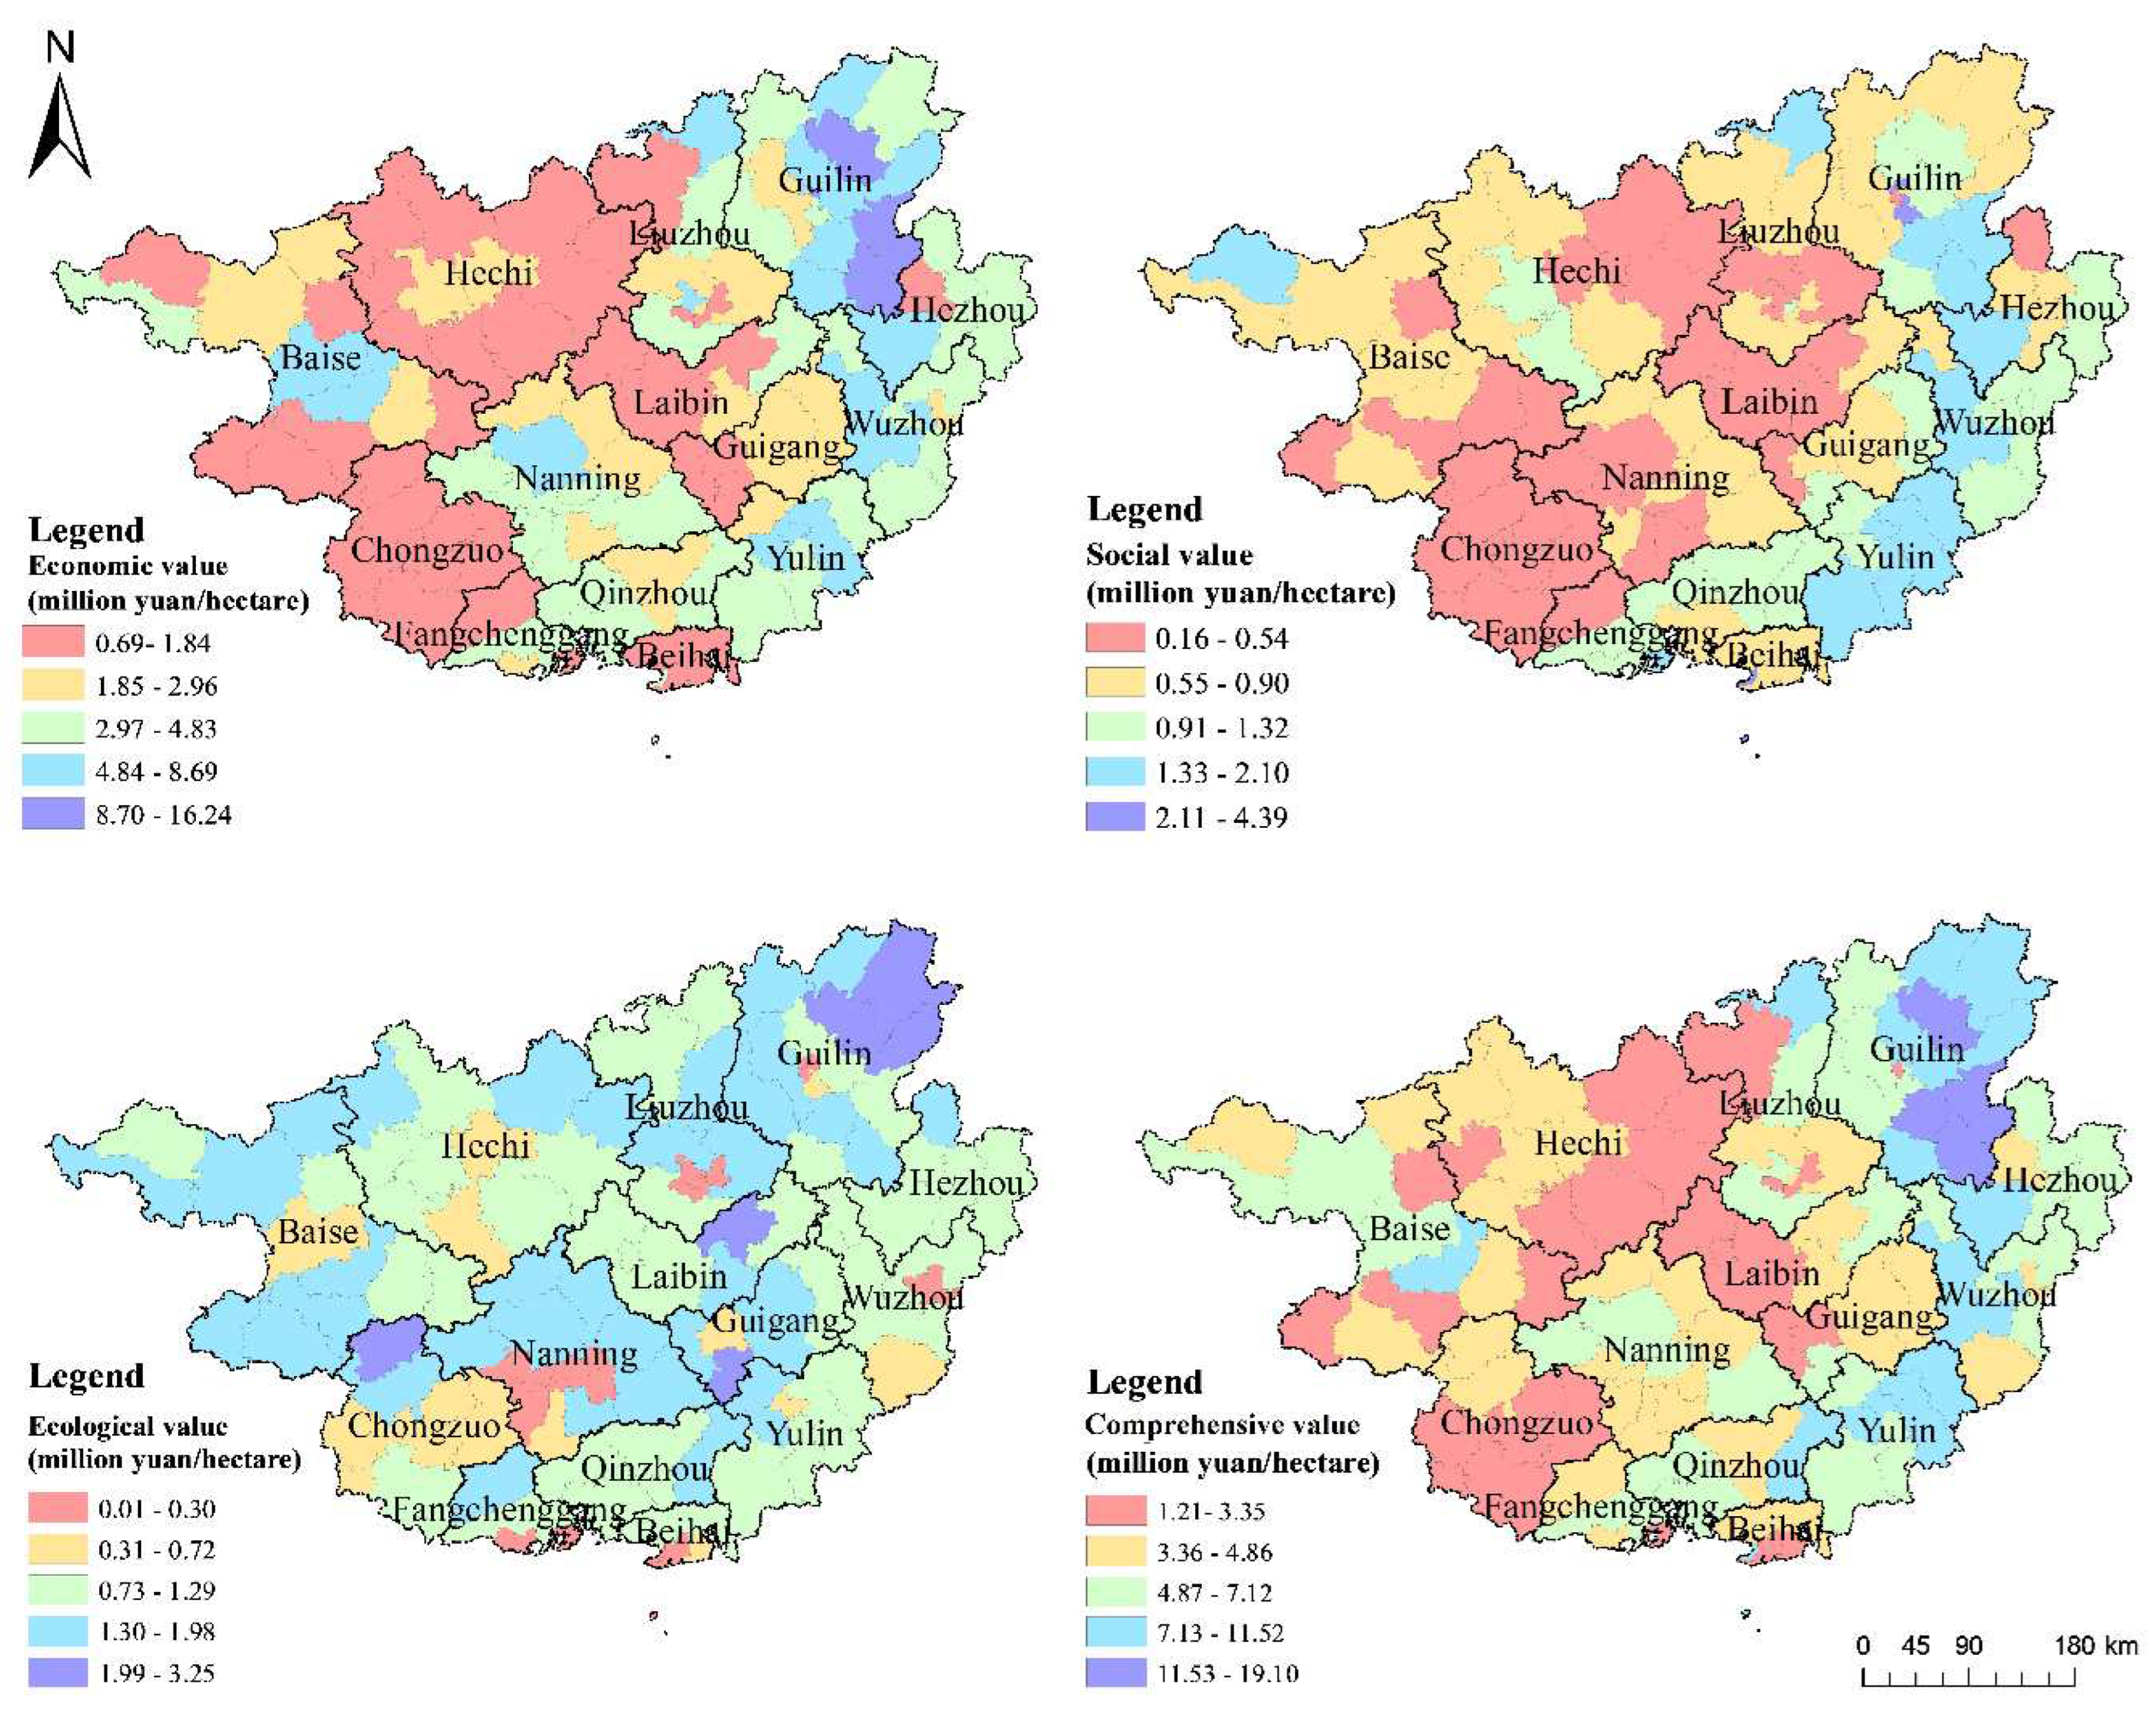
Figure 1. Distribution of cultivated land resource values at the county scale in Guangxi.
Preprints 84356 g001
Figure 2. Moran scatter plot of average value of cultivated land resources in Guangxi counties.
Preprints 84356 g002
Figure 3. LISA agglomeration map of average value of cultivated land resources in Guangxi counties.
Preprints 84356 g003
Table 1. Global spatial autocorrelation characteristic index of cultivated land resource value in Guangxi counties.
average of Economic value average of Social value average of Ecological value average of Comprehensive Value
Moran's I 0.4614 0.2437 0.3968 0.5190
Z-score 7.7180 4.2458 6.7314 8.5302
Confidence level/% 99.90 99.90 99.90 99.90
Table 2. Local spatial autocorrelation characteristics of the average value of cultivated land resources in Guangxi counties.
The relationship between the value of cultivated land in a county and the surrounding counties Number of counties
Economic value Social value Ecological value Comprehensive Value
Not significant 73 77 76 72
H-H 13 3 15 15
L-L 20 26 13 19
L-H 4 5 5 4
H-L 1 0 2 1
Disclaimer/Publisher’s Note: The statements, opinions and data contained in all publications are solely those of the individual author(s) and contributor(s) and not of MDPI and/or the editor(s). MDPI and/or the editor(s) disclaim responsibility for any injury to people or property resulting from any ideas, methods, instructions or products referred to in the content.
Copyright: This open access article is published under a Creative Commons CC BY 4.0 license, which permit the free download, distribution, and reuse, provided that the author and preprint are cited in any reuse.
Prerpints.org logo

Preprints.org is a free preprint server supported by MDPI in Basel, Switzerland.

Subscribe

© 2024 MDPI (Basel, Switzerland) unless otherwise stated