
Submitted:
05 September 2023
Posted:
06 September 2023
You are already at the latest version
Abstract
The determination of critical ventilation flow rate is significant for the risk control and the standard development during accidental hydrogen leakage in a confined space with hydrogen-related equipment. In this paper, an analytical model for calculating critical ventilation flow rate was proposed through the quantification and constraint solution of ventilation effect and ventilation cost. The experimental method was used to investigate the effects of nozzle diameter and stagnation pressure on diffusion and ventilation for horizontal hydrogen leakage in a cuboid chamber. Ventilations from 30m3/h to 180m3/h were carried out through the rectangular vent. It was shown that the peak concentration of the measuring point is positively correlated with the stagnation pressure and the nozzle diameter. The experimental data are used to verify the analytical model by calculating the effective ventilation time. The study demonstrates that the critical ventilation flow rate can be increased significantly at higher stagnation pressures and larger nozzle diameters. And the discrepancy of critical ventilation flow rates under different nozzle diameters will be enhanced with the increase of stagnation pressure. For the stagnation pressure of 0.4MPa, the critical ventilation flow rate under 4mm nozzle even increases by 52% relative to the 2mm nozzle.
Keywords:
Hydrogen leakage
; forced ventilation
; ventilation flow rate
; analytical model
1. Introduction
Hydrogen is a colorless, odorless, tasteless, flammable nontoxic gas [1]. It is also the least dense gas at present, with a specific gravity of 0.0695. Except as industrial raw materials, hydrogen is also a multipurpose energy carrier, with an extremely high energy density between 120 and 142 MJ/kg [2]. As many countries transition to a low-carbon economy, it is becoming a critical fuel for transport, power generation and manufacturing applications. However, hydrogen with very small molecular size can easily pass through porous materials and can be absorbed by some containment materials [1, 3]. This may lead to ductile loss or hydrogen embrittlement of the material and cause leakage. And the process accelerates at high temperatures. Meanwhile, hydrogen diffuses quickly (3.8 times faster than natural gas) [4]. This means that leaking hydrogen is more likely to accumulate under obstacles. Hydrogen has a very low ignition energy (0.019mJ) [5] and a wide flammable limit (4~75%), which makes it easier to ignite. The reaction in this case can develop into deflagration or detonation, and will cause a surge of pressure in the confined space. Therefore, during the popularization of hydrogen, accidental hydrogen release in a confined space should be taken seriously.
Ventilation is the main and effective measure to deal with hydrogen leakage in a confined space. There are two kinds of ventilation: natural ventilation and forced ventilation (mechanical ventilation).The former mainly depends on the density discrepancy between light hydrogen and the surrounding heavy air. The latter often rely on various ventilation systems (fans, etc.) for air supply or exhaust. The overview on hydrogen diffusion and ventilation is shown in Table 1.
Initially, many studies focused on the effects of natural ventilation parameters on hydrogen accumulation and diffusion, including the amount, position and total area of vents [6, 9-11, 16-20]. The intersecting ventilation position was considered to be the most effective configuration to reduce the hydrogen concentration in the enclosed space [10, 15]. With the further research, the shape of the vent has been found to have a significant contribution to the ventilation efficiency. Hajji et al. [9] found that simple geometric shapes (rectangle or square) are more suitable for ventilation of houses with sloping tops. In particular, the change of the roof angle has been proved to have a severe effect on the concentration gradient and stratification of hydrogen [8]. For ordinary residential garages, square vents bring a lower concentration value, which achieves a ventilation efficiency of 56.06% [17]. When the aspect ratio of the square decreases, the intake of fresh air and the emission of hydrogen are greater. Many researches on ventilation parameters tend to be quantitative analyses, which are more practical than qualitative analyses. The coupling effect of the position and area of a single vent on hydrogen diffusion was quantified by Zhang et al. [11]. The average hydrogen concentration of a specific cross section was presented as a quantitative index in the three-dimensional curved surface cloud map, which explains the coupling effect. An analytical model was constructed by Prasad et al. [21] to predict air entrainment and gas stratification in hydrogen buoyant turbulence. The gas driving characteristics in the space are quantized. However, the effect of vents that depend on fixed size and position is often greatly affected by the environment. A sensing-based adaptive risk mitigation control method was proposed by Matsuura et al. [19]. The opening and closing of the vent are controlled in real time by using the concentration data.
Forced ventilation is a supplement to ventilation performance when natural ventilation cannot quickly reduce hydrogen concentration in the space. Both blower and axial fans can be used as forced ventilation equipment in hydrogen-related places. Natural ventilation is always combined with forced ventilation to support fresh air inflow (cooperating with negative pressure forced ventilation) or hydrogen exhaust (cooperating with positive pressure forced ventilation) [12, 14, 15, 18, 20, 22-27]. In addition to the above basic ventilation parameters, the flow rate of forced ventilation has a great influence on the dispersion of hydrogen leakage clouds. Larger flow rate and smaller blower (with higher flow velocity) have been proved to be effective in improving hydrogen dispersion by Xie et al. [28]. For a given leakage condition, the combustible envelope does decrease significantly with the ventilation growth. However, the higher ventilation flow rate may increase the hydrogen detection difficulty by sensors [29]. Lee et al. [15] proposed a strategy of nitrogen forced ventilation to make the spatial concentration level reach the safety standard faster. Considering the disadvantage of constant ventilation flow rate, a new control strategy was proposed by Matsuura et al. [13, 30-32] to change the exhaust flow rate in real time for fixed vent position and area. The hydrogen leakage modes, including leakage rate and position, were estimated by a large amount of sensing data. Accordingly, each leakage mode corresponds to a specific acceptable exhaust flow rate. This time-varying ventilation control method has high flexibility. Previous results show that the combined action of forced ventilation and natural ventilation can effectively restrain the dangerous area and hydrogen concentration in the space. Nevertheless, apart from the study of the hydrogen diffusion and ventilation mechanism, a method used to determine the optimal ventilation flow rate is also necessary for a specified scenario in engineering applications.
In fact, the ventilation flow rate is limited by the fan specification. With the increase of the ventilation flow rate, the cost of the corresponding fan will gradually rise, which has not been studied in previous work. The increase of ventilation flow rate regardless of the cost is not conducive to the application of hydrogen. The impact of the cost needs to be considered in the configuration of the actual ventilation system. For a given condition of vent position and vent area, this paper considers that there is a critical ventilation flow rate to balance the ventilation effect and ventilation cost.
In this paper, the critical ventilation flow rate was introduced as the optimal ventilation flow rate for hydrogen leakage in a confined space. The analytical model of critical ventilation flow rate was proposed for the first time, which includes two calculation methods applicable to different scenarios. The model fully balances the demand of the ventilation cost and effective ventilation time. The effect of the model has been preliminarily verified relying on the experimental data under various hydrogen leakage conditions. In addition to using experimental data as the model input, numerical simulation data for specific scenarios can also be used in the solution. The analytical model of critical ventilation flow rate will provide quantitative reference for the optimal configuration of ventilation systems in the hydrogen-related space.
2. Experimental equipment and procedures
The schematic diagram of the experimental platform is shown in Figure 1. It was used to study the evolution of hydrogen leakage, diffusion and ventilation. The experimental platform is composed of chamber, air supply system, ventilation system and data acquisition system. The chamber was used to form a confined space for actual hydrogen leakage and diffusion. Considering the dangerous characteristics of hydrogen, the experiment was carried out by using helium similar to hydrogen in physical properties. The ventilation system including the fan and governor was to adjust the volume flow rate. Five helium detectors in the data acquisition system were set to record the helium concentration on the jet axis.
The chamber is made of aluminum plate with 12mm thick. In Figure 1, the internal dimension of the cuboid chamber is length×width×height = 2m×1m×1m. A movable bracket was installed at the chamber bottom, with the observation window and the door on two sides respectively. Helium is ejected horizontally into the inner space through the nozzle installed on the side of the chamber. The negative pressure forced ventilation was adopted to dilute the dangerous atmosphere. The maximum ventilation flow rate of the fan is 180m3/h. In particular, a rectangular vent with a size of 0.3m×0.9m was configured in the experiment. Besides, the helium detectors work by pumping as shown in Figure 2. The measuring range of the detectors is from 0 to 100%VOL with its own battery energy storage. The negative pressure is formed at the local measuring point through the external and internal suction pipes. Then helium is inhaled into the detector to obtain the concentration value.
When hydrogen leaks, the safety control system may to be triggered to cut off the leak source. In the present study, it is assumed that the hydrogen leakage will be blocked after 30s. Then the negative pressure ventilation system is started and continues to work for 130s. Thus, hydrogen leakage is divided into two stages: high-speed leakage and ventilation disposal. The whole experimental process was organized accurately by the programmable controller. Nozzle diameter, leakage pressure and ventilation flow rate are independent variables to be adjusted. The parameters of experimental conditions are shown in Table 2, in which the stagnation pressure is the pressure at the outlet of the pressure reduction valve.
3. Results and discussion
3.1. Analytical model of critical ventilation flow rate
At the end of the high-speed leakage stage, considerable hydrogen has been accumulated in the space. For a specific hydrogen leakage condition, a critical ventilation flow rate is required for ventilation to balance the ventilation effect and the ventilation cost. In this paper, the effective ventilation time was introduced to describe the ventilation effect quantitatively. The effective ventilation time was defined as the shortest time in which the characteristic concentration declines below the acceptable risk level. Then the effective ventilation time and ventilation cost were fitted into functions with ventilation flow rate as independent variable respectively. Finally, the critical ventilation criterion was obtained by function coupling, and its maximum point is the critical ventilation flow rate. The main solution procedures are shown in Figure 3.
This paper used the experimental data as data input. The characteristic concentration was identified as the concentration of the local measuring points in the space, while the acceptable risk level was set as the lower hydrogen combustion limit. The ventilation cost depends on the change of ventilation flow rate. Then two hypotheses were put forward. The first hypothesis is shown in Figure 4. In Figure 4(a), the ventilation flow rate significantly enhances the ventilation effect, and this enhancement is constrained at higher ventilation flow rates. The corresponding effective ventilation time verifies from rapid to slow decline. In Figure 4(b), an exponential increase was shown in the variation of the ventilation cost with the ventilation flow rate. This is because the improvement of higher ventilation flow rate means the multiple growth of fan procurement and maintenance costs. In particular, the second hypothesis linearizes the curves in the first hypothesis. As shown in Figure 5, it is assumed that the above dependent variables are linearly correlated with the ventilation flow rate.
Considering the different units of variables, it is necessary to do dimensionless processing without changing the hypothetical variable correlation. For the first hypothesis, the relationship between effective ventilation time and ventilation flow rate is approximately natural exponential function. The dimensionless effective ventilation time is calculated as:
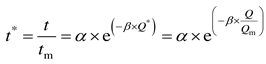
where t* is dimensionless effective ventilation time, t is effective ventilation time of each experimental condition, tm is the maximum ventilation time (130s), Q is ventilation flow rate, Qm is the maximum ventilation flow rate,  is dimensionless ventilation flow rate,
  and
and  are all coefficients in the natural exponential function.
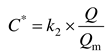
is dimensionless ventilation flow rate, and are all coefficients in the natural exponential function.The correlation between dimensionless ventilation cost and ventilation flow rate is expressed by exponential function as:
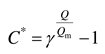
where C* is the dimensionless ventilation cost, and γ (γ > 1) is the base of the exponential function.
It is necessary to restrain the ventilation cost under the condition of certain ventilation effect to obtain the critical ventilation flow rate. The determination of critical ventilation flow rate is transformed into the problem of solving the extreme value under constraint conditions. Critical ventilation criterion M is introduced to integrate dimensionless effective ventilation time and ventilation cost:
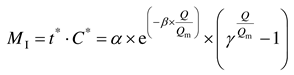
where MI is critical ventilation criterion under the first hypothesis. As shown in Figure 6, MI reaches the maximum value at the critical ventilation flow rate Qcr.
For the second hypothesis, the dimensionless effective ventilation time is calculated as:
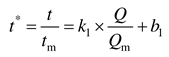
where k1 (k1 < 0) and b1 are the slope and intercept of linear relationship in Figure 5(a), respectively.
The dimensionless ventilation cost depends on the ventilation flow rate:
M under the second hypothesis is expressed as:
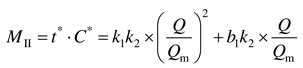
where k1k2 < 0. Obviously, the critical ventilation criterion MII is a univariate quadratic function of dimensionless ventilation flow rate. In Figure 7, the function curve is a parabola with an opening downward. The maximum value of the function is obtained at  , which is the dimensionless critical ventilation flow rate to be found. The actual critical ventilation flow rate is
 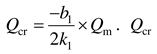 . is proved to be only related to the function parameters of t*.
, which is the dimensionless critical ventilation flow rate to be found. The actual critical ventilation flow rate is . is proved to be only related to the function parameters of t*.The experimental data are discrete and can not cover all the ventilation flow rates. Neither exhaustion nor approximation method is suitable for finding the ventilation flow rate to maximize the critical ventilation criterion. Therefore, it is recommended to fit the function parameters and predict the critical ventilation flow rate through the limited experimental data. For the experimental data (from limited monitoring points), the characteristic concentration has some limitations and can not reflect the overall level of hydrogen concentration in the space. The average concentration of the monitoring points can also be used to characterize the hydrogen risk level in the space. This will also lead to discrepancies in the results of effective ventilation time. It is necessary to adopt the appropriate calculation method (Type I or Type II) according to the experimental data.
3.2. Model verification and case solution
The first measuring point closest to the nozzle is selected to obtain the characteristic concentration in this study, due to the significant variation in concentration at the point. From the beginning of ventilation, the shortest time for the concentration at this point to drop to 4% is the effective ventilation time. The time history of helium concentration at this point is shown in Figure 8. Figure 8(a), (b) and (c) were recorded under the stagnation pressures of 0.2MPa, 0.3MPa and 0.4MPa, respectively. In the stage of high-speed gas leakage, the volume fraction of helium increases sharply. When the ventilation system was triggered, the helium concentration continues to rise along the original trend. After a few seconds of delay, the concentration of helium dropped dramatically. This phenomenon is related to the delayed response of the helium detector. It is worth noting that the sharp decrease in helium concentration occurs almost only within 14s after the ventilation system is started. The decreasing rate of helium concentration gradually slows down obviously after 14s of ventilation. Two effects are proposed to explain the time history. In the early stage of ventilation disposal, the cessation of helium supply lead to a sharp decrease in helium concentration. This means that the leakage blocking effect is dominant and the concentration data of various ventilations are highly coincident at the stage. In the later stage of ventilation disposal, with the turbulent diffusion of gas, the decrease of helium concentration at the point is effectively alleviated. At this time, it is dominated by the ventilation effect, and the concentration data of various ventilations are obviously separated at this stage. With the growth of ventilation flow rate, the helium concentration dropped faster in the later stage of ventilation disposal. In addition, the peak concentration of the measuring point turns to be larger, with the increase of the stagnation pressure and the nozzle diameter. This is mainly due to the leap of helium leakage per unit time.
With the growth of the ventilation flow rate, the effective ventilation time has been obviously improved, which is represented by the downward decreasing distribution of data points. And the data with higher pressure show a distribution of higher position in Figure 9, meaning longer effective ventilation time. The relevant experimental data are sorted out into a cloud map distribution of effective ventilation time in Figure 10. For a given nozzle diameter, stagnant pressure and ventilation flow rate have opposite effects on the effective ventilation time. The leakage at higher stagnation pressure often requires higher ventilation flow rate to improve the ventilation effect.
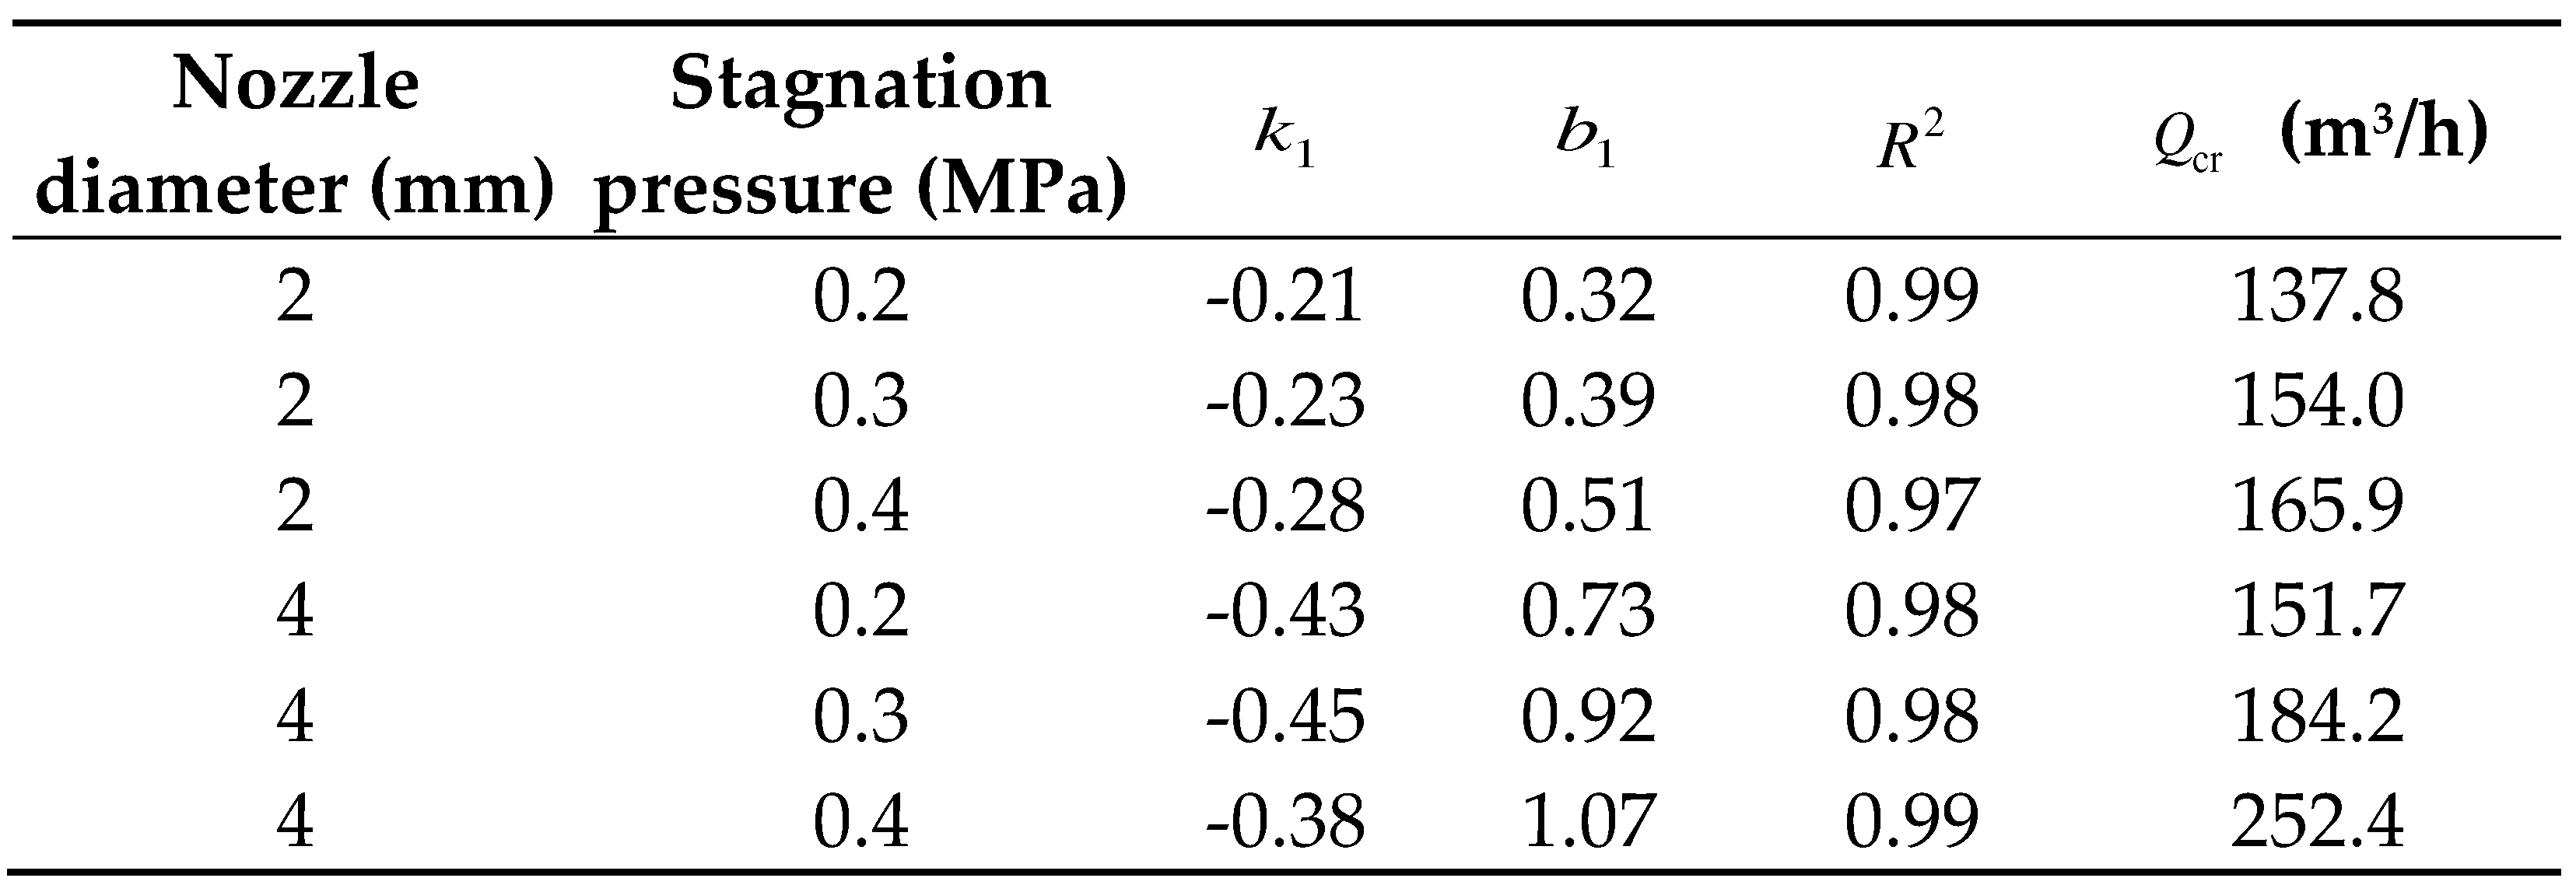
There is an approximate linear correlation between the
effective ventilation time and the ventilation flow rate in Figure 9,
which is consistent with the second hypothesis. After dimensionless processing
of the variables, the correlation is fitted as a trend line in Figure 11.
The relevant parameters of linear fitting under various experimental conditions
are listed in Table 3. And the critical
ventilation flow rate is obtained. From the value of R2, this linear
correlation is credible.
The critical ventilation flow rates under various leakage conditions are shown in Figure 12. For a given nozzle diameter, the critical ventilation flow rate expands significantly at higher stagnation pressures. Moreover, there is a positive correlation between the critical ventilation flow rate and the nozzle diameter. For the stagnation pressure of 0.4MPa, the critical ventilation flow rate under 4mm nozzle even increases by 52% relative to the 2mm nozzle. And a larger nozzle diameter brings a greater growth in critical ventilation flow rate. Strictly speaking, the risk level of leakage accident depends on the combination of nozzle diameter and stagnation pressure. At a higher risk level, the proposed analytical model can adaptively compensate the critical ventilation flow rate to ensure that the rise of ventilation intensity is always faster than that of risk level.
4. Conclusions
In the present study, accidental hydrogen leakage and ventilation experiments were carried out in a confined space, and an analytical model was proposed to determine the critical ventilation flow rate under specific leakage conditions.
The accidental hydrogen leakage is divided into high-speed
leakage stage and ventilation disposal stage. For a large amount of hydrogen
accumulated during leakage, the maximization of ventilation effect and
minimization of ventilation cost can not be achieved at the same time. Thus, in
the ventilation disposal stage, it is necessary to determine a critical
ventilation flow rate to balance the ventilation effect and ventilation cost.
In the analytical model of critical ventilation flow rate, the ventilation
effect and ventilation cost are quantified, and two hypotheses were proposed to
apply to different data. The data of the measuring point used in the study are
applicable to the second hypothesis, in which Qcr depends only on the
linear fitting parameters of t*.
The leakage blocking effect is dominant in the early stage of ventilation disposal, while the ventilation effect is dominant in the later stage, resulting in a different downward trend of concentration. With the growth of ventilation flow rate, the helium concentration dropped faster when the ventilation effect is dominant. And the peak concentration of the measuring point is positively correlated with the stagnation pressure and the nozzle diameter. The effective ventilation time is obtained under various ventilation conditions, which decreases linearly with the growth of ventilation flow rate. For a given nozzle diameter, the effect of stagnation pressure on effective ventilation time is opposite to that of ventilation flow rate.
After fitting the correlation between effective
ventilation time and ventilation flow rate, the formula of 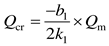 was used to
calculate the critical ventilation flow rate under different leakage
conditions. The critical ventilation flow rate expands significantly at higher
stagnation pressures and larger nozzle diameters. And the discrepancy of
critical ventilation flow rates under different nozzle diameters will be
enhanced with the gradual increase of stagnation pressure. This shows that the
model can adaptively compensate the critical ventilation flow rate for the
condition of more serious leakage. The conclusion is restricted to the second hypothesis,
and may not be appropriate for the first hypothesis applied to other scenarios.
was used to
calculate the critical ventilation flow rate under different leakage
conditions. The critical ventilation flow rate expands significantly at higher
stagnation pressures and larger nozzle diameters. And the discrepancy of
critical ventilation flow rates under different nozzle diameters will be
enhanced with the gradual increase of stagnation pressure. This shows that the
model can adaptively compensate the critical ventilation flow rate for the
condition of more serious leakage. The conclusion is restricted to the second hypothesis,
and may not be appropriate for the first hypothesis applied to other scenarios.This study is critical for determining the forced ventilation flow rate to prevent hydrogen accumulation in a confined space. However, to obtain more obvious concentration variations, only the first measuring point near the nozzle was selected as the data source. In fact, the data of local measuring points are difficult to represent the overall characteristic concentration level of the space. Therefore, the model allows numerical simulation as data input to obtain more accurate output results of critical ventilation flow rate by using concentration parameters of the numerical calculation domain that can better characterize the spatial concentration level.
Author Contributions
Conceptualization, J.Y. and X.S.; methodology, J.Y. and X.S.; formal analysis, X.S.; data curation, J.S.; writing—original draft preparation, J.Y.; writing—review and editing, J.Y. and X.S.; visualization, J.Y. and J.S.; supervision, X.C. and X.S.; project administration, X.S. and X.C.; funding acquisition, X.S.. All authors have read and agreed to the published version of the manuscript.
Funding
This work was supported by “the National Key R&D Program of China” (No. 2021YFB4000901), “Hubei Province unveiling project” (No. 2022BEC024), “Guangdong Basic and Applied Basic Research Foundation” (No. 2023A1515012080), “National Natural Science Foundation of China” (No. 12302443), “the Fundamental Research Funds for the Central Universities” (No. 223161001), “Opening Fund of the Key Laboratory of Civil Aviation Thermal Disaster Prevention and Emergency of Civil Aviation University of China” (No. RZH2021-KF-05) and “Opening Fund of the State Key Laboratory of Fire Science of University of Science and Technology of China” (No. HZ2022-KF09).
Data Availability Statement
Data sharing not applicable.
Conflicts of Interest
The authors declare no conflict of interest.
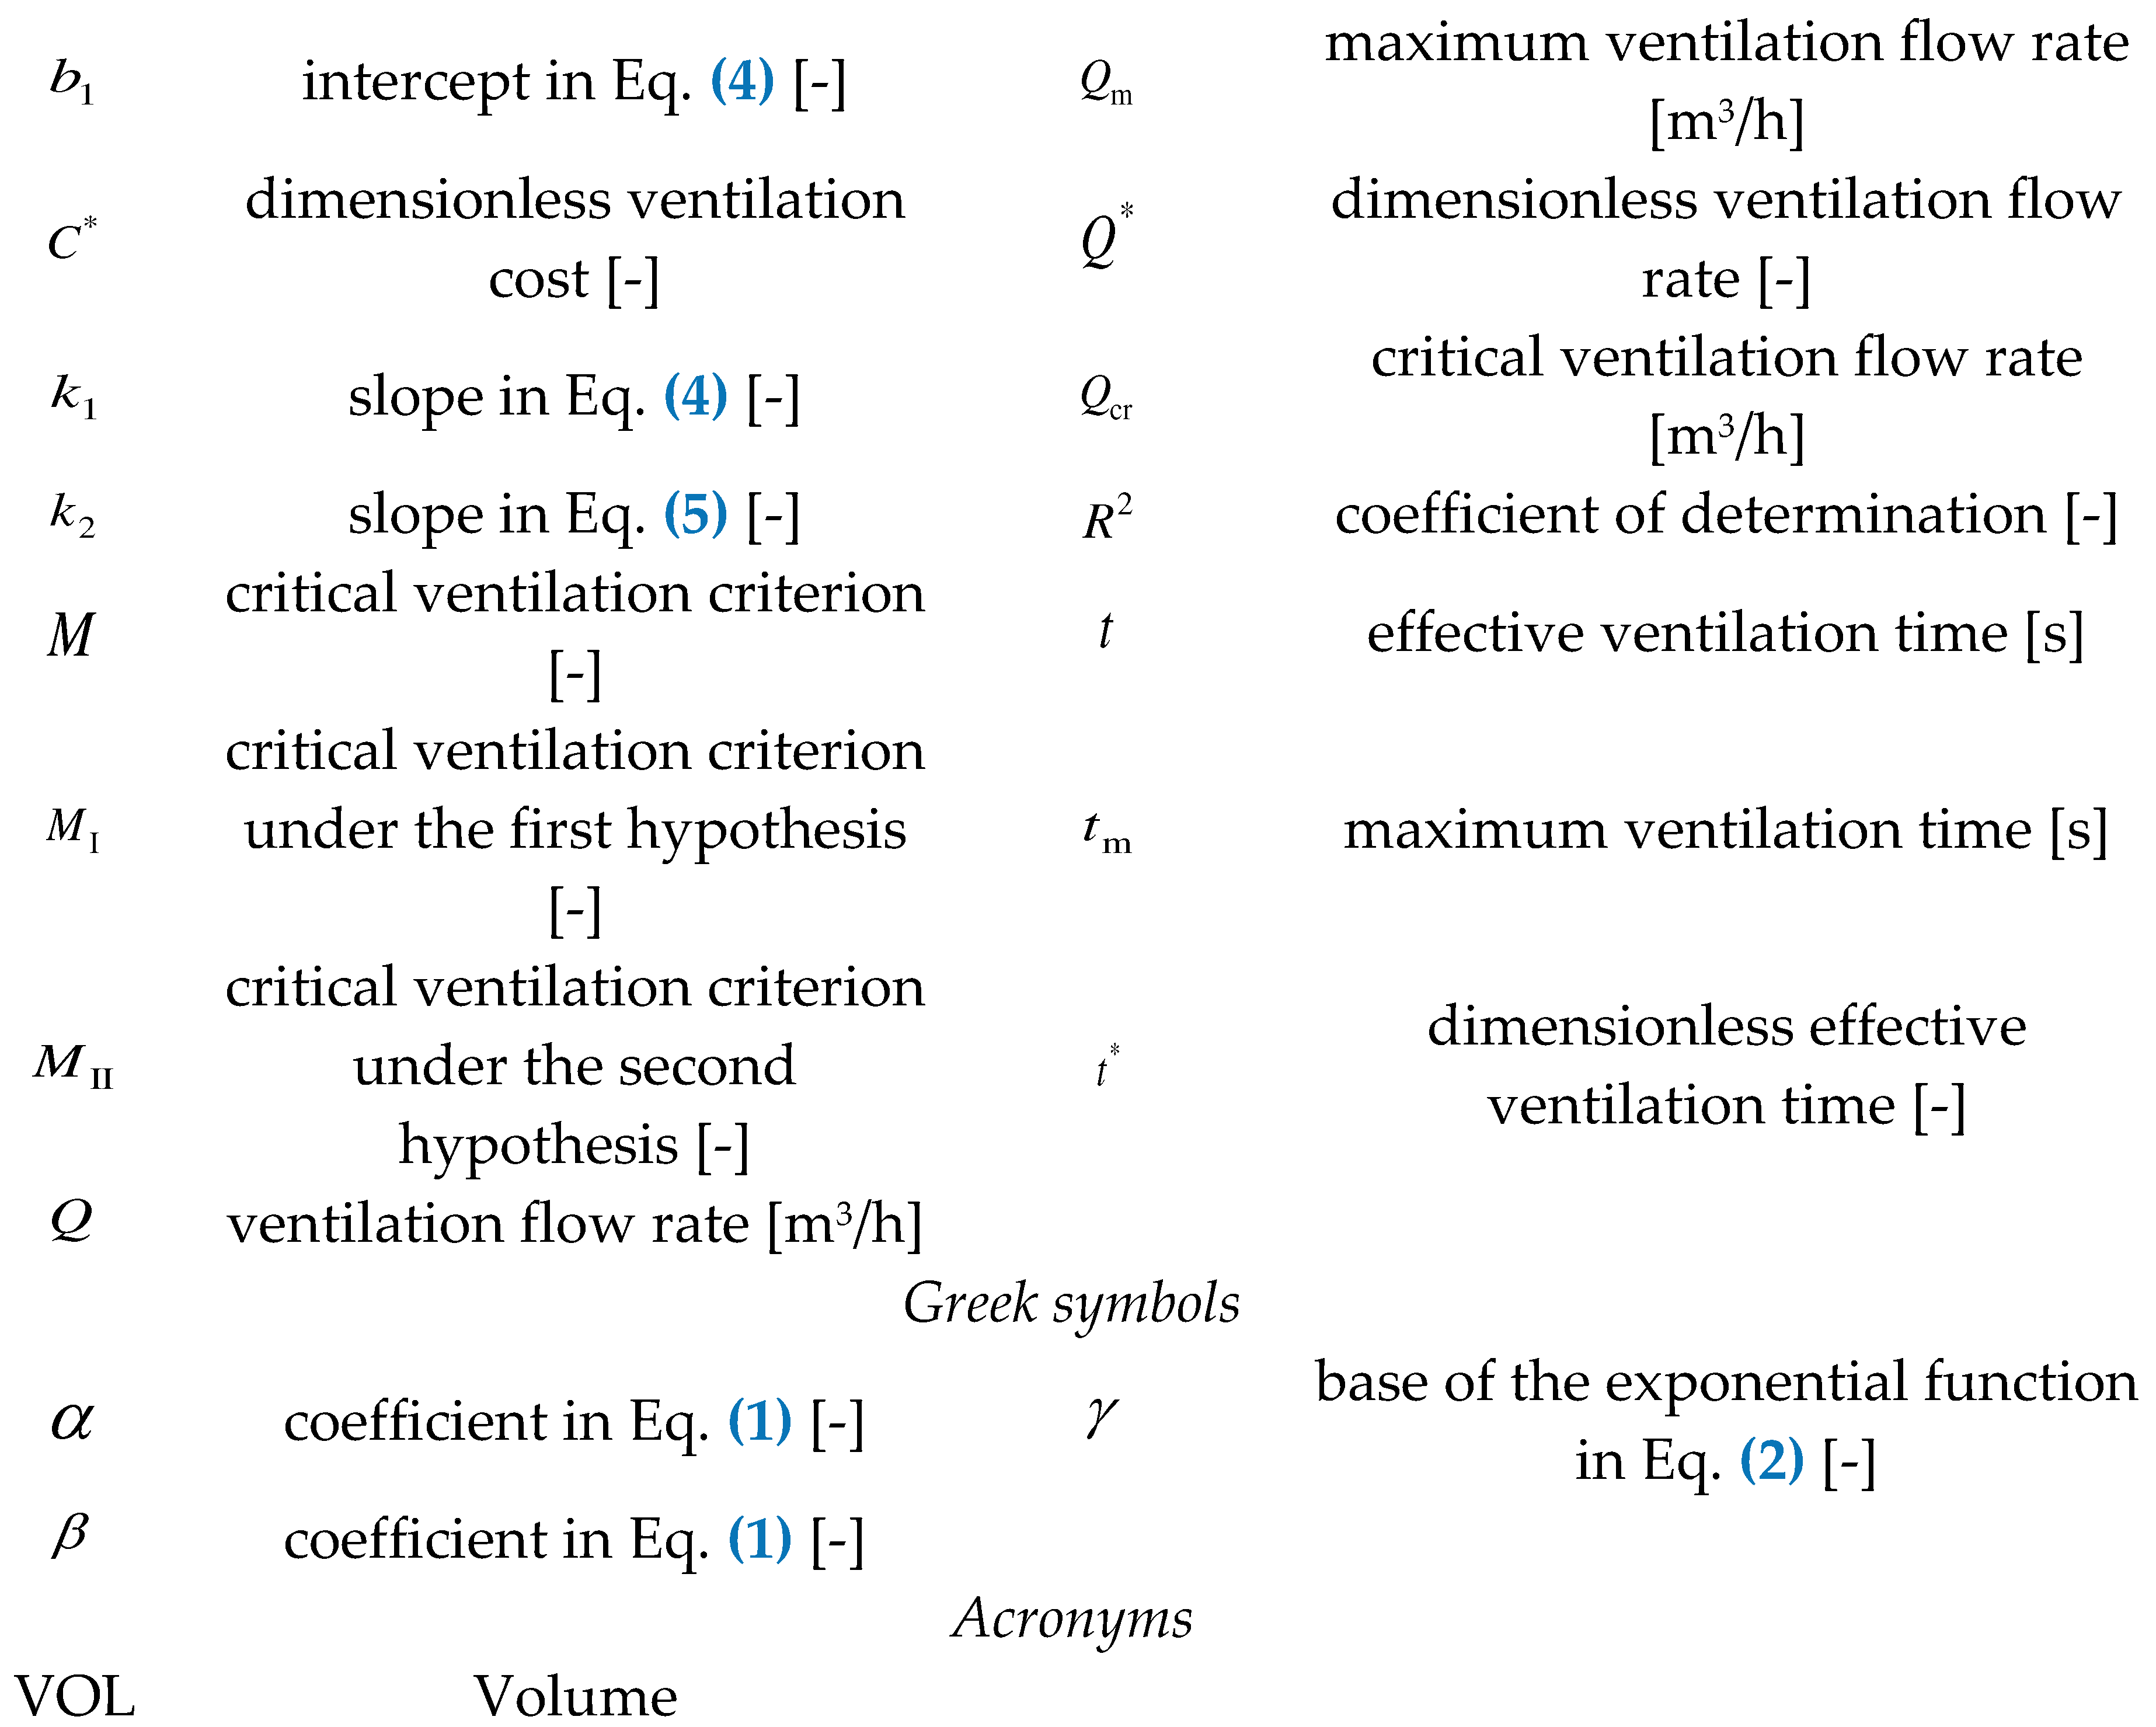
Nomenclature
References
- Abohamzeh E, Salehi F, Sheikholeslami M, Abbassi R, Khan F. Review of hydrogen safety during storage, transmission, and applications processes. J Loss Prevent Proc 2021;72:104569. [CrossRef]
- Ogden JM, Steinbugler MM, Kreutz TG. A comparison of hydrogen, methanol and gasoline as fuels for fuel cell vehicles: implications for vehicle design and infrastructure development. J Power Sources 1999;79(2):143-68. [CrossRef]
- Usman MR. Hydrogen storage methods: Review and current status. Renewable and Sustainable Energy Reviews 2022;167:112743. [CrossRef]
- Cadwallader LC, Herring JS. Safety Issues with Hydrogen as a Vehicle Fuel. United States; 1999.
- Molkov V. Hydrogen Safety Engineering: The State-of-the-Art and Future Progress. Oxford: Elsevier; 20.
- Matsuura K, Kanayama H, Tsukikawa H, Inoue M. Numerical simulation of leaking hydrogen dispersion behavior in a partially open space. Int J Hydrogen Energ 2008;33(1):240-7. [CrossRef]
- Salva JA, Tapia E, Iranzo A, Pino FJ, Cabrera J, Rosa F. Safety study of a hydrogen leak in a fuel cell vehicle using computational fluid dynamics. Int J Hydrogen Energ 2012;37(6):5299-306. [CrossRef]
- Hajji Y, Bouteraa M, El Cafsi A, Belghith A, Bournot P, Kallel F. Dispersion and behavior of hydrogen during a leak in a prismatic cavity. Int J Hydrogen Energ 2014;39(11):6111-9. [CrossRef]
- Hajji Y, Bouteraa M, Elcafsi A, Belghith A, Bournot P, Kallel F. Natural ventilation of hydrogen during a leak in a residential garage. Renew Sust Energ Rev 2015;50:810-8. [CrossRef]
- Lee J, Cho S, Park C, Cho H, Moon I. Numerical analysis of hydrogen ventilation in a confined facility with various opening sizes, positions and leak quantities. 27th European Symposium on Computer-Aided Process Engineering (ESCAPE). 40A. Barcelona, SPAIN: Elsevier Science Bv; 2017:559-64.
- Zhang XL, Wang QB, Hou XL, Li YJ, Miao Y, Li K, et al. Effect of the position and the area of the vent on the hydrogen dispersion in a naturally ventilated cubiod space with one vent on the side wall. Int J Hydrogen Energ 2022;47(14):9071-81. [CrossRef]
- Brennan S, Bengaouer A, Carcassi M, Cerchiara G, Evans G, Friedrich A, et al. TOWARDS MINIMISING HAZARDS IN HYDROGEN AND FUEL CELL STATIONARY APPLICATIONS: KEY FINDINGS OF MODELLING AND EXPERIMENTAL WORK IN THE HYPER PROJECT. 21st Hazards Symposium - Process Safety and Environmental Protection. Manchester, ENGLAND: Inst Chemical Engineers; 2009:399-410.
- Matsuura K, Nakano M, Ishimoto J. Sensing-based risk mitigation control of hydrogen dispersion and accumulation in a partially open space with low-height openings by forced ventilation. Int J Hydrogen Energ 2012;37(2):1972-84. [CrossRef]
- Dadashzadeh M, Ahmad A, Khan F. Dispersion modelling and analysis of hydrogen fuel gas released in an enclosed area: A CFD-based approach. Fuel 2016;184:192-201. [CrossRef]
- Lee J, Cho S, Cho H, Cho S, Lee I, Moon I, et al. CFD modeling on natural and forced ventilation during hydrogen leaks in a pressure regulator process of a residential area. Process Saf Environ 2022;161:436-46. [CrossRef]
- Brady K, Sung CJ, T'Ien J. Dispersion and catalytic ignition of hydrogen leaks within enclosed spaces. Int J Hydrogen Energ 2012;37(13):10405-15. [CrossRef]
- Hajji Y, Bouteraa M, Elcafsi A, Bournot P. Green hydrogen leaking accidentally from a motor vehicle in confined space: A study on the effectiveness of a ventilation system. Int J Energ Res 2021;45(13):18935-43. [CrossRef]
- Papanikolaou E, Venetsanos AG, Cerchiara GM, Carcassi M, Markatos N. CFD simulations on small hydrogen releases inside a ventilated facility and assessment of ventilation efficiency. Int J Hydrogen Energ 2011;36(3):2597-605. [CrossRef]
- Matsuura K, Nakano M, Ishimoto J. The sensing-based adaptive risk mitigation of leaking hydrogen in a partially open space. Int J Hydrogen Energ 2009;34(20):8770-82. [CrossRef]
- Huang T, Zhao MB, Ba QX, Christopher DM, Li XF. Modeling of hydrogen dispersion from hydrogen fuel cell vehicles in an underground parking garage. Int J Hydrogen Energ 2022;47(1):686-96. [CrossRef]
- Prasad K, Yang J. Vertical release of hydrogen in a partially enclosed compartment: Role of wind and buoyancy. Int J Hydrogen Energ 2011;36(1):1094-106. [CrossRef]
- Brennan S, Bengaouer A, Carcassi M, Cerchiara G, Evans G, Friedrich A, et al. Hydrogen and fuel cell stationary applications: Key findings of modelling and experimental work in the HYPER project. Int J Hydrogen Energ 2011;36(3):2711-20. [CrossRef]
- Mylonopoulos F, Boulougouris E, Trivyza NL, Priftis A, Cheliotis M, Wang HB, et al. Hydrogen vs. Batteries: Comparative Safety Assessments for a High-Speed Passenger Ferry. Appl Sci-Basel 2022;12(6):24. [CrossRef]
- Ekoto IW, Houf WG, Evans GH, Merilo EG, Groethe MA. Experimental investigation of hydrogen release and ignition from fuel cell powered forklifts in enclosed spaces. Int J Hydrogen Energ 2012;37(22):17446-56. [CrossRef]
- Prasad K, Pitts W, Yang JA. Effect of wind and buoyancy on hydrogen release and dispersion in a compartment with vents at multiple levels. Int J Hydrogen Energ 2010;35(17):9218-31. [CrossRef]
- Prasad K. High-pressure release and dispersion of hydrogen in a partially enclosed compartment: Effect of natural and forced ventilation. Int J Hydrogen Energ 2014;39(12):6518-32.
- Matsuura K. Effects of the geometrical configuration of a ventilation system on leaking hydrogen dispersion and accumulation. Int J Hydrogen Energ 2009;34(24):9869-78. [CrossRef]
- Xie H, Li XF, Christopher DM. Emergency blower ventilation to disperse hydrogen leaking from a hydrogen-fueled vehicle. Int J Hydrogen Energ 2015;40(25):8230-8. [CrossRef]
- Gitushi KM, Blaylock ML, Klebanoff LE. Hydrogen gas dispersion studies for hydrogen fuel cell vessels II: Fuel cell room releases and the influence of ventilation. Int J Hydrogen Energ 2022;47(50):21492-505. [CrossRef]
- Matsuura K, Nakano M, Ishimoto J. Acceleration of hydrogen forced ventilation after leakage ceases in a partially open space. Int J Hydrogen Energ 2012;37(9):7940-9. [CrossRef]
- Matsuura K, Nakano M, Ishimoto J. Dynamic restriction mechanism for the upper limit of exhaust flow rates in the real-time sensing-based forced ventilation control of leaking hydrogen. Int J Hydrogen Energ 2015;40(12):4401-11. [CrossRef]
- Matsuura K, Nakano M, Ishimoto J. Forced ventilation for sensing-based risk mitigation of leaking hydrogen in a partially open space. Int J Hydrogen Energ 2010;35(10):4776-86. [CrossRef]
Figure 1.
Schematic diagram of the experimental platform.

Figure 2.
Monitoring principle of the helium sensors.
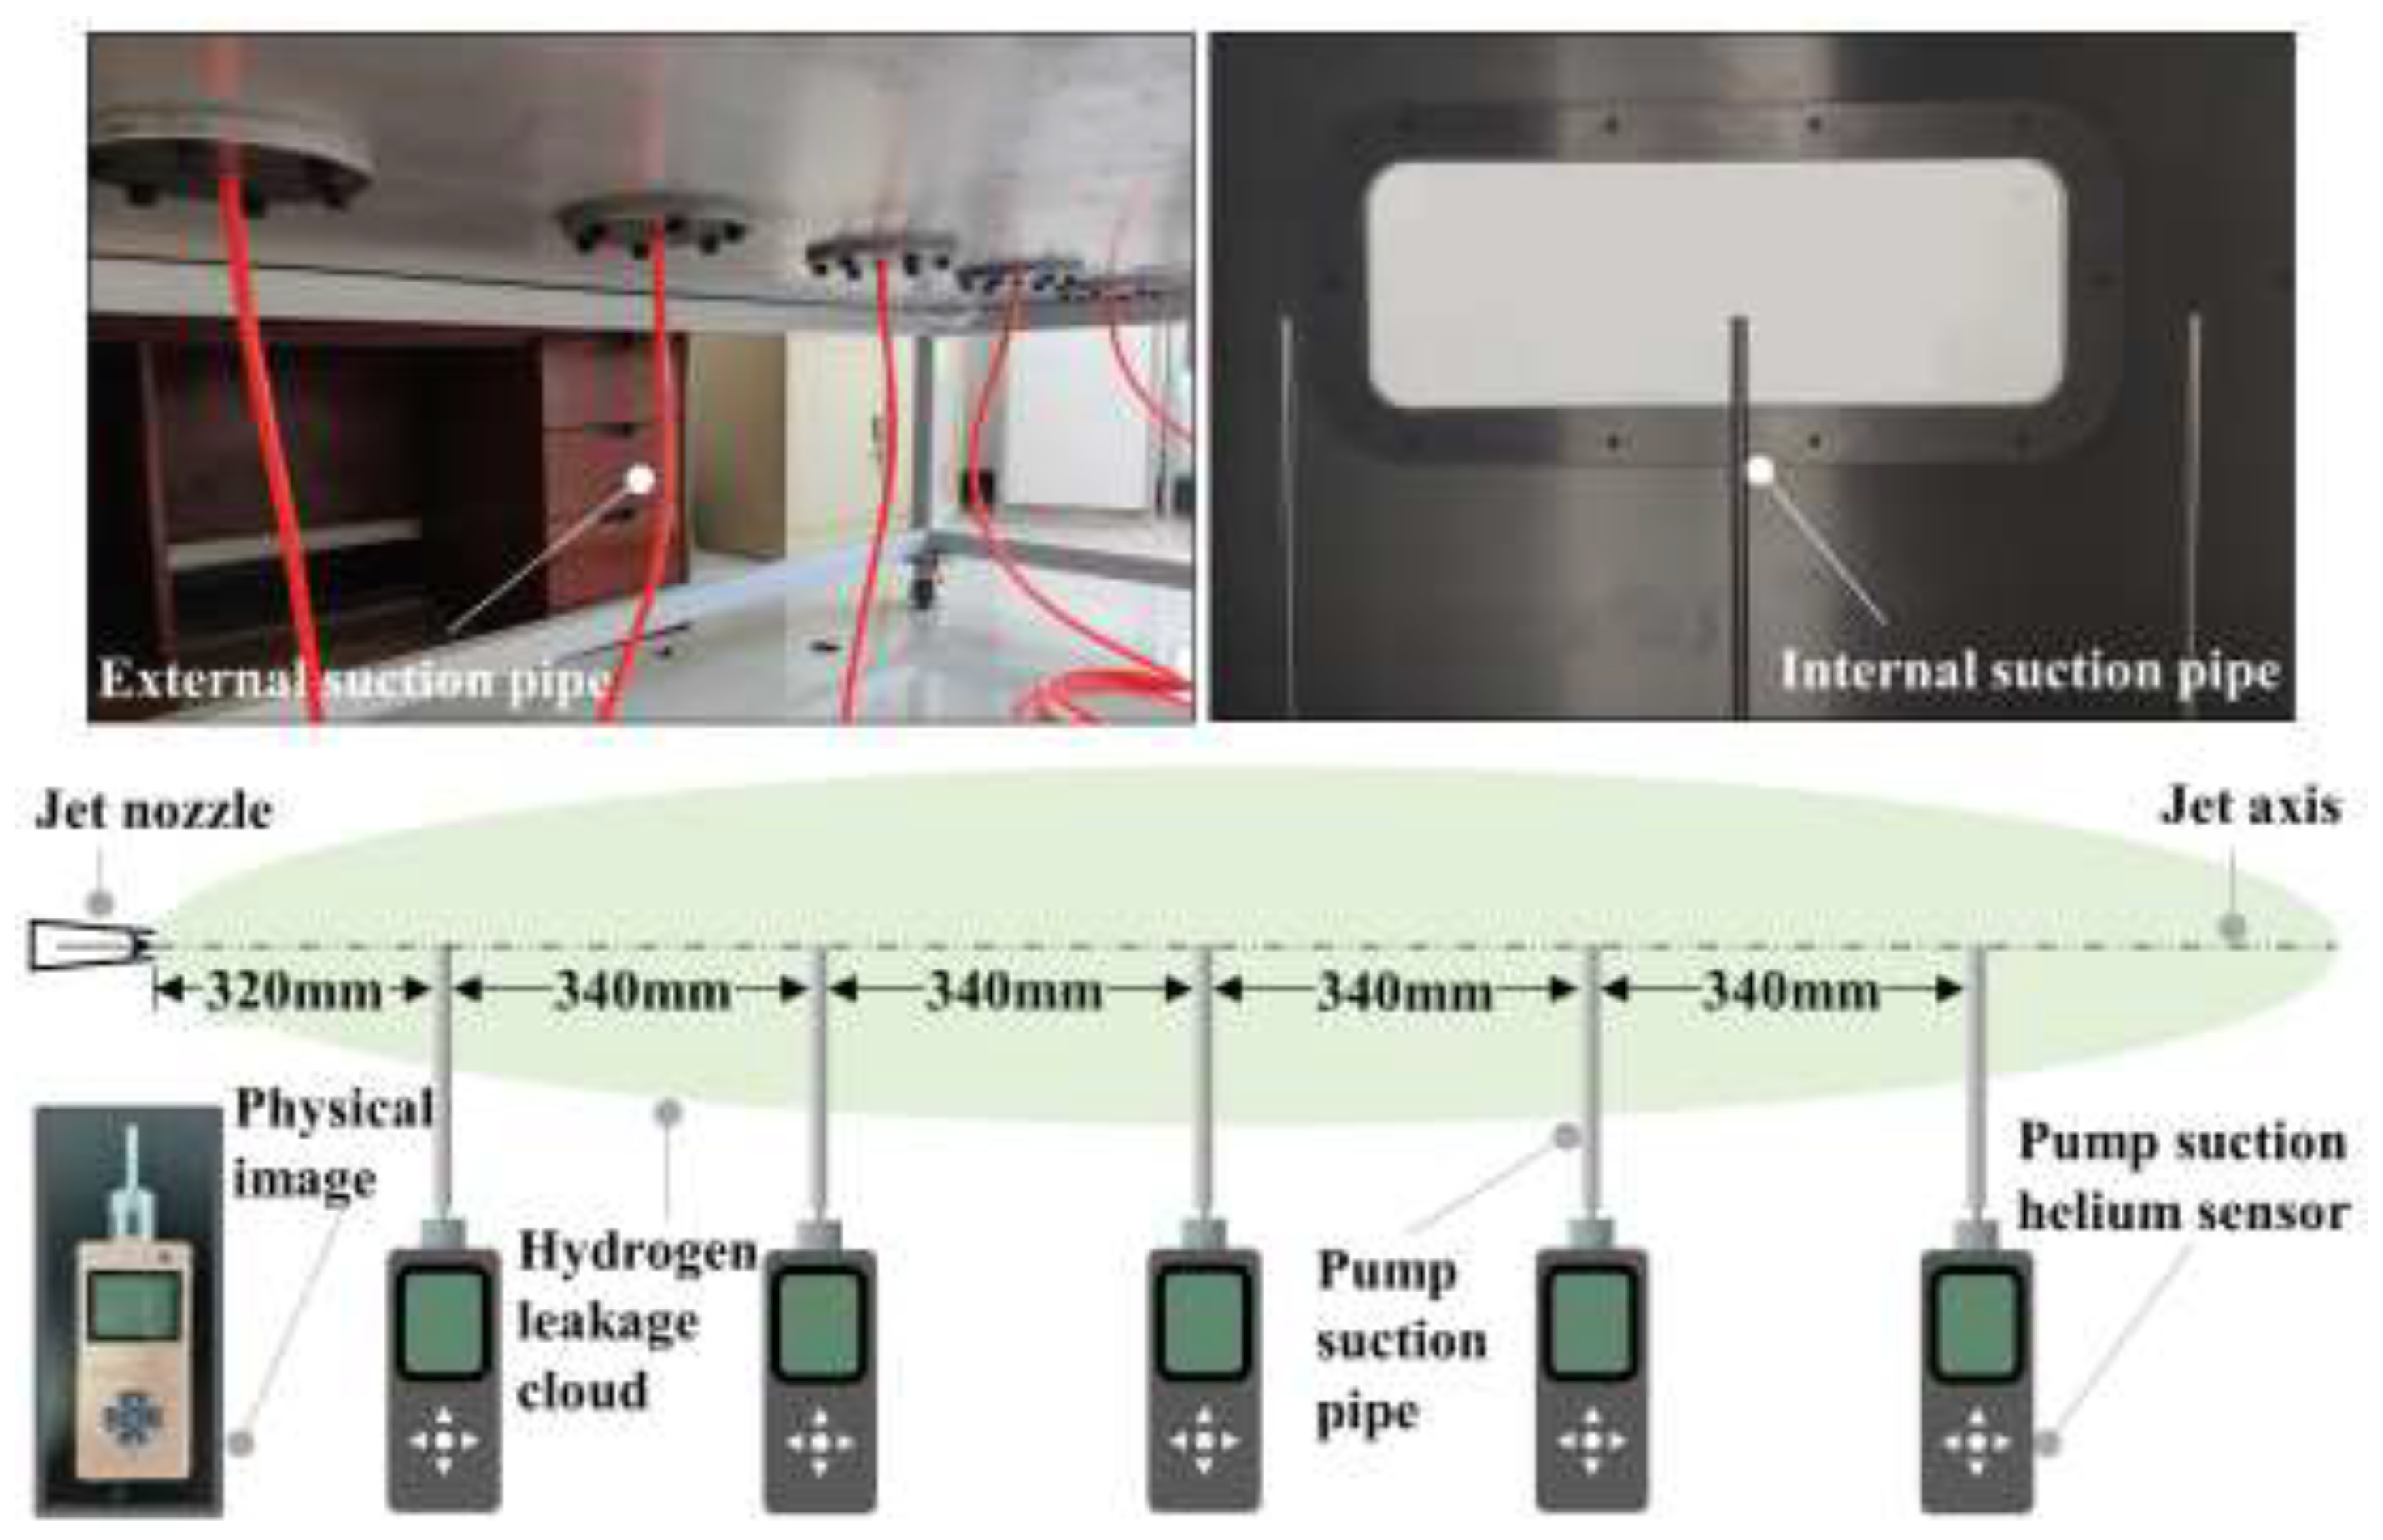
Figure 3.
The schematic diagram of the main solution procedures.

Figure 4.
Variation trend of related variables depending on ventilation flow rate: Type I.
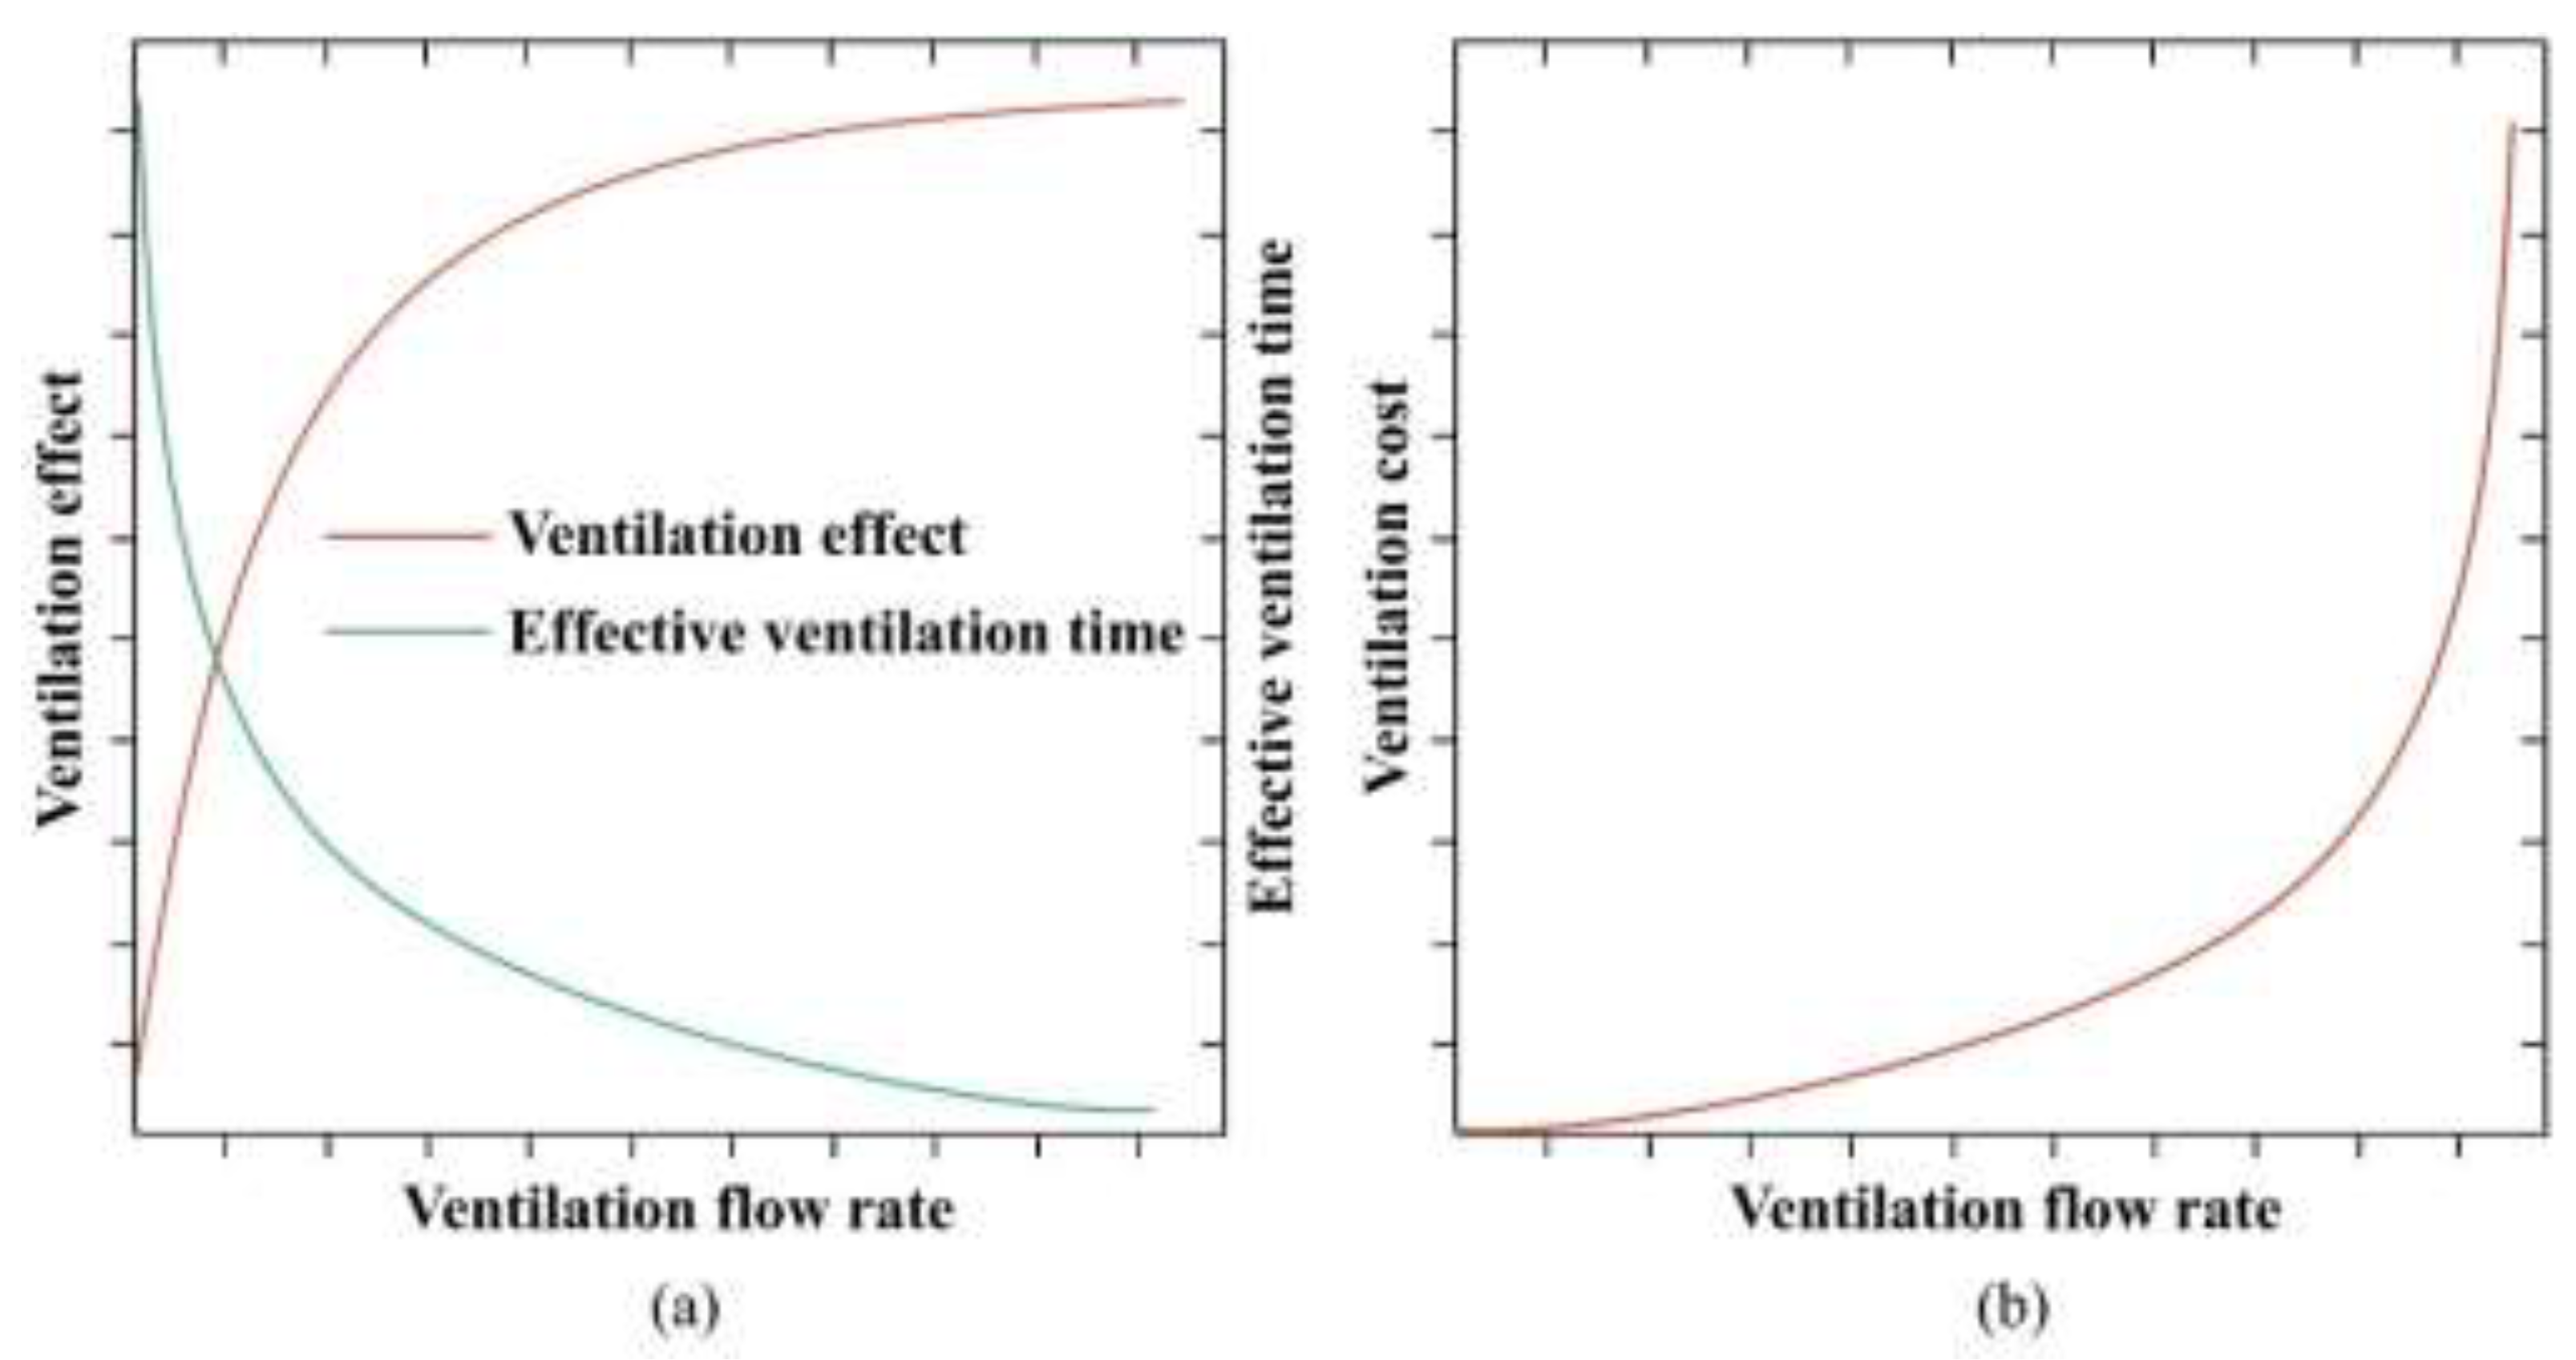
Figure 5.
Variation trend of related variables depending on ventilation flow rate: Type II.
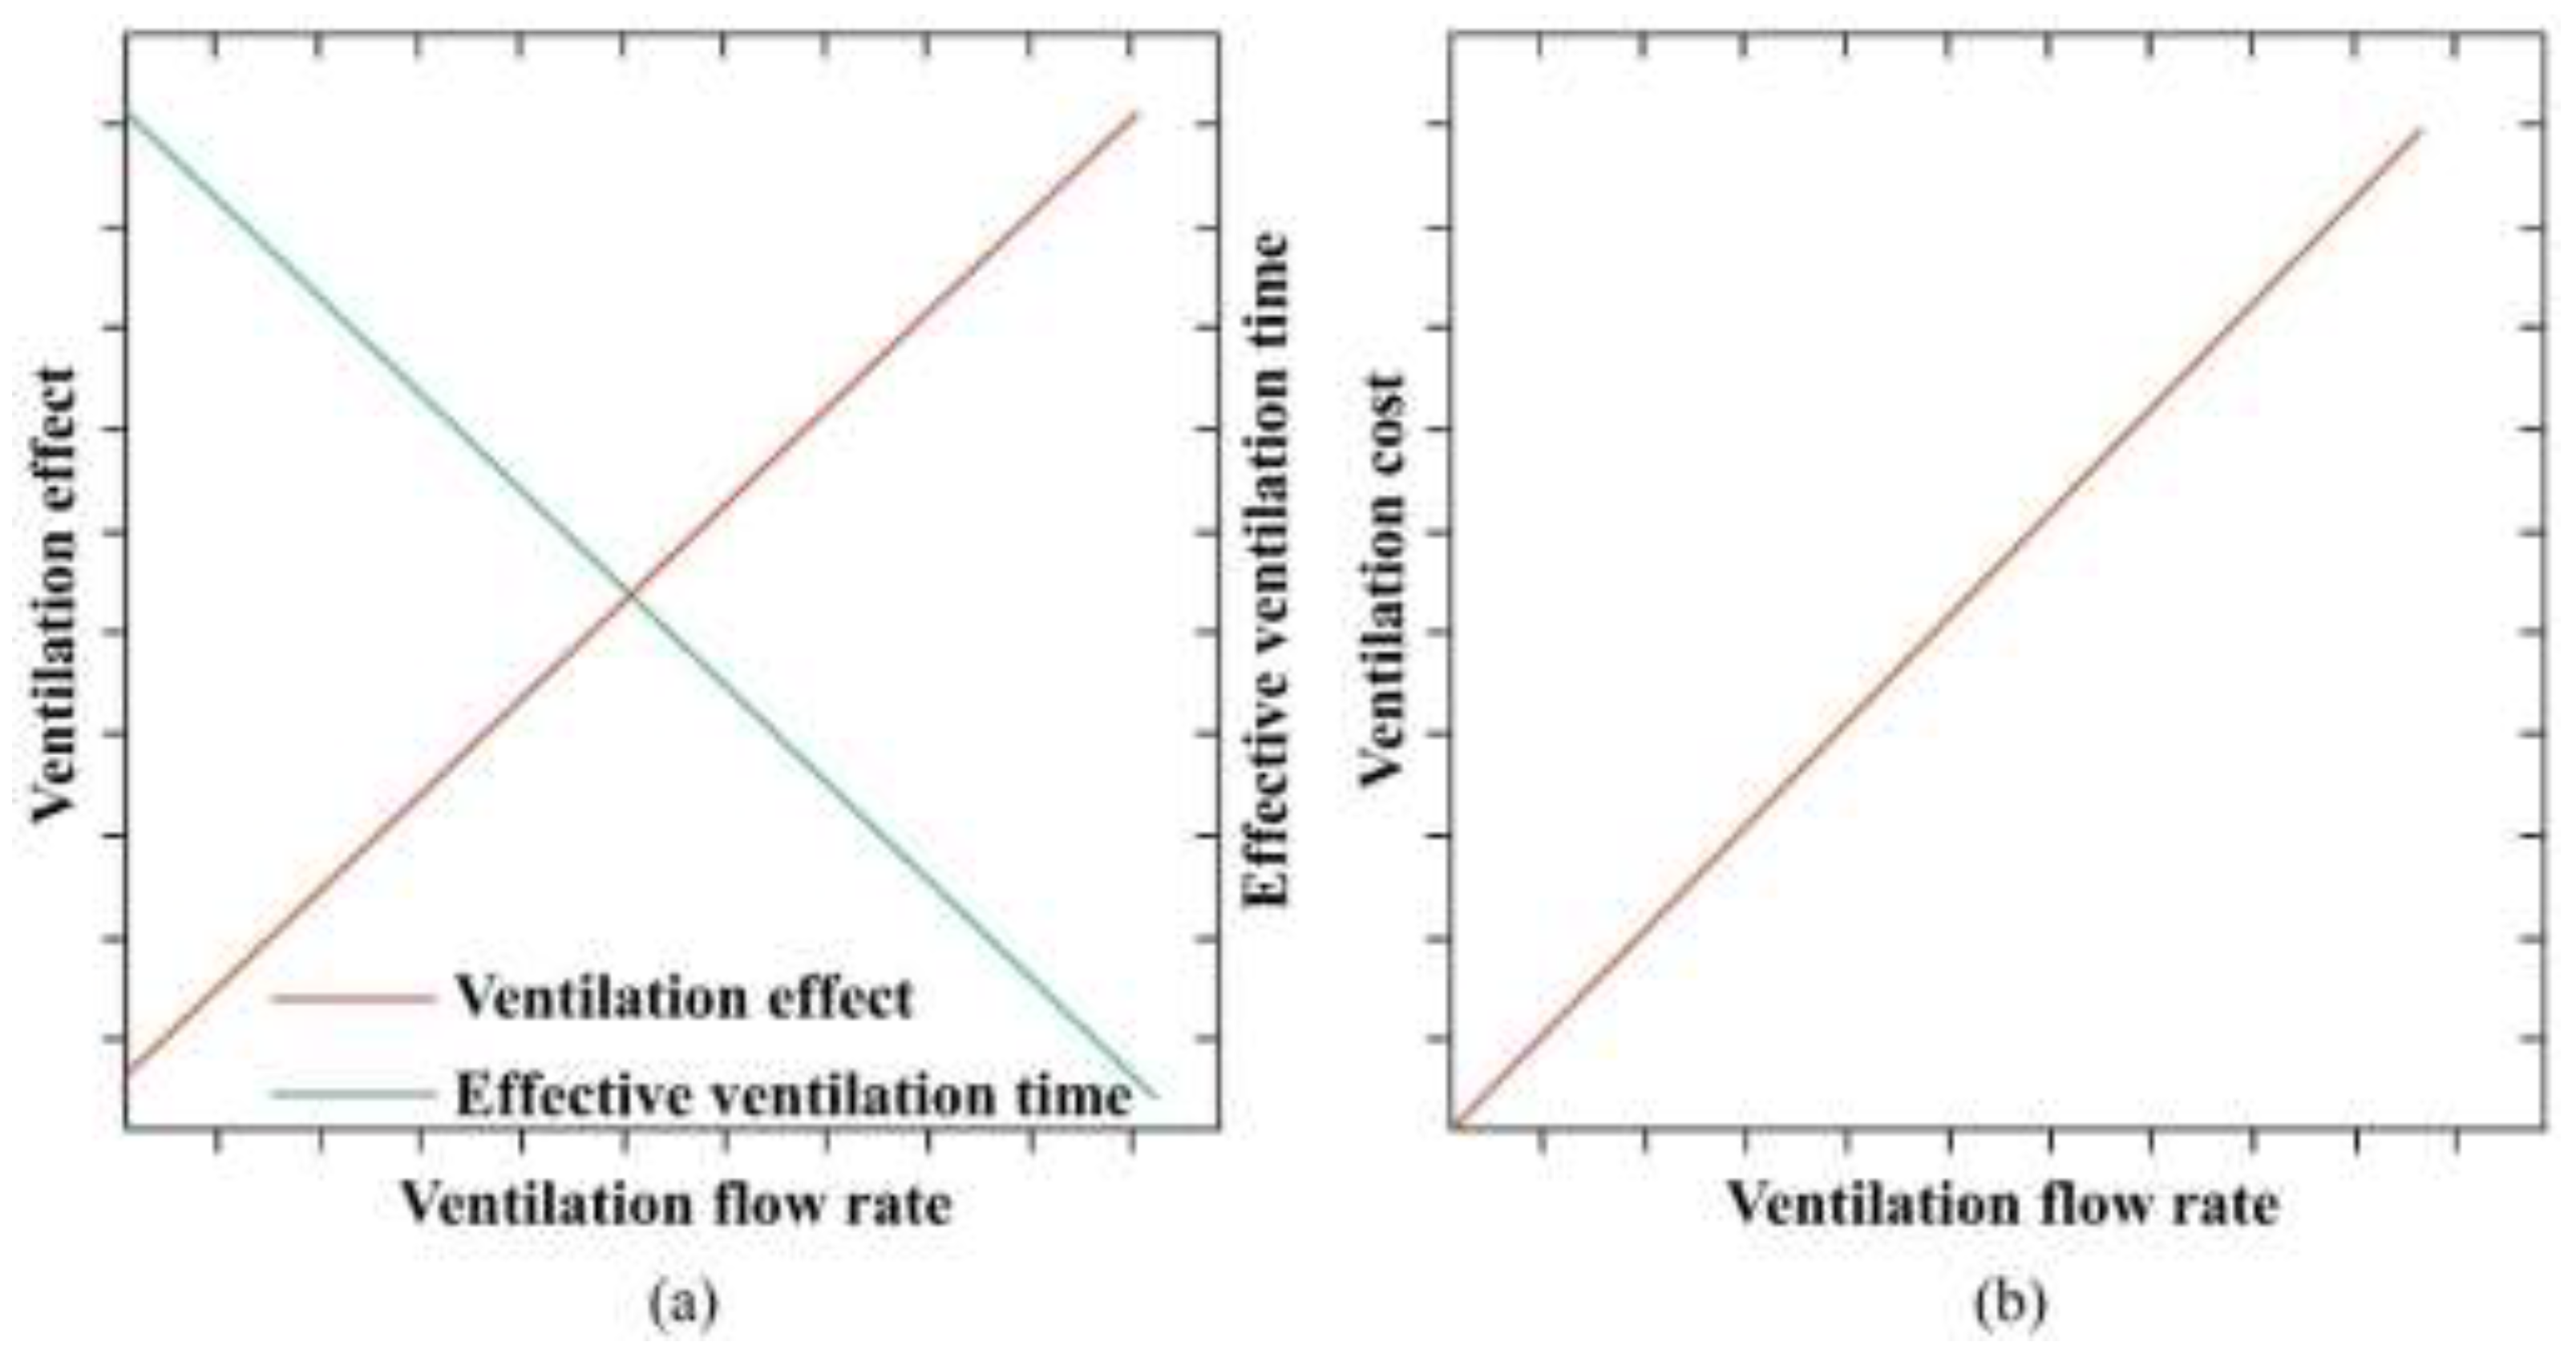
Figure 6.
The trend of critical ventilation criterion function (Type I).
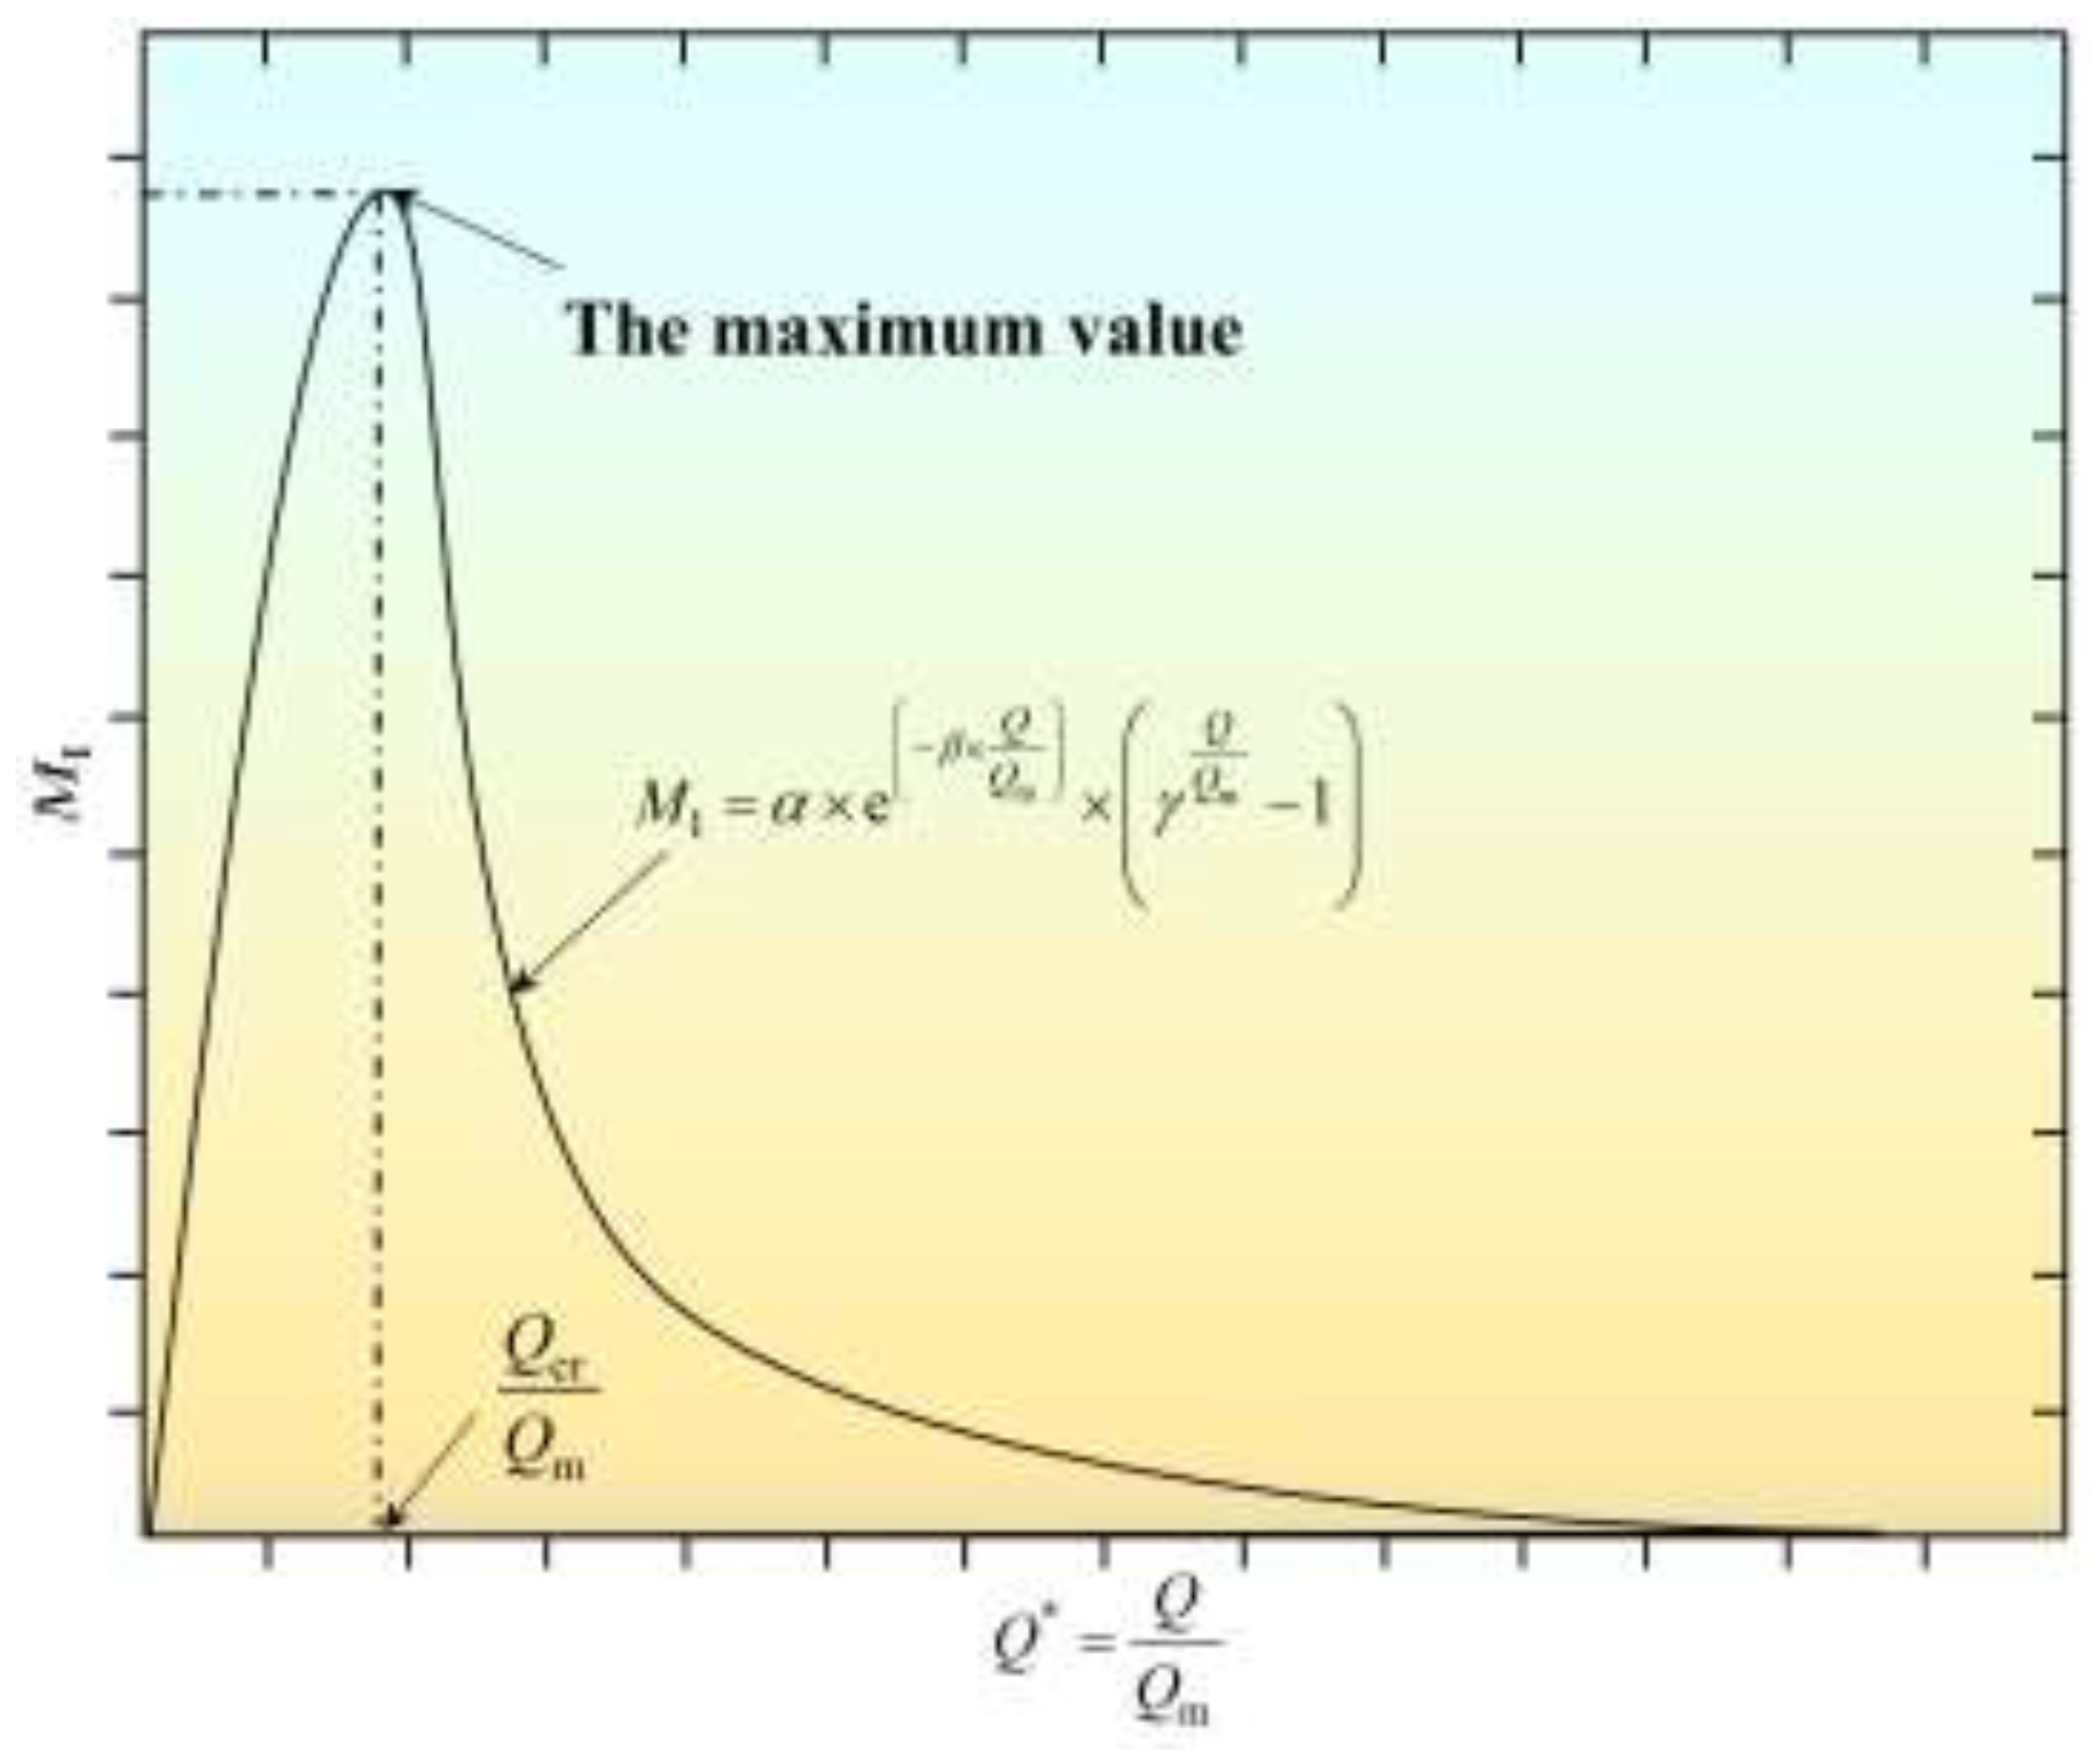
Figure 7.
The trend of critical ventilation criterion function (Type II).
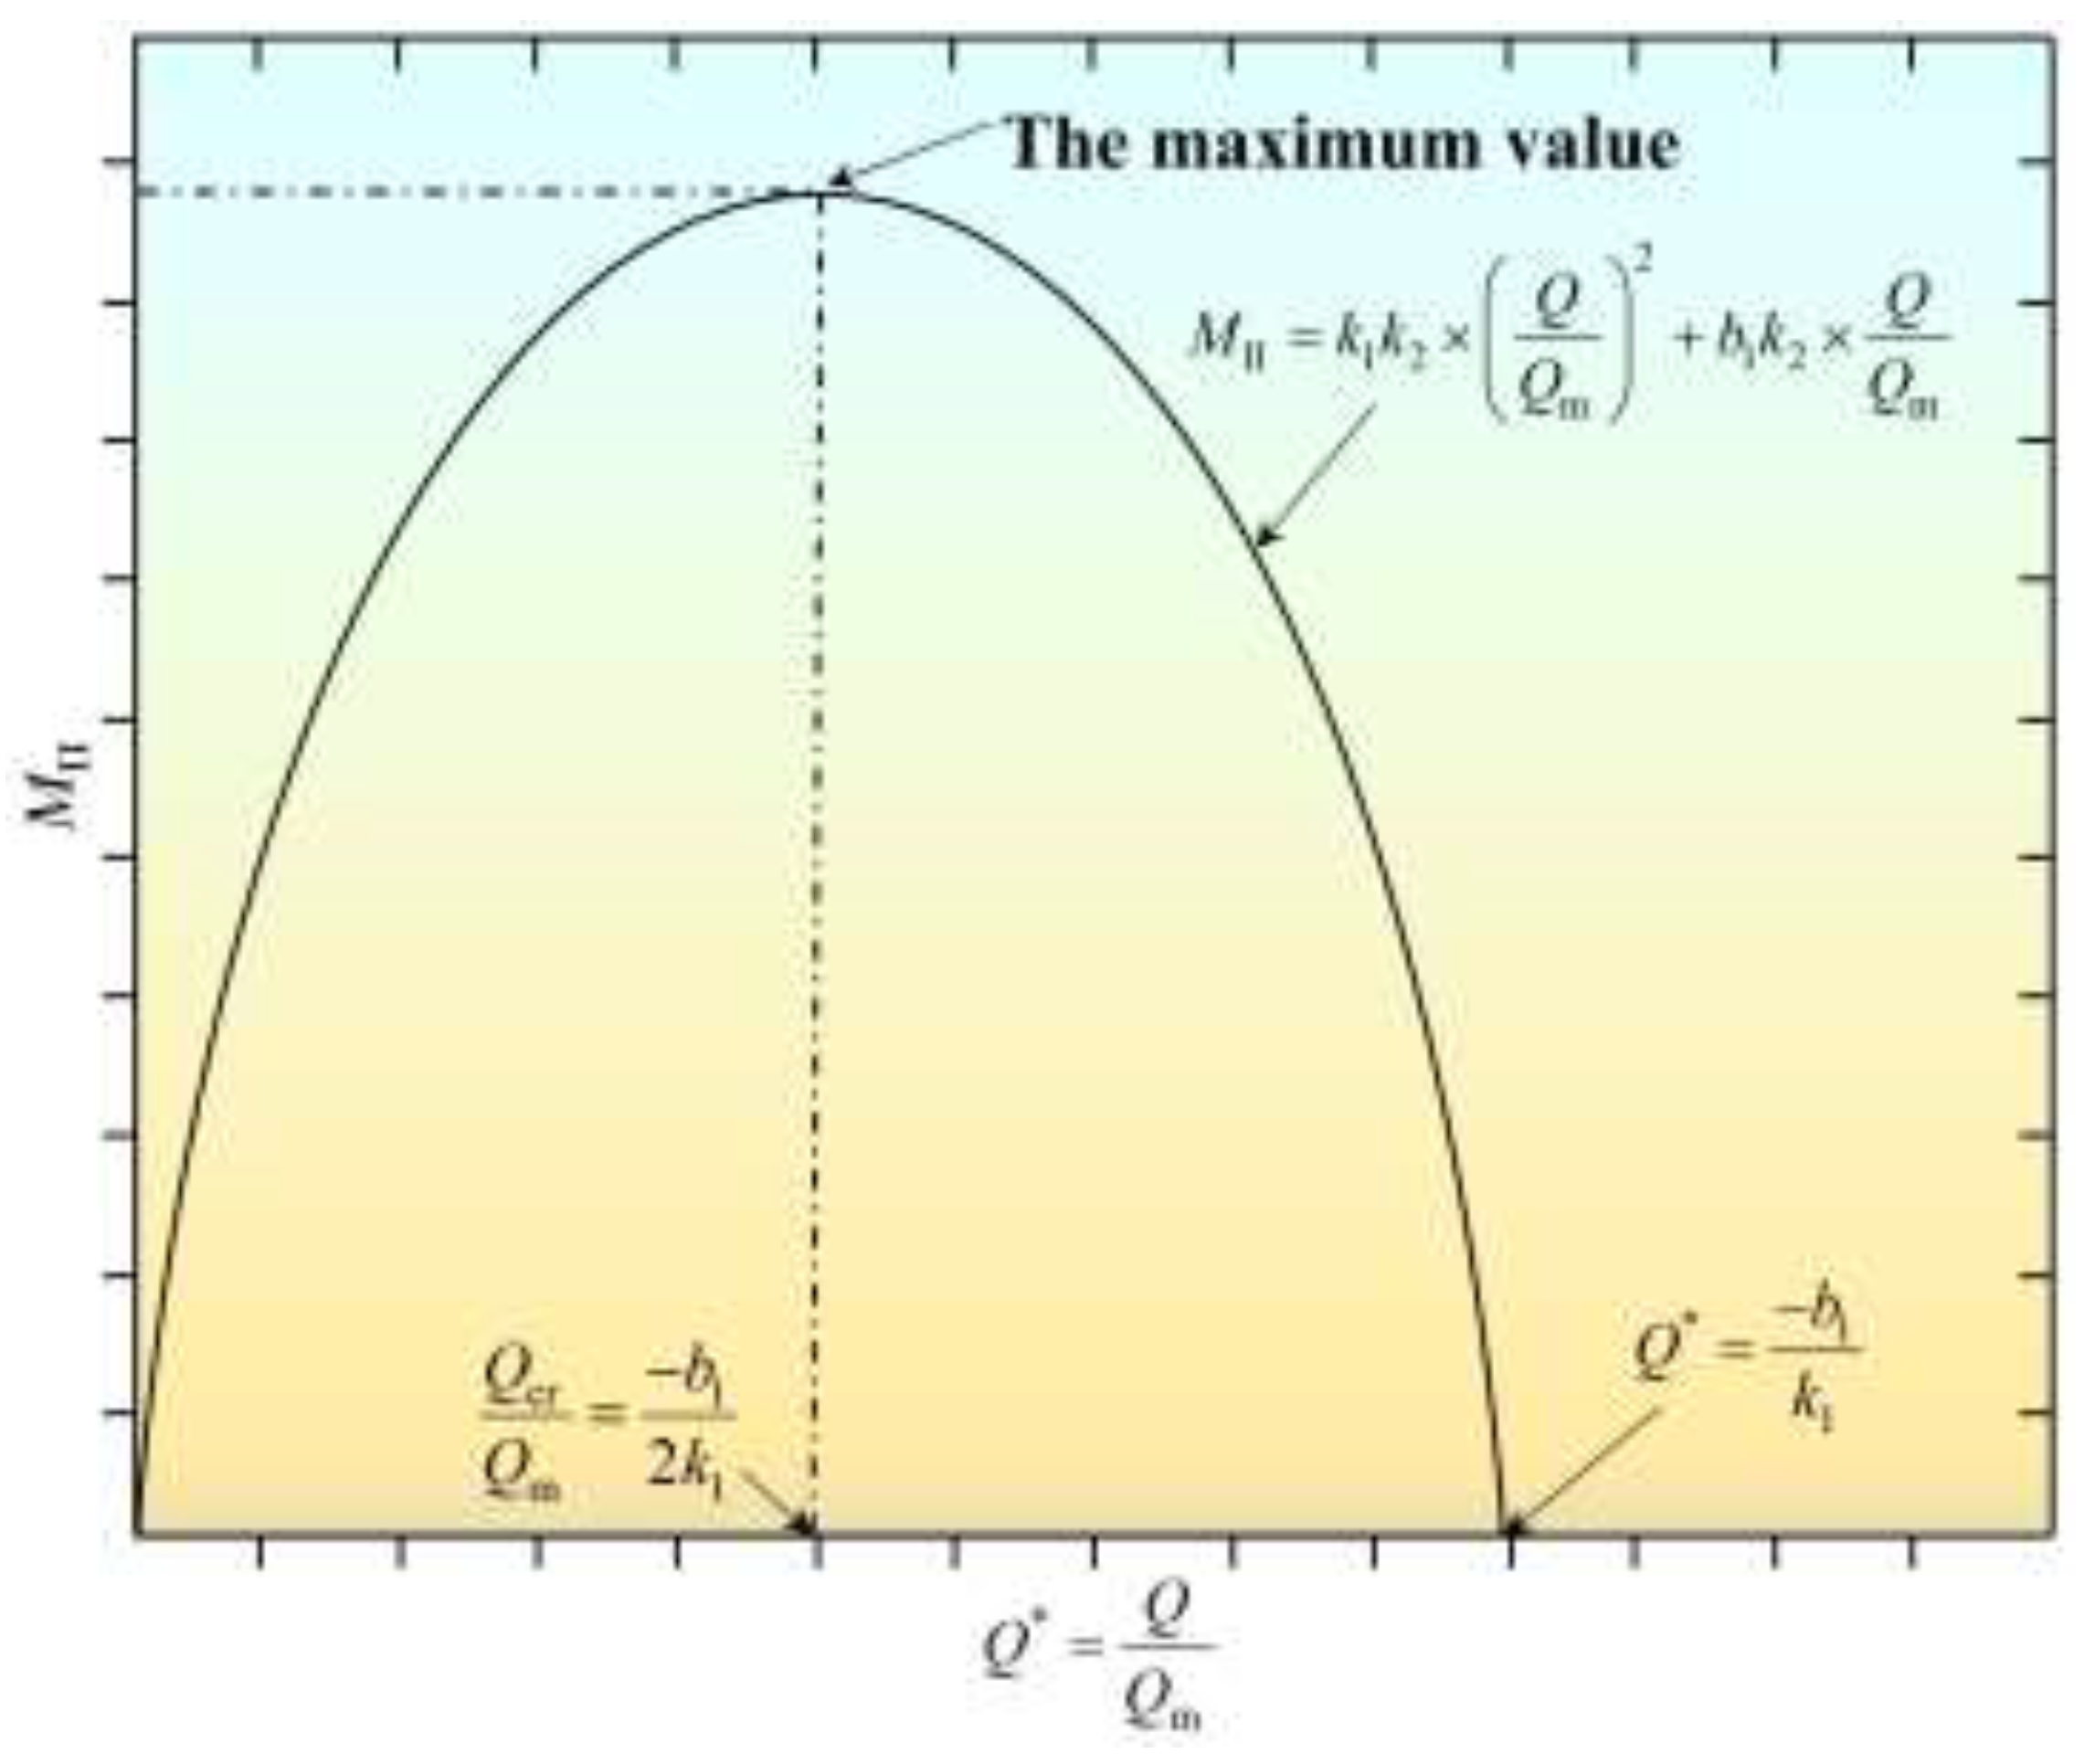
Figure 8.
Time history of helium volume fraction at the measuring point under different stagnation pressures and nozzle diameters.
Figure 8.
Time history of helium volume fraction at the measuring point under different stagnation pressures and nozzle diameters.

Figure 9.
Dependence of effective ventilation time on ventilation flow rate under different experimental conditions.
Figure 9.
Dependence of effective ventilation time on ventilation flow rate under different experimental conditions.
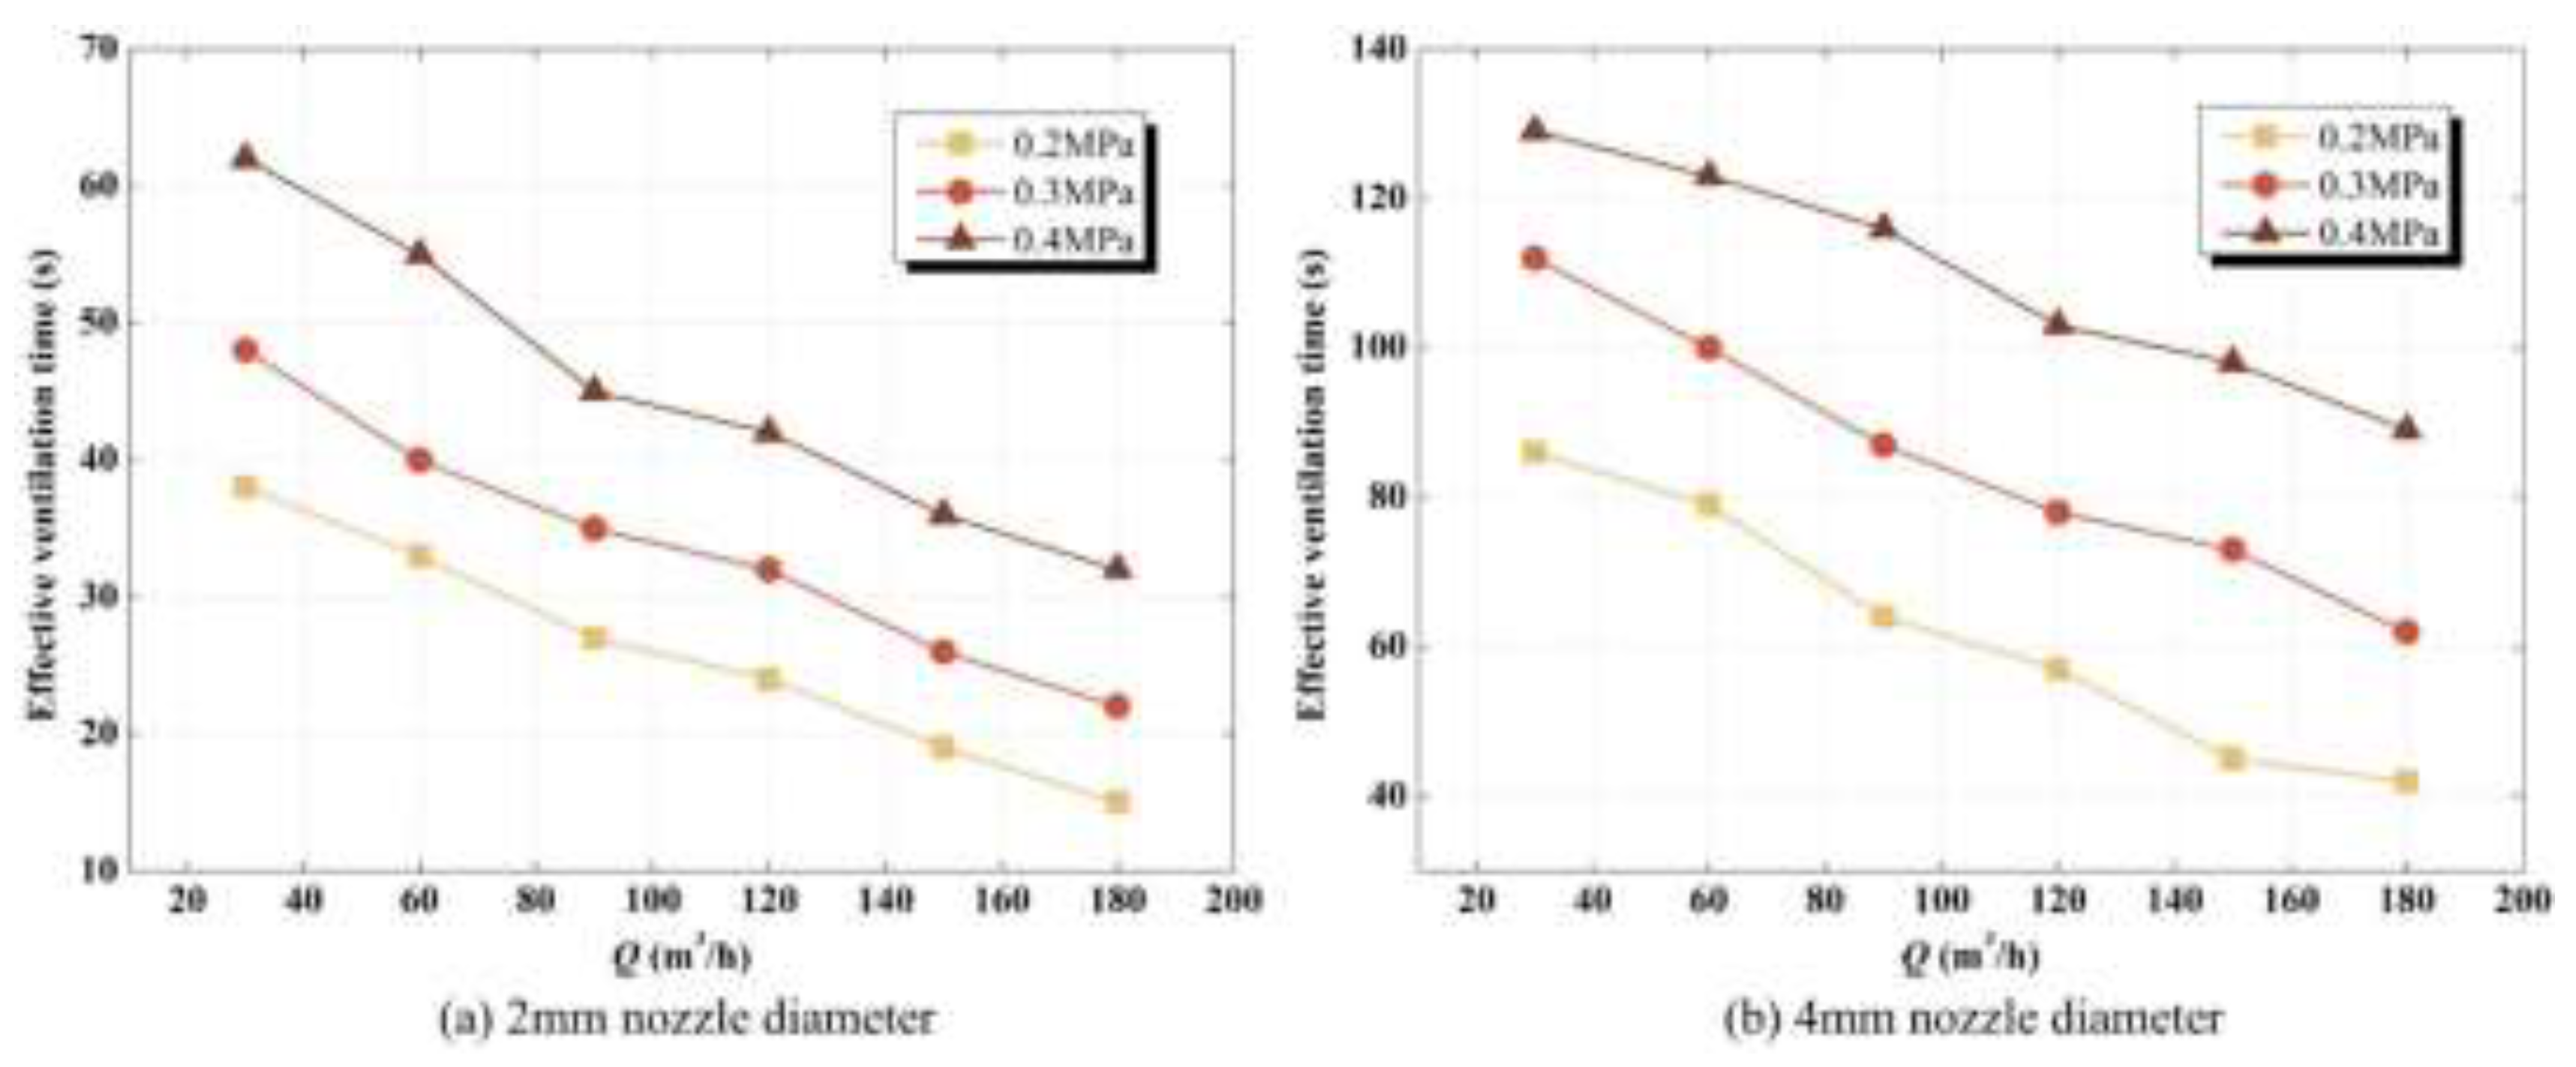
Figure 10.
Cloud map distribution of effective ventilation time under the constraint of stagnation pressure and ventilation flow rate.
Figure 10.
Cloud map distribution of effective ventilation time under the constraint of stagnation pressure and ventilation flow rate.
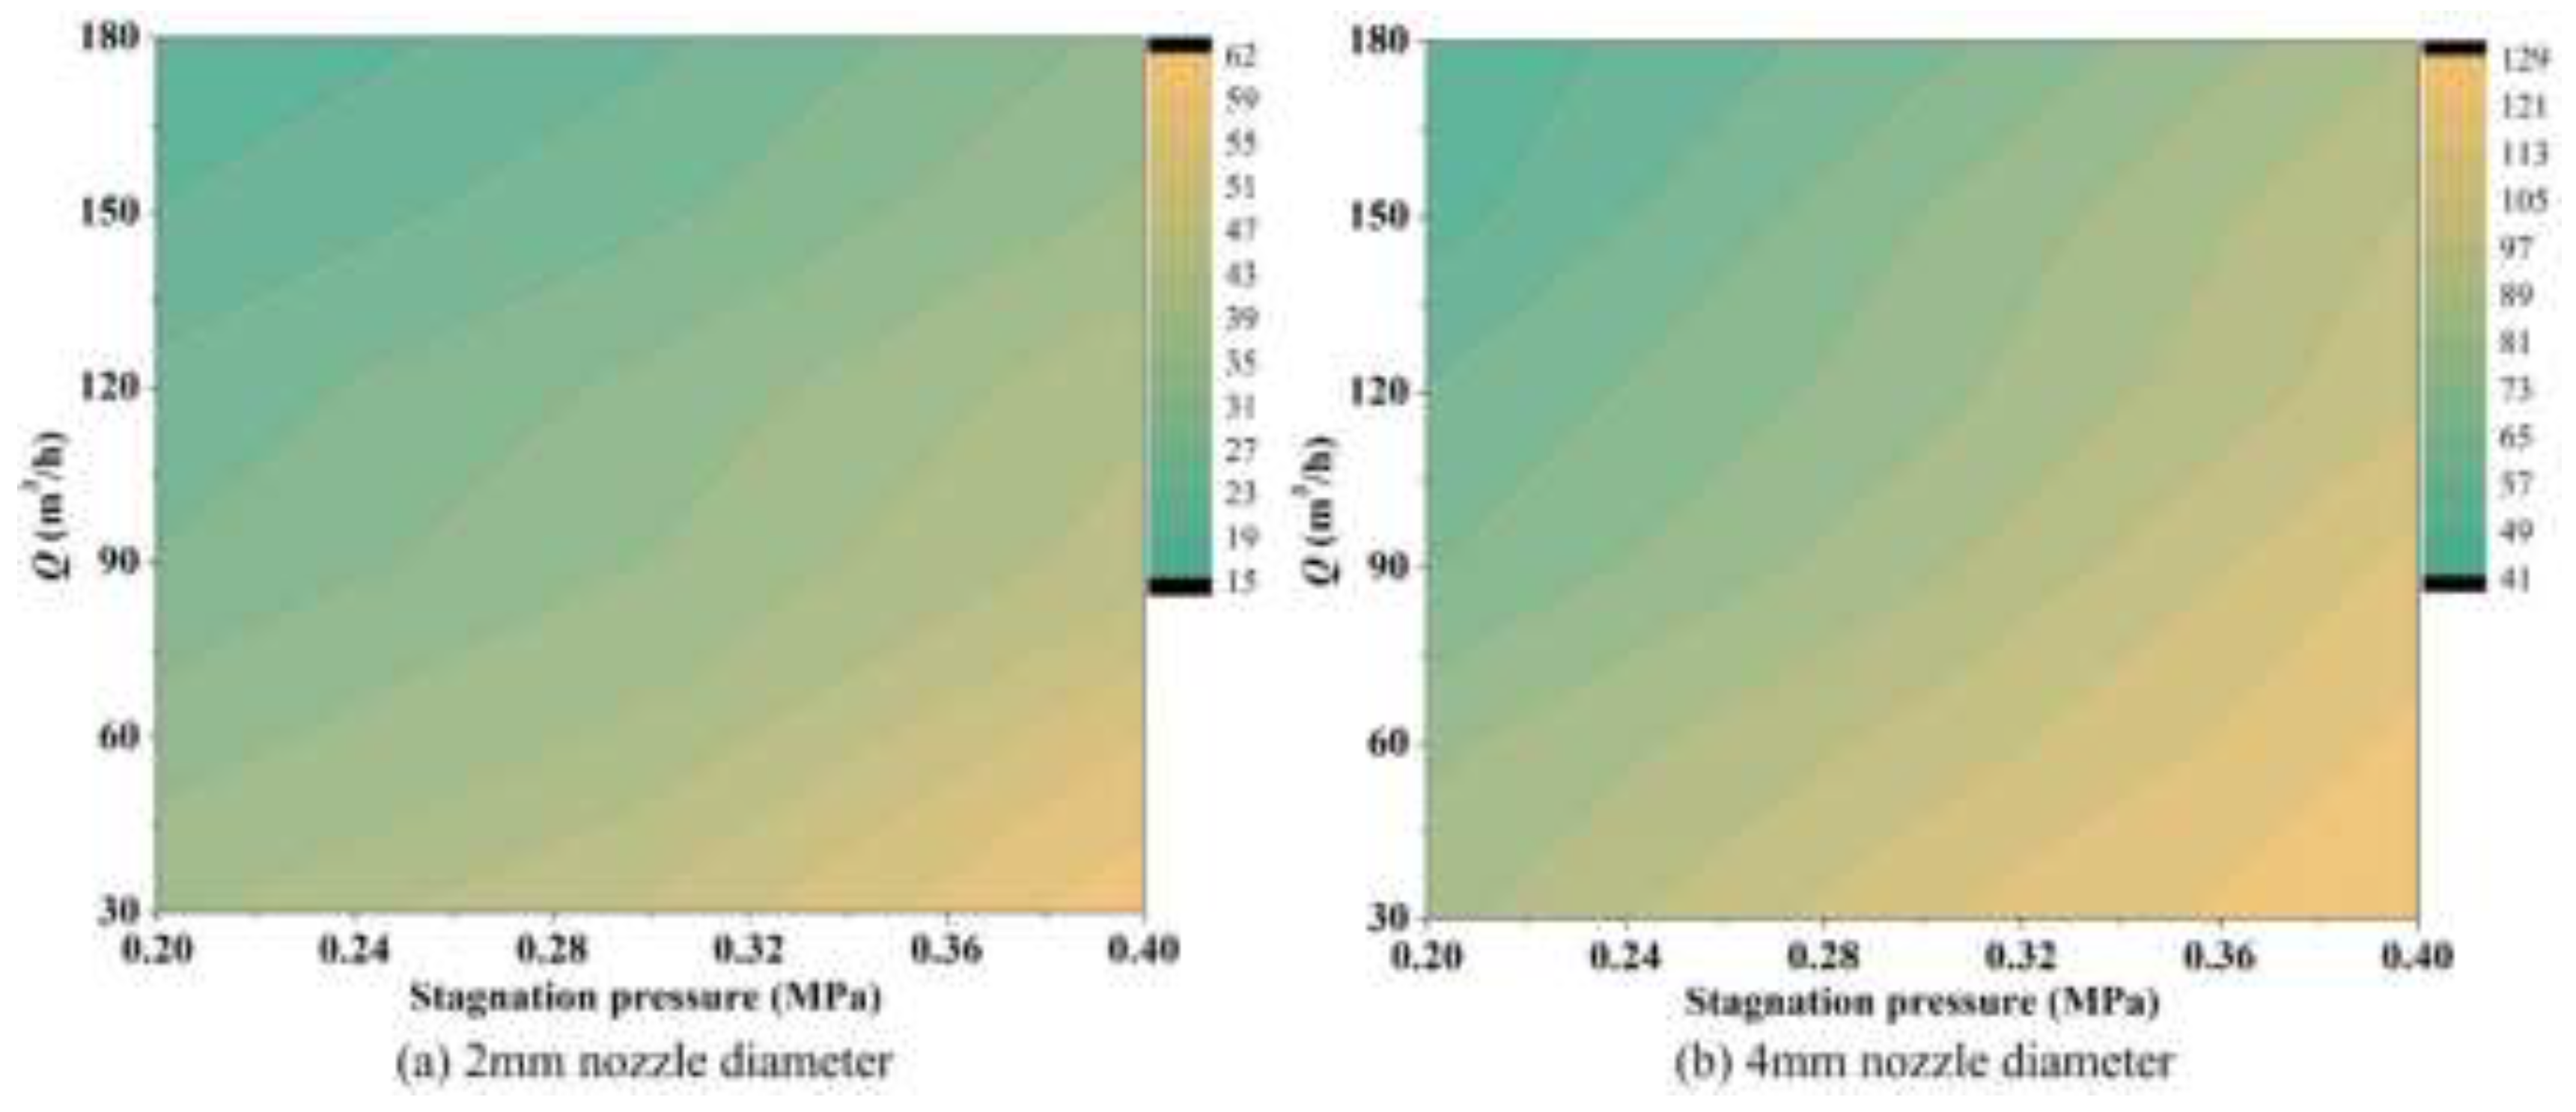
Figure 11.
Correlation fitting between dimensionless effective ventilation time and dimensionless ventilation flow rate.
Figure 11.
Correlation fitting between dimensionless effective ventilation time and dimensionless ventilation flow rate.

Figure 12.
Performance of critical ventilation flow rate under various leakage conditions.


Table 1.
Overview on hydrogen diffusion and ventilation.
| Ventilation mode | Author | Research scenario | Method | Research topic |
|---|---|---|---|---|
| Natural ventilation | Matsuura K [6] | Partially open hallway | Simulation-CFD-ACE | The effects on the hydrogen concentration distribution of changing the vent positions, vent conditions and surrounding atmospheric currents. |
| Salva JA [7] | Hydrogen fuel cell vehicle | Simulation-FLUENT | Risk analysis of hydrogen leakage and diffusion in the vehicle interior by steady state simulation. | |
| Hajji Y [8] | Garage | Simulation-FLUENT | The effects of the roof apex angle and the opening ventilation on the hydrogen concentration gradients and stratification in a prismatic residential garage. | |
| Hajji Y [9] | Garage | Simulation-FLUENT | The influence of building geometry and position, shape and size of openings ventilation on the formation of combustible hydrogen-air clouds. | |
| Lee J [10] | Partially open space | Simulation-FLUENT & Experimental | Hydrogen release behaviors and the most effective ventilation configuration to reduce hydrogen concentration in the space. | |
| Zhang XL [11] | Partially open space | Simulation-FLUENT | The coupling influence mechanism of the vent position and the vent area on the ventilation effect. | |
| Forced ventilation and natural ventilation | Brennan S [12] | Hydrogen fuel cells | Simulation-ADREA-HF & Experimental | Ventilation requirements in enclosures containing fuel cells are determined to control hydrogen concentration in the event of possible leakage. |
| Matsuura K [13] | Partially open space | Simulation-FDS | A sensing-based risk mitigation control strategy that the volume flow rate of forced ventilation is changed with the sensing data to achieve the best ventilation effect. | |
| Dadashzadeh M [14] | Garage | Simulation-FDS | Hydrogen diffusion behavior and mitigation measures under different ventilation conditions. | |
| Lee J [15] | Partially open space | Simulation-FLUENT & Experimental | The most effective natural ventilation configuration and the emergency response using nitrogen forced ventilation. |
Table 2.
Parameters of experimental conditions.
| Nozzle diameter (mm) | Ventilation flow rate (m3/h) | Stagnation pressure (MPa) | ||
|---|---|---|---|---|
| 2 | 30 | 0.2 | 0.3 | 0.4 |
| 60 | 0.2 | 0.3 | 0.4 | |
| 90 | 0.2 | 0.3 | 0.4 | |
| 120 | 0.2 | 0.3 | 0.4 | |
| 150 | 0.2 | 0.3 | 0.4 | |
| 180 | 0.2 | 0.3 | 0.4 | |
| 4 | 30 | 0.2 | 0.3 | 0.4 |
| 60 | 0.2 | 0.3 | 0.4 | |
| 90 | 0.2 | 0.3 | 0.4 | |
| 120 | 0.2 | 0.3 | 0.4 | |
| 150 | 0.2 | 0.3 | 0.4 | |
| 180 | 0.2 | 0.3 | 0.4 | |
Table 3.
Relevant parameters of linear fitting under various experimental conditions.
Disclaimer/Publisher’s Note: The statements, opinions and data contained in all publications are solely those of the individual author(s) and contributor(s) and not of MDPI and/or the editor(s). MDPI and/or the editor(s) disclaim responsibility for any injury to people or property resulting from any ideas, methods, instructions or products referred to in the content. |
© 2023 by the authors. Licensee MDPI, Basel, Switzerland. This article is an open access article distributed under the terms and conditions of the Creative Commons Attribution (CC BY) license (http://creativecommons.org/licenses/by/4.0/).
Copyright: This open access article is published under a Creative Commons CC BY 4.0 license, which permit the free download, distribution, and reuse, provided that the author and preprint are cited in any reuse.


