Submitted:
02 September 2023
Posted:
04 September 2023
You are already at the latest version
Abstract
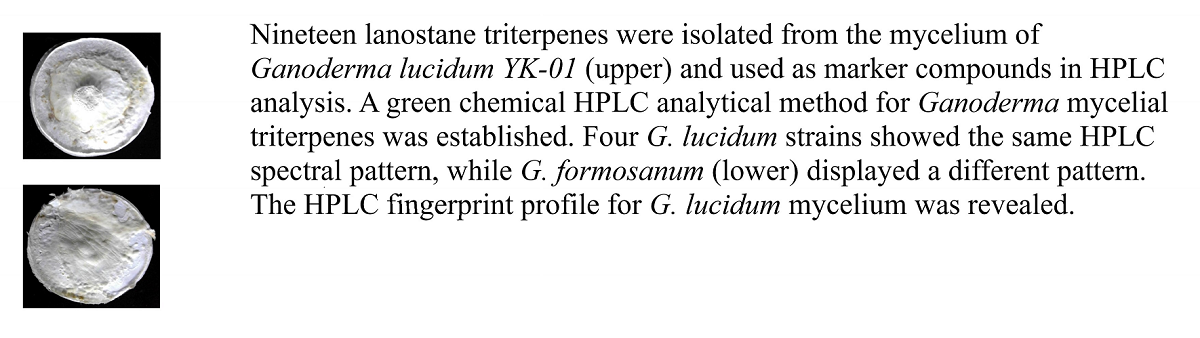
(1) Background: ganoderic acids (GAs) are specific triterpenes of Ganoderma lucidum. The HPLC fingerprint profile of GAs of the fruiting body has been well-known, but the mycelial fingerprinting remains unclear. (2) Methods: the ethanol extract of the mycelium of G. lucidum (YK-01) was further purified by preparative HPLC. The HPLC spectra for four strains of G. lucidum and one strain of G. formosanum (purple lingzhi) were investigated. (3) Results: nineteen lanostane triterpenes, including five new triterpenes, GA-TP (1), ganodermic acid Jc (GmA-Jc) (2), GmA-Jd (3), GA-TQ1 (4), and ganoderal B1 (5), and fourteen known triterpenes 6-19 were isolated from the ethanol extract. A green chemical HPLC analytical method was developed by using ethanol and acetic acid as mobile phase. These triterpenes comprise of a unique HPLC triterpenoid spectral pattern of G. lucidum mycelium. All four G. lucidum strains showed the same HPLC spectral pattern, whereas G. formosanum displayed a different pattern. Quantitation methods for ganoderic acid T (10) and S (12) were also validated. (4) Conclusions: the triterpenoid HPLC analytical method can be used to identify G. lucidum species, and to determine the contents of GA-T and GA-S.
Keywords:
Ganoderic acids
; Ganoderma lucidum
; HPLC fingerprint
1. Introduction
Ganoderma lucidum, or lingzhi, is a well-known medical fungus. Owing to its multiple bio-activities, such as immune modulation, anti-cancer, and liver-protection [1], many dietary supplements have been made from lingzhi and are now very popular on the market. Most of the raw materials are the fruit body and the mycelium (or the fermentation powder) of G. lucidum [2], with the same active constituents, polysaccharides and triterpenes [3]. In our previous reports, nine ganoderic acids [4] and fifteen lucidenic acids (LAs) [5] have been isolated and used for the identifications of G. lucidum fruiting bodies. In contrast to the well-established GA HPLC fingerprint profiles of the fruit body, the reports of G. lucidum mycelia are rare. Besides, identifications and the quality control of the mycelium products of G. lucidum are lacking. On the other hand, GAs from the mycelium of G. lucidum have attracted much attention due to their significant anti-tumor activities [6]. For example, GA-T (10) shows the most prominent effect against LLC metastasis in vitro and in vivo [7], and exerts anti-tumor effects against A549 tumor in xenograft SCID mice [8]. Though GA-T and twenty four other triterpenes have been used as marker compounds for the HPLC analysis of G. lucidum mycelia, the HPLC fingerprint profiles remain to be clarified [9]. Therefore, it is necessary to establish an unambiguous triterpenoid HPLC fingerprint profile for identification and quality control of G. lucidum mycelium. Here we isolated nineteen lanostane triterpenes, including five new compounds 1-5, and fourteen known compounds, GA-U1 (6), ganorbiformin C (7), GA-P (8), GA-Q (9), GA-T (10), GA-TS (11), GA-S (12), GA-R (13), GA-Me (14), GmA-S (15), GmA-T-O (16), GA-Mf (17), GmA-P2 (18) and GA-Y (19), from the mycelium of G. lucidum YK-01. Their structures were identified by matching with published literature [10-14] and spectroscopic data (1H, 13C NMR, DEPT, HSQC, HMBC and mass spectra). A novel and green chemical HPLC analytical method for these triterpenes was also established, which used ethanol and acetic acid as mobile phase. By using this analytical method, a unique HPLC fingerprint profile for the triterpenes of the mycelium of G. lucidum was revealed for the first time. Moreover, the HPLC spectral patterns of GA-type mycelia (YK-01 and BCRC36065) were compared with those of the LA-type (YK-02 and BCRC36090) and purple lingzhi (G. formosanum, CCRC37048). All strains of G. lucidum showed the same spectral pattern, while G. formosanum displayed a various pattern. The results demonstrate that HPLC spectral patterns can be used to identify the species of G. lucidum. Because GA-T (10) and GA-S (12) are the major compounds in G. lucidum mycelia, the HPLC quantitation methods of 10 and 12 were evaluated.
2. Materials and Methods
2.1. Chemicals and apparatus
Absolute ethanol (Fisher Chemical, purity 98%) and glacial acetic acid (PanReac AppliChem, purity 99.8%) are HPLC grade. Cultivation media including glucose (Dongxiao, Zhucheng, China), sucrose (Taiwan Sugar Corporation, Kaohsiung, Taiwan), soy peptone (Organotechnie, La Courneuve, France), malt extract (Stbio media, New Taipei City, Taiwan), yeast extract (Guangxi Yipinxian Biotechnology Co., Ltd., Guangxi, China) and potassium phosphate (Lianyungang Hengsheng Food Additive Co., Ltd., Lianyungang, China) are food grade. MEA (malt extract agar) was purchased from Merck (Darmstadt, Germany) and PDA was purchased from Difco (Sparks, MD, USA). Melting points were determined on MEL-TEMP II apparatus (Laboratory Device INC., IL, USA) and the thermometer (0-3000C) was calibrated with a standard electronic thermometer (TES 1384, Taiwan). 1H NMR and 13C NMR spectra were measured using a Bruker AMX- 700MHz spectrophotometer (Bruker BioSpin Corporation, MA, USA). The mass spectra were measured using an electronic ionization time-of-flight (EI-TOF) mass spectrophotometer (JMS-T200GC AccuTOF GCx-plus, JEOL, Japan) equipped with a DIP sampling device, or on a high performance compact mass spectrometer (Expression CMSL, Advion Inc., NY, USA). Measurement conditions are as previously described [7]. Preparative HPLC was performed using a YMC preparative HPLC (DAU-100-700, Kyoto Chromato Co. Ltd, Kyoto, Japan) equipped with a reverse phase column (ODS-AQ-HG, 15 μm, 100 x 600 mm, YMC, Kyoto, Japan) and an UV-VIS detector. Detective wavelength was set at 243 nm. Semi-preparative HPLC was performed using a SPOT PREP II liquid chromatography (Armen Instrument, Paris, France). A column of Merck Hibar (25 x 250 mm RP-18e 5μm) was used for the isolation of the triterpenes. HPLC analysis was performed using a Hitachi CM 5000 series equipped with a CM5110 pump and CM5340 photo-diode array detector (Hitachi, Tokyo, Japan). Detector wavelength was set at 243 nm. A column of COSMOSIL 5C18-MS-II (4.6 x 250 mm) was used. Freeze centrifugor was performed on a High-speed refrigerated centrifugor (Himac CR 22G, Hitachi, Tokyo, Japan).
2.2. Cultivation of Ganoderma mycelia
The mycelia (in a 7 cm petridish of MEA) of five G. lucidum strains, YK-01, YK-02, BCRC36065, BCRC36090 and CCRC 37048 were provided by Lingzhi Agricultural Co. Ltd., Baiho, Tainan city, Taiwan. In order to produce enough mycelia biomass for HPLC analysis, the mycelia with 1.0 cm edge length were cut from the plates and inoculated into an 18 cm petridish containing MEA and 0.1% (weight percentage) plant fiber (Vitacel wheat fiber, Gemfont, Taipei, Taiwan), and cultivated in an incubator at 250C for 20 days. The mycelia were then collected and washed with water, and dried in an oven (500C for 48 hours) for further HPLC analysis. A seed liquid culture was firstly prepared for the large scale cultivation of Ganoderma mycelium YK-01. The medium for seed culture was composed of glucose (30g/L), sucrose (15g/L), soy peptone (3 g/L), yeast extract (2 g/L) and potassium phosphate (0.6 g/L) in a 1 L fermentation flask (total volume 400 mL). After sterilization (1200C, 30 mins), 3 pieces of mycelia with 0.5 cm edge length were cut from a PDA plate and inoculated into the liquid medium, and cultivated at 28°C on a rotary shaker at 85 rpm for 10 days. The seed culture was then inoculated into 30 sterilized aluminum containers (60 x 40 x 2 cm) which contained 48.0 g of malt extract, 4.8 g of soy peptone and 1.1 g of plant fiber in 1.1 L of water. The static cultivation of the mycelium was carried out in a clean room at 28°C and with a humidity of 80-100% for 20 days. The harvested mycelia were collected and washed with water to remove the medium. Then the wet mycelial plates were freeze dried to give 1.2 Kg of Ganoderma mycelium.
2.3. HPLC analysis of the triterpenes 1-19
The mobile phase was absolute ethanol (A) and 0.5% aqueous acetic acid (B). Elution program was set at isocratical mode with 65% A for 40 mins. The flow rate was 0.8 mL/min. Injection volume was 10 μL and detected at 243 nm.
2.4. Isolation of compounds 1-5 from YK-01 mycelium
The YK-01 mycelium powder (1 Kg) was grounded and extracted with 20 L of 80% ethanol under 600C in a water bath for 3 hours. After cooling, the mixture was filtered and the filtrate was concentrated to 2 L. Then 10 L of water was added into the concentrate, and set aside for precipitation. The precipitate was collected by centrifugation using a freeze centrifugor under 10000 rpm at 40C, and then freeze-dried to give a brown solid (38 g, yield 3.8%). The solid was disolved in 400 mL of 80% ethanol, and subjected to a preparative HPLC (YMC) for the separation of mycelia triterpenes. A gradient elution of 50% to 80% ethanol was used, and the eluents were collected according to their signals. Five fractions were collected and then freeze-dried to give Fraction-1 (50% ethanol, Fr.1, 2.5 g), Fraction-2 (60% ethanol, Fr.2, 3.3 g), Fraction-3 (65% ethanol, Fr.3, 5.1 g), Fraction-4 (75% ethanol, Fr.4, 15.2 g) and Fraction-5 (80% ethanol, Fr.5, 5.4g). Fr. 1 was dissolved in 80% ethanol and subjected to a semi-preparative HPLC (Armen) for further purifiction. Four sub-fractions, Fr.1-1, Fr.1-2, Fr.1-3 and Fr.1-4 were collected by using 50% ethanol as the mobile phase. The eluents were concentrated and crystallized in situ. From Fr.1-3, compound 2 was obtained as white powder (4.8 mg). Compound 3 was isolated from Fr. 1-2 as amphorous powder (3.4 mg). Fr. 1-4 was futher purified by using the same procedures as Fr. 1-3, compound 1 (20.4 mg) was obtanid as colorless needle crystals. From the remaining mixture of Fr.1-4, compound 4 (2.4 mg) was further isolated as cloorless crystals. Fr.4 was further purified by using the same conditions as Fr.1, which gave Fr. 4-1, Fr.4-2 and Fr.4-3. From Fr. 4-3, GA-S (12) was obtained as pale-yellow needle crystals, and compound 5 (2.0 mg) was obtain as colorless needle crystals from the remaining mixture.
2.5. Determination of ganoderic acid T (10) and S (12)
2.5.1. Sample pretreatment
0.5 g of the mycelia powder (100 mesh) in 20 ml of 80% ethanol was sonicated for 3 h at 600C. Then the mixture was centrifuged for 15 minutes at 6000 rpm. The supernatant (2 mL) was passed through a 45 μM membrane filters (Millex-LCR, Merck, Darmstadt, Germany). 10 μL of the filtrate was injected into HPLC for analysis.
2.5.2. Calibration curve
The stock solution of 10 (4 mg/mL) and 12 (4 mg/mL) were serially diluted with 80% ethanol to the concentrations of 20.0, 100.0, 400.0, 800.0 and 1000.0 μg/mL. Calibration curves were performed with five different concentrations in triplicate, and were plotted from the linear regression of peak area versus concentration.
2.5.3. Recovery tests
After 0.5 g of 100 mesh of G. lucidum mycelium (YK-01) was weighted, 1 mL of 100, 400 and 800 μg/mL solution of 10 and 12 were added. A placebo group was prepared with no external addition and it was also used for the determination of 10 and 12 in the mycelium. The mixtures were dried overnight in oven at 600C then prepared as sample solutions as aforementioned.
2.5.4. Limit of detection and limit of quantitation
Used the diluted solutions from the lowest concentrations of 10 (20 μg/mL) and 12 (20 μg/mL), and injected for five times. The limit of detection (LOD) is the average concentration as the signal to noise ratio (S/N) >3. The limit of quantitation (LOQ) is the average concentration of S/N > 10.
2.5.5. Accuracy and precision
Intraday and interday tests were used to evaluate the accuracy and precision of the analytical methods. Concentrations of low, medium and high in the range of calibration curve were analyzed for a consecutive five times for intraday precision. The interday precision was similarly performed within 3 separate days.
3. Results
3.1. Structural identifications of the new triterpenes 1~5
The structures of GAs from the mycelia of G. lucidum usually have C30 (carbon numbers, Figure 1) skeleton and with high similarities [3]. Compound 1 was isolated as colorless needle crystals (mp 231~2330C). The molecular formula was determined as C34H50O7 from its mass ([M]+ m/z 570) and DEPT spectra, which is the same as GA-P (8) (or GA-Q, 9), suggesting an isomer of 8 (or 9). Its 13C NMR (Table 1) spectral data were very similar to those of GA-T (10) [10] except the signal at δ72.5, suggesting a β-hydroxyl group at C-22 instead of an acetyl group in 10. The β-orientation of the 22-hydroxyl group was confirmed by the upfield shift of the C-22 proton (δ3.80, dd, J = 8.4, 4.2 Hz, Table 2) compared with its α-hydroxyl stereo-isomer previously isolated from G. lucidum mycelium [11]. These data indicate that compound 1 is a 22β-hydroxyl derivative of GA-T, and a positional isomer of GA-P or GA-Q. Assignments of its 1H NMR and HMBC spectral data were presented in Table 2. Hence it was assigned as 3α,15α-diacetoxy-22β-hydroxy-5α-lanosta-7,9(11)-trien-26-oic acid, namely ganoderic acid TP (GA-TP).
Compound 2 was isolated as white amorphous powder (mp 175~1770C). The molecular formula was determined as C30H46O4 from its mass ([M]+ m/z 470) and DEPT spectra. Its formula is the same as ganodermic acid Jb (GmA-Jb) previously isolated from G. lucidum mycelium [12]. GmA-Jb has two hydroxyl groups at C-3 and C-15, however, a complete assignment of its 1H NMR is lacking. The 13C NMR spectrum (Table 1) of 2 showed a singlet at δ73.4, corresponding to δ3.80 (dd, J = 7.0, 6.3 Hz) in the HSQC spectrum (See GmA-Jc (2) in the Supplementary Materials), indicating a β-hydroxyl group at C-22, the same as compound 1. Another singlet was observed at δ79.6, corresponding to δ3.16 (dd, J = 11.2, 4.2 Hz) in the HSQC spectrum (See GmA-Jc (2) in the Supplementary Materials), suggesting a β-hydroxyl group at C-3 identical to that of the GmA-Jb. Hence it is a positional isomer of GmA-Jb, assigned as 3β,22β-dihydroxy-5α-lanosta-7,9(11)-trien-26-oic acid, and named as ganodermic acid Jc (GmA-Jc). The assignments of its 13C NMR,1H NMR and HMBC spectral data were completed, as shown in Table 1 and Table 2.
Compound 3 was isolated as amorphous powder (mp 197~1990C). The molecular formula was determined as C30H46O4 from its MS ([M] +m/z 486) and DEPT spectra, which has the same formula with 3α,15α, 22α-trihydroxy-lanosta-7,9(11),24-trien-26-oic acid, a GA derivative with three hydroxyl groups in the molecule previously isolated from the mycelium of G. lucidum [12]. The 13C NMR (Table 1) of 3 showed three hydroxyl groups at C-3 (δ76.8), C-15 (δ75.2), and C-22 (δ73.4), suggesting an isomer of the trihydroxyl GA [12]. However, a complete assignment of the 1H NMR of the trihydroxyl GA has not been revealed. The 1H NMR (Table 2) of 3 showed the signals at δ3.38 (s) and δ4.24 (dd, J = 9.1, 5.6 Hz), representing two α-hydroxyl groups at C-3 and C-15, which is the same as its isomer. But the signal at δ3.74 (t, J = 7.7 Hz) indicated a β-hydroxyl group at C-22, the same as compound 1 and 2. Hence it was assigned as 3α,15α,22β-trihydroxy-lanosta-7,9(11),24-trien-26-oic acid. For systematic consideration, we tentatively named it as ganodermic acid Jd (GmA-Jd). By combining the HSQC (See GmA-Jd (3) in the Supplementary Materials) and HMBC spectral data, the assignments of its 1H NMR spectral data were completed as shown in Table 2.
Compound 4 was isolated as colorless needle crystals (mp 227~2290C). The molecular formula was determined as C32H48O6 from its mass ([M]+ m/z 528) and DEPT spectra. The characteristic signal at δ3.16 (dd, J = 11.2, 4.2 Hz) in its 1H NMR spectrum (Table 2) represented a β-hydroxyl group at C-3. The 13C NMR (Table 1) spectrum showed a singlet at δ73.2, indicating a β-hydroxyl group on C-22 similar to compound 2. Another singlet at δ78.8, corresponding to δ5.07 (dd, J = 9.8, 5.6 Hz) in the HSQC spectrum (See GA-TQ1 (4) in the Supplementary Materials), representing an α-acetoxyl group attached on C-15 similar to those of the GA-P (8) and GA-T (10) [10]. Hence it was assigned as 3β,22β-dihydroxy-15α-acetoxy-5α-lanosta-7,9(11)-trien-26-oic acid, and tentatively named as ganoderic acid TQ1. It is a stereo-isomer at C-3 for GA-U2, recently isolated from the mycelia mat of G. lucidum [13]. The assignments of its 13C, 1H NMR and HMBC spectral data were listed in Table 1 and Table 2.
Compound 5 was isolated as colorless needle crystals (mp 168~1700C). Its molecular formula was determined as C30 H46O3 from its MS ([M]+ m/z 454) and DEPT spectra. The formula is the same as ganoderal B originally isolated from G. lucidum fruit body [14]. Its 13C NMR spectrum (Table 1) showed a signal at δ217.9, indicating a carbonyl group at C-3. An aldehyde group was observed on δ195.2, corresponding to δ9.44 (s, 26-H) on its HSQC spectrum (See Ganoderal B1 (5) in the Supplementary Materials). These data suggested that 5 was a ganoderic aldehyde similar to ganoderal B. However, the 1H NMR (Table 2) of 5 showed the characteristic signal at δ3.90 (dd, J = 6.5, 3.5 Hz), indicating a β-hydroxy group at C-22. Therefore it was confirmed as 22β-hydroxy-3-oxo-5-α-lanosta-8,24E-diene-26-al, and named as ganoderal B1, a positional isomer of ganoderal B in which the hydroxyl group is at C-7 [14]. The complete assignments of its 13C, 1H NMR and HMBC spectral data were listed in Table 1 and Table 2.
3.2. HPLC fingerprint profiles of triterpenes from Ganoderma mycelia
We found that aqueous ethanol was able to purify GA-T (10), and GA-S (12) from ethanol extract of Ganoderma mycelium in semi-preparative HPLC. Thus, ethanol and aqueous acetic acid were used as the mobile phase, and the spectrum of the isolated triterpenes was shown in Figure 2,a. All compounds were well-separated. This is the first green chemical HPLC method for the analysis of Ganoderma triterpenes. In the four strains of G. lucidum, compound 9 (GA-Q), 10 (GA-T) and 12 (GA-S) were detected as the major signals (Figure 2 b, c, d, e). Compound 1, 2, 8, 11 and 13-17 were detected as the minor components, and the rest of triterpenes were the trace compounds. Though the contents of these triterpenes for the four strains were different, they showed an identical HPLC spectral pattern. In G. lucidum YK-01 (Figure 2,b), the first notable peak in the HPLC spectrum was GA-P (8), followed by GA-TP (1) and GA-Q (9), then two major signals 10 and 12, and finally 13 and 14 were dectected as two consequtive signals. The same pattern was also observed for the other three G. lucidum strains (Figure 2,c, d, e). The strain of G. formosanum CCRC37048 displayed a different HPLC spectral pattern from G. ludcidum and had extremely low amount of GAs (Figure 2, f).
3.3. Methods for validation and quantitation of ganoderic acid T (10) and S (12)
Because ganoderic acid T (10) and S (12) are the most abundant compounds with anti-cancer properties in the mycelia of G. lucidum, and can be well-separated with other GAs in the HPLC spectra, they were used as the standard compounds for validating the HPLC analytical method. The calibration, precision, and recovery data were shown in Table 3. The correlation coefficients of 10 and 12 were 0.9984 and 0.9995, respectively, which demonstrate a good linear relationship under this analytical condition. Limit of detection (LOD) were all less than 2.2 μg/mL. The RSD of inter-day and intra-day precision of 10 were between 0.04~0.4%, and 12 were 0.11~0.44%. Compound 10 was detected with an average amount of 1216.00 ± 9.60 μg/mL (Mean ± SD) in the mycelium of YK-01 (placebo), corresponding to 4.86% based on the mycelial dry weight, and compound 12 was 1.47% in average. Recovery percentages for three different concentrations of 10 and 12 were between 96~107%, and RSD were all under 3%. These data show that this green HPLC analytical method is well-suited for determining the contents of 10 and 12 in the mycelium of G. lucidum.
4. Discussion
The identification of Ganoderma species using DNA analysis is still debate [15]. However, the specific GAs has been used to identify the fruiting body of G. lucidum, as described in the US Pharmacopea(USP) [16]. Our previous report also showed that GAs and LAs can be used in the species and strains identifications for G. lucidum [5]. These triterpenes are strain-specific and show diverse bio-activities. Therefore both GAs and LAs not only can be used for identifications but also in the quality control for commercial Ganoderma products. In contrast to the GAs in fruiting body, the structures of mycelial GAs usually have 7,9(11)-diene moiety as shown in Figure 1, and show lower polarity [17]. Thus the mobile phase for the HPLC analysis of mycelial GAs are mainly methanol and acetonitrile [9], but they are toxic to human beings. Furthermore, gradient elution of aqueous methanol fails to separate GA-T (10) [9], the most effective anti-cancer compound in G. lucidum mycelium [7]. In this study, we revealed a green HPLC analytical method using ethanol and acetic acid as mobile phase, and successfully separated the isolated triterpenes. The nineteen triterpenes can be detective in four strains of G. lucidum mycelia, and they all displayed the same HPLC spectral pattern, indicating that this HPLC method can be used in species identification of G. lucidum mycelia. YK-02 and BCRC36090 (Figure 2, d and e) are the strains that produce lucidenic acids (LA-type) in their fruit bodies [5]. It was unclear whether GA-type and LA-type fruit bodies produce the same triterpenoid pattern in their mycelia stages. Our result here is different from previous report in which one strain of LA-type G. lucidum produces GA-Ma and GA-Mb as the major signals, while GA-T as the minor components in its mycelia stage [18]. Our results indicate that GA-T is the most abundant compound in the mycelia of both GA and LA-type fruit bodies. This finding is consistent with previous reports in which G. lucidum mycelium is cultivated under static condition [19].
The cultivation media and conditions, and the harvest timing for the mycelium of G. lucidum may change the relative abundance and the pattern of its triterpenes [20]. Besides, the mycelium collected from a liquid fermentation flask shows a lower triterpenoid content than that of the collected from a static container [20]. Therefore we used the static cultivation method. Furthermore, to collect more mycelial biomass, plant fiber, a natural nutrient for mushroom, was added into the media. The mycelia were then collected after 20 days when the color became pale yellow, as shown in Figure 3, indicating that the mycelia were in the mature stages. This cultivation method provides enough and stable amounts of mycelial GAs for HPLC analysis. The strain of G. formosanum CCRC37048 had extremely low amount of GAs (Figure 2, f), and displayed a different HPLC spectral pattern from G. ludcidum, particulary in the retention time betwen 12-30 mins. The color of the fruit body of G. formosanum is purple, the reason for its common name as purple lingzhi. It is difficult to differentiate the mycelium of G. formosanum from of G. lucidum, because of their similiarities in appearance (Figure 3). However, the proposed HPLC analytical method can accurately authenticate the species of G.lucidum. These results demonstrate that the mycelia of G lucidum, either GA or LA types, show the same triterpenoid HPLC spectral pattern. Moreover, compared with the time-consuming (more than 2 months) procedures to cultivate fruiting body, the mycelium is easier to produce, and be identified using the same HPLC method for authenticating Ganoderma species. However, continuing efforts are needed for a variety of Ganoderma species to establish more GA fingerprint profiles.
5. Conclusions
Nineteen triterpenes were isolated from the mycelium of G. lucidum, and were used as marker compounds in HPLC analysis. All strains of G. lucidum showed the same spectral pattern. This HPLC analytical method is rapid and convenient for the identification of G. lucidum species.
Supplementary Materials
The following supporting information can be downloaded at the website of this paper posted on Preprints.org.
Author Contributions
Conceptualization, Deng-Hai Chen and Kuang-Dee Chen; methodology, Deng-Hai Chen and Mon-Tarng Chen; validation, Jian-Yuan Wang; resource, Yen-Chun Liu; writing—original draft preparation, Deng-Hai Chen. All authors have read and agreed to the published version of the manuscript.
Funding
This research was funded by Double Crane Group, Taiwan, R.O.C.
Institutional Review Board Statement
Not applicable.
Informed Consent Statement
Not applicable.
Data Availability Statement
All data presented in the study are included within the article and its supplementary files.
Acknowledgments
Financial support from Double Crane Group is greatly acknowledged.
Conflicts of Interest
The authors declare no conflict of interest.
References
- Cör, D.; Knez, Ž.; Hrnčič, M.K. Antitumour, antimicrobial, antioxidant and antiacetylcholinesterase effect of Ganoderma lucidum terpenoids and polysaccharides: a review. Molecules 2018, 23, 649–669. [Google Scholar] [CrossRef] [PubMed]
- Chen, D.H.; Ju, H.Y.; Sheu, K.C. Simple Fourier transform (FT)-IR and reverse-phase HPLC identification methods of commercial Ganoderma products. J. Chin. Chem. Soc. 2001, 48, 1207–1210. [Google Scholar] [CrossRef]
- Xia, Q.; Zhang, H.Z.; Sun, X.F.; Zhao, H.J.; Wu, L.F.; Zhu, D. , Yang, G.H.; Xin, Y.N.; Mao, L.Z.; Zhang, G.M. A comprehensive review of the structure elucidation and biological activity of triterpenoids from Ganoderma spp. Molecules 2014, 19, 17478–17535. [Google Scholar] [CrossRef] [PubMed]
- Chen, D.H.; Chen, K.D. Determination of ganoderic acids in triterpenoid constituents of Ganoderma tsugae. J. Food Drug Anal. 2003, 11, 195–200. [Google Scholar] [CrossRef]
- Chen, D.H.; Wang, J.Y.; Chen, M.T.; Chen, K.D. HPLC fingerprint profiles of lucidenic acids from Ganoderma lucidum (lingzhi). J. Chin. Chem. Soc. 2022, 69, 950–959. [Google Scholar] [CrossRef]
- You, B.J.; Lee H,Z. ; Chung, K.R.; Lee, M.H.; Huang, M.J.; Tien, N.; Chgen, C.W.; Kuo, Y.H. Enhanced production of ganoderic acids and cytotoxicity of Ganoderma lucidum using solid-medium culture. Biosci. Biotechnol. Biochem. 2012, 76, 1529–1534. [Google Scholar] [CrossRef] [PubMed]
- Chen, N.H.; Liu, J.W; Zhong, J.J. Ganoderic acid T inhibits tumor invasion in vitro and in vivo through inhibition of MMP expression. Pharmacol. Rep. 2010, 62, 150–163. [Google Scholar] [CrossRef] [PubMed]
- Lai, H.H.; Huang, C.P.; Chen, D.H.; Chen, K.D. Lin, S.B. Ganoderma triterpenoid ganoderic acid T inhibits growth and metastasis of A549 lung adenocarcinoma in vitro and in vivo. J. Chin. Oncl. Soc. 2009, 25, 413–420. [Google Scholar]
- Chyr, R.; Shiao, M.S. Liquid chromatographic characterization of the triterpenoid patterns in Ganoderma lucidum and related species. J. Chromatogr. 1991, 542, 327–336. [Google Scholar] [CrossRef]
- Hirotani, M.; Asaka, I.; Ino, C.; Furuya, T.; Shiro, M. Ganoderic acid derivatives and ergosta-4,7,22-triene-3,6-dione from Ganoderma lucidum. Phytochemistry 1987, 26, 2797–2803. [Google Scholar] [CrossRef]
- Lin, L.J.; Shiao, M.S. Seven new triterpenes from Ganoderma lucidum. J. Nat. Prod. 1988, 51, 918–924. [Google Scholar] [CrossRef] [PubMed]
- Shiao, M.S.; Lin, L.J.; Yeh, S.F. Triterpenes in Ganoderma lucidum. Phytochemistry 1988, 27, 873–875. [Google Scholar] [CrossRef]
- Zhang, X.Q.; Gao, X.X.; Yang, Y.C.; Chen, G.; Hou, G.L.; Huo, X.T.; Jia, X.M.; Wang, A.H.; Hu, G.S. Lanostane-type triterpenoids from the mycelial mat of Ganoderma lucidum and their hepatoprotective activities. Phytochemistry 2022, 198, 113131. [Google Scholar] [CrossRef] [PubMed]
- Nishitoba, T.; Sato, H.; Oda, K.; Sakamura, S. Novel triterpenoids and a steroid from the fungus Ganoderma luicidum. Agric. Biol. Chem. 1988, 52, 211–216. [Google Scholar]
- Paterson, R.R.M.; Lima, N. Failed PCR of Ganoderma type specimens affects nomenclature. Phytochemistry 2015, 114, 16–17. [Google Scholar] [CrossRef] [PubMed]
- United States Pharmacopeial Convention Inc. USP NSP39-NF34, Maryland, USA, 2016; pp. 6641-6647.
- Galappaththi, M.C.A.; Patabendige, N.M.; Premarathne, B.M.; Hapuarachchi, K.K.; Tibpromma, S.; Dai, D. Q.; Suwannarach, N.; Rapior, S.; Karunarathna, S.C. A review of Ganoderma triterpenoids and their bioactivities. Biomolecules 2023, 13, 24. [Google Scholar] [CrossRef] [PubMed]
- Nishitoba, T.; Sato, H.; Oda, K.; Sakamura, S. Novel mycelial components, ganoderic acid Mg, Mh, Mi, Mj and Mk, from the fungus Ganoderma lucidum. Agric. Biol. Chem. 1987, 51, 1149–1153. [Google Scholar]
- Hu, G.S.; Zhai, M.H.; Niu, R.; Xu, X.Q.; Liu, Q.; Jia, J.M. Optimization of culture condition for ganoderic acid production in Ganoderma lucidum liquid static culture and design of a suitable bioreactor. Molecules 2018, 23, 2563–2574. [Google Scholar] [CrossRef] [PubMed]
- Xu, J.W.; Zhao, W.; Zhong, J.J. Biotechnological production and application of ganoderic acids. Appl. Microbiol. Biotechnol. 2010, 87, 457–466. [Google Scholar] [CrossRef] [PubMed]
Figure 1.
Structure of compounds 1~19 isolated from G. lucidum (YK-01) mycelium.
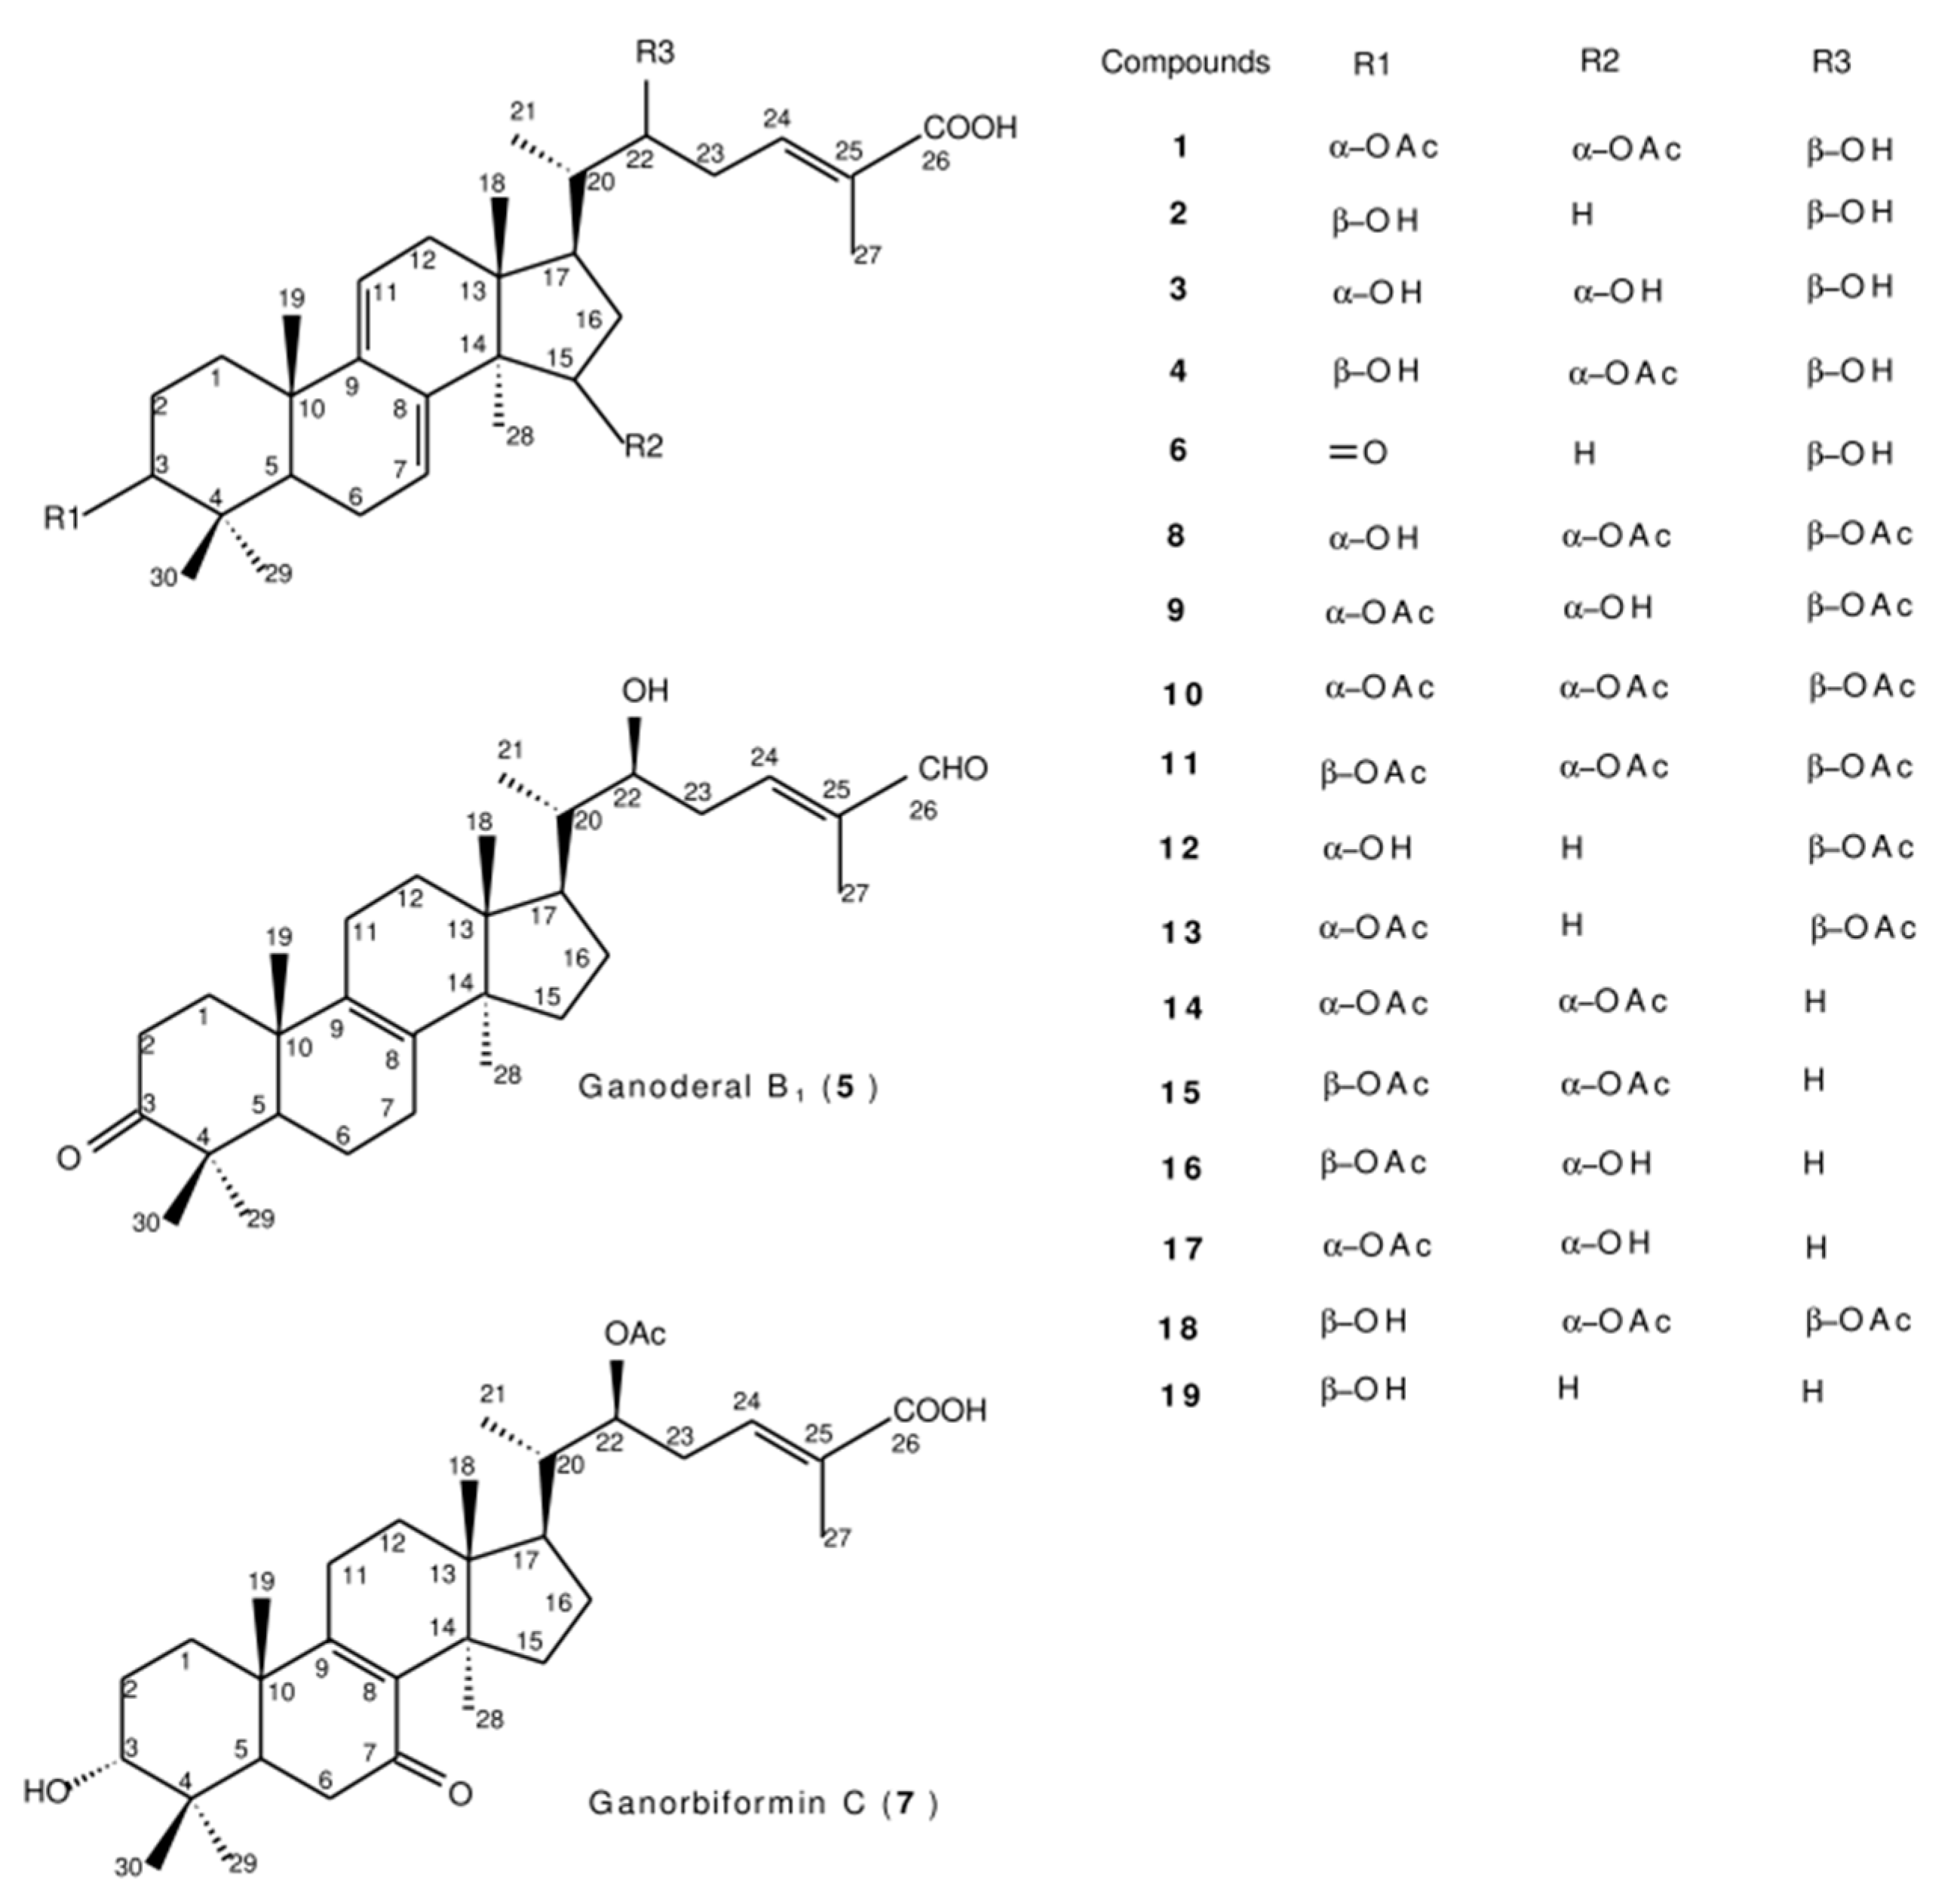
Figure 2.
HPLC spectra of ganoderic acids 1-19 (a), YK-01 (b), BCRC36065 (c), YK-02 (d), BCRC36090 (e) and CCRC37048 (f).
Figure 2.
HPLC spectra of ganoderic acids 1-19 (a), YK-01 (b), BCRC36065 (c), YK-02 (d), BCRC36090 (e) and CCRC37048 (f).
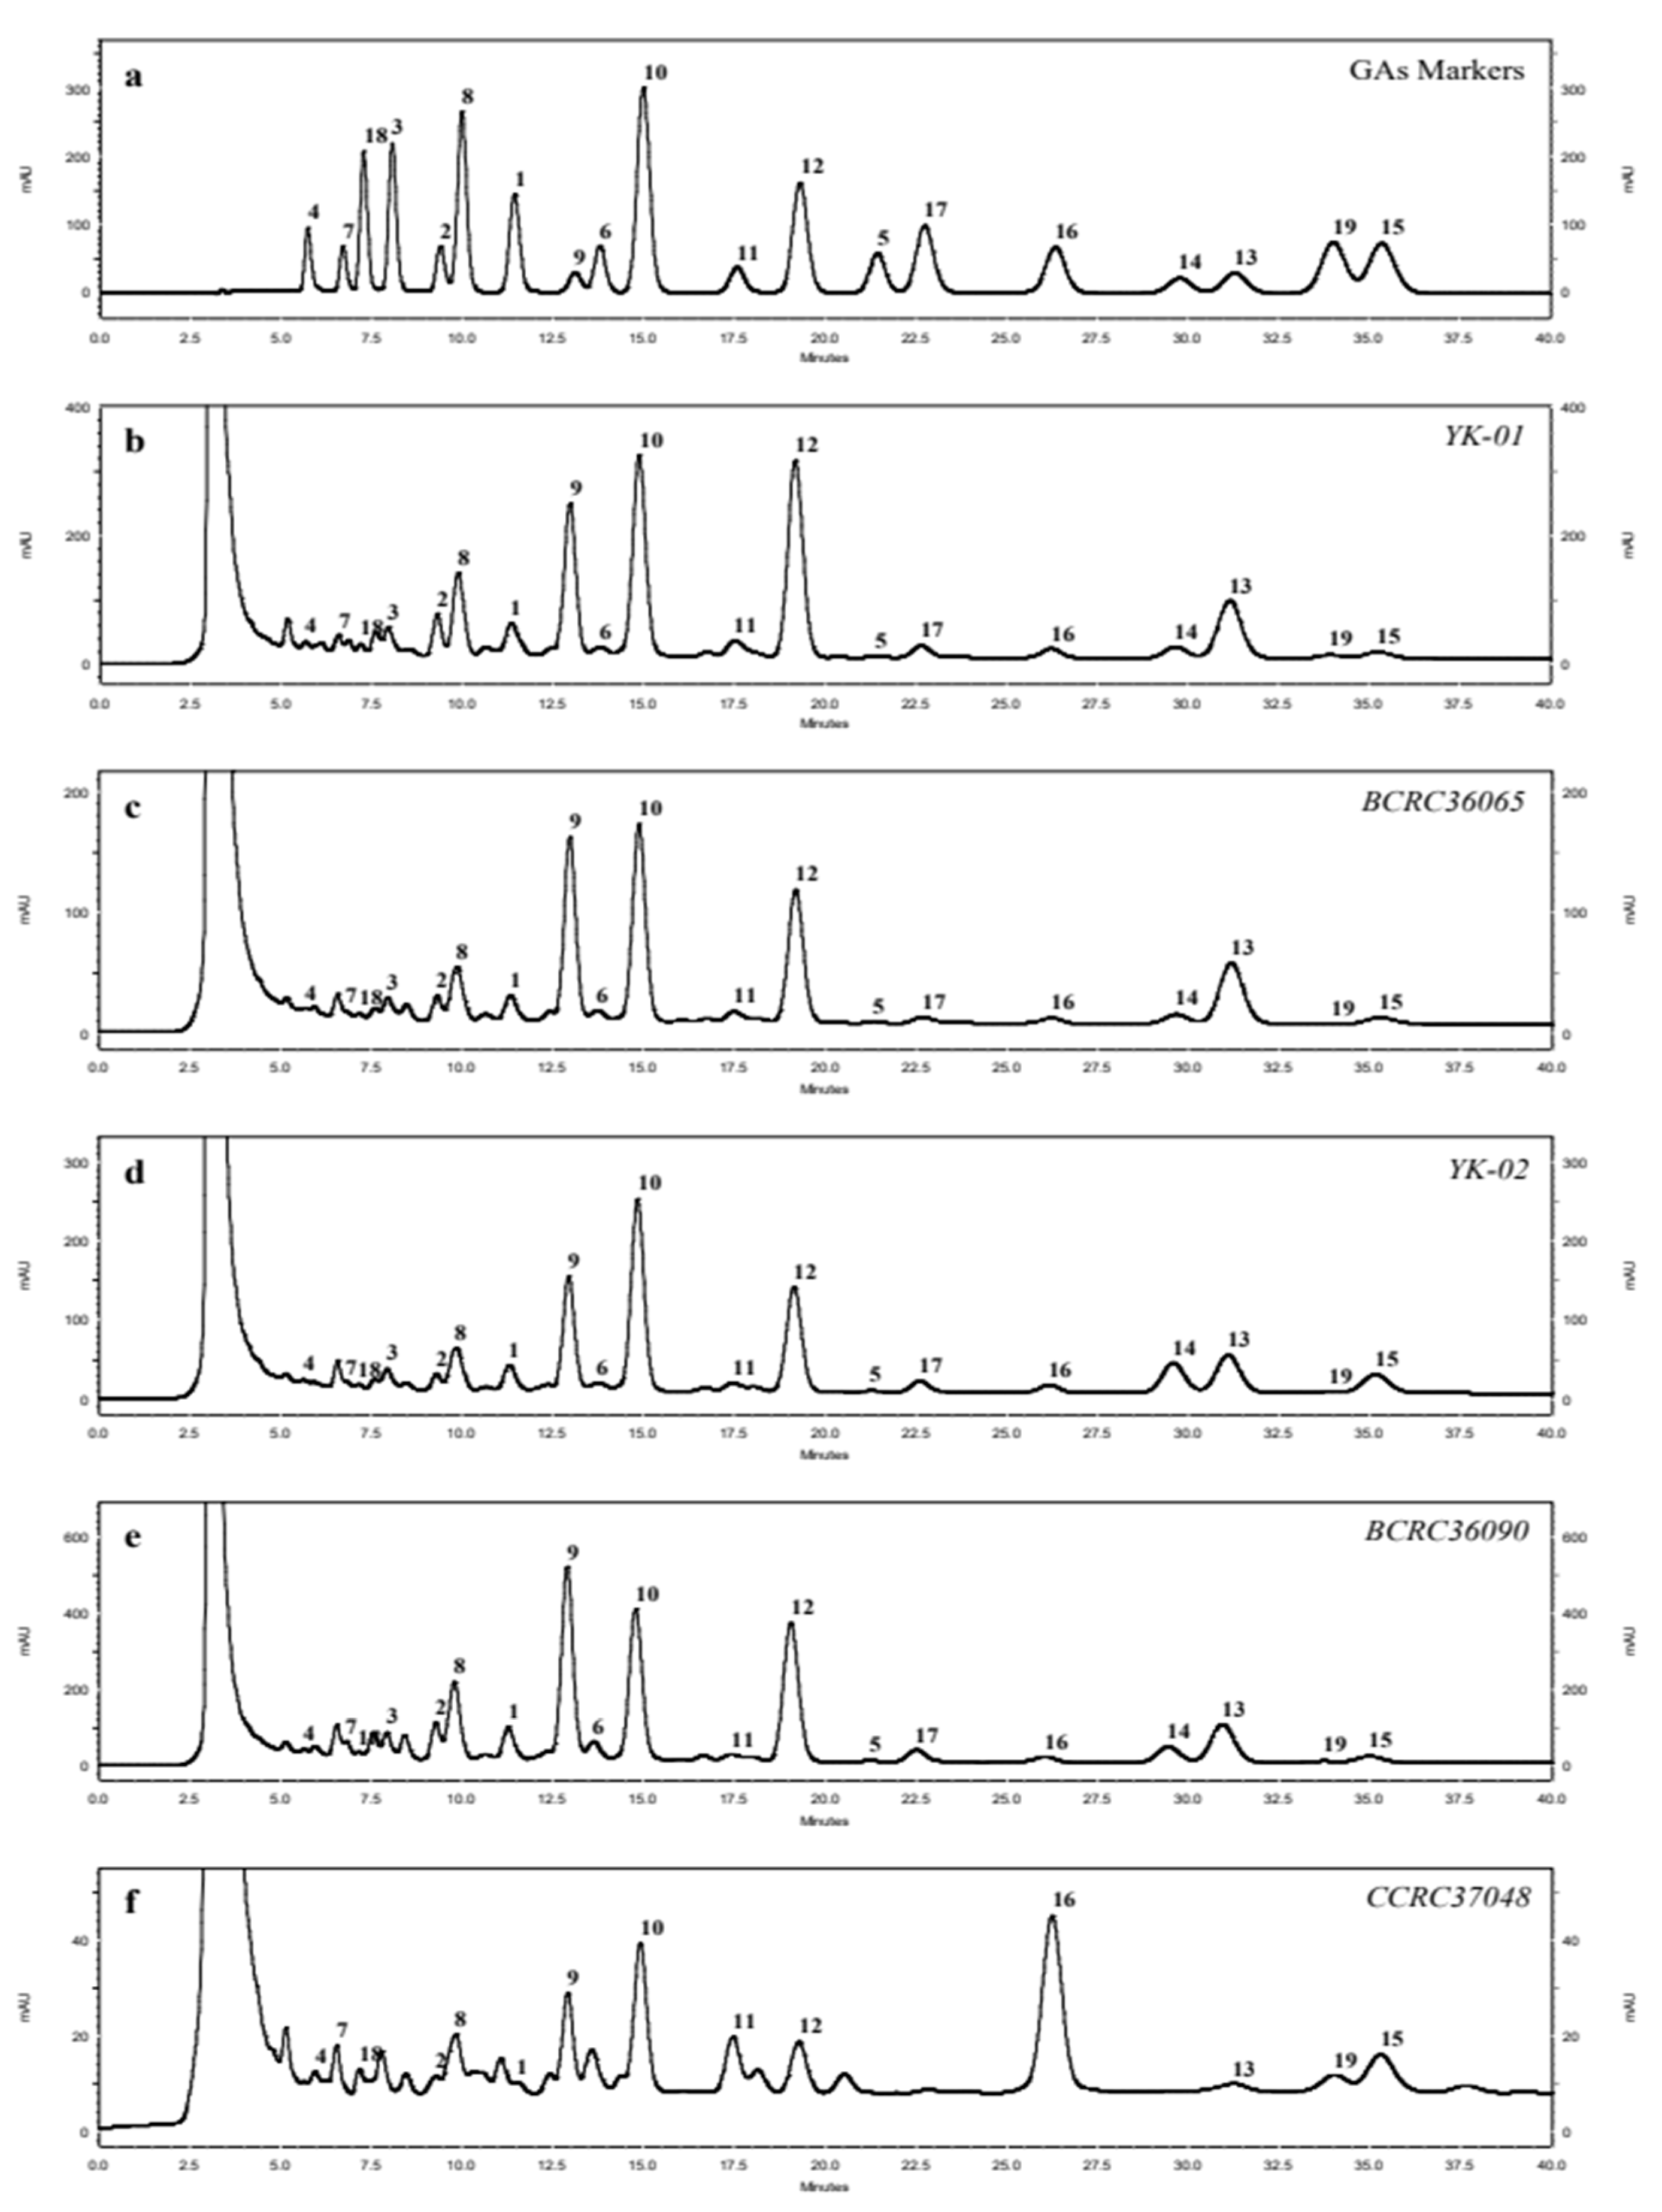
Figure 3.
Photo of dry mycelia of G. lucidum (YK-01, BCRC36065,YK-02, BCRC36090) and G. formosanum (CCRC37048).
Figure 3.
Photo of dry mycelia of G. lucidum (YK-01, BCRC36065,YK-02, BCRC36090) and G. formosanum (CCRC37048).
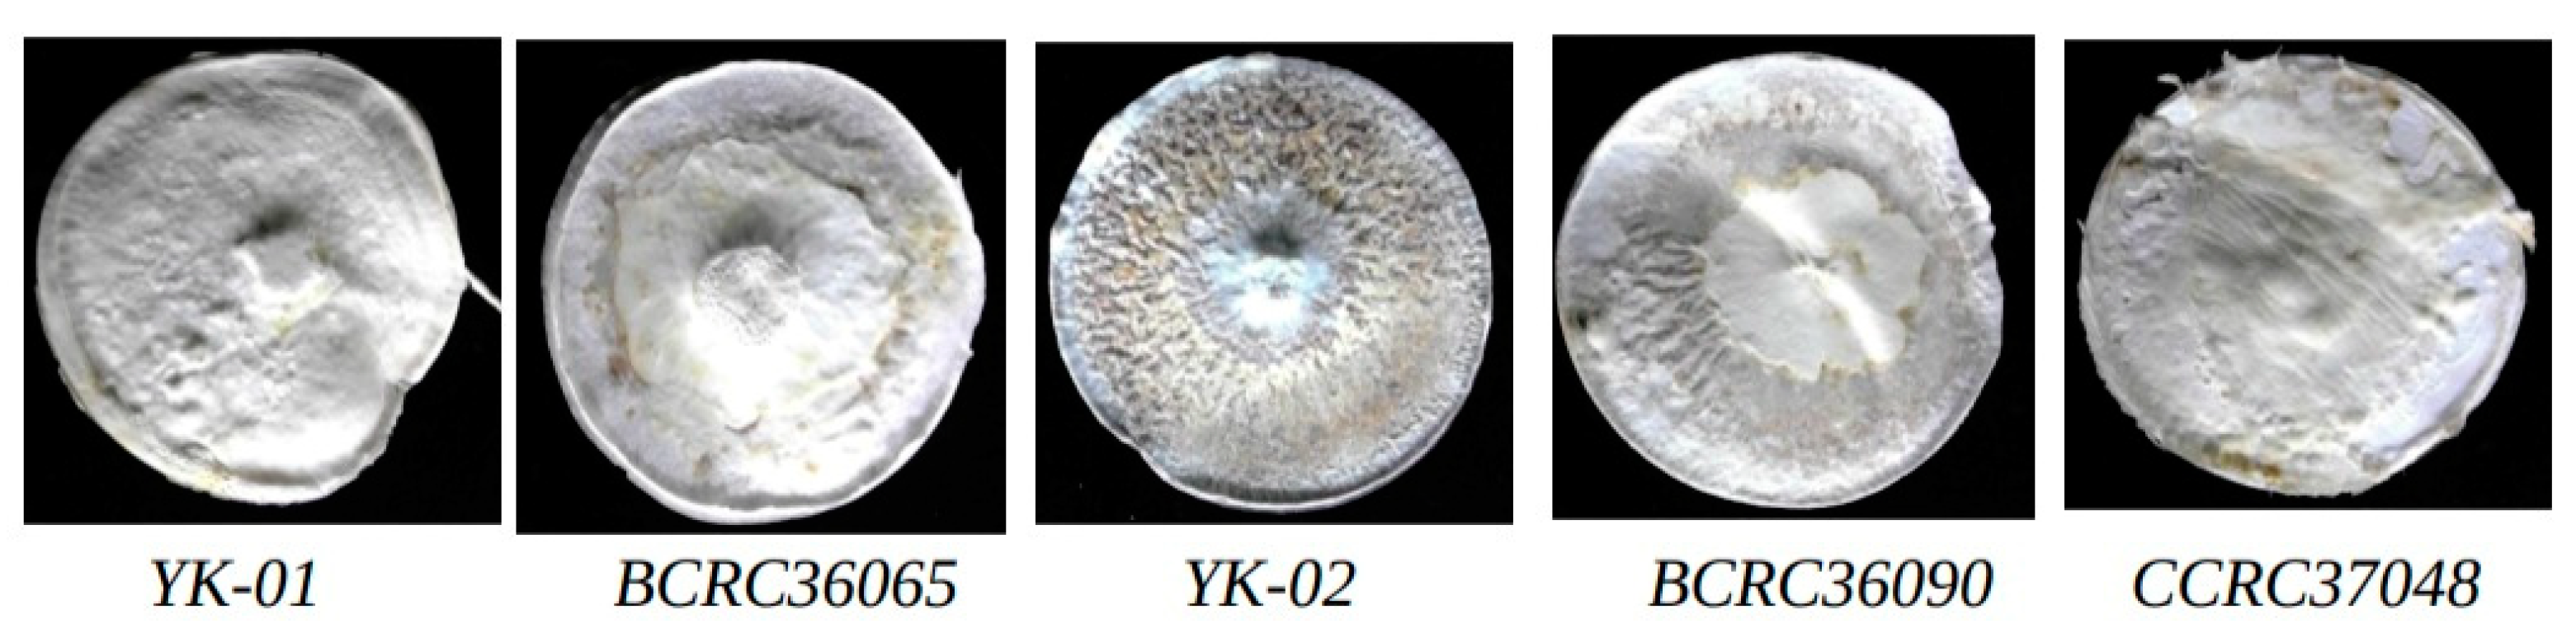

Table 1.
13C NMR spectral data of compounds 1-5. Compounds 1, 5 and 2, 3, 4 were dissolved in CDCl3 and CD3OD, respectively.
Table 1.
13C NMR spectral data of compounds 1-5. Compounds 1, 5 and 2, 3, 4 were dissolved in CDCl3 and CD3OD, respectively.
| 1 | 2 | 3 | 4 | 5 | |
|---|---|---|---|---|---|
| No. | |||||
| 1 | 30.6 (t) | 37.1 (t) | 31.2 (t) | 37.1 (t) | 30.8 (t) |
| 2 | 23.1 (t) | 28.3 (t) | 26.7 (t) | 28.5 (t) | 27.6 (t) |
| 3 | 78.1 (d) | 79.6 (d) | 76.8 (d) | 79.6 (d) | 217.9 (s) |
| 4 | 36.5 (s) | 38.6 (s) | 38.4 (s) | 38.6 (s) | 36.9 (s) |
| 5 | 44.0 (d) | 50.7 (d) | 44.3 (d) | 50.5 (d) | 51.2 (d) |
| 6 | 22.8 (t) | 24.1 (t) | 24.0 (t) | 24.0 (t) | 26.3 (t) |
| 7 | 121.2 (d) | 121.6 (d) | 122.6 (d) | 122.6 (d) | 19.4 (t) |
| 8 | 140.1 (s) | 143.9 (s) | 142.4 (s) | 141.7 (s) | 133.3 (s) |
| 9 | 145.9 (s) | 147.5 (s) | 147.9 (s) | 147.4 (s) | 135.1 (s) |
| 10 | 37.3 (s) | 39.8 (s) | 38.5 (s) | 39.8 (s) | 44.5 (s) |
| 11 | 115.6 (d) | 117.4 (d) | 116.7 (d) | 117.4 (d) | 21.0 (t) |
| 12 | 38.0 (t) | 39.1 (t) | 39.8 (t) | 39.3 (t) | 31.0 (t) |
| 13 | 43.9 (s) | 44.8 (s) | 45.4 (s) | 45.1 (s) | 47.4 (s) |
| 14 | 51.4 (s) | 51.5 (s) | 53.4 (s) | 52.6 (s) | 49.9 (s) |
| 15 | 77.3 (d) | 32.6 (t) | 75.2 (d) | 78.8 (d) | 36.0 (t) |
| 16 | 36.4 (t) | 28.5 (t) | 39.9 (t) | 37.4 (t) | 35.2 (t) |
| 17 | 45.2 (d) | 48.6 (d) | 46.4 (d) | 46.5 (d) | 46.8 (d) |
| 18 | 15.9 (q) | 16.2 (q) | 16.5 (q) | 16.4 (q) | 15.8 (q) |
| 19 | 22.6 (q) | 23.3 (q) | 23.3 (q) | 23.3 (q) | 24.2 (q) |
| 20 | 40.8 (d) | 42.4 (d) | 42.3 (d) | 42.1 (d) | 41.4 (d) |
| 21 | 11.5 (q) | 12.1 (q) | 12.2 (q) | 12.1 (q) | 11.7 (q) |
| 22 | 72.5 (d) | 73.4 (d) | 73.4 (d) | 73.2 (d) | 72.8 (d) |
| 23 | 35.2 (t) | 35.8 (t) | 35.8 (t) | 35.7 (t) | 34.6 (t) |
| 24 | 141.0 (d) | 141.0 (d) | 141.0 (d) | 140.8 (d) | 151.3 (d) |
| 25 | 128.9 (s) | 130.1 (s) | 130.1 (s) | 130.2 (s) | 140.6 (s) |
| 26 | 171.3 (s) | 171.7 (s) | 171.5 (s) | 173.1 (s) | 195.2 (d) |
| 27 | 12.4 (q) | 12.8 (q) | 12.7 (q) | 12.8 (q) | 9.5 (q) |
| 28 | 18.5 (q) | 26.2 (q) | 18.0 (q) | 18.9 (q) | 18.7 (q) |
| 29 | 27.8 (q) | 28.8 (q) | 28.9 (q) | 28.8 (q) | 26.2 (q) |
| 30 | 22.4 (q) | 16.5 (q) | 23.4 (q) | 16.5 (q) | 21.3 (q) |
| OAc | 170.8 (s) | 171.6 (s) | |||
| OAc | 170.8 (s) | ||||
| OCOCH3 | 21.3 (q) | 21.2 (q) | |||
| OCOCH3 | 21.4 (q) |
Table 2.
1H NMR and HMBC spectral data of compounds 1-5. Compounds 1, 5 and 2, 3, 4 were dissolved in CDCl3 and CD3OD, respectively.
Table 2.
1H NMR and HMBC spectral data of compounds 1-5. Compounds 1, 5 and 2, 3, 4 were dissolved in CDCl3 and CD3OD, respectively.
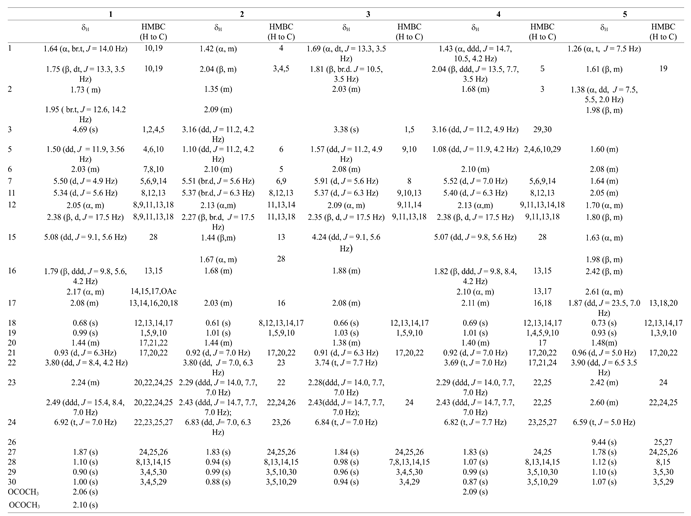 |
Table 3.
Calibrations, analytical precission and recovery data of ganoderic acid T (10) and S (12).
| Linear regression calibration curves | ||||||||
| 10 | 12 | |||||||
| R2 | 0.9984 | 0.9995 | ||||||
| Linear range (g/mL) | 25-3000 | 25-1000 | ||||||
| LOD (Limit of Detection, g/mL) | 2.2 | 2.1 | ||||||
| LOQ (Limit of Quantitation, g/mL) | 6.4 | 6.4 | ||||||
| Intraday and Interday precision | ||||||||
| Concentration (g/mL) | Mean ± SD (RSD, %) | |||||||
| 10 | 12 | |||||||
| Intraday | Interday | Intraday | Interday | |||||
| 100.0 | 101.8 ± 0.15 (0.15) | 100.7 ± 0.06 (0.06) | 101.8 ± 0.42 (0.41) | 100.9 ± 0.11 (0.11) | ||||
| 400.0 | 406.9 ± 1.63 (0.40) | 403.6 ± 0.26 (0.06) | 407.4 ± 0.48 (0.12) | 401.9 ± 0.36 (0.09) | ||||
| 800.0 | 813.8 ± 0.36 (0.04) | 808.0 ± 0.72 (0.09) | 814.7 ± 1.74 (0.21) | 803.9 ± 3.55 (0.44) | ||||
| Recovery tests | ||||||||
| amount added (g/mL) | amount measured (g/mL) , Mean ± SD |
Recovery (%) | RSD (%) | |||||
| 10 | 12 | 10 | 12 | 10 | 12 | |||
| 0 (placebo) | 1216.0 ± 9.60a | 368.1 ± 3.63a | ||||||
| 100.0 | 1322.3 ± 2.39b | 473.6 ± 1.58b | 106.3 | 105.5 | 2.25 | 1.50 | ||
| 400.0 | 1636.7 ± 6.78b | 777.0 ± 11.35b | 105.2 | 102.2 | 1.61 | 2.78 | ||
| 800.0 | 2067.3 ± 13.14b | 1139.3 ± 5.91b | 106.4 | 96.4 | 1.54 | 0.77 | ||
[a] The average contents (mean ± SD, n = 3) of 10 and 12 in YK-01 mycelium. [b] Values including placebo.
Disclaimer/Publisher’s Note: The statements, opinions and data contained in all publications are solely those of the individual author(s) and contributor(s) and not of MDPI and/or the editor(s). MDPI and/or the editor(s) disclaim responsibility for any injury to people or property resulting from any ideas, methods, instructions or products referred to in the content. |
© 2023 by the authors. Licensee MDPI, Basel, Switzerland. This article is an open access article distributed under the terms and conditions of the Creative Commons Attribution (CC BY) license (http://creativecommons.org/licenses/by/4.0/).
Copyright: This open access article is published under a Creative Commons CC BY 4.0 license, which permit the free download, distribution, and reuse, provided that the author and preprint are cited in any reuse.


