1. Introduction
Cities around the globe are experiencing unprecedented growth, with rampant construction often outpacing the available resources. This surge is not just limited to buildings; many urban infrastructure projects spread across sectors further complicate the urban fabric. Managing these projects means grappling with a vast amount of data. As a result, urban management now places significant emphasis on individuals, businesses, organizations, and transportation systems. As cities continuously evolve in response to these complex demands, they seek new tools to aid their transformation. Thompson et al. (2016) [
1] championed the use of digital tools like Building Information Modeling (BIM), Geographic Information Systems (GIS), data science, and information visualization. These tools do not just streamline urban planning; they are also pivotal for preserving the rich historical heritage that cities house.
The digitization of historical heritage is not merely a byproduct of this urban evolution but a necessity. As El-Hakim et al. (2004) [
2] elucidate, there are compelling reasons for this move to digital: the documentation of landmarks for post-disaster reconstruction, crafting educational resources, rebuilding lost or damaged monuments, accessing otherwise inaccessible scenes, ensuring safe interaction with fragile artifacts, and even fueling the burgeoning virtual tourism and museum sectors.
However, with the digitization process comes its own set of challenges. 3D scanning technologies, while efficient in capturing spatial information, produce extensive data sets. They are especially beneficial for inaccessible or high-risk areas, such as specific historic structures. Techniques like laser scanning and photogrammetry have overshadowed traditional 2D representation methods, as those methods have lingering issues of data ambiguity. This can lead to confusion about a building’s condition or even its historical timeline [
3,
4].
Beyond the digitalization process, effectively utilizing digital data is a crucial challenge. Augmented Reality (AR) emerges as a transformative tool in this scenario. AR is defined by the real-time overlay of virtual elements onto the physical environment through a visual device [
5,
6]. An AR environment enables the integration of computational interfaces, facilitating a seamless interaction between users and their surroundings or even other users. From a technological perspective, a visualization device is essential for displaying augmented Reality, whether through direct optical vision or video viewing. Moreover, tracking techniques are crucial for determining scene orientation, using captured images to accurately position virtual objects added to the physical environment [
7]. Visualization devices, ranging from screens, smartphones, and smart glasses to multimedia projectors and webcams, when paired with tracking techniques, bring forth these virtual elements, epitomizing Augmented Reality. Consequently, AR technology offers an intuitive and context-specific means to display and layer multiple data sets, making it highly applicable in urban and heritage contexts. Kaji et al. (2018) [
8] noted that AR technology has seen amplified adoption in the tourism and maintenance sectors due to its economic benefits.
However, given advancements in hardware and software, future studies must focus on natural urban environments. While applications that intertwine AR with urban settings exist, this domain still grapples with numerous gaps and unresolved questions.
Augmented Reality is a pivotal tool in urban settings, particularly in heritage preservation. Notably, many intervention projects in historic buildings overlook continuous maintenance proposals, leading to a critical need for preventive, corrective, and emergency measures. This oversight results in many of Brazil’s historic edifices being neglected until they are on the brink of total degradation. Rather than these structures just being restored without a clear objective, AR provides a comprehensive solution. By documenting these constructions, AR offers an invaluable snapshot of their current conditions. Beyond mere documentation, AR deepens our connection to cultural heritage by crafting hybrid environments that merge the past—through virtually recreated scenes—and the present. Such an immersive experience not only enhances user understanding but also fosters a more interactive engagement with the visualized heritage, as highlighted by Portalés et al., 2012. Through AR, the maintenance and restoration of heritage buildings gain a more informed and strategic direction. Hence, augmented Reality is highly beneficial in the historical and architectural heritage sector. One application is the integration of 3D geometric models using projection resources within heritage settings, enabling the reconstruction of specific historical moments or places. This approach enriches the user’s visual experience, fostering a deeper connection with the environment [
9,
10].
One popular technique to create 3D geometric models is the point cloud model, a set of three-dimensional points in space representing an object, scene, or environment’s geometry. Although point clouds are not end products, they serve as a means to develop geometric models and further processing stages. Creating these models must consider various factors, including computational effort related to the detail level needed for the final models—a requirement for augmented Reality. In this scenario, applying orthophotos on geometric models can make graphical representation in mixed realities feasible when dealing with a large volume of data [
11,
12].
In addition, data acquisition technologies can become essential components in developing a concise methodology for digitization and application in heritage assets. In the ever-evolving realm of data acquisition technologies, digital photogrammetry, and 3D laser scanning have become indispensable for 3D geometric digitizing and implementing heritage assets [
11]. For instance, the creation of point cloud models relies heavily on these tools, which have risen to prominence in cultural heritage data collection. Advanced algorithms from computer vision combined with techniques like dense matching, multi-view stereovision (MVS), and structure for Motion (SFM) are increasingly employed in engineering, restoring, and maintaining historical assets. Digital photogrammetry stands out due to its speed in data collection, real-time capabilities, advanced automation, and adaptability. Its application in documenting buildings and artifacts brings notable benefits, enabling rapid assessment of conservation states and formulating solutions to existing challenges [
13]. On the other hand, 3D laser scanning, used for acquiring point cloud data, offers varied platforms like airborne laser scanning (ALS), terrestrial laser scanning (TLS), mobile laser scanning (MLS), and handheld laser scanning [
14] to capture heritage data across different scales [
15].
Augmented Reality plays a significant role in these contexts, enhancing the modeling of specific areas and consequently reducing costs related to the acquisition, dissemination, and management of virtual models [
16]. Garagnani and Manferdini (2011) [
17] harnessed AR to visualize laser-scanned historical artifact models, while Kleftodimos et al. [
18] used mobile devices, such as smartphones or tablets, to superimpose virtual elements, such as images, information or interactions, combining digital information with the physical environment, allowing for a richer experience. The main idea of this study was to use AR to educate and inform the public, especially students, about an area of the city with historical and cultural value. This was done through information relevant to the physical environment, allowing an enriching exploration of the place. In addition, using Google Earth to create an interactive virtual tour helped consolidate the acquired knowledge.
The collaborative use of techniques for generating, processing, and visualizing virtual objects, combined with thorough documentation, substantially aids in recording cultural and heritage identities. With the cultural heritage tourism sector actively seeking innovative engagement methods and the surge in tourists using mobile devices, the advantages and potentials of AR are on the rise [
19,
20]. Such technology offers tourists deeper insights into a location’s culture and history. Engaging multiple senses, AR facilitates efficient learning and in-depth knowledge acquisition [
21,
22].
This study aims to propose a systematic methodology for digitizing architectural heritage, spanning data acquisition to augmented reality visualization. Our methodology is driven by goals such as: (i) documenting historical objects and buildings for post-disaster reconstruction, (ii) generating educational resources on history and culture, (iii) restoring extinct or partially destroyed historical monuments, (iv) enabling exploration of challenging real-world scenes, and (v) applications in virtual tourism and museum exhibitions.
As a case study, we’ve digitized a block from the historic site located in Pelourinho, Salvador, Bahia, Brazil. This case serves as a validation and demonstration of our proposed methodology. Furthermore, the digitization of this heritage site stands as another significant contribution of our study, providing a means to preserve the region’s historical value and facilitate its dissemination among visitors and scholars interested in the area.
2. Methodology
The Design Science Research (DSR) was adopted for this study. Design Science Research, also known as Constructive Research, is the "science that seeks to consolidate knowledge about the design and development of solutions to improve existing systems, solve problems, and create new artifacts" [
23]. These artifacts can range from model organizational structures to information system designs, among others. In this research, the artifact refers to implementing an application to visualize historical centers in augmented reality [
24].
Walls, Widmeyer, and El Sawy (1992) [
25] note that Design Science Research, while fundamental for engineering, architecture, and arts, is also relevant to the field of information systems. Furthermore, they advocated for applying DSR concepts in technological research as it facilitates the development of prescriptive theories that assist in devising practical and effective solutions.
In addition, a Systematic Literature Review (SLR) was conducted within this context and method to identify, evaluate, and interpret available studies regarding AR applications used to visualize centers and/or historical heritage. A procedure was adopted that involved using SLR protocols and guiding documents so that experiments aligning with the research interests could be pinpointed, as an SLR is a synthesis of existing work executed following a predefined search strategy [
26,
27].
It is important to note that within the SLR itself, there were sub-stages: SLR protocol, SLR conduct, and synthesis of results. The SLR protocol contains the primary parameters for directing the analysis of articles, such as questions to answer during the reading and analysis of the materials found, application areas, databases, study languages, article types, search strings, keywords, and inclusion and exclusion criteria [
26]. The questions posed in the SLR were:
What AR applications are used for urban and historical center visualization?
What software is used for geometric modeling in AR applications for urban and historical center visualization?
What AR programs are employed for urban and historical center visualization?
What tracking techniques are used in AR applications for urban and historical center visualization?
What devices are used in AR applications for urban and historical center visualization?
Concerning the outlined questions, this technology appears increasingly prominent as a supplementary tool for supporting, documenting, and visualizing historical heritage preservation. The findings indicate a predominance of architectural studies, followed by education. There is also a trend in using Blender as the primary geometric modeling software, 3D Unity for AR implementation, sensors as tracking techniques, and smartphones as the most used visualization device [
28].
Following the SLR, the experiment underwent several stages, which will be detailed in section 2.1 delineation. The project proposal focuses on creating an application that, by combining augmented reality with the historical heritage of Pelourinho, offers an interactive experience to the user. They can access the digital model of the heritage through mobile devices, like smartphones or tablets, allowing for its augmented reality visualization and manipulation and accessing its historical information.
2.1. Outline
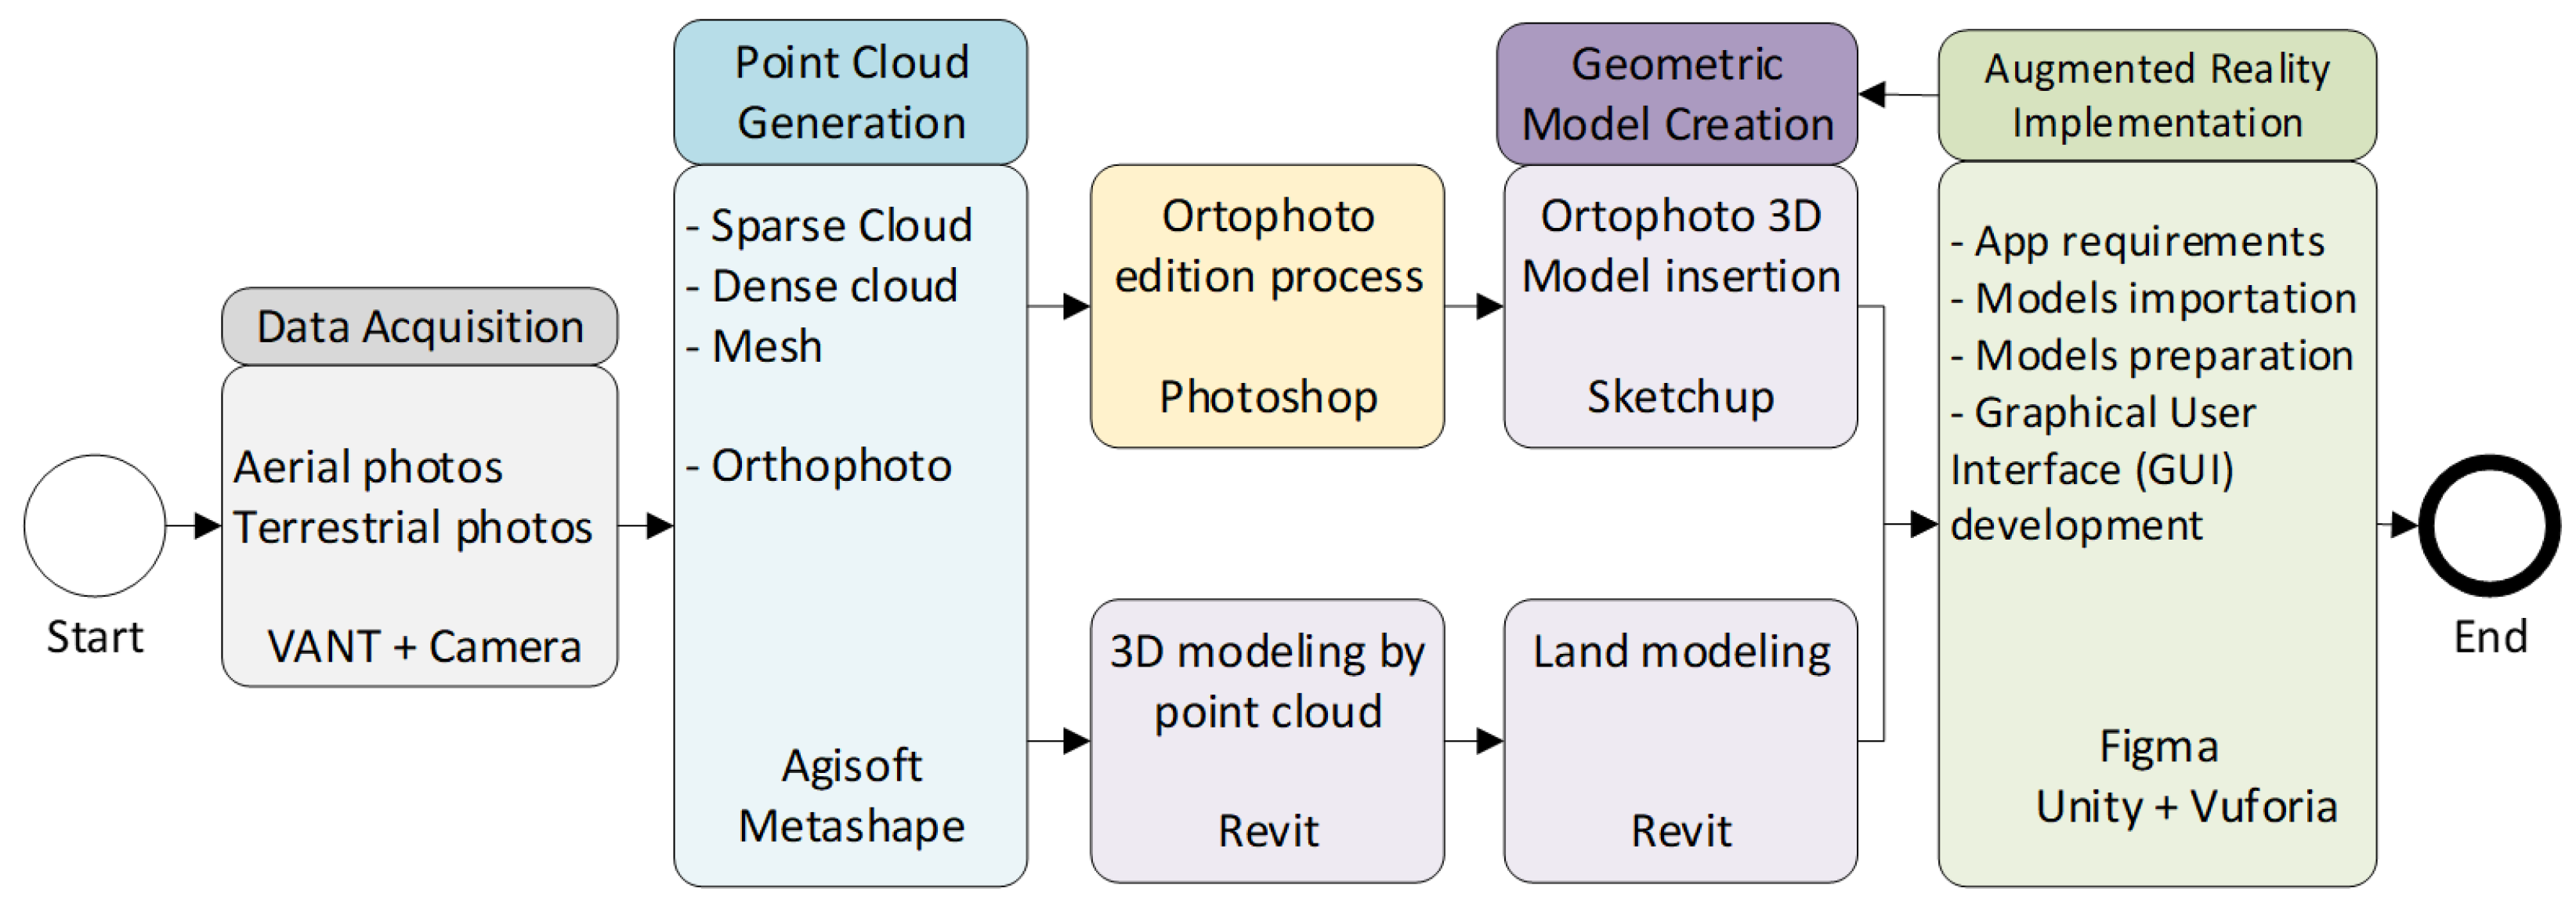
The research outline underwent various stages and employed different technologies and tools (
Figure 1). Following the systematic literature review, the phases of data acquisition, point cloud generation, orthophoto edition process, geometric model creation and augmented reality implementation began. Each of these stages will be detailed in the subsequent sections. Notably, tests with the application’s end-users have not been conducted yet.
2.2. Data Acquisition, Processing, and Registration
The initial phase, data acquisition, was done through aerial and terrestrial photographic surveys. In stages, the aerial photographic survey was executed using an Unmanned Aerial Vehicle (UAV) Phantom 4 model and flight planning through the Pix4Dcapture tool. Three flights at 50 meters height were conducted: the first two orthogonal to each other with the camera’s axis at the nadir and the third with the lens axis at 45 degrees, resulting in 427 photos. The terrestrial data collection was achieved through a photographic shoot using the Nikon D600 camera with an 18-200 mm lens and the Nikon D330 with a 12 mm lens. The point cloud and orthophotos were created during the processing phase using the Agisoft Metashape tool. After this stage, the orthophotos underwent an editing process in Adobe Photoshop before being incorporated into the geometric models crafted in Revit. Concurrently, the digital terrain model was also developed using Revit.
2.3. Augmented Reality Implementation
To optimize the interface creation and refinement process, weekly meetings were held to discuss the application interface’s needs and requirements. Thus, the implementation process underwent various modifications and enhancements. Two main prototypes emerged in its development. The prototype offered a singular experience, only catering to users not present in Pelourinho. The chosen second prototype envisioned an experience that also engaged users present at the Pelourinho historical site.
Moving to the interface and user experience design stage, the tool chosen for designing the app interface was Figma, a design and prototyping software that merges web accessibility with native application features.
During the suitability and study phase, it was found that despite positive results using augmented reality viewer programs like Augin and Augment, the need for a bespoke application with specific functionalities directed the project towards using Game Engines that would allow the development of customized applications for the set objective. Consequently, the Unity 3D platform was selected with the Vuforia plugin. Together, they offer the possibility of developing an application with many functionalities regarding historical heritage and the ability to visualize constructions in AR.
Unity 3D is a free game engine developed by Unity Technologies, utilizing the C programming language for script development. It offers various capabilities, including augmented reality application development associated with AR-focused plugins. Vuforia, on the other hand, is an augmented reality software development kit. It can be integrated with Unity, enabling AR integration in projects developed on this platform.
Development in Unity is conducted through the creation of scenes. These scenes allow designers to define, create, and modify everything visible and hidden within the application. An excessively element-rich scene might lead to poor application performance due to overloading. However, many scenes can also result in the same performance issues because of the frequent scene transitions. Given this characteristic, the application’s structure was designed to balance these aspects: creating distinct scenes for some interfaces, like login and choice, while others utilized a single scene composed of all defined elements for its interface.
2.4. Study Area (Salvador, Brazil, Historic Center)
The Pelourinho experiment, situated in the heart of Salvador’s historic center in Bahia, Brazil, offers a deep dive into the intricate mosaic of Brazil’s cultural and architectural evolution. Salvador is not just another city; it is a living testament to Brazil’s storied past, holding the distinguished title of Brazil’s first capital. Established in 1549 by Tomé de Souza, Salvador was not merely a geographic marker but the epicenter of Portuguese economic ambitions, cultural aspirations, and political strategies during the transformative years between the 16th and 18th centuries [
29].
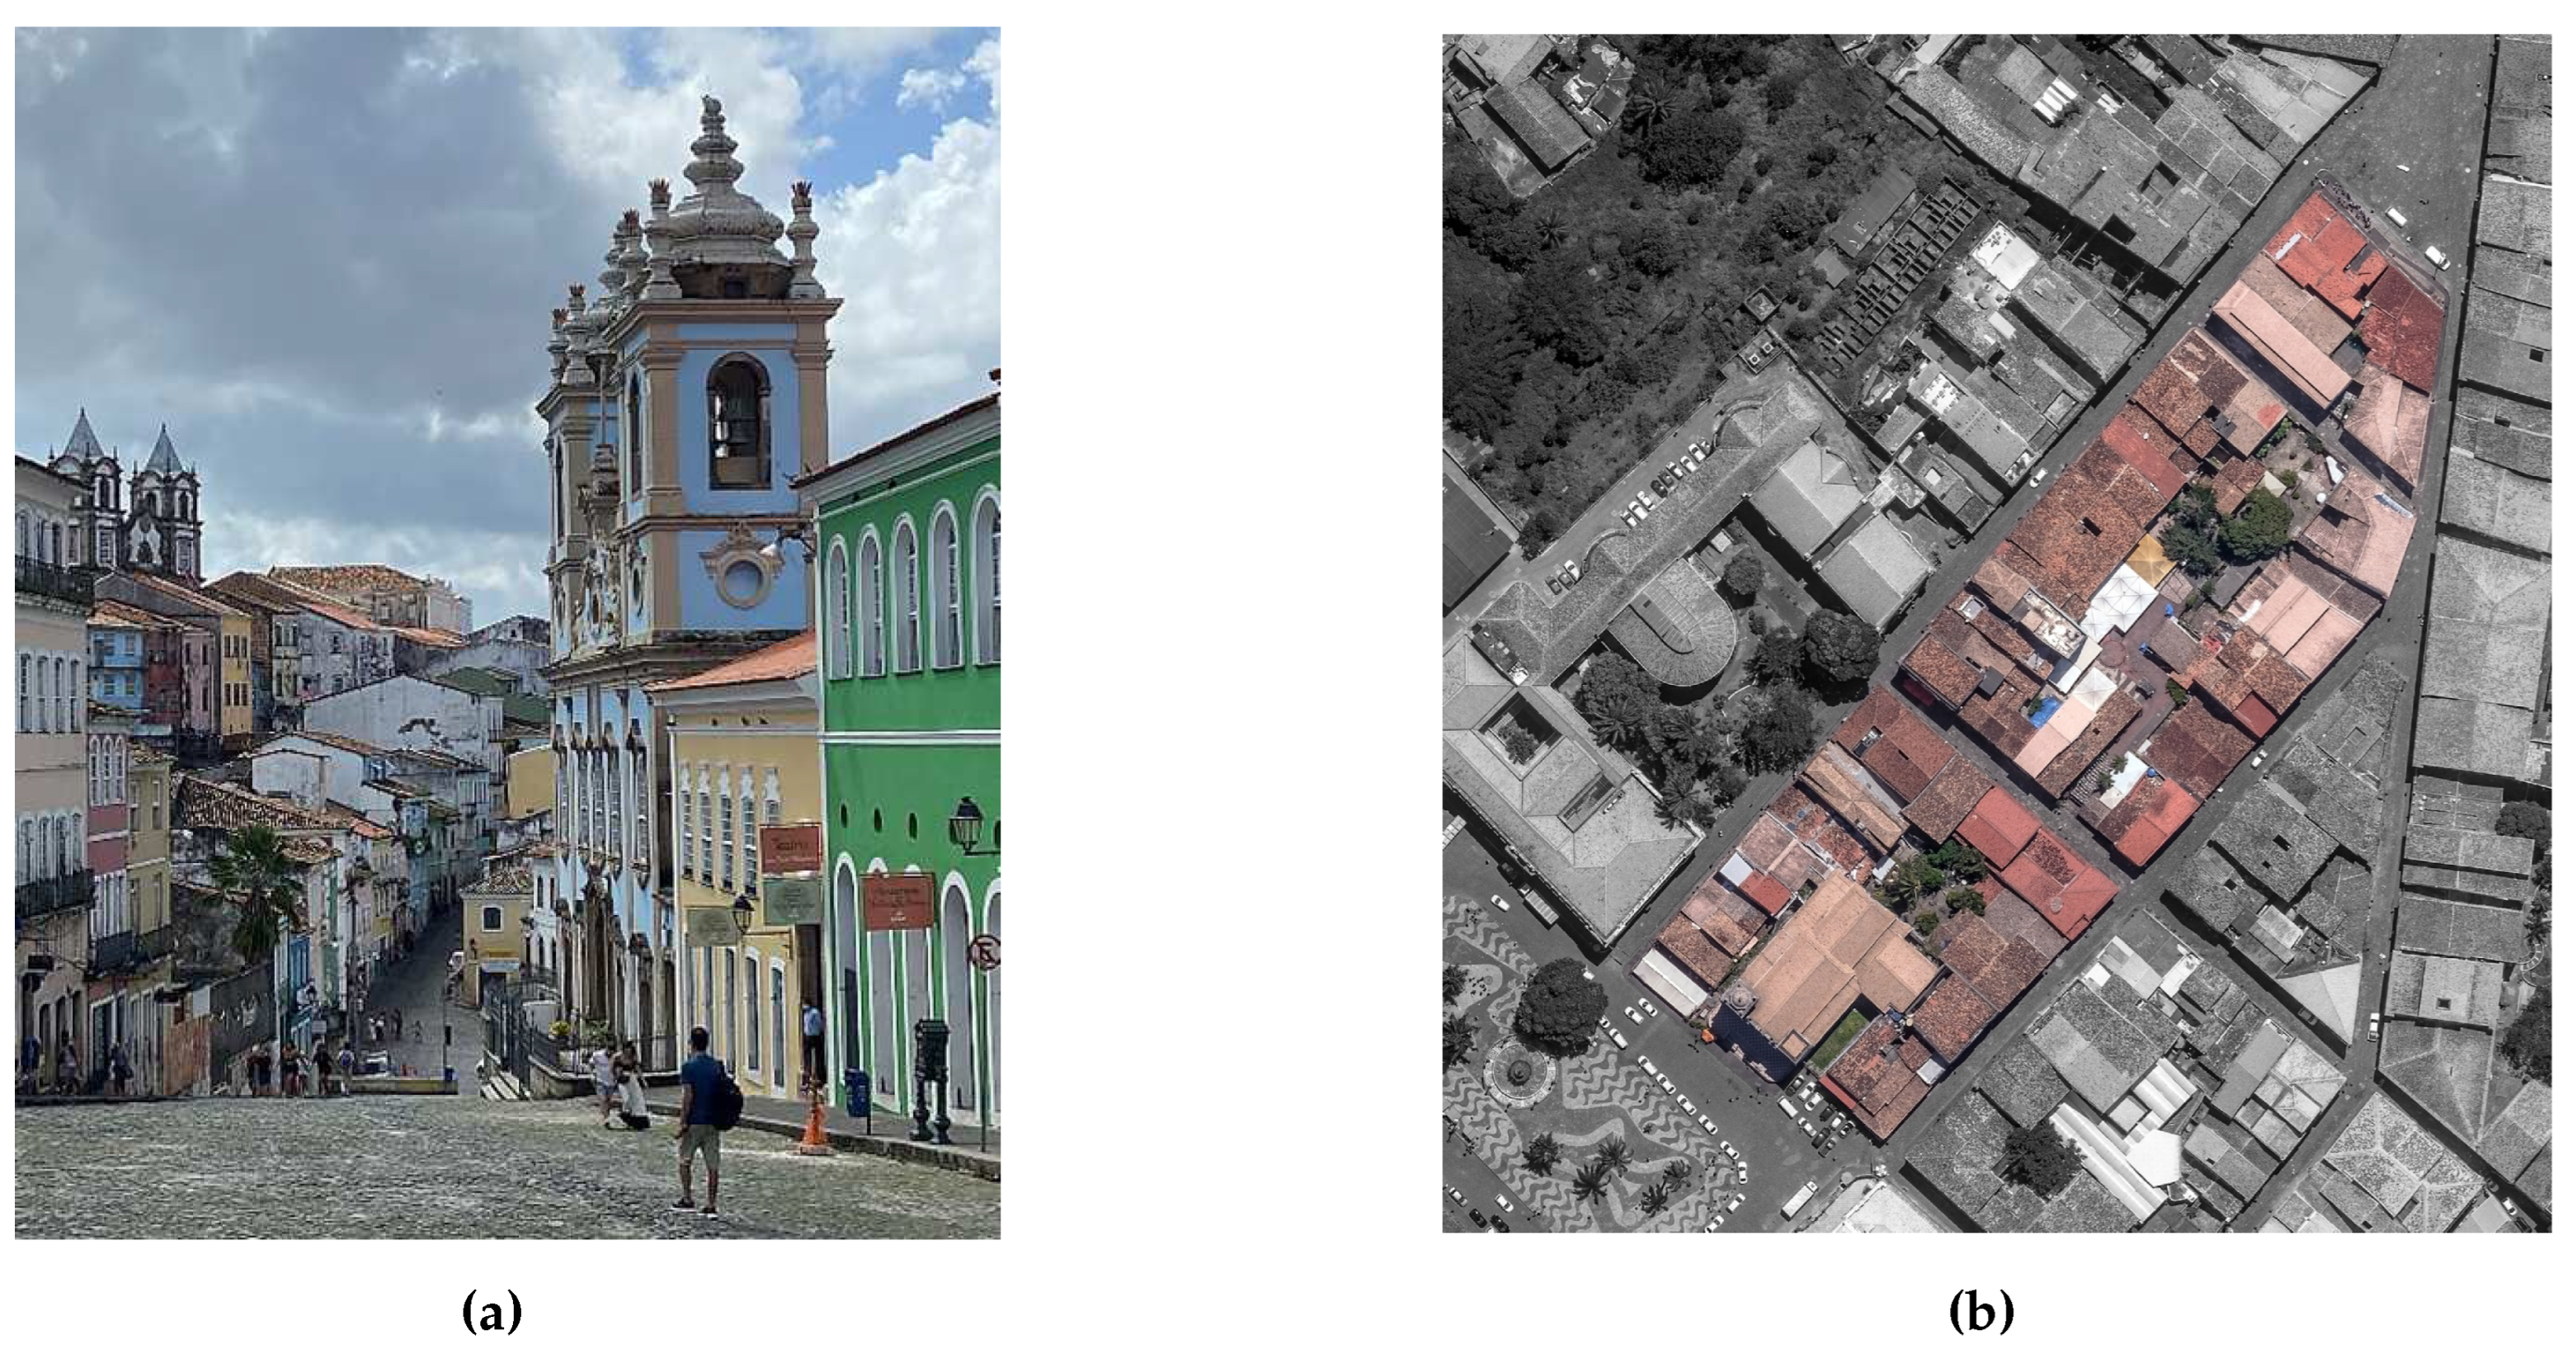
Salvador’s historical importance is so profound that it could not escape the discerning eyes of global cultural organizations. In 1985, UNESCO recognized Salvador’s historic center as a World Heritage Site, underscoring its global significance. The city’s layout, particularly the Pelourinho area, vividly reflects the Portuguese urban vision. This design was not arbitrary; it was intentional and functional. The "upper city" catered to administrative, religious, and elite residential functions, echoing the hierarchical nature of colonial societies. Meanwhile, the "lower city," with its bustling commerce and ports, was the beating heart of Salvador’s economic life. These public spaces and their structural designs are not mere bricks and mortar; they narrate tales of colonial ambitions, societal structures, and evolving cultural dynamics (
Figure 2a) [
29,
30].
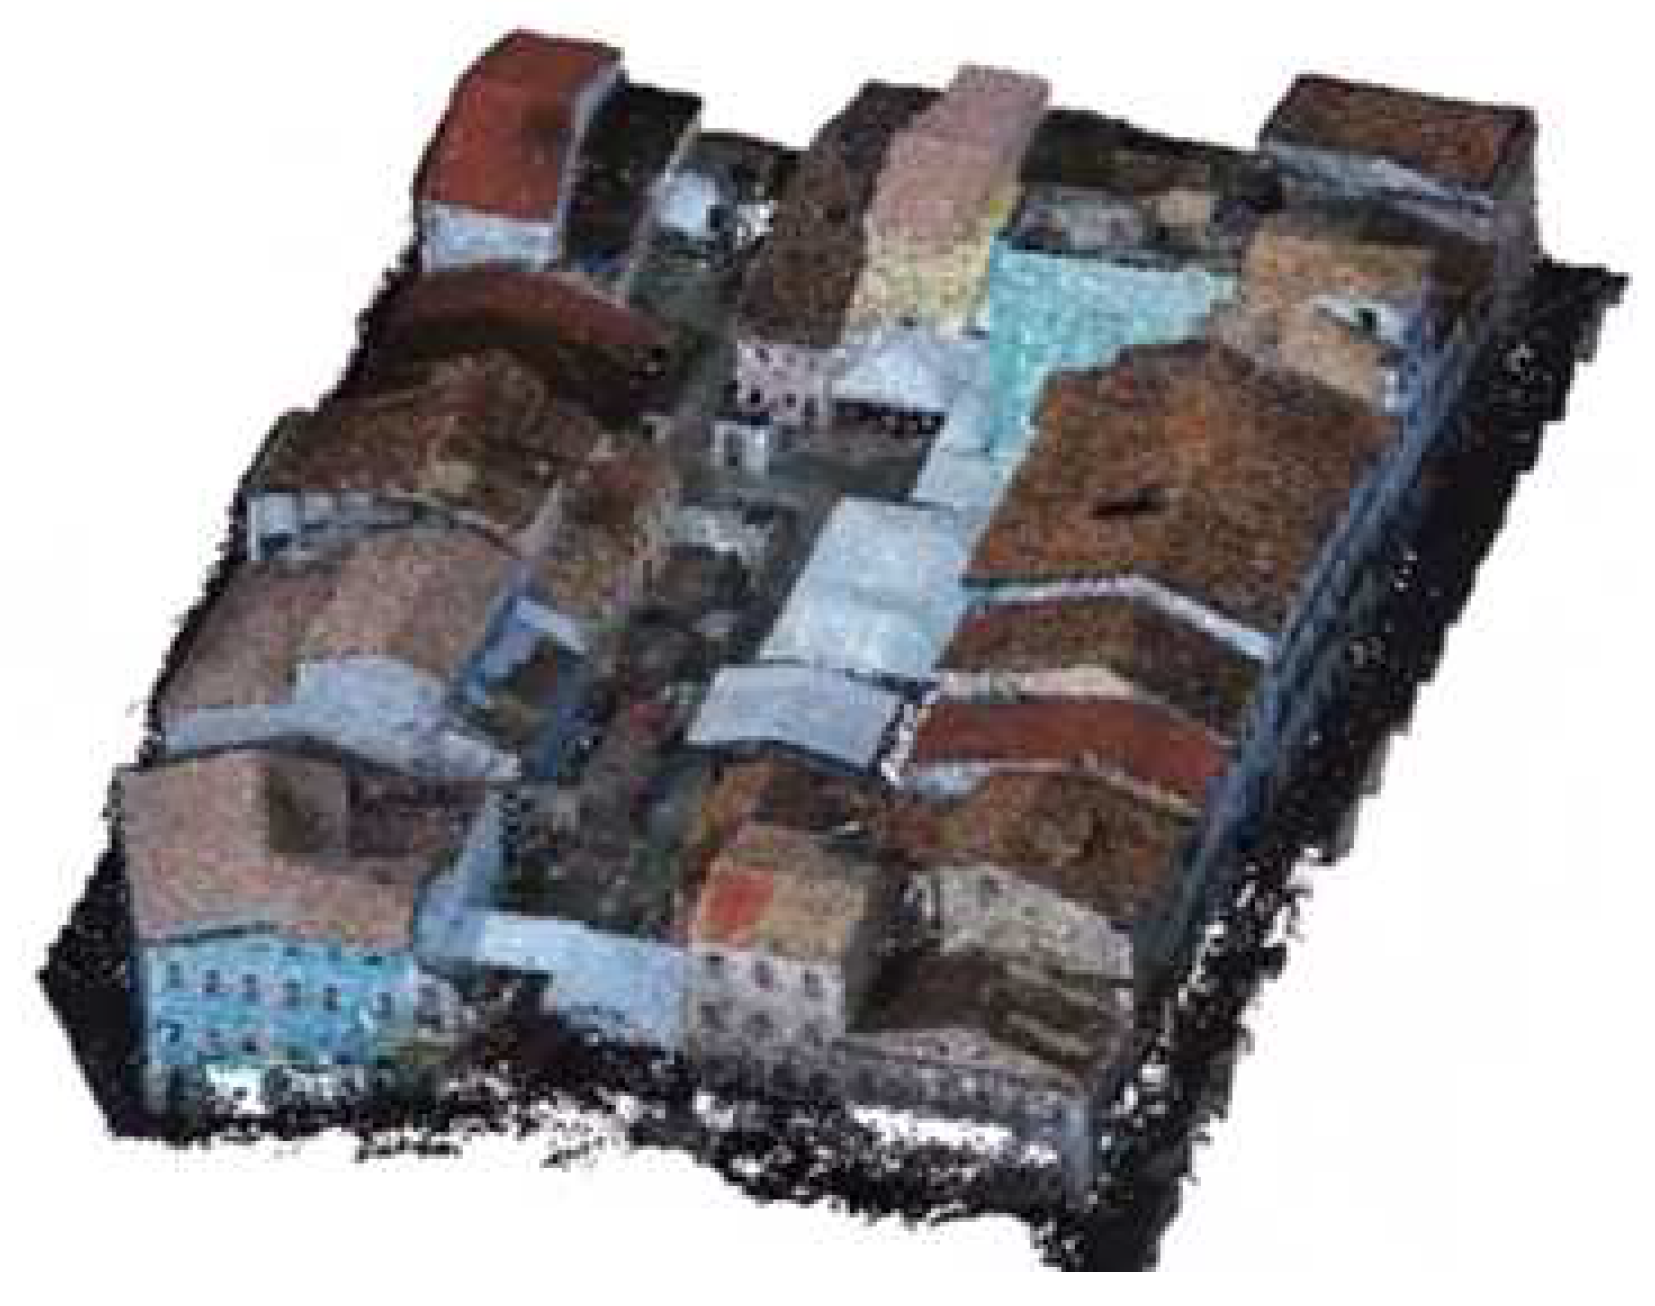
Fast forward to today, and the echoes of the colonial past can still be felt. The historic center stands as a proud guardian of Portuguese urban design, ensuring that future generations can trace the architectural and cultural imprints of the colonial era. Within this context, the present study ventured into three pivotal blocks in Pelourinho, as shown in
Figure 2b, accentuated by the prominence of two iconic structures: The Jorge Amado House Foundation and the Church of São Pedro dos Clérigos.
The Jorge Amado House Foundation is a tribute to one of Brazil’s literary geniuses, Jorge Amado. Inaugurated in 1987, this foundation’s primary mission is to be the custodian of Amado’s vast literary and artistic works. On the other hand, the Church of São Pedro dos Clérigos is an architectural marvel that bridges two significant design philosophies: rococo and neoclassical. Every brick of this 18th-century edifice narrates stories of architectural ingenuity and transitions.
In the digital age, preserving our tangible past becomes even more crucial. In this context, this study is not just an academic endeavor but an effort to digitally Salvador’s heritage. In addition to offering visitors and the general population a tool for better understanding and approximation of the value of this heritage. By leveraging technology, we aim to provide an experience that allows visitors and locals alike to truly comprehend and appreciate the irreplaceable value of Salvador’s culture.
3. Results
3.1. Data Acquisition and Point Cloud Generation
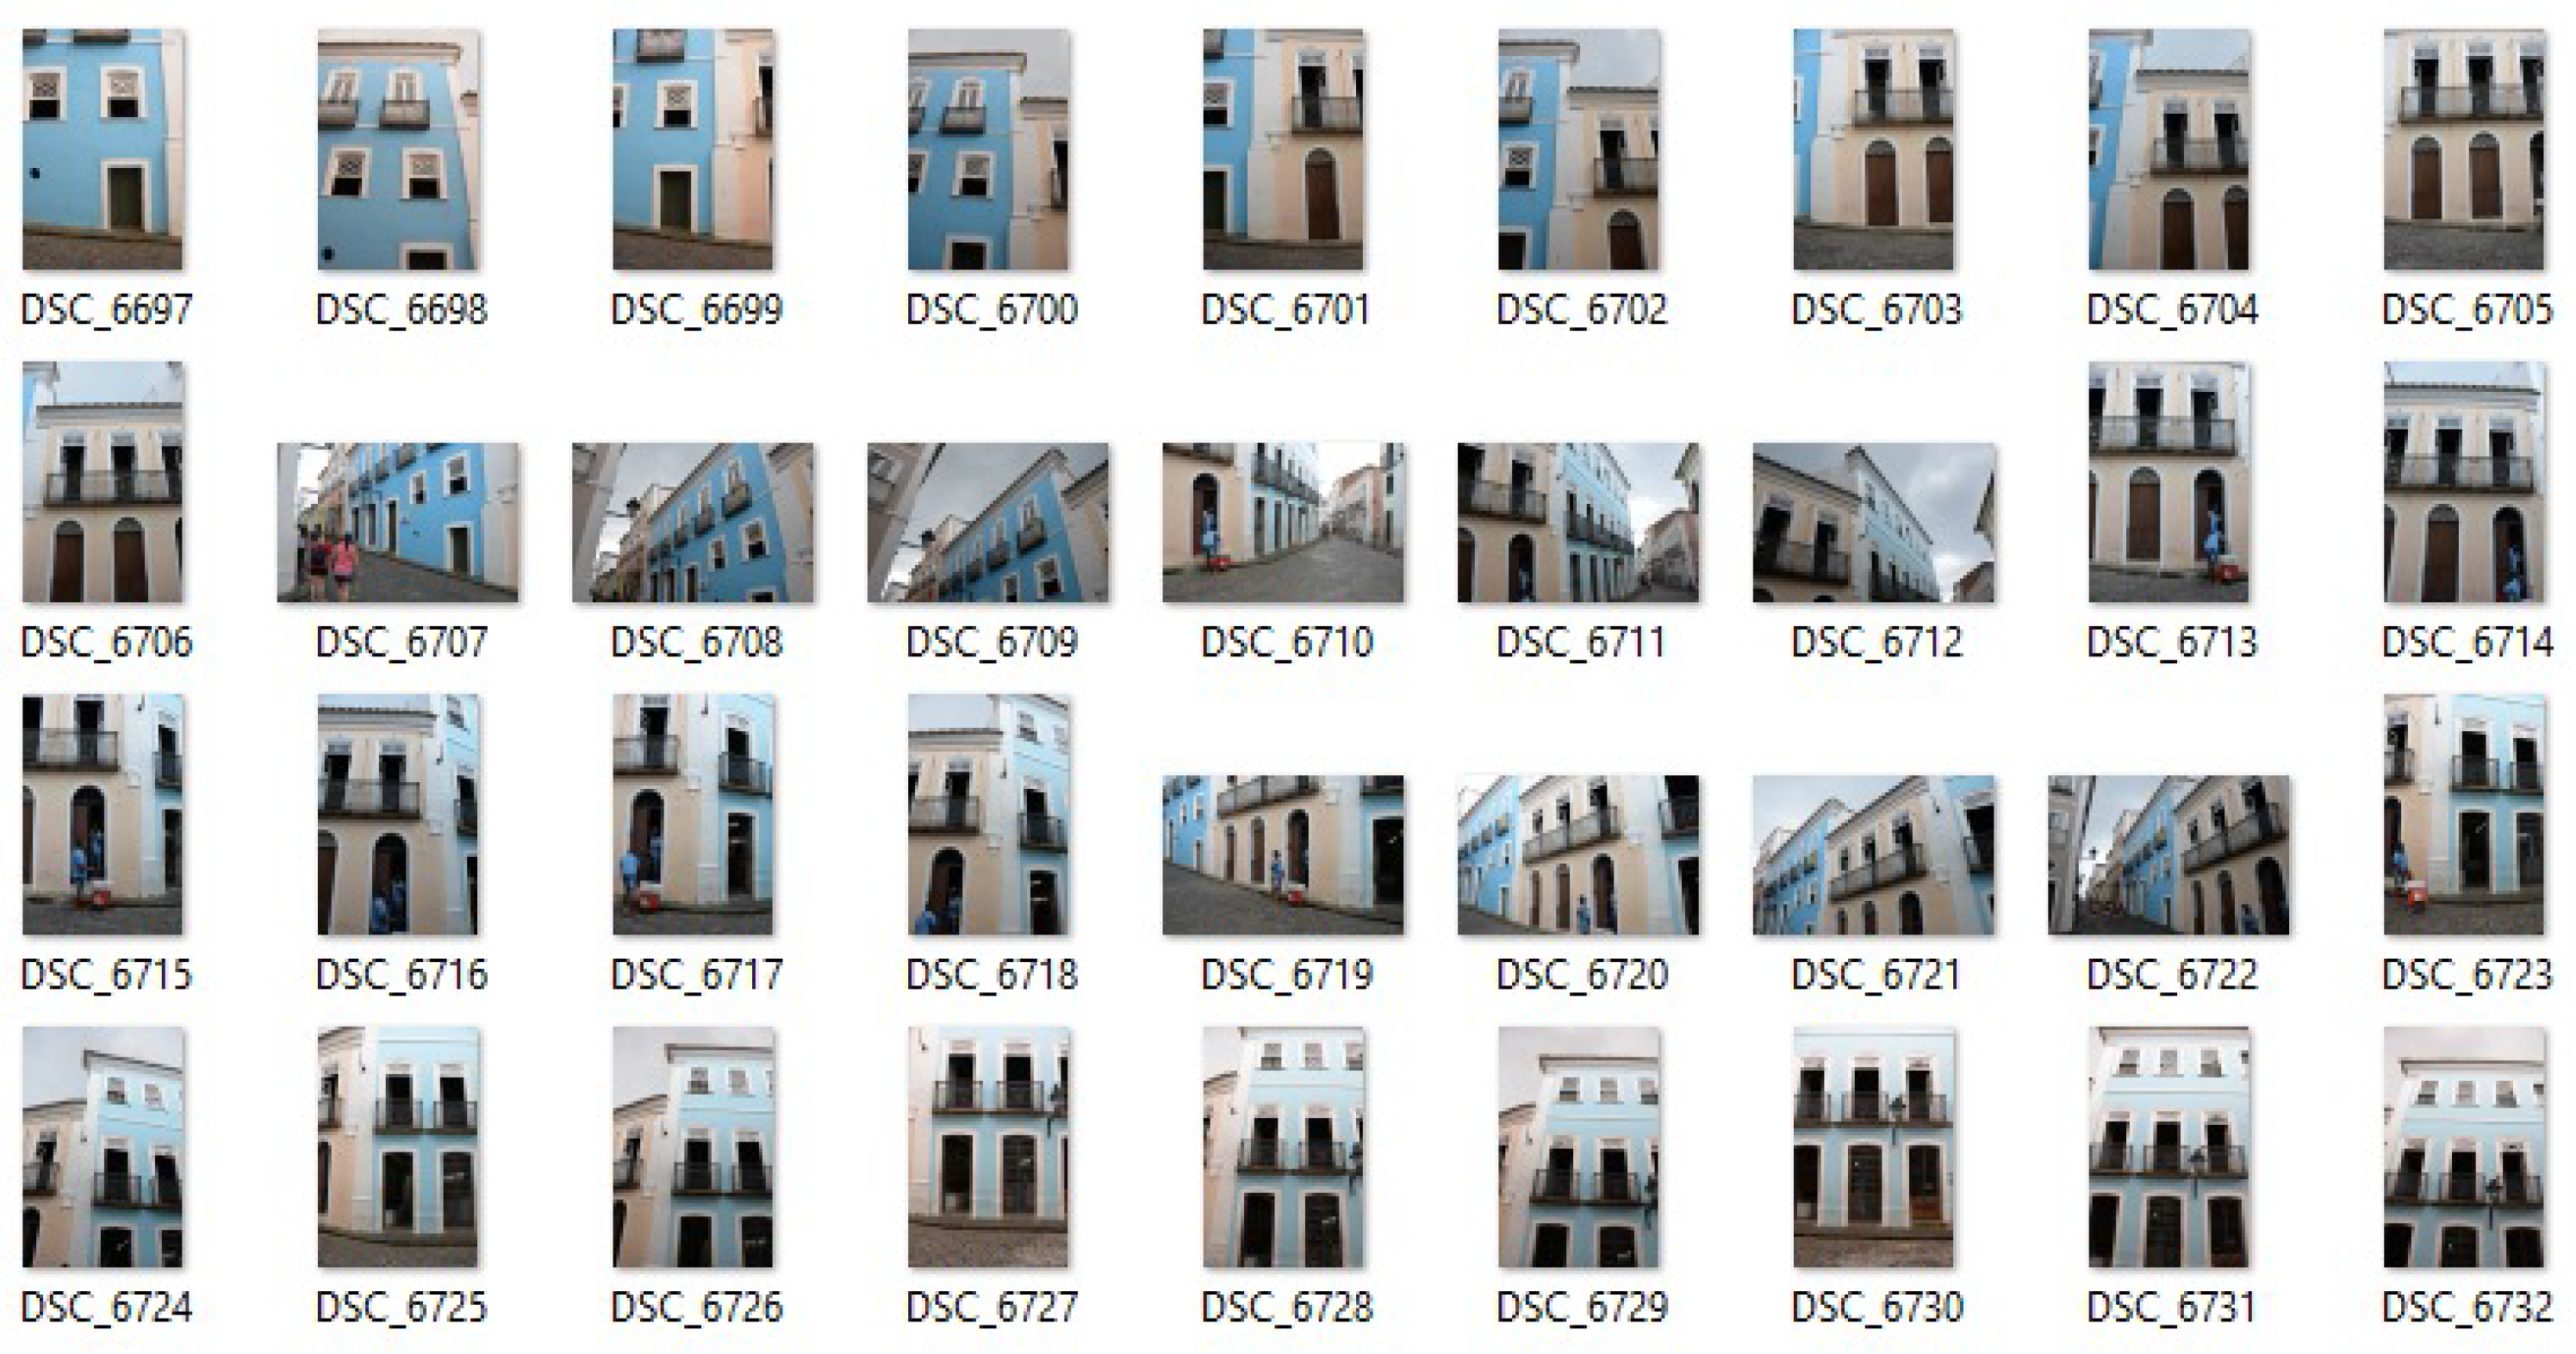
In the initial data collection stage, a significant challenge was faced due to the narrow streets, which made it difficult to capture higher sections of the facade and roofing of the buildings, especially when aiming for an angle of less than 15 degrees between adjacent photos. To ensure clarity and accuracy, the photographs were taken with optimal lighting and sharpness within a short time frame to avoid changes in light conditions. The photographs were then grouped into batches for the processing phase, as illustrated in
Figure 3.
3.2. Point Cloud Generation
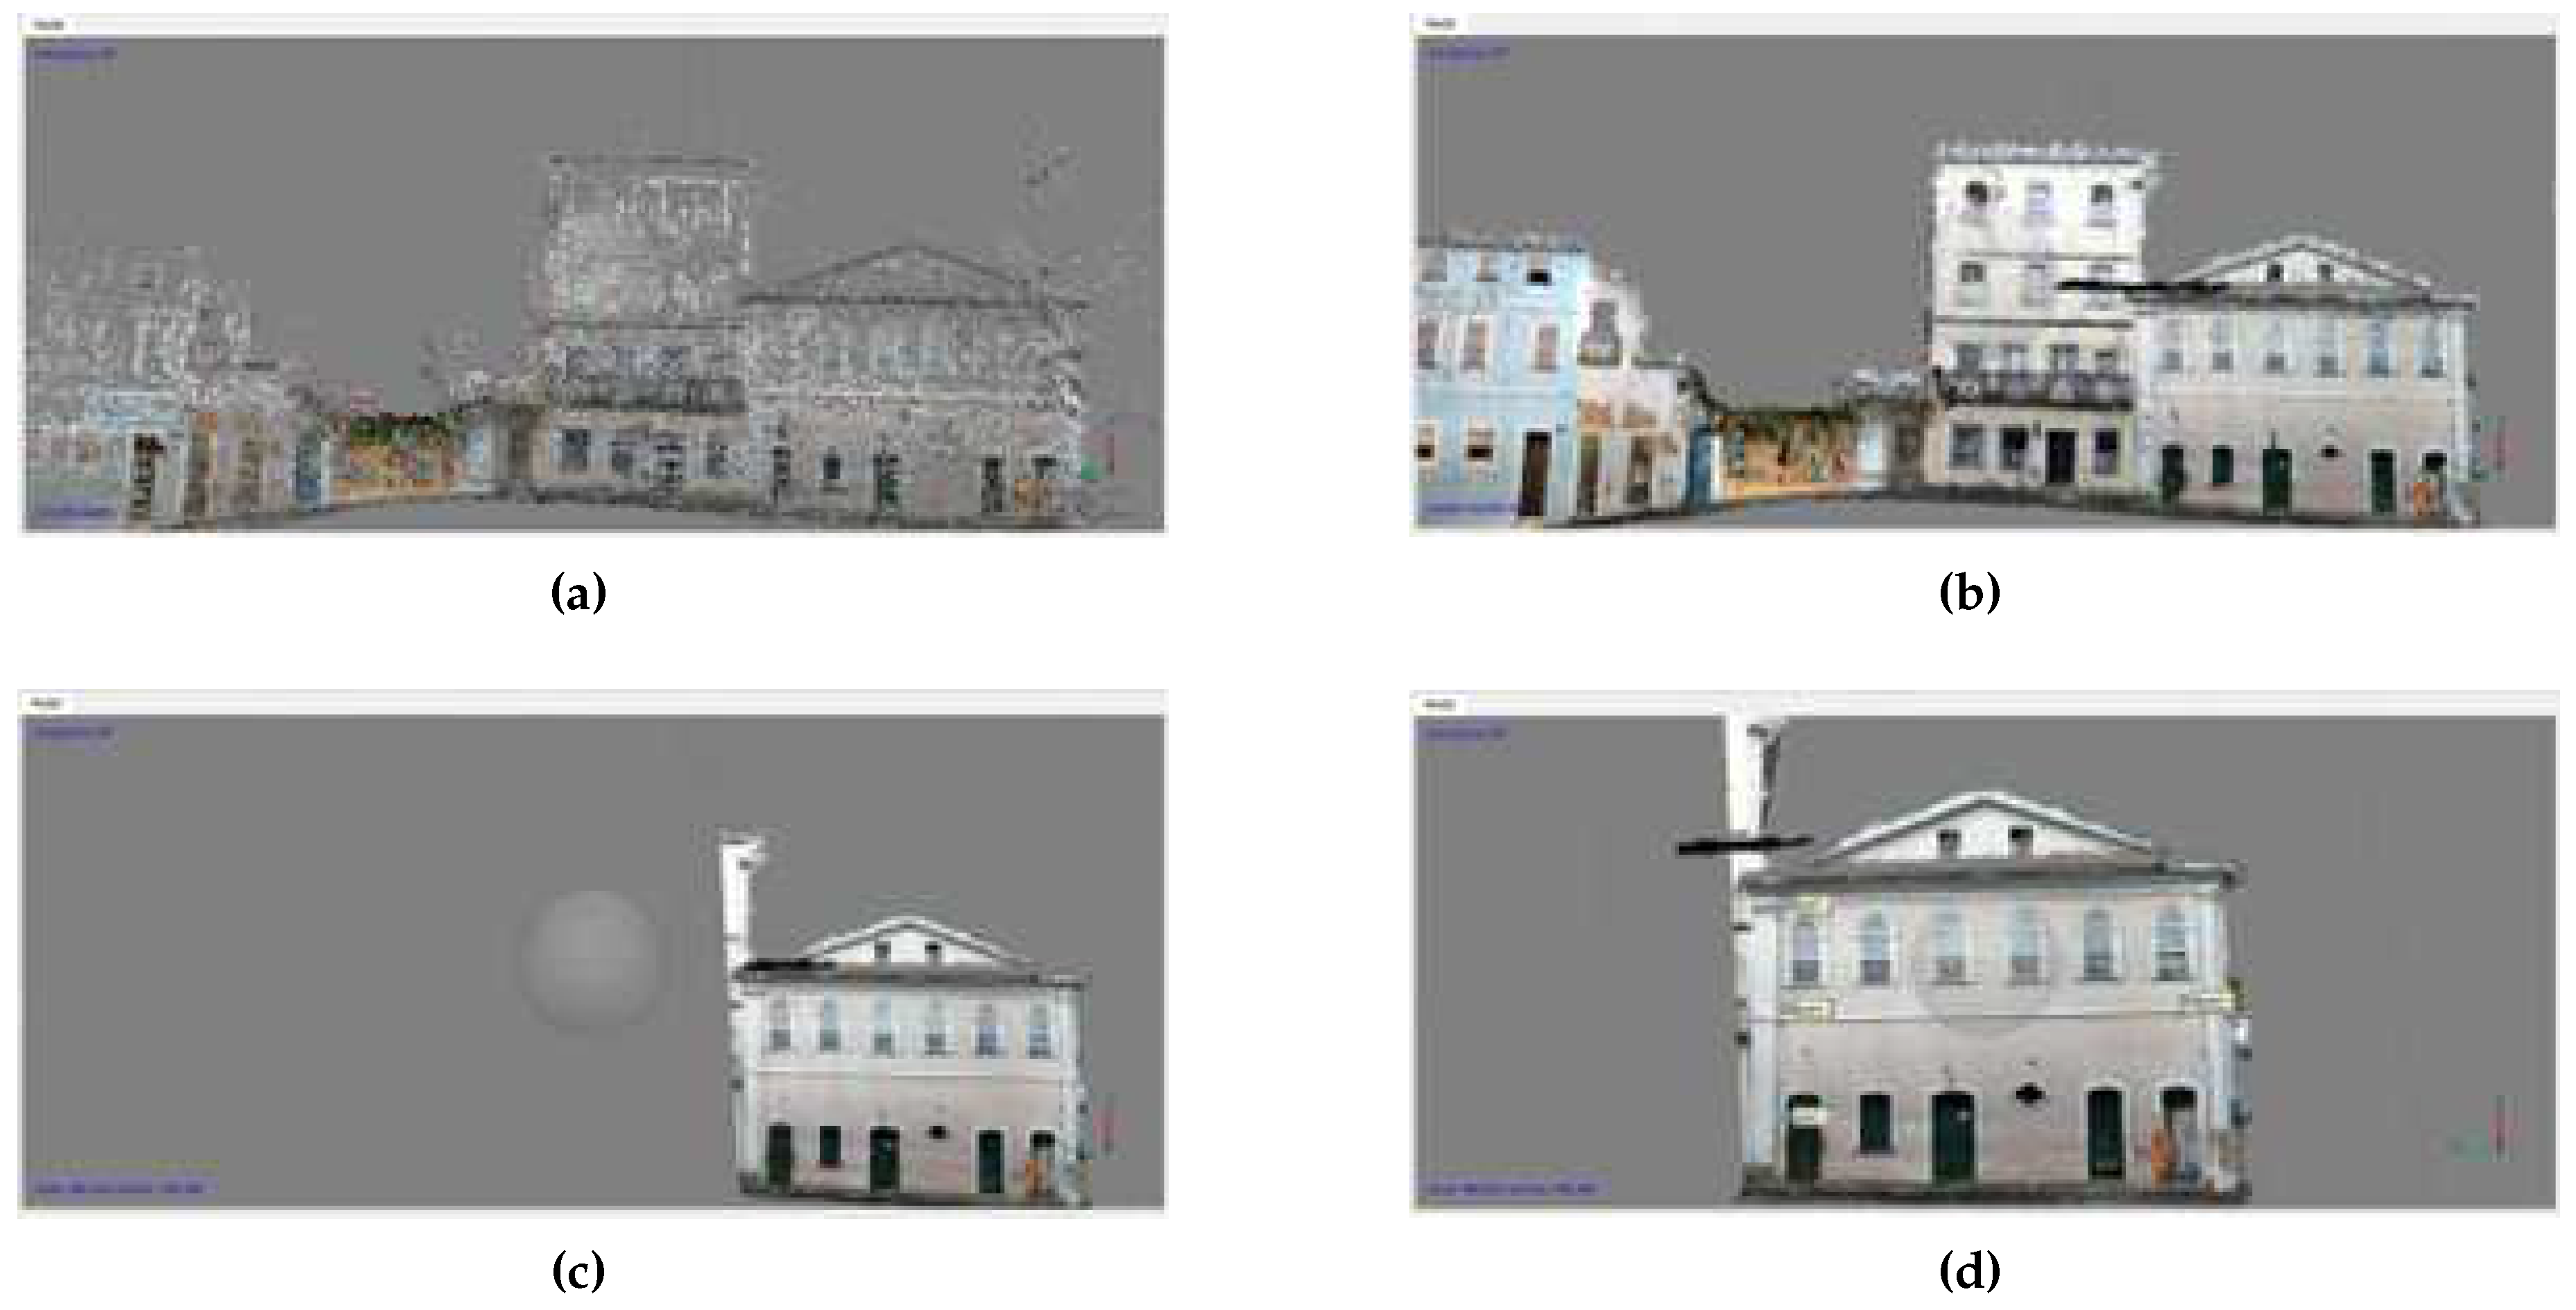
The subsequent pre-processing phase was marked by the generation of the point cloud, which was accomplished using the Agisoft Metashape tool. During this phase, the initial step involved the alignment of photos and determining the orientation of each image, a process automated by the software. The software identifies the camera’s position for each image and fine-tunes its calibration parameters. Once aligned, a sparse point cloud was generated. At this juncture, a selection box was activated to eliminate unwanted points, optimizing the computer’s processing time. With the selection box, the tool only processes points within the box, thereby reducing computational processing time. Following this, a dense point cloud was generated, which led to the creation of a triangular point mesh (Mesh), as shown in
Figure 4. The final steps involved creating orthophotos of the facades, which would undergo further editing in the next phase.
As a result of this phase, the following were generated: (i) the point cloud of the facades in the *.psx file format, (ii) the point cloud of the roofs in the *.psx file format, and (iii) the orthophotos of the facades in the *.tif file format. It is important to note that the point cloud generated from aerial and terrestrial photographic surveys was processed separately before merging, as depicted in
Figure 5.
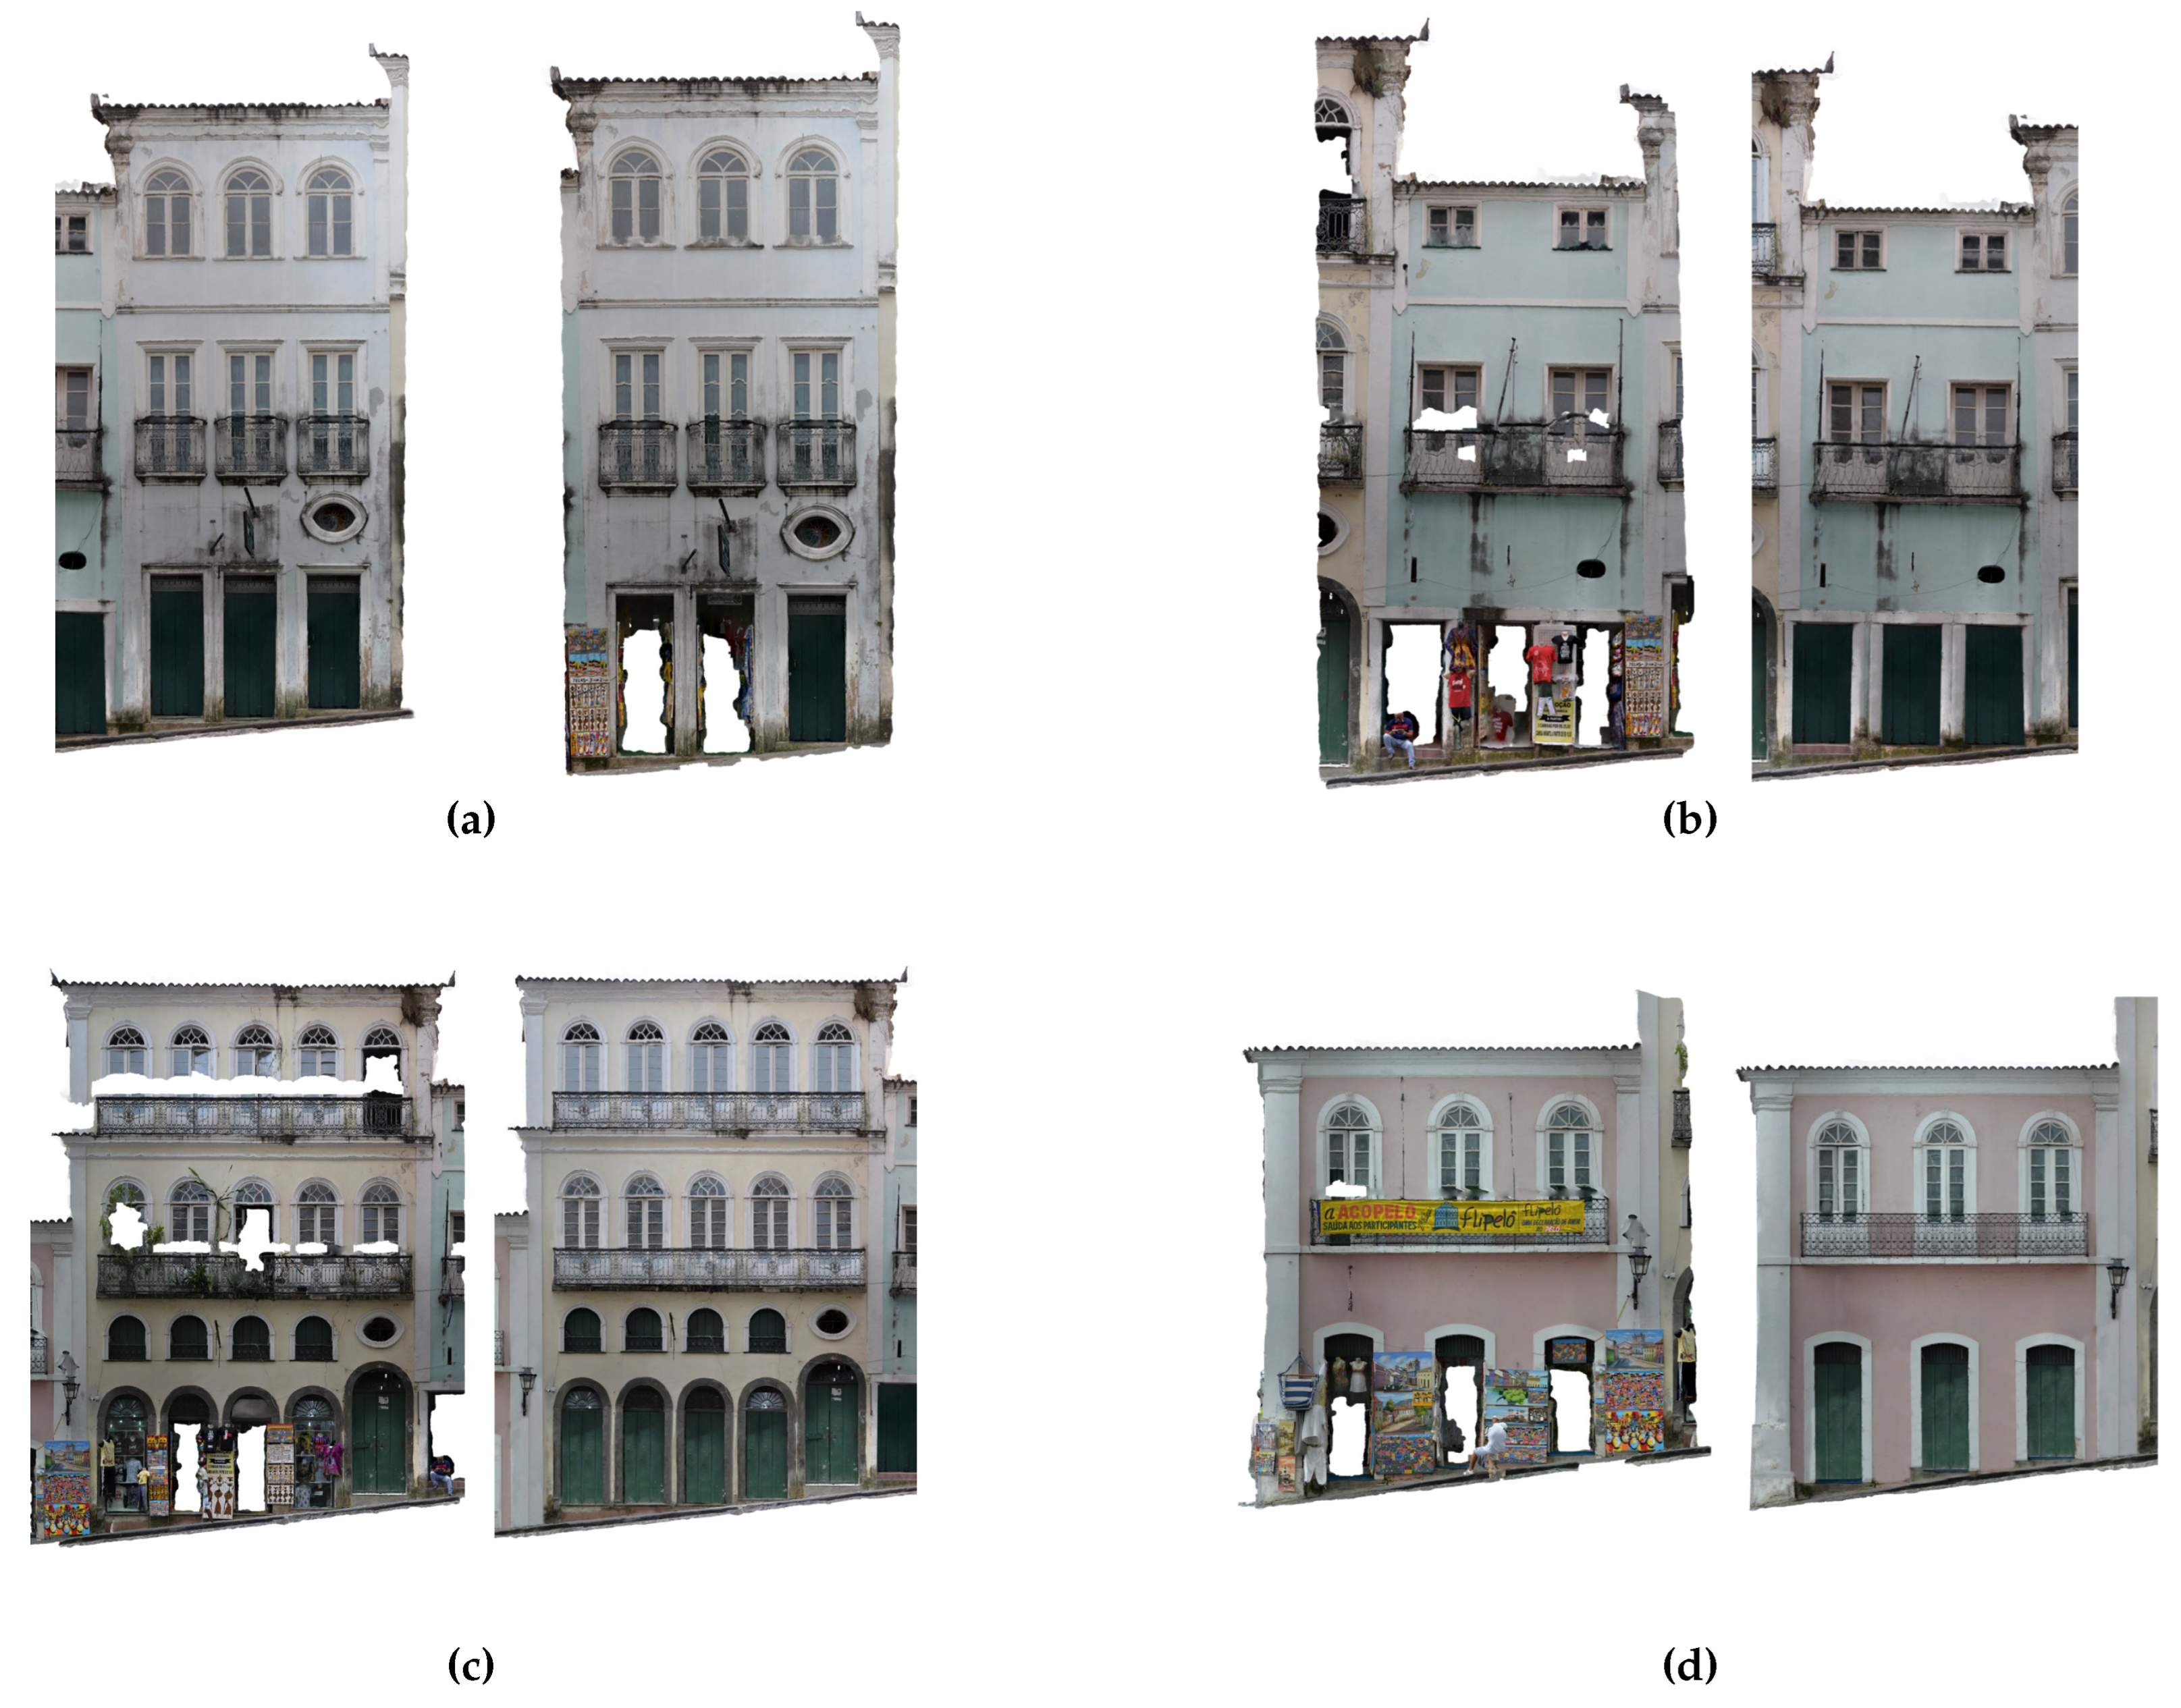
The Historic Center is a bustling commercial area. During the photographic capture, many shops were operational, resulting in objects displayed on building facades and opening most doors. This posed a challenge, as some architectural elements were obscured and could not be captured. Therefore, the "orthophoto edition process" phase involved the treatment of orthophotos, primarily removing non-architectural elements like items for sale and recreating architectural details like doors, windows, and facade decorations. Adobe Photoshop was utilized for this editing process. The intention was to reproduce the existing element in the image accurately, maintaining its authentic color and appearance (
Figure 6). Given the intricacy of historical buildings, this editing phase was time-intensive.
3.3. Geometric model creation
Point clouds, once processed, accurately describe the surfaces of digitized elements. However, they lack additional information about the objects they represent. Hence, it is essential to develop 3D geometric models to capture geometric, topological, and semantic attributes. Building Information Modeling (BIM) tools can be employed for these tasks. The geometric modeling phase was conducted using the previously generated point cloud model. Autodesk’s Recap tool initially converted the point clouds from .las format to .rcp.
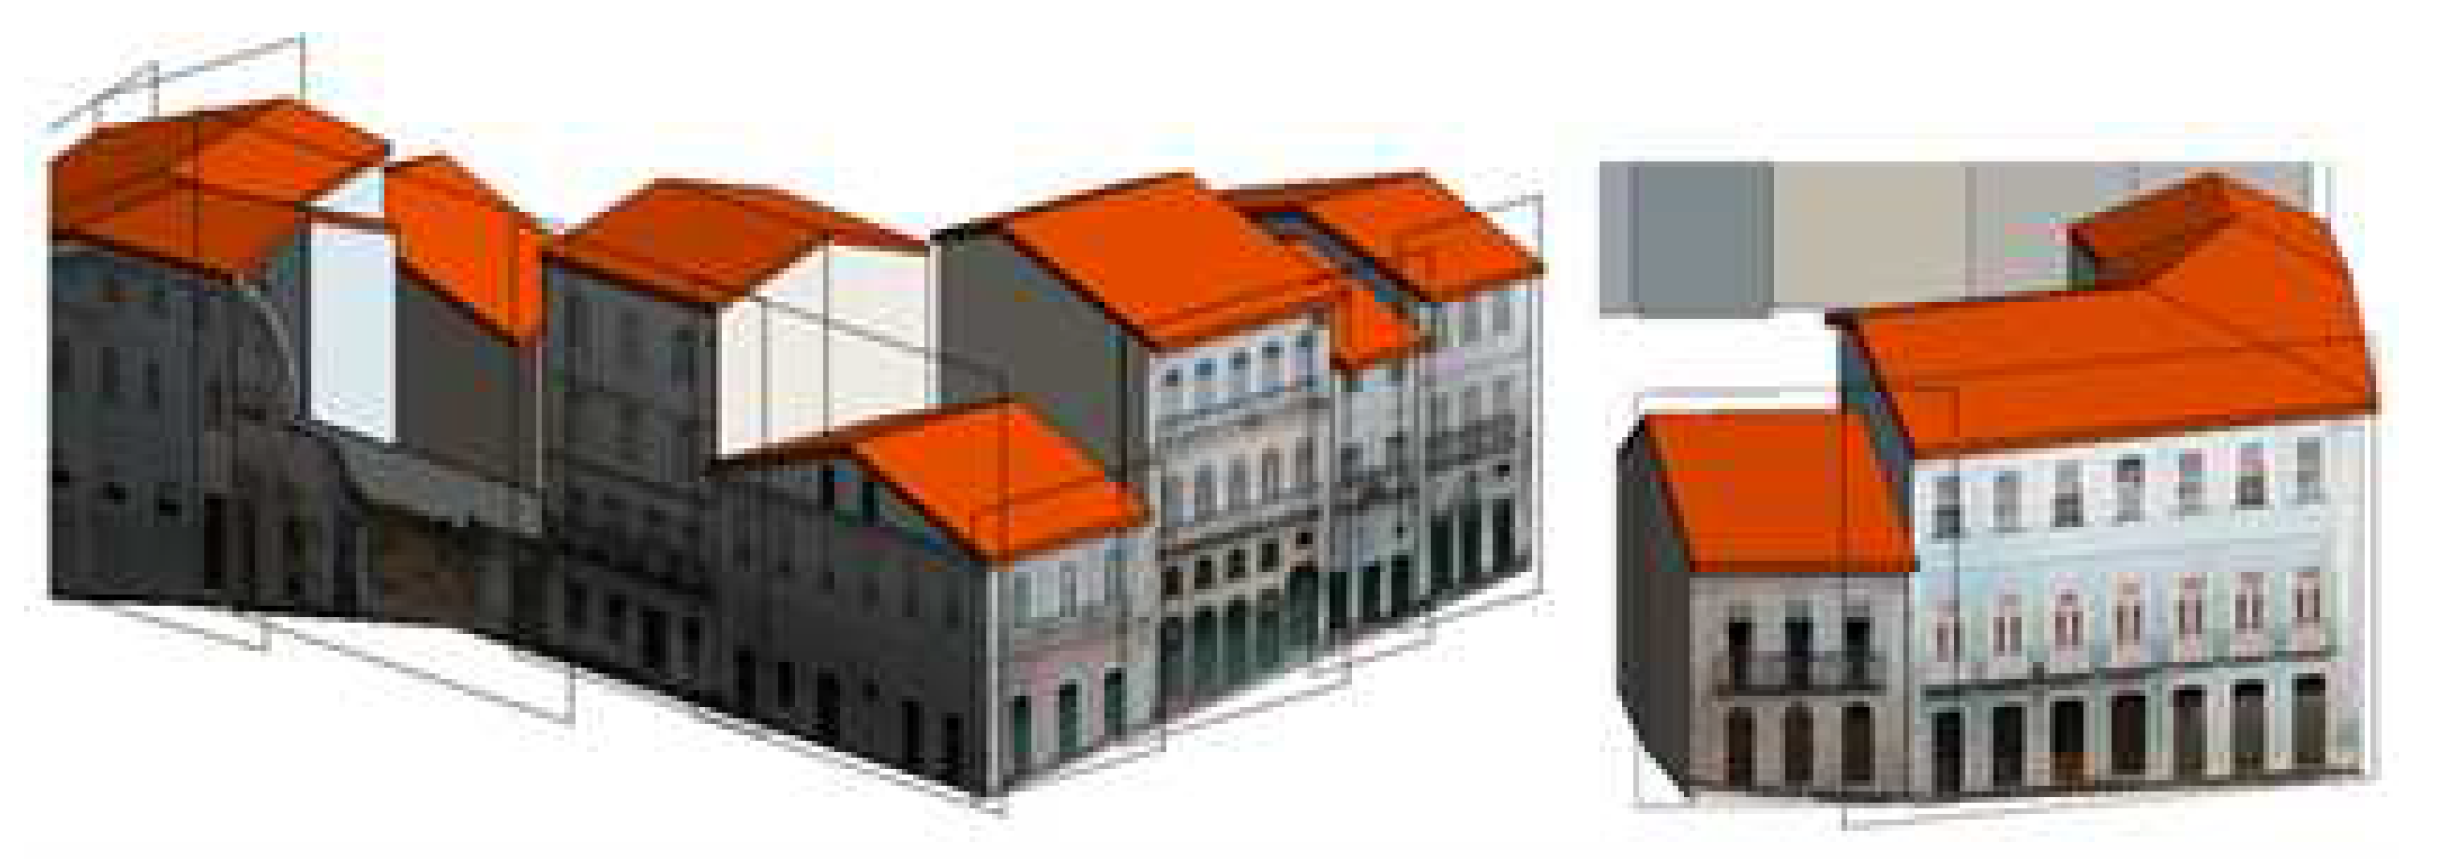
During this phase, architectural elements such as walls and floors (used for roofs) were created, utilizing point clouds to delineate construction boundaries (
Figure 7). Each building’s point cloud was isolated using the "clipping box" tool to streamline the process. This approach enhanced visualization and decreased processing time.
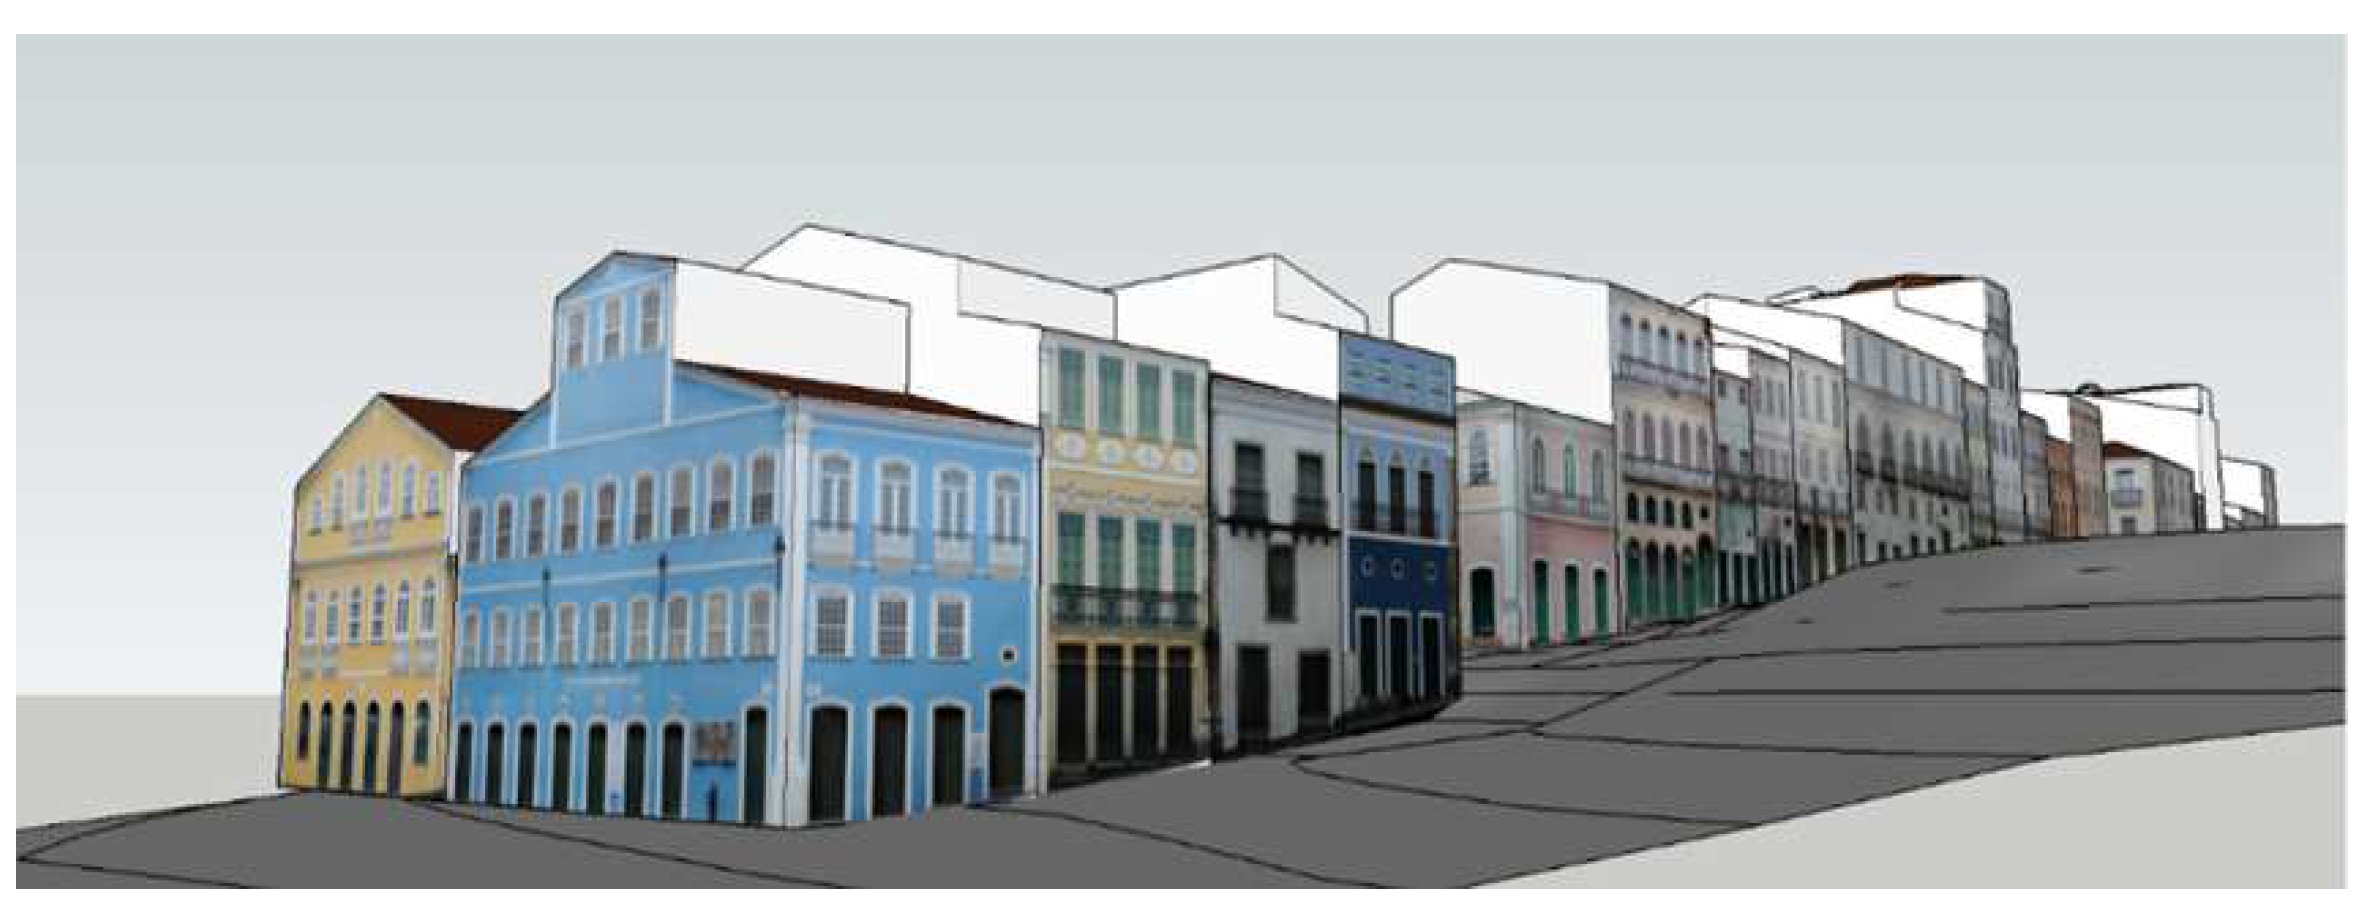
Considering the lack of terrain data, the geometric models of the buildings did not align with the building perimeters, attributed to the area’s varied elevations. This presented an opportunity to create a digital terrain model to accurately depict the site and enhance viewer understanding. Salvador’s digital cartographic base (SICAR) was employed, encompassing a range of urban data, including topographic details in digital format. The terrain surface was generated using information from SICAR and the SketchUp modeling tool.
While combining this terrain with the geometric building models, there were noticeable similarities regarding building placements. However, discrepancies arose when merging the models.
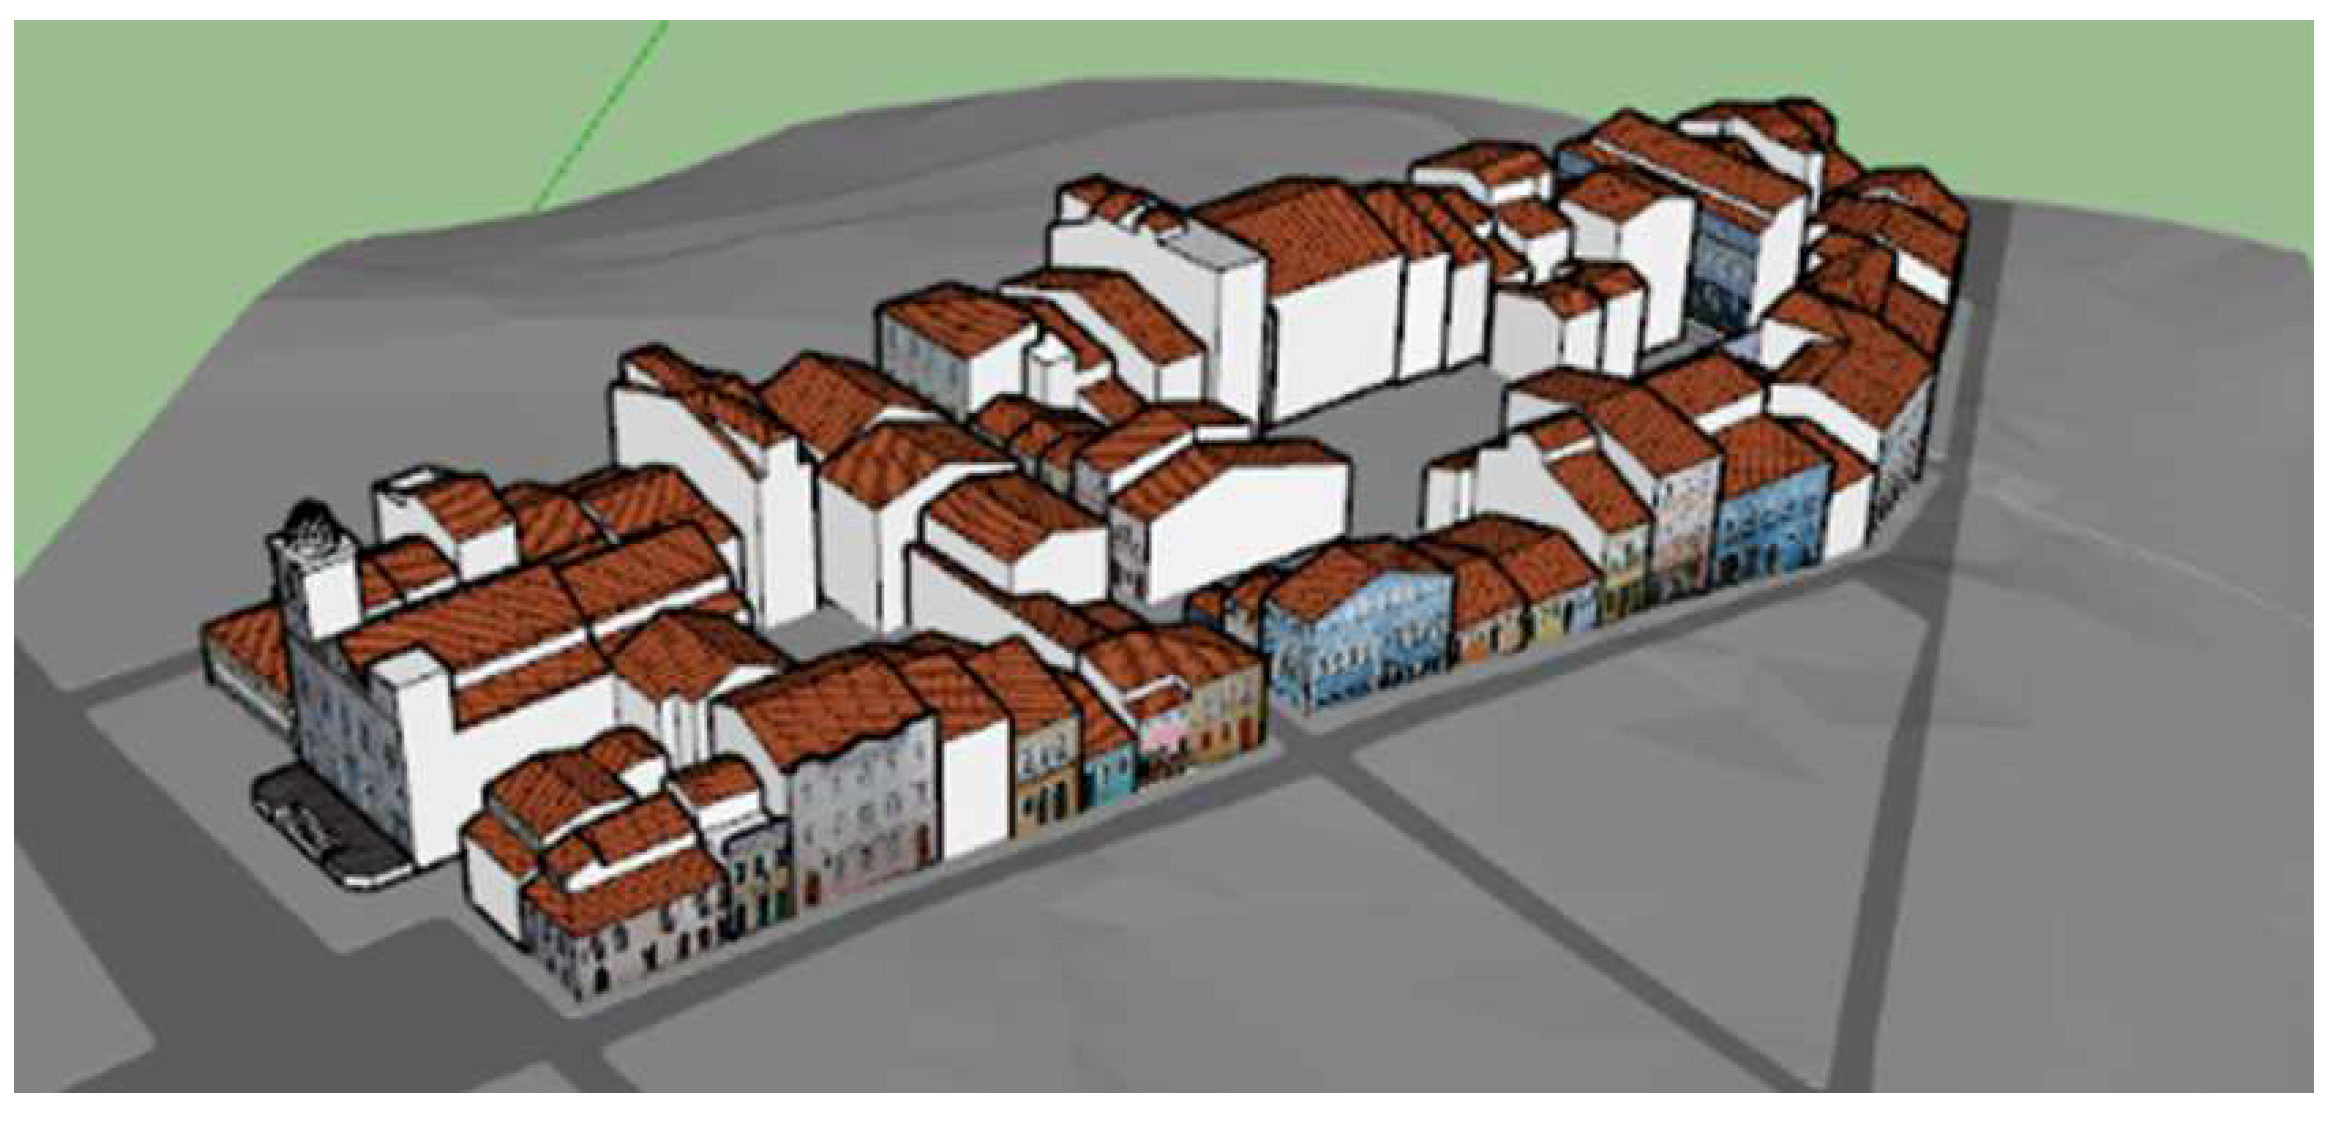
To optimize the digital terrain model and provide more details about the urban physical surroundings, geometric modeling and street and sidewalk marking were carried out using the Revit tool. This was done to offer more information to the model and aid in understanding the architectural ensemble. After this stage, it was noted that the geometric model of the historical site of Pelourinho had an extensive file size, a fact that would hinder its importation into the Unity tool and, consequently, its AR visualization. An attempt to reduce the file size involved exporting the models to the Trimble SketchUp tool and reducing the resolution of the orthophotos of each building, followed by re-inserting them into the geometric models. This action was considered satisfactory, and from there, the development of the application and, consequently, AR visualization proceeded.
Figure 9.
Geometric model of a section of the Pelourinho historic site.
Figure 9.
Geometric model of a section of the Pelourinho historic site.
3.4. Augmented Reality Development
In this phase, the main concepts of the application and interface design were defined before implementation in the tool. Prototype 1 resulted from the initial application ideas. The following criteria were set for it:
Provide access to information about specific buildings in the model during AR visualization;
Have a menu for accessing different tools to handle the model during visualization;
Allow access to a manual that informs how to use the application and its tools;
Access the visualization through a marker, free viewing, or both;
Access information about the creation team and social media;
Offer different viewing experiences for users who are on-site or not.
With these structured criteria, four functions were defined for manipulating the model in AR. The planned tools were:
Photograph the model during viewing (Camera Tool);
Provide a view with as few elements as possible (Hide Tool);
Manually change the model scale during viewing (Scale Tool);
Provide access to building information (Information Tool).
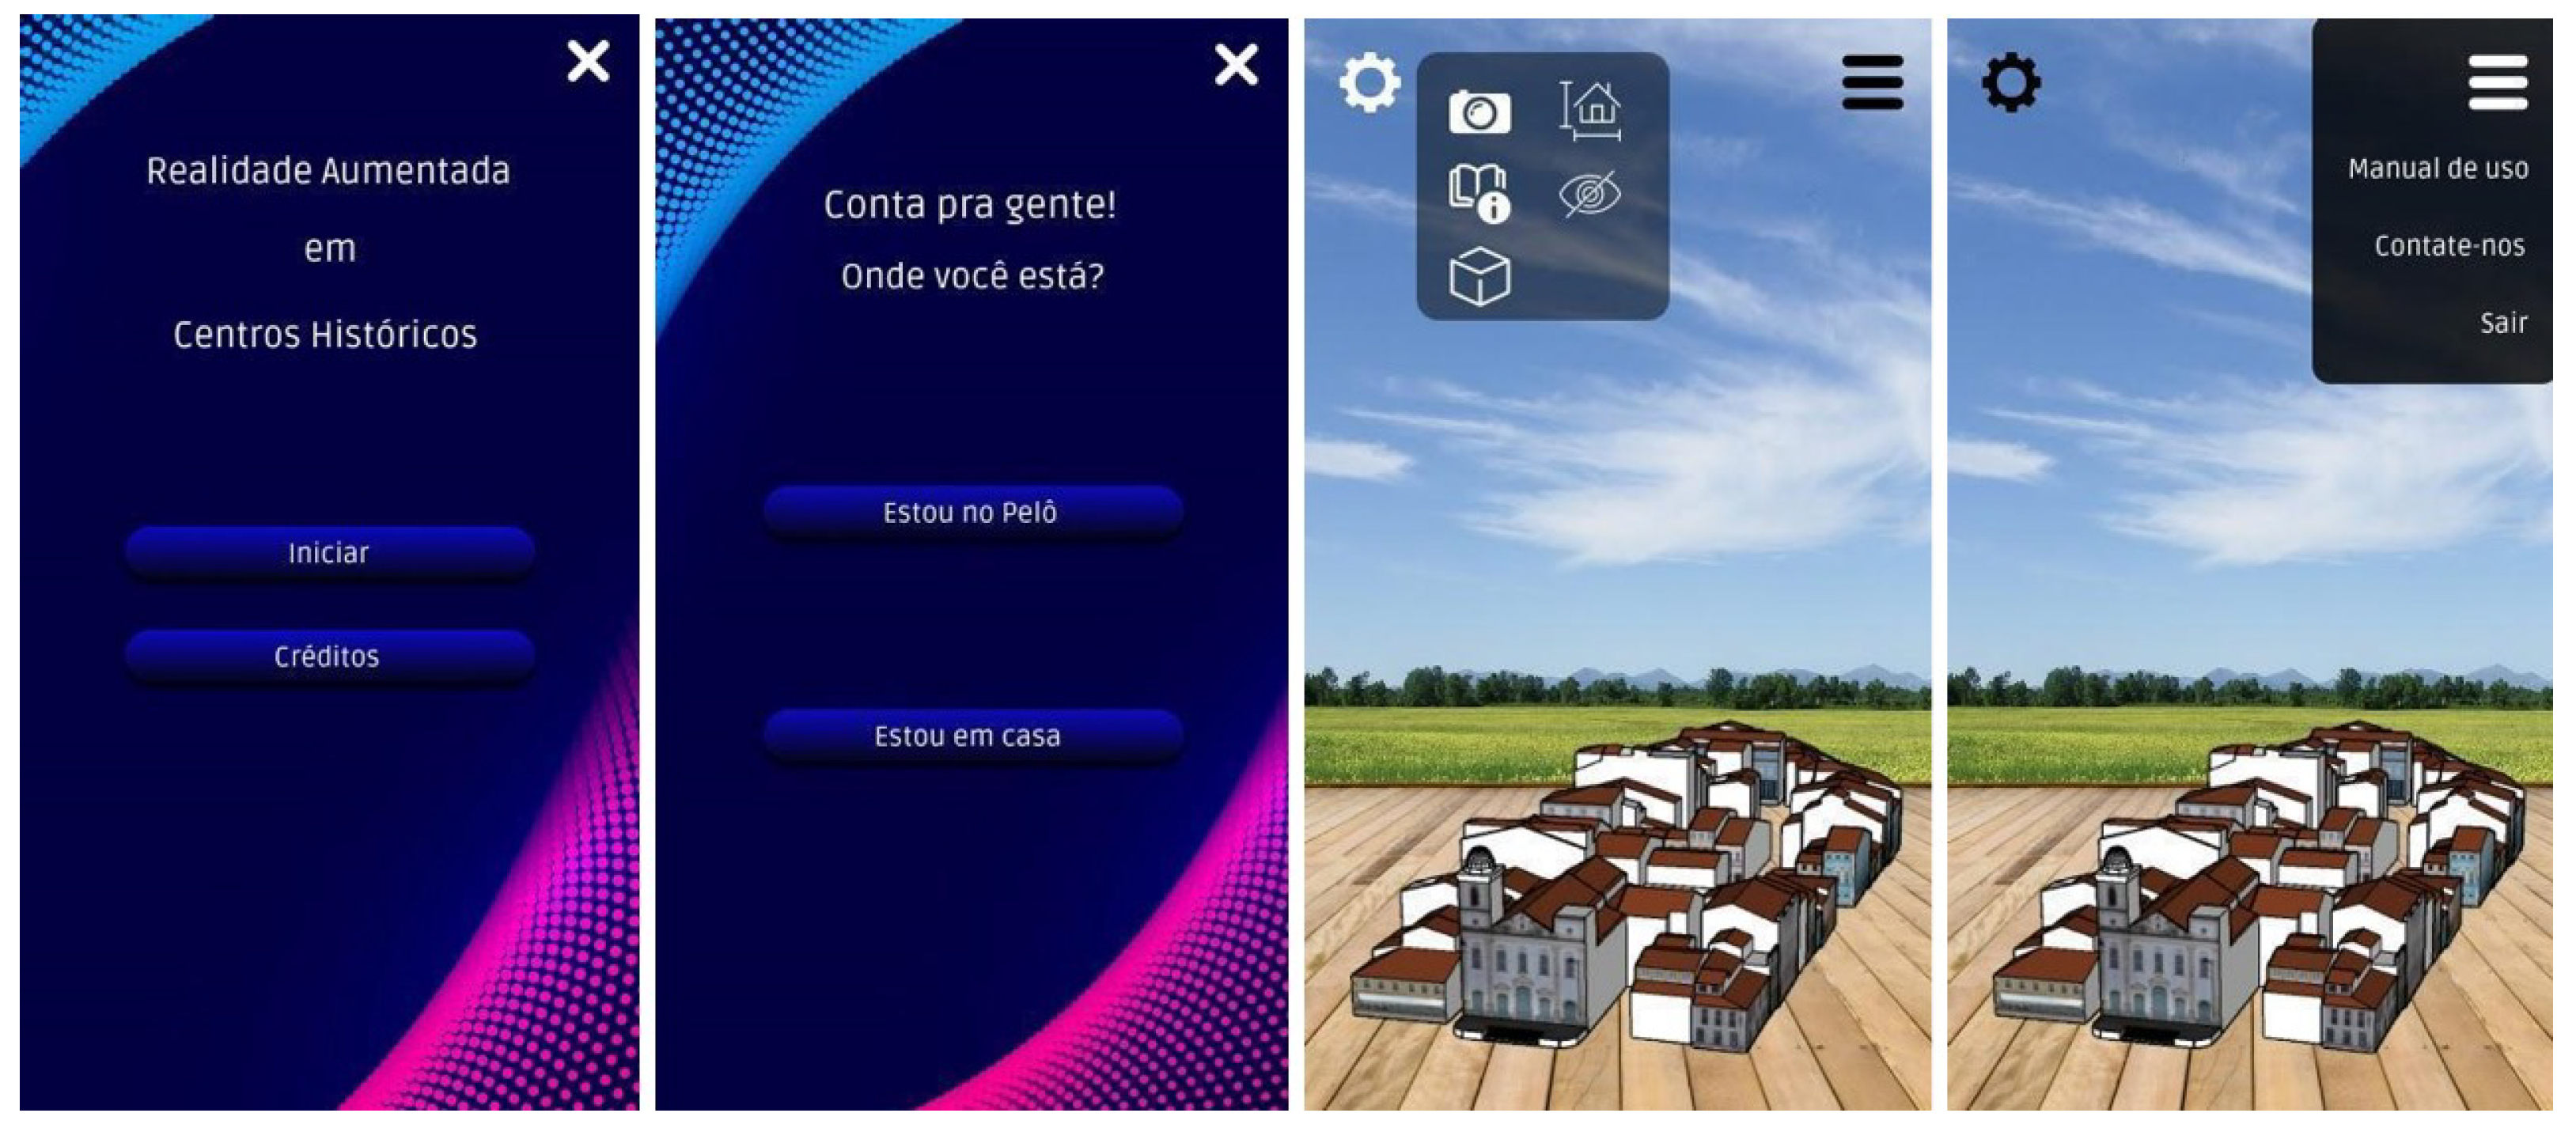
For this initial prototype, the application’s design was exemplified using generic model images, merely demonstrating the prototype’s functionality without a visual appeal. The possibility of two different experiences to access the blocks’ information came with the intent also to provide an interactive experience for users in Pelourinho and encourage them to visit the site. This feature allows framing the facades of specific buildings in the Pelourinho blocks and viewing access balloons to their information and images. With this new form of visualization, a choice interface was inserted, allowing the user to inform which of the two experiences they want (whether the user is in Pelourinho or elsewhere). Images of the block model were added for better viewing, along with other minor visual changes. This resulted in the presentation, as shown in
Figure 10.
Both viewing modes will have cameras and historic site building information tools. The information for users on-site will be shown in balloons and text boxes, while for users not on-site, it will be through icons located above the building images. The balloons and icons accessed in the information interface, on-site or not, will give access to a separate interface with information about the selected building (
Figure 11).
The menu will provide access to a user manual with application instructions and information about its creation.
3.5. Unity Engine Implementation
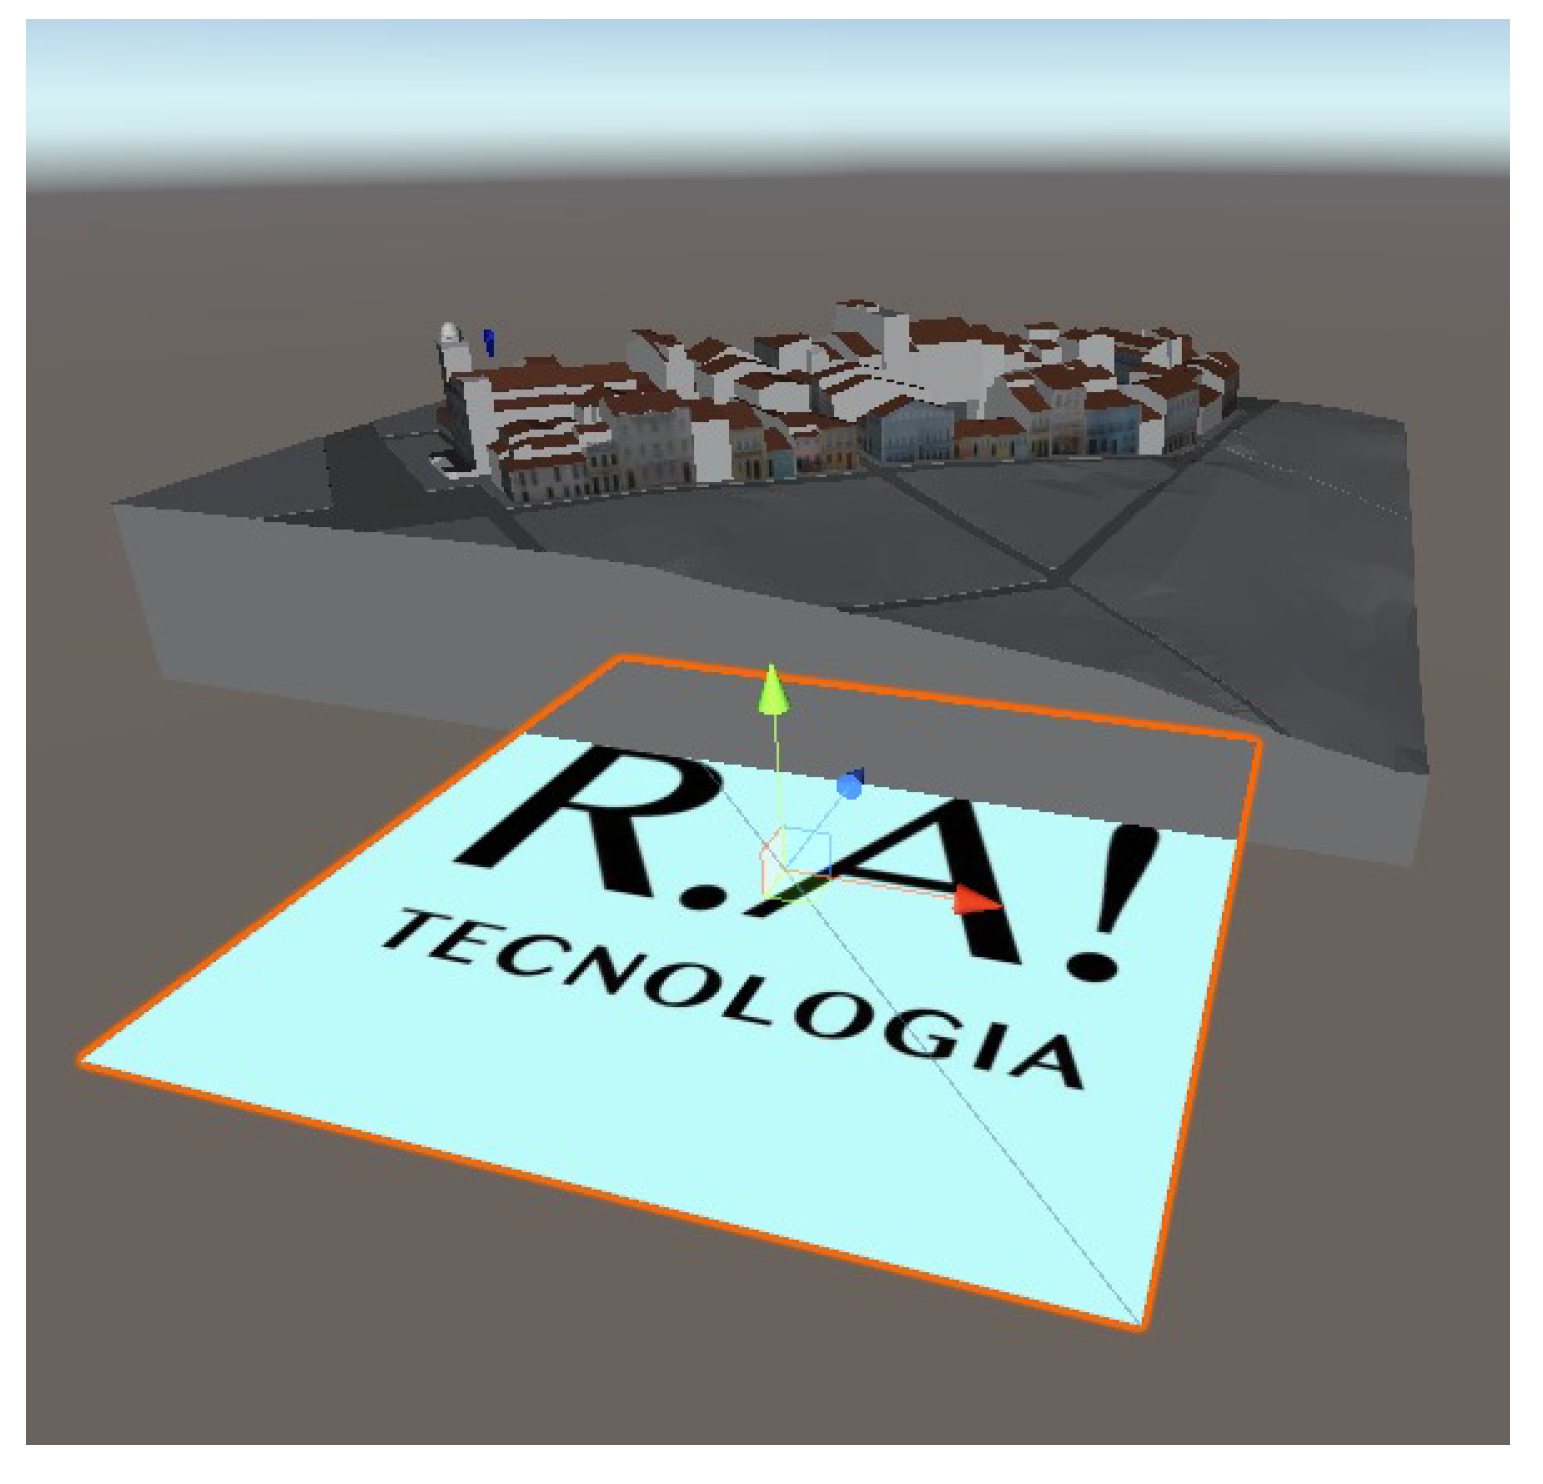
Once the scene structures were defined in the Unity tool, the creation and positioning of the elements began, as well as the development of the scripts containing the necessary codes to perform transitions between scenes and access their elements, such as buttons, menus, and tools. Along with the scripts, Vuforia was used for its capability of AR model visualization. Through the Vuforia website, a test marker was defined (Figure xx), and its settings were established in the Unity environment. Markers are visual elements that serve as reference points to overlay virtual information (geometric models, images, texts, etc.) in the physical environment. There are several types of markers, each with its features and specific uses, and they can also be used in an integrated manner. Several tests were conducted to check marker quality regarding the experiment in question. The following section will describe the experiment.
3.6. Tracking Verification (Marker)
One of the requirements established for the application is that the user can be in Pelourinho and access augmented reality information. This information will be obtained by directing the device’s camera to some object or set of objects, such as a church’s facade. In this sense, it is interesting to check the various lighting possibilities, as the user may be present during different periods (day vs. night) and under different lighting conditions (clear sunny day vs. cloudy dark day, for example). The first check was to find a high-quality marker. Several photos were taken throughout the day, characterizing the different light intensities to be later evaluated by the Vuforia tool.
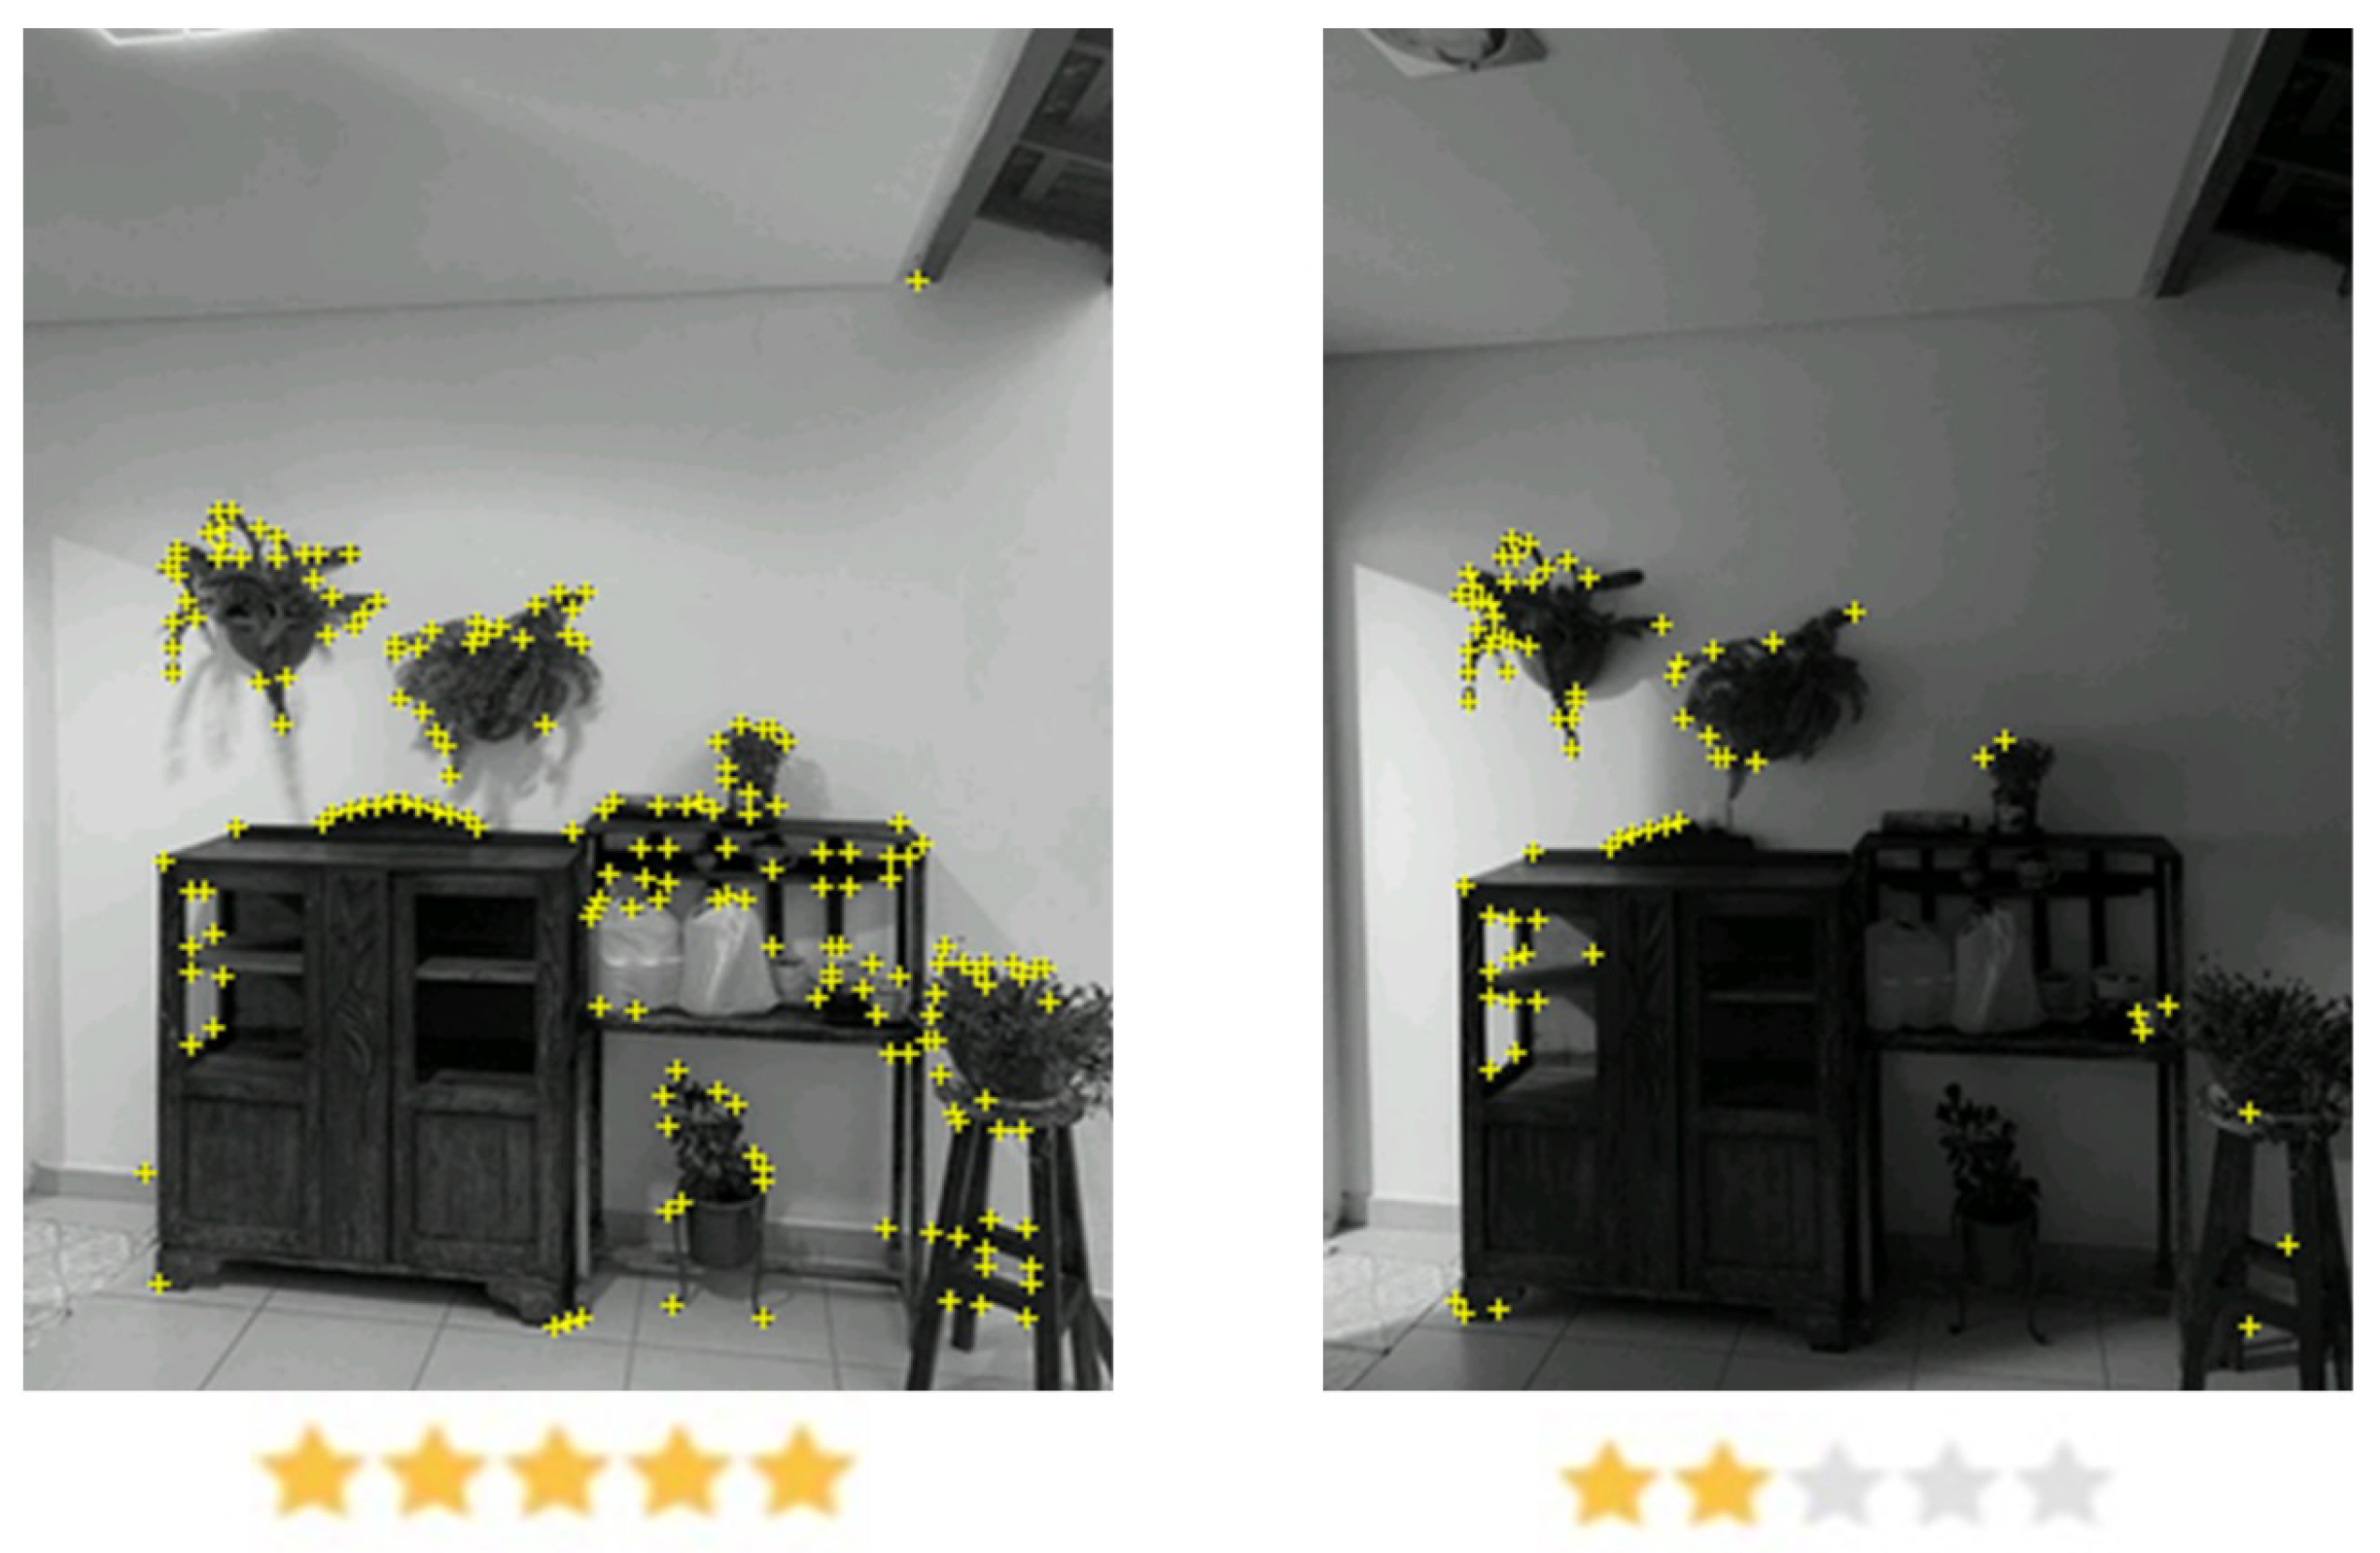
Upon checking the photo evaluation method in Vuforia after turning them into markers, it was noticed that the system classified the marker according to the number of recognition points in the image (points that the software can identify at the ends of lines, objects, and straight line segments in the image). After identifying these points, the program classifies the marker on an ascending scale from 1 to 5 stars, with 1 being a poor-quality marker and five stars characterizing a high-quality marker. Therefore, based on the experiments, it was concluded that there is no need to create multiple markers of a single scene with different light intensities since dim markers were poorly rated on the platform due to the difficulty of finding the recognition points in the image. Thus, the ideal marker model should have good light intensity and contrasts, allowing the detection of a more significant number of points in the image.
Figure 12 exemplifies that satisfactory lighting, like the image on the left, has an excellent rating on Vuforia compared to another image, like the one on the right, which may have more recognition points found. The left image is well-lit, with a reasonable intensity of sunlight, while the right image was taken at night, with only artificial lighting.
After this stage, the second experiment was to test the display of AR objects on a printed marker, gradually decreasing the light intensity on it. It was observed that with a marker well evaluated in Vuforia, the device can detect it even with very little light,
Figure 13.
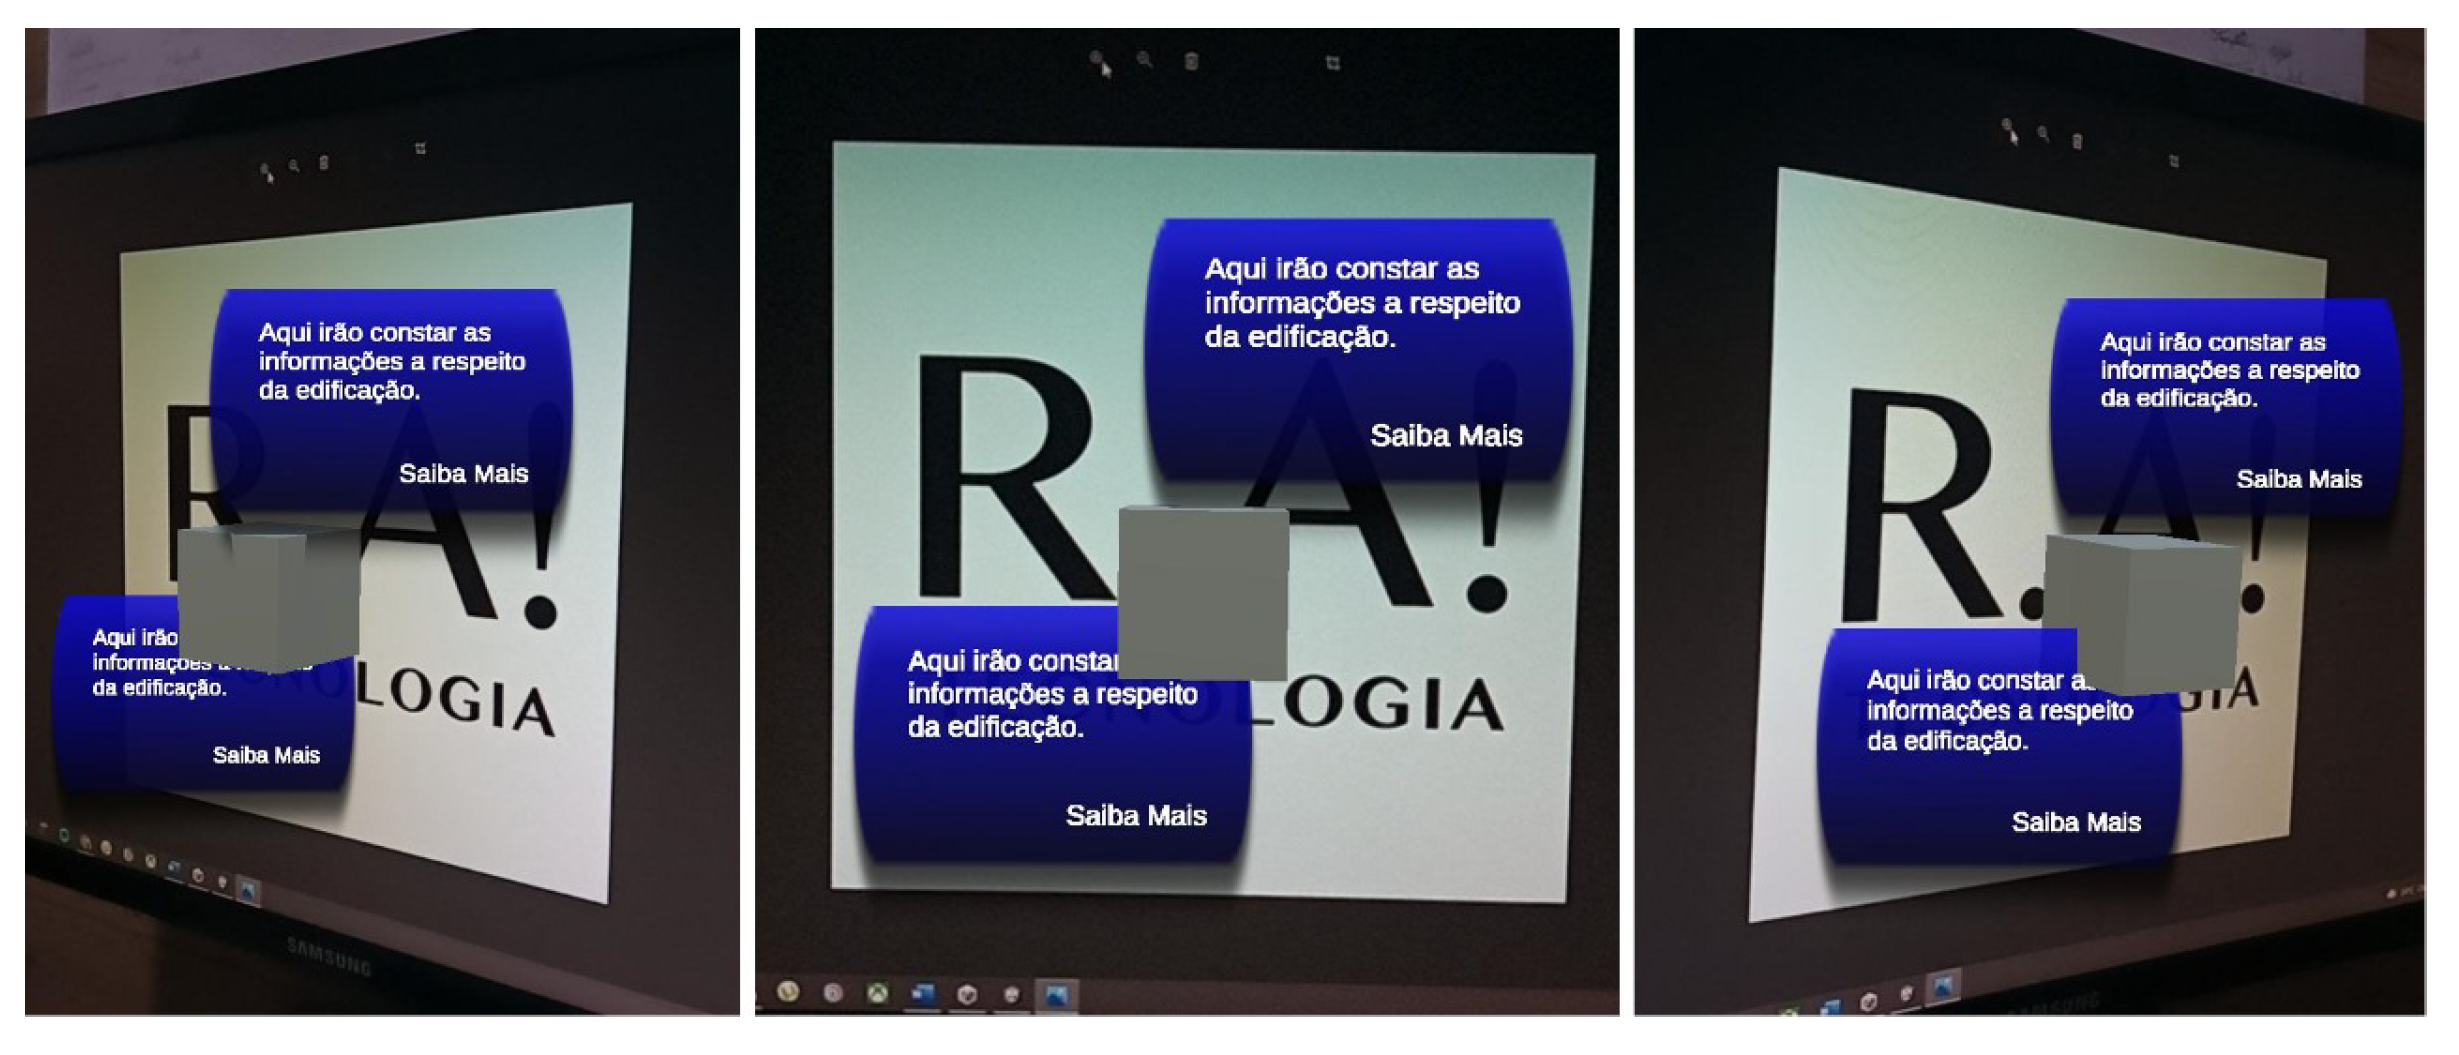
Another test was the overlay of virtual objects on the architectural object. At this stage, it was observed that viewing specific texts could hinder reading depending on the angle at which the object is positioned. To solve this issue, a model was created that allows the user to read texts from various angles, as seen in
Figure 14. Here, the user can see that the front of the objects always follows the direction of the cell phone camera. Therefore, they can view the front of the object (the facade of a building, for example) from any angle. An algorithm used in games was used to make the objects always positioned facing the camera.
Another implemented feature is the possibility to view the geometric model of Pelourinho at different scales, including its natural scale, in AR, simulating the observer’s presence in front of the building. The idea is to modify some constructions present in the model, such as the Jorge Amado House Foundation and the Church of São Pedro dos Clérigos, to have the exact dimensions as their natural constructions in Pelourinho, and when touching the screen, the object is placed on a plane in front of the user.
3.7. Limitations found
During the implementation phase, several challenges arose, such as the size discrepancy between the imported models and those created within the tool. The size differences complicated the control of scales in the AR model because it was not possible to configure them precisely, making it difficult to achieve a natural scale (1:1) in Unity that reflected the desired outcome. It was noted that the format in which models were imported to Unity affected how they were recognized. Models imported in ".dae" format were recognized by Unity in inches, whereas models in ".obj" and ".fbx" formats were recognized in centimeters within Unity. The best solution to this scale problem was to use models imported in ".fbx" format in centimeters and apply a scaling factor that matched the models’ size in meters. This allowed us to achieve a model scale that matched the actual size of the building.
Another challenge was related to lighting and texture. Different model formats imported into Unity also introduced such issues. The ".fbx" and ".obj" format models managed to retain the texture found in the buildings but failed to identify either the ground texture or lighting correctly. The ".dae" format models kept texture and lighting intact but were recognized in inches by Unity, complicating the conversion to meters. The ".obj" model format was used to tackle this issue, and the texture was added and lighting adjusted directly in Unity.
Furthermore, despite using C language for scripting in Unity, the tool also required various libraries and functions to handle scenes, objects, and elements on the platform. Knowing only C was inadequate for the development of the application. This necessitated consistent research throughout the project to better understand Unity’s specific functions and commands that could address the challenges faced.
3.8. Screen Design and User Experience
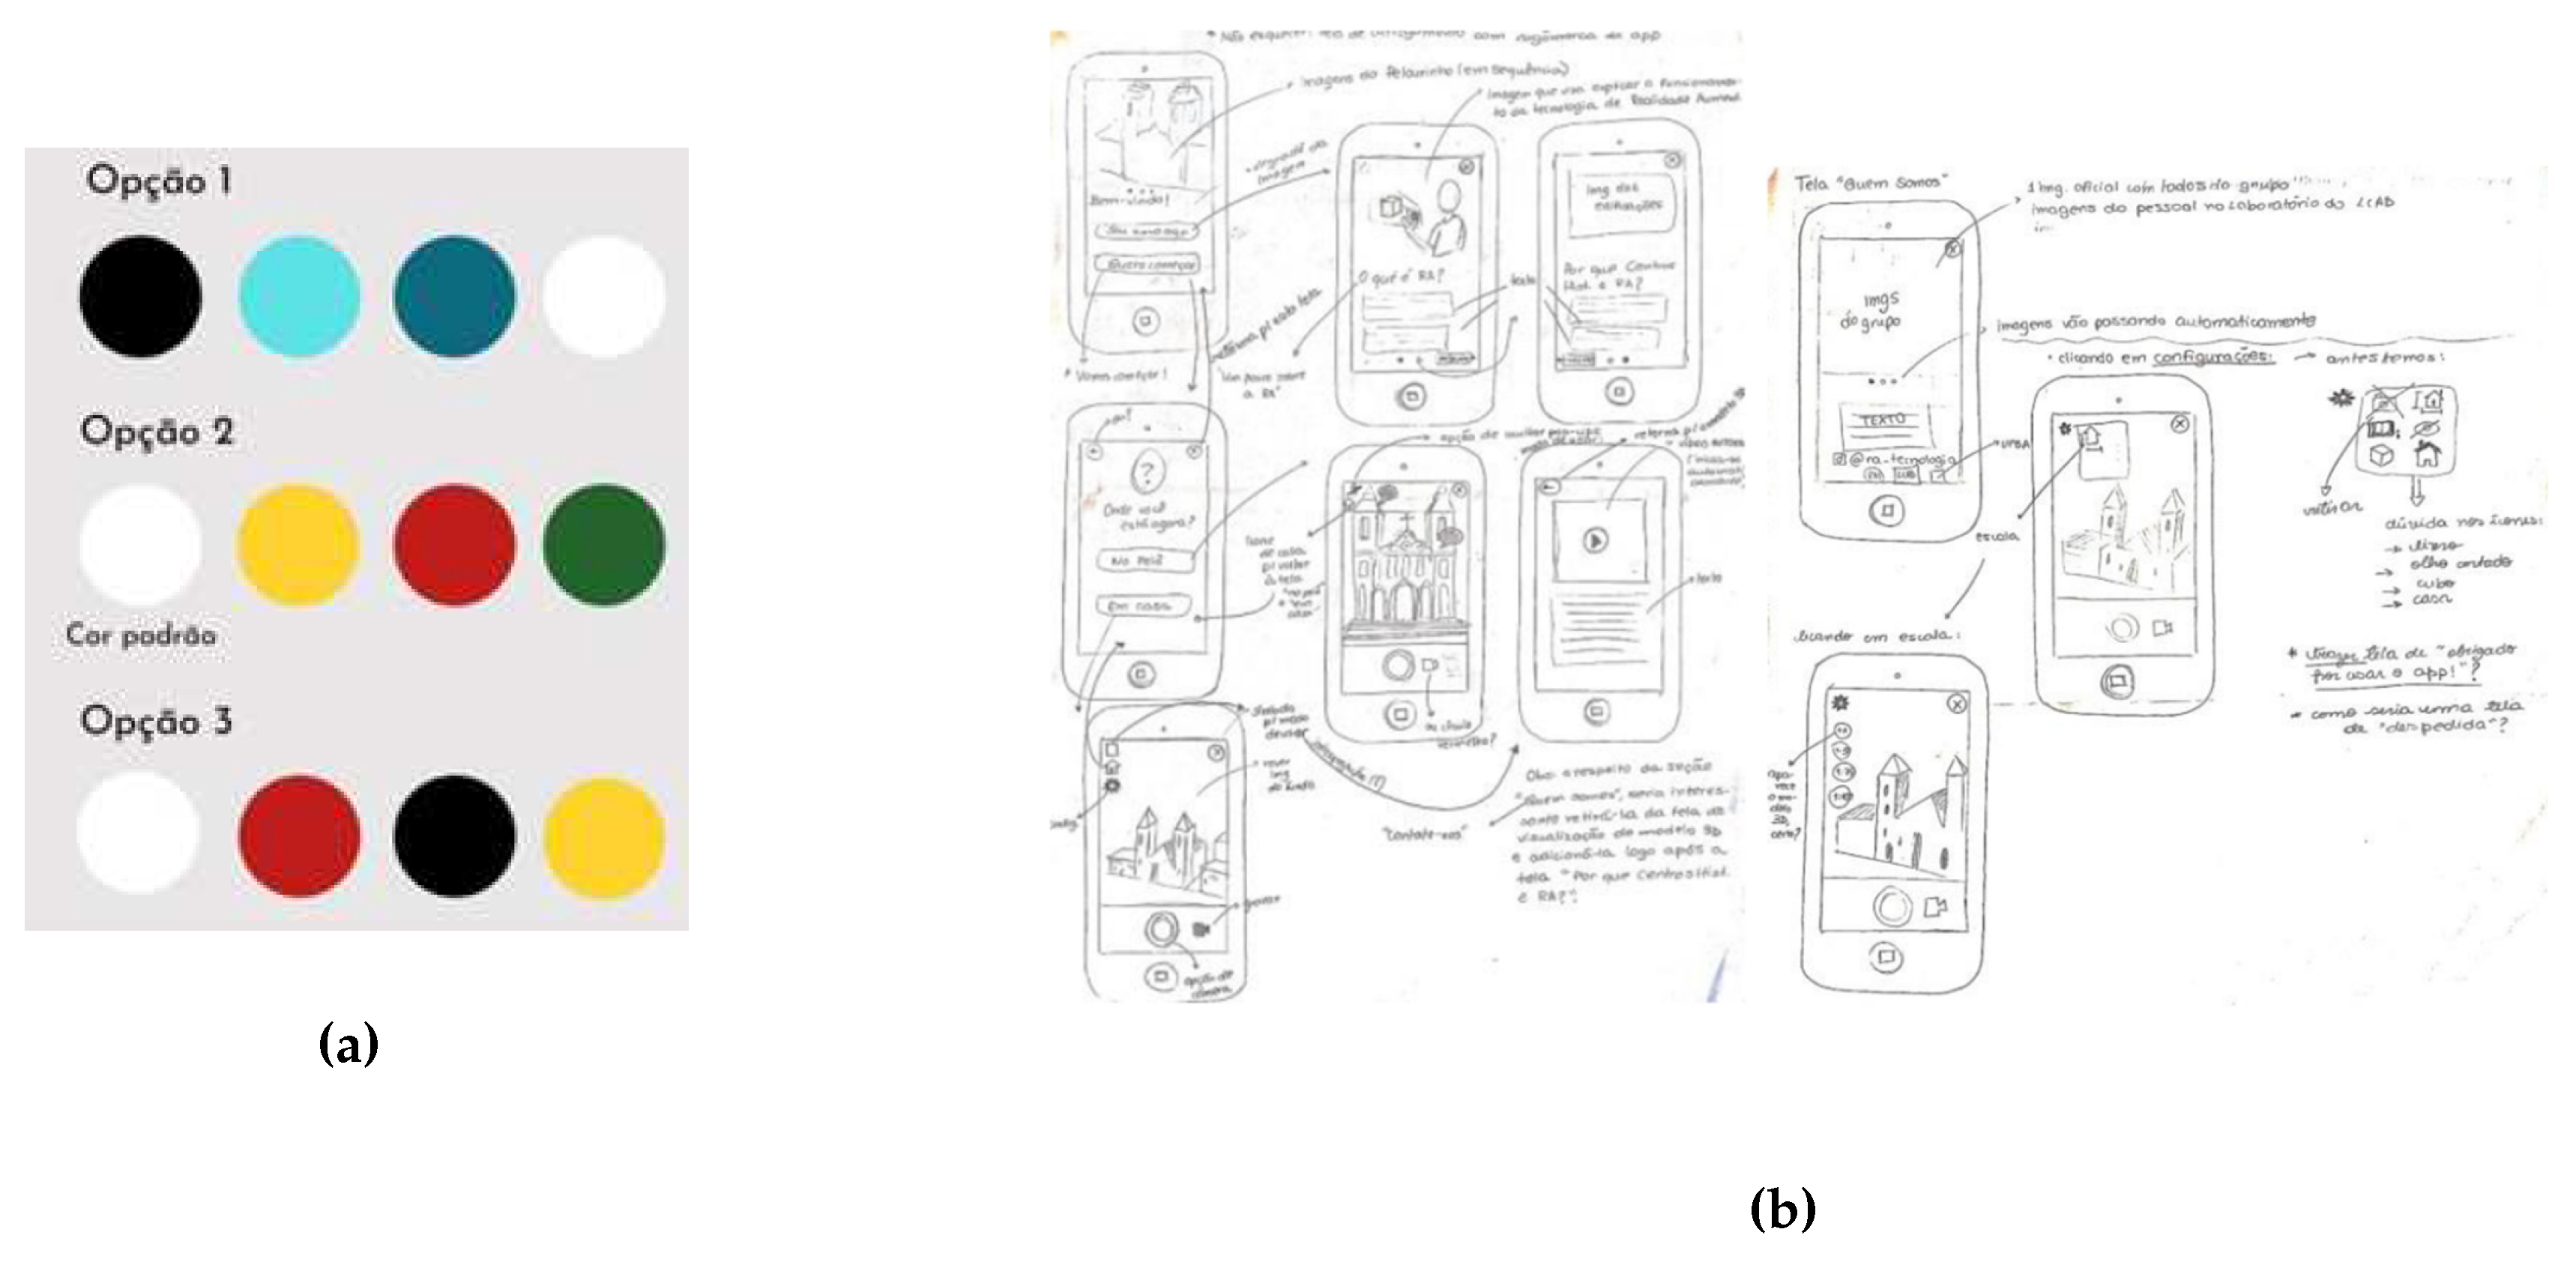
Regarding the app’s visual aspect, several color palettes were devised to bridge two themes: technology and the city of Salvador. Based on Heller (2007), three color palettes (
Figure 16a) were developed. Heller argued that colors and feelings are closely related, as colors project a universal experience tied to language and beliefs. Similarly, Goethe (2018) believed that colors have their character and can impact the human psyche, inducing specific moods and eliciting similar sensations, reactions, and behaviors across individuals.
With this in mind, the first palette choice consisted of cool colors associated with intelligence, science, and detachment. The second palette proposed white as a standard color and warm hues, which could be linked to Salvador’s aesthetic, referencing the colors of the Senhor do Bonfim ribbons, a typical souvenir from the city. Lastly, the third palette, different from the second by excluding green and adding black, brought a more somber feel combined with warm colors. The first palette was chosen for the app due to its association with organization, technology, intelligence, science, etc.
After selecting the app’s color palette, the user flow design started, building on previously completed work. Storytelling-style drawings were developed to gradually achieve the desired interface for the application, as shown in
Figure 16b.
Considering the target audience’s expertise level, users are not expected to have prior augmented reality experience. Given that the app focuses on Pelourinho, Salvador’s tourist area, the interface and content mainly target tourists and passersby in that region. Because of the app’s focus on cultural heritage appreciation, it should intrigue those interested in historical centers. Language choice is vital to engage the app’s users. With no target audience restrictions, casual Portuguese was chosen, avoiding slang and regionalisms. The app aims to be accessible across all age groups. It was later decided to also translate the app into English, broadening its reach.
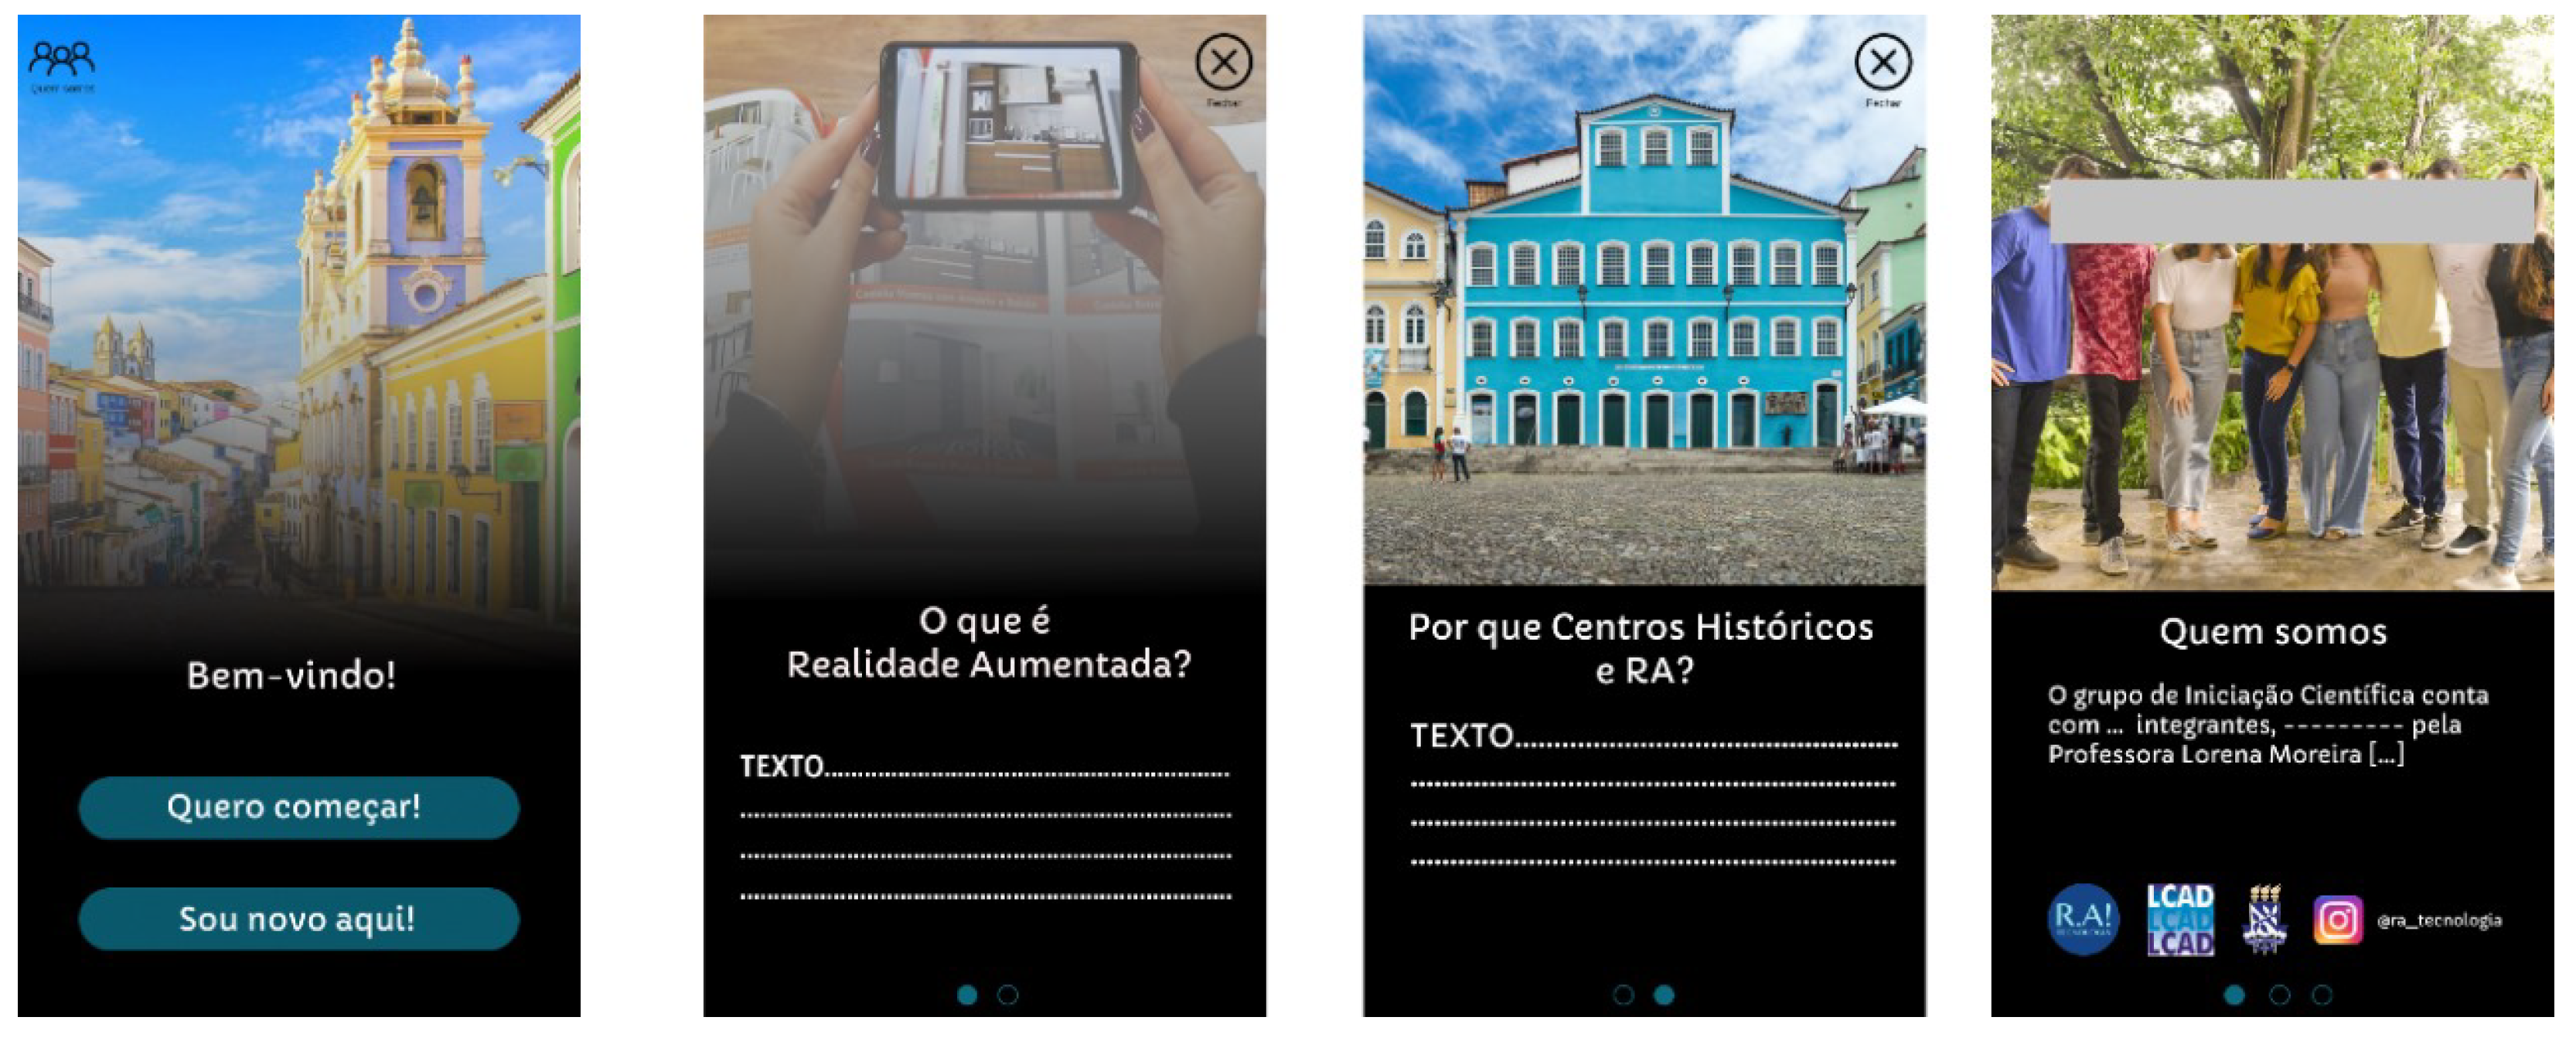
After determining the missing requirements from the previous phase, the app’s screen designs were developed. New scenes were created, setting screen resolution standards, positioning elements (buttons, icons, images, etc.), and aligning functional and user interface aspects. The chosen standard was a 16:9 scale with a 1920:1080 resolution. The first screen directs new users to learn more about the topic via the "I am new here!" tab, leading to a page about Augmented Reality and its use in historical centers. Another option, the "Who are we" button, provides information about the research participants, as shown in
Figure 17.
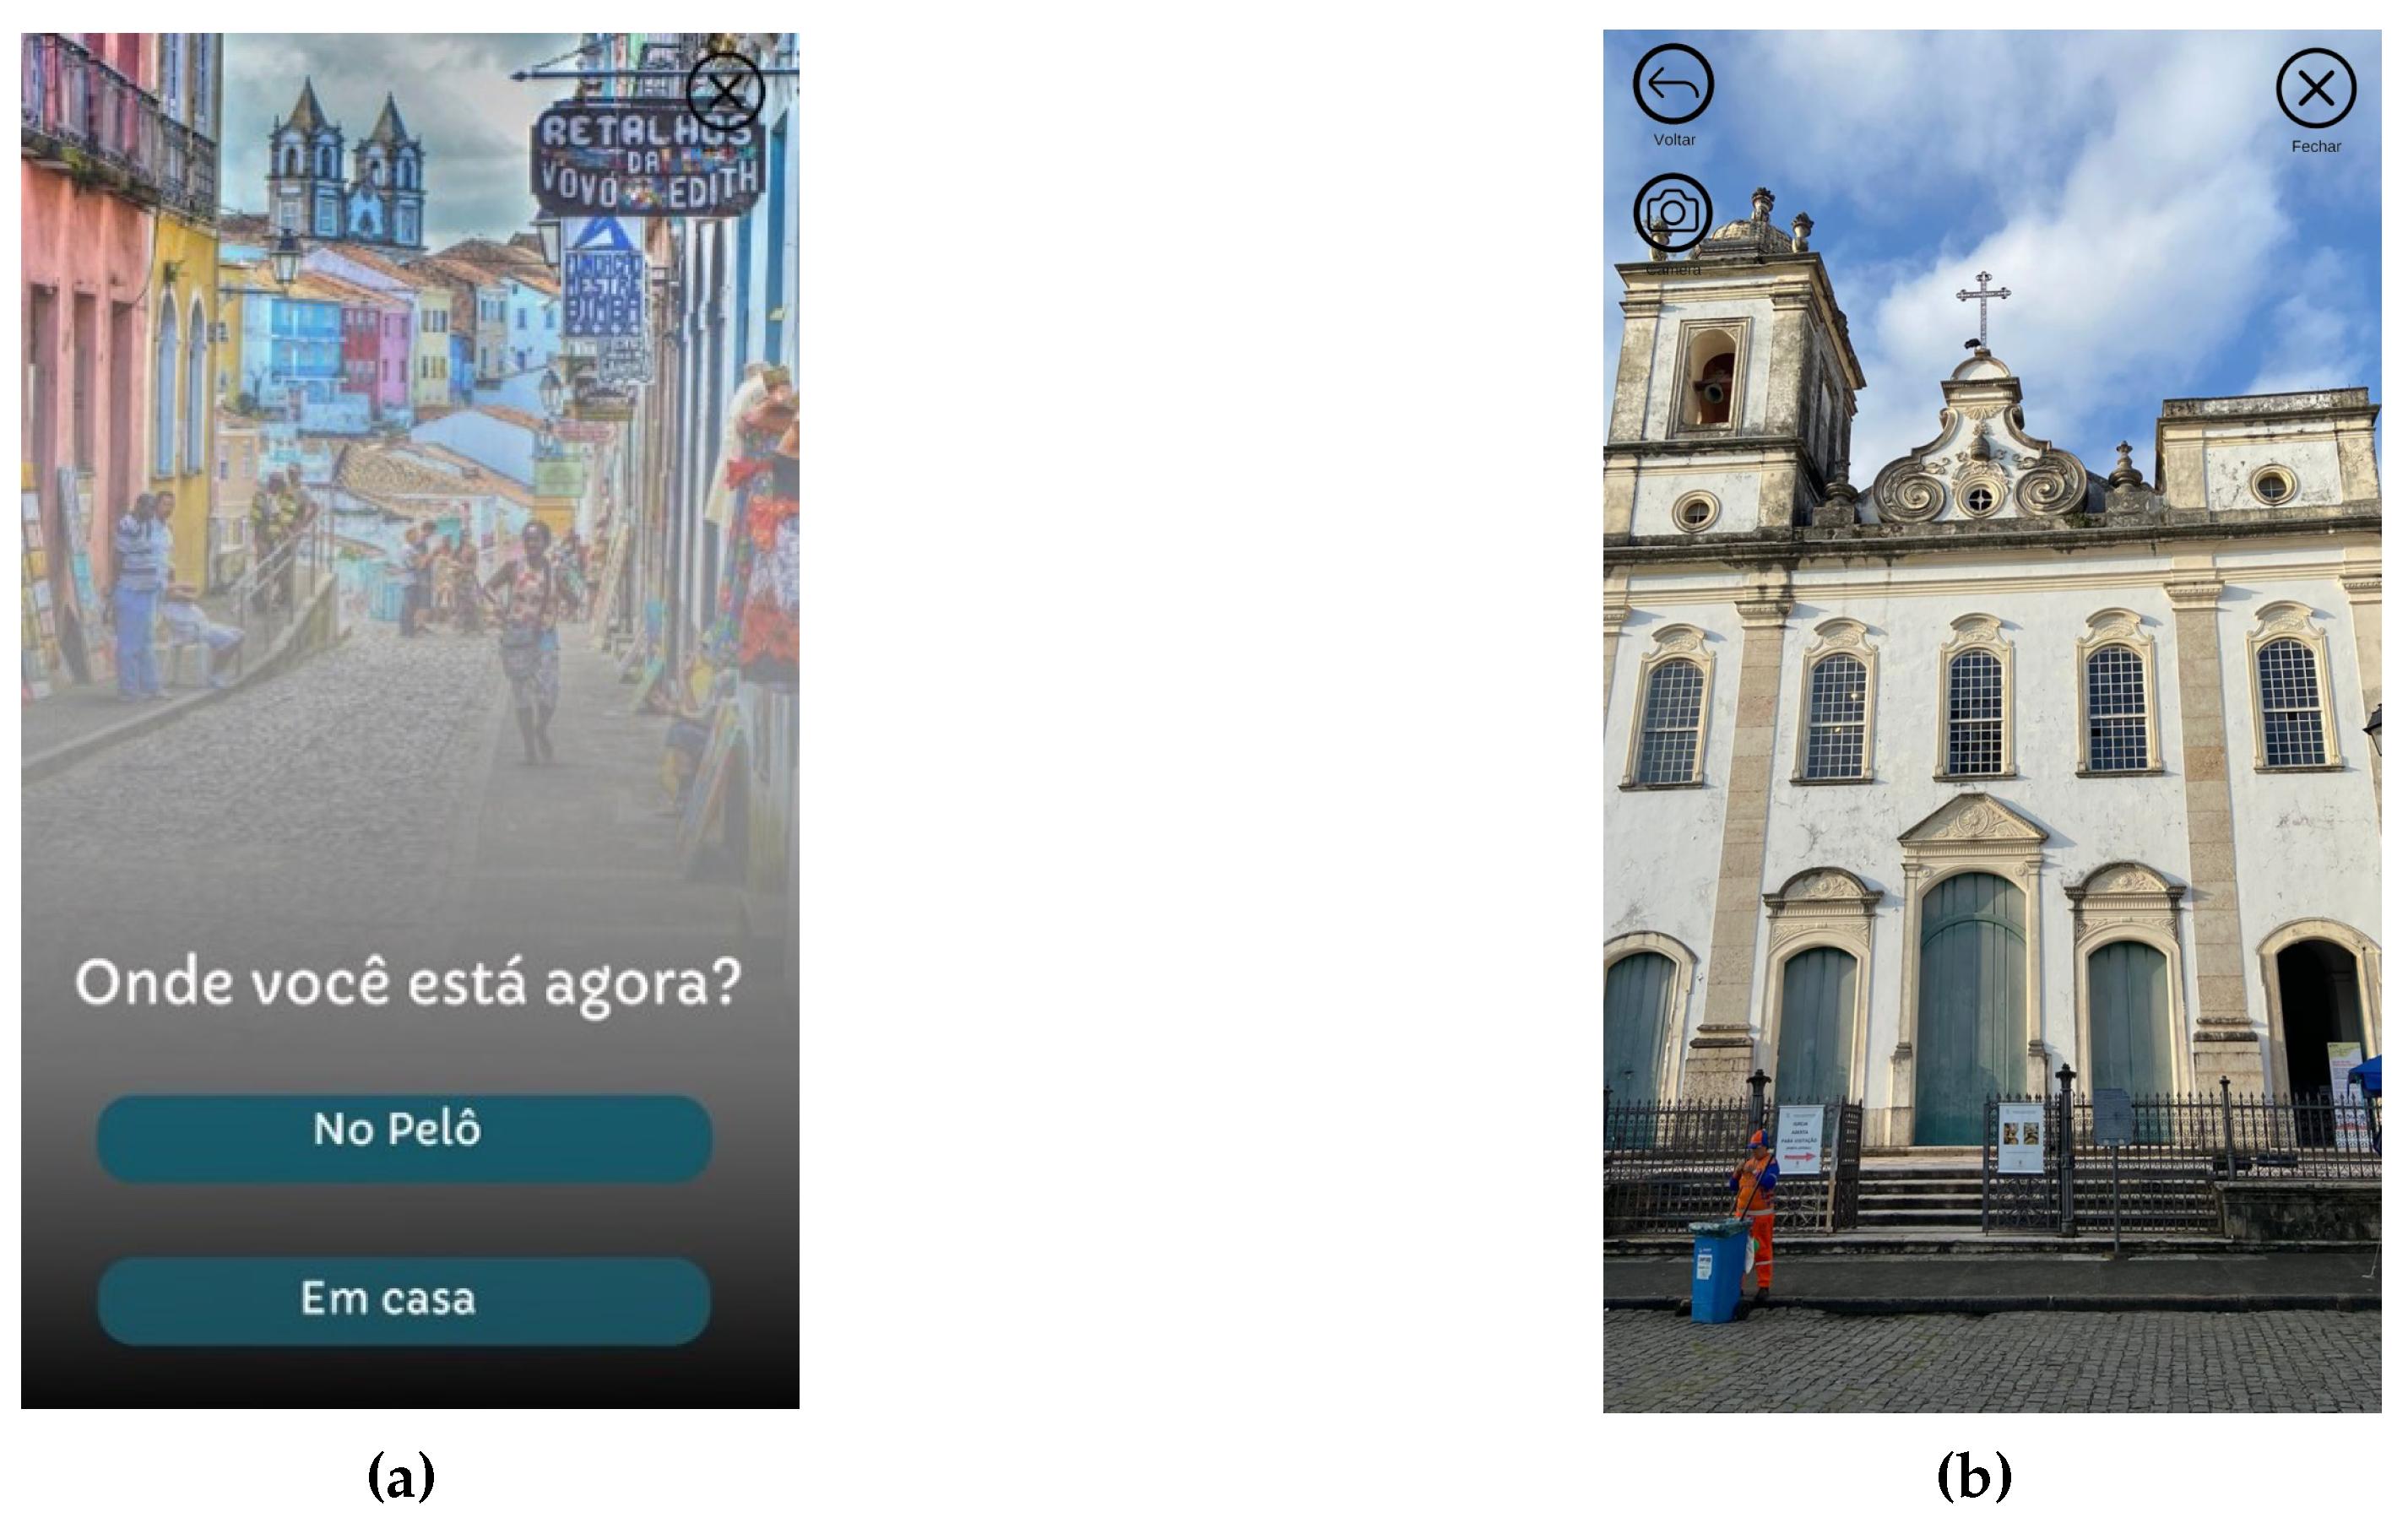
In
Figure 18a, a screen lets users choose their interaction mode, asking if they are in the historical site of Pelourinho. If they confirm their presence in Pelourinho, the app activates the user’s smartphone camera, prompting them to point it at selected buildings like the Fundação Casa de Jorge Amado or the Igreja São Pedro dos Clérigos. Pointing at these structures will bring up interactive AR buttons, leading to the screens in
Figure 18b.
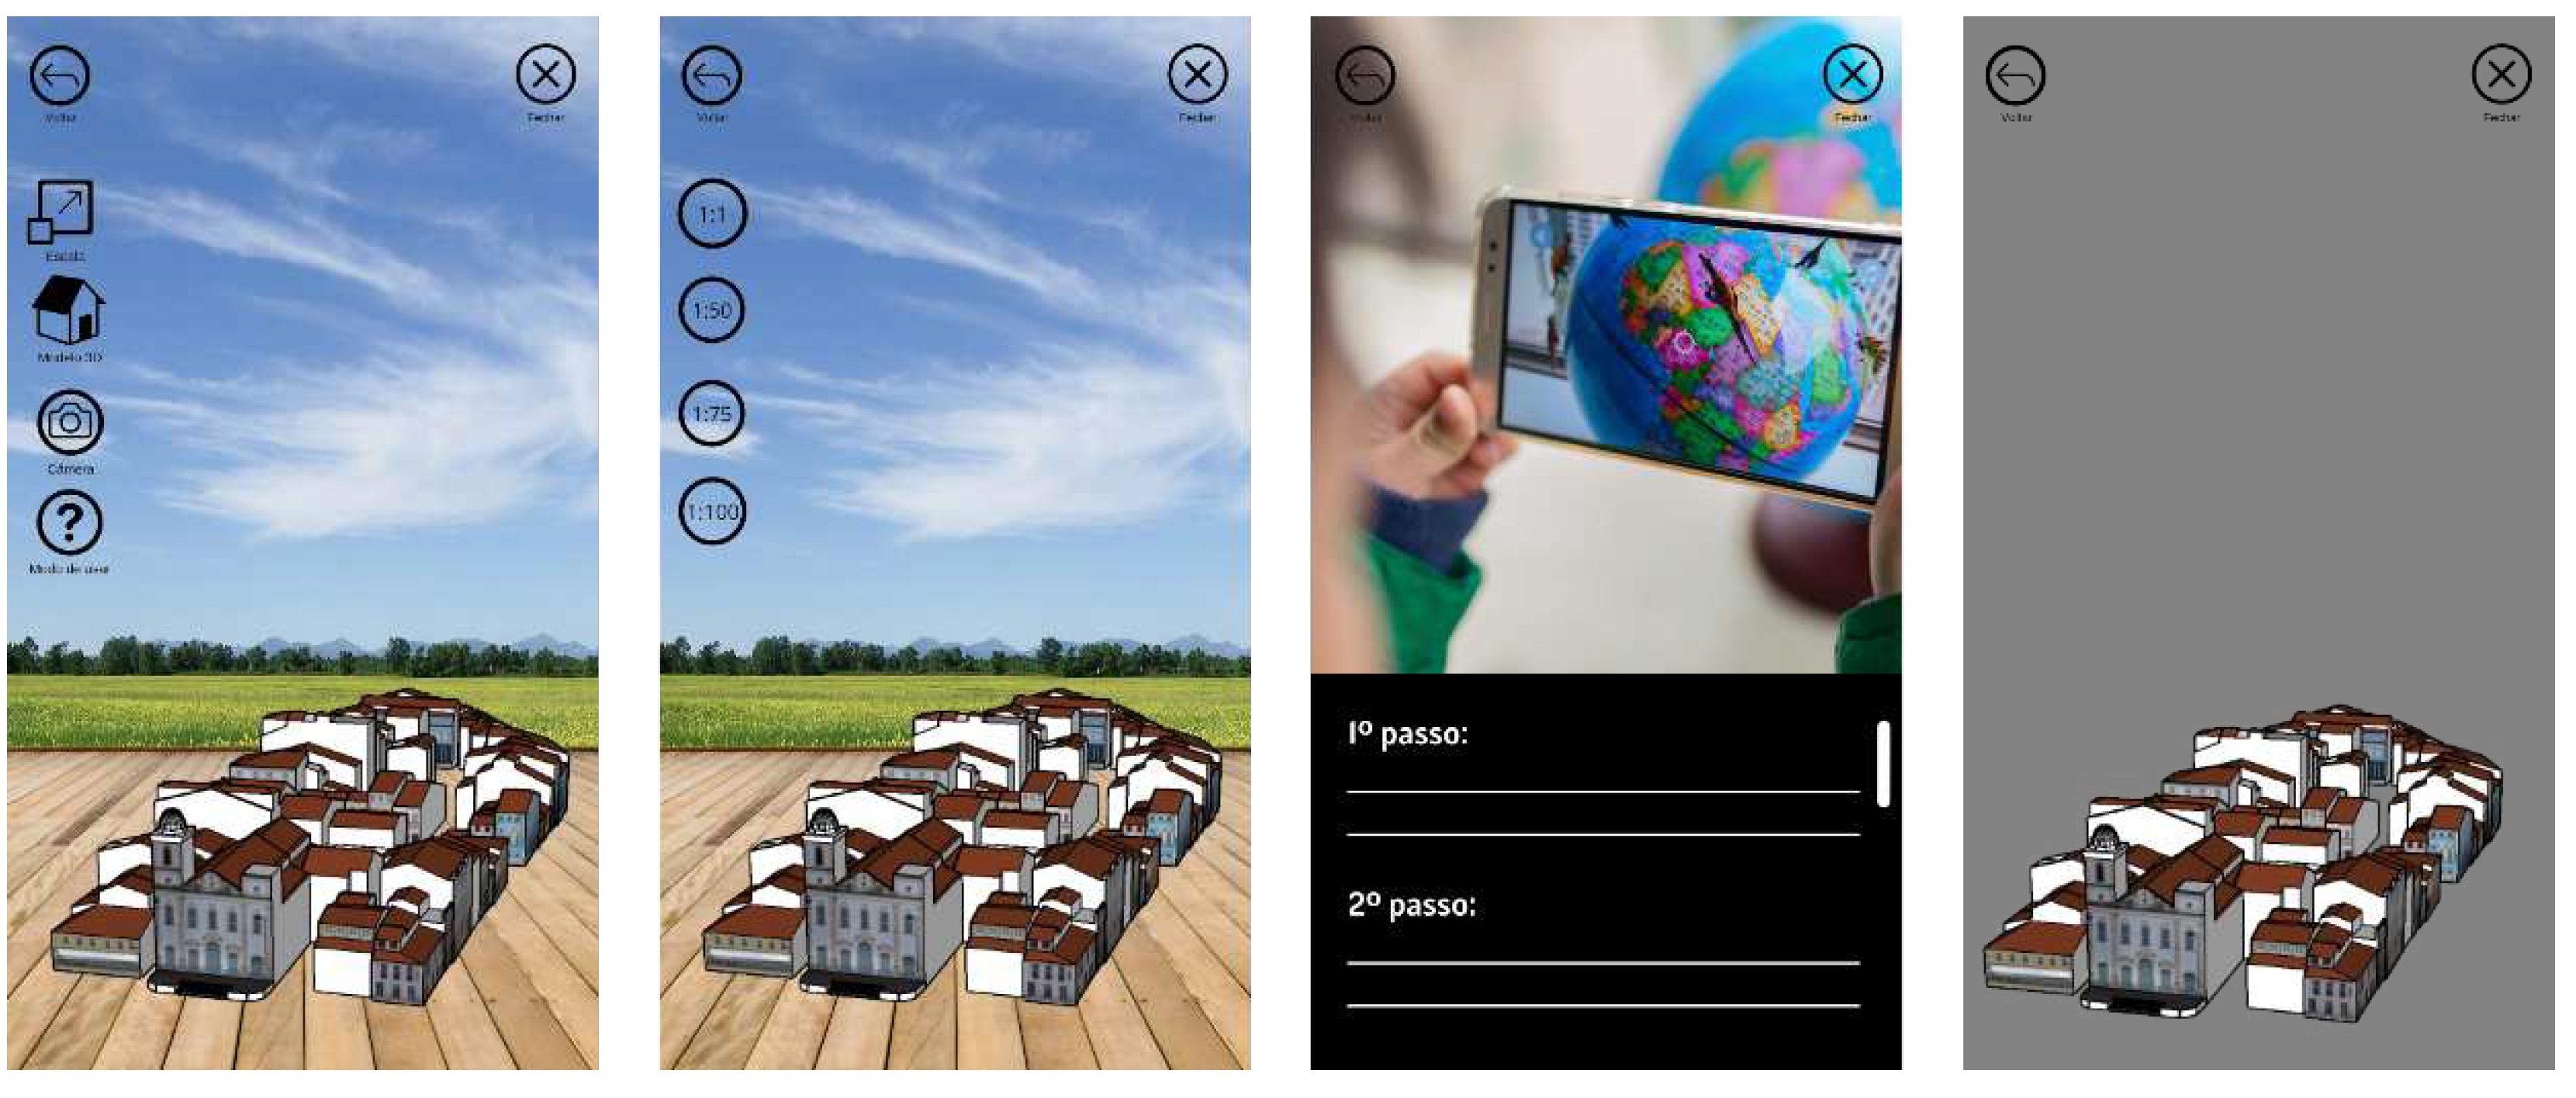
Users outside of Pelourinho, as indicated by the "At Home" button in
Figure 19, can use other functionalities, such as viewing the geometrically modeled buildings at a natural scale, as shown in the first image of
Figure 19. They can adjust the scale by clicking the "Scale" button and seeing the buildings in augmented Reality. The scale option allows viewing the entire geometric model of Pelourinho blocks at preset scales (1/100, 1/75, 1/50, and 1/1). They can access the app’s instructions from the main screen or view the geometric model in 3D.
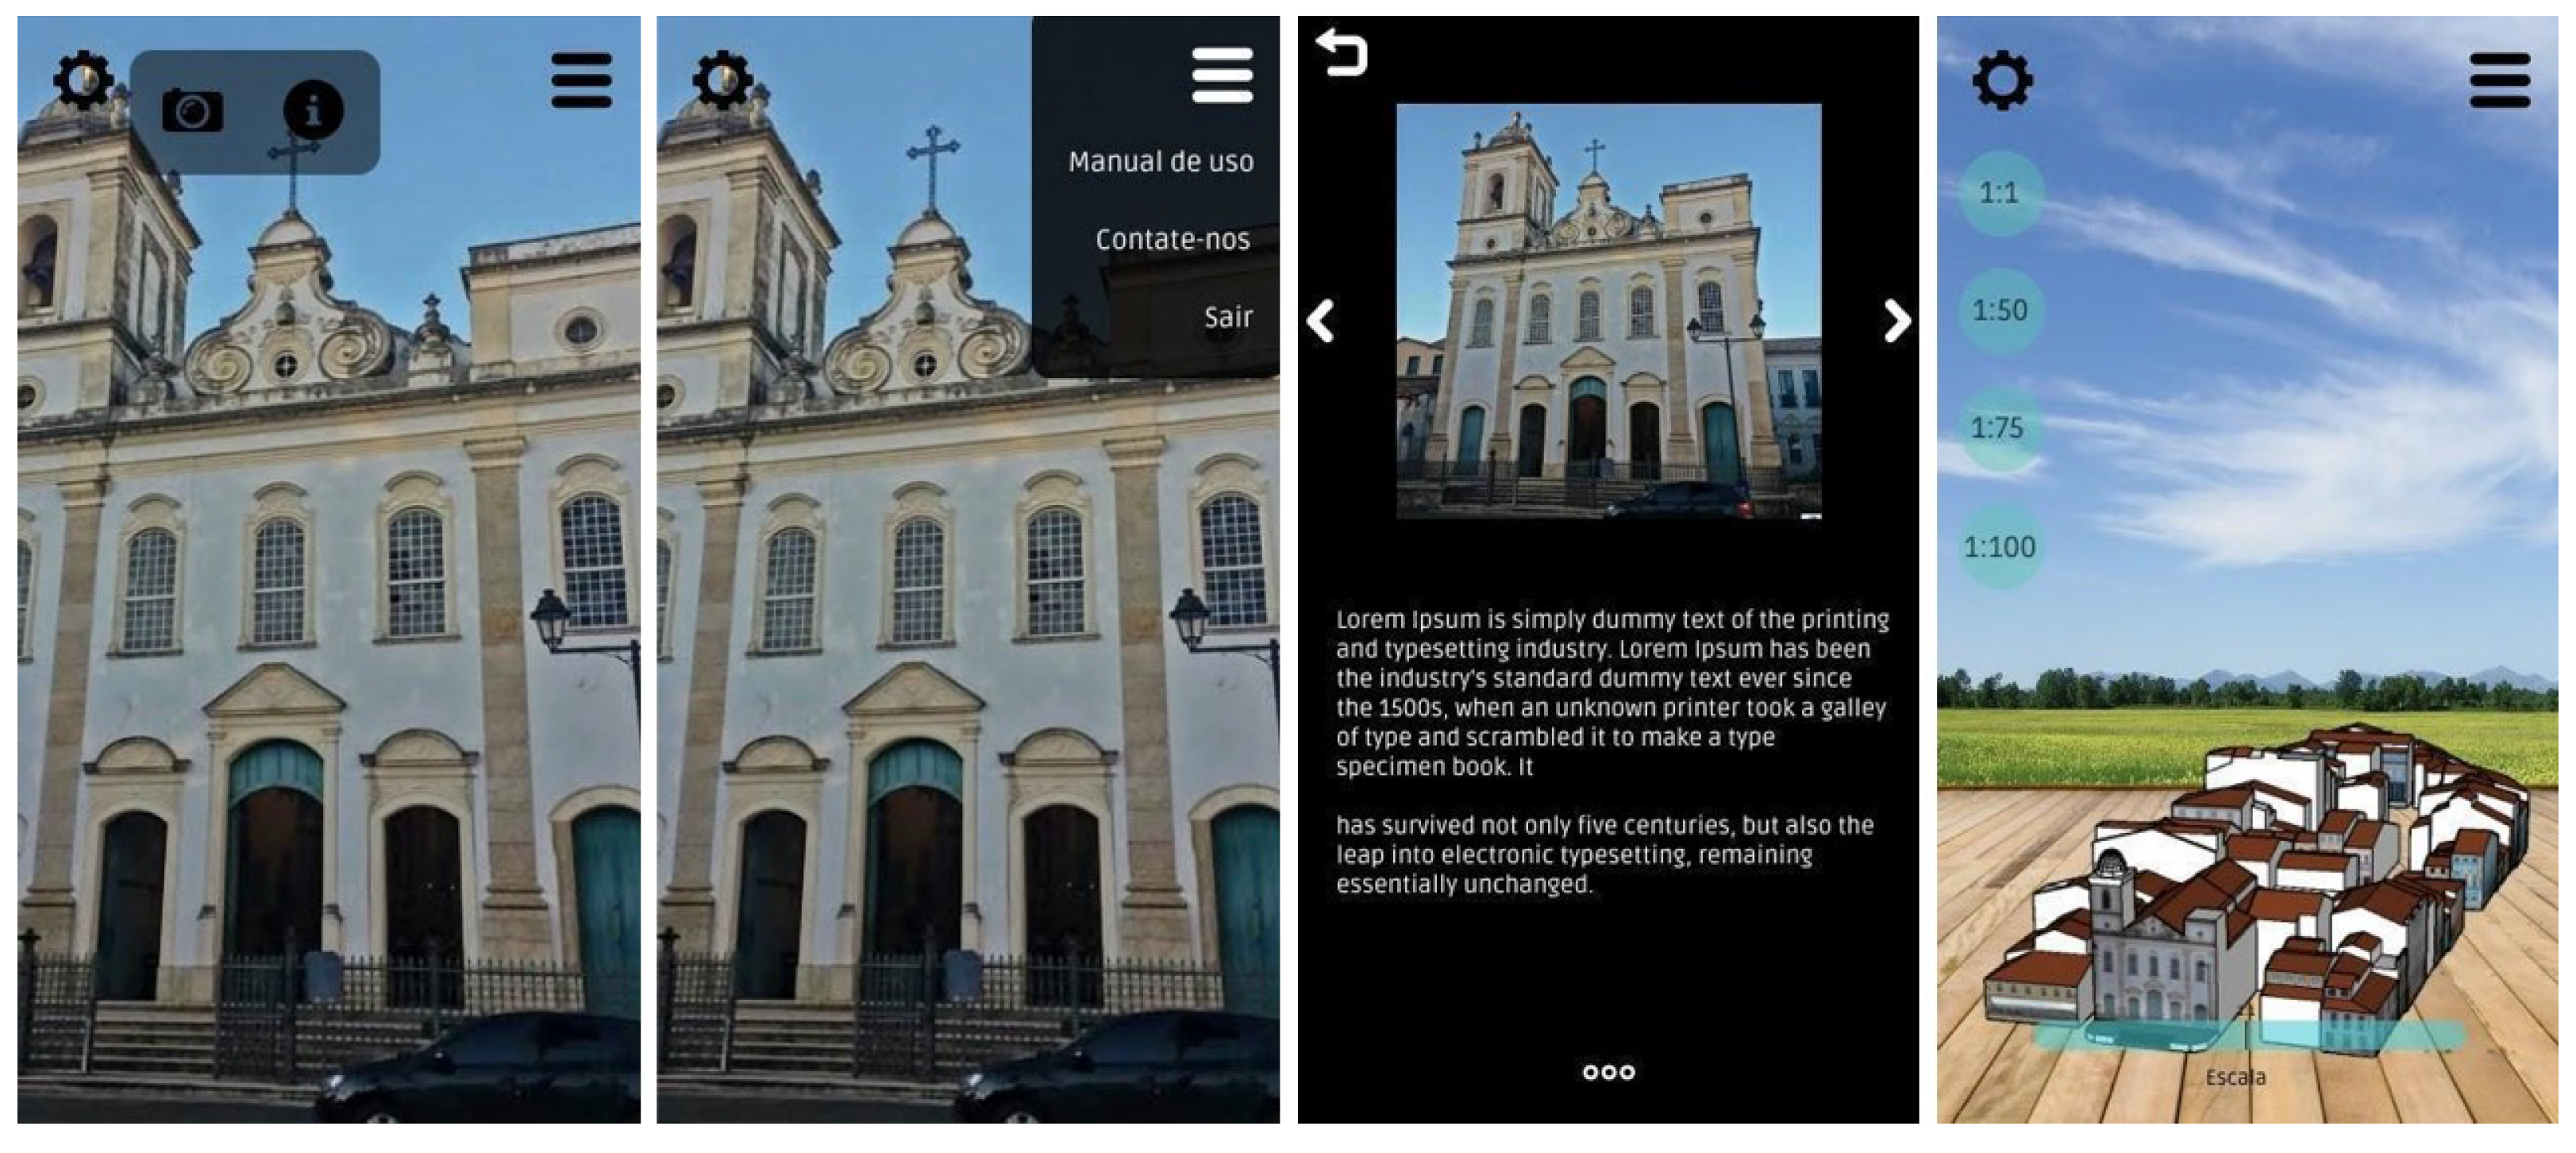
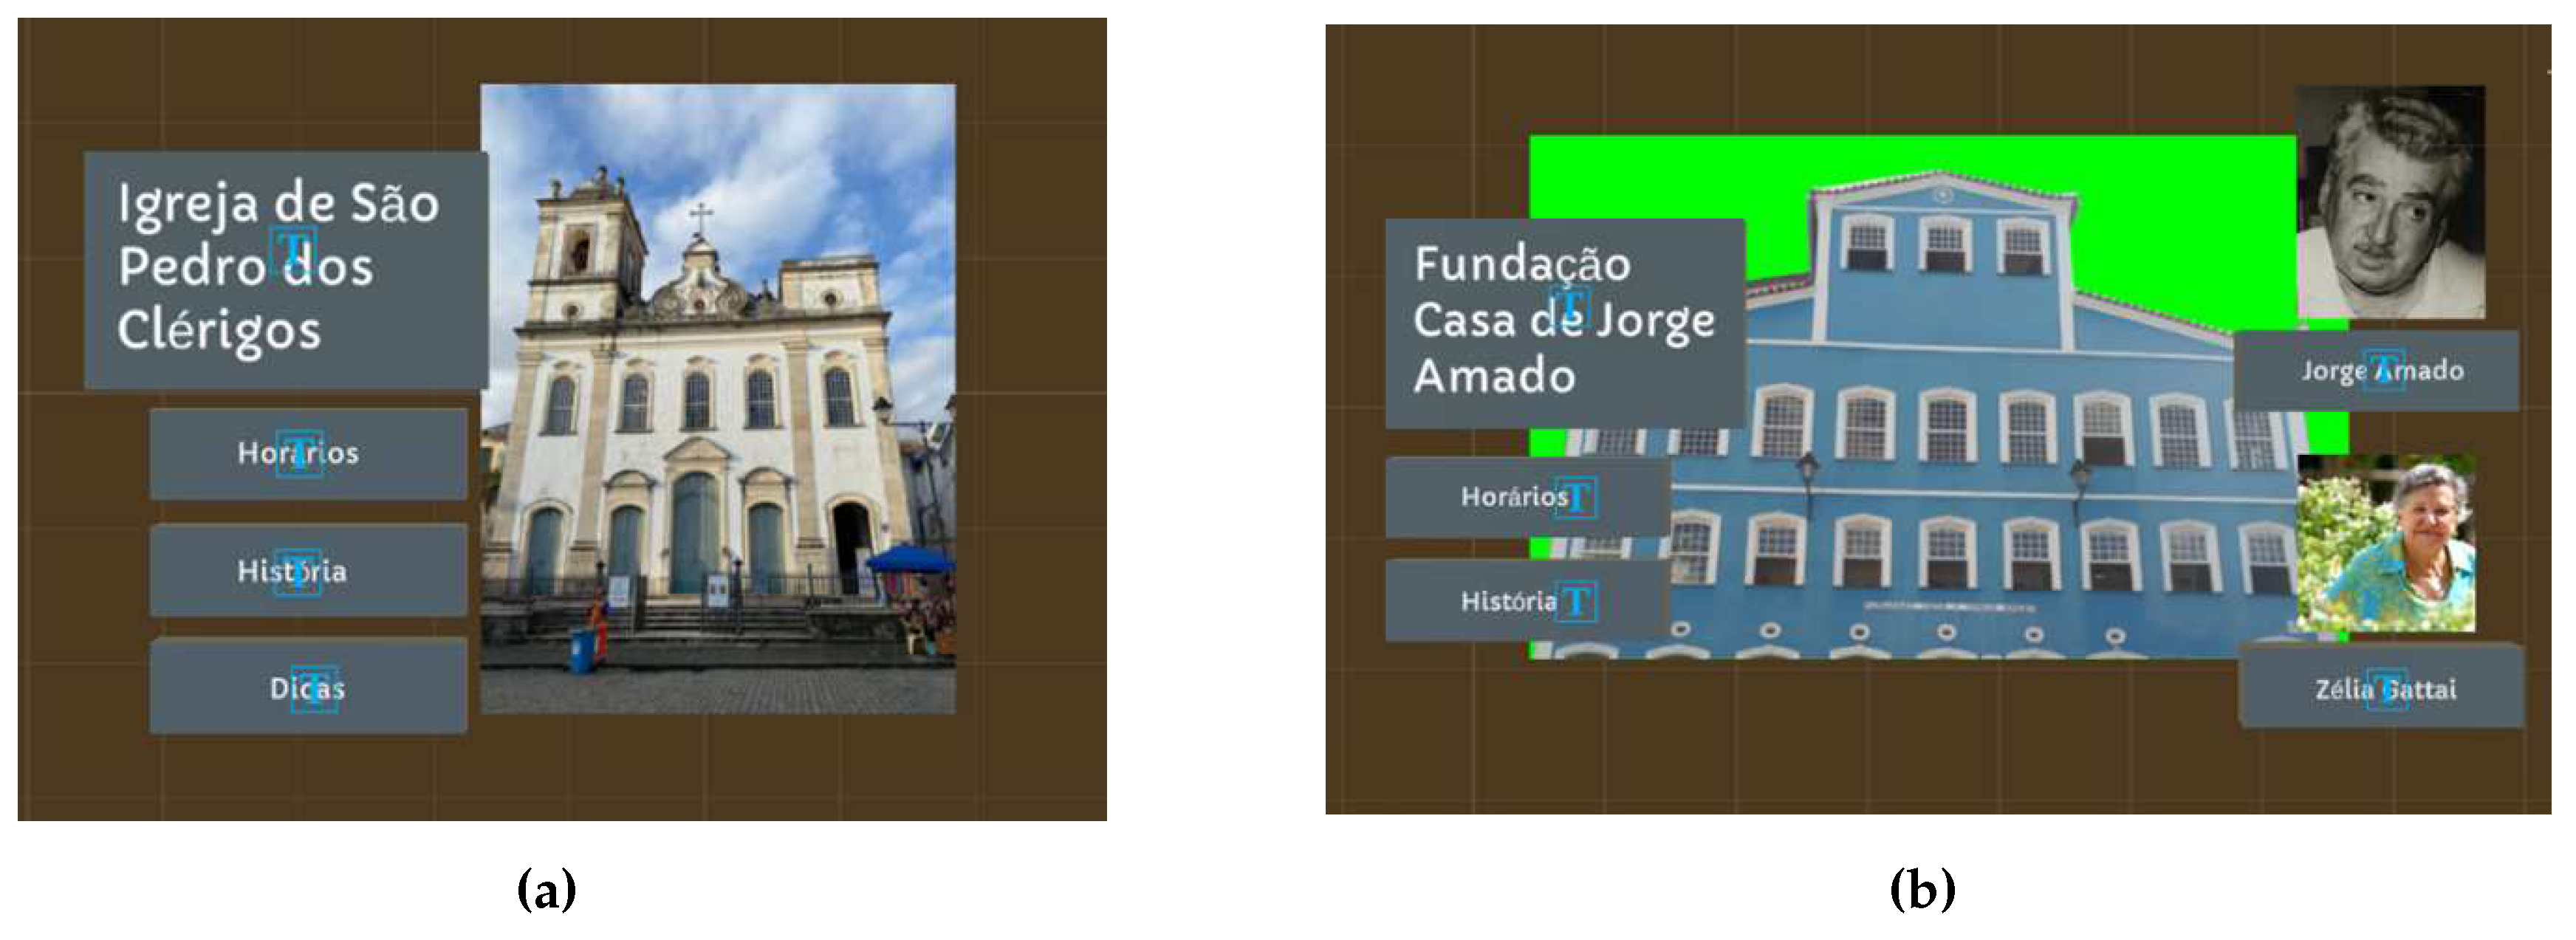
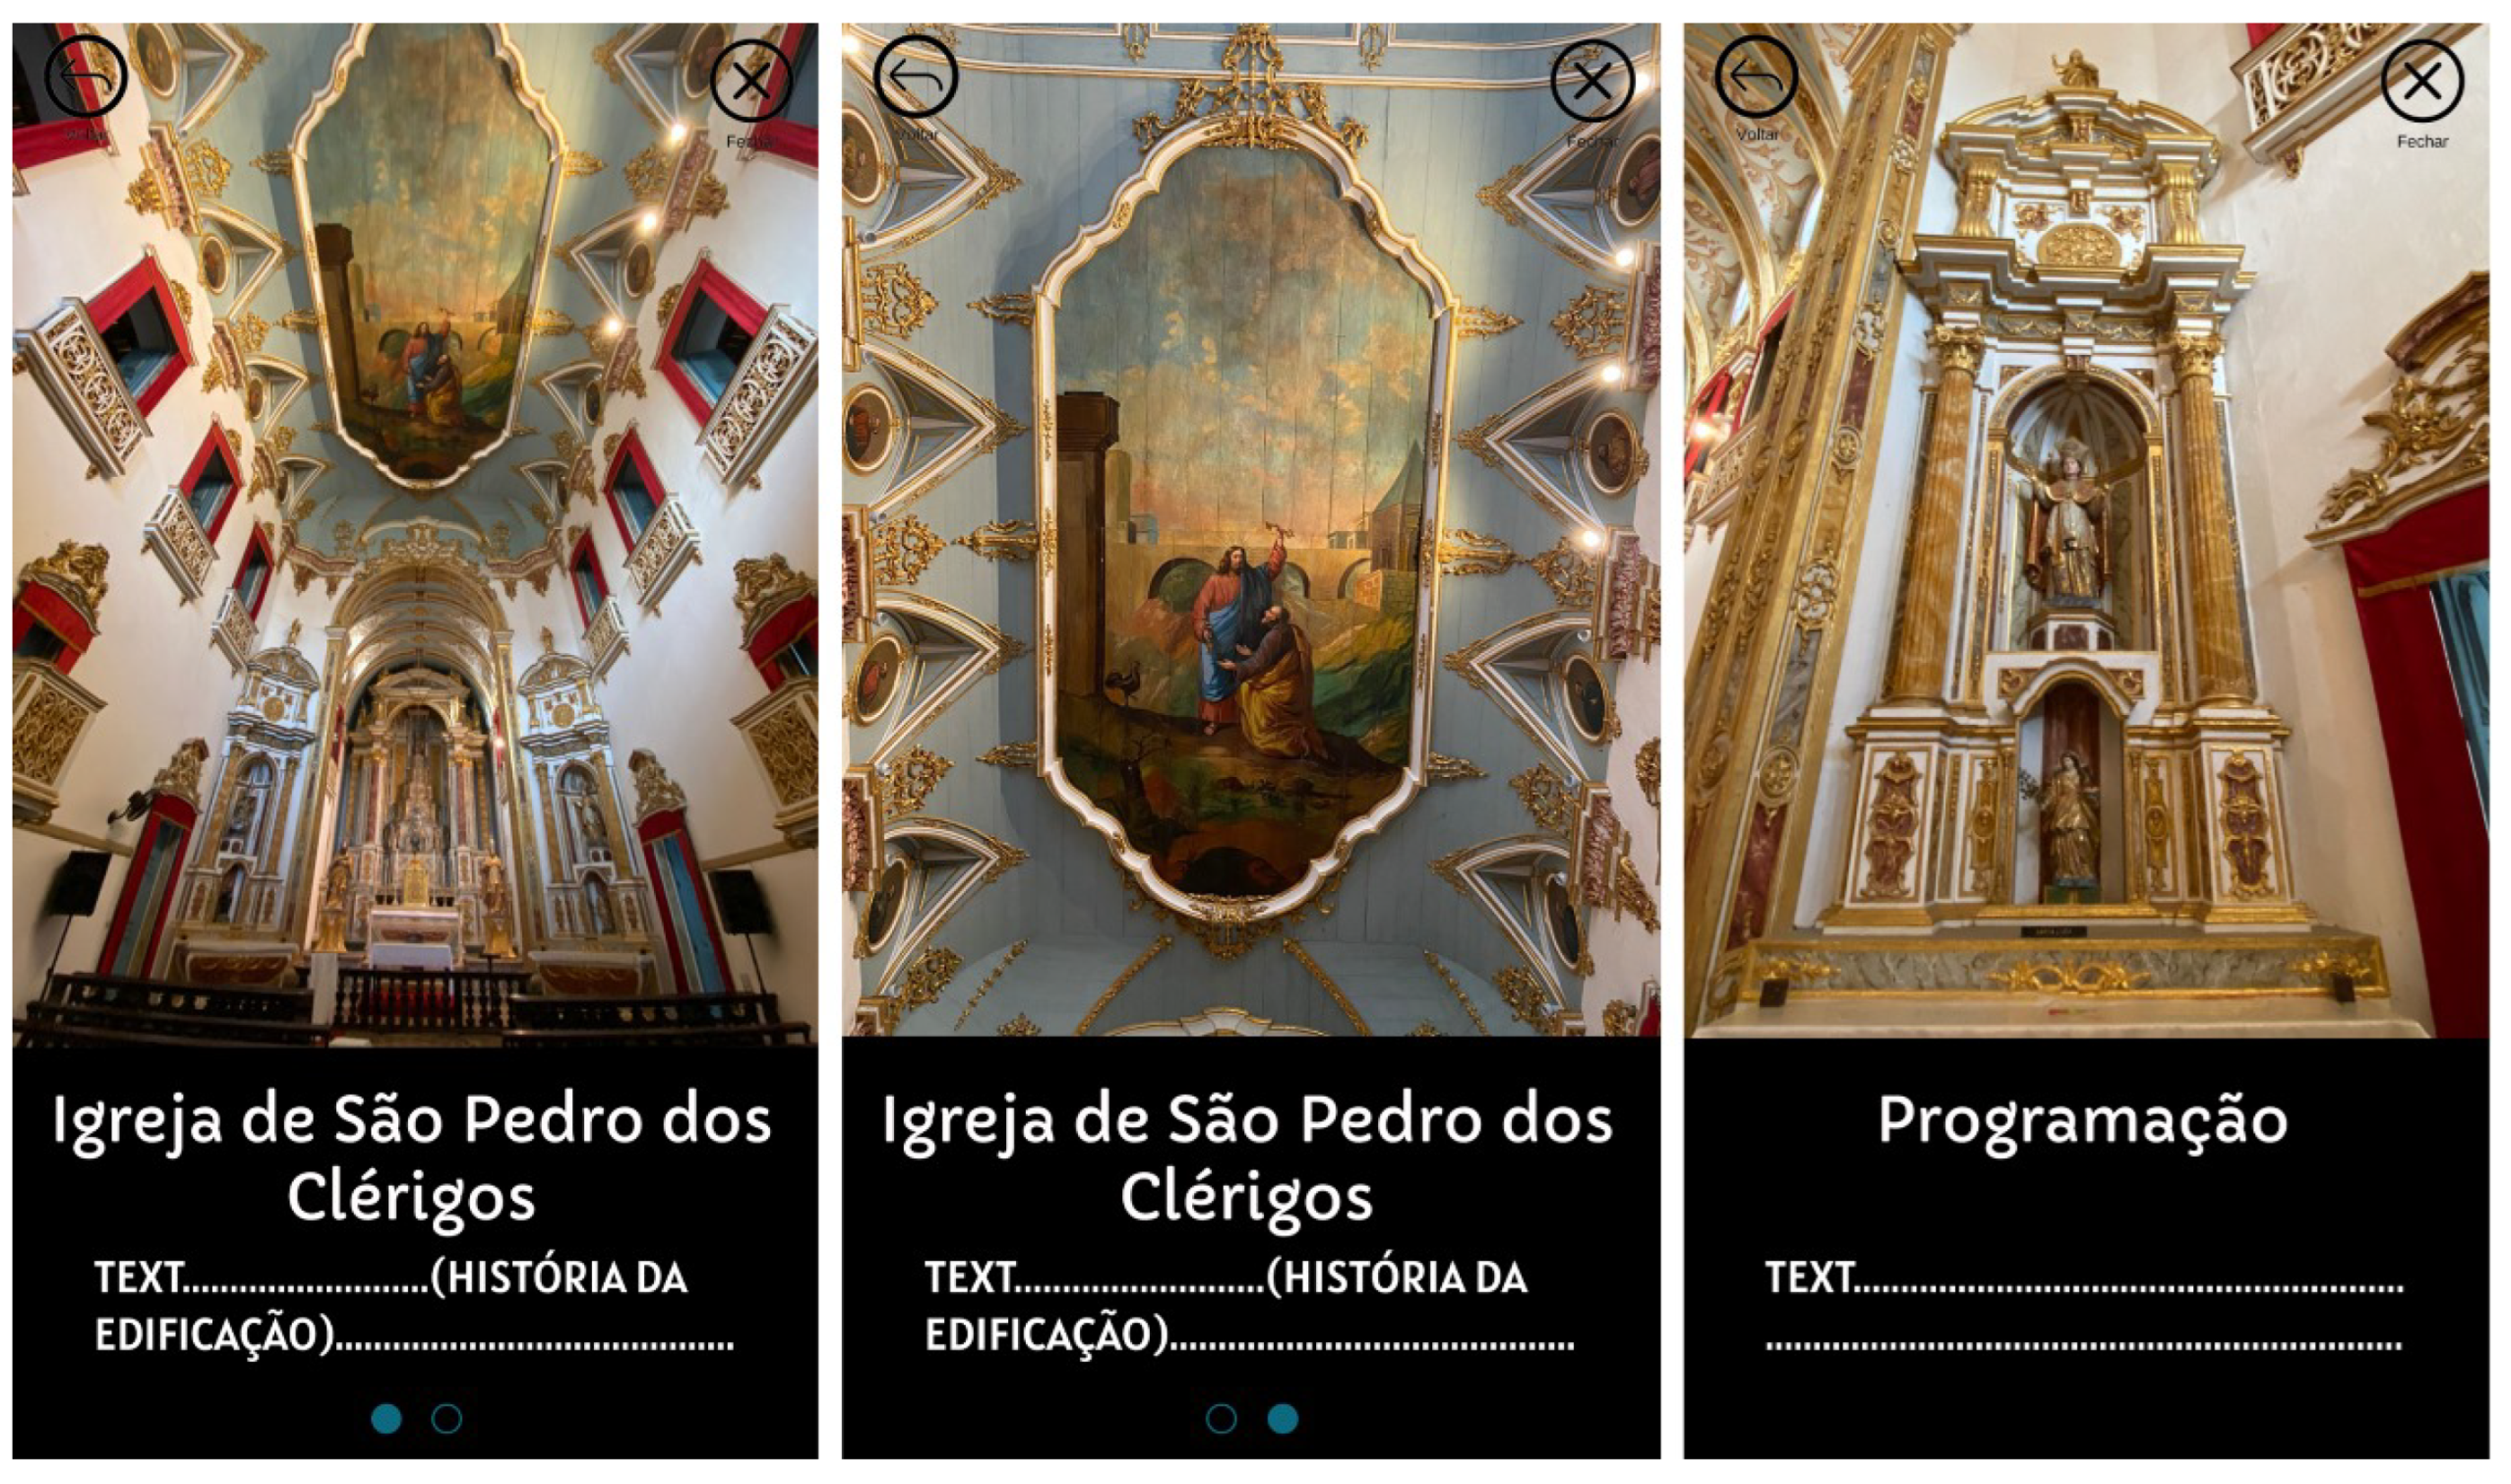
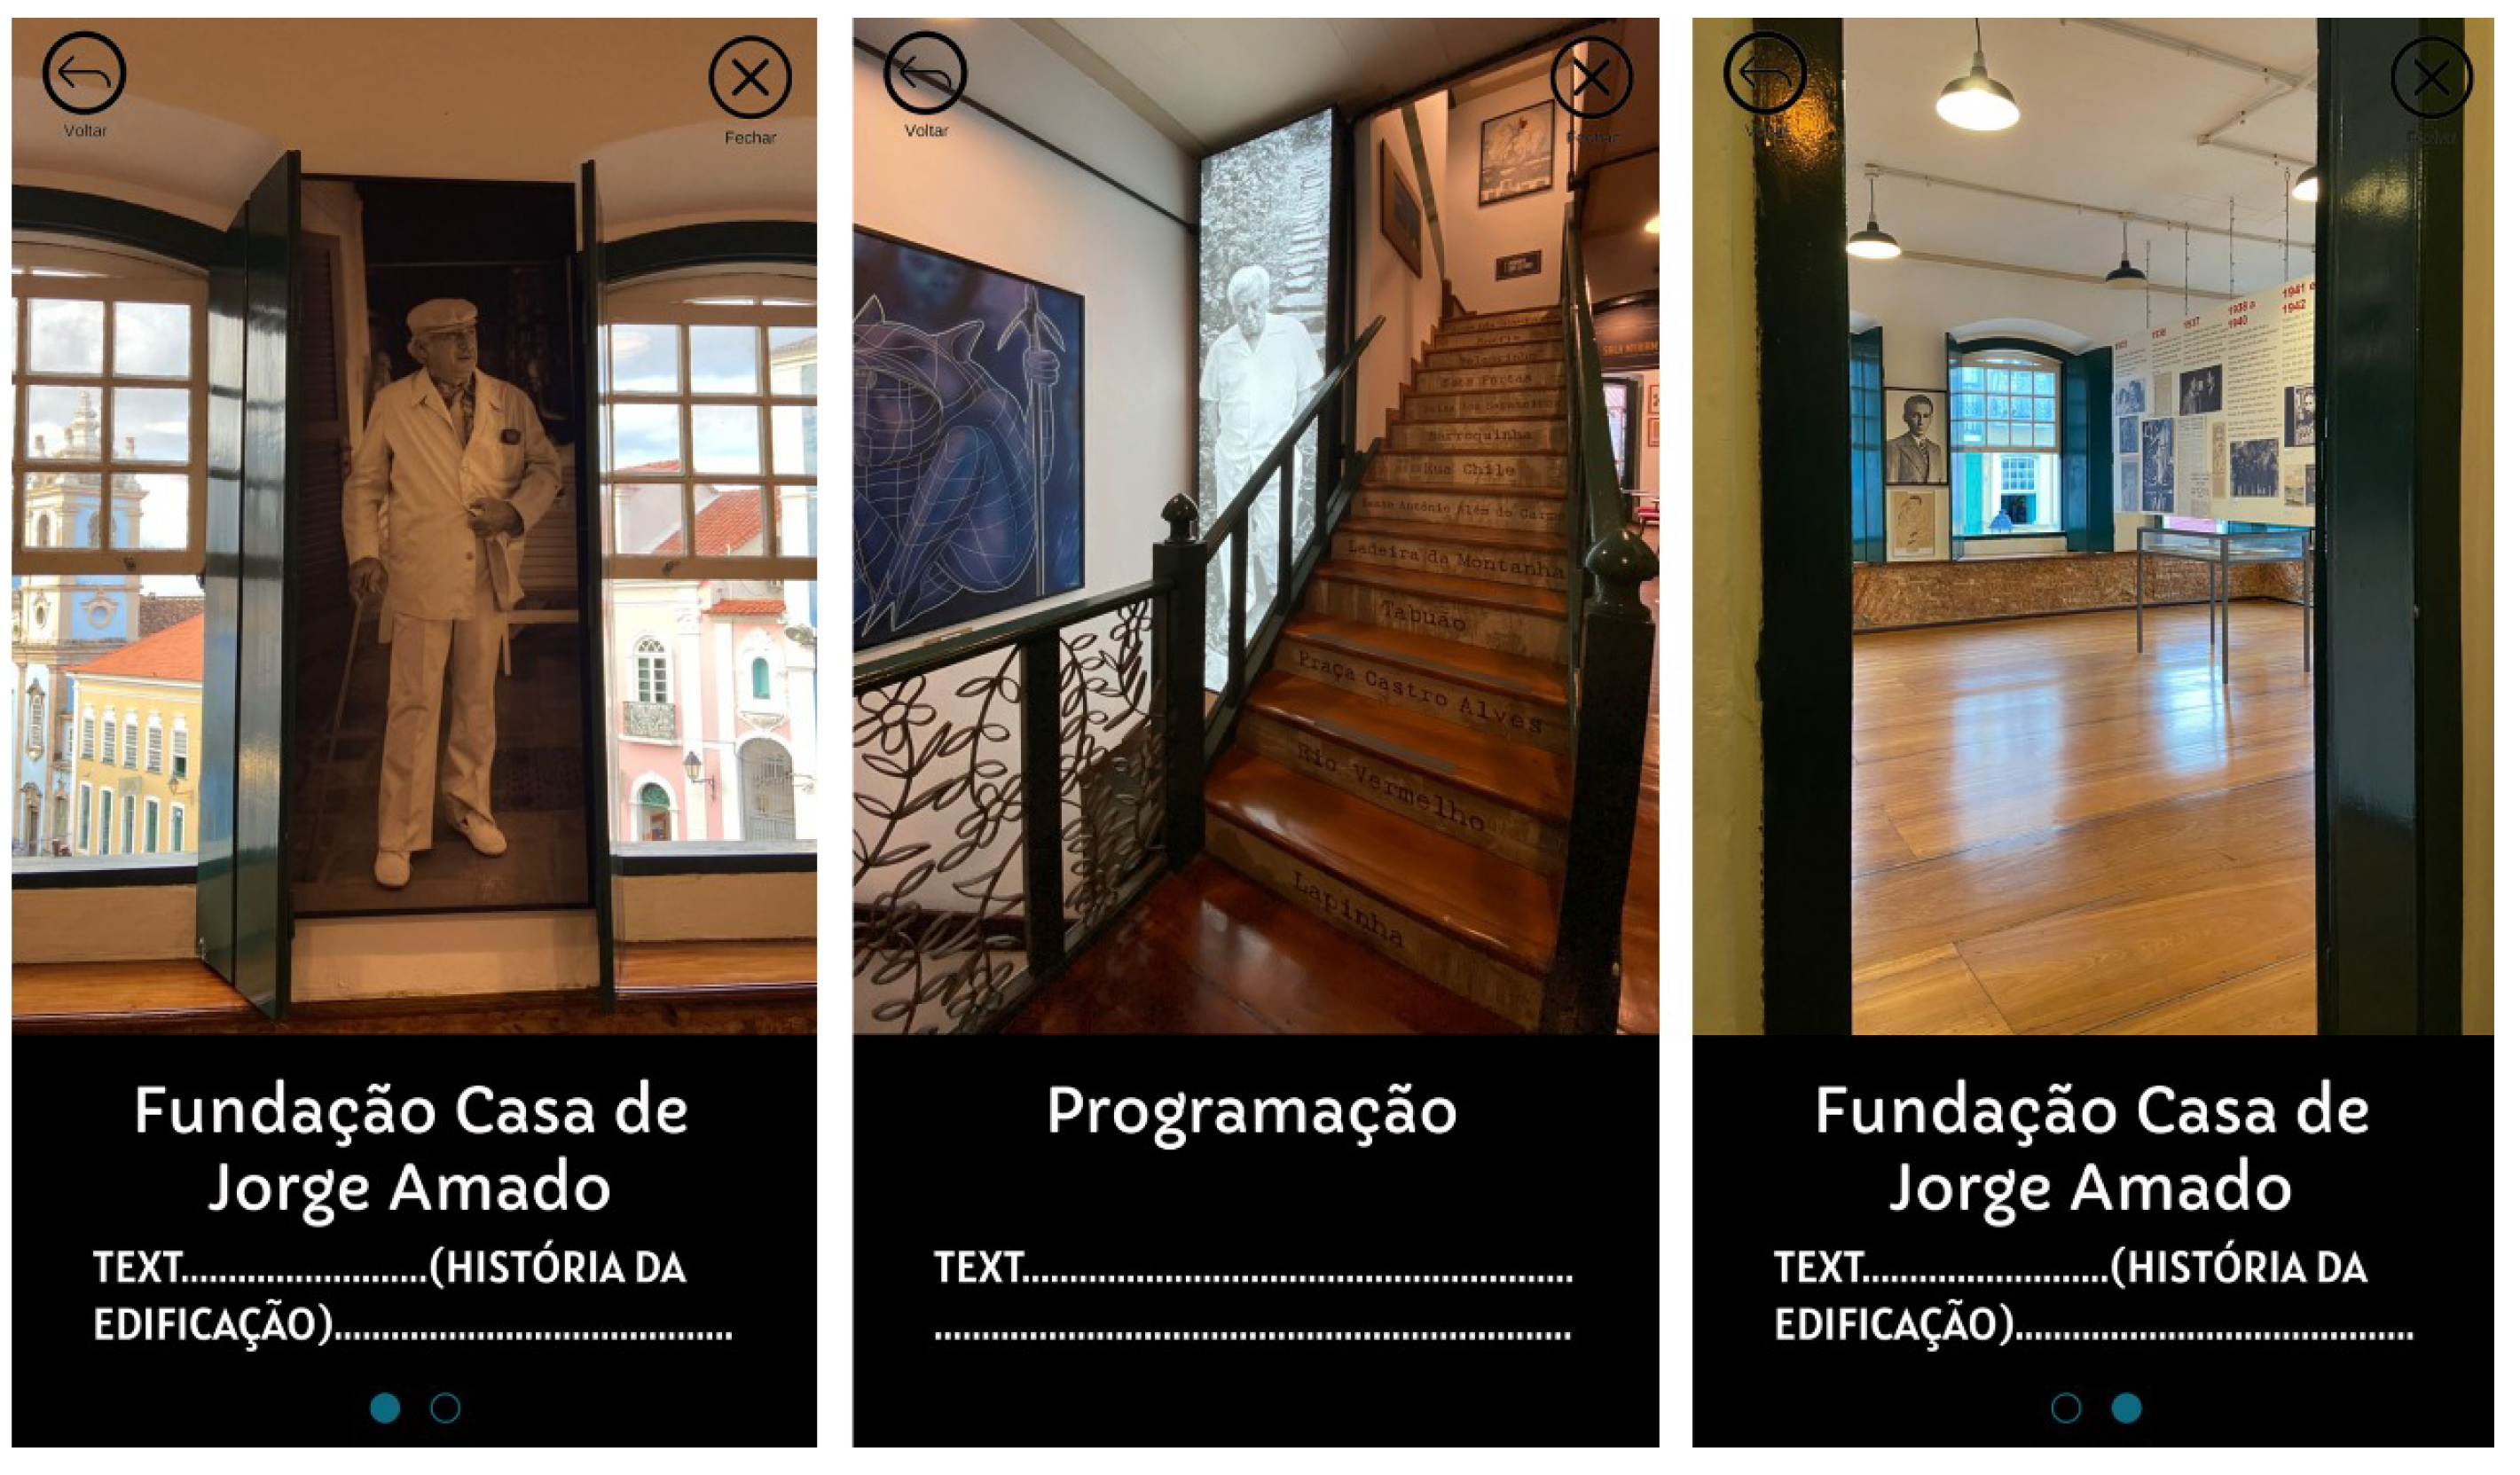
Finally, by accessing the buildings of the Church of São Pedro dos Clérigos and the Jorge Amado House Foundation, the user can obtain information and access images of the interior of these buildings. Information was sought about the history of the buildings, architecture, details about the interior, and operating hours (
Figure 20 and
Figure 21).
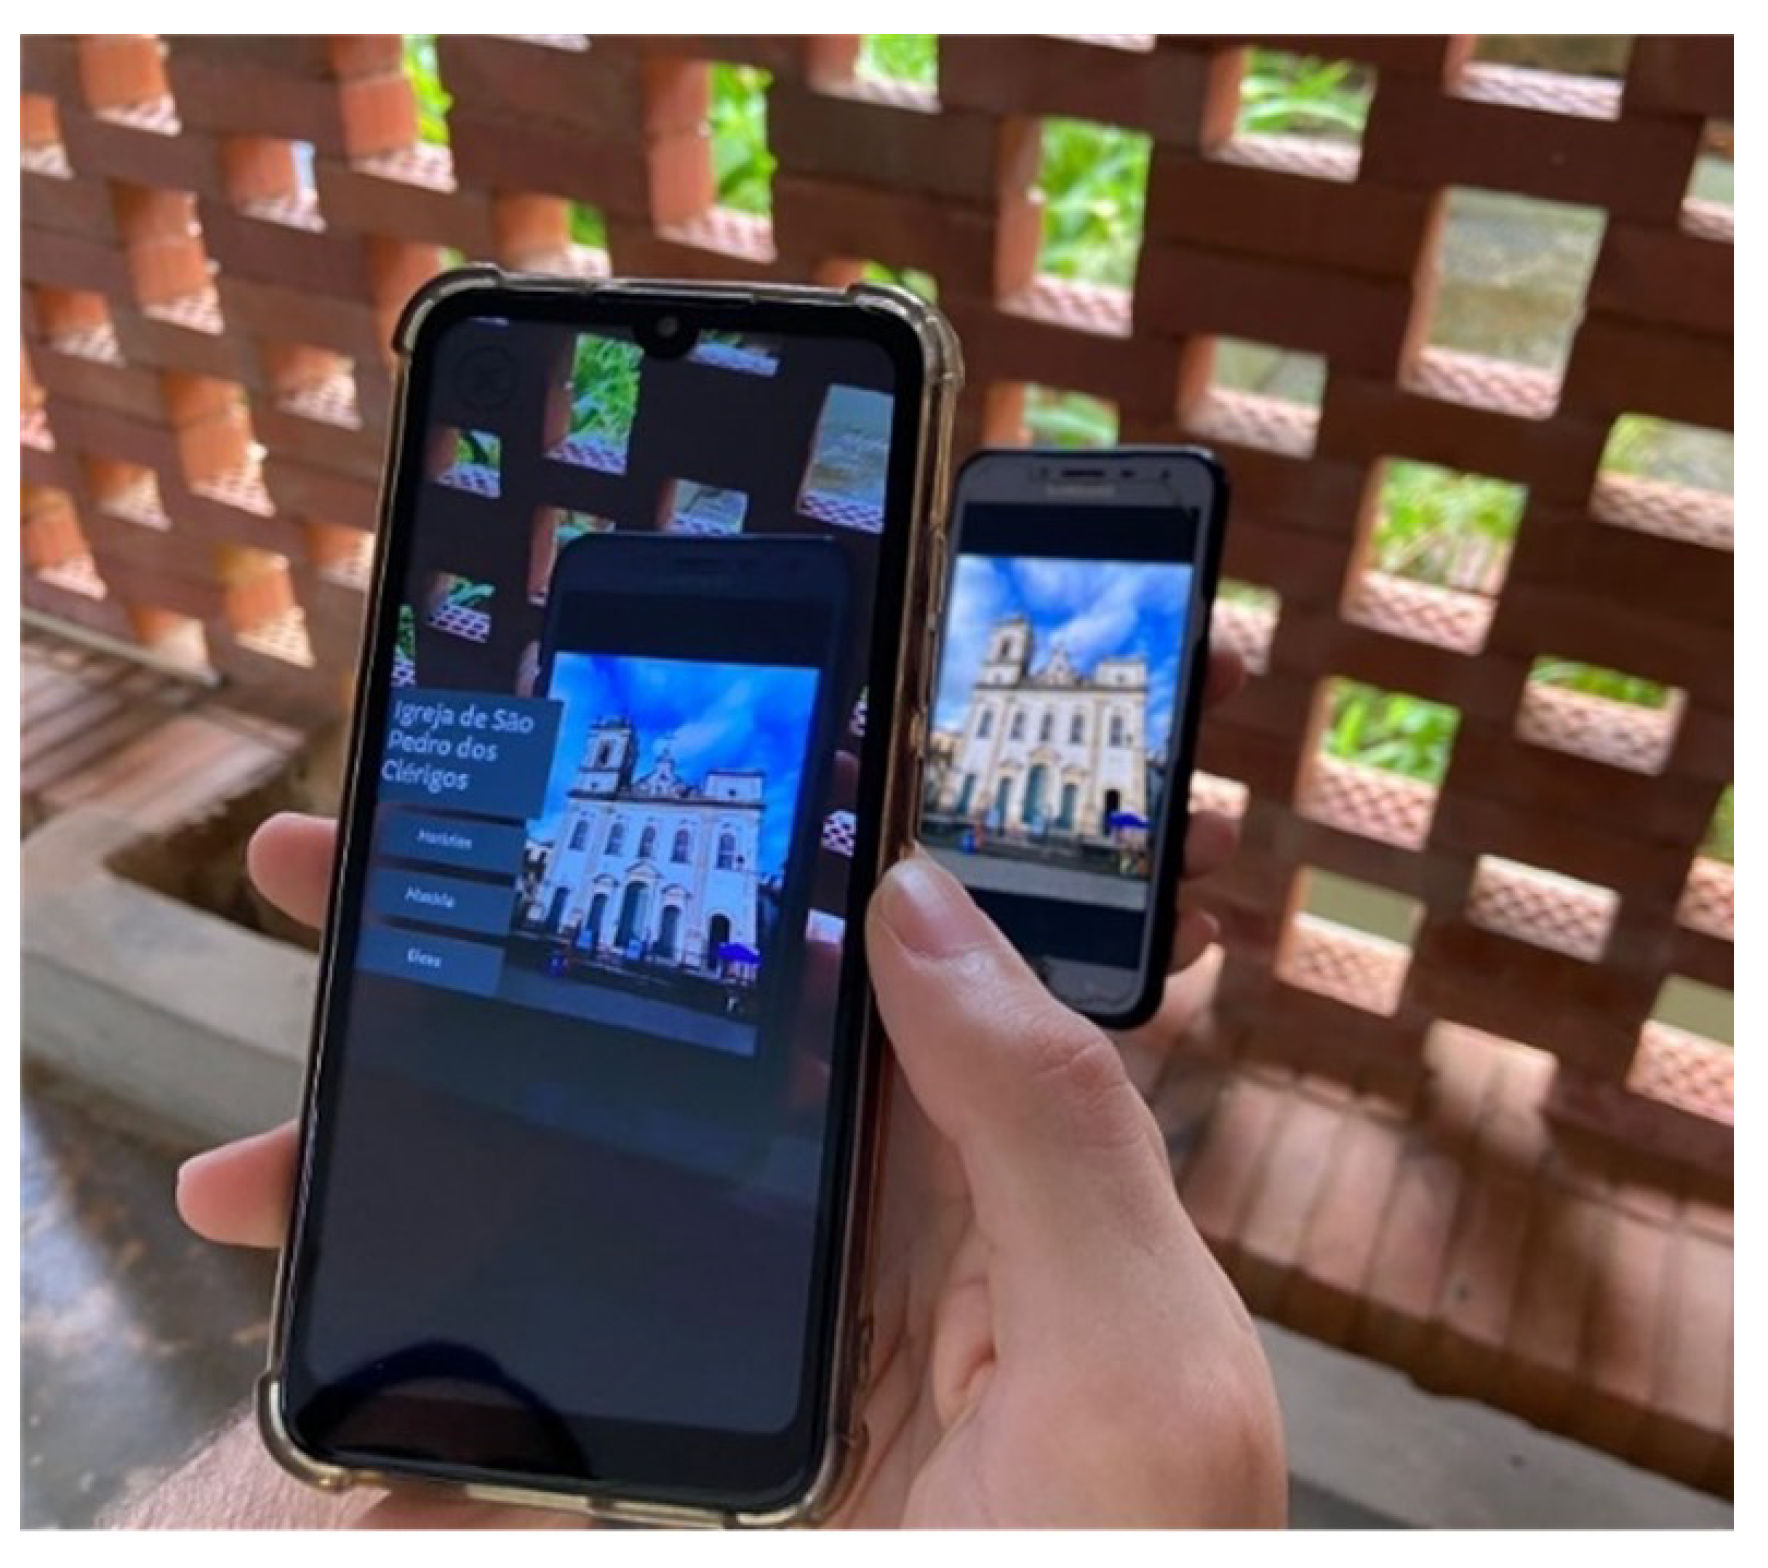
Next,
Figure 22 shows the application in operation, showing the recognition of the church’s image as a marker and its information.
It is worth noting that an augmented reality application focused on heritage is highly relevant due to its many advantages. First and foremost, AR allows preserving historical sites and objects by creating three-dimensional digital models, ensuring their documentation for future generations. In addition, this technology broadens access to heritage, reaching a global audience that can explore and learn about cultural items visually and interactively. Thus, people from different parts of the world can have virtual access to heritage sites and objects that they might not be able to visit physically. This expands the reach of cultural and educational heritage.
Another relevant aspect is the educational capability of applications providing historical and contextual information, enriching the public’s understanding of the cultural significance of each element. Moreover, the interactivity enabled by AR draws both young people and tourists closer, attracting interest and engagement. By revitalizing heritage interpretation, AR innovatively stimulates cultural tourism. Introducing technology into the heritage context can rejuvenate people’s interest in ancient sites and objects. This can lead to new approaches to interpretation and appreciation of heritage. Consequently, this technology preserves and values heritage, enriches education, connects people with their roots, and drives more sustainable tourism.
4. Conclusions
In summary, this research proposed a systematic methodology for digitizing architectural historical heritage, covering everything from data acquisition to augmented reality visualization. The Design Science Research approach allowed for the creation a practical artifact, in this case, an AR application, to enhance the interaction and understanding of cultural heritage. The central motivation for this approach is to meet the needs of documentation, preservation, and access to cultural heritage. The case study carried out in the historical area of Pelourinho, in Salvador, Bahia, Brazil, validated the proposed methodology. Through 3D scanning and the application of augmented reality technologies, the study demonstrated the transformative potential of these approaches in the context of cultural heritage preservation and the dissemination of its historical value. The use of 3D scanning allows for the accurate creation of three-dimensional geometric models, capturing architectural and historical details of buildings and monuments. Applying these models in augmented reality provides a way to interact with the past, overlaying virtual elements onto the physical environment, thus enriching the experience for visitors and those interested. Augmented Reality also has the potential to create hybrid environments that combine elements of the past and present, promoting a deeper understanding of history and culture.
Thus, this research contributes to the preservation of cultural heritage, providing a tool that can be used for documentation, dissemination, and conservation of historical riches. By integrating scanning technologies and augmented Reality, the proposed methodology offered a comprehensive and innovative approach to managing historical heritage. Through the practical application in the study of Pelourinho, the results demonstrated the feasibility and benefits of these techniques in promoting cultural understanding, tourism, and education.
Creating an AR application for interactive visualization of historic buildings, combined with mobile devices, opened new possibilities for learning and engagement with the past. However, it is important to mention that the research has not yet conducted tests with end users, indicating a direction for future evaluations and improvements. In short, this research offers a significant contribution to the field of cultural heritage preservation by proposing and demonstrating a comprehensive methodology for digitization and the application of augmented reality in historical settings. Through the study in Pelourinho, the tangible benefits of these approaches were highlighted, emphasizing their potential to enrich understanding, experience, and conservation of architectural-historical heritage.
Figure 1.
Research Process Outline.
Figure 1.
Research Process Outline.
Figure 2.
Salvador’s historic center (a) and aerial view highlighting the three study blocks (b).
Figure 2.
Salvador’s historic center (a) and aerial view highlighting the three study blocks (b).
Figure 3.
Terrestrial photographs section.
Figure 3.
Terrestrial photographs section.
Figure 4.
(a) Sparse cloud, (b) Dense cloud, (c) Mesh, and (d) Orthophoto.
Figure 4.
(a) Sparse cloud, (b) Dense cloud, (c) Mesh, and (d) Orthophoto.
Figure 5.
Point cloud visualization.
Figure 5.
Point cloud visualization.
Figure 6.
Orthophoto before and after editing.
Figure 6.
Orthophoto before and after editing.
Figure 7.
Geometric modeling process.
Figure 7.
Geometric modeling process.
Figure 8.
Integration step of the historical buildings’ models with the digital terrain model.
Figure 8.
Integration step of the historical buildings’ models with the digital terrain model.
Figure 10.
Implementation of functionalities.
Figure 10.
Implementation of functionalities.
Figure 11.
Information and scale menu.
Figure 11.
Information and scale menu.
Figure 12.
Images with recognition points and ratings by Vuforia.
Figure 12.
Images with recognition points and ratings by Vuforia.
Figure 13.
Test with marker.
Figure 13.
Test with marker.
Figure 14.
Demonstration of texts positioning following the camera.
Figure 14.
Demonstration of texts positioning following the camera.
Figure 15.
Screens showing the Church of São Pedro dos Clérigos (a) and the building of the Jorge Amado House Foundation (b).
Figure 15.
Screens showing the Church of São Pedro dos Clérigos (a) and the building of the Jorge Amado House Foundation (b).
Figure 16.
Showcases various initial screen designs
Figure 16.
Showcases various initial screen designs
Figure 17.
Screen design with features.
Figure 17.
Screen design with features.
Figure 18.
Initial screen (a) with the "In Pelô" option enabled (b).
Figure 18.
Initial screen (a) with the "In Pelô" option enabled (b).
Figure 19.
Screen with main menu and other functionalities.
Figure 19.
Screen with main menu and other functionalities.
Figure 20.
Screens of the Church of São Pedro dos Clérigos
Figure 20.
Screens of the Church of São Pedro dos Clérigos
Figure 21.
Screens of the Jorge Amado House Foundation
Figure 21.
Screens of the Jorge Amado House Foundation
Figure 22.
Application in operation.
Figure 22.
Application in operation.
