
Submitted:
24 August 2023
Posted:
29 August 2023
You are already at the latest version
Abstract
Natural killer cells are associated with the pathogenesis of ulcerative colitis (UC), but their precise contributions remain unclear. The present study sought to investigate the diagnostic value of activated NK-associated genes (ANAGs) in UC. Bulk RNA-seq and scRNA-seq datasets were obtained from the Gene Expression Omnibus (GEO) and Single Cell Portal (SCP) databases. In the bulk RNA-seq, 92 differentially expressed genes (DEGs) were screened out by the “Batch correction” and “Robust rank aggregation” (RRA) methods. The immune infiltration landscape was estimated by single-sample gene set enrichment analysis (ssGSEA) and CIBERSORT, which revealed a higher abundance of activated NK cells in noninflamed UC tissues. 54 DEGs correlated with activated NK cells were identified as ANAGs. Protein-protein interaction (PPI) analysis and least absolute shrinkage and selection operator (LASSO) regression were utilized to screen out 4 key ANAGs (SELP, TIMP1, MMP7, and ABCG2) and establish an activated NK-associated gene score (ANAG score). The ANAG score demonstrated excellent diagnostic value and was validated in three external datasets. The expression of the 4 key ANAGs was validated in UC patients and healthy controls (HC) samples. Through scRNA-seq data analysis, higher expression levels of SELP, TIMP1, MMP7, and ABCG2 were observed in post-capillary venules, inflammatory fibroblasts, enterocytes, and immature enterocytes. The cell scores based on the ANAGs showed enrichment in endothelial cells and fibroblasts. In conclusion, we established and validated an ANAG score with the ability to precisely diagnose UC. The 4 key ANAGs have the potential to serve as therapeutic targets in UC.
Keywords:
ulcerative colitis
; immune infiltration
; activated NK-associated genes
; diagnostic signature
; bulk RNA-seq
; scRNA-seq
1. Introduction
Ulcerative colitis (UC) is a type of inflammatory bowel disease (IBD) that causes inflammation and ulcers in the colon and rectum, most commonly afflicting adults aged 30–40 years [1]. Although the incidence and prevalence of UC are higher in Western countries, the burden of UC has been increasing over time worldwide. The exact cause of UC remains unknown, but several factors have been implicated, including an abnormal immune response, changes in gut microbiota composition, genetic susceptibility, and environmental triggers [2]. Among them, the dysregulated immune response is considered to be the core of the pathogenesis. Hence, it is extremely valuable to investigate immune cell infiltration in UC.
UC is characterized by inflammation of the mucosal lining of the colon, initiating in the rectum and extending proximally towards the cecum in a continuous pattern. A feature of UC is a clear demarcation line visible endoscopically between inflamed and noninflamed areas of the colon. The Montreal classification categorizes UC based on the anatomical location and extent of inflammation: proctitis (E1) is limited to the rectum, left-sided colitis (E2) extends up to the splenic flexure, and pancolitis (E3) affects the entire colon [1]. However, UC exhibits dynamic progression, with the extension of inflammation occurring in approximately 30% of patients initially presenting with E1 or E2 [3]. Given the distinct demarcation between inflamed and noninflamed UC mucosa, we analyzed the transcriptional differences between inflamed and noninflamed tissues to molecularly characterize UC.
Increasing evidence has indicated that natural killer (NK) cells are involved in UC pathogenesis. Previous studies have revealed that UC patients with active disease have a significantly higher proportion of colonic mucosal NK cells than those with inactive disease [4,5]. In a mouse model, a subset of NK cells can amplify intestinal inflammation via the recruitment of inflammatory monocytes [6]. These results suggest that NK cells promote the progression of intestinal inflammation. In contrast, another study reported decreased populations of CD161+ NK cells in the inflamed UC mucosa [7]. Moreover, NK cells were found to protect mice from DSS-induced colitis by suppressing neutrophil function via the Natural Killer Group 2 Member A (NKG2A) receptor [8]. These data indicate that NK cells may exert anti-inflammatory effects in UC. Furthermore, abnormal expression of activating and inhibitory NK cell receptors has been observed in UC patients [9]. Therefore, while NK cells appear to play important roles in UC immunopathology, their precise contributions remain unclear.
In the present study, we utilized single-sample gene set enrichment analysis (ssGSEA) and CIBERSORT to estimate the immune infiltration landscape in UC. Activated NK-associated genes (ANAGs) and activated NK-associated gene score (ANAG score) were established using protein-protein interaction (PPI) network analysis and least absolute shrinkage and selection operator (LASSO) regression. The potential biological significance underlying the ANAG score was explored and validated. ANAGs were also validated in human samples by real-time quantitative polymerase chain reaction (RT-qPCR). Subsequently, using the scRNA-seq dataset, we identified specific cell clusters highly expressing the 4 key ANAGs and calculated cell scores based on their expression. This multigene signature provides a reference for NK-associated molecular mechanisms in UC development and facilitates our knowledge of potential therapeutic targets for UC patients.
2. Results
2.1. Identification and Functional Annotation of DEGs
The overall workflow of the analysis steps is outlined in Figure 1. The analysis selected 3 raw microarray datasets including 172 inflamed and 99 noninflamed UC tissues. The results of batch correction were presented in Figure 2A-D, which showed that the batch effect was removed effectively. To robustly identify DEGs, two approaches were used. “Batch correction” analysis identified 474 DEGs, with 328 upregulated and 146 downregulated. “Robust rank aggregation” (RRA) analysis identified 101 DEGs, including 77 upregulated and 24 downregulated. By intersecting the DEGs from two methods, a final signature of 92 DEGs (71 upregulated, 21 downregulated) was obtained (Figure 2F) and visualized in a heatmap (Figure 2H).
Gene Set Enrichment Analysis (GSEA) of DEGs revealed the upregulation of immune-related signaling pathways in inflamed tissues, including the IL-17 signaling pathway, inflammatory bowel disease, and tumor necrosis factor (TNF) signaling pathway (Figure 2G). Kyoto Encyclopedia of Genes and Genomes (KEGG) and Gene Ontology (GO) analyses indicated that DEGs upregulated in inflamed tissues were mainly enriched in immune-related signaling such as IL-17 signaling pathways, TNF signaling pathways, humoral immune response, and leukocyte migration (Figure 3A,B). DEGs downregulated in inflamed tissues were mainly enriched in transportation-related pathways, such as bile secretion, ATP-binding cassette (ABC) transporters, export across plasma membrane, and xenobiotic transport (Figure 3C,D).
2.2. Immune Cell Infiltration in UC Tissues and Identification of ANAGs
Given the critical involvement of immune cells in UC pathogenesis suggested by the above functional enrichment analyses, we next evaluated immune cell infiltration profiles between inflamed and noninflamed UC tissues using two computational approaches. First, ssGSEA revealed the landscape of 28 immune cell types (Figure 4A). The statistical results indicated that most immune cell types were increased in inflamed versus noninflamed tissues, except for CD56dim natural killer cell (Figure 4B), which was a kind of activated NK cell [10]. Consistent with this, CIBERSORT immune deconvolution showed a higher percentage of activated NK cells in noninflamed tissues (Figure 5A-B). Together, these results indicated that activated NK cells were closely associated with UC pathogenesis. Hence, we sought to find ANAGs and examine the diagnostic value of ANAGs in UC.
We conducted a correlation analysis of DEGs with ssGSEA results and CIBERSORT results (Supplementary Figure S1A,B). Ninety-two DEGs were correlated with CD56dim natural killer cell in ssGSEA and 54 DEGs were correlated with activated NK cells in CIBERSORT (p-value < 0.05). The top 5 positively correlated DEGs with CD56dim NK cells were DHRS11 (R=0.54), AQP8 (R=0.58), KCNK5 (R=0.54), SLC23A1 (R=0.60) and PHLPP2 (R=0.57). The top 5 negatively correlated DEGs with CD56dim NK cells were FUT8 (R=-0.56), GABRP (R=-0.53), SRGN (R=-0.50), CTLA4 (R=-0.51), and FAP (R=-0.47) (Figure 4C). Through the intersection, 54 DEGs were selected and were identified as ANAGs (Supplementary Figure S1C).
2.3. Identification of Hub ANAGs and Generation of ANAG Score
A PPI network was constructed for the 54 ANAGs using the STRING database (Figure 6A). Applying the Molecular Complex Detection (MCODE) plugin in Cytoscape software to this network identified 12 hub ANAGs, organized into 2 interconnected clusters (Figure 6B). The first cluster contained 9 upregulated hub ANAGs that were higher in inflamed tissues. The second cluster had 3 downregulated hub ANAGs that were decreased in inflamed tissues.
Then we used these 12 hub ANAGs for LASSO regression modeling. Optimal model performance was achieved with 4 key ANAGs at a lambda.1se value of 0.046 (Figure 6C,D). These 4 genes - SELP, TIMP1, MMP7, and ABCG2 - were used to calculate a risk score for each patient with the following formula: ANAG score = 0.628 * SELP + 1.574 * TIMP1 + 0.740 * MMP7 - 0.361 * ABCG2 – 18.940.
2.4. Diagnostic Value of the ANAG Score
The expression levels of these 4 ANAGs were significantly different between inflamed and noninflamed tissues (Figure 6E). Receiver operating characteristic (ROC) curve analysis indicated these genes have high diagnostic utility as individual biomarkers, with area under the curve (AUC) values of 0.953, 0.968, 0.963, and 0.931 for SELP, TIMP1, MMP7, and ABCG2, respectively (Figure 6F). Furthermore, in the training cohort, the ANAG score was higher in inflamed tissues, and the AUC of the ANAG score was 0.979, suggesting an excellent discriminatory ability (Figure 7A,B).
To enable quantitative prediction of UC risk, we constructed a nomogram according to the relative expression of ANAGs (Figure 7C). Each gene was assigned a score on a points scale according to its expression level. The total score was calculated by summing the individual gene score. This total score was then projected onto the UC risk scale axis to estimate the risk probability for a given sample.
2.5. Validation of ANAGs, ANAG Score, and Prediction of Drugs
For the validation of the ANAG score, 3 independent UC datasets were retrieved. Dataset GSE11223 contained 63 inflamed and 66 noninflamed UC samples, dataset GSE92415 contained 162 UC and 21 healthy samples, and dataset GSE87466 contained 87 UC and 21 healthy samples. In the 3 validation datasets, these 4 ANAGs showed the same expression pattern compared with those in training datasets (Supplementary Figure S2). The ANAG score was still higher in inflamed or UC tissues and the diagnostic AUCs were 0.989, 0.981, and 0.797, demonstrating the great accuracy and stability of the ANAG score for UC diagnosis (Figure 8A-C).
The expression levels of the 4 ANAGs were validated in 25 UC patients and 25 healthy controls (HC) by RT-qPCR (Figure 8D). ABCG2, TIMP1, and MMP7 showed the maximum differential expression between UC and HC, consistent with the results of the bioinformatics analysis given above. TIMP1 and MMP7 were significantly upregulated and ABCG2 was significantly downregulated in the UC patients. However, SELP expression showed no difference between UC and HC.
In addition, we utilized the Enrichr platform to predict candidate drugs for UC. From the DSigDB database, the top 10 potential compounds sorted by the combined score that could influence the expression of 4 key ANAGs were shown in Figure 8E. Among them, quercetin and retinoic acid had higher scores.
2.6. ScRNA-Seq Analysis Evaluated Gene Expression and Cell Scores Based on the ANAGs
After quality control filtering and integration of the epithelial, fibroblast, and immune cell groups, a total of 281,707 cells were retained for downstream analysis. Fifty-one cell clusters were identified based on the annotation file presented on the Single Cell Portal (SCP) website and visualized as shown in Figure 9A.
Figure 9B showed the expression of known marker genes: immune cells (PTPRC, SELL), T cells (CD3E), B cells (CD79A), myeloid cells (LYZ), epithelial cells (EPCAM, KRT19), fibroblasts (FGF7), and endothelial cells (VWF). The expression of 4 key ANAGs was shown in Figure 9C. We found that SELP, TIMP1, MMP7, and ABCG2 were highly expressed in post-capillary venules, inflammatory fibroblasts, enterocytes, and immature enterocytes, respectively. The difference in the expression of ANAGs between healthy, inflamed, and noninflamed tissues was consistent with the bulk RNA-seq data (Figure 9D).
The scores of ANAGs in each cell were calculated using the “AddModuleScore” function and the “AUCell” package. The distribution and level of score generated by these two methods were similar, among which endothelial cells and fibroblasts scored the highest, such as post-capillary venules, pericytes, inflammatory fibroblasts, myofibroblasts, RSPO3+ fibroblasts, WNT2B+Foshi fibroblasts, WNT2B+Foslo fibroblasts 1, WNT2B+Foslo fibroblasts 2, WNT2B+ fibroblasts 1 and WNT2B+ fibroblasts 2 (Figure 10A, B). The scores of ANAGs were higher in inflamed tissues than in noninflamed tissues and healthy tissues (Figure 10C). Moreover, the GSEA enrichment analysis was performed of the DEGs between AUC score-high and low groups. We found that GO pathways related to extracellular matrix organization and vasculature development were upregulated in the AUC score-high group, while GO pathways related to the biosynthetic process were downregulated in the AUC score-high group (Figure 10D).
3. Discussion
UC is characterized by uncontrolled intestinal immune responses and inflammation. Both innate and adaptive immunity play critical roles in driving UC pathogenesis, and current therapies aim to dampen immune activation and proinflammatory signaling [1]. In this study, we first utilized two bioinformatic approaches to map immune cell infiltration patterns in UC, finding an increased abundance of most immune cells except for activated NK cells in inflamed tissues. Therefore, we screened out 54 ANAGs and identified 4 key ANAGs through comprehensive bioinformatics methods. An ANAG risk score based on these 4 genes showed accurate diagnostic performance, validated in independent datasets. We also clinically confirmed the expression changes of the 4 key ANAGs in human colon samples by RT-qPCR. Furthermore, by analyzing scRNA-seq data, we identified cell clusters where these 4 key ANAGs were located and calculated the cell scores based on 4 key ANAGs.
Natural killer cells are an essential component of the immune system and have the ability to secrete inflammatory cytokines like TNF-α and IFN-γ that polarize and activate other immune cells during inflammation [11]. While NK cells have been implicated in UC pathogenesis, their exact role remains undefined. Some studies show increased mucosal NK cells in active UC patients versus inactive disease [4,5]. However, others report decreased CD161+ NK cells in inflamed UC mucosa [7]. NK cell function is regulated by killer immunoglobulin-like receptor (KIR) that bind major histocompatibility complex (MHC) class I. KIR polymorphism and positive associations between KIR and UC risk have been reported [9,12]. In active UC, peripheral NK cells are decreased compared to inactive disease, and anti-TNF treatment restores peripheral NK cells in responsive patients [13]. The UC drug 6-mercaptopurine induces NK cell apoptosis, possibly limiting inflammation [14]. Despite evidence that NK cells contribute to UC immunopathology, effective biomarkers, especially NK-related biomarkers have not been established.
In our study, we utilized ssGSEA and CIBERSORT to describe the immune infiltration landscape in UC. These two methods both revealed that noninflamed tissues showed a higher percentage of activated NK cells. To identify NK-associated pathogenic genes, we performed a Pearson correlation analysis for DEGs and activated NK cells, resulting in 54 ANAGs, which may be vital factors of NK cells in UC. Using PPI analysis and LASSO regression, SELP, TIMP1, MMP7, and ABCG2 were identified as key ANAGs. This combined approach synergizes biological network analysis with mathematical feature selection to derive an optimal gene signature with biological relevance and diagnostic utility. The integrated PPI-LASSO method provides a robust strategy to identify key genes with meaningful roles in NK biology and UC immunopathogenesis as well as potential biomarkers.
SELP encodes a protein called P-selectin, which is synthesized in megakaryocytes/platelets and endothelial cells [15]. P-selectin's primary ligand is P-selectin glycoprotein ligand-1 (PSGL-1) on leukocytes, mediating endothelial-leukocyte interactions [16]. During inflammation, activators like histamine or thrombin trigger P-selectin translocation from intracellular stores to the endothelial surface, initiating leukocyte recruitment [17]. Two mechanisms regulate the inducible P-selectin expression. First, P-selectin was mobilized from granules to the membrane by thrombin, histamine, or other secretagogues. Second, P-selectin mRNA/protein synthesis was upregulated by TNF, IL-1β, or lipopolysaccharide (LPS) [15,18,19,20]. Consequently, we hypothesized SELP may propagate UC inflammation through these pro-inflammatory effects and that inflammation status induces SELP expression in turn.
MMP7 encodes matrix metalloproteinase-7, a member of the zinc-dependent endopeptidase family that degrades extracellular matrix [21]. MMPs are involved in normal tissue turnover but are overproduced in IBD, contributing to excessive mucosal damage. [22]. As the smallest MMP, MMP7 has broad proteolytic activity against various matrix components including collagens, elastin, proteoglycans, laminin, fibronectin, and casein [23,24]. The elevated MMP7 levels have been found in the inflamed IBD tissues [25,26], implicating its role in intestinal injury.
TIMP1 belongs to the tissue inhibitor of the metalloproteinases (TIMP) gene family, which naturally inhibits active MMPs in a 1:1 ratio to control collagenolytic activity [27]. In IBD inflamed mucosa, TIMP expression correlates with the proinflammatory cytokines and inflammation severity [26,28,29,30,31,32]. Proinflammatory cytokines can induce both MMPs and TIMPs [33,34,35,36], suggesting TIMP1 is involved in tissues remodeling and inflammation processes.
ABCG2 encodes ATP Binding Cassette Subfamily G Member 2, which is expressed on the apical surface of intestinal epithelial cells, mediating transportation of toxins [37,38], carcinogens [39,40,41,42], and clinically used drugs [43,44,45,46]. ABCG2 has been implicated in the absorption of the IBD drug sulfasalazine [46]. As a membrane protein, ABCG2 translation occurs in the endoplasmic reticulum (ER). Inflammatory triggers like cytokines and nitric oxide can impair ER protein folding, causing the accumulation of unfolded proteins and ER stress. This disturbs ABCG2 function and localization [47]. Furthermore, several studies show reduced ABCG2 expression in inflamed IBD tissues [48,49,50,51,52,53], suggesting that ABCG2 may be involved in UC pathogenesis.
Based on the expression of the 4 ANAGs, we constructed an ANAG score demonstrating high diagnostic accuracy and stability in training and validation cohorts, which implied the great potential for clinical translation of the ANAG score. Noteworthily, the superior performance of the ANAG score over individual genes highlights the complex molecular underpinnings of UC.
Although our ANAG score demonstrated accurate diagnostic ability and was validated across multiple datasets, some limitations remain to be addressed. First, clinical details including disease severity and medication use are lacking. Therefore, the associations between immune cells, related genes, disease severity, and medication use, need to be further estimated. Second, the ANAG score derivation utilized public data with small sample sizes. Validation in larger prospective cohorts is warranted before clinical implementation. Third, the design of the datasets makes it difficult to infer causality between the ANAGs and activated NK cells abundance. Future mechanistic studies are needed to determine the functional relationships and interactions.
4. Materials and Methods
4.1. Public Data Collection
The microarray gene expression datasets for UC tissues were obtained from the GEO (http://www.ncbi.nlm.nih.gov/geo/) database. The training datasets included GSE107499, GSE179285, and GSE59071. The validation datasets included GSE11223, GSE87466, and GSE92415. These datasets comprised inflamed UC tissues, noninflamed UC tissues, and normal tissues. Details for each dataset are provided in Table 1. The bulk RNA-seq data were preprocessed by quantile normalization and log2 transformation using the R package “limma”. The scRNA-seq data (accession: SCP259) was obtained from the Single Cell Portal (https://singlecell.broadinstitute.org/single_cell).
4.2. Screening of DEGs
Two approaches were used to identify robust DEGs across the multiple microarray datasets. The first approach “Batch correction” combined the 3 raw expression data into a single expression matrix. Batch effects were removed and DEGs were analyzed using the R package “limma”. The effect of batch correction is visualized by box plot and PCA. The second method, “RRA”, analyzed the DEGs of the 3 expression matrices respectively. Three groups of DEGs were integrated via the R package “RobustRankAggreg”. The final DEGs were generated by intersecting the results from these two approaches, providing robust DEGs across multiple datasets. Screening criteria: adj.P.Val < 0.05 and |log fold change (FC)| > 1.
4.3. Immune Infiltration Analysis
Two methods were used to estimate the immune infiltration landscape in each sample. The first method, “ssGSEA”, used the expression levels of immune cell-specific marker genes to infer immune cell infiltration within individual samples [54]. Marker gene sets for 28 immune cell types were obtained from a published article [55]. The second method, “CIBERSORT”, converted the normalized gene expression matrix into estimates of the composition of infiltrating immune cells for each sample [56]. These two methods were performed and visualized using the R language.
4.4. Screening of Activated NK-Associated Genes (ANAGs)
The relationships of all DEGs with the results of ssGSEA and CIBERSORT were examined using Pearson correlation analysis. DEGs with p-value < 0.05 were considered significantly correlated. Through the intersection of the DEGs associated with ssGSEA results and CIBERSORT results, 54 DEGs were selected and identified as ANAGs.
4.5. Functional Enrichment Analysis
To gain functional insights into the DEGs, GO and KEGG pathway enrichment analyses were performed using the R package “clusterProfiler” [57]. GO analysis identified overrepresented biological processes, molecular functions, and cellular components. KEGG analysis revealed enriched signaling pathways. For both GO and KEGG analyses, terms with p-values <0.05 were considered statistically significant.
4.6. Identification of Hub ANAGs
To identify hub genes, a PPI network was constructed for the ANAGs using the STRING database. STRING integrates known and predicted protein interactions from varied sources to generate a comprehensive interaction network [58] (https://string-db.org). The ANAGs PPI network was visualized using Cytoscape [59]. The Molecular Complex Detection (MCODE) plugin in Cytoscape was then applied to the PPI network to identify highly interconnected subclusters. Core genes within each subcluster were selected as hub ANAGs, representing key nodes in the PPI network with potentially important biological functions.
4.7. Generation and Validation of the ANAG Score
The hub ANAGs identified from the PPI network were used to develop an ANAG score via LASSO regression. This machine-learning technique selected key genes to generate an optimal model for predicting disease status. The diagnostic utility of the ANAG score and model genes was evaluated by ROC curve analysis. The predictive capacity and robustness of the ANAG score were further validated through 3 external datasets.
4.8. Clinical Specimens
The expression of ANAGs was clinically validated in 25 UC patients and 25 healthy individuals. The study was approved by the Medical Ethics Committee of Sir Run Run Shaw Hospital (SRRSH) (ID: 20211103-34). Written informed consent was obtained from all participants. UC patients were aged 18-65 years and diagnosed based on endoscopic, radiologic, and histopathological findings. UC tissues was collected from inflamed regions of the colon during endoscopy. Matched normal colon tissues was obtained from healthy controls. Tissues were immediately placed in cold TRIzol reagent and processed in the laboratory.
4.9. RNA Isolation and RT-qPCR
To validate gene expression changes, total RNA was extracted from colon tissues using TRIzol reagent (Molecular Research Center, Inc.) and reverse transcribed into cDNA using RNase H-reverse transcriptase (Invitrogen) with oligo (dT) primers. qPCR was performed in triplicates using iCycler Sequence Detection System (Bio-Rad) and iQTM SYBR Green Supermix (Bio-Rad). Relative expression of each gene was calculated by the 2-△△CT method using ACTB as the reference gene for normalization. PCR primers used for each gene are listed in Table 2.
4.10. Potential Therapeutic Drug Prediction
To identify potential future drug therapies for ulcerative colitis, the key ANAGs were analyzed using the DsigDB database (http://dsigdb.tanlab.org/DSigDBv1.0/) via the Enrichr platform (https://maayanlab.cloud/Enrichr/).
4.11. ScRNA-Seq Data Processing
The scRNA-seq data was analyzed using the R package “Seurat”. Low quality cells expressing <200 genes, with >15% mitochondrial counts, and genes expressed in <3 cells were filtered out. Data was normalized using the “NormalizeData” function. 2000 highly variable genes were identified using the “FindVariableFeatures”, and principal component analysis was performed. To acquire the unsupervised cell cluster result, “FindNeighbors” and “FindClusters” functions were applied. UMAP dimensionality reduction was used for data visualization. Differentially expressed marker genes for each cluster were identified using “FindMarkers” with criteria: 1) |logFC| > 0.25; 2) p-value < 0.05; 3) min.pct > 0.1. Thereafter, cell types were annotated according to the file presented on the SCP website. “DimPlot” visualized the cell clustering, while “FeaturePlot” and “VlnPlot” generated expression plots.
To elucidate the signature-specific score of each cell based on the ANAGs, we utilized the “AddModuleScore” function and the “AUCell” package. We explored the distribution of scores across different cell types. Moreover, we performed GSEA to evaluate potential biometric differences between the AUC score-high and low groups.
4.12. Statistical Analysis
Data processing, statistical analysis, and figure generation were performed using R 4.1.2 software. Differences between the two groups were assessed by the Student's t-test or the Wilcoxon rank-sum test. The Kruskal-Wallis test was used for comparisons of three or more groups. Pearson correlation tested associations between continuous variables. LASSO regression was implemented using the “glmnet” R package. ROC curve analysis was done with the “pROC” R package. PCA was performed via the “FactoMineR” R package and the “RunPCA” function in the “Seurat” R package. All statistical tests were two-tailed with p<0.05 considered statistically significant.
5. Conclusions
In conclusion, this study established and validated a novel activated NK-associated gene signature and score with accurate diagnostic performance for UC. This signature, comprised of SELP, TIMP1, MMP7, and ABCG2, may represent promising biomarker targets and therapeutic entry points for modulating UC. By highlighting the involvement of NK cell biology and associated genes in UC immunopathology, this work provides new perspectives into UC mechanisms.
Supplementary Materials
The following supporting information can be downloaded at the website of this paper posted on Preprints.org.
Author Contributions
Conceptualization, Qian Cao; Data curation, Siyuan Dong; Formal analysis, Siyuan Dong; Funding acquisition, Qian Cao; Resources, Yu Zhang and Lingna Ye; Supervision, Yu Zhang and Lingna Ye; Writing – original draft, Siyuan Dong; Writing – review & editing, Qian Cao.
Funding
This research was funded by the Provincial key Research & Development project in Zhejiang Province of China (2020C03075).
Institutional Review Board Statement
The study was conducted in accordance with the Declaration of Helsinki, and approved by the Medical Ethics Committee of Sir Run Run Shaw Hospital (SRRSH) (ID: 20211103-34).
Informed Consent Statement
Informed consent was obtained from all subjects involved in the study. Written informed consent has been obtained from the patient(s) to publish this paper.
Data Availability Statement
The datasets used or analyzed during the current study are available from the GEO (http://www.ncbi.nlm.nih.gov/geo/) and SCP (https://singlecell.broadinstitute.org/single_cell) databases. The names of the repository/repositories and accession number(s) can be found in the article.
Acknowledgments
We thank all of the staff contributing to the GEO and SCP databases.
Conflicts of Interest
The authors declare no conflict of interest. The funders had no role in the design of the study; in the collection, analyses, or interpretation of data; in the writing of the manuscript; or in the decision to publish the results.
References
- Ungaro, R.; Mehandru, S.; Allen, P. B.; Peyrin-Biroulet, L.; Colombel, J.-F. Ulcerative Colitis. Lancet 2017, 389, 1756–1770. [Google Scholar] [CrossRef] [PubMed]
- Kobayashi, T.; Siegmund, B.; Le Berre, C.; Wei, S. C.; Ferrante, M.; Shen, B.; Bernstein, C. N.; Danese, S.; Peyrin-Biroulet, L.; Hibi, T. Ulcerative Colitis. Nat. Rev. Dis. Prim. 2020, 6, 74. [Google Scholar] [CrossRef] [PubMed]
- Burisch, J.; Ungaro, R.; Vind, I.; Prosberg, M. V.; Bendtsen, F.; Colombel, J. F.; Vester-Andersen, M. K. Proximal Disease Extension in Patients with Limited Ulcerative Colitis: A Danish Populationbased Inception Cohort. J. Crohn’s Colitis 2017, 11, 1200–1204. [Google Scholar] [CrossRef] [PubMed]
- Steel, A. W.; Mela, C. M.; Lindsay, J. O.; Gazzard, B. G.; Goodier, M. R. Increased Proportion of CD16+ NK Cells in the Colonic Lamina Propria of Inflammatory Bowel Disease Patients, but Not after Azathioprine Treatment. Aliment. Pharmacol. Ther. 2011, 33, 115–126. [Google Scholar] [CrossRef] [PubMed]
- Ng, S. C.; Plamondon, S.; Al-Hassi, H. O.; English, N.; Gellatly, N.; Kamm, M. A.; Knight, S. C.; Stagg, A. J. A Novel Population of Human CD56+ Human Leucocyte Antigen D-Related (HLA-DR+) Colonic Lamina Propria Cells Is Associated with Inflammation in Ulcerative Colitis: ORIGINAL ARTICLE. Clin. Exp. Immunol. 2009, 158, 205–218. [Google Scholar] [CrossRef] [PubMed]
- Schulthess, J.; Meresse, B.; Ramiro-Puig, E.; Montcuquet, N.; Darche, S.; Bègue, B.; Ruemmele, F.; Combadière, C.; Di Santo, J. P.; Buzoni-Gatel, D.; Cerf-Bensussan, N. Interleukin-15-Dependent NKp46 + Innate Lymphoid Cells Control Intestinal Inflammation by Recruiting Inflammatory Monocytes. Immunity 2012, 37, 108–121. [Google Scholar] [CrossRef]
- Shimamoto, M.; Ueno, Y.; Tanaka, S.; Onitake, T.; Hanaoka, R.; Yoshioka, K.; Hatakeyama, T.; Chayama, K. Selective Decrease in Colonic CD56 + T and CD161 + T Cells in the Inflamed Mucosa of Patients with Ulcerative Colitis. World J. Gastroenterol. 2007, 13, 5995. [Google Scholar] [CrossRef]
- Hall, L. J.; Murphy, C. T.; Quinlan, A.; Hurley, G.; Shanahan, F.; Nally, K.; Melgar, S. Natural Killer Cells Protect Mice from DSS-Induced Colitis by Regulating Neutrophil Function via the NKG2A Receptor. Mucosal Immunol. 2013, 6, 1016–1026. [Google Scholar] [CrossRef]
- Fathollahi, A.; Aslani, S.; Mostafaei, S.; Rezaei, N.; Mahmoudi, M. The Role of Killer-Cell Immunoglobulin-like Receptor (KIR) Genes in Susceptibility to Inflammatory Bowel Disease: Systematic Review and Meta-Analysis. Inflamm. Res. 2018, 67, 727–736. [Google Scholar] [CrossRef]
- Liu, Z.; Yadav, P. K.; Chen, C. Potential Role of NK Cells in the Pathogenesis of Inflammatory Bowel Disease. J. Biomed. Biotechnol. 2011, 2011. [Google Scholar]
- Poggi, A.; Benelli, R.; Venè, R.; Costa, D.; Ferrari, N.; Tosetti, F.; Zocchi, M. R. Human Gut-Associated Natural Killer Cells in Health and Disease. Front. Immunol. 2019, 10. [Google Scholar] [CrossRef] [PubMed]
- Jones, D. C.; Edgar, R. S.; Ahmad, T.; Cummings, J. R. F.; Jewell, D. P.; Trowsdale, J.; Young, N. T. Killer Ig-like Receptor (KIR) Genotype and HLA Ligand Combinations in Ulcerative Colitis Susceptibility. Genes Immun. 2006, 7, 576–582. [Google Scholar] [CrossRef]
- Wang, F.; Peng, P. L.; Lin, X.; Chang, Y.; Liu, J.; Zhou, R.; Nie, J. Y.; Dong, W. G.; Zhao, Q.; Li, J. Regulatory Role of NKG2D+ NK Cells in Intestinal Lamina Propria by Secreting Double-Edged Th1 Cytokines in Ulcerative Colitis. Oncotarget 2017, 8, 98945–98952. [Google Scholar] [CrossRef]
- Yusung, S.; McGovern, D.; Lin, L.; Hommes, D.; Lagishetty, V.; Braun, J. NK Cells Are Biologic and Biochemical Targets of 6-Mercaptopurine in Crohn’s Disease Patients. Clin. Immunol. 2017, 175, 82–90. [Google Scholar] [CrossRef] [PubMed]
- Vestweber, D.; Blanks, J. E. Mechanisms That Regulate the Function of the Selectins and Their Ligands. Physiol. Rev. 1999, 79, 181–213. [Google Scholar] [CrossRef] [PubMed]
- Furie, B.; Furie, B. C. Role of Platelet P-Selectin and Microparticle PSGL-1 in Thrombus Formation. Trends Mol. Med. 2004, 10, 171–178. [Google Scholar] [CrossRef]
- Chen, M.; Geng, J. G. P-Selectin Mediates Adhesion of Leukocytes, Platelets, and Cancer Cells in Inflammation, Thrombosis, and Cancer Growth and Metastasis. Arch. Immunol. Ther. Exp. (Warsz). 2006, 54, 75–84. [Google Scholar] [CrossRef] [PubMed]
- Sanders, W. E.; Wilson, R. W.; Ballantyne, C. M.; Beaudet, A. L. Molecular Cloning and Analysis of in Vivo Expression of Murine P-Selectin. Blood 1992, 80, 795–800. [Google Scholar] [CrossRef]
- Weller, A.; Isenmann, S.; Vestweber, D. Cloning of the Mouse Endothelial Selectins. Expression of Both E- and P- Selectin Is Inducible by Tumor Necrosis Factor α. J. Biol. Chem. 1992, 267, 15176–15183. [Google Scholar] [CrossRef]
- Hahne, M.; Jäger, U.; Isenmann, S.; Hallmann, R.; Vestweber, D. Five Tumor Necrosis Factor-Inducible Cell Adhesion Mechanisms on the Surface of Mouse Endothelioma Cells Mediate the Binding of Leukocytes. J. Cell Biol. 1993, 121, 655–664. [Google Scholar] [CrossRef]
- Matrisian, L. M. The Matrix-Degrading Metalloproteinases. BioEssays 1992, 14, 455–463. [Google Scholar] [CrossRef] [PubMed]
- Marônek, M.; Marafini, I.; Gardlík, R.; Link, R.; Troncone, E.; Monteleone, G. Metalloproteinases in Inflammatory Bowel Diseases. J. Inflamm. Res. 2021, 14, 1029–1041. [Google Scholar] [CrossRef] [PubMed]
- Miyazaki, K.; Hattori, Y.; Umenishi, F.; Yasumitsu, H.; Umeda, M. Purification and Characterization of Extracellular Matrix-Degrading Metalloproteinase, Matrin (Pump-1), Secreted from Human Rectal Carcinoma Cell Line. Cancer Res. 1990, 50, 7758–7764. [Google Scholar] [PubMed]
- Wilson, C. L.; Matrisian, L. M. Matrilysin: An Epithelial Matrix Metalloproteinase with Potentially Novel Functions. Int. J. Biochem. Cell Biol. 1996, 28, 123–136. [Google Scholar] [CrossRef]
- Rath, T.; Roderfeld, M.; Halwe, J. M.; Tschuschner, A.; Roeb, E.; Graf, J. Cellular Sources of MMP-7, MMP-13 and MMP-28 in Ulcerative Colitis. Scand. J. Gastroenterol. 2010, 45, 1186–1196. [Google Scholar] [CrossRef]
- Mäkitalo, L.; Kolho, K. L.; Karikoski, R.; Anthoni, H.; Saarialho-Kere, U. Expression Profiles of Matrix Metalloproteinases and Their Inhibitors in Colonic Inflammation Related to Pediatric Inflammatory Bowel Disease. Scand. J. Gastroenterol. 2010, 45, 862–871. [Google Scholar] [CrossRef]
- Von Lampe, B.; Barthel, B.; Riecken, E. O.; Coupland, S. E.; Rosewicz, S. Differential Expression of Matrix Metalloproteinases and Their Tissue Inhibitors in Colon Mucosa of Patients with Inflammatory Bowel Disease. Gut 2000, 47, 63–73. [Google Scholar] [CrossRef]
- Medina, C.; Radomski, M. W. Role of Matrix Metalloproteinases in Intestinal Inflammation. J. Pharmacol. Exp. Ther. 2006, 318, 933–938. [Google Scholar] [CrossRef]
- Wiercinska-Drapalo, A.; Jaroszewicz, J.; Flisiak, R.; Prokopowicz, D. Plasma Matrix Metalloproteinase-1 and Tissue Inhibitor of Metalloproteinase-1 as Biomarkers of Ulcerative Colitis Activity. World J. Gastroenterol. 2003, 9, 2843–2845. [Google Scholar] [CrossRef]
- Meijer, M. J. W.; Mieremet-Ooms, M. A. C.; van Hogezand, R. A.; Lamers, C. B. H. W.; Hommes, D. W.; Verspaget, H. W. Role of Matrix Metalloproteinase, Tissue Inhibitor of Metalloproteinase and Tumor Necrosis Factor-α Single Nucleotide Gene Polymorphisms in Inflammatory Bowel Disease. World J. Gastroenterol. 2007, 13, 2960–2966. [Google Scholar] [CrossRef]
- Meijer, M. J.; Mieremet-Ooms, M. A. C.; Sier, C. F. M.; van Hogezand, R. A.; Lamers, C. B. H. W.; Hommes, D. W.; Verspaget, H. W. Matrix Metalloproteinases and Their Tissue Inhibitors as Prognostic Indicators for Diagnostic and Surgical Recurrence in Crohn’s Disease. Inflamm. Bowel Dis. 2009, 15, 84–92. [Google Scholar] [CrossRef] [PubMed]
- Kapsoritakis, A. N.; Kapsoritaki, A. I.; Davidi, I. P.; Lotis, V. D.; Manolakis, A. C.; Mylonis, P. I.; Theodoridou, A. T.; Germenis, A. E.; Potamianos, S. P. Imbalance of Tissue Inhibitors of Metalloproteinases (TIMP) - 1 and - 4 Serum Levels, in Patients with Inflammatory Bowel Disease. BMC Gastroenterol. 2008, 8, 1–8. [Google Scholar] [CrossRef] [PubMed]
- Kusano, K.; Miyaura, C.; Inada, M.; Tamura, T.; Ito, A.; Nagase, H.; Kamoi, K.; Suda, T. Regulation of Matrix Metalloproteinases (MMP-2, -3, -9, and -13) by Interleukin-1 and Interleukin-6 in Mouse Calvaria: Association of MMP Induction with Bone Resorption*. Endocrinology 1998, 139, 1338–1345. [Google Scholar] [CrossRef] [PubMed]
- Sarén, P.; Welgus, H. G.; Kovanen, P. T. TNF-Alpha and IL-1beta Selectively Induce Expression of 92-KDa Gelatinase by Human Macrophages. J. Immunol. 1996, 157, 4159–4165. [Google Scholar] [CrossRef] [PubMed]
- Murphy, G.; Reynolds, J. J.; Werb, Z. Biosynthesis of Tissue Inhibitor of Metalloproteinases by Human Fibroblasts in Culture. Stimulation by 12-O-Tetradecanoylphorbol 13-Acetate and Interleukin 1 in Parallel with Collagenase. J. Biol. Chem. 1985, 260, 3079–3083. [Google Scholar] [CrossRef] [PubMed]
- Lotz, M.; Guerne, P. A. Interleukin-6 Induces the Synthesis of Tissue Inhibitor of Metalloproteinases-1/Erythroid Potentiating Activity (TIMP-1/EPA). J. Biol. Chem. 1991, 266, 2017–2020. [Google Scholar] [CrossRef] [PubMed]
- Pavek, P.; Merino, G.; Wagenaar, E.; Bolscher, E.; Novotna, M.; Jonker, J. W.; Schinkel, A. H. Human Breast Cancer Resistance Protein : Interactions with Steroid Drugs, Hormones, the Dietary Carcinogen Transport of Cimetidine. J. Pharmacol. Exp. Ther. 2005, 312, 144–152. [Google Scholar] [CrossRef]
- Jonker, J. W.; Buitelaar, M.; Wagenaar, E.; Van der Valk, M. A.; Scheffer, G. L.; Scheper, R. J.; Plösch, T.; Kuipers, F.; Oude Elferink, R. P. J.; Rosing, H.; Beijnen, J. H.; Schinkel, A. H. The Breast Cancer Resistance Protein Protects against a Major Chlorophyll-Derived Dietary Phototoxin and Protoporphyria. Proc. Natl. Acad. Sci. U. S. A. 2002, 99, 15649–15654. [Google Scholar] [CrossRef]
- Van Herwaarden, A. E.; Jonker, J. W.; Wagenaar, E.; Brinkhuis, R. F.; Schellens, J. H. M.; Beijnen, J. H.; Schinkel, A. H. The Breast Cancer Resistance Protein (Bcrp1/Abcg2) Restricts Exposure to the Dietary Carcinogen 2-Amino-1-Methyl-6-Phenylimidazo[4,5-b]Pyridine. Cancer Res. 2003, 63, 6447–6452. [Google Scholar]
- van Herwaarden, A. E.; Wagenaar, E.; Karnekamp, B.; Merino, G.; Jonker, J. W.; Schinkel, A. H. Breast Cancer Resistance Protein (Bcrp1/Abcg2) Reduces Systemic Exposure of the Dietary Carcinogens Aflatoxin B1, IQ and Trp-P-1 but Also Mediates Their Secretion into Breast Milk. Carcinogenesis 2006, 27, 123–130. [Google Scholar] [CrossRef]
- Ebert, B.; Seidel, A.; Lampen, A. Identification of BCRP as Transporter of Benzo[a]Pyrene Conjugates Metabolically Formed in Caco-2 Cells and Its Induction by Ah-Receptor Agonists. Carcinogenesis 2005, 26, 1754–1763. [Google Scholar] [CrossRef]
- Jonker, J. W.; Merino, G.; Musters, S.; Van Herwaarden, A. E.; Bolscher, E.; Wagenaar, E.; Mesman, E.; Dale, T. C.; Schinkel, A. H. The Breast Cancer Resistance Protein BCRP (ABCG2) Concentrates Drugs and Carcinogenic Xenotoxins into Milk. Nat. Med. 2005, 11, 127–129. [Google Scholar] [CrossRef]
- Breedveld, P.; Zelcer, N.; Pluim, D.; Sönmezer, Ö.; Tibben, M. M.; Beijnen, J. H.; Schinkel, A. H.; Van Tellingen, O.; Borst, P.; Schellens, J. H. M. Mechanism of the Pharmacokinetic Interaction between Methotrexate and Benzimidazoles: Potential Role for Breast Cancer Resistance Protein in Clinical Drug-Drug Interactions. Cancer Res. 2004, 64, 5804–5811. [Google Scholar] [CrossRef] [PubMed]
- Jonker, J. W.; Smit, J. W.; Brinkhuis, R. F.; Maliepaard, M.; Beijnen, J. H.; Schellens, J. H. M.; Schinkel, A. H. Role of Breast Cancer Resistance Protein in the Bioavailability and Fetal Penetration of Topotecan. J. Natl. Cancer Inst. 2000, 92, 1651–1656. [Google Scholar] [CrossRef] [PubMed]
- Merino, G.; Jonker, J. W.; Wagenaar, E.; Van Herwaarden, A. E.; Schinkel, A. H. The Breast Cancer Resistance Protein (BCRP/ABCG2) Affects Pharmacokinetics, Hepatobiliary Excretion, and Milk Secretion of the Antibiotic Nitrofurantoin. Mol. Pharmacol. 2005, 67, 1758–1764. [Google Scholar] [CrossRef] [PubMed]
- Zaher, H.; Khan, A. A.; Palandra, J.; Brayman, T. G.; Yu, L.; Ware, J. A. Breast Cancer Resistance Protein (Bcrp/Abcg2) Is a Major Determinant of Sulfasalazine Absorption and Elimination in the Mouse. Mol. Pharm. 2006, 3, 55–61. [Google Scholar] [CrossRef]
- Deuring, J. J.; Peppelenbosch, M. P.; Kuipers, E. J.; Van Der Woude, C. J.; De Haar, C. Impeded Protein Folding and Function in Active Inflammatory Bowel Disease. Biochem. Soc. Trans. 2011, 39, 1107–1111. [Google Scholar] [CrossRef]
- Thibault, R.; De Coppet, P.; Daly, K.; Bourreille, A.; Cuff, M.; Bonnet, C.; Mosnier, J. F.; Galmiche, J. P.; Shirazi-Beechey, S.; Segain, J. P. Down-Regulation of the Monocarboxylate Transporter 1 Is Involved in Butyrate Deficiency During Intestinal Inflammation. Gastroenterology 2007, 133, 1916–1927. [Google Scholar] [CrossRef]
- Gutmann, H.; Hruz, P.; Zimmermann, C.; Straumann, A.; Terracciano, L.; Hammann, F.; Lehmann, F.; Beglinger, C.; Drewe, J. Breast Cancer Resistance Protein and P-Glycoprotein Expression in Patients with Newly Diagnosed and Therapy-Refractory Ulcerative Colitis Compared with Healthy Controls. Digestion 2008, 78, 154–162. [Google Scholar] [CrossRef]
- Thibault, R.; Blachier, F.; Darcy-Vrillon, B.; De Coppet, P.; Bourreille, A.; Segain, J. P. Butyrate Utilization by the Colonic Mucosa in Inflammatory Bowel Diseases: A Transport Deficiency. Inflamm. Bowel Dis. 2010, 16, 684–695. [Google Scholar] [CrossRef]
- Deuring, J. J.; De Haar, C.; Koelewijn, C. L.; Kuipers, E. J.; Peppelenbosch, M. P.; Van Der Woude, C. J. Absence of ABCG2-Mediated Mucosal Detoxification in Patients with Active Inflammatory Bowel Disease Is Due to Impeded Protein Folding. Biochem. J. 2012, 441, 87–93. [Google Scholar] [CrossRef] [PubMed]
- Ferrer-Picón, E.; Dotti, I.; Corraliza, A. M.; Mayorgas, A.; Esteller, M.; Perales, J. C.; Ricart, E.; Masamunt, M. C.; Carrasco, A.; Tristán, E.; Esteve, M.; Salas, A. Intestinal Inflammation Modulates the Epithelial Response to Butyrate in Patients with Inflammatory Bowel Disease. Inflamm. Bowel Dis. 2020, 26, 43–55. [Google Scholar] [CrossRef] [PubMed]
- Englund, G.; Jacobson, A.; Rorsman, F.; Artursson, P.; Kindmark, A.; Rönnblom, A. Efflux Transporters in Ulcerative Colitis: Decreased Expression of BCRP (ABCG2) and Pgp (ABCB1). Inflamm. Bowel Dis. 2007, 13, 291–297. [Google Scholar] [CrossRef] [PubMed]
- Subramanian, A.; Tamayo, P.; Mootha, V. K.; Mukherjee, S.; Ebert, B. L.; Gillette, M. A.; Paulovich, A.; Pomeroy, S. L.; Golub, T. R.; Lander, E. S.; Mesirov, J. P. Gene Set Enrichment Analysis: A Knowledge-Based Approach for Interpreting Genome-Wide Expression Profiles. Proc. Natl. Acad. Sci. U. S. A. 2005, 102, 15545–15550. [Google Scholar] [CrossRef] [PubMed]
- Bindea, G.; Mlecnik, B.; Tosolini, M.; Kirilovsky, A.; Waldner, M.; Obenauf, A. C.; Angell, H.; Fredriksen, T.; Lafontaine, L.; Berger, A.; Bruneval, P.; Fridman, W. H.; Becker, C.; Pagès, F.; Speicher, M. R.; Trajanoski, Z.; Galon, J. Ô. Spatiotemporal Dynamics of Intratumoral Immune Cells Reveal the Immune Landscape in Human Cancer. Immunity 2013, 39, 782–795. [Google Scholar] [CrossRef]
- Newman, A. M.; Steen, C. B.; Liu, C. L.; Gentles, A. J.; Chaudhuri, A. A.; Scherer, F.; Khodadoust, M. S.; Esfahani, M. S.; Luca, B. A.; Steiner, D.; Diehn, M.; Alizadeh, A. A. Determining Cell Type Abundance and Expression from Bulk Tissues with Digital Cytometry. Nat. Biotechnol. 2019, 37, 773–782. [Google Scholar] [CrossRef]
- Yu, G.; Wang, L. G.; Han, Y.; He, Q. Y. ClusterProfiler: An R Package for Comparing Biological Themes among Gene Clusters. Omi. A J. Integr. Biol. 2012, 16, 284–287. [Google Scholar] [CrossRef]
- Szklarczyk, D.; Gable, A. L.; Lyon, D.; Junge, A.; Wyder, S.; Huerta-Cepas, J.; Simonovic, M.; Doncheva, N. T.; Morris, J. H.; Bork, P.; Jensen, L. J.; Von Mering, C. STRING V11: Protein-Protein Association Networks with Increased Coverage, Supporting Functional Discovery in Genome-Wide Experimental Datasets. Nucleic Acids Res. 2019, 47, D607–D613. [Google Scholar] [CrossRef]
- Shannon, P.; Markiel, A.; Ozier, O.; Baliga, N. S.; Wang, J. T.; Ramage, D.; Amin, N.; Schwikowski, B.; Ideker, T. Cytoscape: A Software Environment for Integrated Models of Biomolecular Interaction Networks. Genome Res. 2003, 13, 2498–2504. [Google Scholar] [CrossRef]
Figure 1.
The overall workflow of the analysis steps.
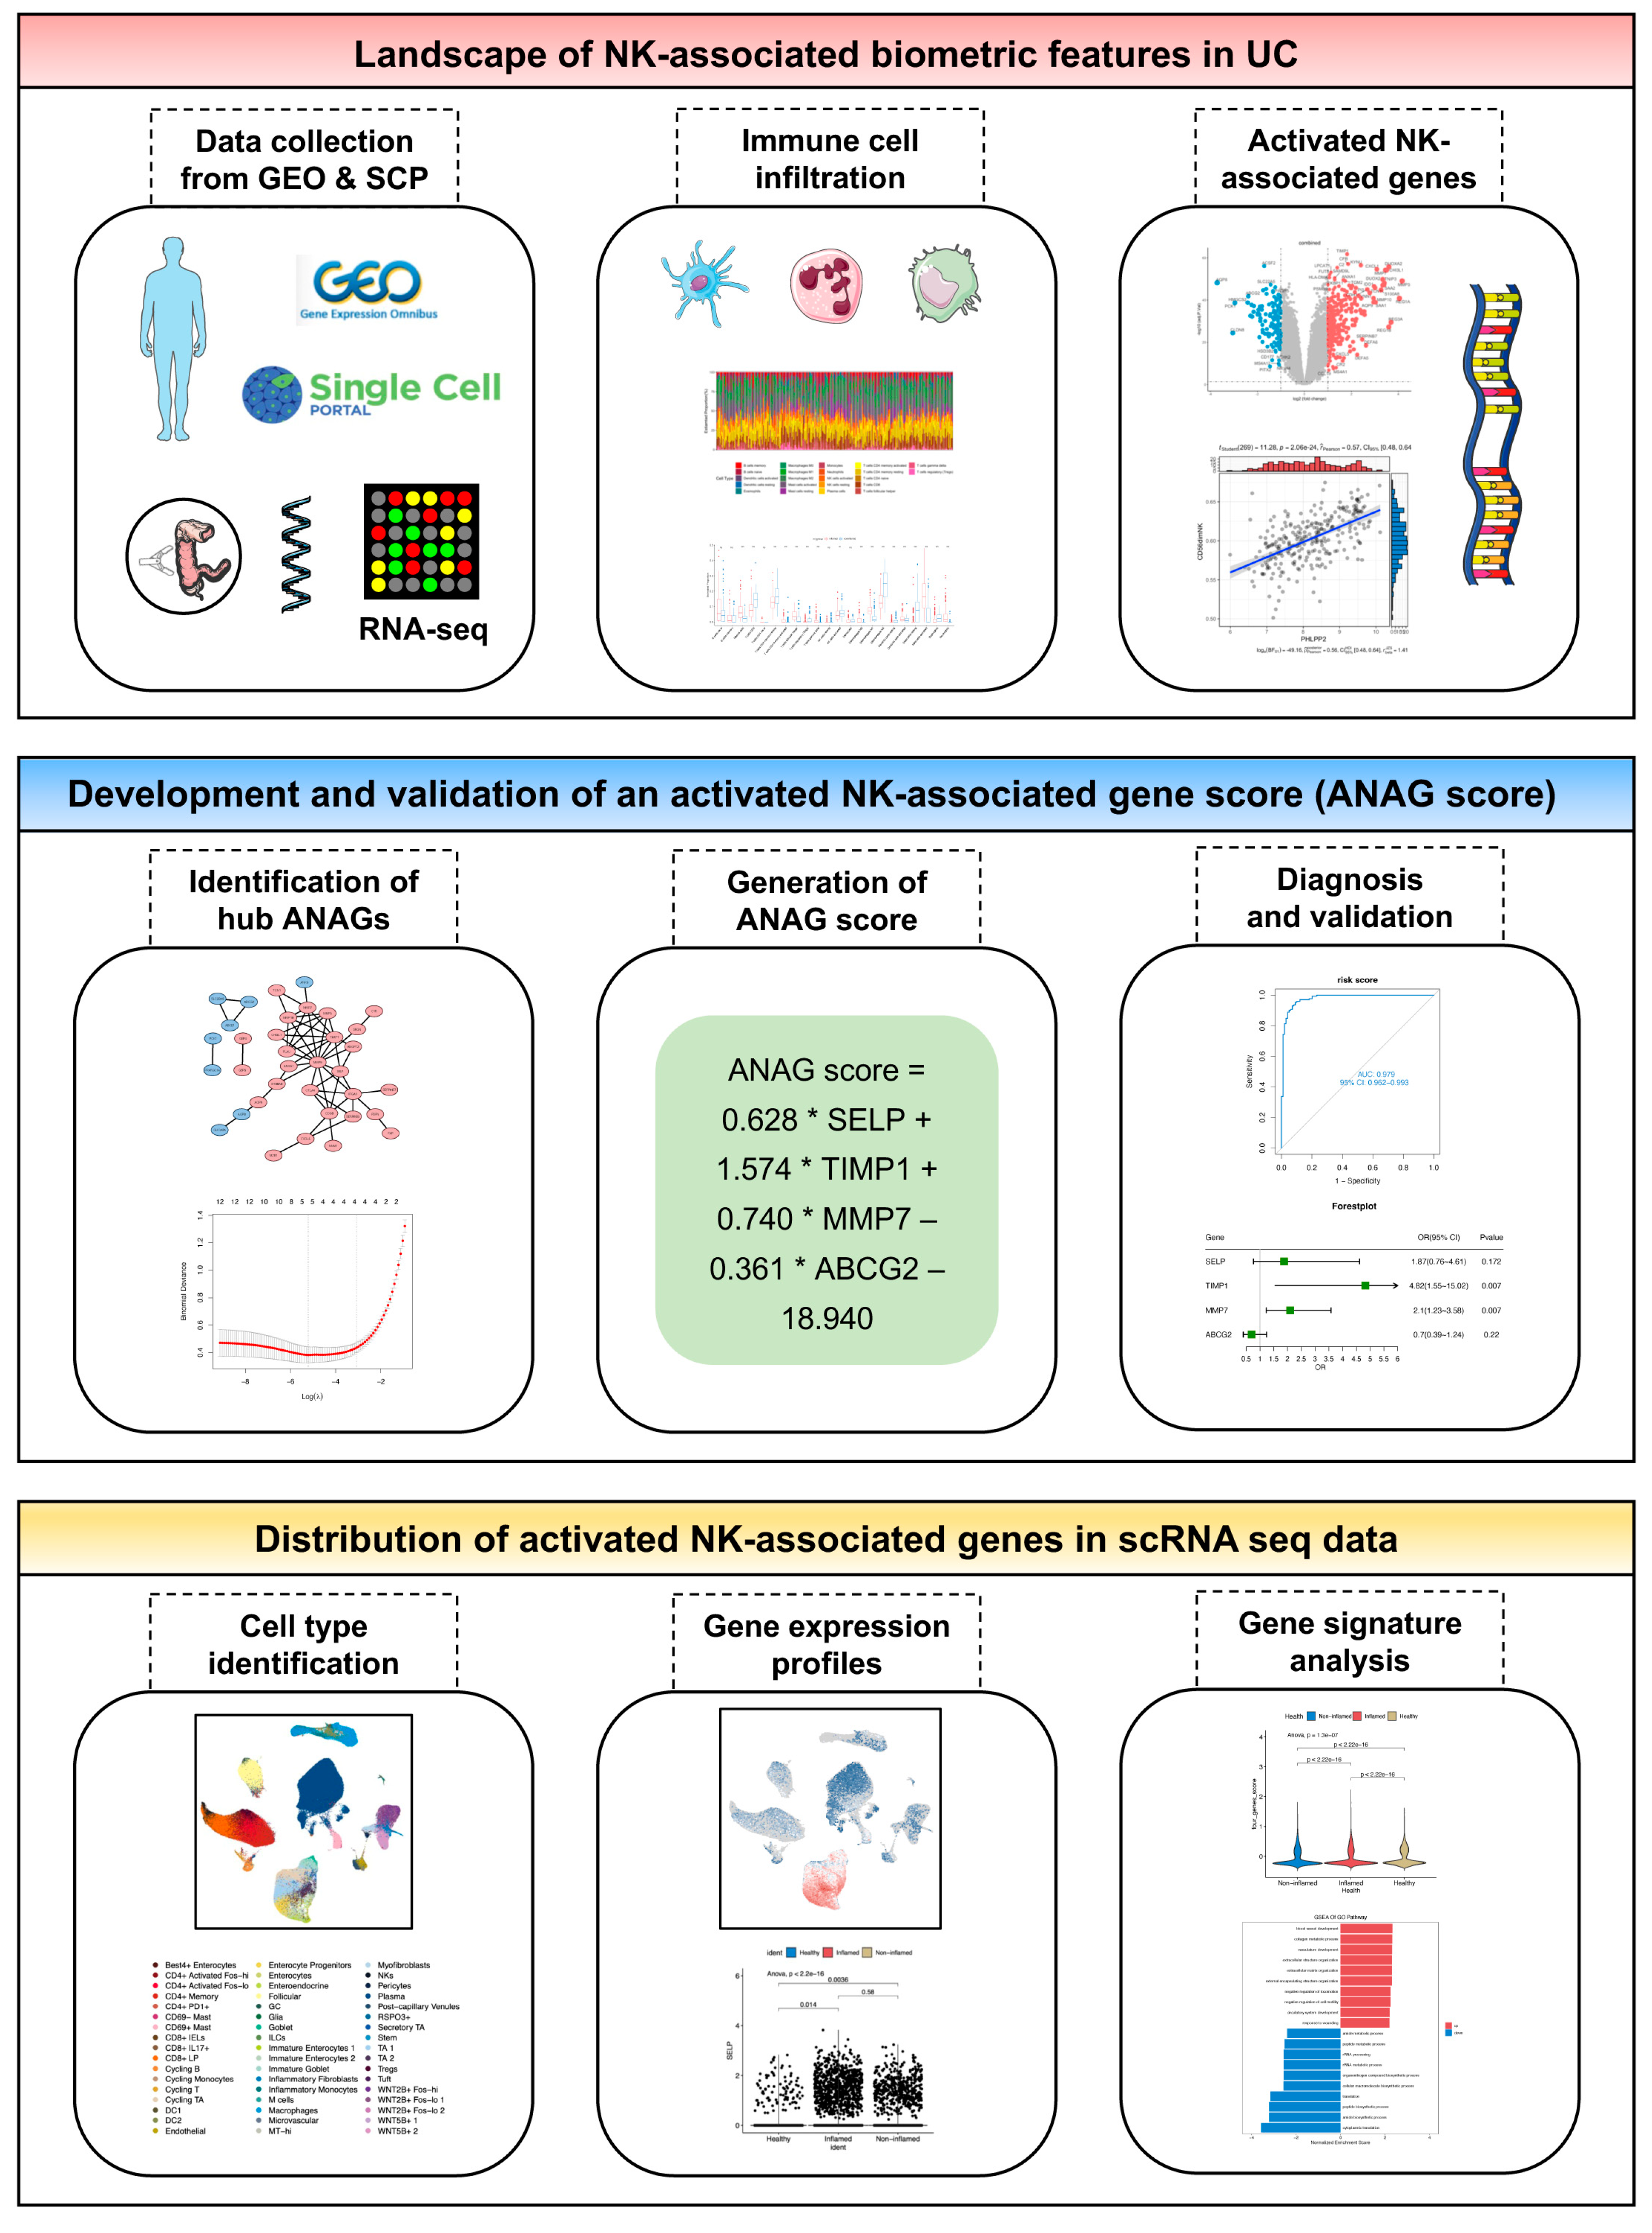
Figure 2.
Elimination of batch effect, identification of DEGs, and functional annotation. (A, B) Box plot and principal component analysis (PCA) plot before batch correction. (C, D) Box plot and PCA plot after batch correction. (E) Volcano plots highlight the DEGs from the combined dataset and three individual datasets. (F) Venn diagrams show the overlap between DEGs screened by the two approaches, left: upregulated genes, right: downregulated genes. (G) GSEA reveals enrichment pathway of DEGs, pathways up-regulated in inflamed tissues were colored red. (H) Heatmap provides the expression patterns for the 92 DEGs across all samples.
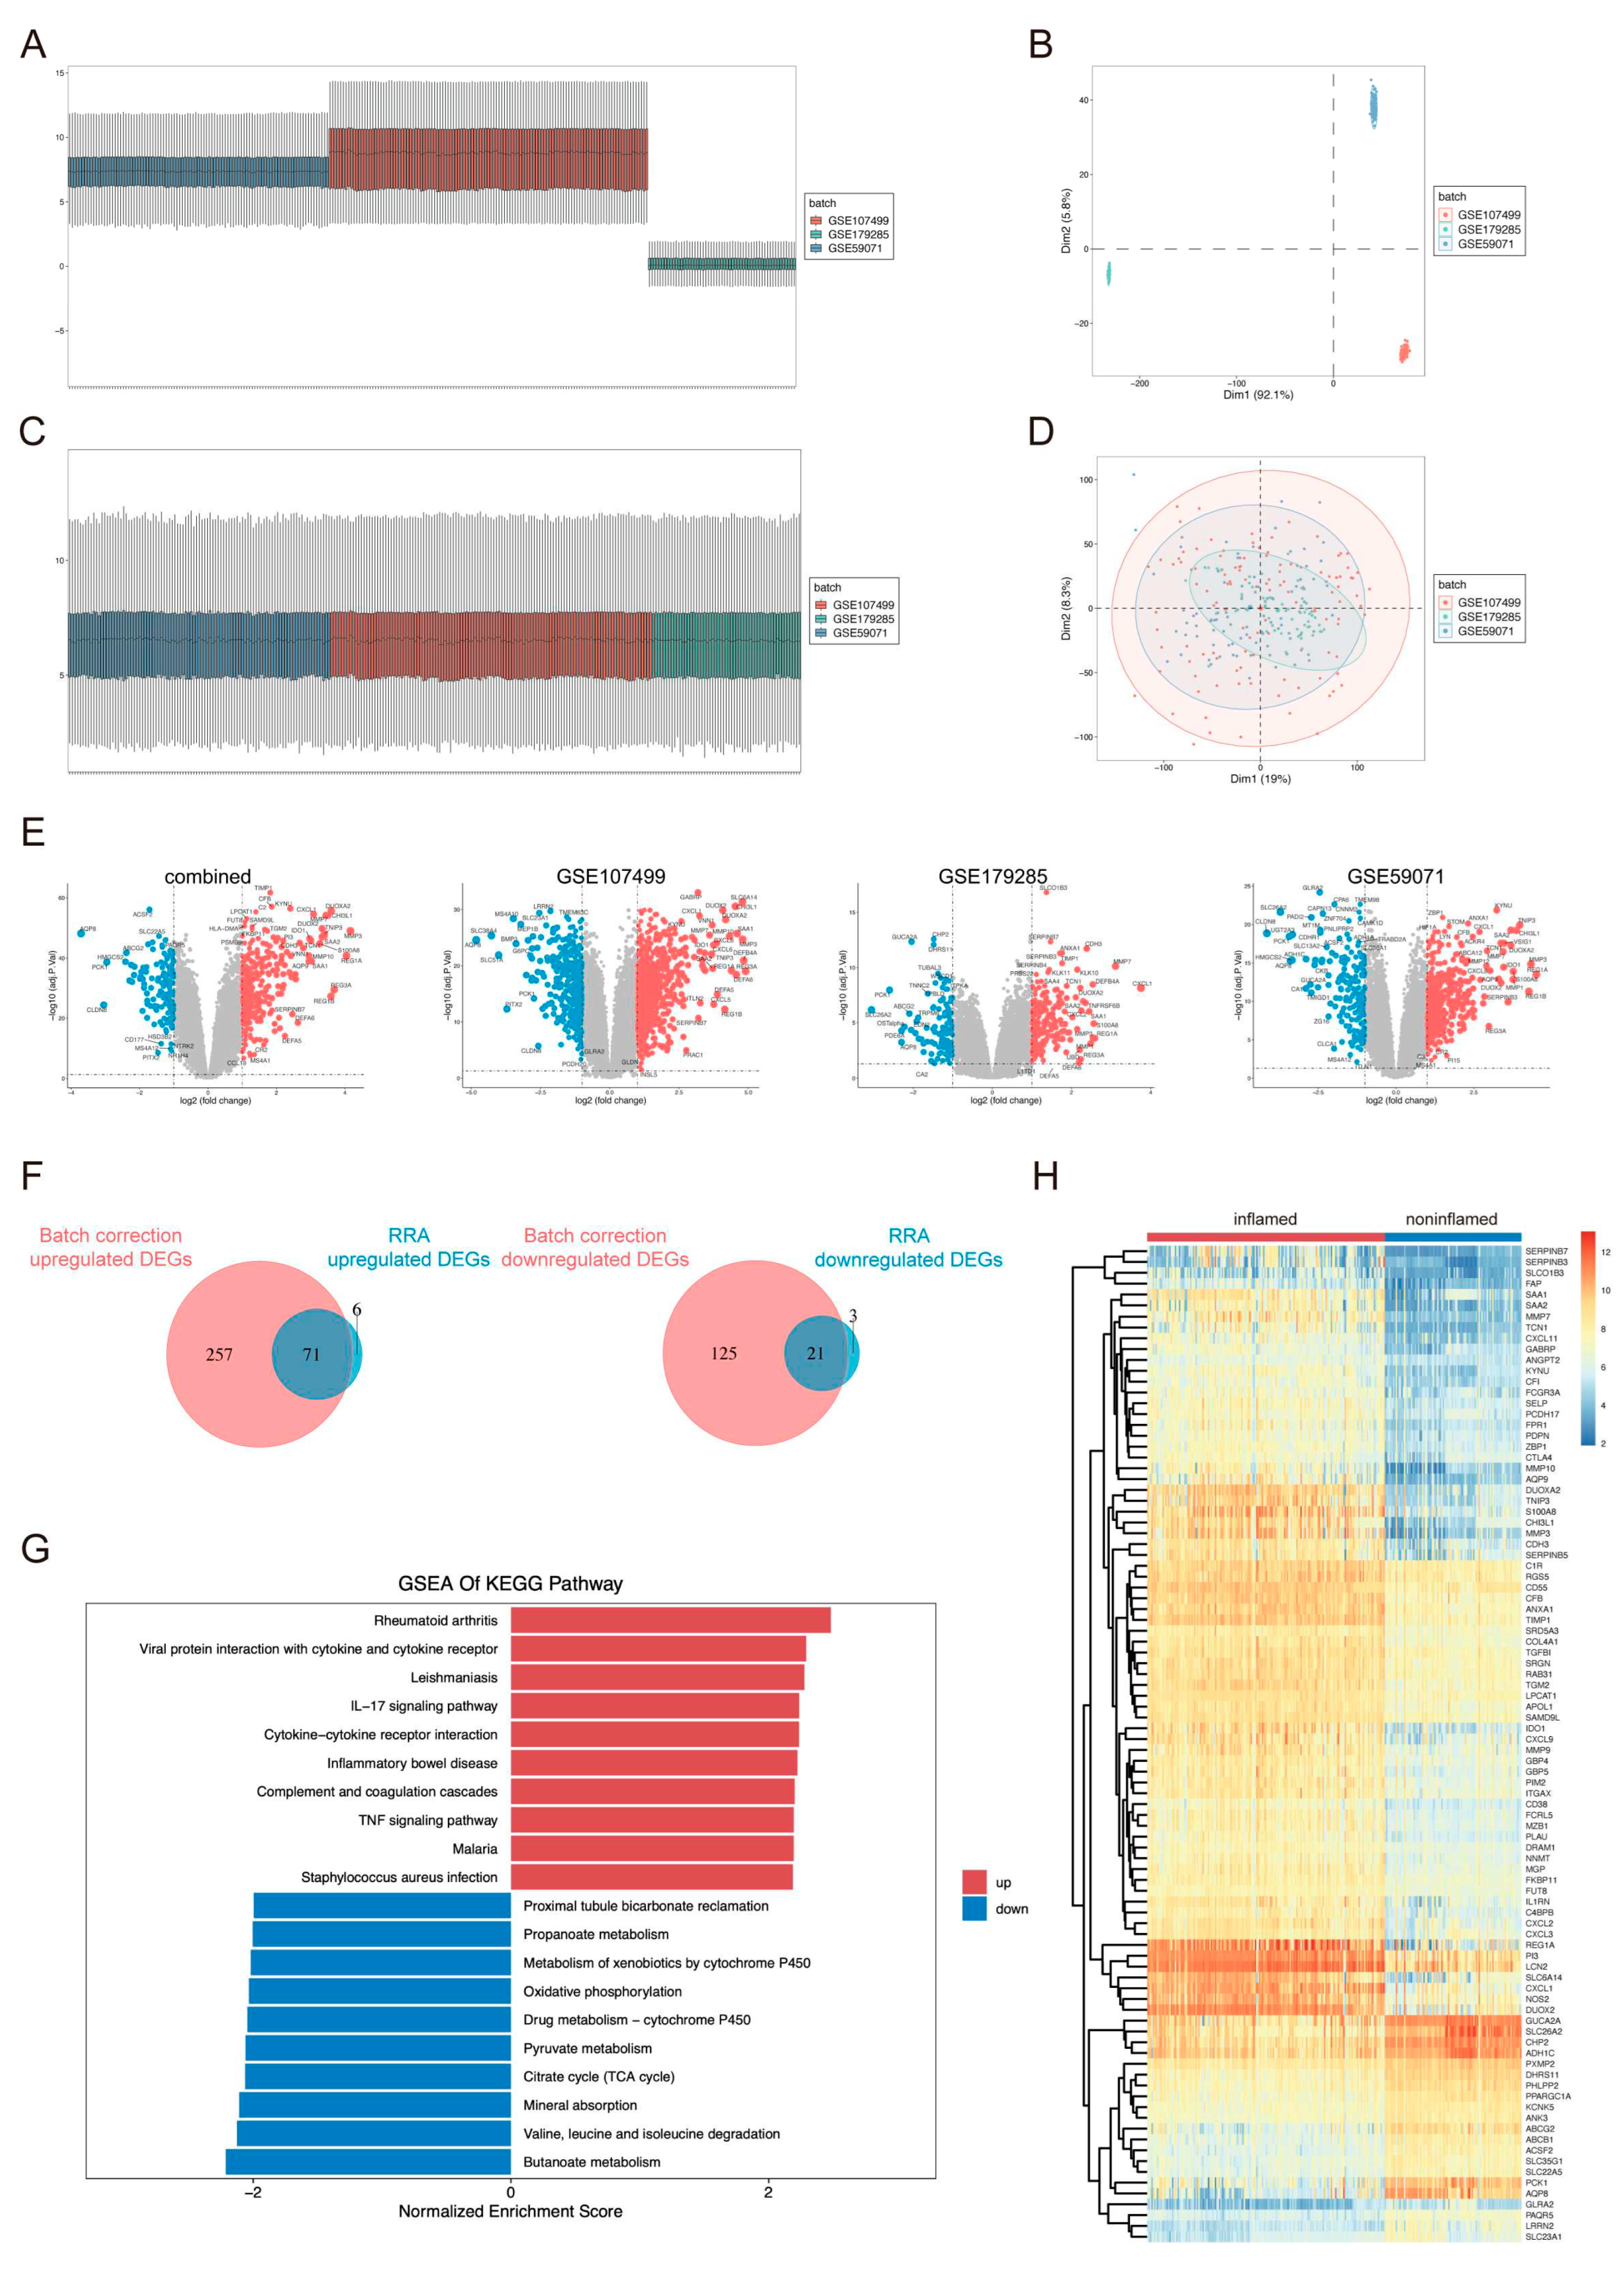
Figure 3.
Functional Annotation of DEGs. (A, B, C, D) Treemaps visualize the results of KEGG and GO enrichment analysis on the upregulated (A and B) and downregulated (C and D) DEGs in inflamed tissues. The size and color of each rectangle represent the gene counts and adjusted p-value of the enriched pathway.
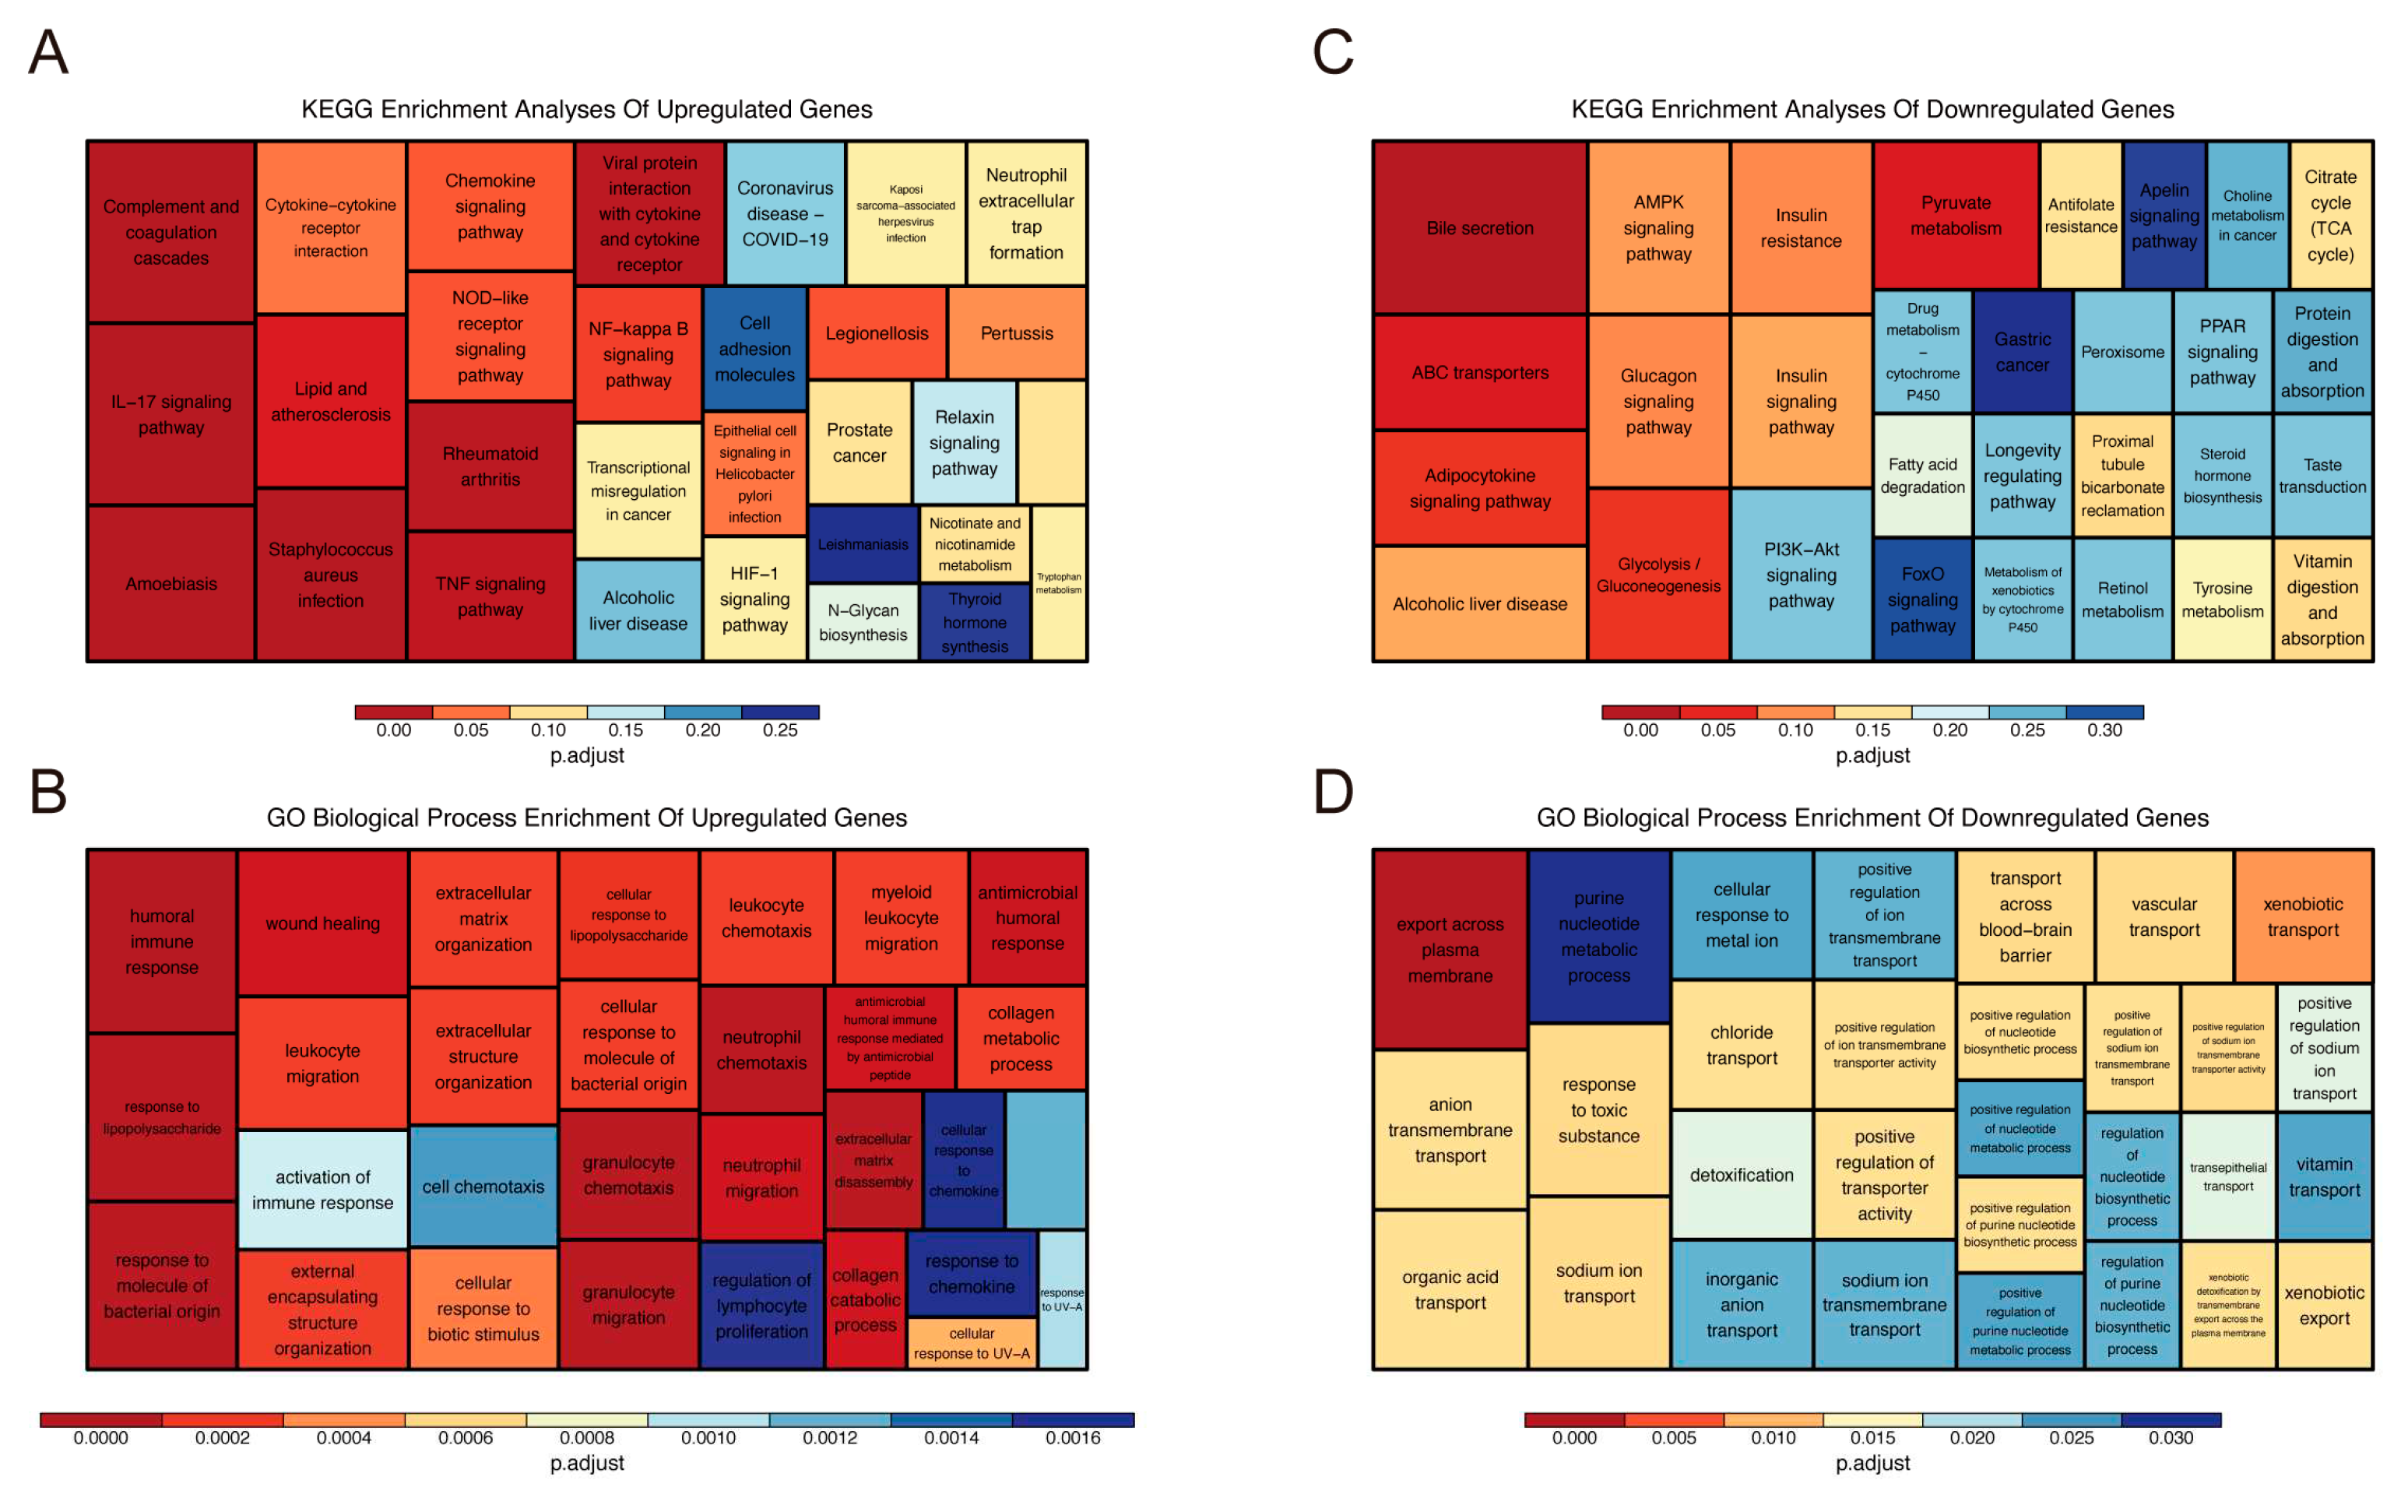
Figure 4.
The landscape of immune cell infiltration analyzed by ssGSEA and CD56dim natural killer cell related DEGs. (A, B) Heatmap (A) and comparison boxplot (B) of 28-immune-cell infiltration between inflamed and noninflamed tissues. (C) Top 5 DEGs positively and negatively correlated with CD56dim natural killer cell.
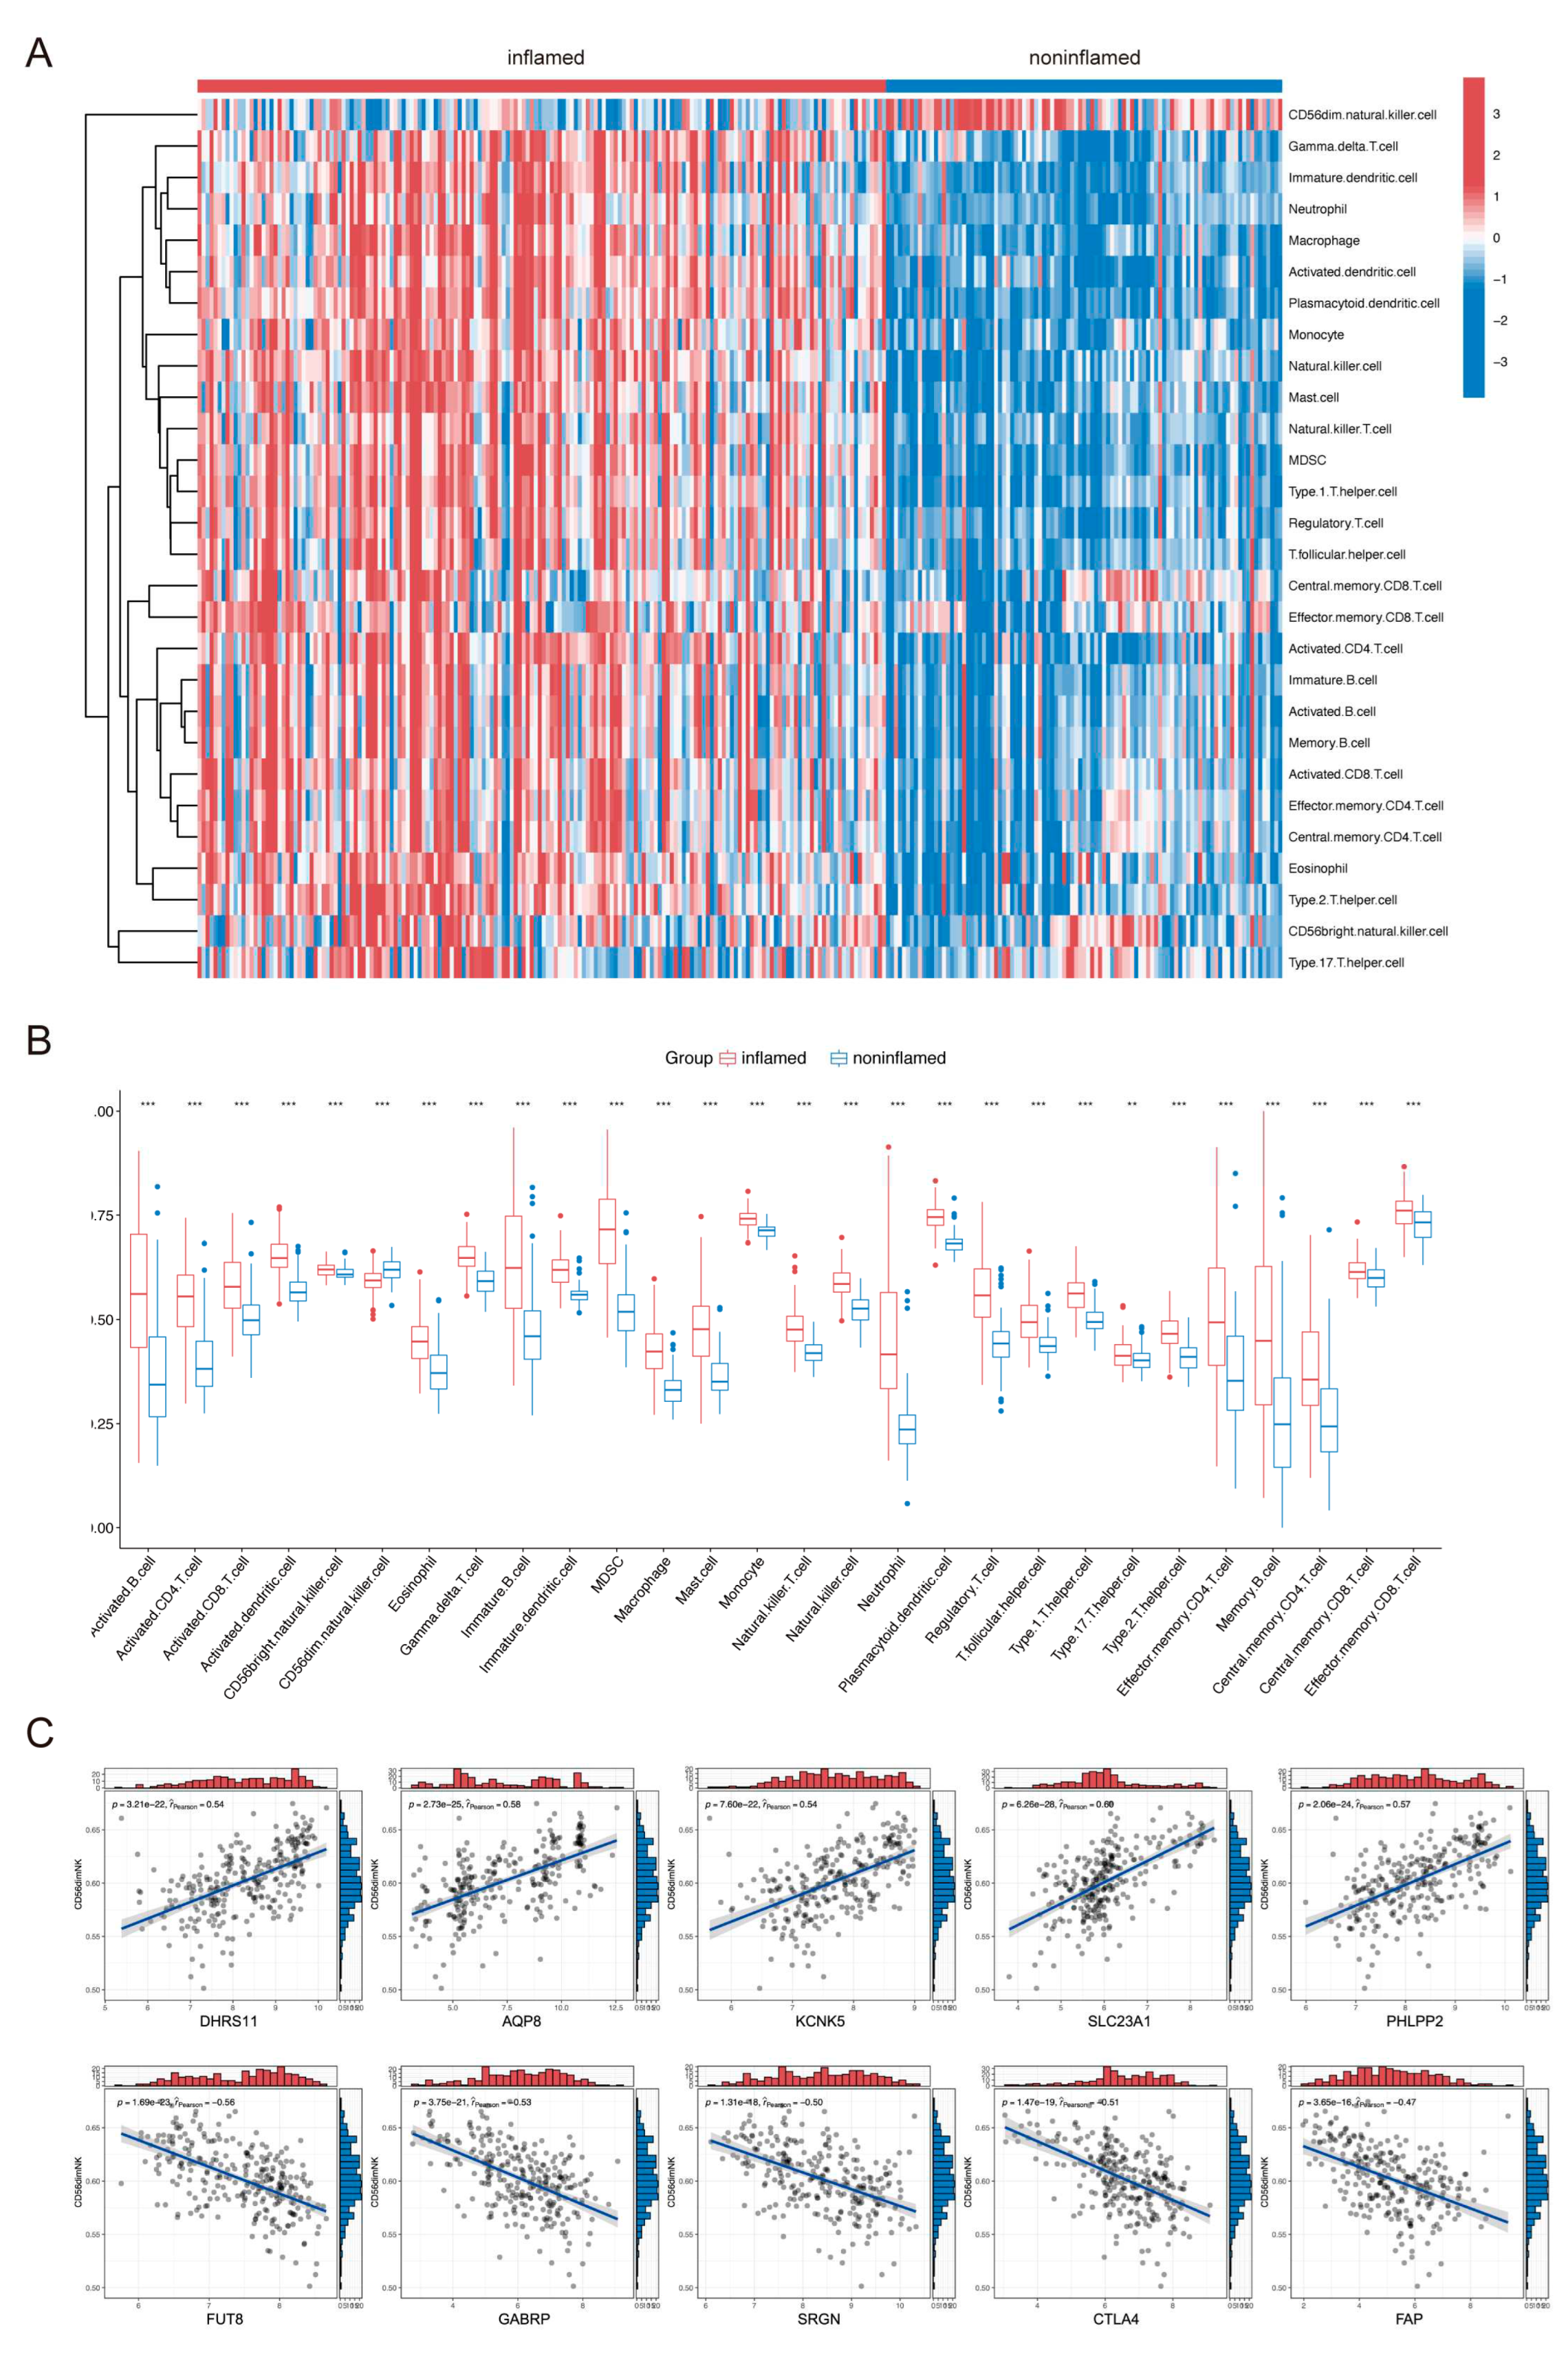
Figure 5.
The landscape of immune cell infiltration analyzed by CIBERSORT and NK cell activated related DEGs. (A, B) Stacked barplot (A) and comparison boxplot (B) of 22 immune-cell infiltration between inflamed and noninflamed tissues. (C) Top 5 DEGs positively and negatively correlated with NK cell activated.
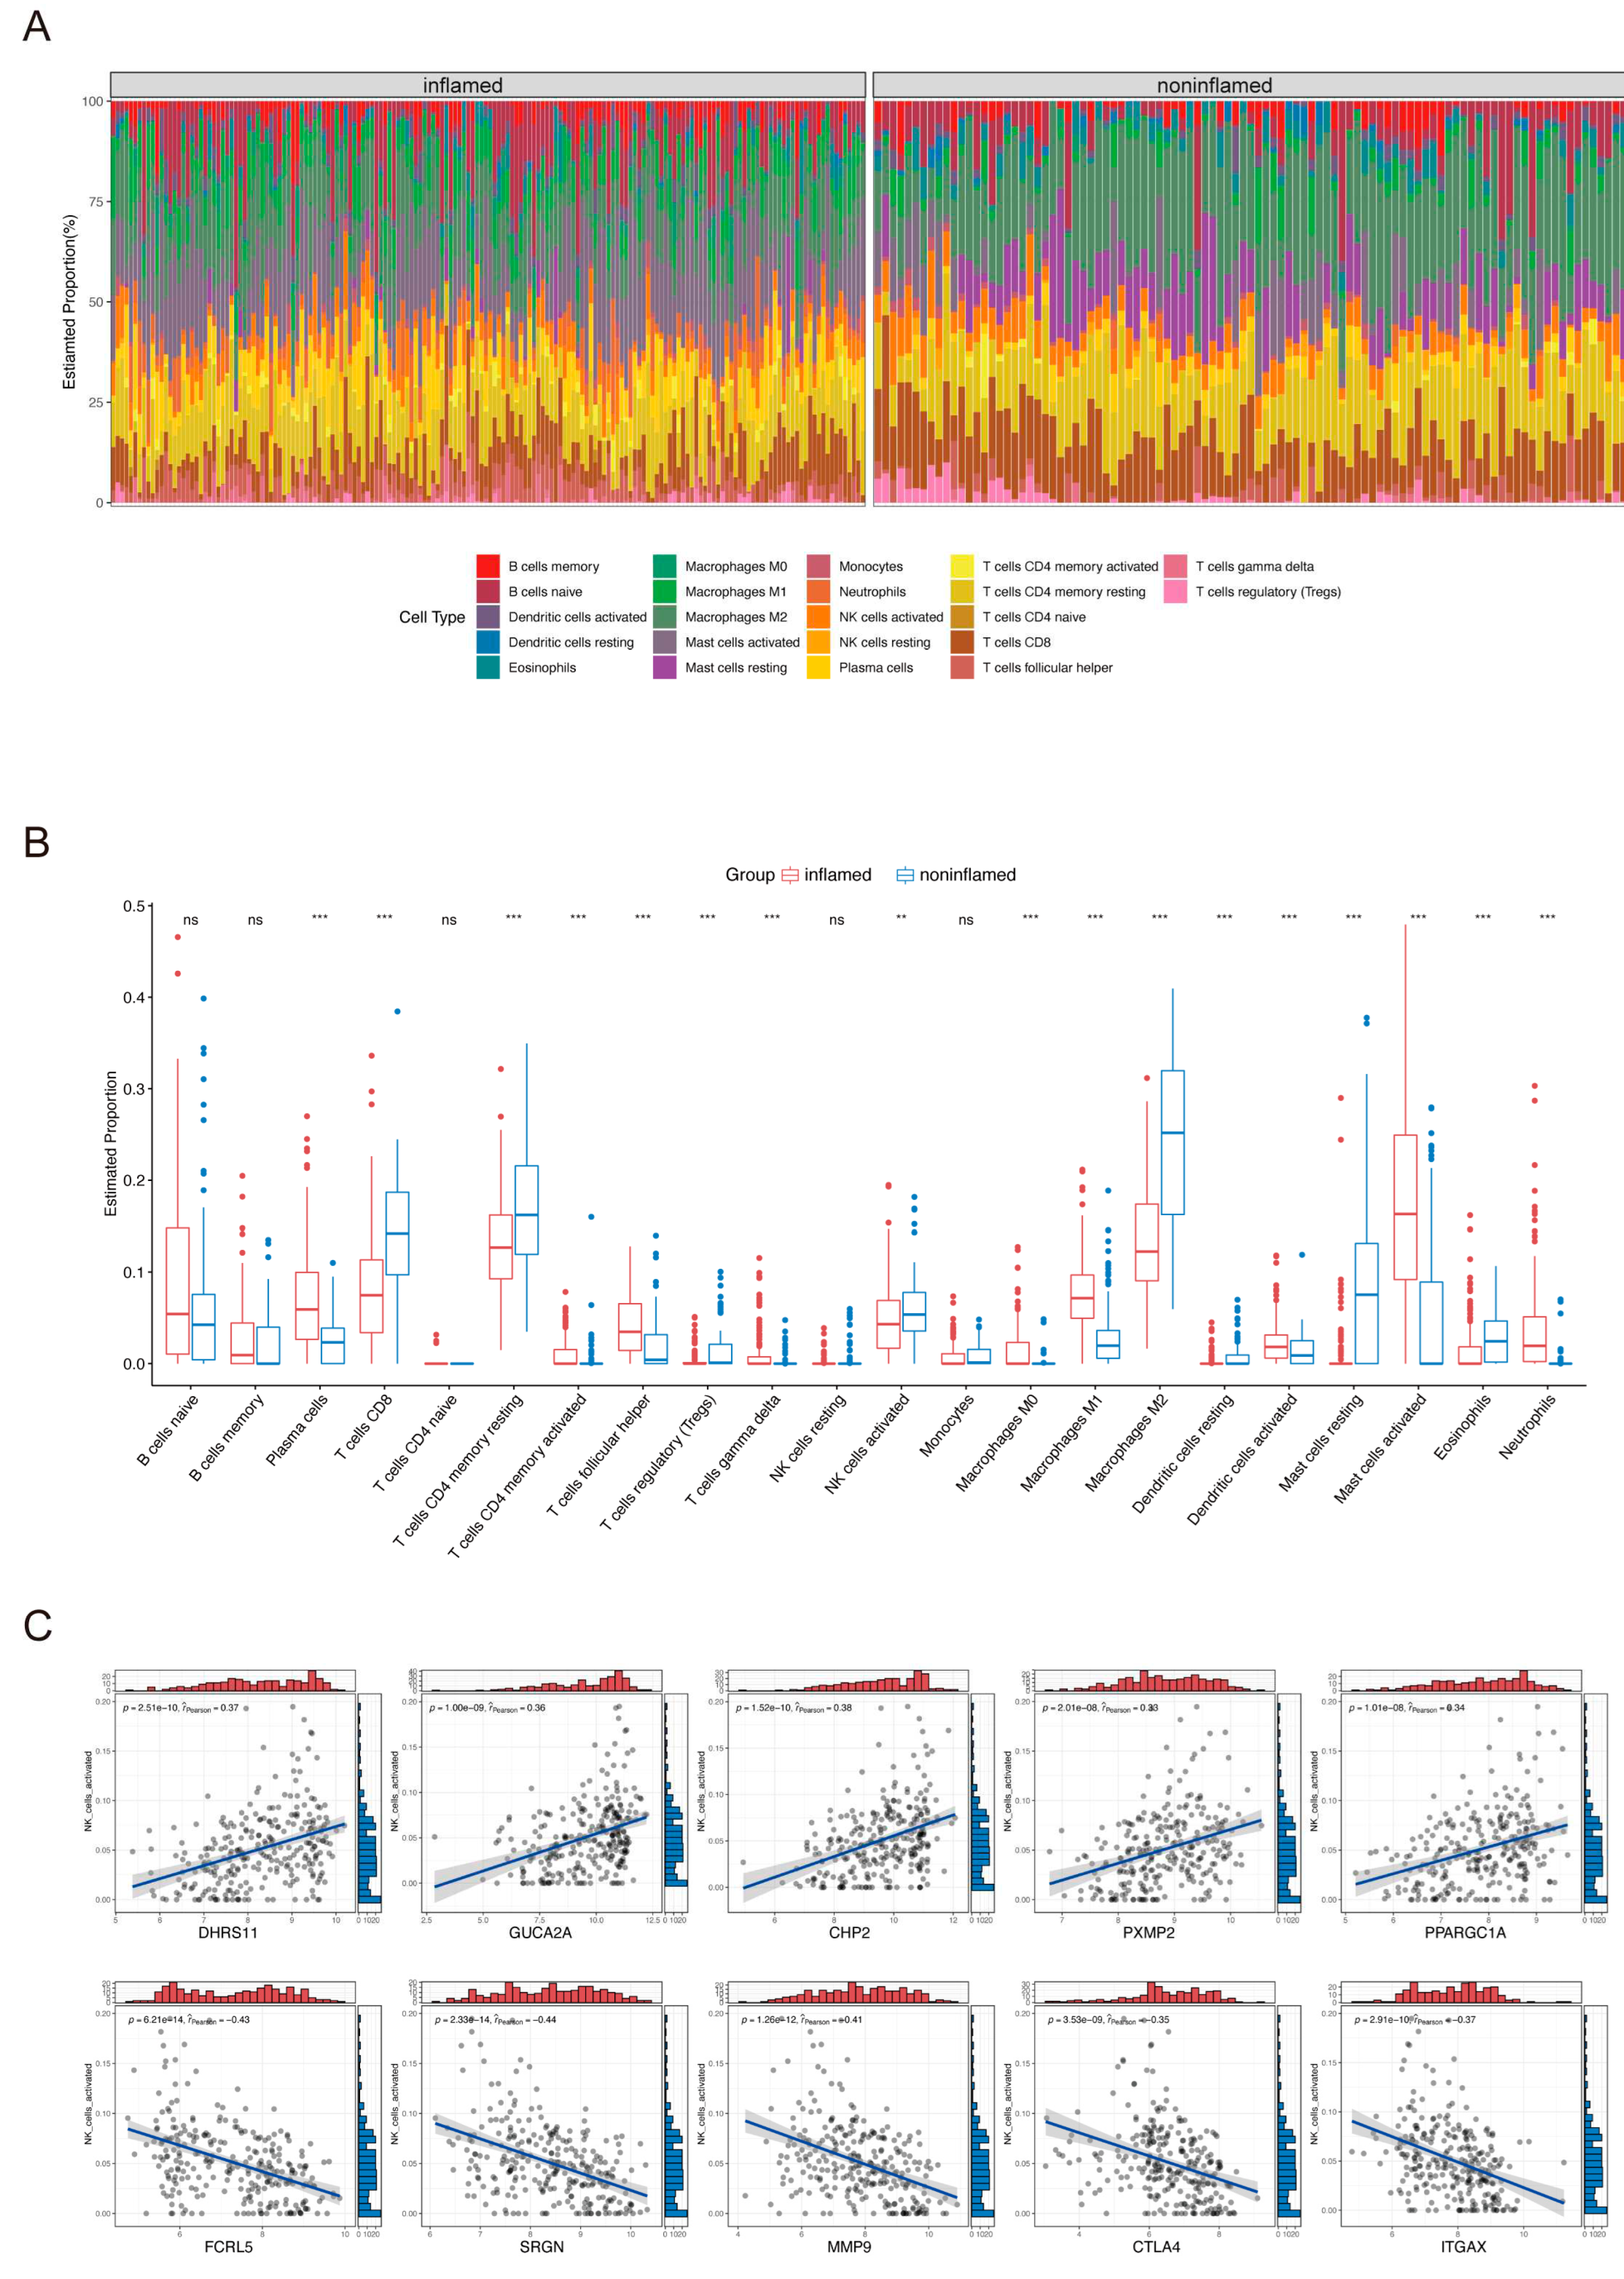
Figure 6.
Construction of the PPI network and identification of key ANAGs. (A, B) The PPI network (A) was constructed based on 92 DEGs by the STRING database. Upregulated DEGs are shown in red and downregulated in blue. Hub genes were identified (B) using the MCODE plugin in Cytoscape. Clusters on the left contain upregulated hub genes while clusters on the right have downregulated hubs. (C, D) LASSO coefficient profile of the 12 hub ANAGs (C). In the binomial deviance plot (D), the optimal lambda was determined when the partial likelihood of deviance reached the minimum value. (E) Expression of the four key ANAGs between inflamed and noninflamed tissues in combined datasets. (F) ROC analysis of the four key ANAGs for UC diagnosis.
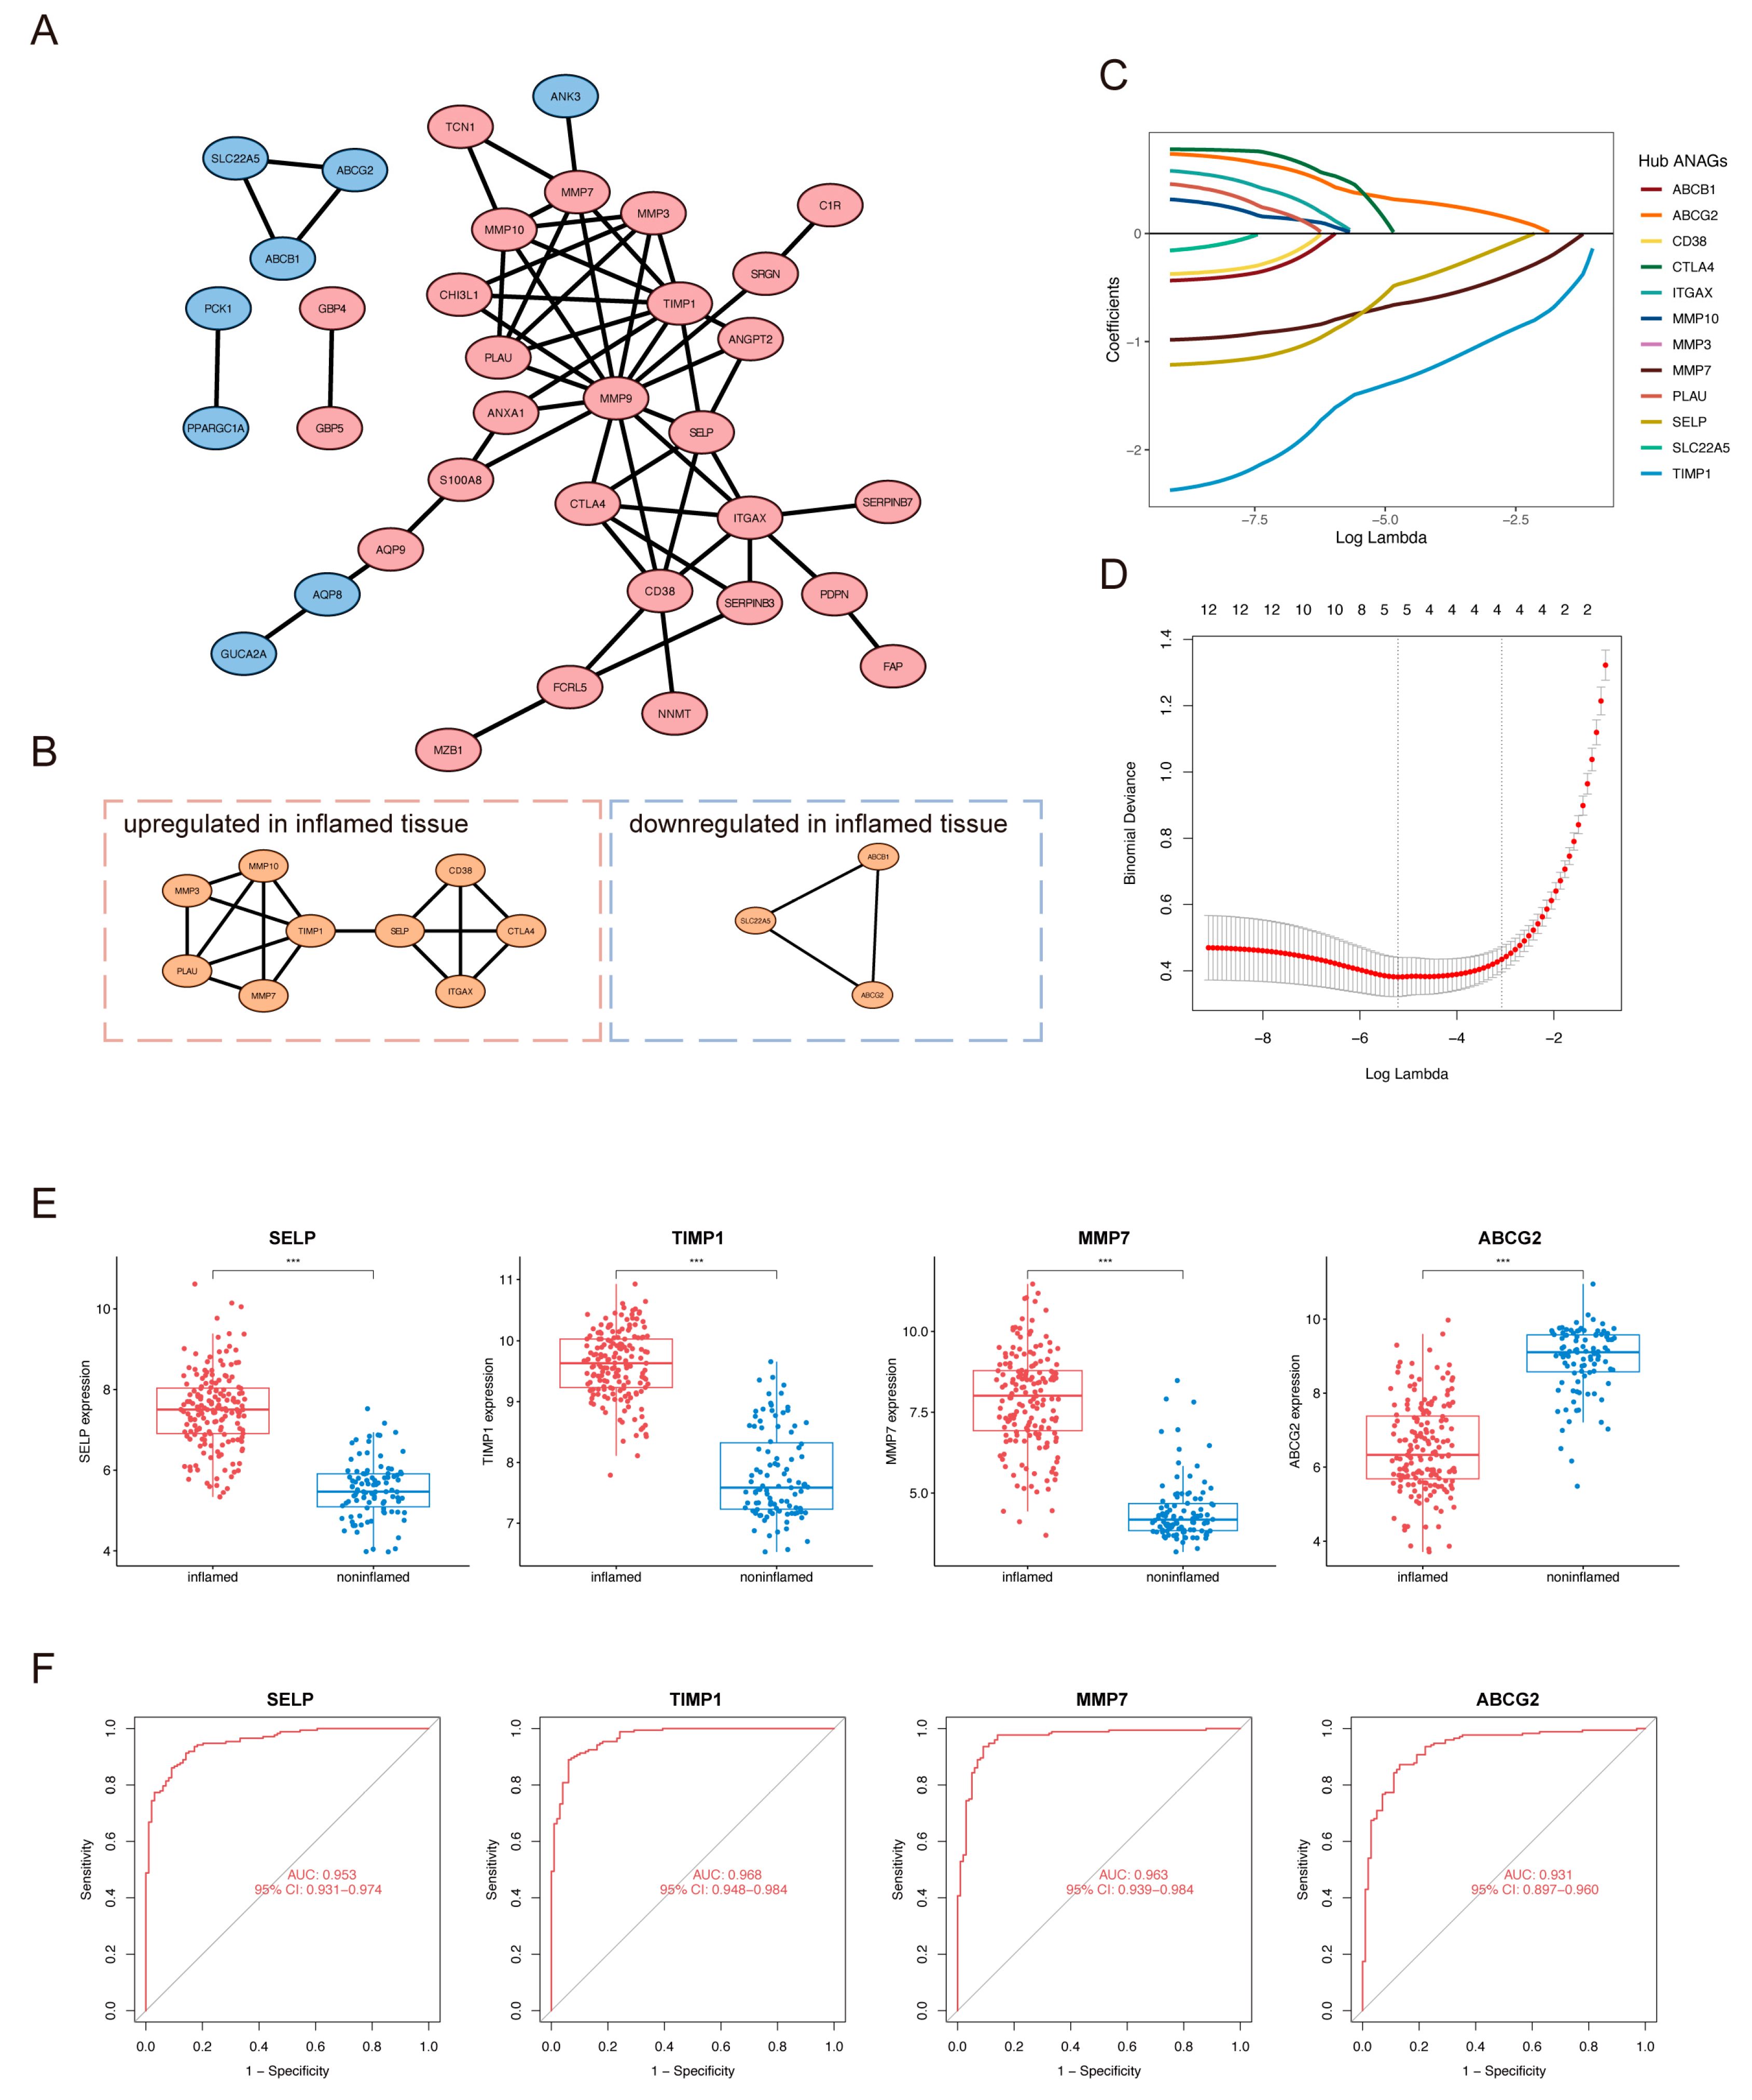
Figure 7.
Diagnostic value of ANAG score. (A) The distribution of ANAG score between inflamed and noninflamed tissues in combined datasets. (B) ROC analysis of ANAG score for UC diagnosis in combined datasets. (C) Nomogram for risk of UC according to the relative expression of 4 key ANAGs.
Figure 7.
Diagnostic value of ANAG score. (A) The distribution of ANAG score between inflamed and noninflamed tissues in combined datasets. (B) ROC analysis of ANAG score for UC diagnosis in combined datasets. (C) Nomogram for risk of UC according to the relative expression of 4 key ANAGs.
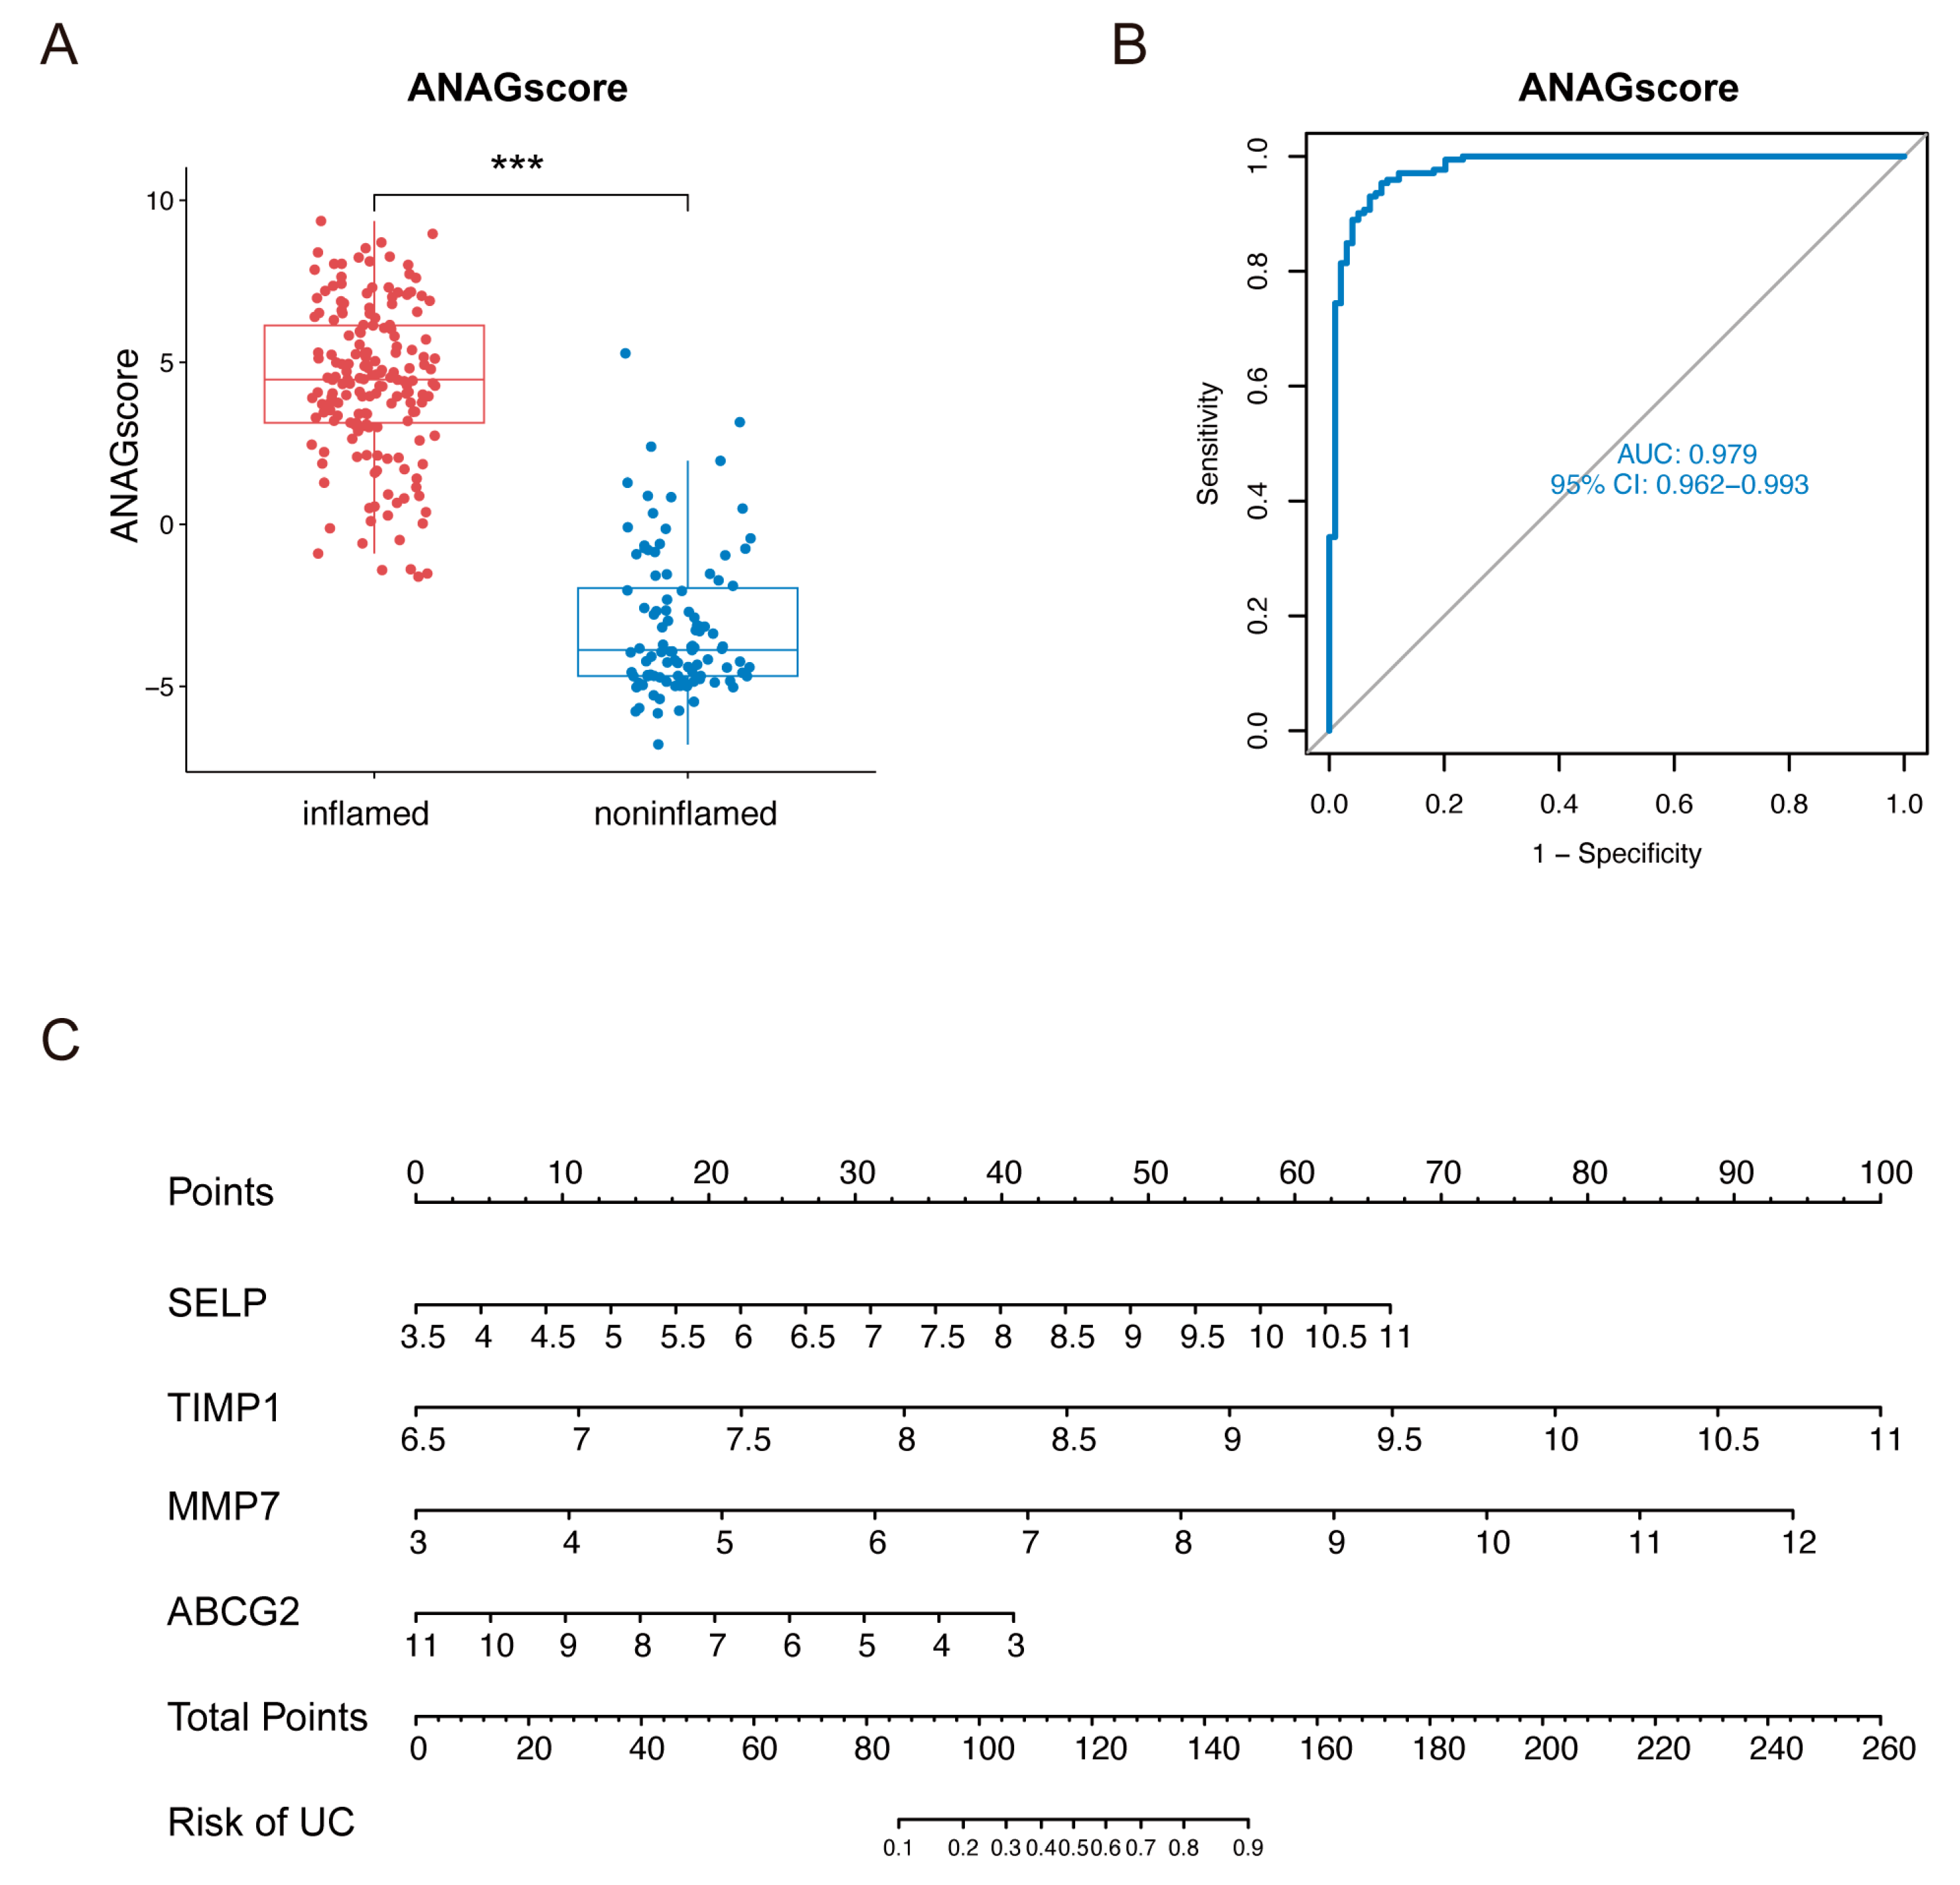
Figure 8.
Validation of ANAGs, ANAG score, and prediction of drugs. (A, B, C) The distribution of ANAG score, ROC analysis of ANAG score, and ROC analysis of each ANAG in GSE87466 (A), GSE92415 (B), and GSE11223 (C). (D) The mRNA levels of the 4 key ANAGs between healthy control and UC patients. (E) Potential drugs for UC predicted by DSigDB database.
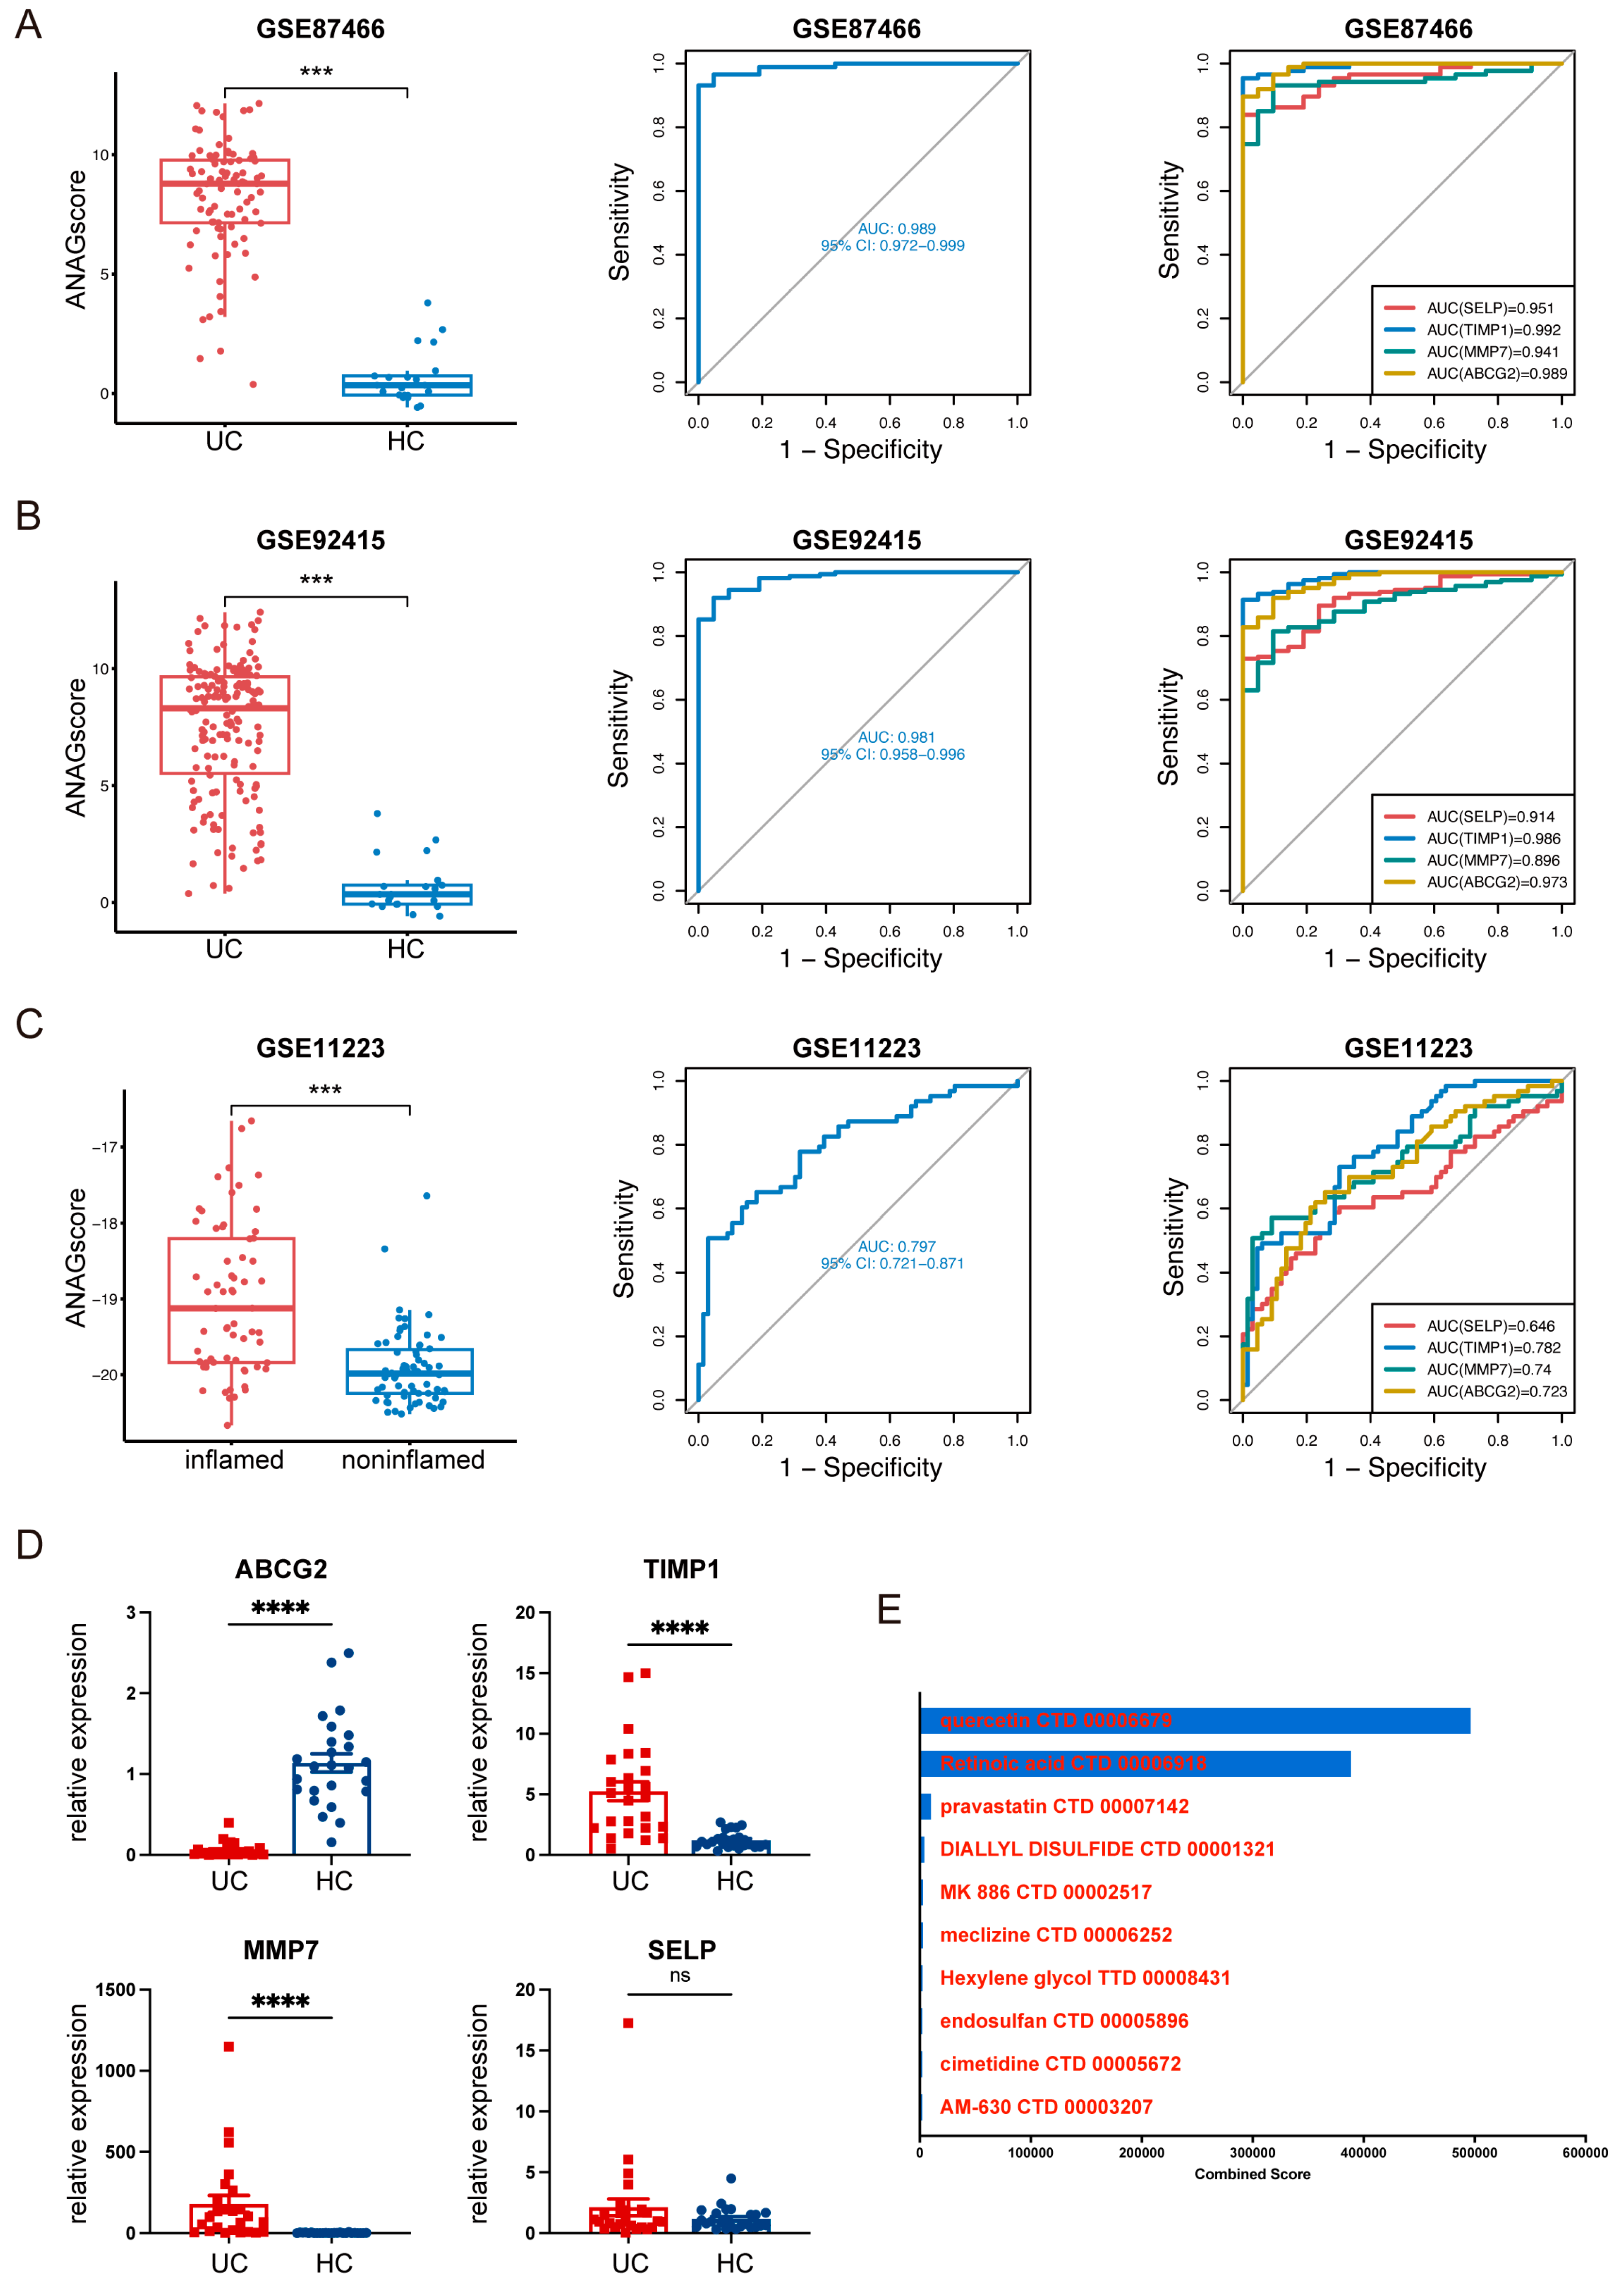
Figure 9.
Distribution of ANAGs in UC based on scRNA-seq analysis. (A) The scRNA-seq data analysis identified 51 distinct cell clusters, visualized on the Uniform Manifold Approximation and Projection (UMAP) plot. (B) Feature plots display the distribution of 9 cell-specific marker genes across different cell clusters. (C) Violin plots show the distribution of 4 key ANAGs across different cell clusters. (D) Violin plots show the relative expression of 4 key ANAGs across different tissues.
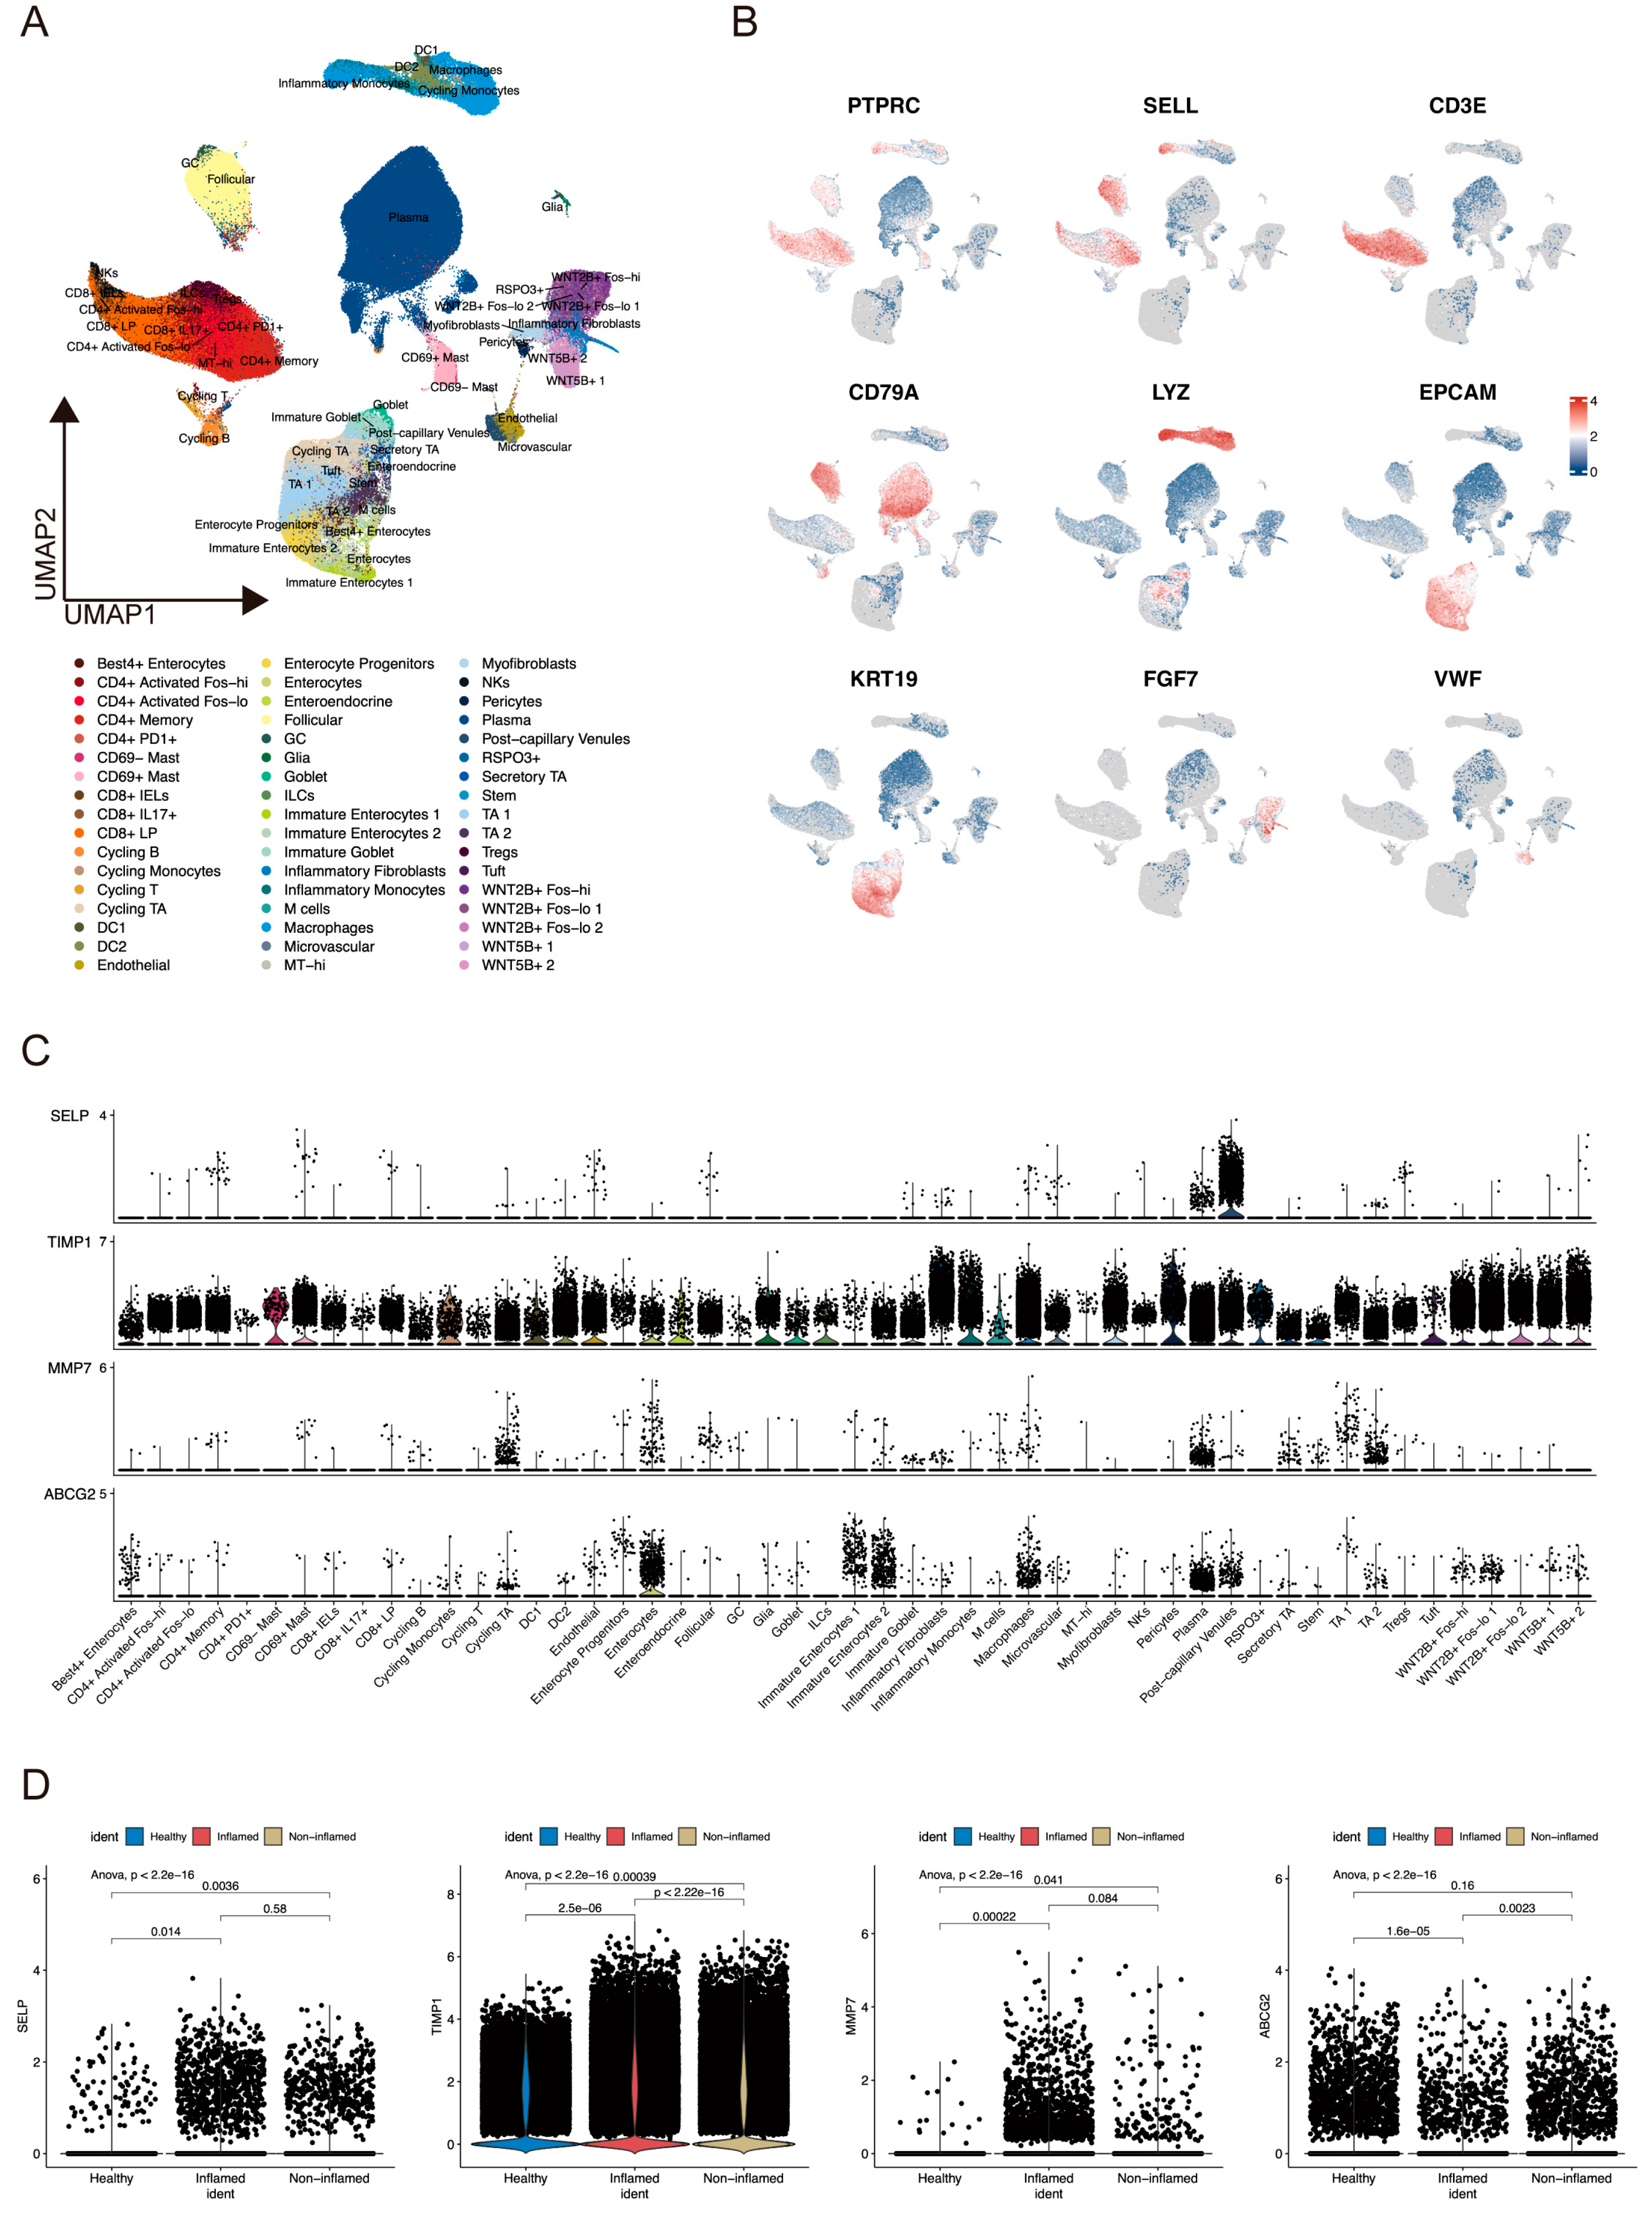
Figure 10.
Cell score of ANAGs based on scRNA-seq analysis. (A, B) The score of ANAGs was calculated for each cell using two methods: “AddModuleScore” (A) and “AUCell” (B). Feature plots and violin plots display the distribution and relative expression level. (C) Violin plots show the score of ANAGs across different tissues. (D) GSEA reveals enrichment pathway of the DEGs between AUC score-high and low groups, pathways up-regulated in AUC score-high group were colored red.
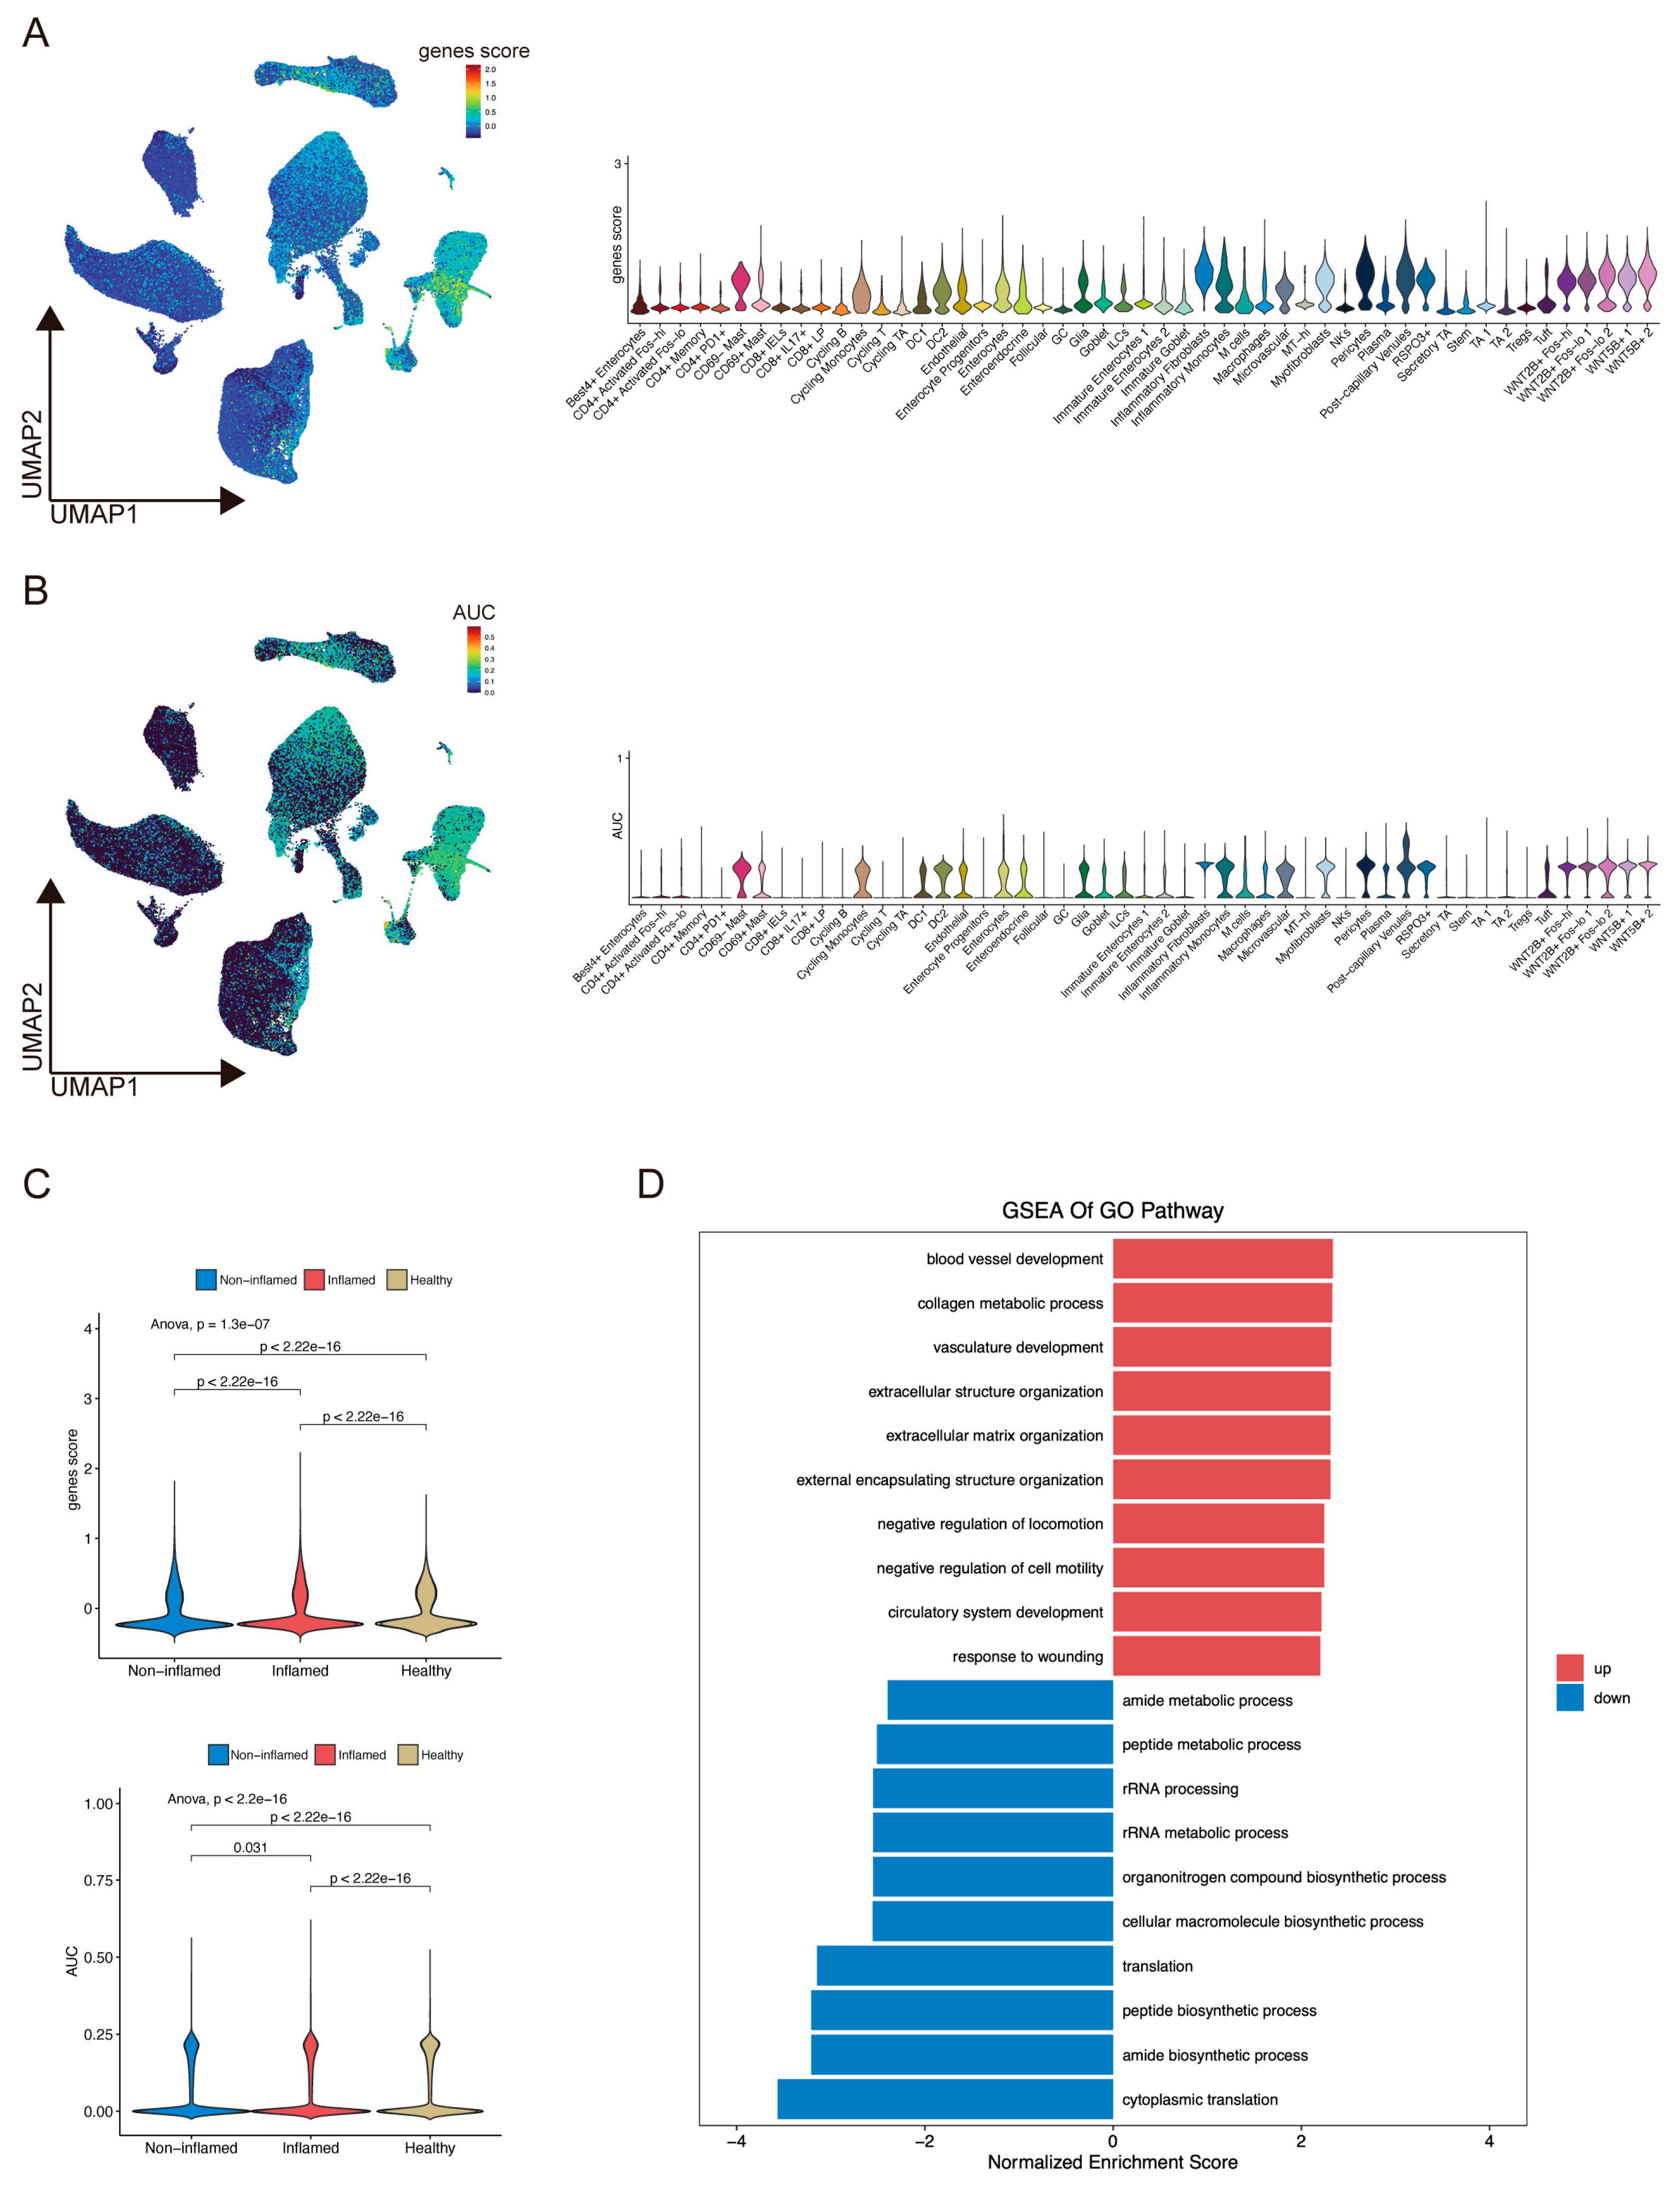

Table 1.
Basic information of GEO datasets included in this study.
| Accession | Platform | Organism | Sample Type & Number | Attribute |
|---|---|---|---|---|
| GSE107499 | GPL15207 Array | Homo sapiens | 75 UC inflamed colon | Training |
| 44 UC noninflamed colon | ||||
| GSE179285 | GPL6480 Array | Homo sapiens | 23 UC inflamed colon | Training |
| 32 UC noninflamed colon | ||||
| 168 CD | ||||
| 31 Healthy control | ||||
| GSE59071 | GPL6244 Array | Homo sapiens | 74 UC inflamed colon | Training |
| 23 UC noninflamed colon | ||||
| 8 CD | ||||
| 11 Healthy control | ||||
| GSE11223 | GPL1708 Array | Homo sapiens | 63 UC inflamed colon | Validation |
| 66 UC noninflamed colon | ||||
| GSE87466 | GPL13158 Array | Homo sapiens | 87 UC | Validation |
| 21 Healthy control | ||||
| GSE92415 | GPL13158 Array | Homo sapiens | 162 UC | Validation |
| 21 Healthy control |
Table 2.
The primers for Real-Time Quantitative PCR.
| Gene | Sequences |
|---|---|
| ACTB | ACAGAGCCTCGCCTTTGCC (Forward) |
| GATATCATCATCCATGGTGAGCTGG (Reverse) | |
| SELP | ACTGCCAGAATCGCTACACAG (Forward) |
| CACCCATGTCCATGTCTTATTGT (Reverse) | |
| TIMP1 | CTTCTGCAATTCCGACCTCGT (Forward) |
| ACGCTGGTATAAGGTGGTCTG (Reverse) | |
| MMP7 | GAGTGAGCTACAGTGGGAACA (Forward) |
| CTATGACGCGGGAGTTTAACAT (Reverse) | |
| ABCG2 | ACGAACGGATTAACAGGGTCA (Forward) |
| CTCCAGACACACCACGGAT (Reverse) |
Disclaimer/Publisher’s Note: The statements, opinions and data contained in all publications are solely those of the individual author(s) and contributor(s) and not of MDPI and/or the editor(s). MDPI and/or the editor(s) disclaim responsibility for any injury to people or property resulting from any ideas, methods, instructions or products referred to in the content. |
© 2023 by the authors. Licensee MDPI, Basel, Switzerland. This article is an open access article distributed under the terms and conditions of the Creative Commons Attribution (CC BY) license (https://creativecommons.org/licenses/by/4.0/).
Copyright: This open access article is published under a Creative Commons CC BY 4.0 license, which permit the free download, distribution, and reuse, provided that the author and preprint are cited in any reuse.


