
Submitted:
25 August 2023
Posted:
29 August 2023
You are already at the latest version
Abstract
Introduction: The goals of this retrospective cohort study of 129,443 persons admitted to Calgary acute care hospitals 2013-2021 were to ascertain correlations of “potentially inappropriate medi-cations” (PIMs), “potential prescribing omissions” (PPOs) and other risk factors with readmissions and mortality. Methods: Processing and analysis codes were built in Oracle Database 19c (PL/SQL), R and Excel. Results: The percentage dying during their hospital stay rose from 3.03% during the first to 7.2% during the 6th admission. The percentage dying within 6 months of discharge rose from 9.4% after the first to 24.9 after the sixth admission. Odds ratios (adjusted for age, gender and comorbidities) for readmission were the post-admission number of medications (1.16; 1.12-1.12), STOPP PIMs (1.16; 1.15-1.16); AGS Beers PIMs (1.11; 1.11-1.11) and START omissions not corrected with a prescription (1.39 (1.35-1.42). Odds ratios for mortality were post-admission number of medications (1.04; 1.04-1.05), STOPP PIMs (0.99; 0.96-1.00); AGS Beers PIMs (1.08; 1.07-1.08) and START omissions not corrected with a prescription (1.56 (1.50-1.63). START omissions corrected with a prescription correlated with a dramatic reduction in mortality (0.51; 0.49-0.53). Odds ratios for readmissions for the second through 39th admission were consistently higher if START PPOs were not corrected for the second admission (1.41; 1.36-1.46), third (1.41;1.35-1.48); fourth 1.35;1.28-1.44); fifth 1.38; 1.28-1.49); sixth (1.47;1.34-1.62) and 7th through 39th admission (1.23; 1.14-1.34). For all admissions when a pre-scription was given to correct START PPOs ORs for mortality within six months of discharge were dramatically improved (0.51; 0.49-0.53). This was also true for the second (0.52; 0.50-0.55; fourth (0.56; 0.52-0.61; fifth (0.63; 0.57-0.68); sixth (0.68; 0.61-0.76); and 7th through 39th admissions (0.71; 0.65-0.78). Conclusions: PPOs should be corrected by prescriptions and teams of family physicians, pharmacists and nurses should focus on patients’ understanding of their illnesses, medications and ability for self-care.
Keywords:
potentially inappropriate medications
; potential medication omissions
; seniors
; readmissions
; mortality
; reducing admissions
; reducing mortality
1. Introduction
1.1. Background/Rationale
A key concern is whether medications assessed as “potentially inappropriate medications” (PIMs) or “potential medication omissions” (PPOs) contribute to seniors’ hospital admissions. The STOPP/START [1] and American Geriatric Society Beers [2] are the two main criteria used for assessment. Medline and Embase were searched to 17 January 2023 with the search terms patient readmission or hospitalization and (systematic reviews or meta-analyses) to identify frequency of readmissions of patients ≥ 65 and the role of medications and other risk factors.
A systematic review identified 62 studies (two RCTs and 60 non-randomised studies with 1,854,698 patients and the average percentages (weighted by study size) for thirty STOPP/START studies (1,245,974 patients) receiving one or more PIMs were 42.8% for 1,242,010 community patients and 51.8% for 3,964 hospitalised patients. For nineteen Beers studies (595,811 patients) the average percentages for one or more PIMs were 58% for 593,389 community patients and 55.5% for 2,422 hospitalised patients [3].
A systematic review of 30 RCTs (n = 11,693) assessed whether primary care could improve post-discharge care. In ten studies patient information was exchanged between health professionals at and after discharge and for the intervention group the relative risk of 30-day hospital readmission compared to control was (RR 0.68; 95%CI 0.56, 0.84) (16.5% vs. 30%) and for 6-month readmission was (RR 0.83; 0.75, 0.92) (35% vs. 38%) [4].
Three prospective studies of readmissions identified increasing numbers of readmissions per patient over time. For the PAERPA study 2015-2017 of 24,500 patients > 75 in the Hauts de France region the best predictor of readmission and death was the progressive numbers of readmissions. The relative risk of admission steadily increased after the first admission (RR 1.8; 1.7, 1.9) to after the fifth admission (RR 3.0; 2.6, 5.5) and the risk of death also steadily increased after the first admission (RR 1.1; 1.07, 1.11) to after the fifth (RR 1.3; 1.1, 1.5) [5].
During the DAMAGE study of 3,081 patients ≥ 75 in six acute French geriatric units again the best predictor of admission and death was prior admissions. The relative risk of readmissions steadily increased after the first admission (RR 1.31; 95%CI 1.08, 1.60) to the fifth readmission (RR 2.66; 1.44, 5.14) and the relative risk of death increased after the first admission (RR 1.61; 1.48, 1.76) to after the fifth readmission (RR 2.01; 123, 3.32). [6].
A prospective study of 625 patients ≥ 70 in two Belgian general teaching hospitals found the 30-day readmission rate was 12.3% and the risk factors were hospitalisation in the previous three months (OR 2.21; 1.24 to 3.87), longer prior stay (OR 2.79; 1.31 to 5.67) and discharge diagnoses for respiratory disease (OR 3.49; 1.88 to 6.42) or genito-urinary illness (OR 5.91; 2.24 to 14.54) [7].
There are two national retrospective cohort studies of readmissions and again the readmission rate increased over time. In New Zealand 2009-10 66,983 patients ≥ 65 had 95,318 admissions. On their first admission 13.3% were readmitted within 30 days and 23.8% within 90 days, and 4.6% died in hospital within 30 days and 8.5% within 90 days. On the second admission 26.1% were readmitted within 30 days and 40.9% within 90 days and 6% died in hospital and 15.4% within 90 days. [8].
In Switzerland, the Swiss Diagnosis-Related Groups reimbursement system was adopted nationwide in 2012 to provide financial incentives to reduce length of stay but there were, however, small increases in readmission rates. For 2,426,722 medical admissions 2009 through 2015 (median age 70, IQR 55-81) there was a small increase in the 30-day readmission rate (14.4% pre- and 15% post-DRG) and a decline in in-hospital mortality (4.9% pre- and 4.6% post-DRG). However, the readmission rates pre- and post-DRG for the 398,479 patients with the five main diagnoses increased for acute myocardial infarction (from 13.7% to 22%), COPD exacerbation (from 17% to 18.2%), acute heart failure (from 14.1% to 16.1%), community-acquired pneumonia (from 10.6% to 11.3%), and pulmonary embolism (from 7.8% to 9%) [9]. Retrospective studies also identified similar high readmission rates. [10,11,12,13].
Thus, there is an urgent need to identify why seniors have so many readmissions and how the readmission rate can be decreased.
1.2. Objectives
1. To measure in this retrospective database of 129,443 first admissions and 155,758 readmissions of Calgary seniors 2013-2021 the relative contributions of risk factors for mortality and readmissions identified in the literature review. 2. To identify cohorts at highest risk of mortality and readmission.
3. To identify the costs of readmissions and how much of these costs could be freed up for interventions by teams of family physicians, pharmacists and home visiting nurses to maintain patients as long as possible in their own homes and avoid readmissions.
3. Methods
3.1. Study Design
Retrosspective cohort database study of the Province of Alberta’s DIMR staff anonymised admission, hospital and discharge records (file DAD) of all individuals ≥ 65 years admitted to the four main acute care hospitals in Calgary with ICD-10 diagnoses and ICC procedure codes in the Province of Alberta DIMR database, and prescribing data in the Patient Information System (PIN).
3.2. Ethics Approval
Conjoint Health Research Ethics Board (CHREB), Research Services, University of Calgary (Project REB15-2163).
3.3. Setting
Retrospective database of 129,443 first admissions of Calgary seniors 2013-2021 and their 155,758 readmissions
3.4. Participants
All individuals ≥ 65 years admitted to the four main acute care hospitals in Calgary 2013-2021.
3.5. Variables
Demographics (age, sex); medical status [illnesses [Medical Council of Canada codes], number of illnesseses, number of medications, Charlson scores), PIMs, PPOs, corrected PPOs, readmissions, mortality.
3.6. Data sources/Measurement
The Province of Alberta’s DIMR staff anonymised admission, hospital and discharge records (file DAD) of all individuals ≥ 65 years admitted to the four main acute care hospitals in Calgary with ICD-10 diagnoses and ICC procedure codes in the Province of Alberta DIMR database, and prescribing data in the Patient Information System (PIN). The 2015 STOPP/START medications [1] and the 2019 AGS BEERS criteria [2] were linked to ATC codes.
3.7. Bias
All output data were independently checked by two authors
3.8. Study Size
All individuals ≥ 65 years admitted to the four main acute care hospitals in Calgary 2013-2021 (129,443 first admissions, 155,758 readmissions). No exclusions.
3.9. Quantitative Variables
The Alberta Health Services DAD and PIN data were combined using patient identifier and admission time windows and any duplicate records in the provided source files were eliminated in the course of processing.
3.10. Statistical Methods
There is no publicly available software for applying STOPP/START or AGS Beers criteria to electronic medical records. The processing and analysis codes developed in the course of this research project were built using a combination of Oracle Database 19c (PL/SQL), R and Excel, and statistical analyses (logistic regressions) were conducted within those databases. Patient outcomes were analysed by age, sex, number of medications on admission and discharge, number of comorbidities, Charlson Index, PIMs, PPOs and corrected PPOs
Missing data were not replaced because the dataset was anonymised by Alberta Health Services and we had no access to individual patient charts.
All patients admitted to the four Calgary acute care hospitals were entered in a unified data system. If patients went out of province and their records were not thereafter incorporated into the AHS database we had no way of knowing about any out of province medical events.
Logistic regressions adjusted raw outcome data for age on admission, sex and number of comorbidities
The DAD and PIN data were combined using patient identifier and admission time windows and any duplicate records in the provided source files were eliminated. The strategy utilised for joining these two data sets consisted of matching prescriptions for a given patient ID by date, identifying prescribed medications one month prior to admission and 180 days post admission, removing any prescriptions that fell into overlapping visit date windows as well as any duplication (Figure 1). The admission window is variable and not shown to scale.
Coupled with the six-month post discharge time window studied, the discharge supply (average 34 days, median 28) amounted to 9,342,962 post discharge prescription records for the 129,443 patients in the study. Subsequent processing excluded from this raw count any duplicate medications along with any medications counted as part of preadmission prescriptions. The prescriptions associated with a given visit were then categorised by type because of the wide variety of brand name and generic medications encountered over the cohort time period and also to simplify correlation with STOPP/START and AGS Beers criteria. The admission data also included diagnostic information for the visit, and this was used to calculate the criteria results for a given visit. Where required, laboratory results for eGFR (estimated glomerular filtration rate) were included to support calculations.
The results per visit for criteria are generally binary (medication is present or not). For AGS Beers they are ternary (values of 0,1,2), with 0 meaning no medication, 1 meaning diagnosis with no recommended medication and 2 meaning diagnosis with recommended medications.
There is no publicly available software for applying STOPP/START or AGS BEERS criteria to electronic medical records. The individual criteria were coded as Oracle database functions and applied to the raw data. This design allowed rapid processing and modularity for recalculation. The final results table was analysed using R Studio and Markdown. For calculations of Odds Ratios, the Generalized Linear Model (GLM) was used to apply logistic regressions (family parameter set to binomial). The processing and analysis code developed in the course of this research project was built using a combination of Oracle Database 19c (PL/SQL), R and Excel.
4. Results
4.1. Summary of the Characteristics of the Patients with a First Admission 2013-2021 Admitted to the Four Acute Care Hospitals in Calgary
In Table 1, descriptive statistics are shown for a total of 285,201 visits for 129,443 unique patients of both genders.
The number of first admissions for which data were available across all three Alberta Health Services databases (medical, surgical, and procedures; medications; and laboratory results) was 129,443 (median age 76 years). On admission they had a median of three medications and at discharge a median of nine (Table 1).
4.2. Numbers of Patient Admissions to the Four Acute care Calgary Hospitals 2013-2021
Data were obtained from three Alberta Health Services datasets and the total numbers reported in the tables vary according to how much information could be joined across all three datasets. The initial admission 2013-2021 was of 129,443 patients, the second of 64,441 of those patients, the third of 35,206, the fourth of 20,354, the fifth of 12,271 and the sixth of 7,577 patients. Another 14,951 patients had 7 to 15 admissions, and 843 had 16-25 admissions. A very small number of patients had more than 25 admissions during this period: the final 115 pa tients had 26-39 admissions. There were slightly more male (144,908) than female (140,293) admissions (Table 2).
4.3. Numbers of Admissions, Readmissions, Length of Stay, and Death in Hospital and in the Next Six Months
The percentage of patients who died during their first hospital admission was 3% and the percentage increased to 7.21% by the sixth admission and the average for the 7th through 39th admissions was 7.54% (Table 3). Of the 129,443 first admissions a large number (28,292; 21.9%) were readmitted within six months. The percentage of readmissions within six months rose steadily to the sixth readmission (45.2% and then averaged 53.5% for the 7th through 39th readmissions. The percentage who died within six months of an admission increased from 9.4% after the first admission to 24.9% after the sixth admission and then averaged 26% for the 7th through 39th admissions. The average stay rose from 9.8 days for the first admission to 13 days for the 6th and then averaged 11.7 days thereafter. The relative risk of readmission rose from 49.8% for a second after a first admission and to 61.8% for a 6th after a 5th readmission. For the smaller numbers of admissions after the 7th the relative risk varied between 65% and 100% with the numbers of readmissions becoming much smaller as the multiple readmissions progressed.
4.4. Principal Diagnoses for Admissions 1 through 39, and also Annually for Each Year 2013-2021
One method of visualising the large numbers of principal admitting diagnoses is to use “heat maps,“ which show larger numbers of patients in hot colours (e.g., red) and smaller numbers in cooler colours (pale yellow and green). The principal admitting diagnoses are shown in Figure 2 and Figure 3 as heat maps and the numerical data are also shown in the text below.
The most frequent principal admitting diagnoses (Figure 2) were for cardiac problems (34,277): heart failure (12,159); arrhythmias without cardiac catheterization (4,031); percutaneous coronary intervention with MI/Shock/Arrest/Heart Failure (3,706); Pacemaker implantation (3,555); Myocardial Infarction/Shock/Arrest without cardiac catheterization (2,608); Other cardiac disorders (2,326); Cardiac Valve Replacement (2,206); Percutaneous Coronary Intervention without MI/Shock/Arrest/Heart Failure (1,932); and Coronary Artery Bypass without Cardiac Catheterizations, without MI/Shock/Arrest, with/without pump (1,724).
The second most frequent principal admitting diagnoses were orthopedic procedures (25,610): Knee replacement (10,139); Hip replacement (5,924); Fixation/repair Hip/Femur (3,754); Spinal Vertebrae intervention (3,106); and Hip Replacement with trauma/complication of treatment (2,687).
The third most frequent principal admitting diagnoses were infections (22,364): Viral/Unspecified Pneumonia (6,019; Lower urinary tract infection (5,334); Other/Unspecified Septicemia (3,276); Enteritis (3,143); Severe Enteritis (2,402); and Aspiration pneumonia (2,190).
The fourth most frequent principal admitting diagnoses were pulmonary (15,637): Chronic Obstructive Pulmonary Disease (COPD) (10,995; Pulmonary Embolism (1,944); and Malignant Neoplasms of Respiratory System (1,698). The fifth most frequent principal admitting diagnoses were Central Nervous System (13,308): Ischemic Event Central Nervous System (4,884); Organic Mental Disorder (4,633); and Dementia (3,791). The sixth most frequent principal admitting diagnoses were Renal (8,890): Minor Intervention on Upper Urinary tract (3,572); Renal Failure (2,604); Non-Major Intervention on Lower Renal Tract (2,409), and Disorder Fluid/Electrolyte Balance (2,305). The seventh most frequent principal admitting diagnoses were Gastro-Intestinal (6,505): Gastrointestinal Hemorrhage (2,962); Symptom/Sign of Digestive Problem (1,848); and Laparoscopic Cholecystectomy (1,695). There were 5,897 operations for Partial Excision/Destruction of the Prostate.
This pattern of serious illness was also seen in each of the admissions in each of the years 2013-2021. Figure 2 lists the top 20 of the 40 most frequent diagnoses. he Medical Council of Canada diagnoses (MCC) (Figure 3) with the darker red colour highlight the anatomic systems with the most numerous primary admissions and show the persistence of admissions with these organ system problems.
4.5. The numbers of Medications Pre-Admission and on Discharge for all Admissions
On pre-admission there were 50,000 patients who had no medications and the numbers of medications declined steadily and sharply from two to 15 medications. However, there was a dramatic increase in the number of medications post-discharge with a median number of nine medications then tapering steadily to thirty medications (Figure 4).
4.6. Class and Numbers of Medications Prescribed: All Admissions 2013-2021
Of the top ten most frequently prescribed medications seven were for cardiac conditions: beta blockers (3,987,449 prescriptions), statins (2,706,992 prescriptions), calcium channel blockers (2,343,022 prescriptions), ACE inhibitors (1,786,653 prescriptions), antiplatelet agents (1,724,720 prescriptions) and ARBs (1,363,172 prescriptions) (Supplemental Table 1).
4.7. Costs of Admissions 2013-2021 Measured by Resource Intensity Weighting
The costs for the 1st to 19th admissions are shown (data are not shown beyond 19th readmission because of the small numbers). The Canadian Institute of Health Information (CIHI) designed the Resource Intensity Weighting (RIW) method to estimate costs of individual patient hospital admissions across Canada, with separate estimates for each province. The “cost per weighted case” (CPWC) 2022 measures a ratio for each province and for the whole of Canada. The ratio is a hospital’s total acute inpatient care expenses compared to the number of acute inpatient weighted cases. The weighted cases used are CMG+ 2022 (CIHI’s most recent case mix grouping methodology) [14,15]. Payments to physicians are in a separate confidential file we could not access. Resource Intensity Weights measure the intensity of resource use (i.e., relative cost) for the diagnostic, surgical, procedure and medical care of an individual. RIWs are assigned according to the case mix group to which an individual is assigned, and also include the patient’s age, health status, and discharge status. Micro-costing uses CIHI Complexity Overlay (CMG Plx™). We computed that the RIW data are skewed for each year 2013-2021 (due to some very expensive admissions). However, because this is a very large dataset comprising nine years of financial data, it is expected that the skewness will be a persistent feature of the RIW and the RIW methodology has been tested by CIHI so that they form the most reliable available data on costs. The average cost of a hospital stay in Alberta 2020-2021 was CAD$9149 and for Canada CAD$7619. In the Calgary dataset 2013-2021, the estimated RIW of a senior’s admission ranged from 1.527 to 11.727 times more expensive compared to the average cost of an admission (Figure 5). The heat map shows the consistently high costs (red colour) occurring in admissions for ear, nose mouth and throat diseases, dementia, rehabilitation, burns, circulatory system, cancer, and the respiratory system. RIWs tended to be very high when complex cancer surgery and reconstruction was involved (Figure 5). Using the RIW cost data available for the 285,201 patients for whom we had data from all three AHS databases, we extrapolated the costs for the full sample of 295,708 patients. Using Alberta costs the total cost of all seniors’ admissions to the four acute care hospitals in Calgary 2013-2021 was $7,477,391,068 and if average Canada costs were used $6,571,010,108. Using Alberta costs the cost of the 2nd through 39th admissions 2013-2021 was $2,762,343,130. If 10% could be saved from the 2nd through 39th admissions that would provide $276,234,313 for teams of family physicians, home visit nurses, pharmacists and other professionals to keep senior patients at home and avoid readmissions. If 20% could be saved then $552,468,626 would be available. Seniors’ admissions include many surgeries and there would be limited opportunity for cost saving from surgeries.
Source: Canadian Institute of Health Information, The Cost of a Standard Hospital Stay (also referred to as “cost per weighted case (CPWC)” 2022. measures a ratio for each province and for the whole of Canada. The ratio is a hospital’s total acute inpatient care expenses compared to the number of acute inpatient weighted cases. The weighted cases used are CMG+ 2022 (CIHI’s most recent case mix grouping methodology). Micro-costing uses Complexity Overlay (CMG Plx™) methodology [14,15].
4.8. Correlations with Readmissions and Mortality 2013-2021
For all admissions (Table 4) The (unadjusted) odds ratios for readmission were markedly elevated for START PPOs not prescribed (1.58; 1.55-1.61), STOPP PIMs (1.17; 1.17-1.17), and to a lesser extent AGS Beers PIMs (1.11; 1.11-1.12).
The most adverse unadjusted odds ratios for mortality within six months were for START PPO medications which were needed but not prescribed (2.16; 2.11-2.21). Patients with higher Charlson scores also had a high odds ratio of mortality (1.43; 1.42-1.43). Patients assessed as having any Resource Intensity Weighting above the average for all admissions also had higher odds ratios of mortality (ranging between 1.39 for RIW 1-2 to 2.86 for RIW >9). The number of comorbidities increased the odds ratio of mortality (1.19; 1.18-1.19) and also the number of medications assessed after admission (1.19; 1.18-1.19). The only (unadjusted) risk factor which had ORs including unity were START PPOs which were correctly prescribed with an odds ratio of mortality of (0.99; 0.97-1.01).
When odds ratios were corrected for age, gender and comorbidities the risk of mortality for STOPP PPOs not corrected remained elevated (1.56; 1.50-1.63) but when a prescription was given the ORs were markedly reversed (0.51; 0.49-0.53), and this was the only factor that provided improvement (and a major improvement) in the odds ratios of mortality.
For the first admission (Supplemental Table 2) the corrected odds ratio for readmission was elevated for START PPOs not prescribed (1.39; 1.35-1.42), for STOPP PIMs (1.16; 1.15-1.16), AGS Beers PIMS (1.11; 1.11-1.11) and number of medications (1.12; 1.12-1.12). Odds ratios were elevated for correctly prescribed STOPP PIMs (1.26; 1.23-1.30). Interpretations are that these patients received correct prescriptions but their illnesses needed time to improve, or that they received increased supervision resulting in readmissions
The ORs (adjusted for age at admission, gender and comorbidities) for mortality within six months were elevated for START PPOs not corrected by a prescription (1.56; 1.50-1.63) but mortality was markedly reduced if the PPOs were corrected by prescribing for the patient (0.51; 0.49-0.53).
The next result that was of key interest in this research project was to assess whether the odds ratios of further admissions) and mortality improved or worsened during subsequent admissions. The same pattern of a marked reduction in mortality if PPOs were correctly prescribed persisted in all subsequent admissions (Supplemental Tables S3-S8).
However, odds ratios of readmission were consistently higher if START PPOs were corrected: second admission (1.36; 1.31-1.41); third admission (1.42;1.36-1.49); fourth admission 1.50;1.41-1.59); fifth admission 1.49; 1.38-1.60); sixth admission (1.64; 1.49-1.81) and 7th through 39th admission (1.53; 1.41-1.65). It will be important to examine each patient’s illness and progress to identify the reasons for this apparently anomalous result. The possibilities are that the patient has other illnesses that cause admissions; prescribing to correct PPOs identified illnesses and their amelioration is still underway; the patients received increased monitoring and were more likely to be admitted for follow-up care; or the patient, carer and primary care team were concerned about deterioration from other illnesses and sought hospital care.
4.9. Destination after Discharge from the Four Calgary Acute Care Hospitals 2013-20221
After their admissions, only 44% of patients returned directly to their homes or to a lodge (residences in Canada in which patients are expected to be able to look after themselves with minimal supervision) (Figure 6). An important focus of this project was to identify the experiences of the Calgary seniors during their multiple admissions. Increasing the numbers of discharges direct to home with continued long-term residence in their own homes supported by a team of family physicians, pharmacists and home visit nurses would be an outstanding benefit.
5. Discussion
5.1. Key Results
There was a dramatic decrease in mortality over all admissions when PPOs were corrected with a prescription (OR 0.51; 95%CI 0.48-0.53; p <.001) but a marked increase in mortality if PPOs were not corrected with a prescription (OR 1.56; 1.50-1.63; p <.001). There was an increase in mortality if patients received a Beers AGS PIM (OR 1.08; 1.07-1.08; p < .001) but not a STOPP PIM (OR 0.99; 0.96-1.00; p <.001) (all data corrected for age, gender and comorbidities).
There was an increase in readmissions if START PPOs were not corrected (OR 1.39; 1.35-1.42; p <.001) but also if they were corrected (OR 1.26; 1.23-1.30; P<.001) and the possible reasons for this unexpected finding need to be investigated. The possibilities are that the patient acquired other illnesses, prescribing to correct PPOs was underway but had not ameliorated the illnesses, or patients received increased monitoring including readmissions. STOPP PIMs also correlated with readmissions (OR 1.16; 1.16-1.16; p <.001) as did AGS Beers PIMs (1.11; 1.11-1.11; p<.001).
5.2. Admission Costs
When hospital costs for the province of Alberta are applied to the Calgary sample the total cost of all seniors’ admissions to the four acute care hospitals in Calgary 2013-2021 was $7,477,391,068 and when average Canadian costs are utilised the costs were $6,571,010,108. For the 2nd through 39th admissions 2013-2021 the Alberta cost was $2,762,343,130. If 10% were saved by reducing the numbers of 2nd through 39th admissions this would provide $276,234,313 for home care and a 20% saving $552,468,626.
5.3. Previous Studies of Interventions to Reduce PIMs, PPOs and Admission Costs
Two key systematic reviews emphasised the importance of comprehensive patient-centred rather than system-centred interventions. A systematic review and meta-analysis of 42 RCTs of the complexity of interventions to prevent readmissions of those ≥65 rated most studies on the Cochrane Risk of Bias tool at low risk with the most frequent problem being no reliable method of dealing with missing data. The relative risk of 30-day readmission was lower in the intervention arms (0.82; 0.73, 0.91), and was lower when the intervention augmented patient self-care capacity (RR 0.68; 0.53, 0.86) compared to when it did not (RR 0.88; 0.80, 0.97); had five unique components (RR 0.63; 0.53, 0.76) compared to when it did not (RR 0.91; 0.81, 1.01); and when at least two individuals were involved in intervention delivery (RR 0.69; 0.57, 0.84) compared to when they were not (0.87; 0.66. 0.98). Compared to Category 1 interventions (which provided no comprehensive support) Category 3 interventions provide a consistent and comprehensive strategy that emphasises the assessment and treatment of factors of patient context and self-care (caregiver contributions, functional status, impact of comorbidities, patient and caregiver goals for care and potential for self-management) and socioeconomic factors. Studies with Category 3 interventions had a lower relative risk of admission of 0.63 (0.43, 0.91) [16].
A systematic review of 15 systematic reviews of integrated care assessed the average AMSTAR 1 score of the reviews as seven and identified whether the 219 included studies incorporated all the elements in the WHO Integrated care for Older People approach (WHO 2016, WHO 2016). All the interventions included case management and multidisciplinary planning and/or care delivery and multiple care providers (nurses in 12 studies, physiotherapists in 10, GPs in nine and social workers in nine). However, the outcomes in most reviews were service or system centered and not focused on patient care experiences, whereas the key WHO focus is for interventions to be patient-reported outcome measures (PROMs) and patient-reported experiences (PREMs) [17]
Three systematic reviews of specific interventions (physician-pharmacist collaboration, multidisciplinary teams, pharmacist counselling) assessed the evidence as low quality and thus conclusions about these interventions cannot be made. A systematic review of physician and pharmacist collaboration in primary care to reduce readmissions of adult patients included 16 RCTs. The Cochrane Risk of Bias tool assessed 16/16 studies as low risk for randomisation, 11/16 for allocation concealment, 0/16 blinding of participants and personnel, 15/15 blinding of outcome assessors, 15/16 completeness of outcome data, and 16/16 no selective reporting but the GRADE study quality was low. Despite face-to-face communication between pharmacists and primary care physicians in all studies, there was no significant effect on readmissions (RR 0.92; 0.80-1.06) and low certainty of evidence [18]. A systematic review of 11 RCTs (n = 7,496 ≥ 65) of care in acute geriatric units on the Cochrane Risk of Bias tool assessed four at high risk of bias for randomisation and two for allocation concealment and only five performed an intention-to treat analysis. The multidisciplinary team included a geriatrician and/or primary care physician and a nurse with geriatric training and there was only a small difference in the relative risk of living at home after three months (RR 1.06; 0.99, 1.13) [19].
A systematic review identified 62 RCTs of pharmacists counselling patients and for the 29 RCTs of pharmacists counselling patients to adhere to their prescribed medication adherence increased (RR 1.30; 1.19, 1.43) but the GRADE assessment of quality was low to very low. For 11 RCTs which assessed effects on 30-day readmission rates the RR was 0.76 (0.58, 0.99) [20]. Another systematic review of 18 RCTs of pharmacist medication reviews rated 10/18 as high risk on the Cochrane risk of bias tool and readmission rates did not differ between the experimental and control groups (RR .97; 0.89, 1.05) [21].
Two small studies identified that polypharmacy and PIMs predicted readmissions. A study of 647 patients in acute geriatric wards in southern Italy in 2013 found that polypharmacy predicted 3-month readmissions (OR 2.72; 1.48-4.99) but STOPP (1.60; 0.85, 3.01) and AGS BEERS criteria (0.85; 0.46-1.56) did not [22]. In a study of 259 patients discharged from a general medicine unit in Scotland during the 41.5-month follow-up period: 50% died and a PIM was associated with three or more readmissions (OR 2.43; 1.19-4.48) and with mortality (OR 2.51; 1.20, 5.28) and a PPO with mortality (OR 1.88; 1.09, 3.27 [23].
Thus, key concepts in planning interventions to reduce readmissions are presented in Leppin’s [16] systematic review which found that reductions in readmission rates were most likely if interventions improved self-care capacity, had five or more unique components and involved two of more intervenors.
5.4. Strengths
This database is the largest of first admissions (129,443) and of readmissions (155,758) over the longest period of nine years (2013-2021) in the literature.
5.5. Weaknesses
We were not able to obtain the costs that physicians billed for hospital care as this was in a separate confidential file. We did not have access to individual patient files and were unable to discover why physicians corrected some PPOs with a prescription and other PPOs not or the reasons why additional medications were started during readmissions (some were PIMs). We were unable to identify adverse drug reactions because during the time of the study there was no specific category for ADRs in the hospital records. We would have preferred to use Cox proportional hazards models to accurately assess survival but the non-proportional hazard assumption was not met and so we used logistic regression.
5.5. Generalisability
The study is generalisable to the Calgary population as a whole because the numbers of patients by age group and gender admitted to the four Calgary acute care hospitals are representative of the Calgary population as measured by the 2022 Canadian Census (Supplemental Table S9).
The study population is also similar to the five-year age groupings of Alberta, Canada and the US and could be generalised to those jurisdictions with appropriate caution for differences in ethnic composition, access to medical care and prescribed medications.
However, generalisability could be reduced for populations with a substantially different ethnic composition. Twelve key P450 isoforms metabolise more than 70% of medications. Many medications also either inhibit or enhance metabolic rates in these isoforms, thus affecting how other medications are metabolised. Ethnic differences within populations are particularly important because of major differences between ethnic groups in their P450 enzymes and the alleles they inherit from each parent and how these affect drug metabolism, drug-drug and drug-gene interactions. For example, two thirds of anti-depressants are metabolised by two isoforms, CYP2C19 and CYP2D6. Patients with the CYP2C19 Null/Null genotype have 0% metabolic activity for medications which are metabolised by the CYP2C19 P450 isoform, whereas those with CYP2C19*17/*17 have two ultrarapid metabolising alleles and they metabolise at 120% of the normal rate, and for the CYP2D6WtX3 genotype (which has two ultrarapid alleles) the metabolic rate is 150% [24,25].
Author Contributions
Conceptualization, R.E.T. and R.A.; methodology, R.E.T. and R.A.; software, R.A..; validation, R.E.T. and R.A.; formal analysis, R.A. and R.E.T.; investigation, R.E.T. and R.A..; resources, R.E.T. and R.A..; data curation, R.A. and R.E.T.; writing—original draft preparation, R.E.T. ; writing—review and editing, R.E.T, R.A, D.T; visualization, R.A..; supervision, R.E.T.; project administration, R.E.T.; funding acquisition, (no funding). All authors have read and agreed to the published version of the manuscript.
Institutional Review Board Statement
Ethics approval was provided by the Conjoint Ethics Board, University of Calgary (ID REB15-2163:
Informed Consent Statement
Informed consent was not required because all data were anonymized by Alberta Health services before provision to the researchers.
Data Availability Statement
Alberta Health Services will not permit researchers to share data outside AHS
Conflicts of Interest
The authors declare no conflict of interest.
Recognition: To Dr. Leo Nguyen for extensive coding and analysis of an earlier version of the database 2013-2018
References
- Thomas, R.E.; Thomas, B.C. A Systematic Review of Studies of the STOPP/START 2015 and American Geriatric Society Beers 2015 Criteria in Patients >= 65 Years. Current Aging Science. 2019, 12, 121–154. [Google Scholar] [CrossRef] [PubMed]
- O’Mahony, D.; O’Sullivan, D.; Byrne, S.; O’Connor, M.M.; Ryan, C.; Gallagher, P. STOPP/START criteria for potentially inapprpriate prescribing in older people: version 2. Age Ageing 2015, 44, 213–218. [Google Scholar] [CrossRef] [PubMed]
- The American Geriatrics Society Beers Criteria Update Expert Panel. American Geriatrics Society 2019 Updated AGS Beers Criteria(R) for Potentially Inappropriate Medication Use in Older Adults. J Am Geriatr Soc. 2019, 67, 674–694. [Google Scholar] [CrossRef] [PubMed]
- Li, R.; Geng, J.; Liu, J.; Wang, G.; Hesketh, T. Effectiveness of integrating primary healthcare n aftercare for older patients after discharge from tertiary hospitals – a systematic review and meta-analysis. Age and Ageing 2022, 51, 1–10. [Google Scholar] [CrossRef] [PubMed]
- Visade, F.; Babykina, G.; Lamer, A.; Defebvre, M.-M.; Verloop, D.; Ficheur, G.; Genin, M.; Puisieux, F.; Beuscart, J.-F. Importance of previous hospital stays on the risk of hospital re-admission in older adults: a real-life analysis of the PAERPA study population. Age & Ageing. 50, 141-146. [CrossRef]
- Visade FBabykina, G.; Puisieux, F.; Bloch, F.; Charpentier, A.; Delecluse, C.; Loggia, G.; Lescure, P.; Attier-Żmudka, J.; Gaxatte, C.; Deschasse, G.; Beuscart, J.-B. Risk Factors for Hospital Readmission and Death After Discharge of Older Adults from Acute Geriatric Units: Taking the Rank of Admission into Account. Clinical Interventions in Aging 2021, 16, 1931–1941. [Google Scholar] [CrossRef] [PubMed]
- Cornette, P.; Swine CMalhomme, B.; Gillet, J.-B.; Meert, P.; D’Hoore, W. Early evaluation of the risk of functional decline following hospitalization of older patients: development of a predictive tool. European Journal of Public Health. 2006, 16, 203–208. [Google Scholar] [CrossRef] [PubMed]
- Robinson, T.; Kerse, N. Medical readmissions amongst older New Zealanders: a descriptive analysis. N Z Med J 2012, 125, 24–34. [Google Scholar] [PubMed]
- Kutz, A.; Gut, L.; Ebrahimi, F.; Wagner, U.; Schuetz, P.; Mueller, B. Association of the Swiss diagnosis-related group reimbursement system, with length of stay, mortality, and readmission rates in hospitalized adult patients. JAMA Network Open 2019, 2, e188332. [Google Scholar] [CrossRef] [PubMed]
- Rajaguru, V.; Han, W.; Kim, T.H.; Shin, J.; Lee, S.G. LACE Index to Predict the High Risk of 30-Day Readmission: A Systematic Review and Meta-Analysis. J Pers. Med. 2022, 12, 545. [Google Scholar] [CrossRef] [PubMed]
- Pedersen, M.K.; Meyer, G.; Uhrenfeldt, L. Risk factors for acute care hospital readmission in older persons in Western countries: a systematic review. JBI Database Of Systematic Reviews And Implementation Reports. 2017, 15, 454–485. [Google Scholar] [CrossRef]
- Lanièce, I; Couturier, P. ; Dramé, M.; Gavazzi, G.; Lehman S.; Jolly D. et al. Incidence and main factors associated with early unplanned hospital readmission among French medical inpatients aged 75 and over admitted through emergency units. Age Ageing 2008, 37, 416–422. [Google Scholar] [CrossRef]
- Espallargues, M.; Philp, I.; Seymour, D.G.; Campbell, S.E.; Primrose, W.; Arino, S. Measuring case-mix and outcome for older people in acute hospital care across Europe: the development and potential of the ACMEplus instrument. QJM 2008, 101, 99–109. [Google Scholar] [CrossRef]
- Canadian Institute of Health Information. Resource Indicators: DAD Resource Intensity Weights And Expected Length Of Stay. https://www.cihi.ca/en/resource-indicators-dad-resource-intensity-weights-and-expected-length-of-stay0. Canadian Institute of Health Information https://www.cihi.ca/en/indicators/cost-of-a-standard-hospital-stay (accessed on 16 June 2023).
- Canadian Institute of Health Information Available online:. Available online: https://www.cihi.ca/en/resource-indicators-dad-resource-intensity-weights-and-expected-length-of-stay (accessed on 16 June 2023).
- Leppin, A.L.; Gionfriddo, M.R.; Kessler, M.; Brito, J.P.; Mair, F.S.; Gallacher, K. Preventing 30-day hospital readmissions: a systematic review and meta-analysis of randomized trials. JAMA Internal Medicine. 2014, 174, 1095–1107. [Google Scholar] [CrossRef]
- Briggs, A.M.; Valentijn, P.P.; Thiyagarajan, J.A.; Araujo de Carvalho, I. Elements of integrated care approaches for older people: a review of reviews. BMJ Open. 2018, 7, e021194. [Google Scholar] [CrossRef] [PubMed]
- Foot, H.; Scott, I.; Sturman, N.; Whitty, J.A.; Rixon, K.; Connelly, L.; Williams, I.; Freeman, C. Impact of pharmacist and physician collaborations in primary care on reducing readmission to hospital: A systematic review and meta-analysis. Research in social & administrative pharmacy 2022, 18, 2922–2943. [Google Scholar]
- O’Shaughnessy, I.; Robinson, K.; O’Connor, M.; Conneely, M.; Ryan, D.; Steed, F.; Carey, L.; Leahy, A.; Shanahan, E.; Quinn, C.; Galvin, R. Effectiveness of acute geriatric unit care on functional decline, clinical and process outcomes among hospitalised older adults with acute medical complaints: a systematic review and meta-analysis. Age & Ageing. 51, S1, 1-11. [CrossRef]
- Kelly, W.N.; Ho, M.J.; Bullers, K.; Klocksieben, F.; Kumar, A. Association of pharmacist counseling with adherence, 30-day readmission, and mortality: A systematic review and meta-analysis of randomized trials. JAPhA. 2021, 61, 340–350. [Google Scholar] [CrossRef] [PubMed]
- Renaudin, P.; Boyer, L.; Esteve, M.-E.; Bertault-Peres, P.; Auquier, P.; Honore, D. Do pharmacist-led medication reviews in hospitals help reduce hospital readmissions? A systematic review and meta-analysis. Br J Clin Pharmacol. 2016, 82, 1660–1673. [Google Scholar] [CrossRef] [PubMed]
- Fabbietti, P.; Di Stefano, G.; Moresi, R.; Cassetta, L.; Di Rosa, M.; Fimognari, F.; Bambara, V.; Ruotolo, G.; Castagna, A.; Ruberto, C.; Lattanzio, F.; Corsonello, A. Impact of potentially inappropriate medications and polypharmacy on 3-month readmission among older patients discharged from acute care hospital: a prospective study. Aging Clin Exp Res. [CrossRef]
- Counter, D.; Millar, J.W.T.; McLay, J.S. Hospital Readmissions, Mortality and Potentially Inappropriate Prescribing: A Retrospective Study of Older Adults Discharged From Hospital. Br J Clin Pharmacol. 2018, 84, 1757–1763. [Google Scholar] [CrossRef] [PubMed]
- Thomas, R.E. Improving the Care of Older Patients by Decreasing Potentially Inappropriate Medications, Potential Medication Omissions, and Serious Drug Events Using Pharmacogenomic Data about Variability in Metabolizing Many Medications by Seniors. Geriatrics 2020, 5. [Google Scholar] [CrossRef] [PubMed]
- Thomas, R.E. Optimising Seniors’ Metabolism of Medications and Avoiding Adverse Drug Events Using Data on How Metabolism by Their P450 Enzymes Varies with Ancestry and Drug–Drug and Drug–Drug–Gene Interactions. Journal of Personalized Medicine 2020, 10, 84. [Google Scholar] [CrossRef] [PubMed]
Figure 1.
Prescription/Admission time windows used for analysis.
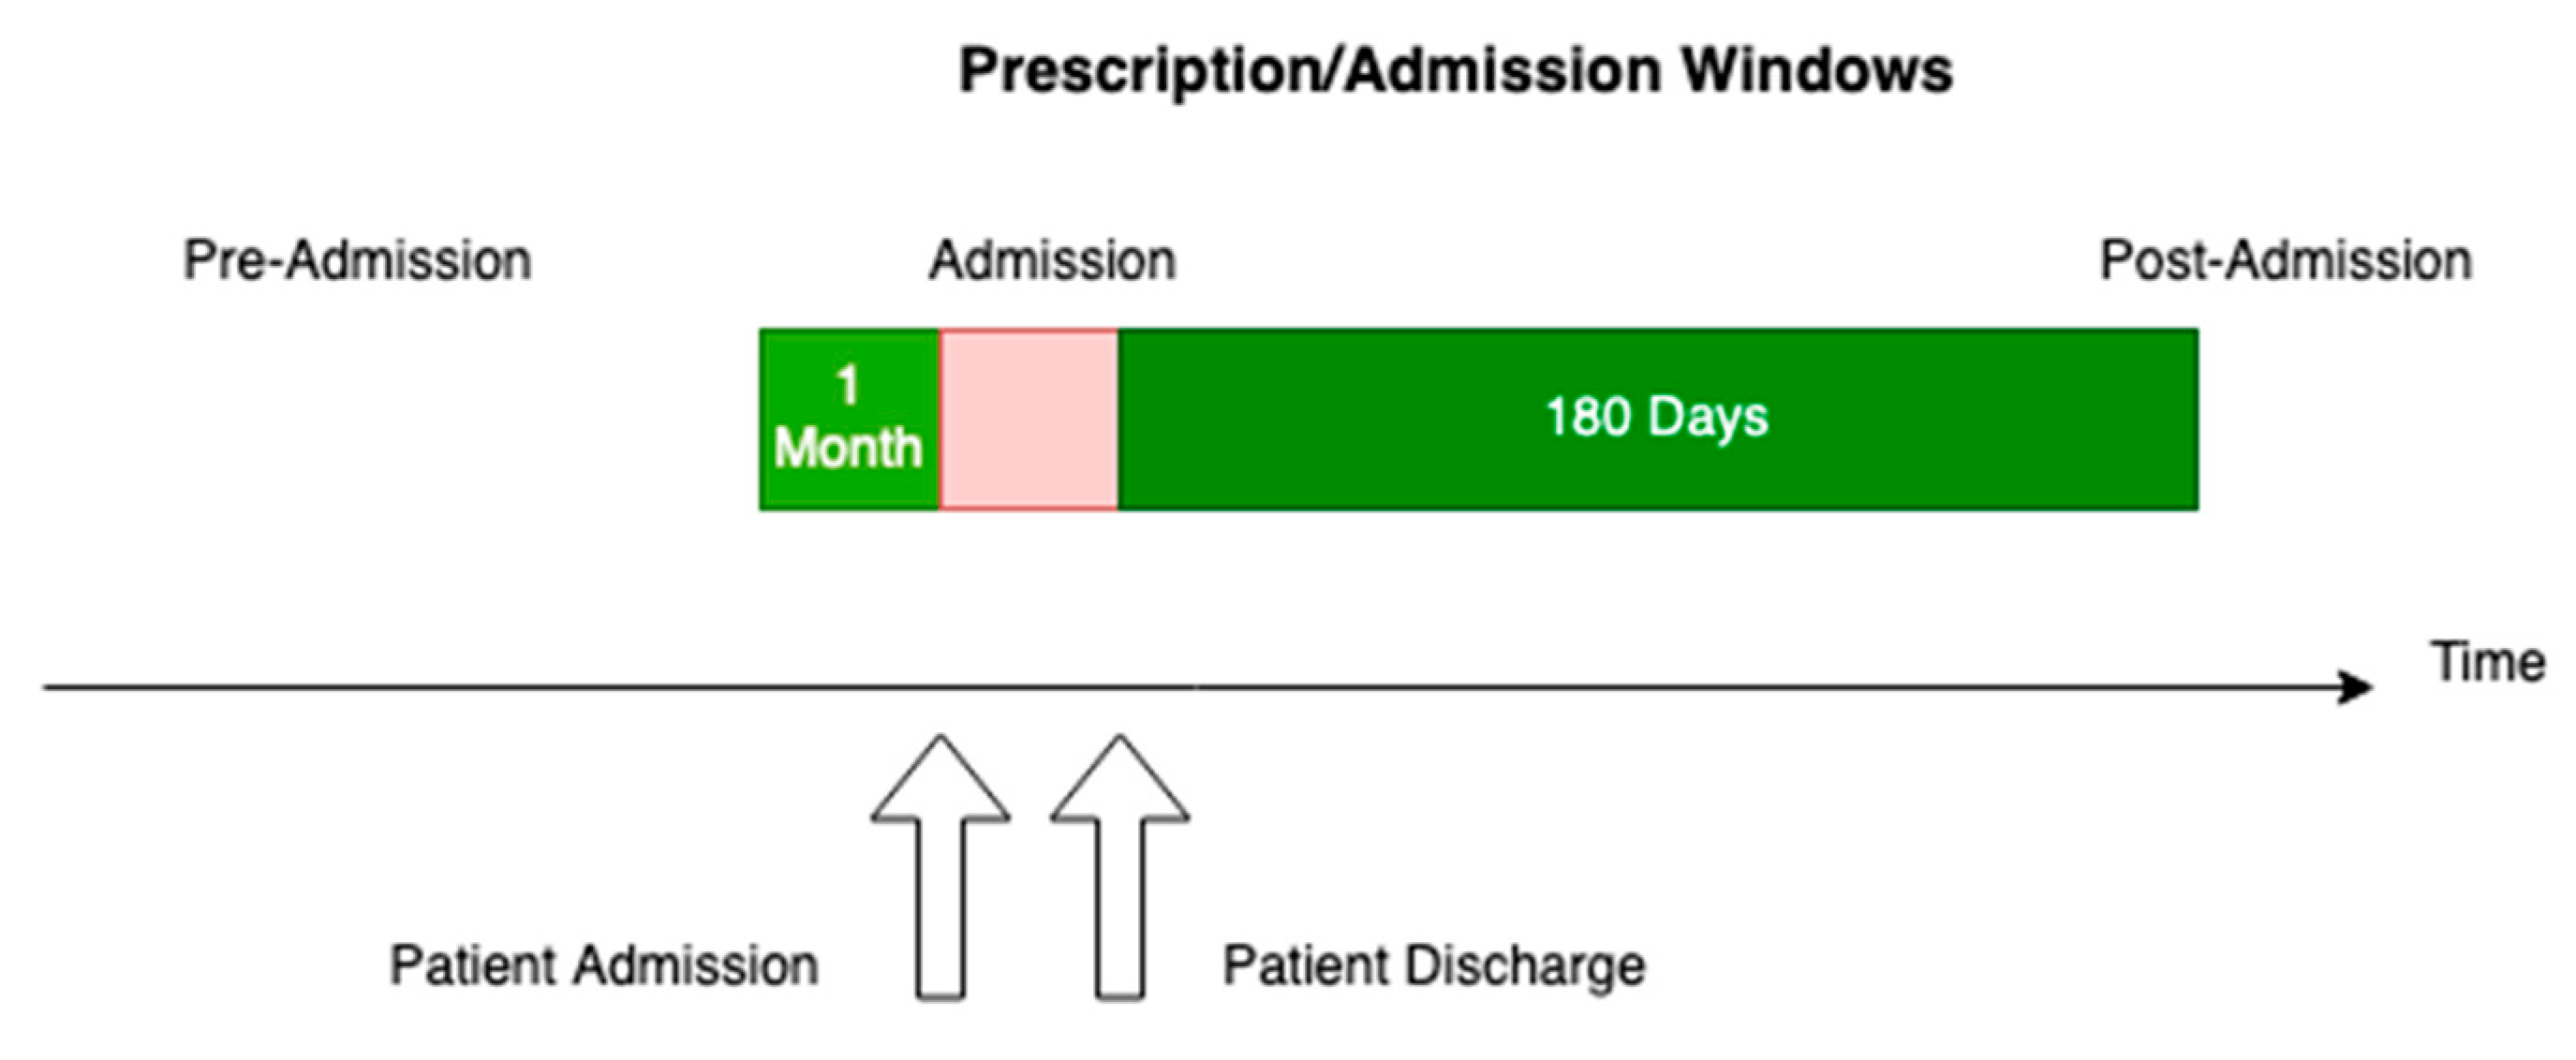
Figure 2.
Diagnoses for each admission by number of the admissions (Top 20).
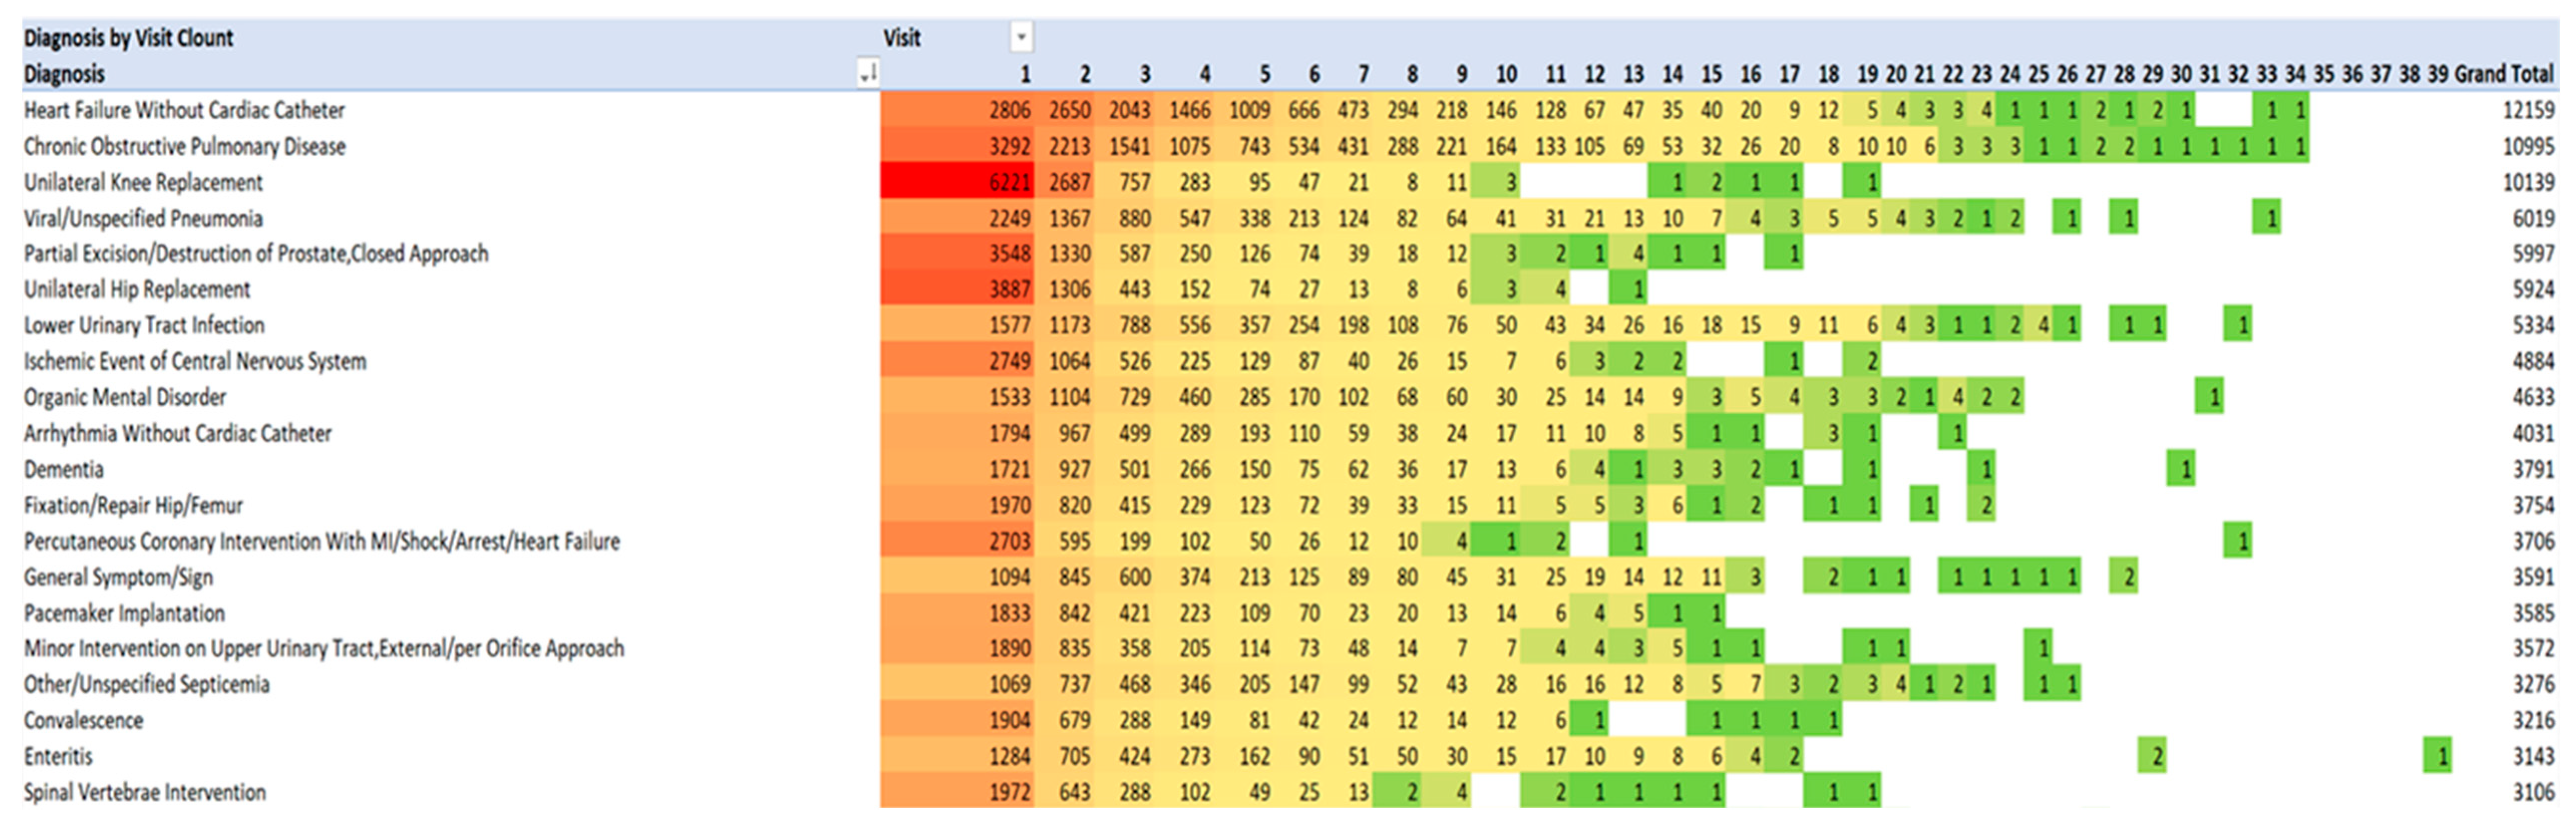
Figure 3.
Diagnoses using Medical Council of Canada diagnostic categories.

Figure 4.
Numbers of medications Pre-Admission and on Discharge.
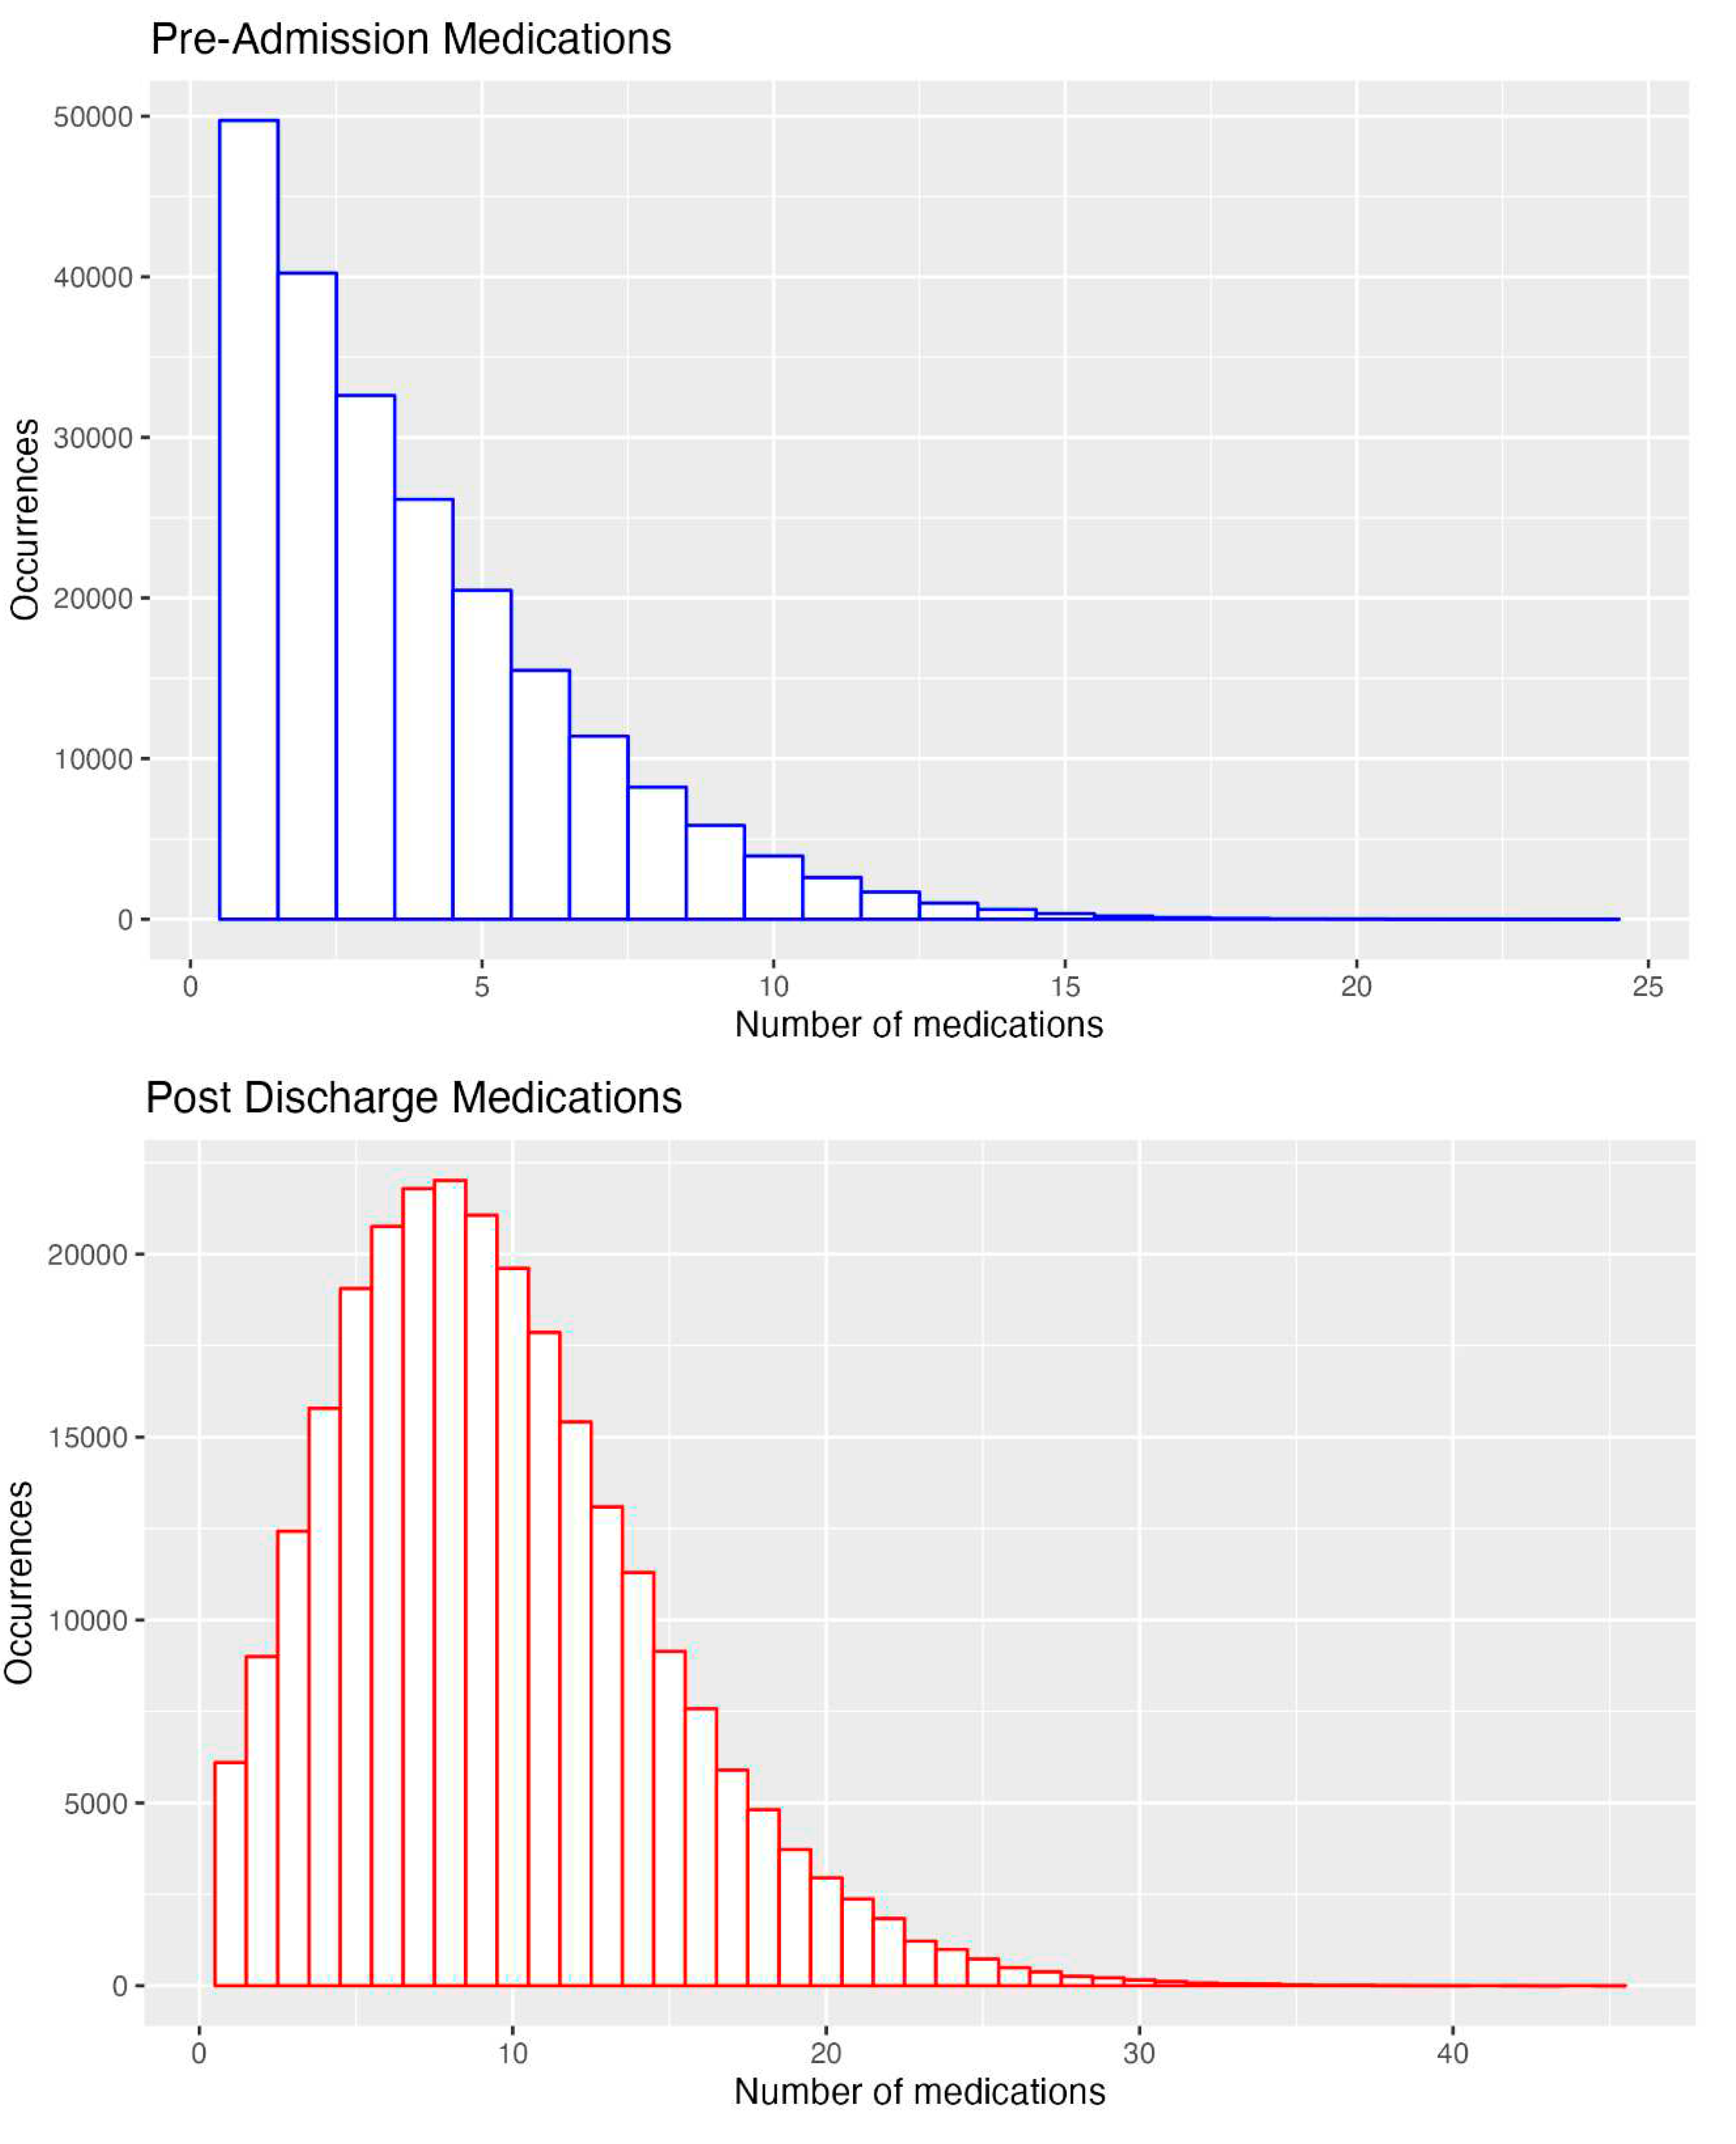
Figure 5.
Costs of admissions measured by Resource Intensity Weighting (RIW) – Top 30.
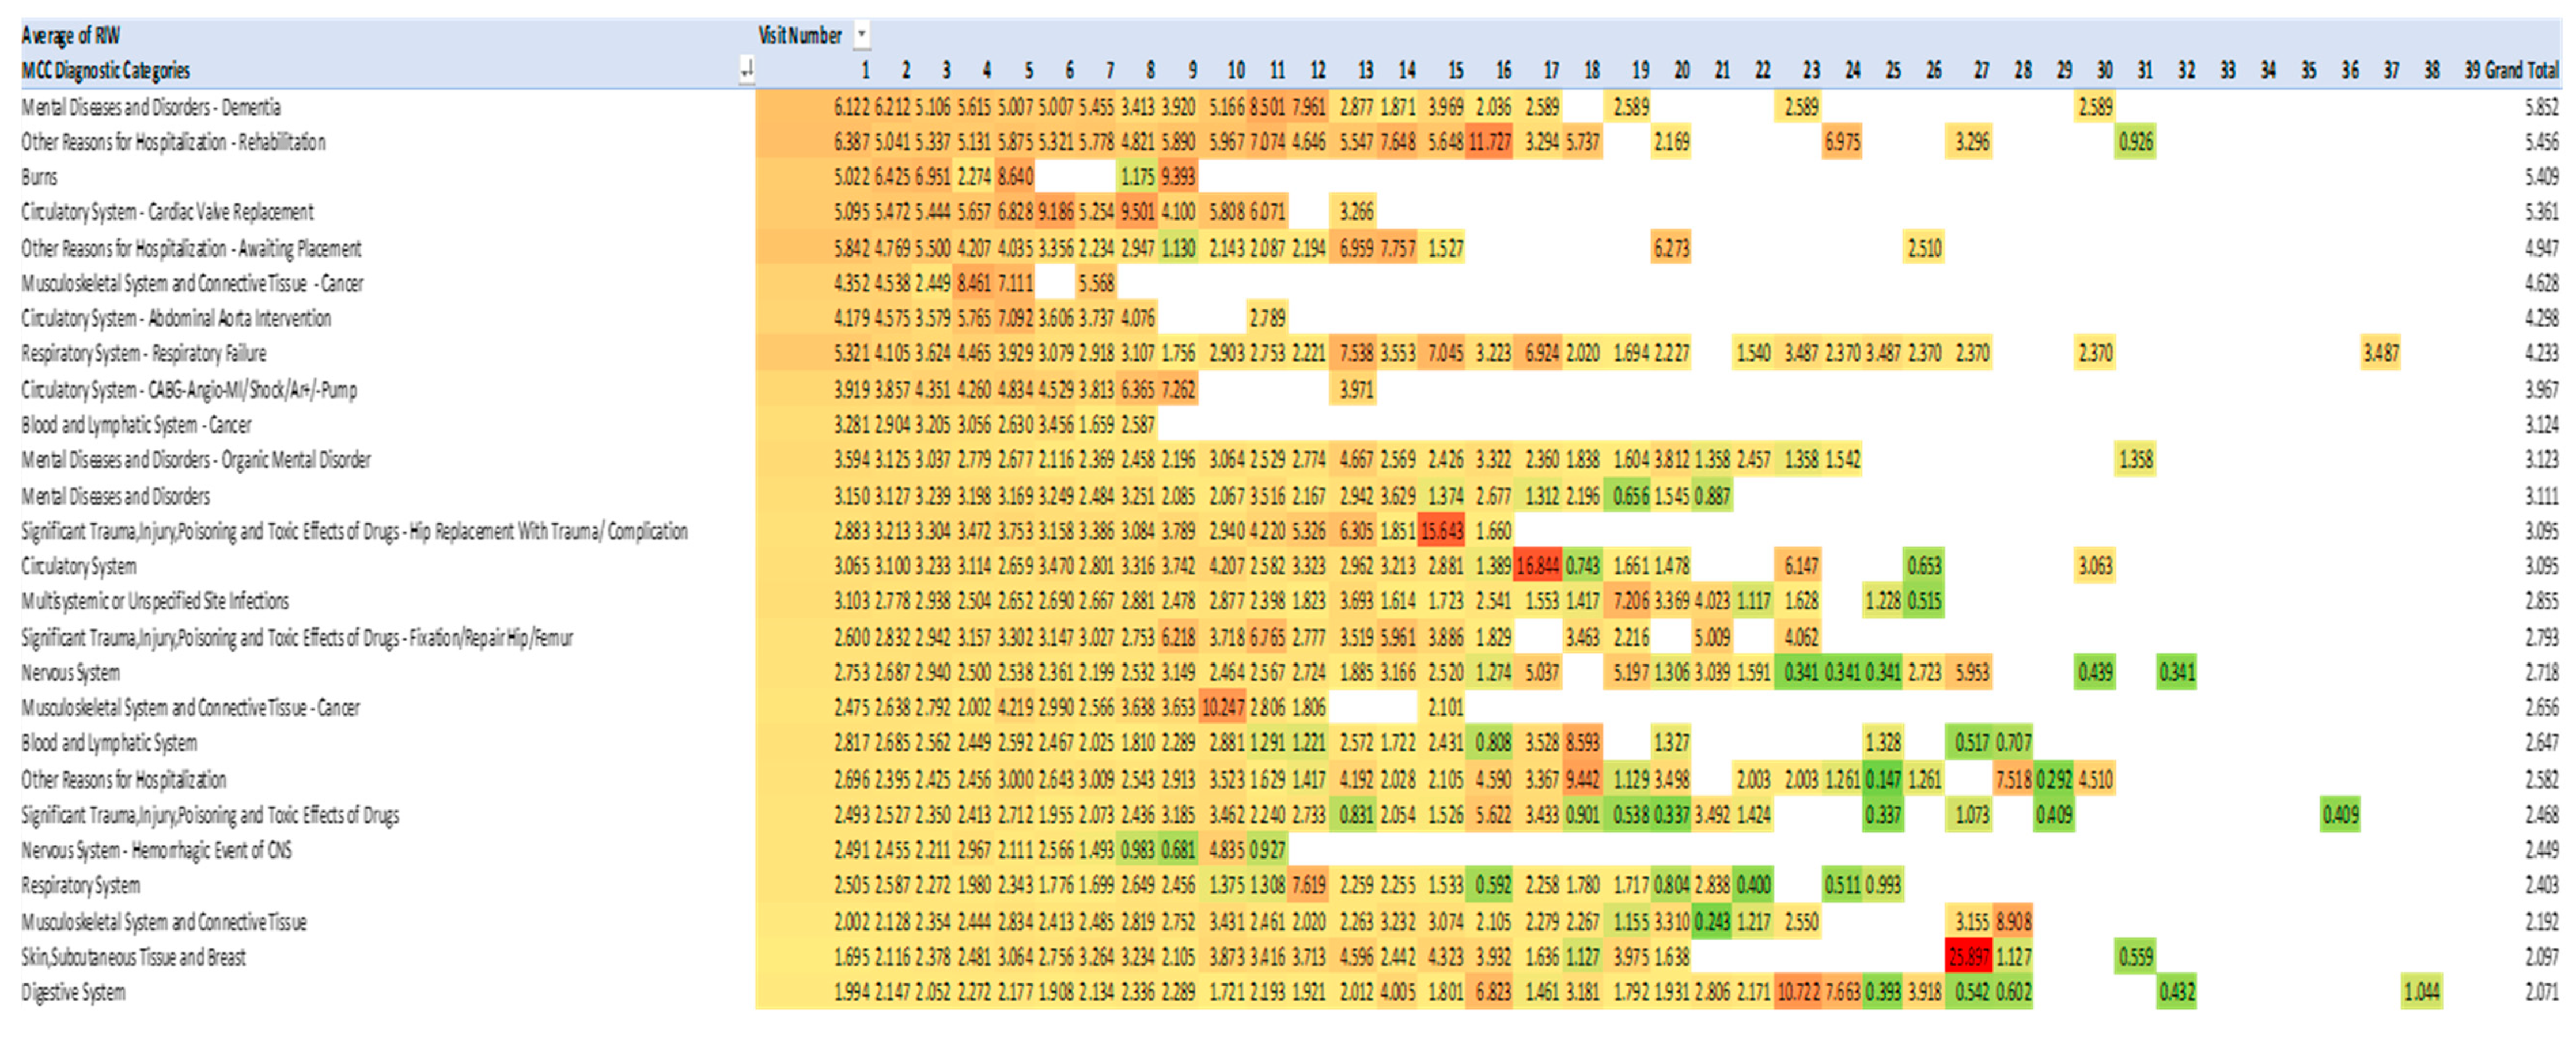
Figure 6.
Destinations after discharge. [For visual clarity percentages are presented as integers. The 0% is the category for prisoners referred directly from jail and discharged directly back from hospital to jail (6 prisoners)].
Figure 6.
Destinations after discharge. [For visual clarity percentages are presented as integers. The 0% is the category for prisoners referred directly from jail and discharged directly back from hospital to jail (6 prisoners)].
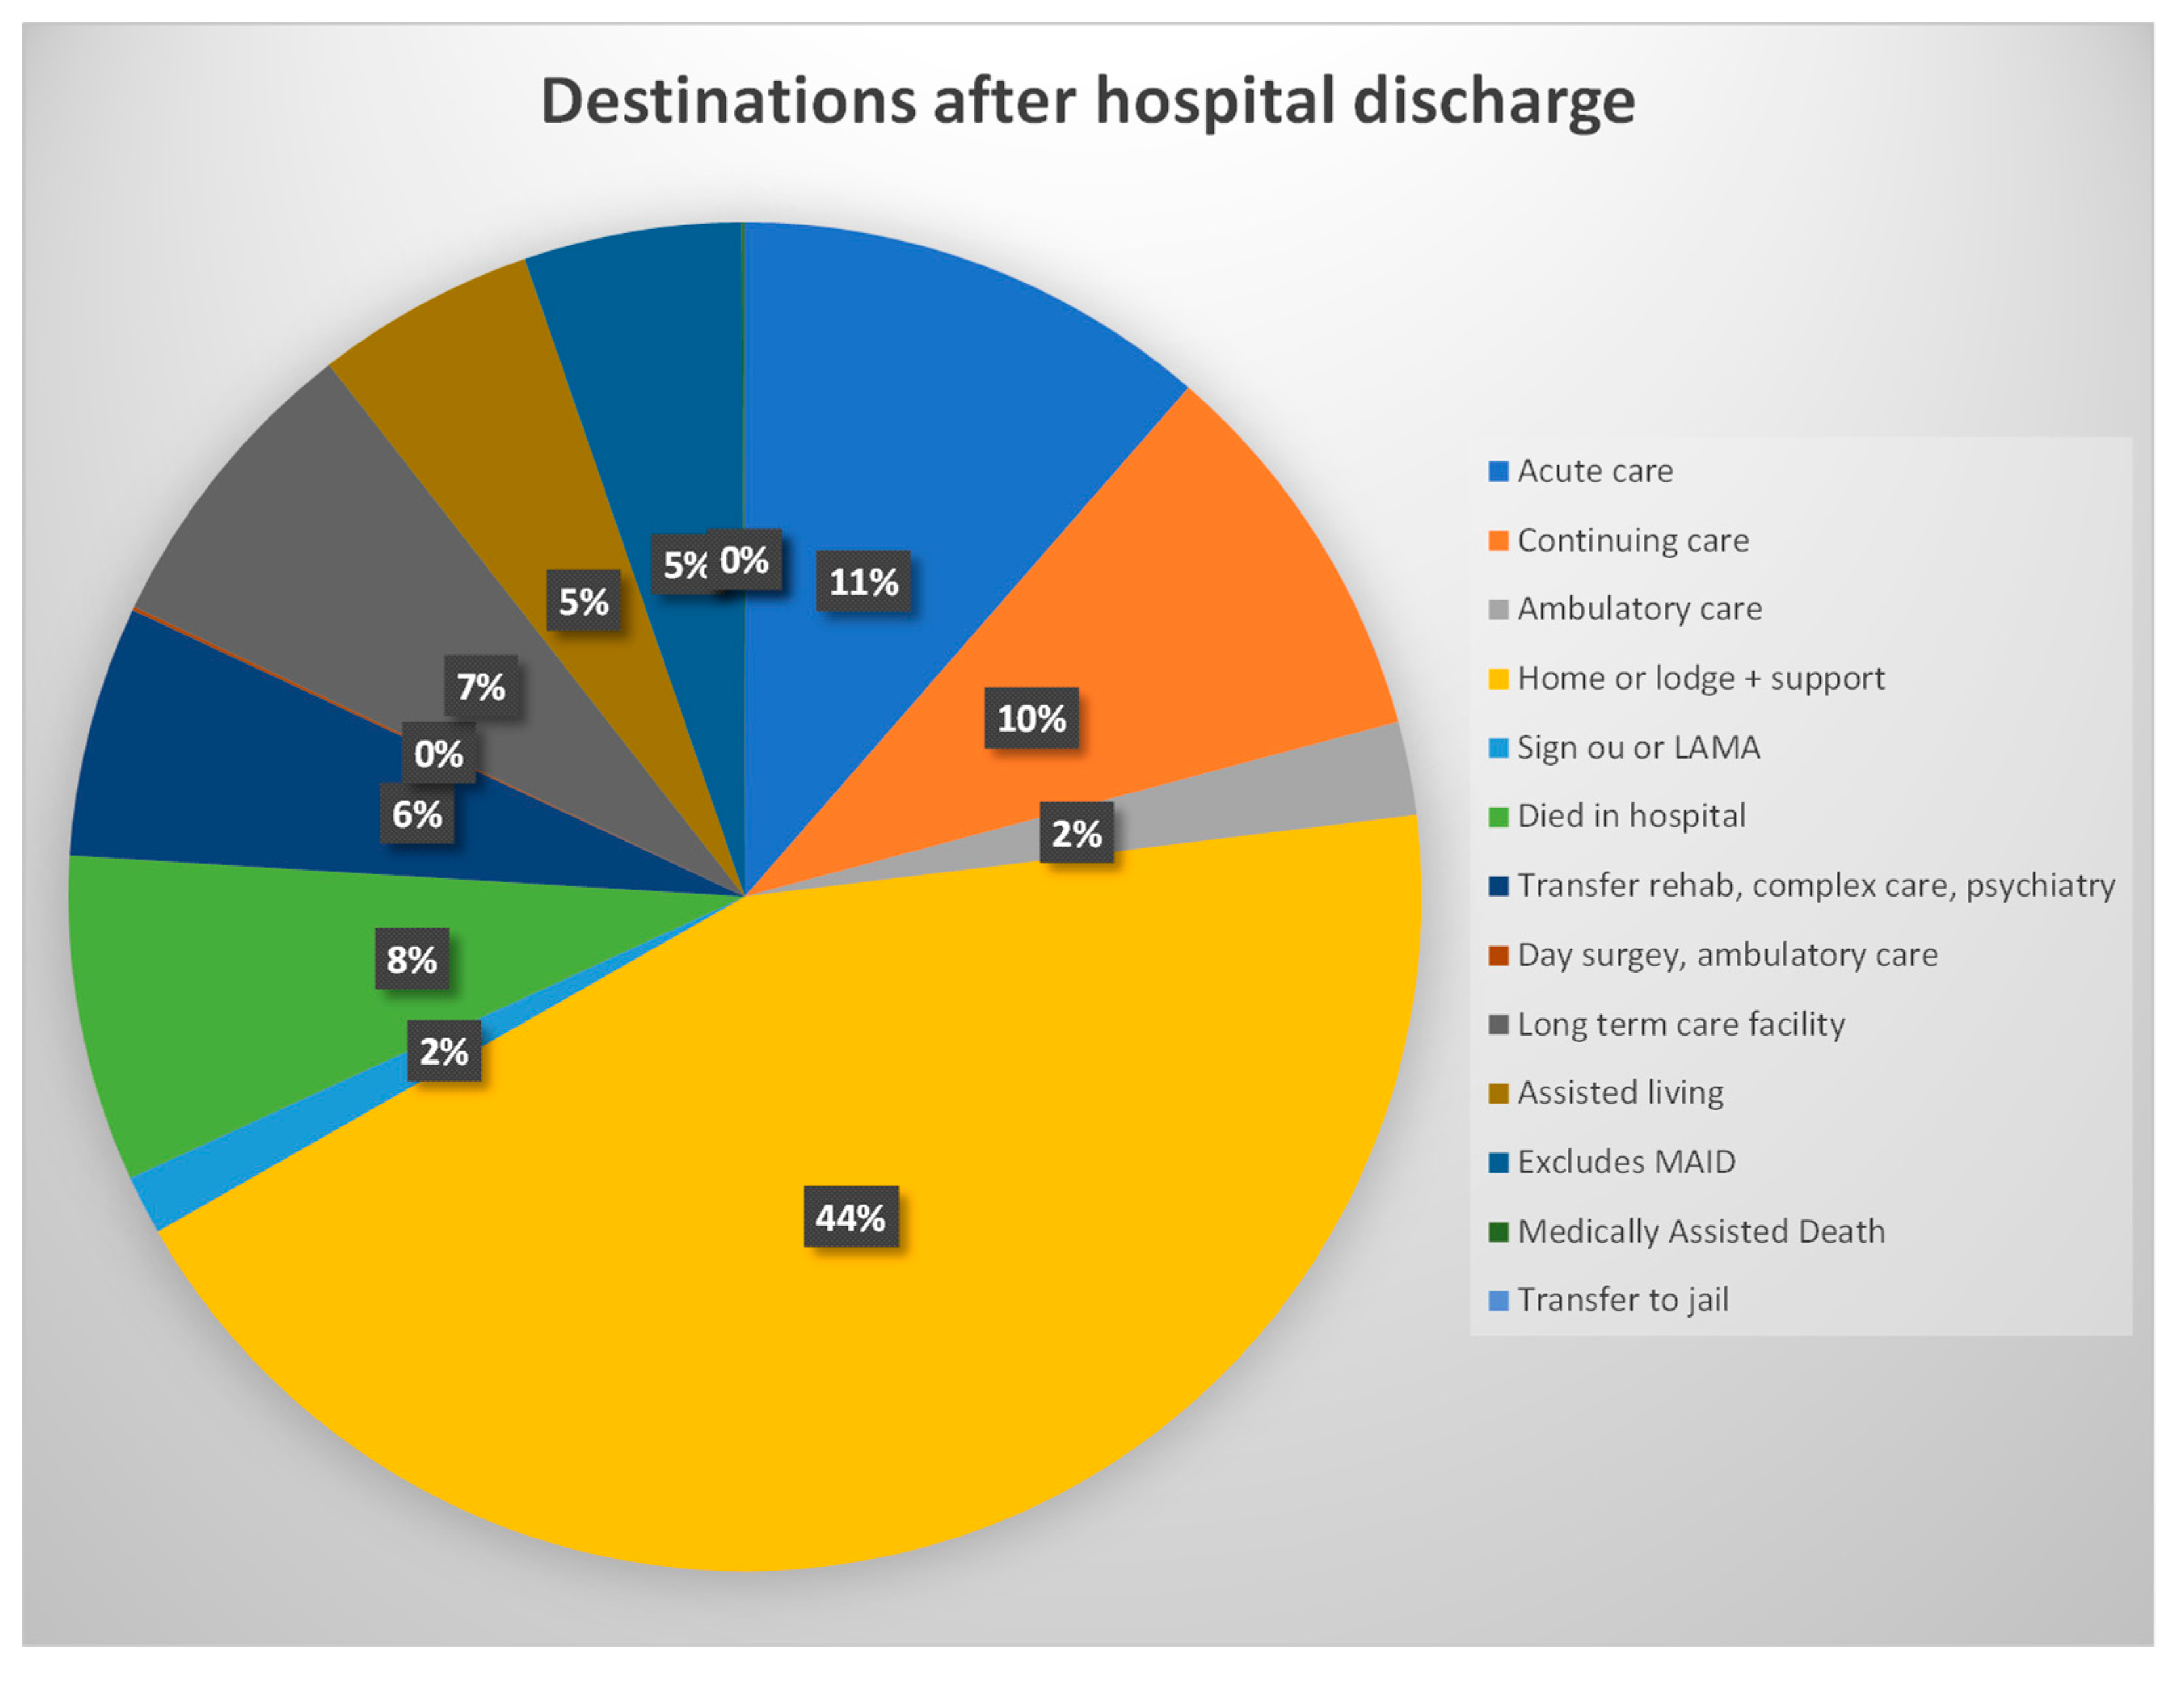

Table 1.
Summary characteristics for patients on first admission to four acute care Calgary hospitals, 2013-2021.
Table 1.
Summary characteristics for patients on first admission to four acute care Calgary hospitals, 2013-2021.
| Both Genders | Female | Male | ||
|---|---|---|---|---|
| Number of patients (%) | 129443 (100%) | 64621(49.92%) | 64822(50.08%) | |
| Age group at first admission | ||||
| 65-69 | 45244(27.39%) | 20500(15.84%) | 24744 (19.12%) | |
| 70-74 | 26042(20.09) | 12409 (9.59%) | 13633(10.53%) | |
| 75-79 | 21526((17.78%) | 10750(8.30%) | 10766 (8.32%) | |
| 80-84 | 18125(16.11%) | 9647 (7.45%) | 8478 (6.55%) | |
| 85-89 | 12138(11.93%) | 7027(5.43%) | 5111(3.95%) | |
| 90+ | 6368 (6.68%) | 4288 (3.31%) | 2080(1.61%) | |
| Total Visits 285201 | ||||
| For entire data set | ||||
| Median Age | 76 | 77 | 75 | |
| IQR (Age) | 13 | 14 | 13 | |
| Medicines upon admission | ||||
| Median | 3 | 3 | 3 | |
| IQR | 3 | 3 | 3 | |
| Maximum | 24 | 23 | 24 | |
| Medicines upon discharge | ||||
| Median | 9 | 9 | 9 | |
| IQR | 7 | 7 | 6 | |
| Readmission | 82524(28.93%) | 38953 (13.65%) | 43571 (15.27%) | |
| Mortality | 41479 (14.54%) | 19554 (6.85%) | 21925 (7.68%) | |
Table 2.
Number of admissions per patient 2013-2021, four acute care Calgary hospitals.
| Admission no |
Number of patients | Admission no |
Number of patients | Admission no |
Number of patients | |||||||
|---|---|---|---|---|---|---|---|---|---|---|---|---|
| Female | Male | Total | Female | Male | Total | Female | Male | Total | ||||
| 1 | 64622 | 64821 | 129443 | 14 | 214 | 200 | 414 | 27 | 8 | 9 | 17 | |
| 2 | 31714 | 32727 | 64441 | 15 | 166 | 152 | 318 | 28 | 7 | 8 | 15 | |
| 3 | 17154 | 18052 | 35206 | 16 | 106 | 108 | 214 | 29 | 7 | 8 | 13 | |
| 4 | 9809 | 10545 | 20354 | 17 | 80 | 79 | 159 | 30 | 7 | 5 | 12 | |
| 5 | 5820 | 6451 | 12271 | 18 | 56 | 61 | 117 | 31 | 6 | 4 | 10 | |
| 6 | 3540 | 4037 | 7577 | 19 | 49 | 52 | 101 | 32 | 5 | 3 | 8 | |
| 7 | 2338 | 2577 | 4915 | 20 | 33 | 44 | 77 | 33 | 2 | 3 | 5 | |
| 8 | 1524 | 1726 | 3250 | 21 | 21 | 31 | 52 | 34 | 2 | 2 | 4 | |
| 9 | 1034 | 1131 | 2165 | 22 | 16 | 22 | 38 | 35 | 2 | 1 | 3 | |
| 10 | 717 | 777 | 1494 | 23 | 13 | 17 | 30 | 36 | 2 | 1 | 3 | |
| 11 | 534 | 551 | 1085 | 24 | 13 | 17 | 30 | 37 | 1 | 1 | 2 | |
| 12 | 379 | 378 | 757 | 25 | 11 | 14 | 25 | 38 | 1 | 1 | 2 | |
| 13 | 271 | 282 | 553 | 26 | 8 | 11 | 19 | 39 | 1 | 1 | 2 | |
| TOTAL | 140,293 | 144,908 | 285201 | |||||||||
Table 3.
Numbers of first admissions, readmissions, deaths in hospital, length of stay, deaths in next 6 months, and risk of readmission.
Table 3.
Numbers of first admissions, readmissions, deaths in hospital, length of stay, deaths in next 6 months, and risk of readmission.
| Admi ssion |
Patients | Mort ality in hospital |
% died in hospital | Read mitted within 6 months |
% read mitted within 6 months |
Died within 6 months | % died within 6 months | Average stay (days) | Relative risk of read mission |
|---|---|---|---|---|---|---|---|---|---|
| 1 | 129443 | 3919 | 3.03% | 28292 | 21.9% | 12144 | 9.4% | 9.8 | |
| 2 | 64441 | 2947 | 4.57% | 18157 | 28.2% | 9427 | 14.6% | 11.6 | 49.8% |
| 3 | 35206 | 2049 | 5.82% | 11585 | 32.9% | 6500 | 18.5% | 12.6 | 54.6% |
| 4 | 20354 | 1414 | 6.45% | 7576 | 37.2% | 4450 | 21.9% | 13.2 | 57.8% |
| 5 | 12271 | 885 | 7.21% | 4982 | 40.6% | 2948 | 24% | 13.8 | 60.3% |
| 6 | 7577 | 546 | 7.21% | 3422 | 45.2% | 1882 | 24.9% | 13 | 61.8% |
| 7-39 | 15909 | 1200 | 7.54% | 8510 | 53.5% | 4128 | 26% | 11.7 | 65-100% |
Table 4.
All admissions. Gender, age, comorbidities, numbers of medications, PIMs, PPOs, Charlson Index and Resource Intensive Weighting (RIW) and correlations with readmission or mortality within 6 months of discharge (data for 285201 admissions).
Table 4.
All admissions. Gender, age, comorbidities, numbers of medications, PIMs, PPOs, Charlson Index and Resource Intensive Weighting (RIW) and correlations with readmission or mortality within 6 months of discharge (data for 285201 admissions).
| Risk factor. | Readmission within 6 months | Mortality within 6 months | |||||
|---|---|---|---|---|---|---|---|
| Unadjusted ORs and 95%CIs | |||||||
| OR | 95%CI | p | OR | 95%CI | p | ||
| Gender | 1.12 | 1.10-1.14 | <.001 | 1.10 | 1.08-1.12 | <.001 | |
| Age at admission | 1.01 | 1.01-1.01 | <.001 | 1.07 | 1.07-1.07 | <.001 | |
| Number of comorbidities | 1.01 | 1.01-1.01 | <.001 | 1.19 | 1.18-1.19 | <.001 | |
| Post admission Rx number | 1.05 | 1.04-1.05 | <.001 | 1.19 | 1.18-1.19 | <.001 | |
| Total STOPP PIMs | 1.17 | 1.17-1.17 | <.001 | 1.04 | 1.03-1.04 | <.001 | |
| START Omissions not corrected | 1.58 | 1.55-1.61 | <.001 | 2.16 | 2.11-2.21 | <.001 | |
| START Omissions correctly prescribed | 1.50 | 1.47-1.52 | <.001 | 0.99 | 0.97-1.01 | .189 | |
| AGS Beers PIMs | 1.11 | 1.1-1.12 | <.001 | 1.09 | 1.09-1.10 | <.001 | |
| Charlson Index | 1.09 | 1.08-1.09 | <.001 | 1.43 | 1.42-1.43 | <.001 | |
| ORs and 95%CIs adjusted for age at admission, gender (male) and comorbidities | |||||||
| Risk factor | OR | 95%CI | p | OR | 95%CI | p | |
| Post admission Rx number | 1.12 | 1.12-1.12 | <.001 | 1.04 | 1.04-1.05 | <.001 | |
| Total STOPP PIMs | 1.16 | 1.15-1.16 | <.001 | 0.99 | 0.96-1.00 | <.001 | |
| START Omissions not corrected | 1.39 | 1.35-1.42 | <.001 | 1.56 | 1.50-1.63 | <.001 | |
| START Omissions correctly prescribed | 1.26 | 1.23-1.30 | <.001 | 0.51 | 0.49-0.53 | <.001 | |
| AGS Beers PIMs | 1.11 | 1.11-1.11 | <.001 | 1.08 | 1.07-1.08 | <.001 | |
Data for the numbers of admissions are derived from three files LAB_UC-2022, PIN-US_2022 and DAD_UC_2022 with DAD-UC-2022 containing 295,236 admission records.
Disclaimer/Publisher’s Note: The statements, opinions and data contained in all publications are solely those of the individual author(s) and contributor(s) and not of MDPI and/or the editor(s). MDPI and/or the editor(s) disclaim responsibility for any injury to people or property resulting from any ideas, methods, instructions or products referred to in the content. |
© 2023 by the authors. Licensee MDPI, Basel, Switzerland. This article is an open access article distributed under the terms and conditions of the Creative Commons Attribution (CC BY) license (http://creativecommons.org/licenses/by/4.0/).
Copyright: This open access article is published under a Creative Commons CC BY 4.0 license, which permit the free download, distribution, and reuse, provided that the author and preprint are cited in any reuse.


