
Submitted:
23 August 2023
Posted:
28 August 2023
You are already at the latest version
Abstract
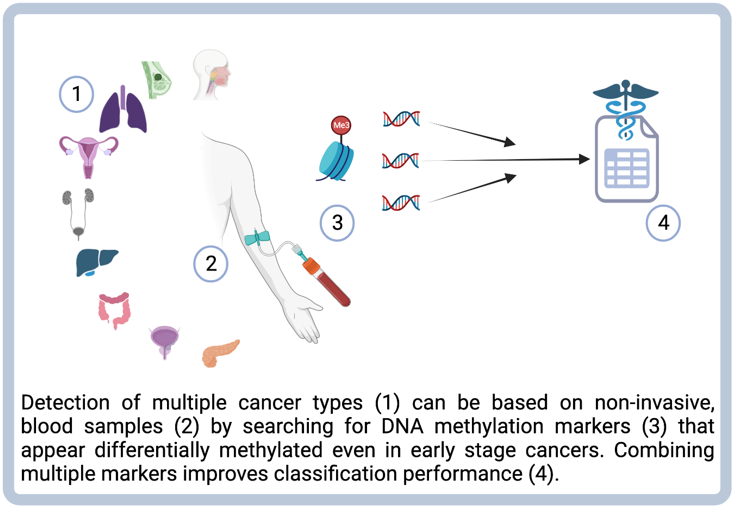
Abstract: The ability to detect several types of cancer using a non-invasive, blood-based test holds the potential to revolutionize oncology screening. We mined tumor methylation array data from the Cancer Genome Atlas (TCGA) covering 14 cancer types and identified two novel, broadly oc-curring methylation markers at TLX1 and GALR1. To evaluate their performance as a general-ized blood-based screening approach, along with our previously reported methylation bi-omarker, ZNF154, we rigorously assessed each marker individually or combined. Utilizing the TCGA methylation data and applying logistic regression models within each individual cancer type, we found that the three-marker combination significantly increased the average area under the ROC curve (AUC) across the 14 tumor types compared to single markers (p= 1.158e-10; Friedman test). Furthermore, we simulated dilutions of tumor DNA into healthy blood cell DNA and demonstrated increased AUC of combined markers across all dilution levels. Finally, we evaluated assay performance in bisulfite sequenced DNA from patient tumors and plasma, in-cluding early-stage samples. When combining all three markers the assay achieved 100% sensi-tivity and specificity, as demonstrated in lung cancer plasma samples. In patient plasma from hepatocellular carcinoma, ZNF154 alone yielded the highest combined sensitivity and specificity values averaging 68% and 72%, whereas multiple markers could achieve higher sensitivity or specificity, but not both. Altogether this study presents a comprehensive pipeline for the identifi-cation, testing and validation of multi-cancer methylation biomarkers with a considerable poten-tial for detecting a broad range of cancer types in patient blood samples.
Keywords:
Liquid biopsy
; DNA methylation
; biomarker
; cancer
; multi-cancer
; bisulfite sequencing
; diagnostics
; screening
1. Introduction
The negative impact of COVID-19 resulted in an estimated 10 million missed cancer screenings in the first six months of 2020 [1] and an 11% increase in diagnoses at inoperable or metastatic timepoints in the last ten months of the year [2]. COVID-19 notwithstanding, the lifetime risk of developing any type of cancer in the United States is 43% for men and 33% for women [3]. Despite this relatively high incidence, most cancer types completely lack effective tests suitable for general screening. Routine cancer screening, recommended for a few cancer types, includes colon, rectum, breast, and cervix per the American Cancer Society and the US Preventive Services Task Force [4]. Additionally, lung cancer, the most prevalent cancer, affects more than 200,000 individuals annually, but the screening test has qualifiers – individuals must be aged 50 to 80 years and have a 20 pack-year smoking history [5].
The absence of generalized cancer screening combined with lack of patient adherence to available testing contributes to the problem of a higher prevalence of tumors being detected at late stages, which in turn is known to produce poor survival rates in these patient populations [6]. In addition to these considerations, screening for most individual cancer types remains impractical because their low incidence rates coupled with low specificity tests increases the false positive to true positive ratio. Barriers to effective screening explain why cancers continue to be diagnosed at late stages of disease where treatment efficacy remains limited, medical costs increase dramatically, and 5-year survival rates diminish [7].
New, non-invasive, and affordable screening tests are urgently needed that can reliably detect more cancer types, at stages early enough to provide effective treatment [8,9]. Blood-based tests, known as liquid biopsies, are emerging to fill this gap. Indeed, a simple blood sample can provide access to a plethora of analytes such as cell-free DNA (cfDNA), proteins, and circulating tumor cells (CTCs) [10]. With minimal characteristics for patient discomfort, test invasiveness, and time required, these tests could complement the current diagnostic modalities of imaging, tissue biopsy and exploratory surgery.
Detection of markers with high sensitivity and specificity for widespread cancer screening is the current challenge in the field. Although many cancer detection tests target somatic mutations in cfDNA with the expectation of exclusivity to tumor cells, differences in driver mutations per individual tumors reduce test sensitivity [11,12,13]. Therefore, generalized, multi-cancer screening using somatic mutations requires large biomarker panels, inclusive of hundreds to thousands of marker sites to catch multiple cancer types with rigor. These tests also suffer false positives from mutations carried in clonal hematopoietic cells, which contain known driver mutations that are not present in the solid tissue tumors [14]. In contrast to the pitfalls of somatic mutation testing, DNA hypermethylation sites can occur consistently across individual tumors originating from the same organ and in different cancer types [15,16,17,18]. Our prior work indicates that methylation-based biomarkers are more reliable for cancer detection and, as we show here, represent ideal sources for a generalized approach to detecting multiple types of cancer.
Previously, we reported a promising multi-cancer methylation biomarker, ZNF154, which is hypermethylated in at least 14 different cancer types in The Cancer Genome Atlas (TCGA) of tumor data [19,20]. Importantly, we demonstrated a higher incidence of ZNF154 hypermethylation compared to panels of somatic driver mutations, underscoring the utility of a multi-cancer, DNA methylation biomarker [21]. Utilizing a PCR-based, digital detection approach we demonstrated identification of late-stage ovarian cancer and early- and late-stage pancreatic cancer from 1-2 milliliters of patient plasma [21,22]. However, as some tumors were missed by the marker, we predicted that cancer detection by ZNF154 could be improved by combination with additional multi-cancer methylation biomarkers.
In this study we mined the TCGA methylation data from 14 cancer types and identified two additional methylation markers for use in combinatorial testing, found in GALR1 and TLX1. While novel pan-cancer markers like these continue to emerge, the need for preliminary validation methods prior to initiating extensive laboratory testing intensifies. Therefore, the objective of this study was not only to validate the three markers individually and combined, but also to explore strategies for testing the biomarkers in a more blood-related context prior to processing of plasma samples. The goal of this approach is to detect a broad spectrum of tumor types. Naturally, this calls for additional, more advanced follow-up tests, enabling identification of the tumor tissue of origin, which however will not be the scope of the present study. Exploiting the large number of tumor samples contained in the TCGA database we were able to assess multi-cancer detection performance across 14 cancer types, with cross validation and validation in four independent cancer datasets, creating a solid foundation for the identified biomarkers. In addition to simulating dilutions of the TCGA data with tumor DNA concentrations ranging from 100-1%, also with cross validation, we tested different thresholds used in calling a positive test. We evaluated this approach in terms of the analytical performance criteria, sensitivity and specificity. We also demonstrated the beneficial effect of combining markers on the positive predictive value (PPV). Finally, we tested the marker combinations in two cohorts of patient plasma samples using bisulfite treated cfDNA sequencing data previously generated from lung and liver cancer patient samples. We ultimately provide a complete workflow generating supportive evidence for the further implementation of these three markers into a multi-cancer detection assay.
2. Materials and Methods
2.1. The samples and datasets
The Cancer Genome Atlas (TCGA) data and ENCODE cell line data were collected as described in Sanchez-Vega et al. [19]. In brief, we downloaded level 3 data for 15 different cancer types from the TCGA data portal (https://tcga-data.nci.nih.gov/tcga/). Data had been acquired using the Illumina HumanMethylation450K platform and had been pre-processed following TCGA level 3 standard protocols. We discarded all probes that were located on chromosomes X and Y, as well as all data points that were masked as NA (‘Not Available’). Data frozen October 1, 2013 were BMIQ normalized [23]. Thyroid cancer was excluded from the dataset since previous work did not show differentially methylated probes within this tumor type. 2,711 peripheral whole blood cell samples representing male and female donors, ages 35–80 years were from GEO dataset GSE55763 [24]. Independent sets of Illumina Infinium human methylation array data from breast cancer samples (n= 450) and normal tissue (n=149) were pooled together from three GEO data sets (GSE37754 [25], GSE66695 [26], and GSE69914 [27]). Illumina Infinium human methylation array data from colon cancer samples (n=35) and normal tissue (n=18), and lung adenocarcinoma samples (n=9) and normal tissue (n=11) came from GEO dataset GSE53051 [28]. Prostate cancer data came from GSE112047, with data collected from tumor (n=31) and normal tissues (n=16) [29]. All Illumina Infinium data were processed as described for the TCGA data. Breast tumor (n=40) and normal breast tissue DNA (n=8) were obtained from AMSBio (Cambridge, MA) as reported in Margolin et al. 2016 [20]. Each well contained 5 µL genomic DNA at approximately 4 ng/µL, yielding 20 +/-3 ng genomic DNA per sample (mean +/-SD). Experimental datasets comprising whole genome bisulfite sequencing (WGBS) from cell free DNA of plasma were from lung cancer (n=9) or normal plasma (non-cancer samples) (n=4) [30,31]. The nine lung cancer plasma samples covered 6 cases of adenocarcinoma (stage 1A or 1B), one case of non-small cell carcinoma (stage IIIA/IV), one case of squamous cell carcinoma (stage unknown), and one case of benign fibroelastotic scar [30]. Additional WGBS data from plasma of liver cancer (n=26+4) or healthy individuals (n=32) was obtained from [31,32]. Liver cancer plasma samples covered 25 samples with BCLC stage A (early stage), 1 sample with BCLC stage B (intermediate stage), and 4 samples of unknown stage [32].
2.2. Probe identification
We assessed differential methylation in all positions on the Illumina 450K methylation array data, using data from 4,050 tumors and 646 normal samples provided by TCGA in 14 cancer types. Processing 485,577 probe positions on the array in one tumor type at a time, we searched for CpG sites whose absolute differences in mean and median methylation beta values between tumors and normal samples were above 0.4, and with significant p-values from both t-test and Wilcoxon rank sum tests after Bonferroni-correction. The Wilcoxon test constraint was removed for three tumor types (pancreatic, rectal, and stomach adenocarcinoma), where no probes would otherwise have been identified. The genomic coordinate for the GALR1 probe cg03502002 in hg19 is chr18: 74,962,134. For TLX1, the genomic coordinate for probe cg14861089 in hg19 is chr10: 102,895,044, and the ZNF154 probe cg21790626 is located at chr19:58,220,494. In Figure 1, the GALR1 locus window coordinates are chr18:74961138−74962794 and contain 25 CpGs, the TLX1 window coordinates are chr10:102894120−102895708 and contained 9 CpGs, the ZNF154 window coordinates are chr19:58211993−58220837 and contain 12 CpGs (all in hg19).
2.3. Sensitivity, specificity, and sample classification in TCGA data
Logistic regression models were trained using methylation levels from one, two, or three markers as covariates (additive effect) for all 14 cancer types individually (coefficients for each covariate can be found in Table S1). Next, receiver operating characteristic (ROC) curves were built with the ‘pROC’ package in R and used to find optimal thresholds for classifying tumor vs normal samples. The area under the ROC curve (AUC) was used to measure the performance of each combination of markers as a classifier. For all 14 tumor types we tested the three markers separately, in pairwise combinations, and all three markers together, which resulted in 14 AUC values for each possible combination. We performed Friedman test (tumor types set as blocks) and pairwise Wilcoxon signed-rank tests with Bonferroni corrected p-values to compare average AUC values from each of the possible biomarker combinations. We applied two strategies for validating test performance. First, each of the 14 TCGA cohort (tumor and normal samples) were split randomly 50/50 five times and each time one set was used for training and setting of threshold, while the other was used for validation. Second, we validated the test performance in independent data sets, using logistic regression coefficients for the corresponding cancer type and probe combinations from the TCGA data to predict probabilities in the independent validation cohorts. This was followed by classification using the same cutoff threshold applied to the TCGA discovery cohort. Sample code will be made available at https://github.com/lannado/Tumor_classification_bymethylation.
2.4. Blood sample simulations
Each of the 4,050 TCGA tumor samples were matched with a random normal peripheral blood sample (some blood samples were matched multiple times). Methylation data obtained from TCGA tumors was simulated into percentages of total DNA by weighting the average methylation value from a given tumor sample and normal peripheral blood cell sample at the targeted fractions. Simulated circulating tumor DNA (ctDNA) fractions ranged from 100-1%. We did not take into account the fragmentation pattern observed in cell-free DNA [33] when performing these simulations. At each concentration (100, 99.9, 99, 90, 75, 50, 25, 10, 1%), logistic regression models were trained using all 4,050 tumor samples pooled into a single cohort and normal peripheral blood samples while applying 10-fold cross validation, followed by construction of ROC curves and calculation of AUC as a measure of performance. The accuracy and kappa statistics (incl. SD) from the 10-fold cross validation are reported in Table S2. We selected the optimal threshold based on results with 10% tumor DNA concentration and applied this common threshold to each of the 14 cancer types and reported the sensitivity for each of the markers. The coefficients for each covariate in the logistic regression models at 10% tumor DNA concentration are reported in Table S3.
2.5. Calculation of positive predictive value
Incidence rates were extracted using the SEER*Stat software providing access to the 1975-2019 SEER Research Plus Data (November 2021 Submission). We used the database ‘Incidence - SEER Research Limited-Field Data, 22 Registries, Nov 2021 Sub (2000-2019)’, and retrieved age-adjusted rates using the 2000 U.S. Std Population (19 age groups - Census P25-1130). Rates were calculated for cases diagnosed from 2010-2019 and with age at diagnosis set to 50 – 85+, thereby maintaining a focus at the screening-relevant part of the population. We compiled a complete list of tumor subtypes covered by the TCGA cohort used for analysis including both the topography code (ICD-O-3 Site) and morphology code (ICD-O-3 Histology). We then extracted the relevant incidence rates from SEER and summed the subtype-specific rates together to obtain the final incidence rate for each tumor type (e.g., BRCA). In the lung squamous cell carcinoma (LUSC) cohort, a single tumor sample was excluded prior to retrieval of incidence rates, since the patient was diagnosed with ‘Adenocarcinoma, NOS’ at the ‘upper lobe, lung’, and thus in theory belonged to the lung adenocarcinoma (LUAD) type. A list of incidence rates applied for each TCGA tumor type can be found in Table S4. The positive predictive value (PPV) was calculated as:
with incidence rates inserted as fractions of 1. Using the common threshold set to detect all 14 cancer types with maximum sensitivity and specificity (Youden’s index), PPV was calculated for each individual tumor type. When estimating the PPV for all tumor types combined, each tumor type-specific sensitivity was multiplied with the respective incidence rate, and the sum of this product across all 14 tumor types was used. The PPV was plotted as a boxplot showing the median with first and third quartiles, based on the PPV values obtained from the 7 possible probe combinations (GALR1, TLX1, ZNF154, GALR1+TLX1, GALR1+ZNF154, TLX1+ZNF154, GALR1+TLX1+ZNF154). Alternatively, we calculated the PPV for each of the assays where thresholds were determined based on a fixed specificity at 95%.
2.6. PCR assay and sequencing
The sample cohort covered 40 breast tumor and 8 normal breast samples, each in duplicate. Our primer design assumed all non-CpG cytosines (C) to be converted with sodium bisulfite to thymine (T). The primers annealed to regions in the genomic DNA sequence devoid of any cytosines in a CpG context. The following PCR primers were used:
| ZNF154 | |
| Forward primer | Reverse primer |
| 5’-GGTTTTTATTTTAGGTTTGA-3’ | 5’-AAATCTATAAAAACTACATTACCTAAAATACTCTA-3’ |
| Genomic position | Amplicon size (incl. primers) |
| Chr19: 58220404-58220705 (+ strand) | 302 bp (20 CpGs) |
| TLX1 | |
| Forward primer | Reverse primer |
| 5’-TTTTTAGTTTAGGTTTTATGGGGTAG-3’ | 5’-AAAACCATAACTTCCTTTATAACCC-3’ |
| Genomic position | Amplicon size (incl. primers) |
| Chr10: 102894992-102895165 (+ strand) | 174 bp (13 CpGs) |
| GALR1 | |
| Forward primer | Reverse primer |
| 5’-GGGAGTTTTTTTTGTAGGAGT-3’ | 5’-AAAACACTAAAATCCCCTTCC-3’ |
| Genomic position | Amplicon size (incl. primers) |
| Chr18: 74961979-74962242 (+ strand) | 264 bp (27 CpGs) |
For purposes of sequencing, the primers contained the following adapters:
- -
- Forward adapter: 5′-ACACTCTTTCCCTACACGACGCTCTTCCGATCT-3′,
- -
- Reverse adapter: 5′-GTGACTGGAGTTCAGACGTGTGCTCTTCCGATCT-3′.
Sequencing data from PCR-generated amplicons of ZNF154 was obtained from our previous study [20]. In brief, ZNF154 amplicons were prepared from 20 ng genomic DNA which was bisulfite converted with the EZ DNA Methylation-Direct Kit (catalog no. D5023; Zymo Research, Irvine, GA). PCR products were sequenced at the NIH Intramural Sequencing Center using the Illumina MiSeq platform with Reagent Kit Version 3 (Illumina Inc.) to generate paired-end, 300-bp reads. Post-run processing of data was performed using RTA version 1.18.42 and CASAVA software version 1.8.2 (Illumina Inc.). TLX1 and GALR1 amplicons were generated and sequenced at Zymo Research in a multiplex reaction. Zymo’s PCR annealing temperature was 56 degrees, otherwise bisulfite conversion, PCR and sequencing were performed the same as ZNF154. Analysis was done using standard Illumina base-calling software and then analyzed using a Zymo Research proprietary analysis pipeline.
We aligned the full-length fragments to the human genome version GRCh37/hg19 using Bismark version 0.7.12 [34]. This procedure filtered out nonaligning reads and returned the number of aligned reads together with methylation levels at each CpG in the amplicon and mean methylation across each sample. Samples with read count <500 were excluded from the analysis of the ZNF154 amplicon. Since TLX1 and GALR1 amplicons resulted in lower sequencing reads, the threshold was set proportionally lower for the analyses of these two amplicons (19 reads as cutoff). The duplicate samples were treated as separate sample cohorts, in order to check for reproducibility of the results with either sample cohort. The maximum mean methylation level among the normal samples was used to set the threshold for classification of the tumor samples (resulting in 100% specificity). To combine the markers into multi-marker assay, every sample that passed the read count limit for all markers, was evaluated for positivity for each of the markers and presented in the Venn diagram.
2.7. EpiClass procedure to assess marker performance in plasma samples
In accordance with the EpiClass procedure [22], two parameters were specified to call a sample positive: (1) a minimum methylation density, MDmin, defined as the fraction of methylated CpG sites in a given read (see Table S5), and (2) a minimum epiallelic fraction, EFmin, defined as the fraction of reads at or above a given methylation density. A sample was considered positive if at least EFmin of the DNA reads were methylated at a methylation density above or equal to MDmin. As input, we used reads from the whole genome bisulfite sequencing (WGBS) plasma samples that overlapped 500-600 bp regions flanking the corresponding CpG probe of interest (1000-1200 bp total). For each marker and marker combination used to classify the plasma samples, we initially set EpiClass to identify the optimal cutoffs that maintained 100% specificity and maximized sensitivity. In a second approach, we used the maximum value for sensitivity + specificity. For the lung cancer cohort (n = 9) and healthy controls (n = 4), all samples were treated as a training cohort with no subsequent validation. For the liver cancer cohort (n = 30) and healthy controls (n = 36) the two cohorts were repeatedly divided into two equally sized training and testing cohorts. Thus, the results from the liver cancer cohort appears as the mean of 5 iterations +/- 1 standard deviation.
3. Results
3.1. Discovery of multi-cancer methylation biomarkers in TCGA data
We previously showed that ZNF154 probe cg21790626 (hg19/chr19:58,220,494) in Illumina’s 450K methylation array is significantly hypermethylated in 4,0520 TCGA tumor vs 646 normal samples from 14 cancer types [19]. Revisiting this data, we find that the mean methylation level at Illumina probe cg21790626 (i.e., ZNF154) across all tumor samples is high (0.46) compared to normal tissues (0.08 0.005 SEM). The difference in median beta value between cancer and normal tissue within individual cancer types varied from 0.01 in kidney renal papillary cell carcinoma (KIRP) to 0.69 in uterine corpus endometrioid carcinoma (UCEC) (Figure 1a). In a 1000-bp window surrounding the ZNF154 probe cg21790626 site we evaluated methylation status in 11 CpG nucleotides present on the array (Figure 1a); however, ZNF154 at the position cg21790626, which we previously reported, showed the highest average difference in methylation beta values between tumor and normal samples across all 14 cancer types.
To identify additional markers with similar performance to ZNF154 across multiple cancer types, we reanalyzed TCGA data from the same 14 cancer types. We required mean and median methylation differential values 0.40 between tumor and normal samples for at least one CpG position (Bonferroni corrected P-values <0.05 for t-tests and Wilcoxon rank sum tests). This process revealed several CpG sites that displayed strong differential methylation signals in a wide range of tumors. We followed up on two positions as putative multi-cancer markers. At probe cg14861089 in TLX1 (hg19/chr10:102,895,044), the difference in median beta values between tumor and normal samples across all 14 cancer types ranged from 0.03 in kidney renal clear cell carcinoma (KIRC) to 0.73 in uterine corpus endometrioid carcinoma (UCEC). At this position, hypermethylation met or exceeded the 0.40 threshold in 9 of 14 cancer types (Figure 1b), including bladder, breast, head and neck, liver, lung, pancreas, prostate, stomach, and uterine cancer. A second methylation probe, cg03502002 in GALR1 (hg19/chr18:74,962,134), showed an average difference in median beta value between tumor and normal of 0.43, with the smallest difference detected in KIRP (0.02) and the largest difference again found in UCEC (0.70). GALR1 also met the 0.40 threshold in nine tumor types: bladder, breast, colon, head and neck, lung, prostate, rectal, stomach, and uterine cancer (Figure 1c). By comparison, ZNF154, which was not originally identified using this method, met the 0.40 threshold in only six cancer types: bladder, head and neck, liver, lung squamous cell, stomach, and uterine. These findings suggest the two new markers could have comparable or even greater potential as multi-cancer markers than ZNF154, however, the performance across 14 cancer types is seldom determined by a single evaluation method.
Abbreviations: BLCA, bladder urothelial carcinoma; BRCA, breast invasive carcinoma; COAD, colon adenocarcinoma; HNSC, head and neck squamous cell carcinoma; KIRC, kidney renal clear cell carcinoma; KIRP, kidney renal papillary cell carcinoma; LIHC, liver hepatocellular carcinoma; LUAD, lung adenocarcinoma; LUSC, lung squamous cell carcinoma; PAAD, pancreatic adenocarcinoma; PRAD, prostate adenocarcinoma; READ, rectum adenocarcinoma; STAD, stomach adenocarcinoma; UCEC, uterine corpus endometrioid carcinoma.
3.2. Methylation at TLX1, GALR1, and ZNF154 in tumor and normal karyotype cell lines
To expand upon cancer types in our analysis of TCGA data we examined cell lines from a variety of tumor and normal cell types (Figure S1). Previously, we observed a striking pattern in which ZNF154 was methylated in cell lines derived from tumor, but not nontumor cell lines [19]. For TLX1, GALR1, and ZNF154, we assessed methylation data for cell lines derived from non-tumor (n=30) or tumor (n=23) cell karyotypes [35], and in addition 9 cell lines with no designation (Figure 2). For each marker, the median beta value across tumor-derived cell lines was very high: 0.87 for TLX1, 0.90 for GALR1, and 0.94 for ZNF154. Conversely, the average beta value across all non-tumor-derived cell lines was <0.1 for each marker. ZNF154 was unmethylated in all non-tumor-derived cell lines (range 0-0.05) and hypermethylated in all tumor-derived cell lines (range 0.47-0.99), with the exception of Nt2d1 (a teratocarcinoma cell line), which had methylation beta values <0.1 for all three markers. The low level of methylation seen in this cell line may be related to its pluripotent nature [36]. TLX1 showed high methylation (>0.4) in 18/23 tumor-derived cell lines and two non-tumor cell lines. The two normal cell lines were HEEpic (human esophageal epithelial cells) and NHBE (human bronchial epithelial cells). GALR1 showed high methylation in 18/23 tumor-derived cell lines, and 1 non-tumor-derived cell line, GM12878 (B-lymphocytes derived from peripheral blood). Thus, like ZNF154, TLX1 and GALR1 methylation were elevated across the majority of tumor-derived cell lines. We used the designation of tumor or immortalized healthy cell lines originally determined by ENCODE. For clustering analysis, we used only the methylation beta values for each cell line. Cell lines lacking karyotype information in the ENCODE data (“Not specified”) clustered with either tumor or nontumor cell lines based on their methylation value. Notably, the tumor cell lines included leukemia (CMK), neuroblastoma (BE2_C), cerebral brain tumor (PFSK-1), and glioblastoma (U87), among others, which were not included in the 14 cancer types analyzed from TCGA in Figure 1 (Figure S1).
3.3. Performance of the three biomarkers individually
To classify tumor and normal samples from the TCGA data, we trained logistic regression models using methylation beta values from the three biomarkers one tumor type at a time. Next, we determined the best probability thresholds for classification with receiver operating characteristic (ROC) analysis and used the area under the ROC curve (AUC) to measure the performance of each marker. Across the 14 tumor types, the three markers showed varying AUC values ranging from 0.63-1.0 (Figure 3). While GALR1 and TLX1 showed near perfect performance in classifying colon cancer (AUC of 0.97 for both), ZNF154 only achieved an AUC of 0.81 within this tumor type. On the other hand, ZNF154 showed optimal performance in several other cancers such as uterine corpus endometrial and head and neck cancer (Figure 3). Importantly, ZNF154 enabled near-perfect classification of liver cancer samples with an AUC of 0.92, where GALR1 and TLX1 only produced AUC values of 0.64 and 0.77, respectively. As expected, the sensitivity and specificity at the optimal threshold of each of the three biomarkers differed across the 14 tumor types in accordance with the AUC values (Table S6). A good example of the compromise between sensitivity and specificity when settling on a threshold is the performance of ZNF154 in colon cancer. Due to the relatively high level of methylation in normal colon tissue TCGA samples (median beta value 0.51 in TCGA samples), the threshold that allows for a high specificity (92%) comes with a compromise in sensitivity (64%). The same tendency could be observed for this marker in classification of rectal cancer samples albeit a better performance (100% specificity and 78% sensitivity). On the contrary, because the GALR1 marker suffered from low levels of methylation in TCGA liver cancer tissue (median beta value 0.09), the specificity of 94%, corresponds to a sensitivity of only 46%, making it a poor marker for detection of this cancer type. To summarize each marker, we found the average of the sensitivity values in tissue samples across all 14 cancer types was 78% for GALR1, 81% for TLX1, and 84% for ZNF154. The average specificity across all 14 tissue types was 95% for GALR1, 96% for TLX1, and 97% for ZNF154. Together, these data indicate that no marker has ideal performance in all cancer types and supports the use of multiple markers to complement each other’s performance. While the vast majority of cell-free DNA (cfDNA) in plasma from healthy individuals derives from hematopoietic cells [33], certain pathological states (related or unrelated to cancer) can alter the cell type contribution to cfDNA [37]. Thus, we find it noteworthy to ensure differential methylation levels between tumor and normal tissue as demonstrated for these three markers.
3.4. Combining methylation biomarkers into multi-marker assays
We next evaluated the combination of two or three markers. To combine the markers, we included them as separate covariates in the logistic regression model (coefficients for each covariate can be found in Table S1). Again, we applied a consistent thresholding approach to assess performance of biomarker combinations utilizing ROC curves and AUC within each cancer type. When compared to the performance of individual markers, the three-marker combination significantly increased discrimination of tumor and normal samples, as evaluated by the AUC values calculated for each cancer type (Figure 4a, p-value = 0.0026; pairwise Wilcoxon signed-rank tests with Bonferroni correction). Compared to ZNF154 alone, the addition of TLX1 and GALR1 into a three-marker assay improved the AUC value by more than 0.07 in 4 cancer types (Table S6). For example, breast cancer increased from 0.87 to 0.98 and colon cancer increased from 0.81 to 0.99 (Figure 4b-c and Table S6). The triple-marker assay even reached a perfect AUC value of 1.0 for classification of rectal and stomach cancer (Table 1). Pairwise marker combinations including GALR1 showed significantly lower AUC values than the triple marker assay, while the combination of ZNF154 and TLX1 showed similar performance to the triple marker assay, suggesting that combining these two markers might be sufficient (Figure 4a).
Based on each of the ROC curves we picked a threshold that would maximize both sensitivity and specificity and tested all samples. The three-marker combination displayed a very high sensitivity across all cancers examined (average = 93%) (Table 1). The sensitivity was highest in rectal and stomach cancers (100%), as well as uterine cancer and lung squamous cell carcinoma (99%). Furthermore, in 8/14 cancer types the sensitivity was 97%, including colon cancer. The lowest sensitivity was 74% in kidney renal papillary tumors (KIRP) and 82% in kidney renal clear cell tumors (KIRC). Compared to classification by ZNF154 alone, the sensitivity of detection of the 14 cancer types improved with the three-marker combination, except uterine and prostate, which stayed the same (99% and 90%, respectively) (Table S6). Importantly, this high level of sensitivity was achieved without negatively affecting the specificity of the triple marker assay, which across all 14 normal tissues averaged 97%. In individual cancer types, specificity ranged from 84% in kidney renal papillary tissue to 100% in 7/14 healthy tissue types, including lung and colon tissue (Table 1). In sum, the three-marker combination demonstrated a strong ability to correctly identify tumor samples and normal samples, while missing few of either type.
To validate our model within the TCGA dataset, we split each tumor and normal cohort into two equally sized cohorts in a random manner and used only half of the samples for training while the other samples were utilized for performance testing. We repeated the random split over 5 iterations, and performance in both training and validation cohorts are reported in Tables S7 and S8 as mean and standard deviation. While sensitivities remained fairly stable (ranging from 72.3% in KIRP to >95.0% in eight cancer types), the specificities were somewhat reduced in the validation cohorts for some of the tumor types, including bladder, breast, lung and prostate cancer (ranging from 80.0 to 88.8%). The test performance in the training cohorts across the 5 iterations showed little to no variation, which can be seen from the resulting ROC curves and AUC values, which remain consistently high (ranging from 0.87 to 1.0), and the fact that all AUC standard deviations were <0.02 (Table S7 and Figure S2).
3.5. Validation of three-marker combination in independent tumor datasets
All analyses up to this point were based on the same TCGA datasets. Therefore, we validated the performance of the GALR1, TLX1, and ZNF154 markers in independent sets of Illumina 450K methylation array data available for four cancer types: breast cancer (450 tumors, 149 normal samples), colon cancer (35 tumors, 18 normal samples), lung adenocarcinoma (9 tumors, 11 normal samples), and prostate adenocarcinoma (31 tumors, 16 normal samples). In all of these datasets, the average methylation value was elevated in tumor samples compared to normal tissue samples for all three probes (Figure 5a-d), and in general the methylation levels were comparable to those found in the corresponding TCGA cohort (Figure S3). To test assay performance in these validation cohorts, we utilized the TCGA-based trained regression models and calculated thresholds described in the section above. The classification performance for the three-marker combination can be viewed in Table 2. The sensitivity and specificity in this breast cancer validation set were 80% and 94%, respectively, which was slightly reduced from 91% and 96% in the TCGA dataset. For the colon cancer validation set the sensitivity and specificity were 94% and 83%, respectively, which was also slightly reduced from 97% and 100% in the TCGA dataset. The lung adenocarcinoma validation data, albeit being a very small cohort, showed a shift in the balance between sensitivity and specificity, with sensitivity going up (from 97% to 100%) while specificity dropped from 100% to 73%. Prostate cancer (PRAD) showed identical sensitivity while specificity improved to 100%. In summary, all validation sets achieved comparable sensitivity and specificity using the thresholds determined from TCGA data, although at slightly lower values than obtained with the training data. Results from the other biomarker combinations (single and pairwise) with the validation cohorts are shown in Table S9. No information was available to match the type, grade, or stage of tumors between the training and the testing sets. From these analyses we consider the performance of the methylation thresholds robust for further evaluation in cancer detection.
3.6. Methylation at TLX1, GALR1, and ZNF154 in early tumorigenesis
Detecting cancer at an early stage provides the most promise for improving patient survival. To investigate if our three target biomarkers showed differential methylation at early stages of cancer development, we analyzed stage I tumors in the TCGA dataset. (same dataset as used for section 3.3 and 3.4). Stage I samples were available for 12 of 14 cancer types (unavailable in pancreas and prostate), resulting in a total of 480 tumor samples and 588 normal samples. GALR1, TLX1, and ZNF154 were significantly hypermethylated in stage I samples for 10 of 12 tumor types (p-values Wilcoxon rank sum test with continuity correction) (Figure 6a-c). Additionally, GALR1 showed significant differential methylation in lung adenocarcinoma samples, despite the low number of tumor samples (n = 3). With only two stage I tumors in the stomach cancer cohort and two normal samples, the sample size was too small to be tested statistically. Again, the three markers displayed complementary strengths. GALR1 and TLX1 provided higher discrimination (Figure 6b-c) of normal colon and rectal tissue samples that ZNF154 may lack (Figure 6a). The difference in median beta value between tumor and normal samples for colon was 0.13 for ZNF154, while TLX1 and GALR1 showed a difference of 0.70 and 0.60, respectively. By contrast, ZNF154 displayed the largest amount of differential methylation for stomach cancer (difference in median methylation 0.63), improving performance over TLX1 or GALR1 (difference in median beta value at 0.50 and 0.30, respectively). We also tested the combination of the three markers by logistic regression in stage I tumors for 11 of 14 cancer types with available data (stomach adenocarcinoma samples were excluded due to the small sample size). For individual markers the median AUCs for classification of stage I tumors were 0.91 (GALR1), 0.88 (TLX1), and 0.90 (ZNF154) vs 1.00 using all three markers together (Figure 6d). We applied Friedman test to compare all marker combinations using tumor types as blocks and found a significant difference between the marker combinations (p-value = 4.023e-5). Although pairwise comparison using Wilcoxon signed-rank test with multiple comparison correction showed no significant difference between any of the markers, a trend towards reduced variability in AUC could be observed when combining more markers (Figure 6d). Our analyses provisionally demonstrate that each of the three markers is capable of detecting early-stage tumors in 10 of 12 cancer types, and the finding that each biomarker has distinct strengths regarding detecting early-stage tumors further supports use of these three markers in combination.
P-value < 0.05, ** indicates P-value < 0.01, *** indicates P-value < 0.001, ns indicates ‘not significant’ (Wilcoxon rank sum test with continuity correction). NA indicates insufficient sample numbers for statistical testing. Tumor types are abbreviated as in Figure 1. (d) Area under the receiver operating characteristic curve (AUC) calculations for stage I tumors using each possible marker combination (G, GALR1; T, TLX1; Z, ZNF154). Each boxplot contains 11 AUC values (STAD was excluded). Groups were compared using Friedman test. All methylation data were obtained from The Cancer Genome Atlas.
3.7. Testing multi-cancer assay performance in simulated blood samples
Until this point, we assessed the ability of the three markers to distinguish between tumor and corresponding normal tissue. However, for a blood-based test an important consideration is the differential signal between tumor DNA and healthy white blood cell DNA, since lymphoblasts provide >90% of healthy cell free DNA (cfDNA) in plasma [38]. To characterize methylation at our three candidate markers in white blood cells, we analyzed Illumina methylation array data from 2,711 peripheral whole blood cell samples gathered from male and female donors, ages 35–80 years (GSE55763) [24] (Figure 7a). For all three markers, median methylation was significantly higher in TCGA tumor samples (n = 4,050, all tumor samples combined in one cohort) than normal tissue samples (n = 646) or normal white blood cells (n=2,711) (P-values <0.0001; Wilcoxon rank sum test). GALR1 methylation level in white blood cells was slightly elevated compared to TLX1 and ZNF154 (Figure 7a). Using the peripheral whole blood cell DNA as a proxy for cfDNA, this analysis confirms that methylation at these markers in tumor cell DNA is distinct from methylation in the healthy cfDNA that would be sampled in blood-based testing.
Next, we sought to mimic patient plasma samples by simulating dilutions of the tumor DNA into a background of normal WBC DNA. Previously, we have applied this approach using tumor and normal tissue DNA methylation signal at the ZNF154 locus to predict the suitability of this marker for liquid biopsy analysis [20]. Here, we instead used WBC DNA as the normal background. In this way, the tumor DNA would now represent the circulating tumor DNA (ctDNA) while the WBC DNA mimicked the normal cfDNA. TCGA methylation data were simulated into percentages of total ctDNA by weighting the methylation beta value from tumor samples as a fraction of the methylation beta value of peripheral blood cells at the same CpG site. Dilutions ranged from 100–1% tumor DNA. Since our main aim of this study was to develop a potential multi-cancer testing approach, we combined all tumor samples into one group and assessed the ability of each marker or combination of markers to classify every tumor sample apart from normal blood samples. At each concentration we performed a new ROC analysis and obtained the AUC value for each marker or combination of markers (Figure 7b and Table S10). This analysis included a 10-fold cross validation from which accuracy and kappa statistics (incl. SD) are reported in Table S2. At ctDNA concentrations down to 25% the AUC values for all the marker combinations remained stable. However, performance of the assays dropped markedly in the span of simulated 1–10% ctDNA, clearly illustrating the challenge of detecting ctDNA in dilute samples such as plasma. Interestingly, this data also revealed a worse performance of GALR1 compared to the other two markers, which is likely explained by the elevated methylation level at this locus in WBC DNA (Figure 7a).
We considered head-to-head and combined marker comparisons at the 10% ctDNA concentration, where ZNF154 and TLX1 each reached an AUC value of 0.84 and 0.85, respectively, while GALR1 only reached an AUC of 0.70 (Figure 7b). Importantly, the effect of combining the markers remained positive in terms of classification performance with the triple marker assay as well as ZNF154 and TLX1 combined in a two-marker assay both obtaining an AUC value of 0.88 at 10% ctDNA concentration. The coefficient values for each covariate in the logistic regression model at 10% ctDNA concentration can be found in Table S3. Based on the ROC curves for each of the assays we settled on thresholds that would lead to maximum sensitivity and specificity in detecting tumor DNA at 10% concentration. After classifying each sample as tumor or normal using our multi-cancer model, we then looked at performance in terms of sensitivity within each of the 14 tumor types. As shown in Figure 7c, the mean sensitivity greatly varied depending on the tumor site. Seven of the 14 cancer types had a mean sensitivity of >80% including gastrointestinal cancers such as colon, rectal, and stomach cancer. On the other end of the scale, the assays performed with lower sensitivities in kidney carcinomas and pancreatic adenocarcinoma with on average 33% and 56% correct classification of tumor samples, respectively (Figure 7c and Table S10). Considering all 14 tumors combined the marker combinations performed with 76% average detection sensitivity. The assay with the highest correct classification of tumor samples was TLX1 combined with ZNF154 and the triple marker assay, both of which reached 79% sensitivity across all tumor samples. Values for specificity ranged from 80-86% between alternate marker combinations except GALR1 alone, which had a specificity among the normal blood cell samples of 57% (Figure 7d). Interestingly, this trade-off in specificity was followed by a considerably higher sensitivity towards detection of kidney renal clear cell carcinoma and pancreatic adenocarcinoma (53% and 69%, respectively) compared to the alternate marker combinations (Figure 7c). We also investigated the performance of the markers at 1% ctDNA concentration (Figure S4). However, at this concentration the overlap between tumor and normal blood sample methylation signal from single probe methylation array data became so extensive that the maximum AUC value obtained was 0.57 (TLX1 combined with ZNF154 and the triple marker assay) (Table S10). We do not find this assay system sufficiently sensitive to measure ctDNA at levels <1%.
3.8. Positive predictive value of the three-marker combination
The positive predictive value (PPV) is the probability that a positive test result indicates the presence of a tumor. Additionally, the PPV indicates the frequency of false positive tests, and thus predicts the amount of people that would have to continue through diagnostic follow-up procedures only to confirm the absence of a tumor. The PPV of a screening test can be measured from large-scale population studies enrolling non-symptomatic individuals for screening. However, PPV can also be estimated from the analytical performance parameters, sensitivity and specificity, calculated from case-control studies. In that case the frequency of disease within a given population must be taken into account. The estimated PPV can be calculated using the following formula:
Where f is the frequency of the disease within the population investigated. The frequency of individuals suffering from cancer is most often represented by the prevalence. However, in the case of a consistently screened population, we expect the performance of our test to be dominated by the new incidences rather than already existing and diagnosed cases of cancer. Thus, we calculated the PPV for each of the 7 alternate marker combination assays using age-adjusted incidence rates extracted from the Surveillance, Epidemiology, and End Results Program (SEER) database (Table S4). We applied the previously reported sensitivities and specificities for the simulated blood samples consisting of 10% ctDNA (Figure 7c-d, Table S10). While specificity of each assay remained consistent across all tumor types, the sensitivities varied, as shown in Figure 7c. In addition, the incidence of each tumor type differed, which also had an impact on the computed PPV (Figure 8a). Thus, compared to the cancer types with low incidence rates we observed improved PPV in the more common cancer types such as colon, breast, lung (LUAD), and prostate cancer where the median PPV for all 7 seven alternate marker combinations was 0.4%, 0.3%, 0.3%, and 1.0%, respectively. Most importantly, there was a clear increase in median PPV to 3.2% when considering all 14 tumor types together in a single multi-cancer screening setup, mainly due to the aggregated incidence rate (Figure 8a). Until this point, the estimated PPV values were all calculated with sensitivities and specificities derived from setting a threshold that would maximize the Youden’s index (sensitivity + specificity). However, the calculation of PPV is more sensitive to changes in specificity rather than sensitivity. Therefore, we recalculated the PPV for the multi-cancer assay aiming to detect all 14 cancer types while applying a strict threshold requiring 95% specificity for each of the alternate marker combinations. The computed PPV values for each of the 7 alternative marker combinations showed a considerable increase when using the 95% specificity threshold compared to the threshold set by the Youden’s index (Figure 8b). More specifically, the median PPV increased from 3.2% to 7.2% when specificity was forced to be 95% (p = 0.016; pairwise Wilcoxon signed-rank test). The best performing assay under these conditions was the triple marker assay (PPV at 8.0%), followed by the TLX1 and ZNF154 combined assay (PPV at 7.7%), and TLX1 alone (PPV at 7.8%). Naturally, and as a consequence of fixing the specificity at 95%, the sensitivities dropped for all of the marker combinations. Sensitivity ranged from 42-61%, except for GALR1 which obtained a sensitivity of only 10% (Figure S5).
3.9. Performance of three-marker combination in cancer tissue
In the context of a clinical liquid biopsy, the percentage of ctDNA present is often below 1% [39]. As we have stated, we do not believe the array data is sensitive below 1%. Under such circumstances a PCR-based assay might be more suitable than an array-based assay targeting the methylation status of single CpGs for tumor classification. Using PCR, methylation can be measured across an entire CpG island, where additional CpG positions may be present that are not represented on the Illumina microarray. These correlated positions can increase tumor discrimination [20] and enable thresholds based on methylation density [22]. Thus, we next developed an amplicon-based methylation assay followed by sequencing to combine results from the three-markers TLX1 (containing 13 CpGs), GALR1 (containing 27 CpGs), and ZNF154 (containing 20 CpGs). We tested the assay on bisulfite-converted DNA extracted from an independent collection of 40 breast tumors and 8 normal breast tissue samples, as used in Margolin et al. [20]. For each marker, we averaged the methylation signal across the CpG sites within the amplified region, setting the threshold for identifying tumor samples above the maximum methylation level detected among the healthy controls (ensuring 100% specificity). Considering each of the markers individually, ZNF154 reached 82% sensitivity, while TLX1 and GALR1 correctly classified 90% and 95% of the tumor samples, respectively (Figure 9a-c). The relatively high sensitivity for GALR1 was likely caused by the lower methylation level detected in the normal tissue samples enabling a lower threshold setting. We then combined the markers such that if one marker showed methylation value above threshold, the sample would be regarded as positive. For this analysis, we only considered the 35 tumor samples that passed the QC criteria in terms of read count (see Material and Methods section) across all three markers. Interestingly, the combination of ZNF154 with either TLX1 or GALR1 resulted in the successful detection of all tumor samples (100% sensitivity) (Figure 9d). To test this approach further we performed the same analysis on a second batch of the same samples (Figure S6). This time, only the combination of ZNF154 and TLX1 was able to achieve 100% sensitivity. We concluded that two markers may be sufficient, but larger sample sizes and plasma-based samples may still benefit from the addition of a third amplicon. Thus, we demonstrated the markers are in positions amenable to PCR amplification after bisulfite conversion and were successfully implemented in a PCR-based assay. To investigate, whether the inclusion of multiple CpGs surrounding the original probe of interest increased performance we re-analyzed this data looking only at sequencing results for the single CpGs previously assessed in the TCGA methylation array dataset. Again, the threshold for counting samples as “positive” was set to the maximum beta value obtained among the normal tissue samples. Indeed, all three markers performed with increased sensitivity when utilizing information on all CpGs in the amplicon compared to assessing only the beta value at the single CpG level (Figure S7).
3.10. Testing of the three biomarkers in patient plasma using whole genome bisulfite sequencing
To test if the three methylation biomarkers could detect the presence of a tumor from a liquid biopsy, we obtained whole genome bisulfite sequencing (WGBS) data from plasma samples belonging to lung cancer (n=9) and liver cancer (n=30) patients along with healthy controls (n=4, n=36, respectively) [30,31,32]. As seen for the PCR amplicon data, WGBS data allows for analysis of a stretch of DNA, and for each target region (TLX1, GALR1, ZNF154), we assessed reads overlapping 500-600 bp regions flanking either side of the CpG sites of interest (see Table S5 for details on the regions analyzed). We previously demonstrated that the extremely dilute nature of methylated ctDNA in plasma requires special analysis methods for detection, which led us to develop a novel classifier method called EpiClass [22]. This approach is more sensitive than simply setting a cutoff based on the average methylation level per sample. In brief, for each marker EpiClass will give two thresholds: One for the density of methylation across the locus (i.e., percent methylation), and one for the fraction of sequence reads exceeding the percent methylation threshold (i.e., epiallelic fraction). These values can be selected based on the user’s desire to maximize sensitivity, specificity, or both. For each target region (TLX1, GALR1, ZNF154) we used EpiClass to determine the methylation density threshold (Table S5) and kept it consistent throughout the following analyses. Initially, we sought to establish a threshold for the epiallelic fraction that maintained 100% specificity while maximizing sensitivity. With these thresholds, the ZNF154 locus displayed the best performance of any single marker in lung cancer plasma with an AUC of 0.78 enabling a sensitivity of 77.8% (Figure 10a). TLX1 had a slightly lower AUC of 0.72, whereas using GALR1 alone to classify the samples only reached an AUC of 0.56. When combining the markers, we considered a sample to be positive if at least one of the individual markers showed methylation values above the selected thresholds. The three-marker combination, but no other, achieved 100% sensitivity in this dataset (Table 3). While these results demonstrated the unique complementarity between the three markers, the small sample size created the possibility of overfitting of the data.
To further investigate the performance of the three-marker panel in a larger dataset, we tested data from WGBS hepatocellular carcinoma plasma (n=30) and healthy controls (n=36). Note that these datasets have previously been characterized as low-coverage (~4X) [30]. Because the sample size was still too small for an actual training and testing set, we randomly assigned each of the cases and controls into two groups (one for training and one for testing) and repeated this sampling in 5 iterations. The resulting sensitivities and specificities are reported as a mean of the 5 iterations +/- the standard deviation. We applied the EpiClass approach to each set, again seeking a threshold for the epiallelic fraction that would maximize specificity. In this dataset the demand for high specificity resulted in a compromise in sensitivity which ranged from 8-37% (Figure 10b and Table 3). The maximum specificity was obtained when using the markers individually (range 93-94%). Maximum sensitivity was obtained when combining ZNF154 and TLX1 (33%) or all three markers (37%), albeit at a lower specificity (88% and 83%, respectively). In the attempt to include more than one marker without compromising specificity, we set up a different test criterion called “any-two”. Here we considered all three markers, and if two of them exceeded their respective threshold, the sample would be regarded positive. Applying the any-two criterion increased the stringency of the test, where maximum specificity was 99%, while suffering from an 8% sensitivity (Figure 10b). To accommodate an improved sensitivity, we re-analyzed the dataset with the EpiClass approach, but now seeking a threshold for the epiallelic fraction that would maximize both sensitivity and specificity for each marker. We found that among the single markers, ZNF154 yielded the highest combined sensitivity and specificity values averaging 68% and 72%, respectively (Figure 10c). GALR1 and TLX1 each showed poor sensitivity, with mean values of 27% and 38%, respectively, but maintained increased specificity at 80% and 82%. The addition of either TLX1 or GALR1 with ZNF154 improved its sensitivity to 76% but decreased specificity to 59-60%. The three-marker panel further improved sensitivity to 84%, with a slight additional cost to specificity, which decreased to 53%. Notably, applying the any-two criterion resulted in an increased specificity compared to ZNF154 alone (82%), while suffering a decrease in sensitivity which only reached 40%. These results indicate that plasma testing is feasible for hepatocellular carcinoma detection. Because 25 of 30 of the samples represented early-stage tumors in this WGBS plasma dataset, we conclude that the sensitivity demonstrates potential for use in patient testing. Notably, a variety of combinations of these multi-cancer markers can yield similar overall classification results, although individual parameters of sensitivity and specificity will vary based on the user’s preference for highest specificity or sensitivity.
4. Discussion
The lack of effective generalized screening tests for most types of cancers means that detection is routinely delayed until the appearance of symptoms, which typically occurs at a late stage of disease with low therapeutic efficacy. Even then, a complex set of tests may be needed to determine the origin of symptoms. An emerging technology to detect more cancers before symptoms appear is through blood-based detection of circulating tumor DNA (ctDNA) [10]. The most comparable indicators in current use are tumor-associated antigens, including PSA, CA-125, and CA-19, which however can be elevated in noncancer conditions and thus lack the sensitivity and specificity of the emerging DNA-based tests [40]. We previously showed that ZNF154 methylation detection in ovarian cancer plasma outperformed patient CA-125 measurement (69.6% vs 47.8 %, correct classification, respectively), and combined, the two markers showed improvement over ZNF154 alone (87.0%, correct classification) [22]. Currently, a handful of liquid biopsy platforms are FDA approved as companion diagnostic tests to evaluate eligibility of patients for certain treatments [41,42,43]. Furthermore, a DNA methylation-based sequencing platform has emerged as a pan-cancer commercial product though not yet approved for clinical screening applications [44]. In addition, studies have demonstrated detection of early-stage tumors using cfDNA and protein-based liquid biopsies [45,46]. While these encouraging results demonstrate the potential for early disease detection, a workflow that enables high throughput, cost-effective analyses with a broad multi-cancer perspective are still crucial for applicability in laboratory and clinical settings. In this study, we present a simplified approach that requires no more than three DNA methylation markers, and which holds the potential to detect many types of cancer in a single blood-based assay. We identify two novel, multi-cancer markers in the intronic or promoter regions of TLX1 and GALR1, respectively, and report the benefit of combining them with ZNF154 as a multi-cancer assay. In addition to the potential as diagnostic markers, the hypermethylation at these locations is consistent with previously reported roles of TLX1, GALR1, and ZNF154 in multiple cancers [47,48,49]. Furthermore, ZNF154 was originally reported as a methylation marker specific for bladder cancer [50], which we later showed was relevant in many cancer types [19,20].
Given the large number of DNA methylation markers that have been published [51], the likelihood that additional targets are yet to be discovered remains high. The development of DNA methylation markers for analysis of ctDNA follows a series of steps, detailed by Lissa and Robles [52], which are further developed in recent recommendations for standardization of ctDNA testing by next generation sequencing [53]. However, both of these guidelines are based on cases where the markers have already been identified and validated in preliminary studies. Considering the scarce availability of samples for preclinical and clinical analysis, alternative methods for pre-screening newly identified cancer methylation biomarkers and evaluating their suitability for liquid biopsy testing are required to ensure continuous rapid progress. In this study, we followed a systematic approach beginning from the initial identification of markers in tumor DNA all the way through to analysis in patient plasma, with the added complexity of investigating three markers instead of one. At this stage of development, we consider the markers suitable for extensive laboratory-based testing, pushing the assay towards the required FDA standards.
Throughout this study, we have utilized a range of different data sources and techniques to evaluate the performance of the ZNF154, TLX1, and GALR1 biomarkers individually or in combinations. Overall, we found a good correlation between the tissue-based and plasma-based analyses, despite that the datasets were derived from DNA methylation array and whole genome bisulfite sequencing (WGBS) data, respectively. For example, in TCGA liver cancer tissue data, ZNF154 alone could obtain a sensitivity of 87% and specificity of 98% with an AUC value at 0.92. The two-marker combination, ZNF154 and TLX1, improved performance over ZNF154 alone, increasing sensitivity to 92% with specificity still at 98%, and AUC at 0.95. The inclusion of GALR1 did not improve results in either analysis. In the simulated blood samples with 10% ctDNA, ZNF154 had an AUC of 0.84 in classifying tumor versus normal blood cell samples, which could be increased to 0.88 by adding TLX1. Again, the addition of GALR1 did not improve the results markedly. Using the common threshold for classification of all tumor types as one disease, and then zooming in on the liver cancer cohort, ZNF154 showed the best sensitivity of all single markers (77%). As expected, the addition of TLX1, either with or without GALR1, improved the sensitivity to 80%. Through all these combinations the specificity remained almost constant ranging from 80%-84%. Based on these results, we did not expand beyond three multi-cancer markers.
While the tissue-based analysis using TCGA data depended on the methylation levels at a single CpG probe expressed as a beta value (ranging from 0-1), analysis of whole genome bisulfite sequencing data added another level of complexity. This data provided information on the methylation density across reads overlapping a 1kb region, requiring more advanced computational tools for classification. We have previously developed such an application called the EpiClass tool, which takes into consideration both the methylation density (e.g., how many CpG sites in a given stretch of DNA is methylated) and the concentration of each of these differentially methylated epialleles [22]. Applying this technology on the sequenced plasma samples derived from patients with liver cancer or healthy controls, we found that ZNF154 and TLX1 performed with similar sensitivity (20% and 21%, respectively) when forcing the specificity to its maximum level (93% and 94%, respectively). If the two markers were combined in a single assay, such that a positive read-out for any of the two markers results in a positive test, the sensitivity increased to 33% along with a drop in specificity to 88%. Adding GALR1 further improved sensitivity to 37% at a cost of 83% specificity. Following this sequential line of analyses from TCGA tissue data to actual plasma samples, it becomes evident how the dilute nature of ctDNA in liquid biopsies challenges assay performance. However, it should be noted, that WGBS is likely not the optimal technology for detection of methylation at target loci in cfDNA samples. A natural consequence of the broadness of this approach (targeting the entire genome) is the relatively low coverage that results [30]. In addition, we consider this a pilot study, with provisional findings for early-stage cancer detection, as larger cohorts representing more tumor types are warranted to fully demonstrate the multi-cancer detection potential of our markers. Nonetheless, these data collectively point towards a strong performance when combining the ZNF154 and TLX1 markers into a single assay. While GALR1 showed superiority in classifying TCGA tumor versus normal tissue derived from breast, kidney (KIRC) and lung (LUAD), it suffered from increased methylation level in normal blood cells. Accordingly, GALR1 had markedly worse performance at any simulated dilution level, reaching only 57% specificity in normal blood cell samples when ctDNA concentration was 10%. However, the utility of this marker cannot be ruled out, since the compromise in specificity led to GALR1 reaching the highest sensitivity as a multi-cancer assay within kidney, pancreatic, and lung adenocarcinoma.
We utilized the performance parameters, sensitivity, and specificity, obtained from diluted TCGA tumor methylation signal in a normal white blood cell background to estimate the putative positive predictive value (PPV) for our triple marker combination in a pan-cancer setting. PPV is a key metric used to evaluate harm-benefit in cancer testing, however, most commonly calculated from large scale clinical studies enrolling non-symptomatic individuals. As an example, the Cologuard®, has a PPV of 3.7% in detecting colorectal cancer [54] and low-dose CT has a PPV of 2.4% in detecting lung cancer [55]. Pan-cancer detection platform has yet to be evaluated for their performance in large asymptomatic cohorts of individuals. In the study by Klein and colleagues supporting Grail’s Galleri® test, the authors extrapolate the PPV from their case control study using SEER cancer incidence rates in the 50-79 year age group [56]. With a stage I-IV sensitivity across 27 cancer classes of 51.5% and a specificity among healthy blood donors of 99.5%, they manage to obtain an estimated PPV of 44%. A recent announcement from Grail on the PATHFINDER study enrolling more than 6,000 non-symptomatic individuals above 50 years old, revealed an actual PPV of 43.1% (https://grail.com/press-releases/grail-announces-final-results-from-the-pathfinder-multi-cancer-early-detection-screening-study-at-esmo-congress-2022/). A major factor affecting the PPV is the prevalence of the disease being detected in the tested population. In line with this, our data also demonstrates how grouping individual cancer types into one disease detected by a single assay drastically improves the PPV. Considering all 7 possible marker combinations we obtain an estimated PPV of 0.4% for colon and 0.3% for lung cancer, respectively. However, when considering all 14 cancer types combined, then average PPV increased to 3.2%. Additionally, by setting a fixed specificity level at 95%, we managed to obtain a PPV of 8% for the triple marker assay. Comparing estimated PPV values head-to-head between studies should be done with utmost caution. The study by Klein et al. is considered a clinical validation of a pan-cancer test being applied to >4,000 plasma samples from cancer patients and controls [56]. In the study presented here, the data derives from simulated blood samples based on 4,050 tumor tissue samples and 2,711 control white blood cell samples, yet still not actual plasma samples. Furthermore, the Galleri® test is based on enrichment and sequencing of a methylation-specific panel covering 11,66,720 CpGs, whereas our technology focuses on reducing complexity in downstream analysis by targeting only 3 CpGs.
Utilizing the TCGA data for pre-screening of potential cancer biomarkers has several limitations. First, a large number of TCGA samples analyzed here represented late-stage cancer diagnoses. Nonetheless, we were able to detect the presence of significant hypermethylation at the three biomarkers in the majority of stage I TCGA tumors compared to normal controls. Second, the undiluted TCGA methylation data represent an optimal sensitivity, specificity and AUC, (Table 1), which is unlikely to be reached in dilute plasma samples until technology improves. Third, TCGA methylation array data challenges biomarker performance by only providing array hybridization data on single CpG sites. This led to markedly decreased performance of all assays when simulating the concentration of tumor DNA down to 1%. A DNA-based liquid biopsy intended for early detection of cancer should preferably be able to detect the dilute nature of ctDNA relative to cell free DNA (cfDNA) where ratios of 1:1,000 to 1:10,000 (ctDNA:cfDNA) are common [57,58,59,60]. Although some cancer patients present with increased concentrations of ctDNA [61], our analysis at 10% simulated tumor DNA concentration is far from the desirable clinical range. Thus, the use of single probe methylation array data will likely not suffice for early detection purposes. However, it still constitutes a powerful and highly relevant resource for assessing multi-cancer detection potential of several markers in a large dataset covering 14 tumor types in 4,050 samples. Importantly, this multi-cancer panel covered tumor types where there is currently no screening option, such as pancreatic, bladder and head and neck cancer. Combining detection of multiple cancers in one single assay puts a challenge on biomarker identification, but in turn provides tremendous clinical benefits. By targeting several tumor types, the incidence rates will aggregate and potentially allow low-prevalence cancers into broadly applicable screening programs, due to the boost in the positive predictive value (PPV) of a given test [62]. We note that our analysis does not constitute a diagnostic assay, and as such, detection of cancer markers should be considered as a first step in pre-symptomatic testing. Notably additional biomarkers continue to emerge to refine follow-up testing.
5. Conclusions
In summary, we present a three-marker combination of DNA methylation sites that, if further validated, could potentially be used as a first-pass cancer detection method, after which more specific biomarker testing procedures could be applied to reach a diagnosis. As an economical test, with sufficiently high sensitivity and low false positive rate, this combination could be especially useful to complement existing screening methods; especially when screening for a given type of cancer does not currently exist.
Supplementary Materials
Figure S1: Schematic overview of ENCODE cell lines and their organ of origin; Figure S2: Receiver operating characteristic (ROC) curves showing classification performance of TCGA training cohorts. Figure S3: Hypermethylation at the three methylation probes in TCGA (training) vs independent validation cohorts. Figure S4: Simulated dilution of tumor DNA at 1% in a background of WBC DNA; Figure S5: Sensitivity in detection of all tumor samples at 10% dilution level with specificity set to 95%; Figure S6: Breast tumor identification using the three biomarkers for bisulfite amplicon sequencing (second batch of samples); Figure S7: Comparing single CpG analysis with average methylation across multiple CpGs in an amplicon; Table S1: Logistic regression coefficients from analysis of TCGA tumor vs normal tissue samples; Table S2: Measurements of accuracy from 10-fold cross validation logistic regression modelling using tumor vs blood samples; Table S3: Logistic regression coefficients from analysis of tumor vs blood samples (10% ctDNA); Table S4: Tumor type incidence rates extracted from SEER Research Plus Data (November 2021 Submission); Table S5: Thresholds applied in EpiClass analysis of WGBS data from plasma; Table S6: Performance of GALR1, TLX1, and ZNF154 in classifying TCGA tumors; Table S7: Performance of the three-marker combination (GALR1, TLX1, and ZNF154) in classifying TCGA tumors using cross validation (training cohorts). Table S8: Performance of the three-marker combination (GALR1, TLX1, and ZNF154) in classifying TCGA tumors using cross validation (validation cohorts). Table S9: Performance of GALR1, TLX1, and ZNF154 in classifying tumor vs normal samples in independent validation cohorts; Table S10: Performance of markers in simulated dilutions of tumor DNA into WBC DNA.
Author Contributions
Conceptualization, K.F., G.M., and L.E.; methodology, K.F., S.R.B.-C., B.F.M., H.T., C.B., G.M., D.H., N.S.A., and L.E.; formal analysis, K.F., S.R.B.-C., B.F.M., G.M., H.M.P., N.J., and D.H.; writing—original draft preparation, L.E., and S.R.B.-C.; writing—review and editing, K.F., S.R.B.-C., N.S.A., and L.E.; visualization, S.R.B.-C. and B.F.M.; supervision, G.M., H.T., and L.E.; project administration, L.E.; funding acquisition, S.R.B.-C. and L.E. All authors have read and agreed to the published version of the manuscript.
Funding
This research was funded by Carlsberg Foundation (grant number CF21-0592) and by the Intramural Program of the National Human Genome Research Institutes, the National Institutes of Health.
Institutional Review Board Statement
Previously published samples used in this study were approved for human subjects use by the associated IRB. Ethical review and approval were waived for this study, based on the review by the National Institutes of Health (NIH) Office of IRB Operations (IRBO), the project does not qualify as human subjects research, in that the activities do not involve human subjects as defined in the federal regulations. The activities only involve anonymous or otherwise de-identified information or biospecimens.
Informed Consent Statement
Not Applicable
Data Availability Statement
Raw data are available through the TCGA portal and Gene Expression Omnibus, GEO. Sample code will be made available at https://github.com/lannado/Tumor_classification_bymethylation.
Acknowledgments
We thank the NIH Intramural Sequencing Center and Zymo Research for the dedicated work in processing and sequencing our amplicon libraries. Furthermore, we would like to thank Dr. Wenyuan Li (UCLA) and assistant professor Peiyong Jiang (CUHK) for access to the WGBS datasets used in this study. We thank Kristin Harper of Harper Health & Sciences Communications LLC for editing early versions of the manuscript.
Conflicts of Interest
The authors declare no conflict of interest.
References
- Chen, R.C.; Haynes, K.; Du, S.; Barron, J.; Katz, A.J. Association of Cancer Screening Deficit in the United States With the COVID-19 Pandemic. JAMA Oncol 2021, 7, 878–884. [Google Scholar] [CrossRef]
- Guven, D.C.; Sahin, T.K.; Yildirim, H.C.; Cesmeci, E.; Incesu, F.G.G.; Tahillioglu, Y.; Ucgul, E.; Aksun, M.S.; Gurbuz, S.C.; Aktepe, O.H.; et al. Newly diagnosed cancer and the COVID-19 pandemic: tumour stage migration and higher early mortality. BMJ Support Palliat Care 2021. [Google Scholar] [CrossRef] [PubMed]
- Holland-Frei. Cancer Medicine, 6th edition; Donald W Kufe, M., Raphael E Pollock, M., PhD, , Ralph R Weichselbaum, M., Robert C Bast, J., MD, T, ed S Gansler, M., MBA, , James F Holland, M., ScD , Emil Frei, I., MD, Eds. BC Decker: Hamilton (ON), 2003.
- Smith, R.A.; Andrews, K.S.; Brooks, D.; Fedewa, S.A.; Manassaram-Baptiste, D.; Saslow, D.; Wender, R.C. Cancer screening in the United States, 2019: A review of current American Cancer Society guidelines and current issues in cancer screening. CA: a cancer journal for clinicians 2019, 69, 184–210. [Google Scholar] [CrossRef] [PubMed]
- Force, U.S.P.S.T.; Krist, A.H.; Davidson, K.W.; Mangione, C.M.; Barry, M.J.; Cabana, M.; Caughey, A.B.; Davis, E.M.; Donahue, K.E.; Doubeni, C.A.; et al. Screening for Lung Cancer: US Preventive Services Task Force Recommendation Statement. JAMA 2021, 325, 962–970. [Google Scholar] [CrossRef]
- McPhail, S.; Johnson, S.; Greenberg, D.; Peake, M.; Rous, B. Stage at diagnosis and early mortality from cancer in England. Br J Cancer 2015, 112 Suppl 1, S108–115. [Google Scholar] [CrossRef]
- Henley, S.J.; King, J.B.; German, R.R.; Richardson, L.C.; Plescia, M. Surveillance of screening-detected cancers (colon and rectum, breast, and cervix) - United States, 2004-2006. Morbidity and mortality weekly report. Surveillance summaries (Washington, D.C. : 2002) 2010, 59, 1–25. [Google Scholar]
- Loud, J.T.; Murphy, J. Cancer Screening and Early Detection in the 21(st) Century. Seminars in oncology nursing 2017, 33, 121–128. [Google Scholar] [CrossRef]
- Wise, J. Diagnosing cancer early is vital, new figures show. BMJ (Clinical research ed.) 2016, 353, i3277. [Google Scholar] [CrossRef]
- Alix-Panabieres, C.; Pantel, K. Liquid Biopsy: From Discovery to Clinical Application. Cancer Discov 2021, 11, 858–873. [Google Scholar] [CrossRef]
- Bailey, M.H.; Tokheim, C.; Porta-Pardo, E.; Sengupta, S.; Bertrand, D.; Weerasinghe, A.; Colaprico, A.; Wendl, M.C.; Kim, J.; Reardon, B.; et al. Comprehensive Characterization of Cancer Driver Genes and Mutations. Cell 2018, 173, 371–385. [Google Scholar] [CrossRef]
- Watson, I.R.; Takahashi, K.; Futreal, P.A.; Chin, L. Emerging patterns of somatic mutations in cancer. Nature reviews. Genetics 2013, 14, 703–718. [Google Scholar] [CrossRef]
- Kim, H.; Kim, Y.M. Pan-cancer analysis of somatic mutations and transcriptomes reveals common functional gene clusters shared by multiple cancer types. Scientific reports 2018, 8, 6041. [Google Scholar] [CrossRef] [PubMed]
- Hu, Y.; Ulrich, B.C.; Supplee, J.; Kuang, Y.; Lizotte, P.H.; Feeney, N.B.; Guibert, N.M.; Awad, M.M.; Wong, K.K.; Janne, P.A.; et al. False-Positive Plasma Genotyping Due to Clonal Hematopoiesis. Clinical cancer research : an official journal of the American Association for Cancer Research 2018, 24, 4437–4443. [Google Scholar] [CrossRef]
- Shames, D.S.; Girard, L.; Gao, B.; Sato, M.; Lewis, C.M.; Shivapurkar, N.; Jiang, A.; Perou, C.M.; Kim, Y.H.; Pollack, J.R.; et al. A genome-wide screen for promoter methylation in lung cancer identifies novel methylation markers for multiple malignancies. PLoS medicine 2006, 3, e486. [Google Scholar] [CrossRef] [PubMed]
- Novak, P.; Jensen, T.; Oshiro, M.M.; Watts, G.S.; Kim, C.J.; Futscher, B.W. Agglomerative epigenetic aberrations are a common event in human breast cancer. Cancer research 2008, 68, 8616–8625. [Google Scholar] [CrossRef]
- Heyn, H.; Esteller, M. DNA methylation profiling in the clinic: applications and challenges. Nature reviews. Genetics 2012, 13, 679–692. [Google Scholar] [CrossRef] [PubMed]
- Feinberg, A.P.; Ohlsson, R.; Henikoff, S. The epigenetic progenitor origin of human cancer. Nature reviews. Genetics 2006, 7, 21–33. [Google Scholar] [CrossRef] [PubMed]
- Sanchez-Vega, F.; Gotea, V.; Petrykowska, H.M.; Margolin, G.; Krivak, T.C.; DeLoia, J.A.; Bell, D.W.; Elnitski, L. Recurrent patterns of DNA methylation in the ZNF154, CASP8, and VHL promoters across a wide spectrum of human solid epithelial tumors and cancer cell lines. Epigenetics 2013, 8, 1355–1372. [Google Scholar] [CrossRef]
- Margolin, G.; Petrykowska, H.M.; Jameel, N.; Bell, D.W.; Young, A.C.; Elnitski, L. Robust Detection of DNA Hypermethylation of ZNF154 as a Pan-Cancer Locus with in Silico Modeling for Blood-Based Diagnostic Development. The Journal of molecular diagnostics : JMD 2016, 18, 283–298. [Google Scholar] [CrossRef]
- Miller, B.F.; Petrykowska, H.M.; Elnitski, L. Assessing ZNF154 methylation in patient plasma as a multicancer marker in liquid biopsies from colon, liver, ovarian and pancreatic cancer patients. Scientific reports 2021, 11, 221. [Google Scholar] [CrossRef]
- Miller, B.F.; Pisanic Ii, T.R.; Margolin, G.; Petrykowska, H.M.; Athamanolap, P.; Goncearenco, A.; Osei-Tutu, A.; Annunziata, C.M.; Wang, T.H.; Elnitski, L. Leveraging locus-specific epigenetic heterogeneity to improve the performance of blood-based DNA methylation biomarkers. Clinical epigenetics 2020, 12, 154. [Google Scholar] [CrossRef]
- Teschendorff, A.E.; Marabita, F.; Lechner, M.; Bartlett, T.; Tegner, J.; Gomez-Cabrero, D.; Beck, S. A beta-mixture quantile normalization method for correcting probe design bias in Illumina Infinium 450 k DNA methylation data. Bioinformatics (Oxford, England) 2013, 29, 189–196. [Google Scholar] [CrossRef] [PubMed]
- Lehne, B.; Drong, A.W.; Loh, M.; Zhang, W.; Scott, W.R.; Tan, S.T.; Afzal, U.; Scott, J.; Jarvelin, M.R.; Elliott, P.; et al. A coherent approach for analysis of the Illumina HumanMethylation450 BeadChip improves data quality and performance in epigenome-wide association studies. Genome biology 2015, 16, 37. [Google Scholar] [CrossRef]
- Terunuma, A.; Putluri, N.; Mishra, P.; Mathé, E.A.; Dorsey, T.H.; Yi, M.; Wallace, T.A.; Issaq, H.J.; Zhou, M.; Killian, J.K.; et al. MYC-driven accumulation of 2-hydroxyglutarate is associated with breast cancer prognosis. The Journal of clinical investigation 2014, 124, 398–412. [Google Scholar] [CrossRef]
- Worsham, M.J.; Chitale, D.; Chen, K.M.; Datta, I.; Divine, G. Cell signaling events differentiate ER-negative subtypes from ER-positive breast cancer. Medical oncology (Northwood, London, England) 2015, 32, 142. [Google Scholar] [CrossRef] [PubMed]
- Gao, Y.; Jones, A.; Fasching, P.A.; Ruebner, M.; Beckmann, M.W.; Widschwendter, M.; Teschendorff, A.E. The integrative epigenomic-transcriptomic landscape of ER positive breast cancer. Clinical epigenetics 2015, 7, 126. [Google Scholar] [CrossRef] [PubMed]
- Timp, W.; Bravo, H.C.; McDonald, O.G.; Goggins, M.; Umbricht, C.; Zeiger, M.; Feinberg, A.P.; Irizarry, R.A. Large hypomethylated blocks as a universal defining epigenetic alteration in human solid tumors. Genome medicine 2014, 6, 61. [Google Scholar] [CrossRef]
- Aref-Eshghi, E.; Schenkel, L.C.; Ainsworth, P.; Lin, H.; Rodenhiser, D.I.; Cutz, J.C.; Sadikovic, B. Genomic DNA Methylation-Derived Algorithm Enables Accurate Detection of Malignant Prostate Tissues. Front Oncol 2018, 8, 100. [Google Scholar] [CrossRef]
- Kang, S.; Li, Q.; Chen, Q.; Zhou, Y.; Park, S.; Lee, G.; Grimes, B.; Krysan, K.; Yu, M.; Wang, W.; et al. CancerLocator: non-invasive cancer diagnosis and tissue-of-origin prediction using methylation profiles of cell-free DNA. Genome biology 2017, 18, 53. [Google Scholar] [CrossRef] [PubMed]
- Li, W.; Li, Q.; Kang, S.; Same, M.; Zhou, Y.; Sun, C.; Liu, C.C.; Matsuoka, L.; Sher, L.; Wong, W.H.; et al. CancerDetector: ultrasensitive and non-invasive cancer detection at the resolution of individual reads using cell-free DNA methylation sequencing data. Nucleic acids research 2018, 46, e89. [Google Scholar] [CrossRef] [PubMed]
- Chan, K.C.; Jiang, P.; Chan, C.W.; Sun, K.; Wong, J.; Hui, E.P.; Chan, S.L.; Chan, W.C.; Hui, D.S.; Ng, S.S.; et al. Noninvasive detection of cancer-associated genome-wide hypomethylation and copy number aberrations by plasma DNA bisulfite sequencing. Proceedings of the National Academy of Sciences of the United States of America 2013, 110, 18761–18768. [Google Scholar] [CrossRef]
- Heitzer, E.; Auinger, L.; Speicher, M.R. Cell-Free DNA and Apoptosis: How Dead Cells Inform About the Living. Trends Mol Med 2020, 26, 519–528. [Google Scholar] [CrossRef]
- Krueger, F.; Andrews, S.R. Bismark: a flexible aligner and methylation caller for Bisulfite-Seq applications. Bioinformatics (Oxford, England) 2011, 27, 1571–1572. [Google Scholar] [CrossRef] [PubMed]
- Consortium, E.P. An integrated encyclopedia of DNA elements in the human genome. Nature 2012, 489, 57–74. [Google Scholar] [CrossRef]
- Andrews, P.W.; Damjanov, I.; Simon, D.; Banting, G.S.; Carlin, C.; Dracopoli, N.C.; Føgh, J. Pluripotent embryonal carcinoma clones derived from the human teratocarcinoma cell line Tera-2. Differentiation in vivo and in vitro. Laboratory investigation; a journal of technical methods and pathology 1984, 50, 147–162. [Google Scholar]
- Sun, K.; Jiang, P.; Chan, K.C.; Wong, J.; Cheng, Y.K.; Liang, R.H.; Chan, W.K.; Ma, E.S.; Chan, S.L.; Cheng, S.H.; et al. Plasma DNA tissue mapping by genome-wide methylation sequencing for noninvasive prenatal, cancer, and transplantation assessments. Proceedings of the National Academy of Sciences of the United States of America 2015, 112, E5503–E5512. [Google Scholar] [CrossRef] [PubMed]
- Underhill, H.R.; Kitzman, J.O.; Hellwig, S.; Welker, N.C.; Daza, R.; Baker, D.N.; Gligorich, K.M.; Rostomily, R.C.; Bronner, M.P.; Shendure, J. Fragment Length of Circulating Tumor DNA. PLoS genetics 2016, 12, e1006162. [Google Scholar] [CrossRef]
- Heitzer, E.; Haque, I.S.; Roberts, C.E.S.; Speicher, M.R. Current and future perspectives of liquid biopsies in genomics-driven oncology. Nature reviews. Genetics 2019, 20, 71–88. [Google Scholar] [CrossRef]
- Nagpal, M.; Singh, S.; Singh, P.; Chauhan, P.; Zaidi, M.A. Tumor markers: A diagnostic tool. National journal of maxillofacial surgery 2016, 7, 17–20. [Google Scholar] [CrossRef]
- Torres, S.; Gonzalez, A.; Cunquero Tomas, A.J.; Calabuig Farinas, S.; Ferrero, M.; Mirda, D.; Sirera, R.; Jantus-Lewintre, E.; Camps, C. A profile on cobas(R) EGFR Mutation Test v2 as companion diagnostic for first-line treatment of patients with non-small cell lung cancer. Expert Rev Mol Diagn 2020, 20, 575–582. [Google Scholar] [CrossRef] [PubMed]
- Leighl, N.B.; Page, R.D.; Raymond, V.M.; Daniel, D.B.; Divers, S.G.; Reckamp, K.L.; Villalona-Calero, M.A.; Dix, D.; Odegaard, J.I.; Lanman, R.B.; et al. Clinical Utility of Comprehensive Cell-free DNA Analysis to Identify Genomic Biomarkers in Patients with Newly Diagnosed Metastatic Non-small Cell Lung Cancer. Clinical cancer research : an official journal of the American Association for Cancer Research 2019, 25, 4691–4700. [Google Scholar] [CrossRef]
- Woodhouse, R.; Li, M.; Hughes, J.; Delfosse, D.; Skoletsky, J.; Ma, P.; Meng, W.; Dewal, N.; Milbury, C.; Clark, T.; et al. Clinical and analytical validation of FoundationOne Liquid CDx, a novel 324-Gene cfDNA-based comprehensive genomic profiling assay for cancers of solid tumor origin. PloS one 2020, 15, e0237802. [Google Scholar] [CrossRef]
- Liu, M.C.; Oxnard, G.R.; Klein, E.A.; Swanton, C.; Seiden, M.V.; Consortium, C. Sensitive and specific multi-cancer detection and localization using methylation signatures in cell-free DNA. Ann Oncol 2020, 31, 745–759. [Google Scholar] [CrossRef] [PubMed]
- Cohen, J.D.; Li, L.; Wang, Y.; Thoburn, C.; Afsari, B.; Danilova, L.; Douville, C.; Javed, A.A.; Wong, F.; Mattox, A.; et al. Detection and localization of surgically resectable cancers with a multi-analyte blood test. Science (New York, N.Y.) 2018, 359, 926–930. [Google Scholar] [CrossRef] [PubMed]
- Phallen, J.; Sausen, M.; Adleff, V.; Leal, A.; Hruban, C.; White, J.; Anagnostou, V.; Fiksel, J.; Cristiano, S.; Papp, E.; et al. Direct detection of early-stage cancers using circulating tumor DNA. Sci Transl Med 2017, 9. [Google Scholar] [CrossRef]
- Durinck, K.; Van Loocke, W.; Van der Meulen, J.; Van de Walle, I.; Ongenaert, M.; Rondou, P.; Wallaert, A.; de Bock, C.E.; Van Roy, N.; Poppe, B.; et al. Characterization of the genome-wide TLX1 binding profile in T-cell acute lymphoblastic leukemia. Leukemia 2015, 29, 2317–2327. [Google Scholar] [CrossRef]
- Misawa, K.; Ueda, Y.; Kanazawa, T.; Misawa, Y.; Jang, I.; Brenner, J.C.; Ogawa, T.; Takebayashi, S.; Grenman, R.A.; Herman, J.G.; et al. Epigenetic inactivation of galanin receptor 1 in head and neck cancer. Clinical cancer research : an official journal of the American Association for Cancer Research 2008, 14, 7604–7613. [Google Scholar] [CrossRef]
- Zhang, W.; Shu, P.; Wang, S.; Song, J.; Liu, K.; Wang, C.; Ran, L. ZNF154 is a promising diagnosis biomarker and predicts biochemical recurrence in prostate cancer. Gene 2018, 675, 136–143. [Google Scholar] [CrossRef]
- Reinert, T.; Modin, C.; Castano, F.M.; Lamy, P.; Wojdacz, T.K.; Hansen, L.L.; Wiuf, C.; Borre, M.; Dyrskjøt, L.; Orntoft, T.F. Comprehensive genome methylation analysis in bladder cancer: identification and validation of novel methylated genes and application of these as urinary tumor markers. Clinical cancer research : an official journal of the American Association for Cancer Research 2011, 17, 5582–5592. [Google Scholar] [CrossRef] [PubMed]
- Qureshi, S.A.; Bashir, M.U.; Yaqinuddin, A. Utility of DNA methylation markers for diagnosing cancer. International journal of surgery (London, England) 2010, 8, 194–198. [Google Scholar] [CrossRef]
- Lissa, D.; Robles, A.I. Methylation analyses in liquid biopsy. Translational lung cancer research 2016, 5, 492–504. [Google Scholar] [CrossRef]
- Godsey, J.H.; Silvestro, A.; Barrett, J.C.; Bramlett, K.; Chudova, D.; Deras, I.; Dickey, J.; Hicks, J.; Johann, D.J.; Leary, R.; et al. Generic Protocols for the Analytical Validation of Next-Generation Sequencing-Based ctDNA Assays: A Joint Consensus Recommendation of the BloodPAC's Analytical Variables Working Group. Clinical chemistry 2020, 66, 1156–1166. [Google Scholar] [CrossRef]
- Imperiale, T.F.; Ransohoff, D.F.; Itzkowitz, S.H.; Levin, T.R.; Lavin, P.; Lidgard, G.P.; Ahlquist, D.A.; Berger, B.M. Multitarget stool DNA testing for colorectal-cancer screening. N Engl J Med 2014, 370, 1287–1297. [Google Scholar] [CrossRef] [PubMed]
- Aberle, D.R.; DeMello, S.; Berg, C.D.; Black, W.C.; Brewer, B.; Church, T.R.; Clingan, K.L.; Duan, F.; Fagerstrom, R.M.; Gareen, I.F.; et al. Results of the two incidence screenings in the National Lung Screening Trial. N Engl J Med 2013, 369, 920–931. [Google Scholar] [CrossRef]
- Klein, E.A.; Richards, D.; Cohn, A.; Tummala, M.; Lapham, R.; Cosgrove, D.; Chung, G.; Clement, J.; Gao, J.; Hunkapiller, N.; et al. Clinical validation of a targeted methylation-based multi-cancer early detection test using an independent validation set. Ann Oncol 2021, 32, 1167–1177. [Google Scholar] [CrossRef] [PubMed]
- Diehl, F.; Li, M.; Dressman, D.; He, Y.; Shen, D.; Szabo, S.; Diaz, L.A., Jr.; Goodman, S.N.; David, K.A.; Juhl, H.; et al. Detection and quantification of mutations in the plasma of patients with colorectal tumors. Proceedings of the National Academy of Sciences of the United States of America 2005, 102, 16368–16373. [Google Scholar] [CrossRef]
- Jahr, S.; Hentze, H.; Englisch, S.; Hardt, D.; Fackelmayer, F.O.; Hesch, R.D.; Knippers, R. DNA fragments in the blood plasma of cancer patients: quantitations and evidence for their origin from apoptotic and necrotic cells. Cancer research 2001, 61, 1659–1665. [Google Scholar] [PubMed]
- Fleischhacker, M.; Schmidt, B. Circulating nucleic acids (CNAs) and cancer--a survey. Biochimica et biophysica acta 2007, 1775, 181–232. [Google Scholar] [CrossRef] [PubMed]
- Heitzer, E.; Ulz, P.; Geigl, J.B. Circulating tumor DNA as a liquid biopsy for cancer. Clinical chemistry 2015, 61, 112–123. [Google Scholar] [CrossRef]
- Bredno, J.; Lipson, J.; Venn, O.; Aravanis, A.M.; Jamshidi, A. Clinical correlates of circulating cell-free DNA tumor fraction. PloS one 2021, 16, e0256436. [Google Scholar] [CrossRef] [PubMed]
- Ahlquist, D.A. Universal cancer screening: revolutionary, rational, and realizable. NPJ Precis Oncol 2018, 2, 23. [Google Scholar] [CrossRef] [PubMed]
Figure 1.
Regional hypermethylation of three multi-cancer methylation biomarkers in 14 types of cancer. Methylation beta values at (a) ZNF154, (b) TLX1, and (c) GALR1 between tumor and normal control tissue samples, shown in extended windows of >1kb including the probe of interest. Each vertical bar represents the median beta value for individual CpG sites on the Illumina array, and each grid position shows a different cancer type. Bars are colored by sample type (tumors in pink and normal in cyan blue) and plotted as overlayed bars (overlap is shown in gray). The density of CpG sites present in these windows varies by gene: ZNF154=11, TLX1=9, and GALR1=25. The gray arrows indicate the probes with the highest median differential methylation value for each locus, averaged across all 14 cancer types. All methylation data were obtained from The Cancer Genome Atlas.
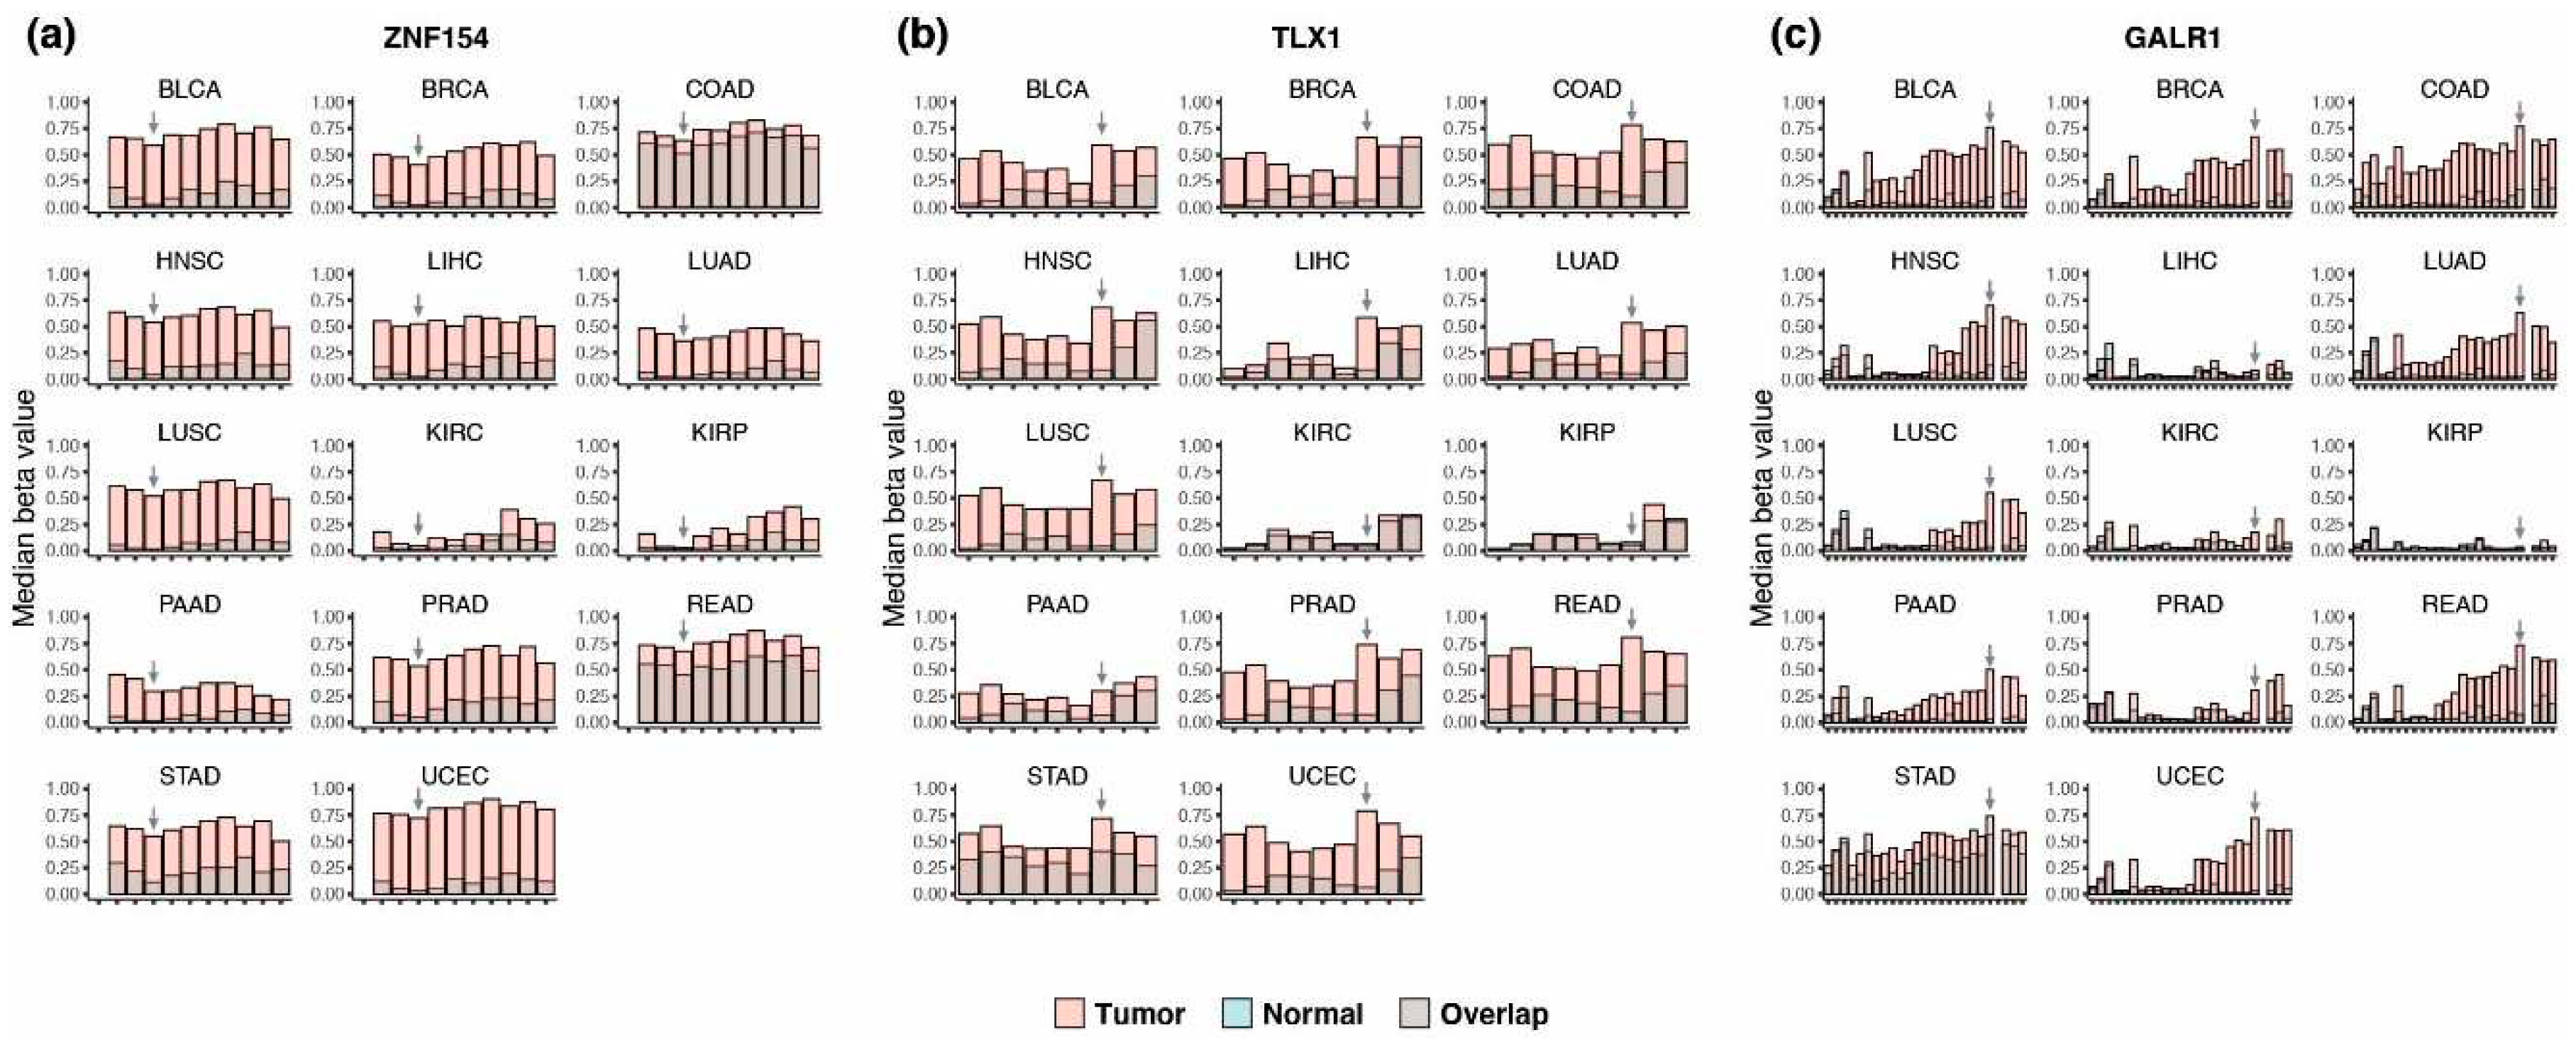
Figure 2.
DNA methylation status at ZNF154, TLX1, and GALR1 in cell lines. Healthy (n=30), tumor-derived (n=23), and not specified (n=9) cell lines are arrayed along the x-axis with corresponding methylation beta values plotted on the y-axis. Data were obtained from the ENCODE Consortium using the Illumina Infinium Human Methylation 450K Bead Array. The tumor or nontumor origin of cell lines was determined using karyotype analysis provided by the ENCODE Consortium [35]. The white line represents the density histogram of beta values, where bright yellow represents full methylation, dark blue equals no methylation and greens represents 50% methylation.
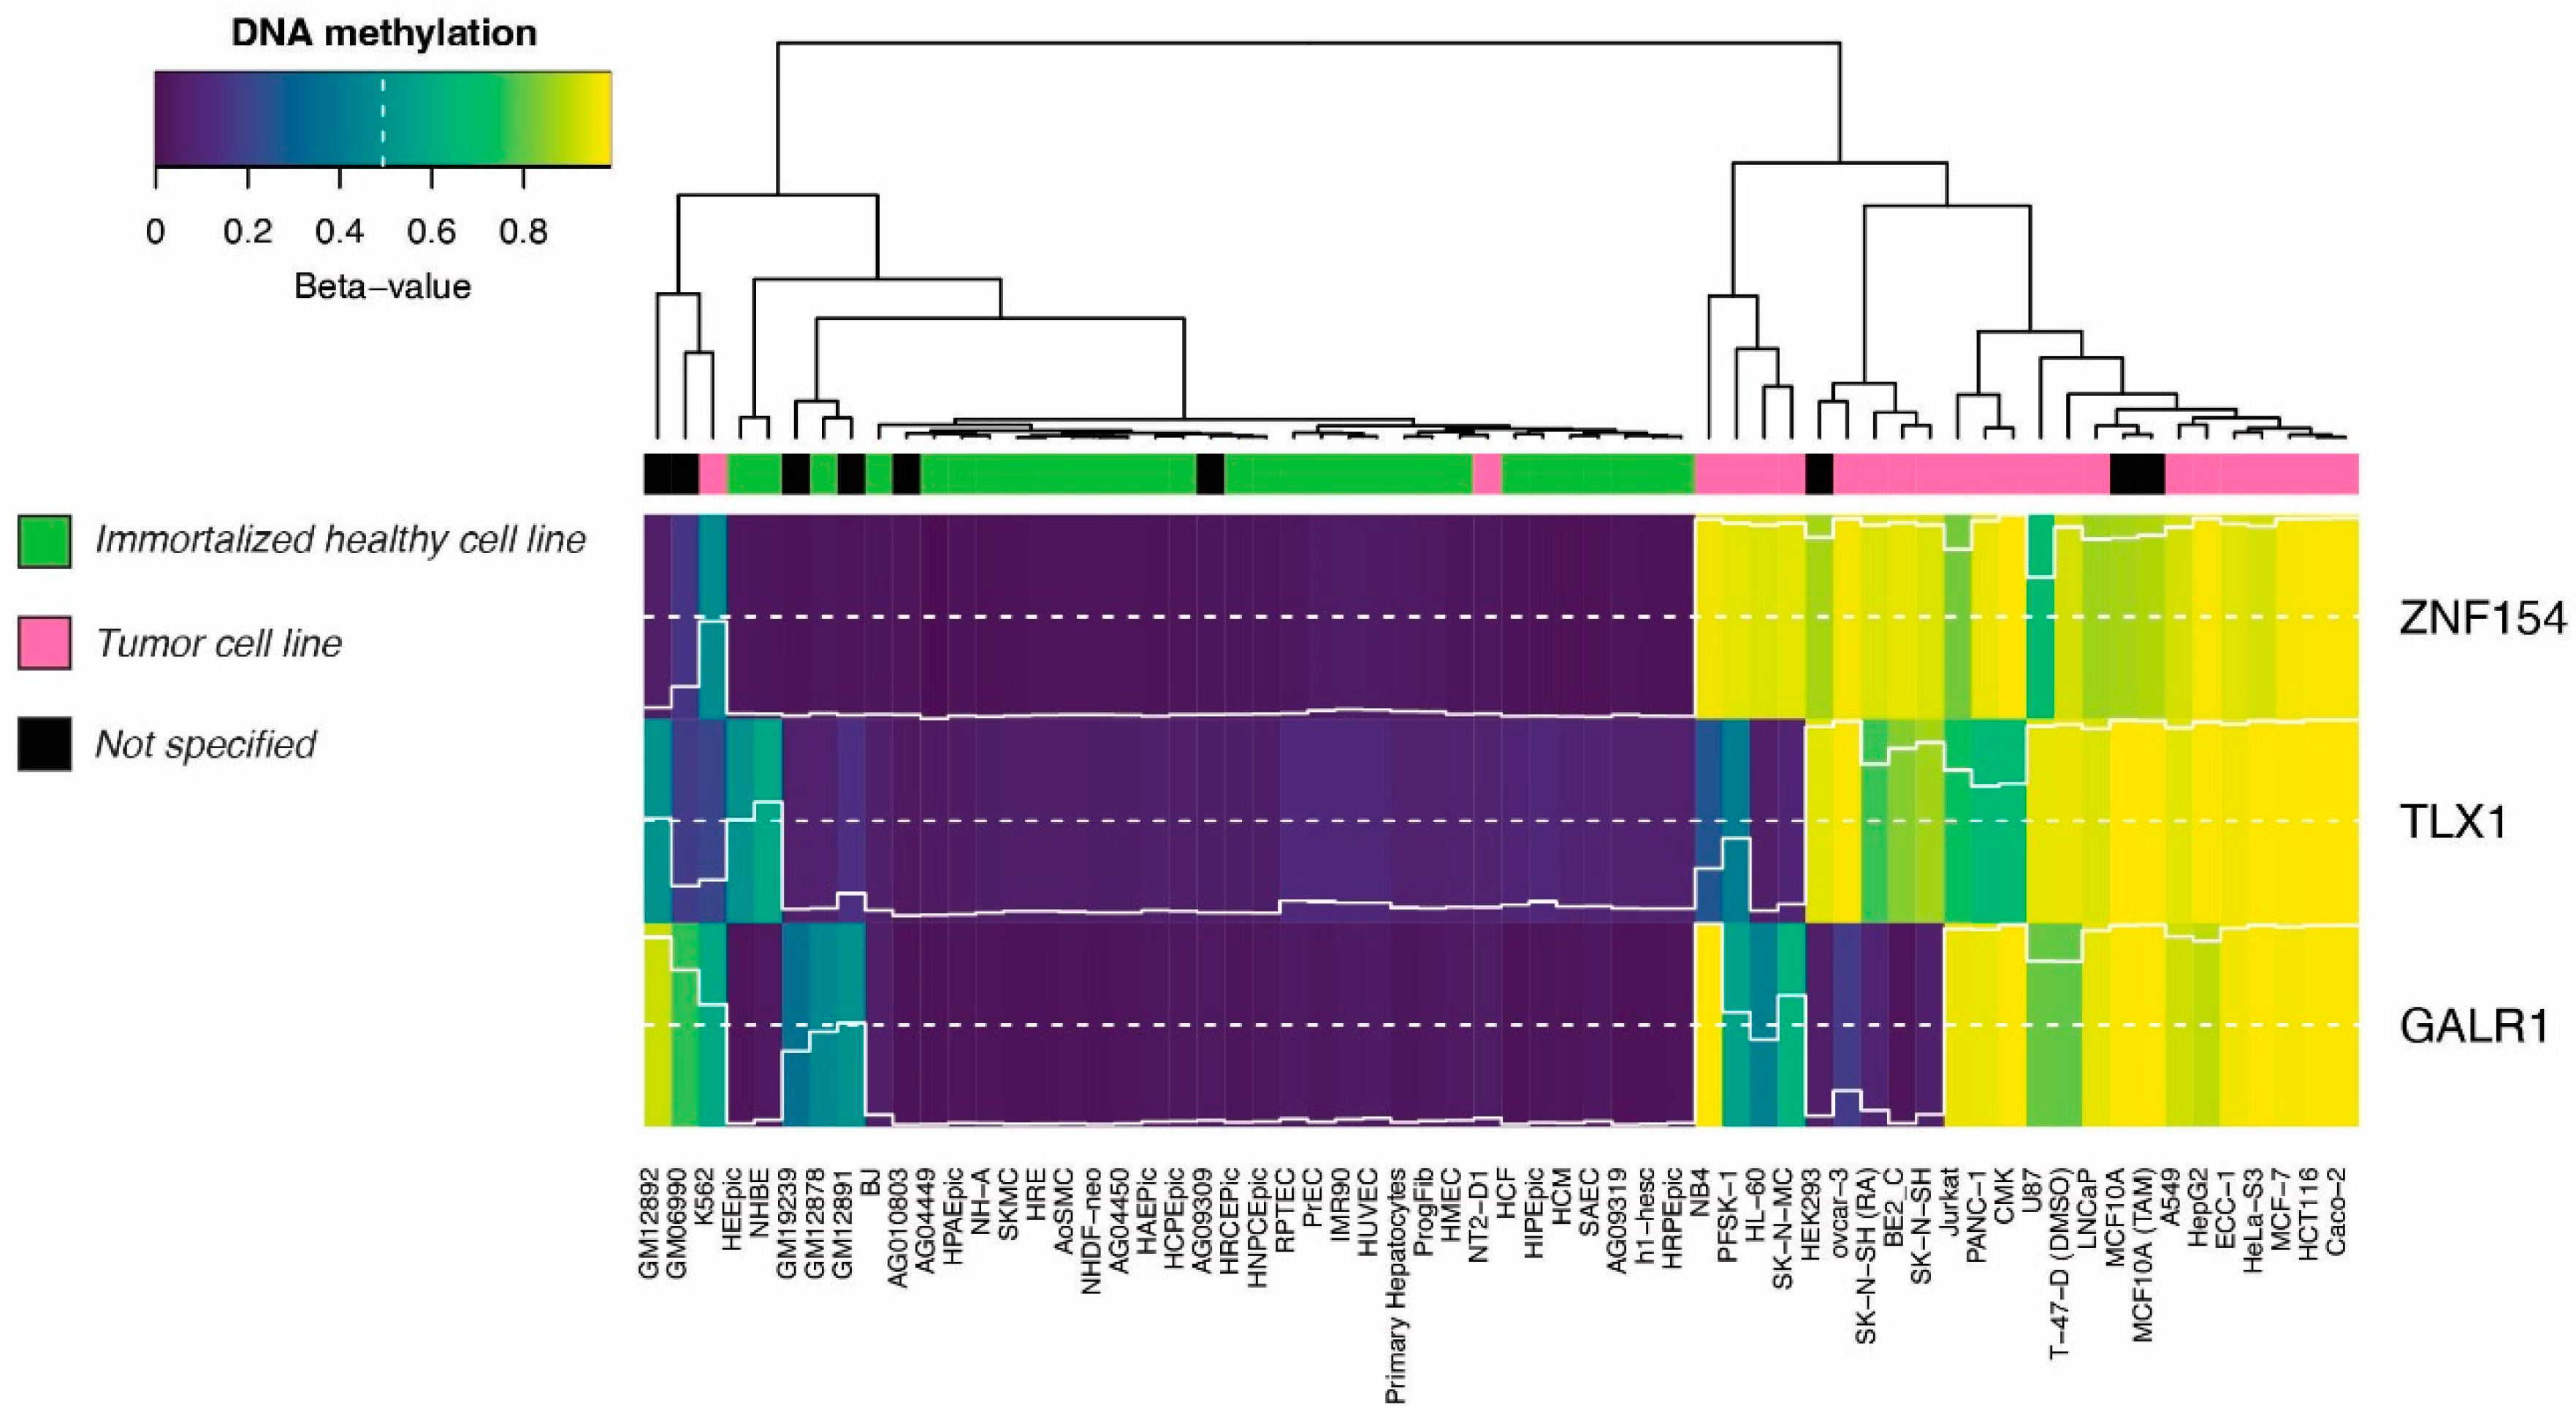
Figure 3.
Performance of TLX1, GALR1, and ZNF154 in classifying tumor versus normal tissue. Area under the ROC curve (AUC) values are plotted for each of the 14 tissue types (in total 4,050 tumor samples, 646 normal tissue samples). Bar colors indicate the biomarker tested (white = GALR1, dark grey = TLX1, light grey = ZNF154). All methylation data were obtained from The Cancer Genome Atlas repository and abbreviated as in Figure 1.
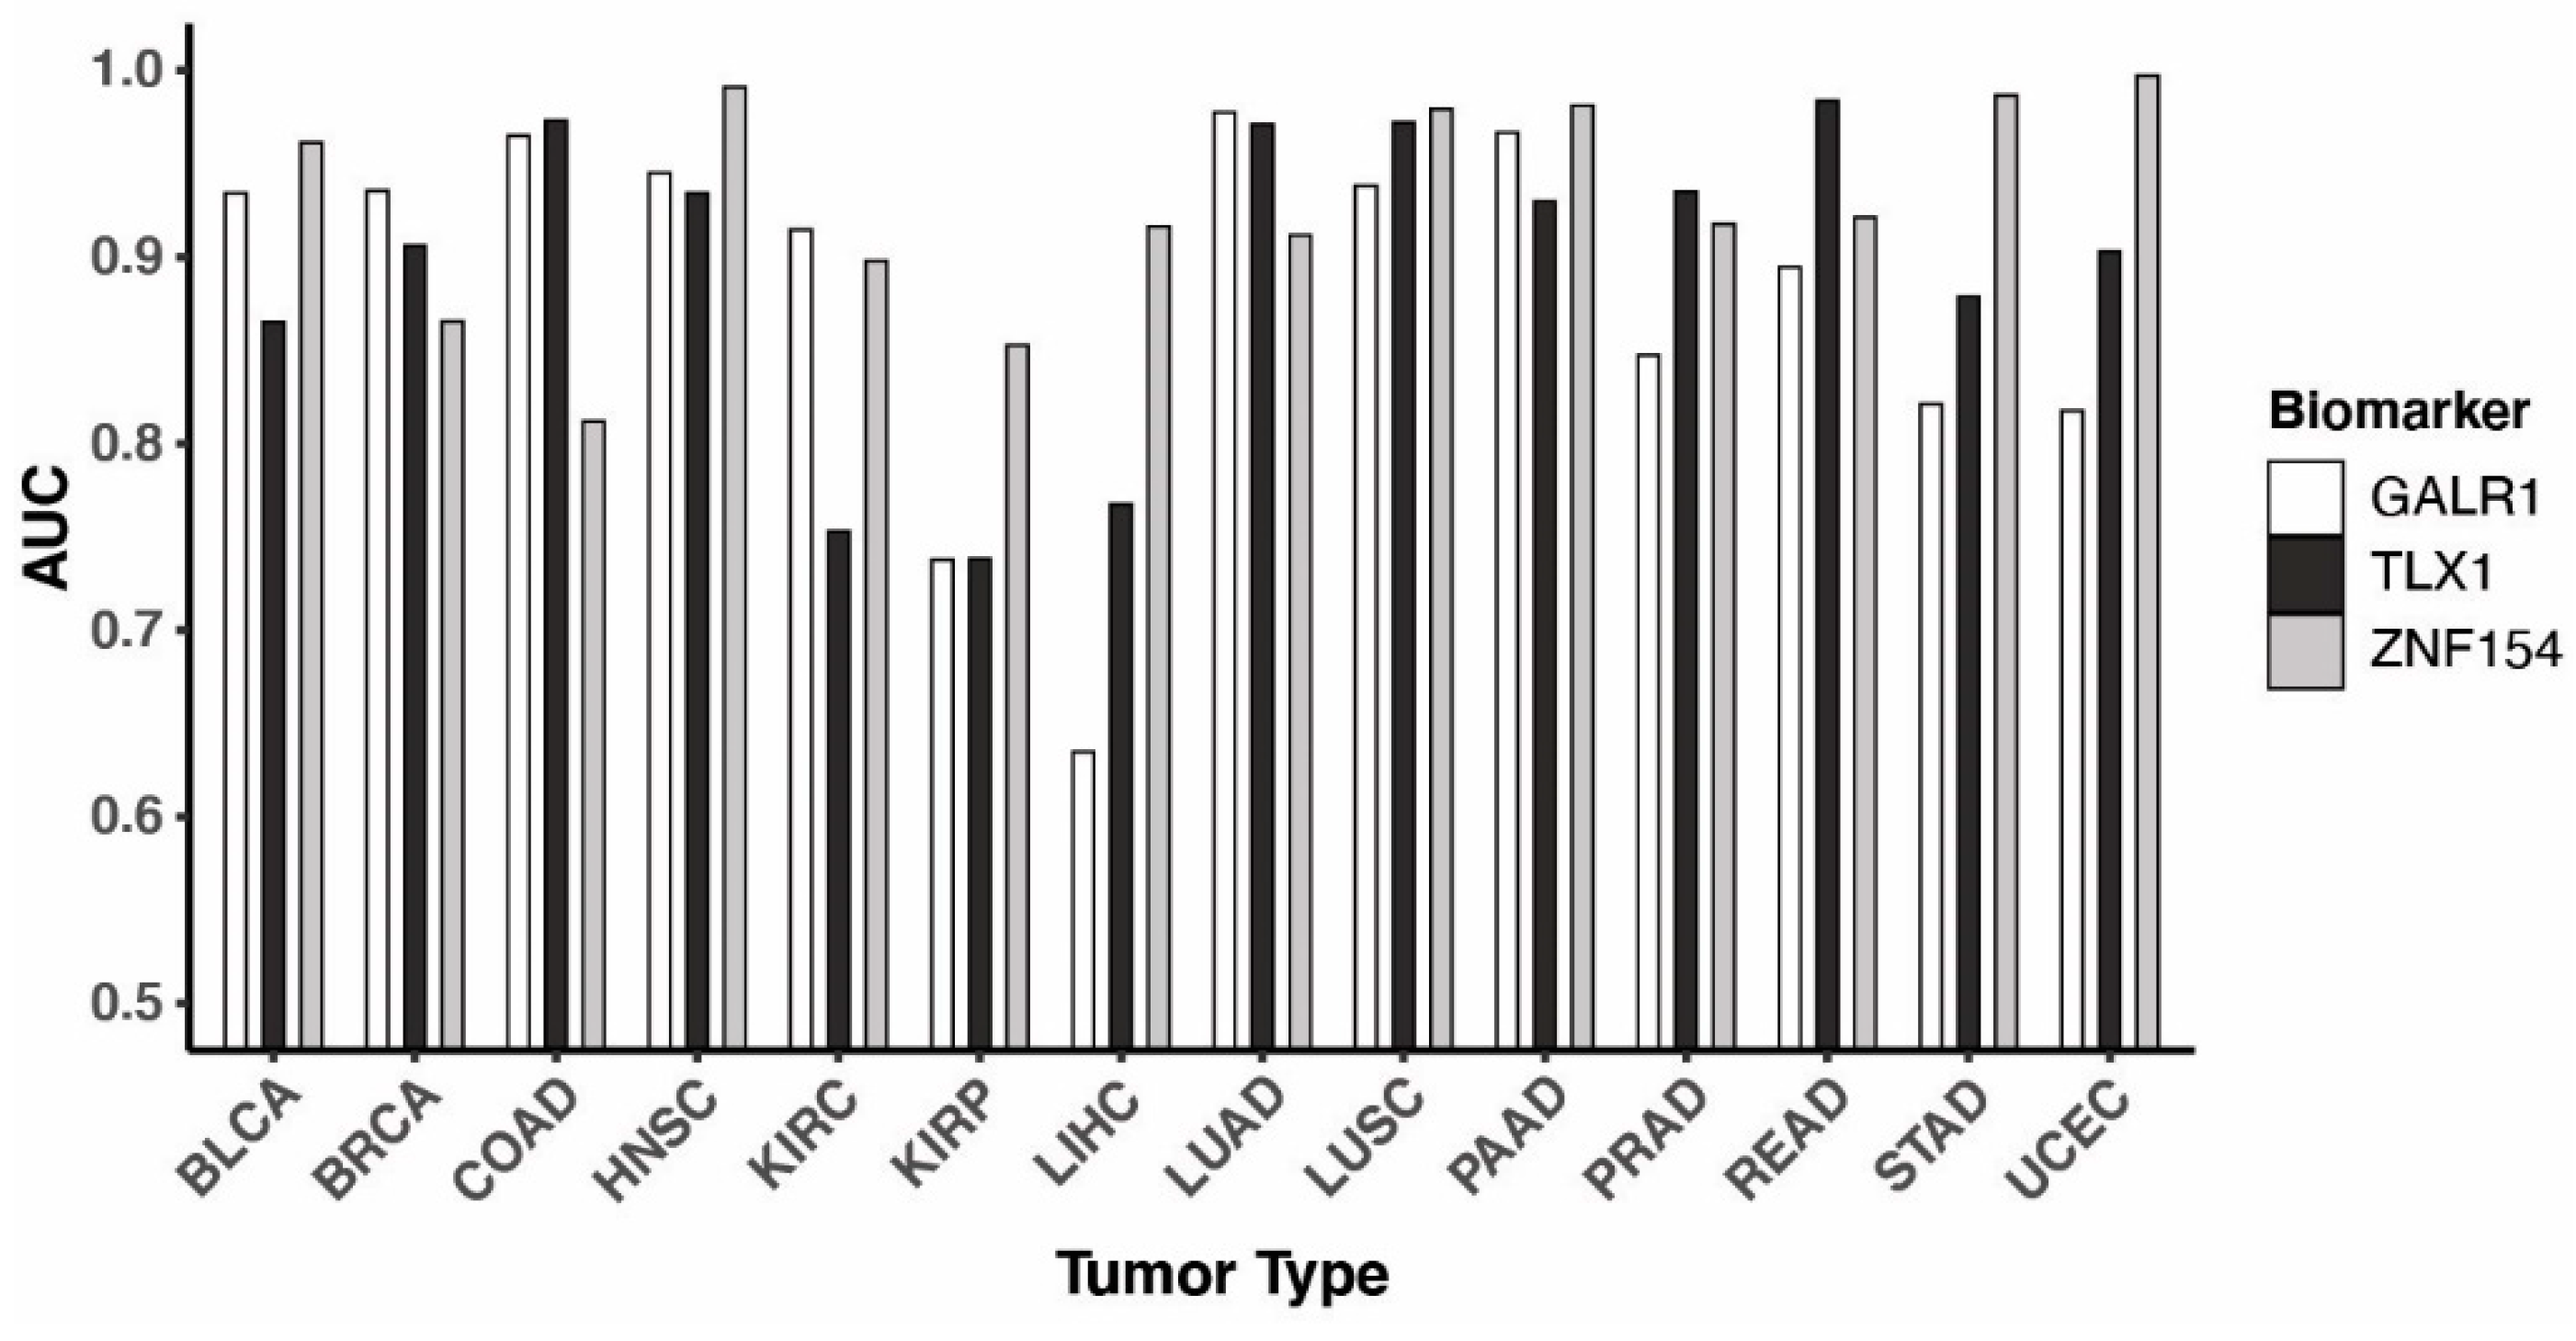
Figure 4.
Performance of TLX1, GALR1, and ZNF154 combinations in tumor classification. (a) Box plots are shown using the area under the receiver operating characteristic (ROC) curve (AUC) for each possible marker combination (G, GALR1; T, TLX1; Z, ZNF154). AUC values were calculated for each of the 14 cancer types (4,050 tumor samples, 646 normal tissue samples), thus each boxplot contains 14 AUC values. All marker combinations were compared by Friedman test followed by a pairwise comparison between the triple marker assay and each of the other combinations using Wilcoxon signed-rank test with Bonferroni correction. * indicates P-value < 0.05, ** indicates P-value < 0.01, ns indicates ‘not significant’. (b) and (c) ROC curves showing classification performance in colon cancer vs normal tissue by either the three markers separately (b) or combined (c). All methylation data were obtained from The Cancer Genome Atlas.
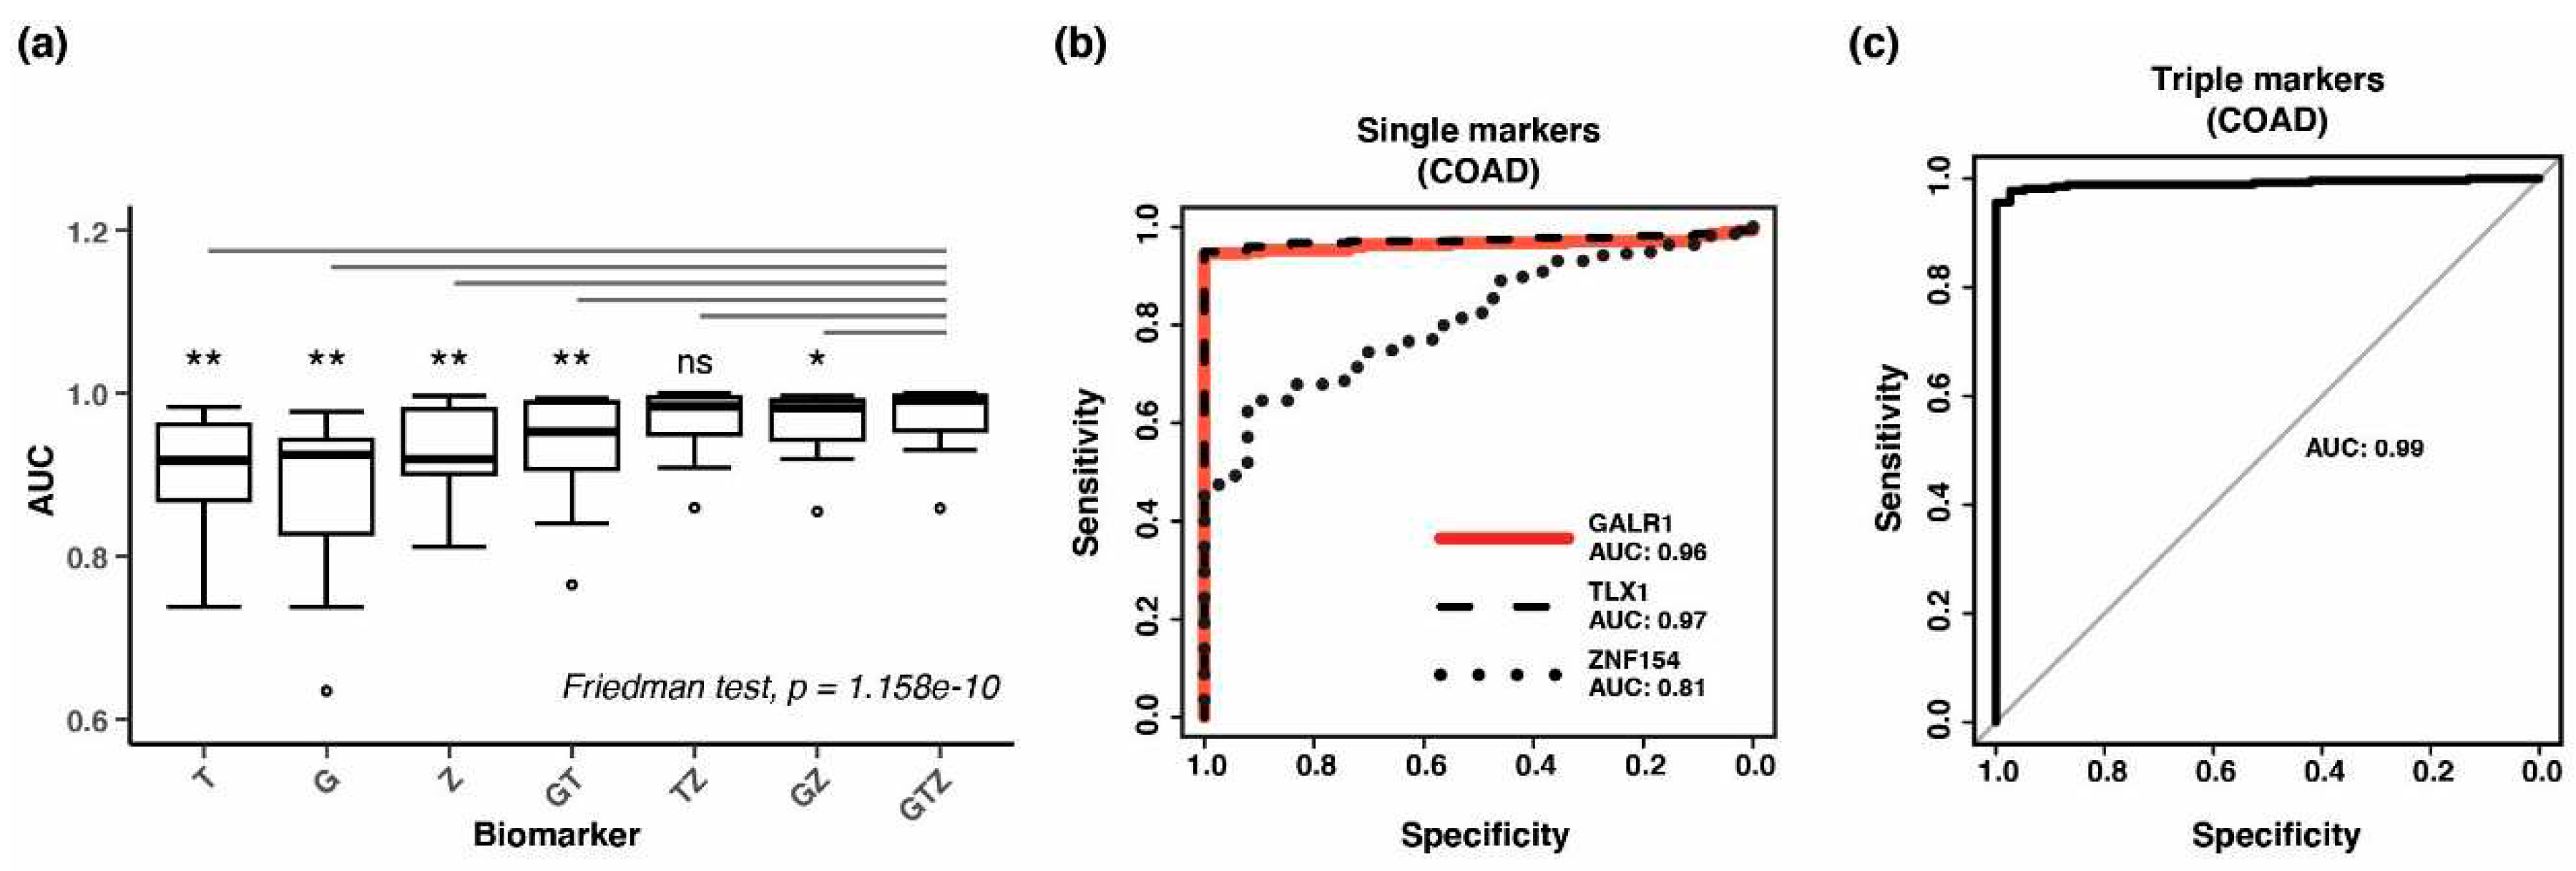
Figure 5.
Hypermethylation at the three methylation probes in independent validation cohorts. Box plots of methylation beta values in (a) BRCA (GSE37754, GSE66695, GSE69914), (b) COAD (GSE53051), (c) LUAD (GSE53051), and (d) PRAD (GSE112047) for each methylation probe. Tumor types are abbreviated as in Figure 1. The number of samples in each group is listed in Table 2.
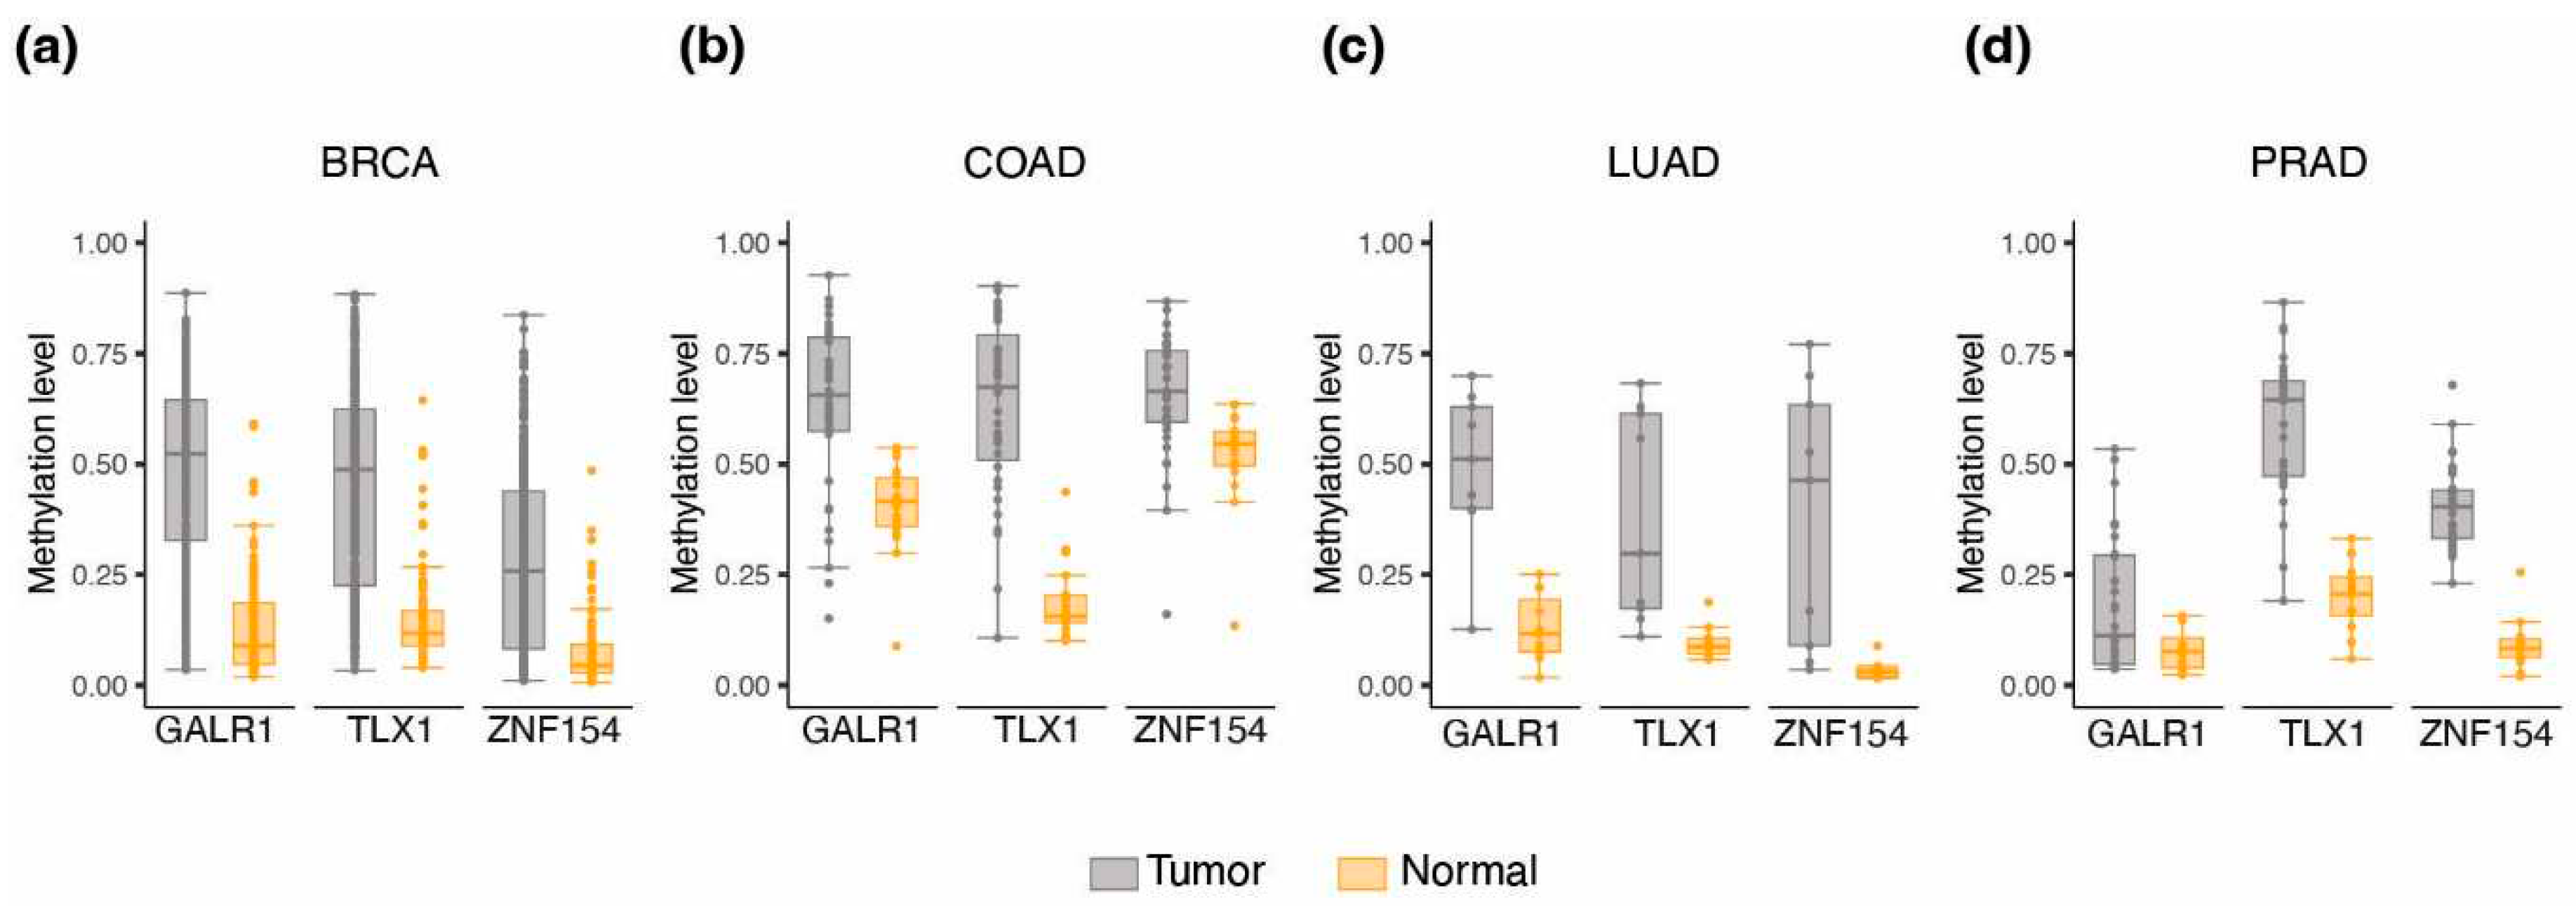
Figure 6.
Hypermethylation at the three methylation probes in early-stage tumors. Box plots of methylation beta values at (a) ZNF154, (b) TLX1, and (c) GALR1 for each cancer type in stage I tumors and normal tissue samples. The number of tumor/normal samples is listed in parenthesis below each cancer type. * indicates
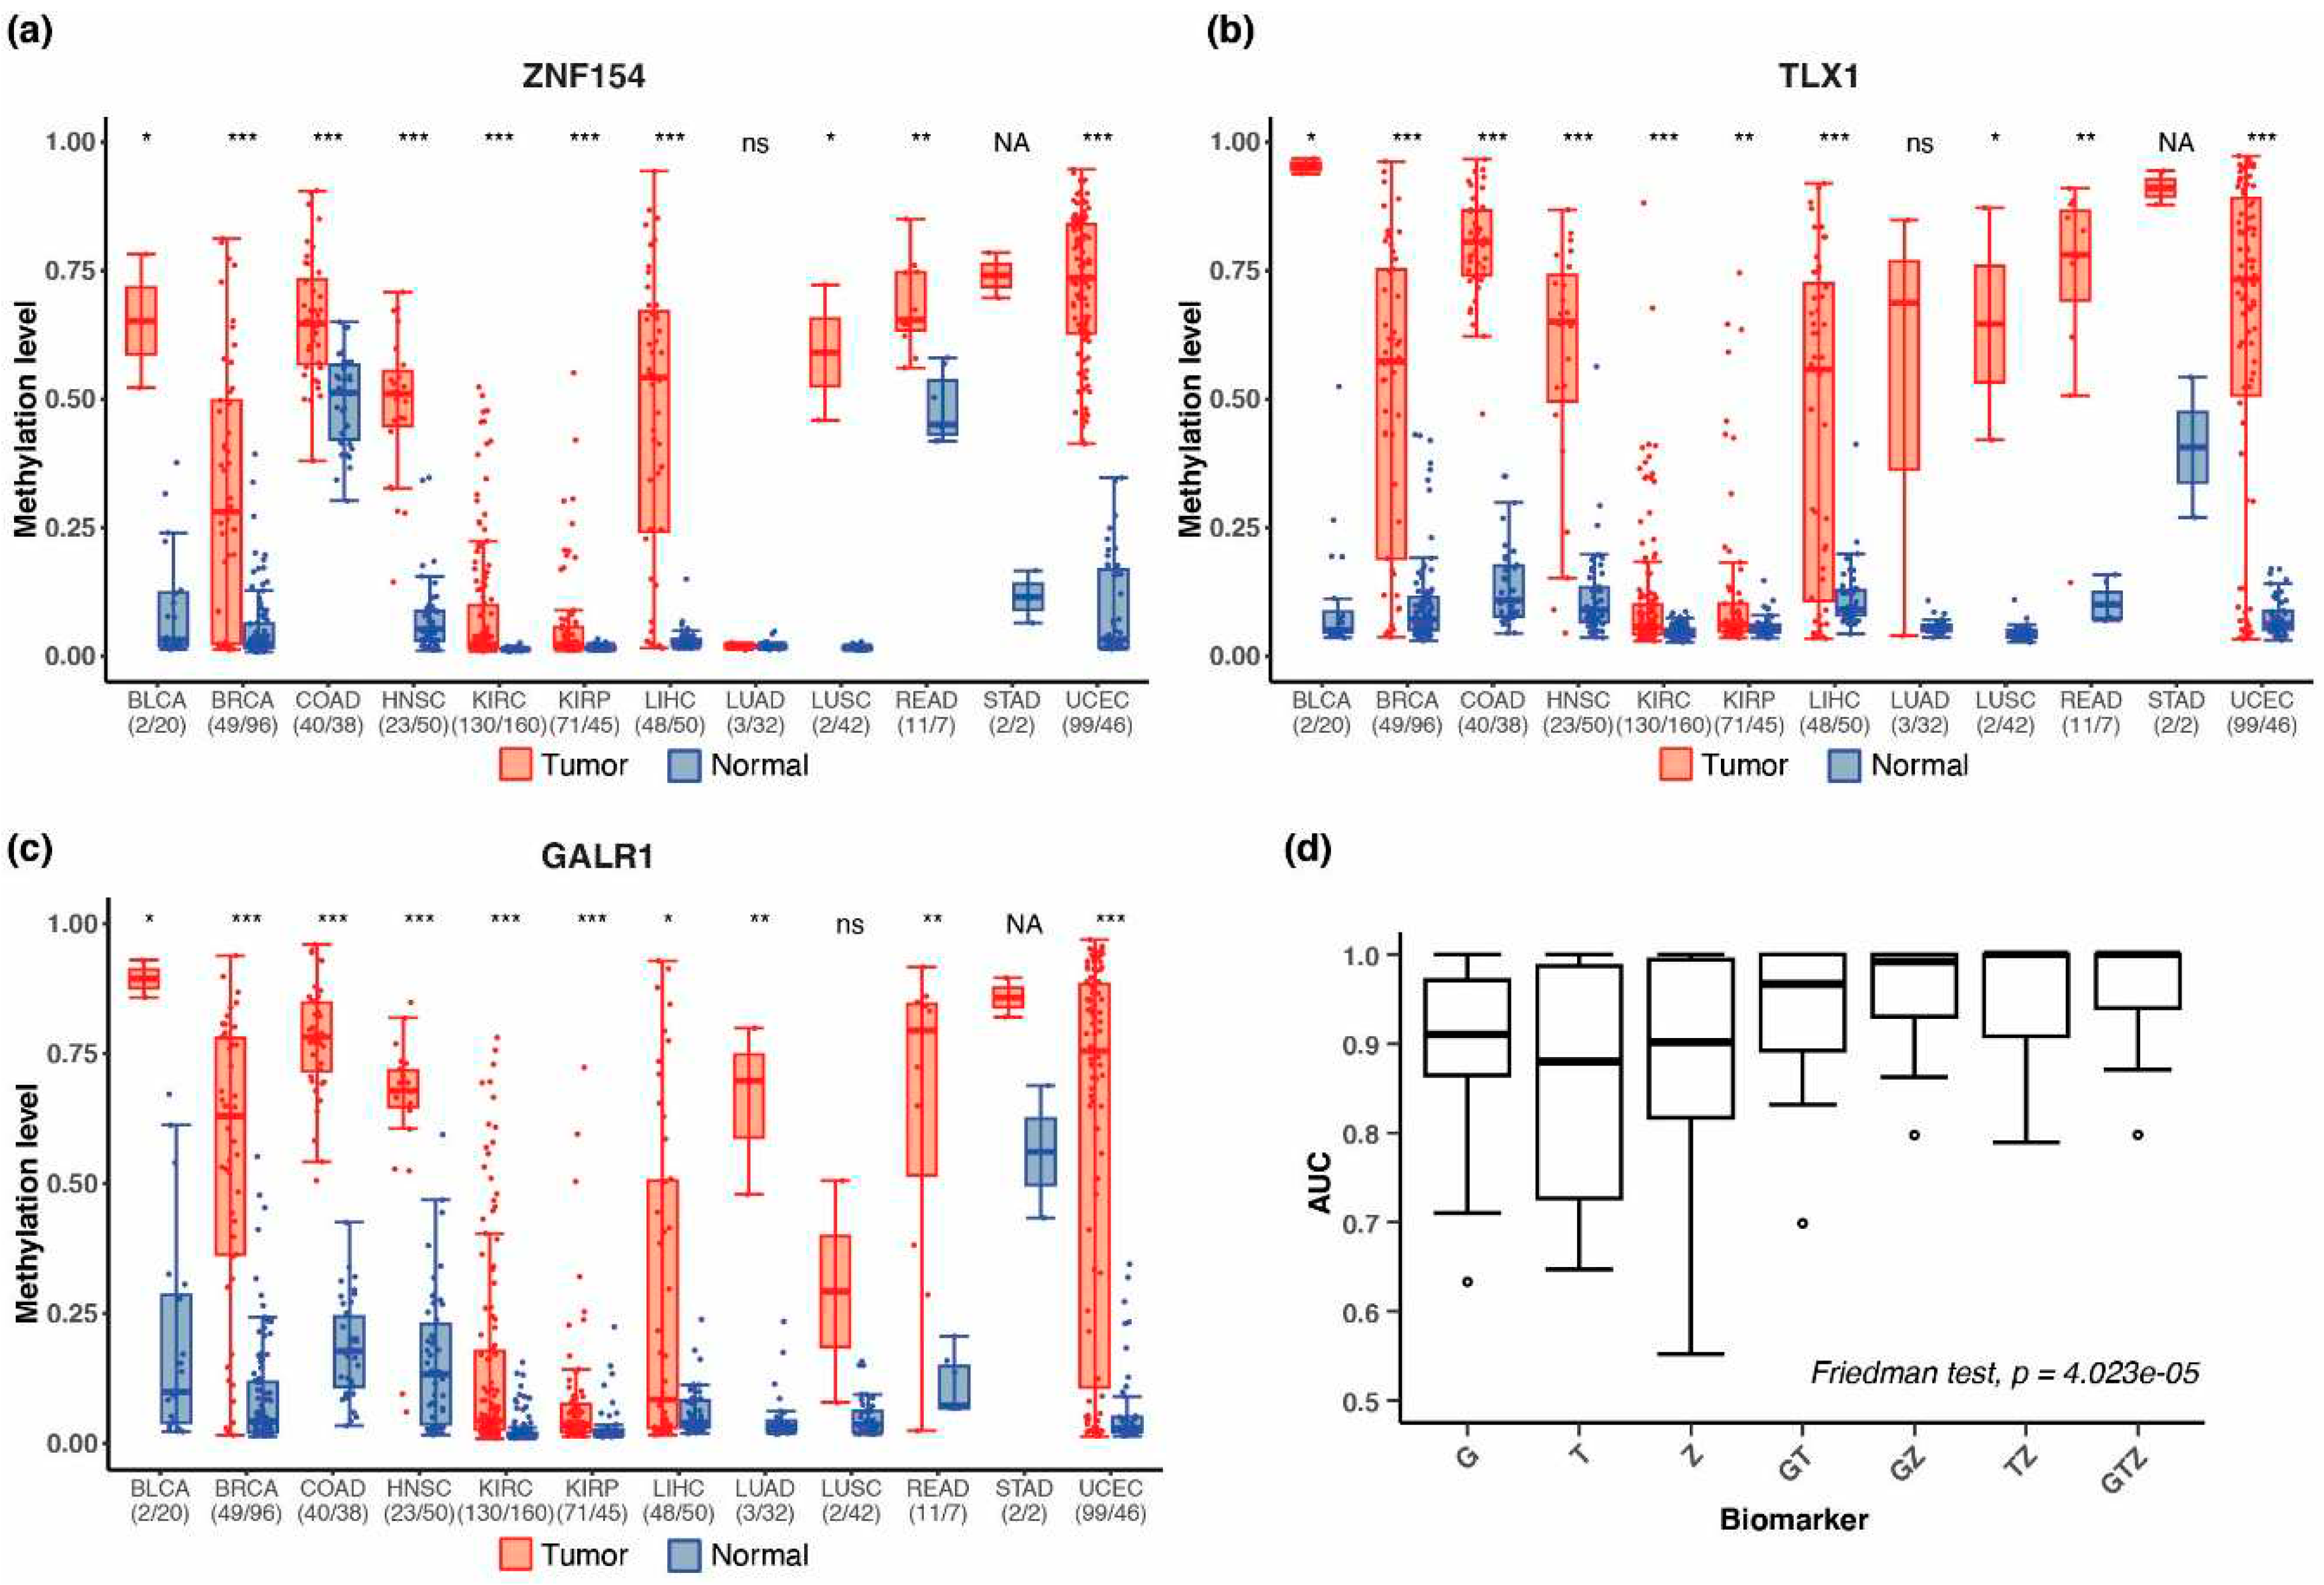
Figure 7.
Simulated dilutions of tumor DNA into WBC DNA. (a) Box plots of methylation levels (beta value) at GALR1, TLX1, and ZNF154 in DNA from tumor (n=4,050, all tumor samples combined into one cohort), normal tissue (n=646, all normal samples combined into one cohort), or peripheral white blood cell samples (WBC-DNA) (n=2,711). Methylation data were obtained from The Cancer Genome Atlas or GEO. *** indicates P-value < 0.0001 (for Wilcoxon rank sum test). (b) AUC values displayed by biomarker combination across a range of simulated dilutions (100–1%) of tumor DNA into WBC DNA. AUC values were derived from ROC curve analysis of all tumor samples (n=4,050) vs peripheral white blood cell samples (n=2,711). (c) Sensitivity of detecting tumor samples with a ctDNA concentration of 10%. Each bar represents a tumor type (grey bars). The pink bar shows performance when considering all tumor samples in one pool. Bar height shows the mean sensitivity (%) and dots represent performance of individual marker combinations. (d) Specificity in classification of peripheral white blood cell samples. Each bar represents an individual assay. For (b), (c), and (d) markers are abbreviated as G = GALR1, T = TLX1, and Z = ZNF154.
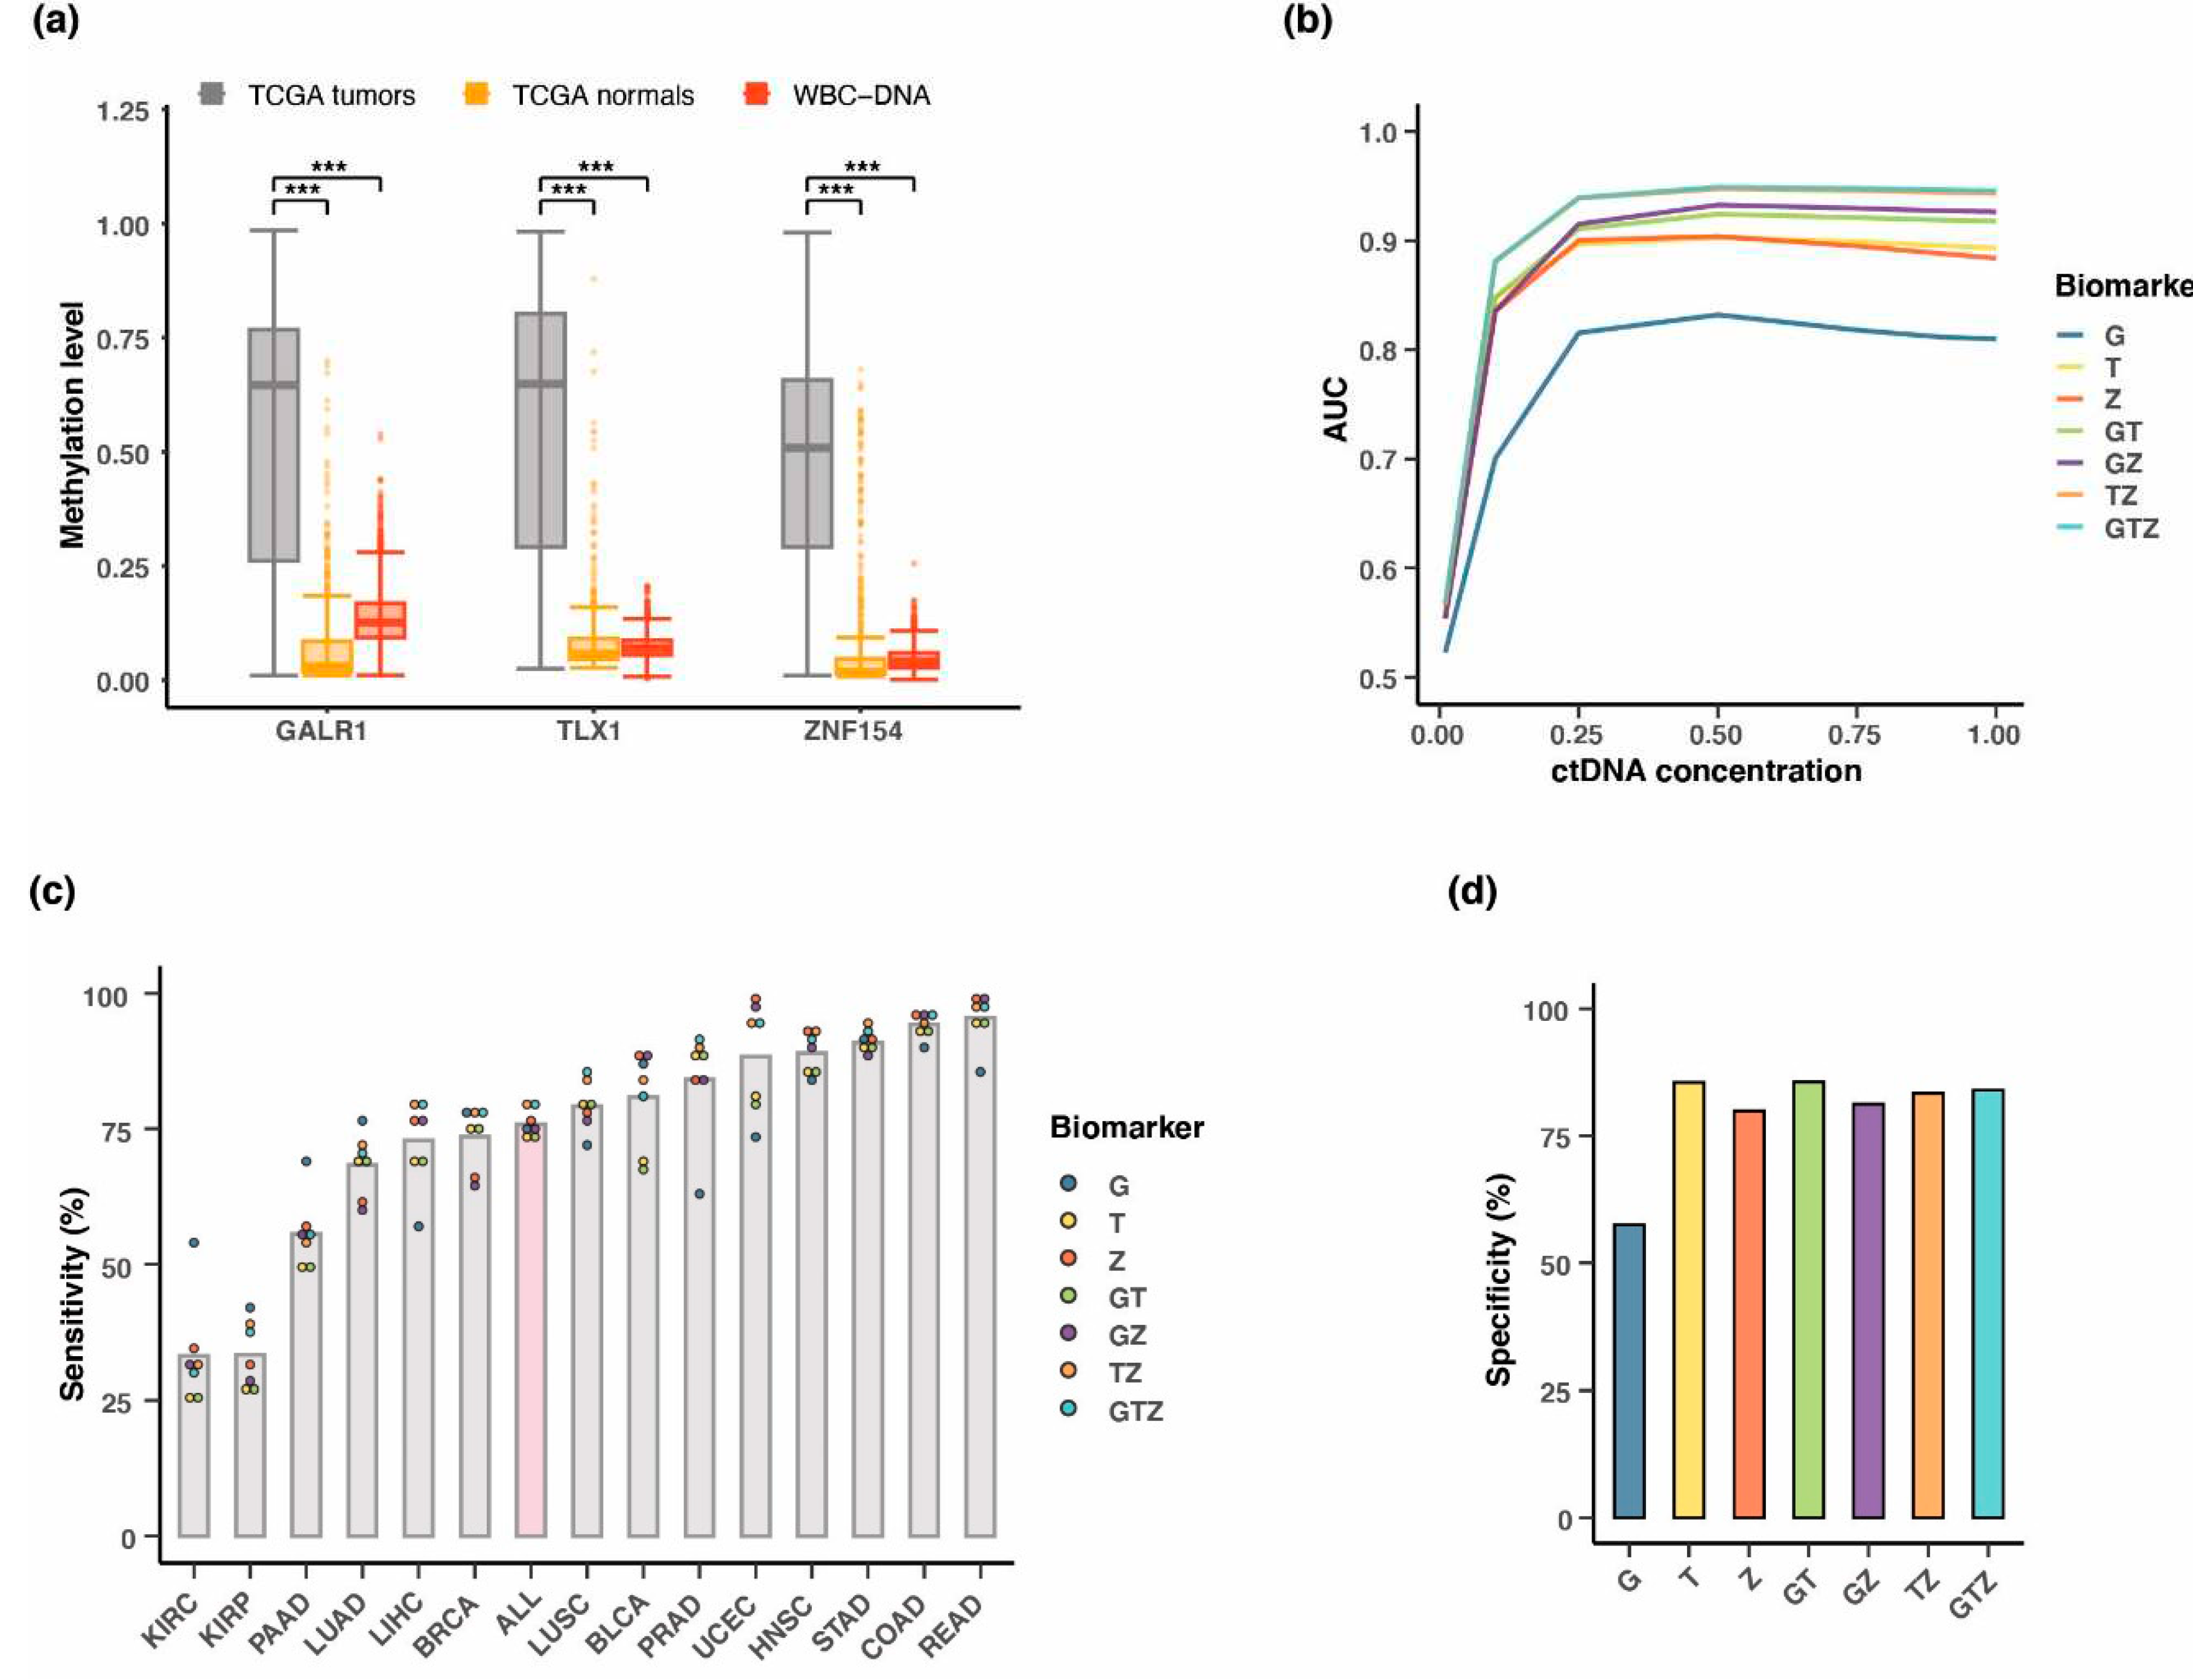
Figure 8.
Estimating the positive predictive value when detecting multiple cancers in a single assay. (a) Boxplots of estimated positive predictive value (PPV) (%) of the 7 different marker combinations for each tumor type individually or combined (ALL). PPV was calculated using incidence rates. (b) Boxplots of PPV (%) for detecting all 14 tumor types combined. Two different methods for choosing the classification threshold were compared; a threshold that results in 95% specificity for all assays (“95% specificity”) or a threshold that maximizes both sensitivity and specificity (“Youden’s index”). The resulting PPV value for each of the 7 marker combinations was compared between the two types of thresholding using Wilcoxon signed-rank test. * indicates P-value < 0.05. PPV for each individual assay is shown as color-coded dots. Markers are abbreviated as G = GALR1, T = TLX1, Z = ZNF154.
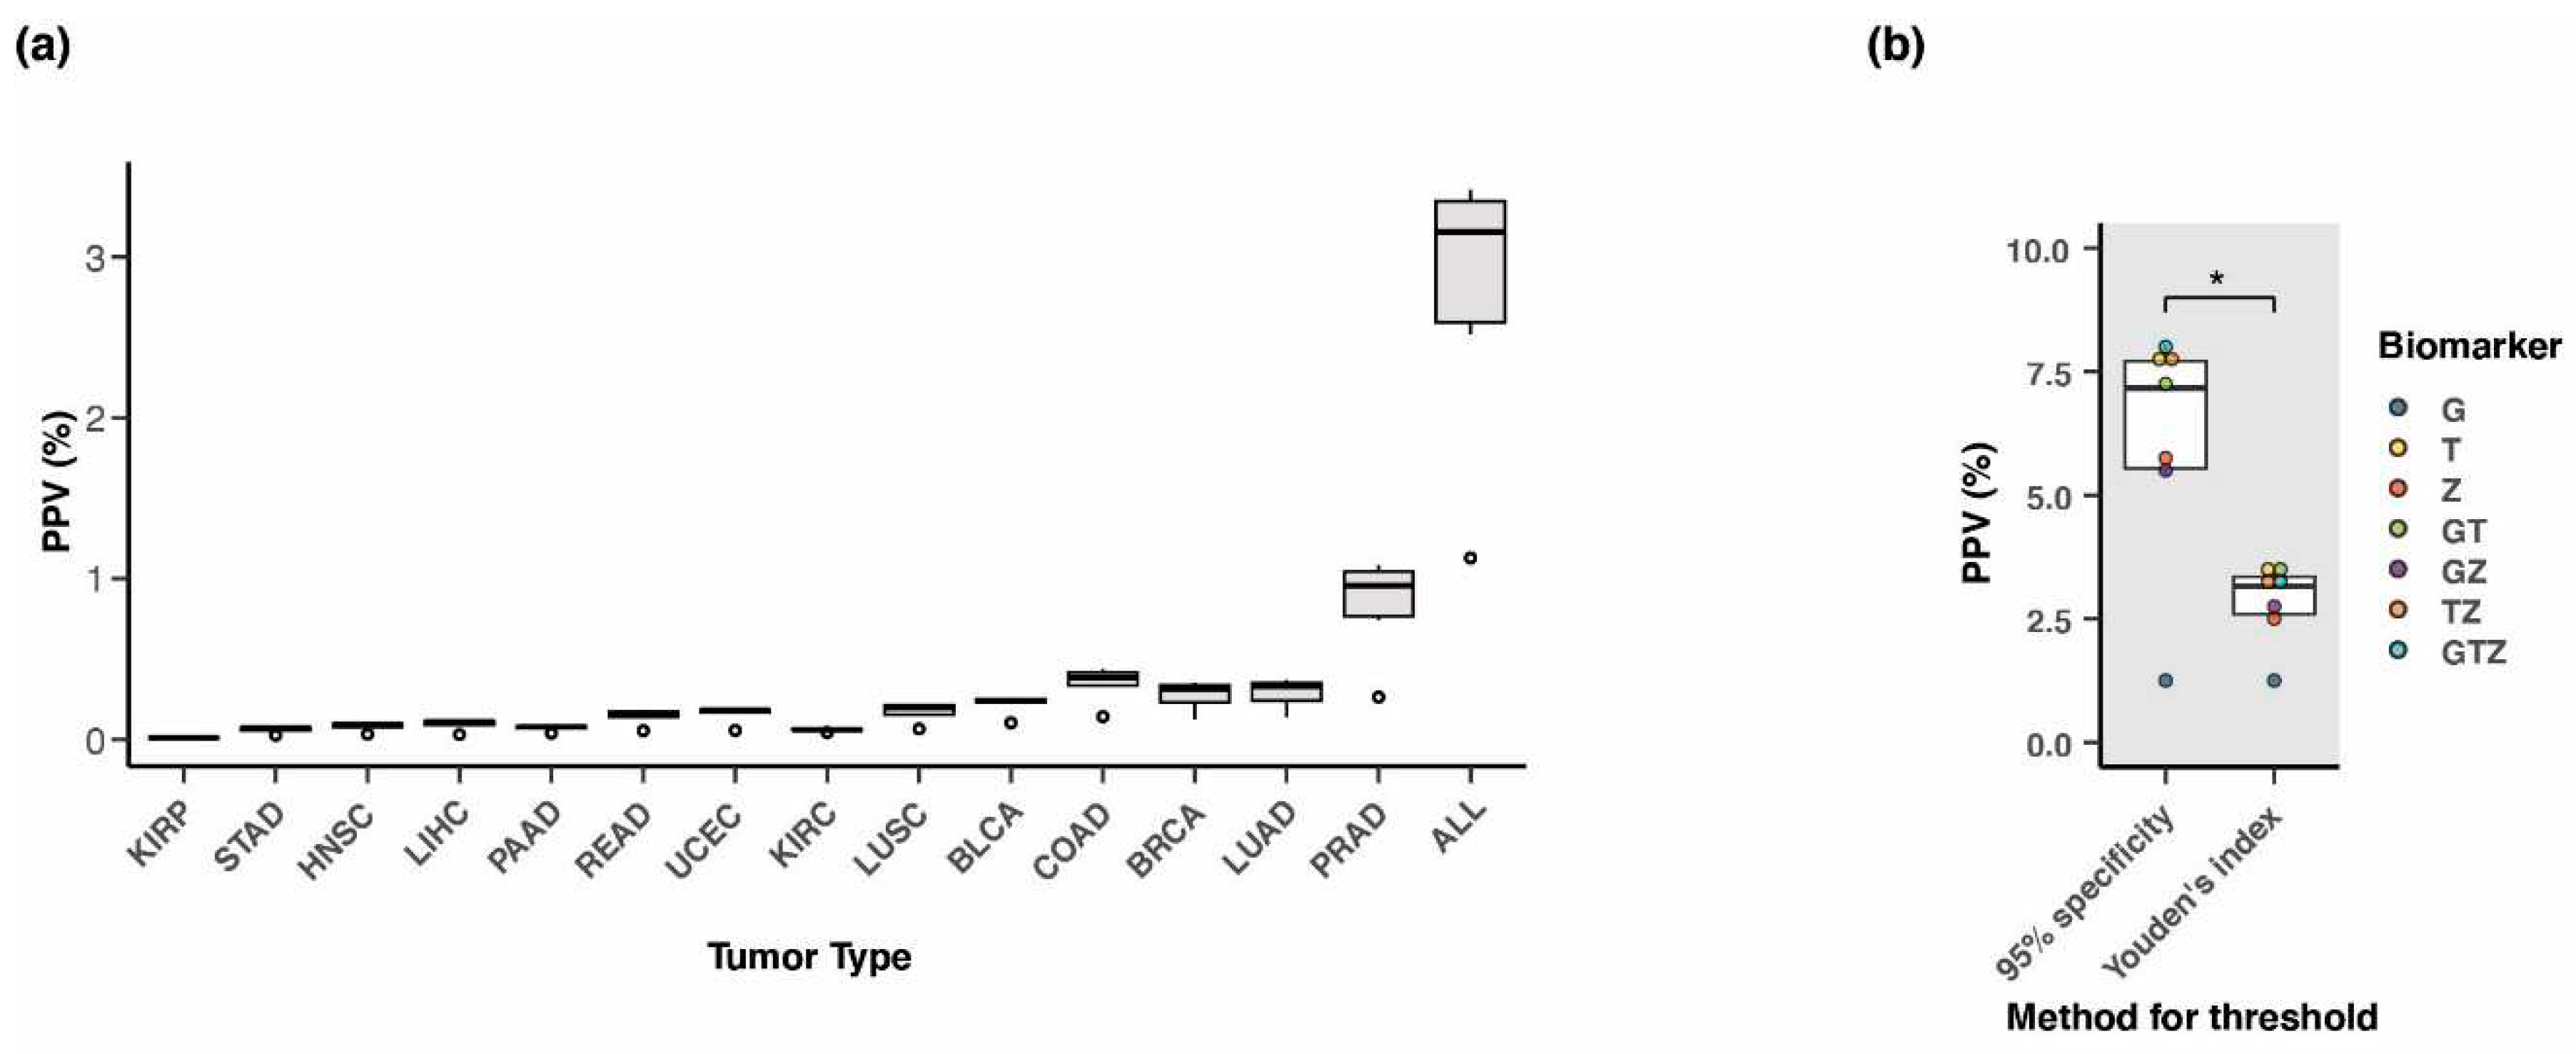
Figure 9.
Breast tumor identification using the three biomarkers for bisulfite amplicon sequencing. Average CpG methylation level across amplicons generated by PCR amplification for (a) ZNF154 (38 tumor, 8 normal samples), (b) TLX1 (40 tumor, 8 normal samples), and (c) GALR1 (37 tumor and 7 normal samples). Each dot represents a tissue sample, and methylation level is shown as a percentage. Solid grey lines represent the mean. The red dashed lines indicate the thresholds for classification of tumor samples (max methylation level in normal tissue). (d) Venn diagram showing the number of tumor samples correctly classified by each of the three methylation markers. Only tumor samples with read counts above QC level for all three markers were included in this graph (n = 35).
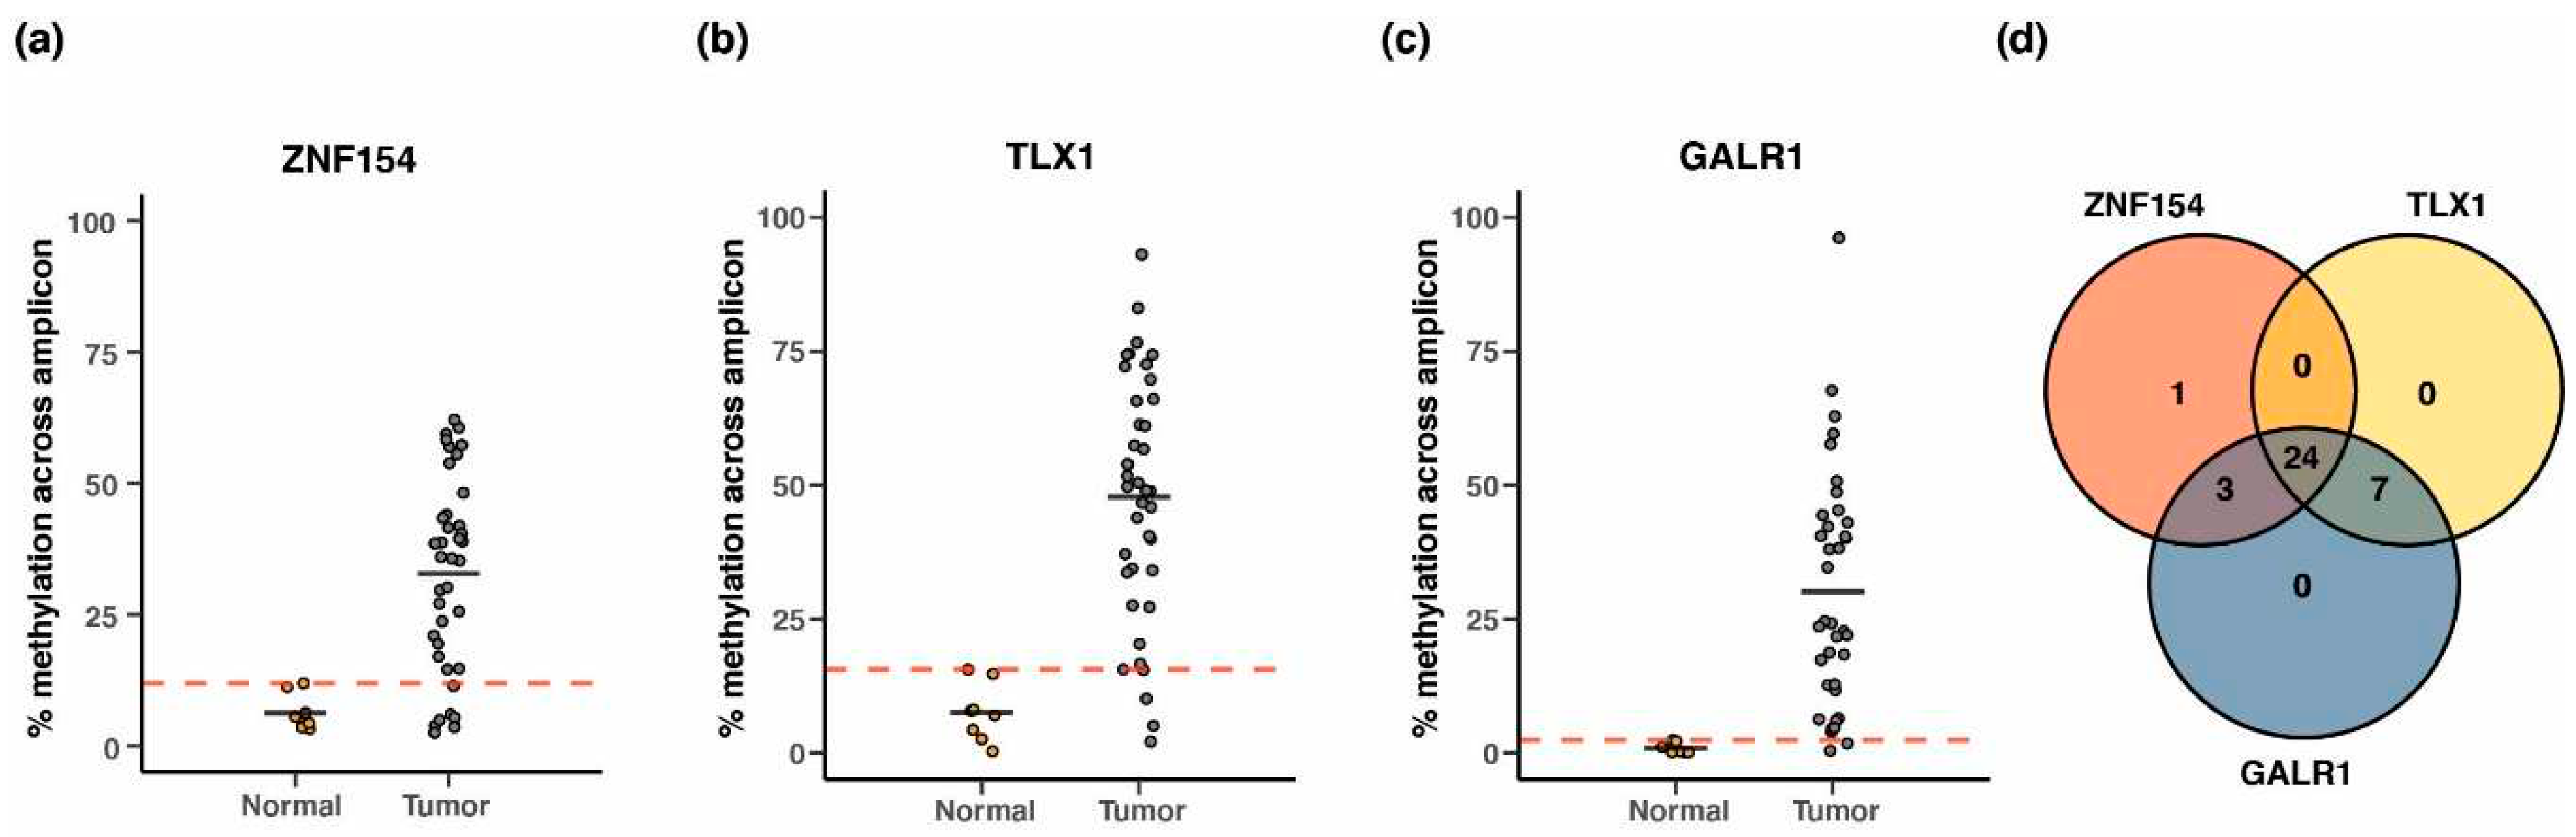
Figure 10.
Analysis of lung and hepatocellular carcinoma whole genome bisulfite sequence data from patient plasma. (a) Lung cancer (n=9) and healthy control (n=4) plasma samples were assessed for ctDNA detection. Specificity was maintained at 100% for all markers, while sensitivity varied. Plotted are sensitivity (red line) and specificity (blue line). (b) Liver cancer (n=30) and healthy control (n=36) plasma samples were assessed for ctDNA detection. Each cohort was randomly divided in two (training vs testing) over 5 iterations. Thresholds that maintained specificity at the highest detectable level (max(specificity)) were chosen and the resulting sensitivity (red line) and specificity (blue line) were plotted. Pink or light blue areas represent +/- 1 SD. (c) Same as in (b) but with the threshold criteria that satisfied max(sensitivity+specificity) values. Markers are abbreviated as T = TLX1, G = GALR1, and Z= ZNF154.
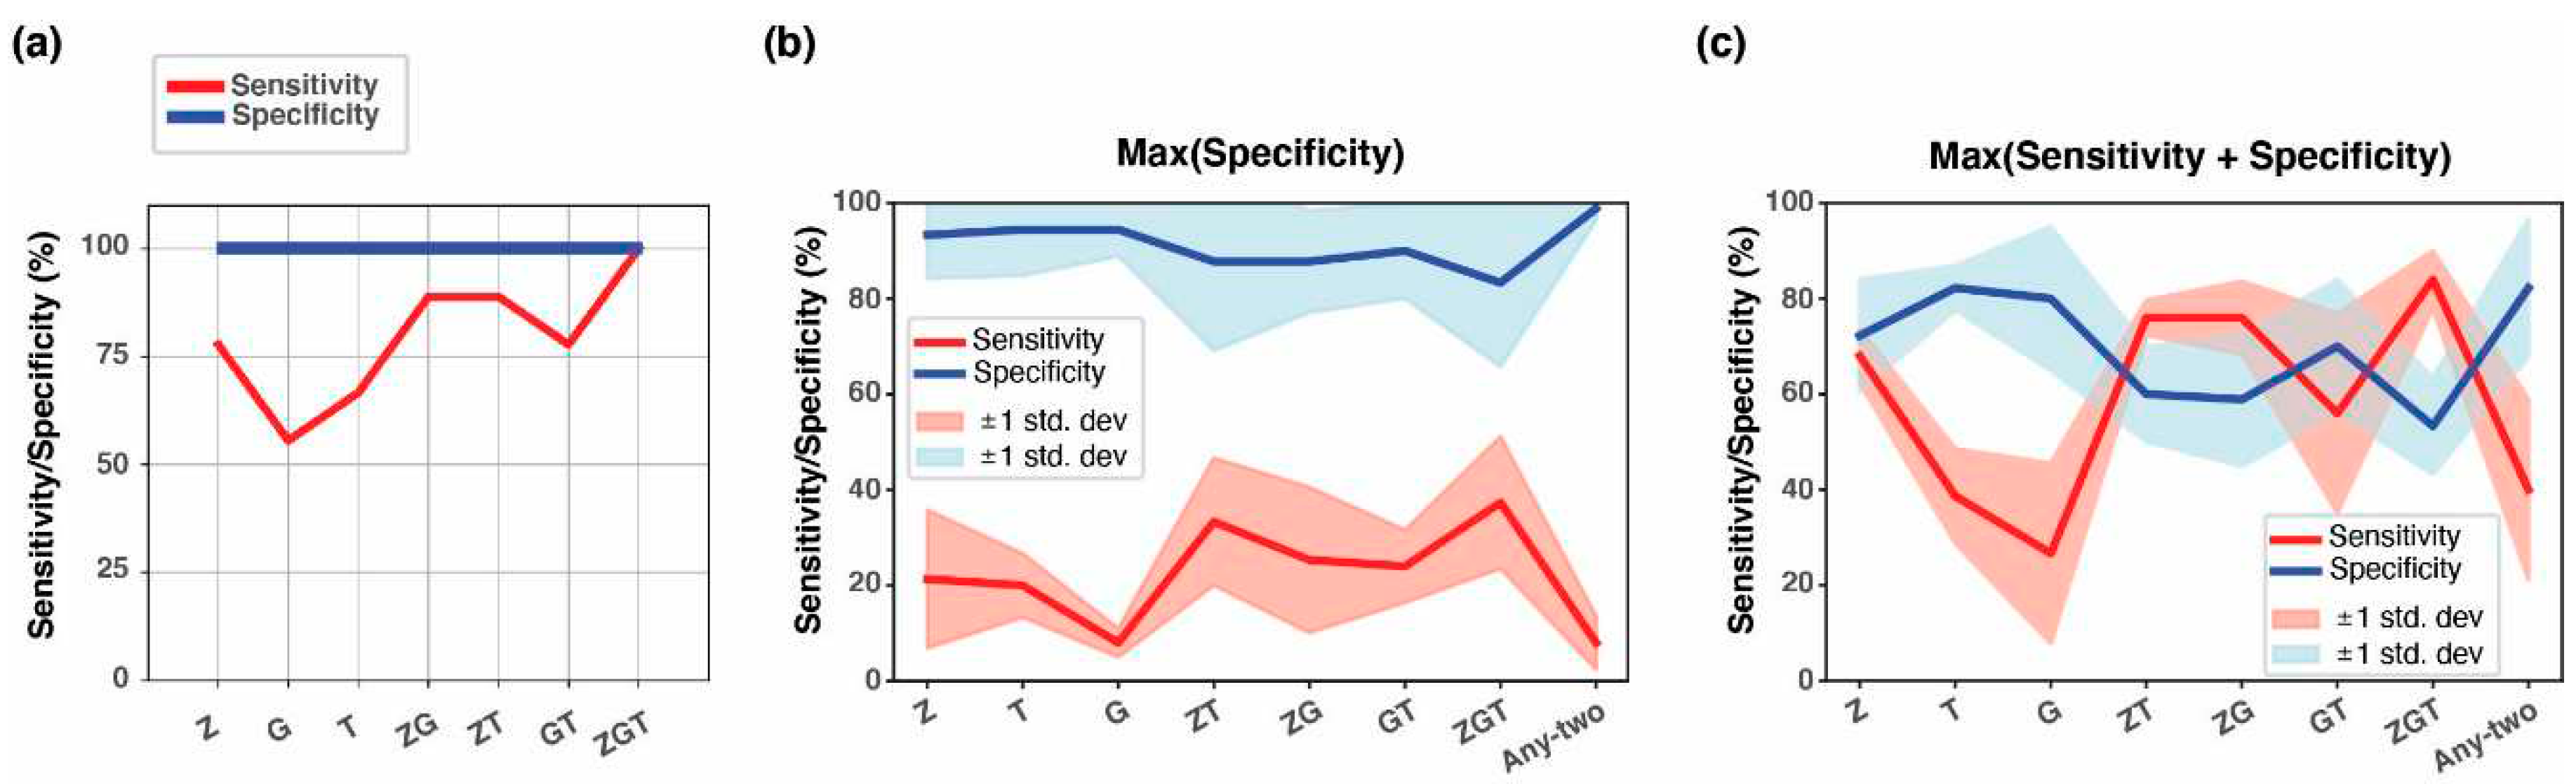

Table 1.
Performance of the three-marker combination (GALR1, TLX1, and ZNF154) in classifying TCGA tumors.
Table 1.
Performance of the three-marker combination (GALR1, TLX1, and ZNF154) in classifying TCGA tumors.
| Tumor type1 | #Tumor samples2 | #Normal samples2 | Threshold3 | Sensitivity | Specificity | AUC4 |
|---|---|---|---|---|---|---|
| BLCA | 201 | 20 | 0.93 | 90.5% | 95.0% | 0.967 |
| BRCA | 676 | 96 | 0.90 | 90.5% | 95.8% | 0.979 |
| COAD | 274 | 38 | 0.84 | 96.7% | 100% | 0.992 |
| HNSC | 426 | 50 | 0.80 | 98.6% | 98.0% | 0.996 |
| KIRC | 296 | 160 | 0.65 | 82.4% | 95.6% | 0.931 |
| KIRP | 156 | 45 | 0.70 | 73.7% | 84.4% | 0.859 |
| LIHC | 151 | 50 | 0.43 | 92.1% | 98.0% | 0.950 |
| LUAD | 437 | 32 | 0.98 | 97.3% | 100% | 0.999 |
| LUSC | 359 | 42 | 0.64 | 99.2% | 100% | 0.996 |
| PAAD | 65 | 9 | 0.58 | 98.5% | 100% | 0.991 |
| PRAD | 248 | 49 | 0.82 | 90.3% | 91.8% | 0.941 |
| READ | 96 | 7 | 0.50 | 100% | 100% | 1.000 |
| STAD | 260 | 2 | 0.50 | 100% | 100% | 1.000 |
| UCEC | 405 | 46 | 0.79 | 99.0% | 100% | 0.997 |
1 Tumor types are abbreviated as in Figure 1; 2 All methylation data were obtained from The Cancer Genome Atlas; 3 Probability threshold obtained by maximizing Youden’s Index after logistic regression and ROC curve analysis; 4 Abbreviations: AUC = Area Under the ROC Curve, ROC = Receiver Operating Characteristics
Table 2.
Performance of the three-marker combination (GALR1, TLX1, and ZNF154) in independent validation cohorts.
Table 2.
Performance of the three-marker combination (GALR1, TLX1, and ZNF154) in independent validation cohorts.
| Tumor type1 | Dataset | #Tumor samples | #Normal samples | Sensitivity | Specificity |
|---|---|---|---|---|---|
| BRCA | GSE37754, GSE66695, GSE69914 | 449 | 149 | 79.5% | 94.0% |
| COAD | GSE53051 | 35 | 18 | 94.3% | 83.3% |
| LUAD | GSE53051 | 9 | 11 | 100% | 73% |
| PRAD | GSE112047 | 31 | 16 | 90.3% | 100.0% |
1 Tumor types are abbreviated as in Figure 1
Table 3.
Performance of the three-marker combination (GALR1, TLX1, and ZNF154) in plasma validation cohorts.
Table 3.
Performance of the three-marker combination (GALR1, TLX1, and ZNF154) in plasma validation cohorts.
| Tumor type1 | Dataset | # Tumor samples | #Normal samples | Sensitivity2 | Specificity2 |
|---|---|---|---|---|---|
| LUAD | [30,31] | 9 | 4 | 100% | 100% |
| LIHC | [31,32] | 30 | 36 | 37.3% | 83.3% |
1 Tumor types are abbreviated as in Figure 1; 2 Assay performance when thresholds were selected to maximize specificity.
Disclaimer/Publisher’s Note: The statements, opinions and data contained in all publications are solely those of the individual author(s) and contributor(s) and not of MDPI and/or the editor(s). MDPI and/or the editor(s) disclaim responsibility for any injury to people or property resulting from any ideas, methods, instructions or products referred to in the content. |
© 2023 by the authors. Licensee MDPI, Basel, Switzerland. This article is an open access article distributed under the terms and conditions of the Creative Commons Attribution (CC BY) license (https://creativecommons.org/licenses/by/4.0/).
Copyright: This open access article is published under a Creative Commons CC BY 4.0 license, which permit the free download, distribution, and reuse, provided that the author and preprint are cited in any reuse.


