
Submitted:
23 August 2023
Posted:
28 August 2023
You are already at the latest version
Abstract
Macrophages undergo different cellular states upon activation that can be hyporesponsive (tolerated) or hyperresponsive (primed or trained) to subsequent stimuli. Epigenetic modifications are known to play a key role in determining these cellular states. However, little is known about the role of signaling pathways that lead to these epigenetic modifications. Here, we examined the effects of various inhibitors targeting key signaling pathways induced by lipopolysaccharide (LPS) on tolerance and priming in the murine macrophages. We found that a prolonged inhibition (>18 h) of the MEK1/2-ERK signaling axis reversed tolerance and primed cells in expressing IL-1β and other inflammatory cytokines such as IL-6, TNFα, and CXCL10. Ectopic expression of catalytically active and inactive MEK1 mutants suppressed and enhanced IL-1β expression, respectively. Primed cells by the MEK1/2 inhibitor U0126 expressed higher levels of gene sets associated with immune responses and cytokine/chemokine production but lower levels of genes with cell cycle progression, chromosome organization, and heterochromatin formation than non-primed cells. Of interest, expression of the histone 3 lysine 9 (H3K9) methyltransferase Suv39h1 and the H3K9 methylation reader Cbx5 was substantially suppressed, whereas the H3K9 demethylase Kdm7a was enhanced, suggesting a role of the MEK1/2-ERK signaling axis in H3K9 demethylation. The H3K9 trimethylation levels in the genomic regions of IL-1β, TNFα, and CXCL10 were decreased by U0126. Also, the H3K9 methyltransferase inhibitor BIX01294 mimicked and overexpression of Cbx5 prevented the U0126 training effects in both RAW264.7 cells and bone marrow-derived macrophages. Collectively, these data suggest that prolonged inhibition of the MEK1/2-ERK signaling axis reverses tolerance and primed macrophages likely through decreasing H3K9 methylation levels.
Keywords:
Macrophages
; LPS
; MEK1/2
; ERK
; IL-1β
; H3K9 methylation
; Cbx5
; Innate immune memory
; Tolerance
; Priming
; Training
1. Introduction
Macrophages are sentinel innate immune cells that orchestrate immune responses in almost all tissues. Their diversity in function requires plasticity and resilience to adapt to the changing microenvironments. A cellular state that renders rapid and robust inflammation is referred to as “trained” or “primed” whereas an attenuated and anti-inflammatory cellular state is referred to as “tolerated”. These altered cellular states are crucial for fending off infections and maintaining immune homeostasis, respectively [1,2]. Upon exposure to microenvironmental and microbial stimuli, macrophages undergo intrinsic changes rendering different cellular states. Several stimuli, including β-glucan, Bacillus Calmette–Guérin (BCG) vaccine & oxidized low-density lipoprotein (oxLDL), render macrophages to a trained state that enhances inflammatory responses when cells are subsequently exposed to microbial components such as lipopolysaccharide (LPS) [3,4]. Conversely, tolerance is demonstrated when macrophages pre-exposed to LPS become less responsive to the same or similar stimuli in producing inflammatory cytokines [5]. The first level of tolerance is a general dampening of activation and signaling through transient (lasting hours) negative feedback mechanisms including downregulation of receptors [6], expressing negative signaling regulators, such as A20 [7] and interleukin-1 receptor-associated kinase-M (IRAK-M) [8], and inducing repressive transcription factors, such as B cell leukemia-3 and nuclear factor-κB (NF-κB) p50 [9]. The second level of tolerance is manifested at a later stage where tolerance stimuli render prolonged (lasting days or weeks) and gene-specific changes that repress or enhance transcription through epigenetic mechanisms [10,11,12].
To date, extensive studies have revealed various epigenetic modifications, such as histone modifications, DNA methylation, and non-coding RNA expression that determine macrophage states [10,13]. Among them, histone modifications particularly in H3K4 mono- or tri-methylation (H3K4me1/3) and H3K27 acetylation (H3K27ac) are transactivating markers involved in training/priming, whereas H3K9 di/tri-methylations (H3K9me2/3) are repressive markers of tolerated genes [14,15,16]. In the human monocytic THP-1 cell line, prolonged LPS stimulation suppresses the expression of Tnf [17,18] and Il1b [19] by inducing H3K9 methylation through recruiting the histone H3K9 methyltransferase Euchromatic histone-lysine N-methyltransferase 2 (EHMT2, also known as G9a) and heterochromatin-binding protein 1 a (HP1α, also known as chromobox (CBX)5) in their promoters and enhancers. In contrast, dissociation of G9a in the promoters/enhancers is required for expressing late-response genes induced by LPS [20]. In murine macrophages, however, tolerance is mainly mediated by the loss of the transactivating markers H3K4me1/2 [12] and H3K27ac [4], rather than the gain of the repressive H3K9me2/3 markers [12].
In mammals, LPS initiates intracellular signaling cascades through binding to its receptor toll-like receptor 4 (TLR4) [21]. Upon activation, TLR4 triggers multiple signaling cascades through the myeloid differentiation primary response protein-88 (MyD88) and toll/IL-1 receptor domain-containing adapter-inducing interferon (TRIF) adaptors [22,23]. The key downstream signaling axes include the inhibitor kB kinases (IκK)-NF-kB axis, phosphatidylinositol 3-kinase (PI3K)-AKT axis, the three mitogen-activated protein kinase (MAPK) signaling axes (MAPK kinase (MEK)1/2- extracellular signal-regulated protein kinases (ERK), MEK3/6-p38, and MEK4/7- cJun N-terminal Kinase (JNK)), and the antiviral TRIF-IRF3 signaling axis [24,25,26]. Activation of these signaling axes is crucial for anti-microbial and pro-inflammatory responses by inducing effector molecules at various levels including transcription factors, transactivation machinery formation, translation, RNA stability, and protein function [27,28,29]. In general, the IκK-NF-kB and MEK3/6-p38 axes are crucial for pro-inflammatory and anti-infective processes; the MEK4/7-JNK axis is for cell death and pro-inflammation; the MEK1/2-ERK axis is for cell proliferation and pro-inflammation [30]. The PI3K-PKD-AKT pathway contributes both proinflammatory and regulatory responses depending on the isoforms involved in the pathway: AKT1 inhibits LPS responses and promotes immune regulatory effector functions; AKT2 has opposing roles of AKT1 [31]. To date, extensive studies shed light on the role of these signaling axes in inflammation and gene transcription. However, how these signaling axes contribute to macrophage tolerance and priming/training is yet to be defined.
This study examined the role of key TLR4 signaling axes in LPS-induced tolerance and training of macrophages using IL-β expression as a readout. We found that inhibition of the MEK1/2-ERK signaling axis had dual effects on the expression of IL-1β in murine macrophages: an early/short-term inhibition of the signaling axis suppressed IL-1β expression but prolonged inhibition (>18 h) primed IL-1β expression. The priming effects were mediated by decreasing the H3K9me3 levels in part through downregulating CBX5 expression.
2. Results
2.1. Inhibition of MEK1/2 enhances IL-1β expression in LPS-tolerized RAW264.7 macrophages
To examine the role of key signaling cascades involved in LPS-induced tolerance, we first induced tolerance by treating RAW264.7 macrophages with a low dose of LPS (10 ng/ml) for 18-24 h. After removing LPS, these cells were replated and further cultured with fresh cell media for 4-6, 24, 48, and 72 h. These cells were then activated by a high dose of LPS (100 ng/ml) for 4-6 h and expression of IL-1β mRNA was examined by qPCR (Figure 1A). Compared to non-tolerized cells, tolerized cells were significantly compromised in expressing IL-1β mRNA for up to 48 h. Activation of ERK and NF-kB by LPS was normal in tolerized cells (Figure S1), suggesting that tolerance at this time frame was independent of the general negative regulation of activation/signaling pathways. We then examined the role of TLR4 signaling pathways by inducing tolerance in the presence of inhibitors targeting key signaling pathways (Figure 1B). Among them, the MEK1/2 inhibitor U0126 was able to inhibit tolerance. Another MEK1/2-specific inhibitor selumetinib also significantly inhibited tolerance in expressing IL-1β mRNA at both 4 and 6 h after LPS activation (Figure C). Since activation of the MEK1/2 signaling is most prominent at the early phase of LPS stimulation, we examined if early inhibition (exposing U0126 in the first 6 h of tolerance) or late inhibition (exposing U0126 in the last 6 h of tolerance) was enough to inhibit tolerance. However, the tolerance reversing effect was only observed when U0126 was treated for a prolonged time (18-24 h) (Figure 1D). As expected, MEK1/2, JNKs, and p38 inhibitors significantly suppressed IL-1β mRNA expression when cells were exposed just before activation (Figure 1E).
2.2. Prolonged inhibition of the MEK1/2-ERKs signaling axis primes RAW26.47 cells to LPS-induced IL-1β expression
Since prolonged, but not short-term, exposure to MEK1/2 inhibitors reversed IL-1β expression in tolerated macrophages, we further examined if MEK1/2 inhibition could enhance IL-1β expression in non-tolerated macrophages. When RAW264.7 cells were pre-treated with inhibitors targeting MEK1/2, p38, JNK, and AKT for 18 h, only the MEK1/2 inhibitors U0126 and selumetinib further enhanced IL-1β mRNA expression over the levels of non-treated cells in response to LPS (Figure 2A). Like in tolerated cells, only after 18-24 h of exposure of U0126 significantly enhanced IL-1β mRNA expression (Figure 2B) in a dose-response manner, maximally at 10 µM of U0126 (Figure 2C). In line with mRNA expression, U0126 enhanced IL-1β protein production in both tolerated and non-tolerated cells (Figure 2D). To further substantiate the role of basal MEK1/2 activity in IL1-β expression, catalytically active and inactive mutants of MEK1 were ectopically expressed for 48 h using adenoviral vectors. Expression of the catalytically active MEK1 (MEK1-CA) led to constitutive ERK activation and significantly lower IL1-β mRNA expression; whereas, expression of the catalytically inactive MEK1 (MEK1-CI) led to lower constitutive ERK activation and higher IL-1β mRNA expression than vector transfection in response to LPS (Figure 2E). Collectively, these data suggest that the constitutive MEK1/2-Erk signaling axis determines the level of IL-1β expression in LPS-activated macrophages.
2.3. Prolonged inhibition of MEK1/2 enhances the expression of genes involved in the immune response and cytokine production but suppresses genes involved in cell cycle progression and heterochromatin formation
To examine the overall impact of MEK1/2 inhibition and the potential mechanism of the priming effects, we performed a transcriptomic analysis in RAW264.7 cells exposed to none or U0126 (5 µM) for 18 h. U0126 induced 1190 and suppressed 916 genes in more than 1.5 folds (adj. p < 0.05; Figure 3A). To dissect the functional aspects of these genes changed, Gene Set Enrichment Analysis (GSEA) was performed using the mouse Molecular Signature Database (M5.all.v2023). Among the mouse ontology gene sets, 678 gene sets were induced, whereas 516 gene sets were suppressed, by U0126. These data sets were visualized by the Cytoscape program [32] (Node Cutoff: Q-value ≤ 0.01; Edge Cutoff: FDR ≤ 0.5) (Figure 3B). Prominent functional clusters decreased by U0126 include cell cycle progression/chromosome regulation (183 nodes) and epigenetic regulation/heterochromatin formation (33 nodes); whereas, increased ones were related to immune responses/regulation (80 nodes) and cytokine/chemokine production (10 nodes) (Table S1). Among the top 20 leading changes, response to bacteria, IL-1 production, and external side of the plasma membrane gene sets were positively enriched; whereas, DNA replication, mitotic cell cycle, and chromosome organization gene sets were negatively enriched by U0126 (Figure 3C). Among the 33 epigenetic regulation/heterochromatin nodes, the 6 heterochromatin nodes contained 61 genes which were mostly suppressed by U0126 (Figure 3D).
2.4. MEK1/2 inhibition regulates the expression of genes that promote histone H3K9 demethylation
Among the changes induced by U0126, a decrease in genes associated with heterochromatin formation was of interest since histone modification is a key epigenetic mechanism in macrophage tolerance and training. Particulalry, the H3K9 methylation-related heterochromatin-related genes such as Dnmt1, Setdb2 (encoding the SET domain bifurcated histone lysine methyltransferase (SETDB)2), Cbx1/2/3/5, Suv39h1/2 (encoding the suppressor of variegation 3-9 homolog (SUV39)H1 and 2), and Ezh2, were downregulated by U0126 (Figure 3D). To further examine genes selectively involved in histone modifications, we looked into the 703 genes annotated as histone modifiers (Table S2) and found that the 30 genes were significantly changed (FC > 2, p < 0.05) by U0126 (Figure 4A; Table S3). Particularly, Cbx5 and Suv39h1, encoding histone H3K9 methyltransferases, were significantly down-regulated but Kdm7, encoding an H3K9 demethylase, was significantly up-regulated. qPCR analysis also confirmed that mRNA levels of Suv39h1 and Cbx5 were decreased, but Kdm7a was increased in U0126-treated cells (Figure 4B). Since H3K9 and DNA methylation are correlated with gene repression [33], we examined if inhibition of the H3K9 histone demethylases KDM5 and 7 negates the priming effect of U0126 and if inhibition of histone and DNA methyltransferases mimics the U0126 priming effect. As shown in Figure 4C, neither KDM5 nor 7 inhibitors prevented the priming effect. Among the H3K9 and DNA methyltransferase inhibitors examined, the H3K9 methyltransferase G9a inhibitor BIX01294 (BIX) was able to prime cells to LPS (Figure 4D). Since the G9a-CBX5 complex is required for H3K9 methylation and gene repression [34,35,36], the BIX effect may also indicate a key role of CBX5 in the priming effect. To confirm the role of CBX5, RAW246.7 cells were stably transfected with eGFP alone (vector control) or eGFP-conjugated CBX5 (eGFP-CBX5; Figure 4E, right panel) and examined if ectopic expression of eGFP-CBX5 inhibited the priming. RAW246.7 cells transfected with the vector alone were primed by U0126, but not in eGFP-CBX5-transfected cells (Figure 4E, right panel). These data suggest that, although multiple factors could have been cooperatively involved in H3K9 demethylation, CBX5 likely played a key role in the priming effect of U0126.
2.5. Inhibition of MEK1/2 decreases H3K9 trimethylation in the genomic region of the IL-1β, CXCL10, and tumor necrosis factor (TNF)α
Since H3K9 demethylation was involved in the priming of IL-1β transcription, we further examined if H3K9 methylation levels were lowered in the IL-1β gene region when cells were treated with U0126. To find potential H3K9me3 associated sites in macrophages, the H3K9me3 ChIP-seq database available in the GEO database (GSE107227; peritoneal macrophages) was visualization in the UCSC mouse MM9 Genome browser. Two prominent H3K9me3 peaks close to the IL-1β promoter and intragenic regions were selected for analysis: Site 1 located at ~7500 bp upstream of IL-1β transcription start site (highlighted in gray) and Site 2 located within the intron 3 (highlighted in pink) (Figure 5A, upper panel). H3K9me3 chromatin immunoprecipitation (ChIP)-qPCR analysis, using primers targeting Site 1 or Site 2, showed that U0126 significantly decreased H3K9me3 levels in Site 1 (Figure 5A, lower panel). Site 2 also showed a decreasing trend but was not statistically significant. We then further examined if U0126 could also enhance the expression of other inflammatory cytokines including IL-6, CXCL10, and TNFα. Similar to IL-1β, these inflammatory cytokines were also further induced when cells were treated with U0126 for 18 h (Figure 5B). We then examined two H3K9me3 peaks (the one within the genomic area and the other proximal to the promoters; Figure 5C, left panel). Except in IL-6, one of the two regions in both Cxcl10 and TNFa showed significantly lower H3K9me3 levels in U0126-treated than in non-treated cells (Figure 5C, right panel). These results suggest that U0126 primed not only IL-1β but also other inflammatory cytokines, likely by decreasing the repressive H3K9me3 levels.
2.6. Inhibition of the MEK1/2-ERK signaling axis primes IL-1β and other inflammatory cytokines in primary bone marrow-derived macrophages
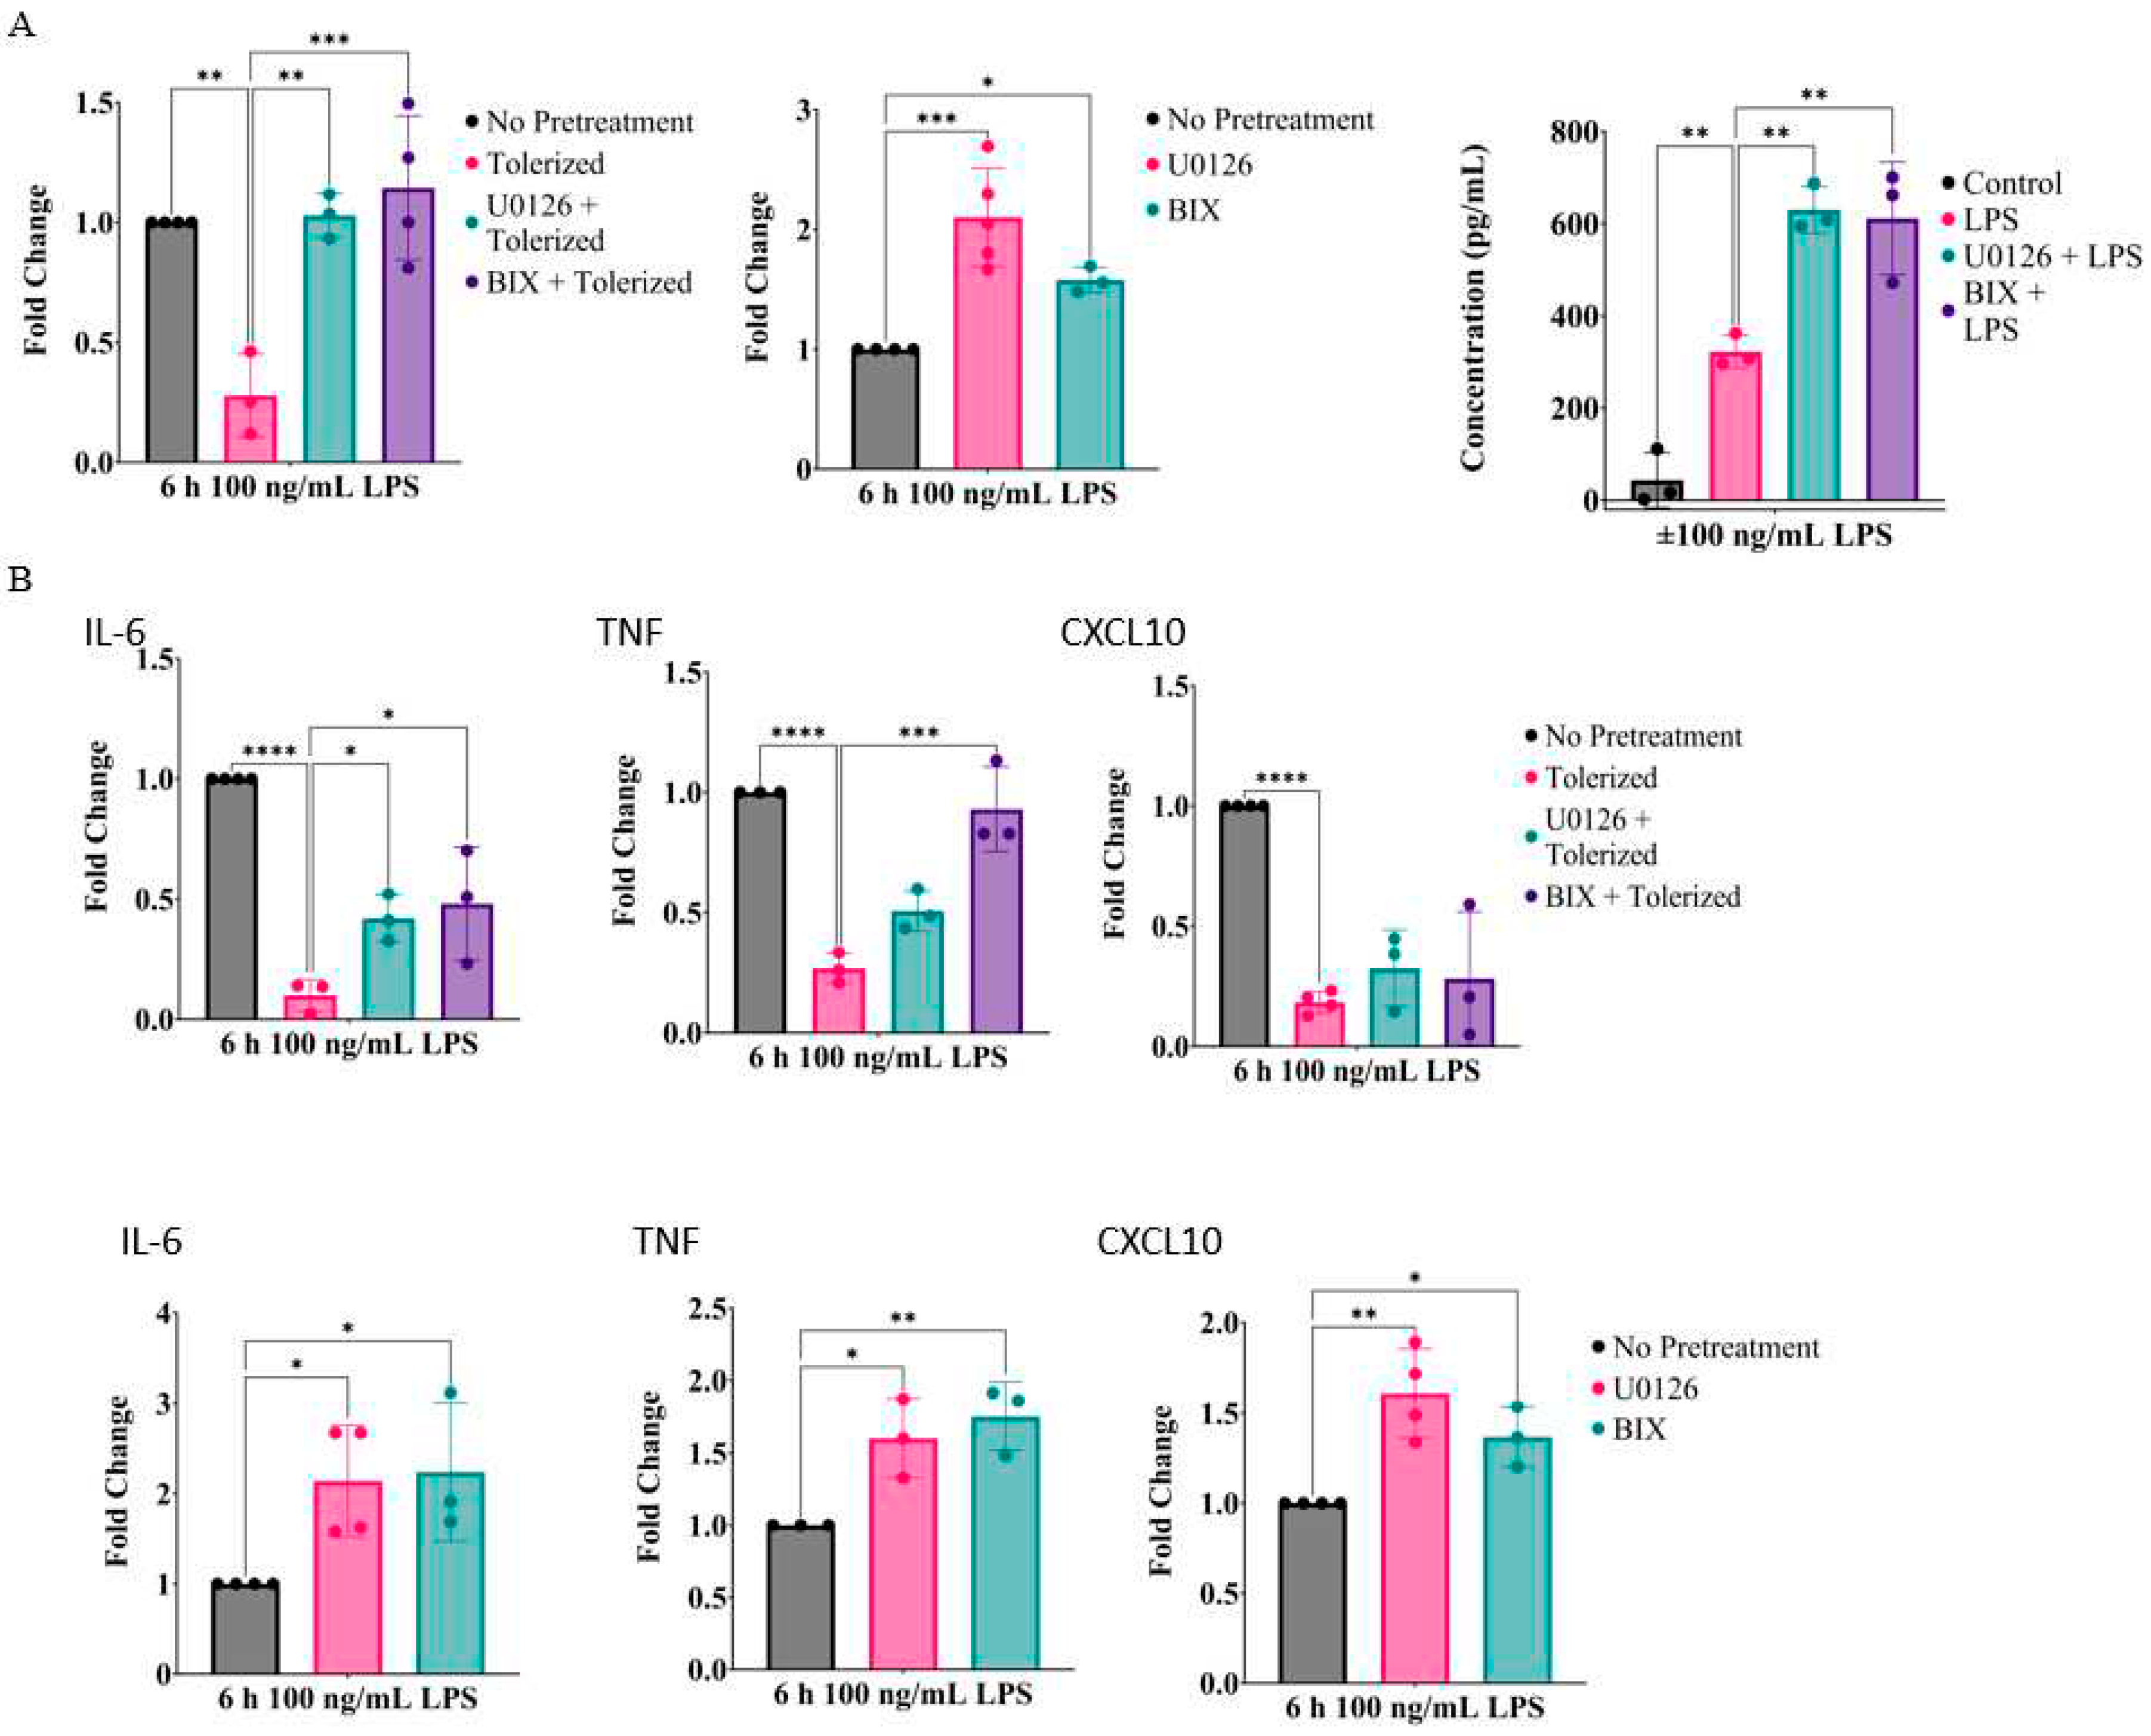
To confirm the role of the MEK1/2-ERK signaling axis in training IL-1β and other inflammatory cytokines in primary macrophages, bone marrow-derived macrophages (BMDMs) were prepared from C57BL/6 mice by culturing bone marrow cells in the presence of macrophage colony-stimulating factor (M-CSF). BMDMs were non-tolerized or tolerized with LPS (10 ng/ml) for 24 h in the presence or absence of U0126 or BIX and then activated by LPS (100 ng/ml) for 6 h. Similar to RAW264.7 cells, tolerated BMDMs failed to express IL-1β mRNA but BMDMs tolerized in the presence of U0126 or BIX were able to express IL-1β mRNA similarly to non-tolerized cells (Figure 6A, left panel). Also, BMDMs primed with U0126 or BIX expressed higher levels of IL-1β mRNA (middle panel) and protein levels (right panel). U0126 and BIX also reversed tolerization in the mRNA expression of IL-6 and TNFα (Figure 6B, upper panel), and further enhanced IL-6, TNFα, and CXCL10 in non-tolerized cells (Figure 6B, lower panel).
3. Discussion
This study demonstrated that prolonged (>18 h) inhibition of the MEK1/2-ERK signaling axis reversed tolerance and primed macrophages in expressing IL-1β and other key inflammatory cytokines such as IL-6, TNFa, and CXCL10. The tolerance reversing effect by the MEK1/2-ERK inhibition may not implicate that the signaling axis is directly involved in the tolerance process since U0126 treatment during the first 6 h of tolerance (when the signaling axis is activated) failed to reverse tolerance (Figure 1D), and U0126 alone was able to prime non-tolerized cells (Figure 2A). Prolonged inhibition of the signaling axis led to prominent transcriptomic changes that enriched transcripts involved in immune responses/signaling and cytokine/chemokine production but repressed transcripts involved in cell proliferation and lipid biosynthesis pathways (Figure 3, Figure S2). Also, cells transfected with the active MEK1 mutant expressed lower IL-1β expression but cells with the inactive MEK1 mutant expressed higher IL-1β expression when compared to vector-transfected control cells (Figure 2E). These results suggest an unexpected role of the MEK1/2-ERK signaling axis that suppresses inflammatory cytokine production at a basal condition.
The tolerance reversing and priming effects of the MEK1/2-ERK inhibition are reminiscence of the effects induced by ultra-low doses of LPS [37,38,39], BCG vaccine [40], C. albicans [41] and its cell wall component β-glucan [4,42], oxidized low-density lipoprotein (ox-LDL) [43,44], and the antineoplastic agent carboplatin [45]. These stimuli commonly reverse LPS tolerance and/or train/prime macrophages through epigenetic reprogramming. One of the key epigenetic mechanisms in reversing tolerance is mediated by introducing/stabilizing the transactivation histone markers, namely H3K4me2/3 and H3K27ac, or removing the silencing histone marker H3K9me2/3 [10,46,47]. These histone modifications at the promoters and enhancers are introduced in response to training stimuli in a gene-specific manner. We found that gene sets involved in heterochromatin formation were suppressed by U0126 (Figure 3D) and among them, Kdm7a, Suv39h1, and Cbx5 pointed to H3K9 demethylation as a potential modification involved in the U0126 priming effect (Figure 4). H3K9me3 is a facultative and constitutive gene silencer rendering transcription repression, heterochromatin formation, and DNA methylation in lineage-specific cell differentiation and maintenance [48,49]. In macrophages and dendritic cells, high levels of H3K9 methylation are associated with low inflammatory cytokine production [50,51,52,53]. Interestingly, H3K9 methylation suppresses the activation of all MAPKs (ERK, p38, and JNK) and NF-kB, and suppressed various proinflammatory cytokines in the heart [54]. Thus, lowering H3K9 methylation levels by U0126 could have been attributed to the overall enhancement of transcripts involved in immune response genes (Figure 3B).
The dynamic methylation status of H3K9 is determined by the counteracting methyltransferases and demethylases. The known H3K9 mono-/di-methyltransferases are G9a and G9a-like protein 1 (GLP1), and H3K9 di-/tri-methyltransferases are SUV39H1, SUV39H2, SETDB1 and SETDB2 [48,49]. These methyltransferases have redundancy in some functions but also have unique cell type-specific roles. Among them, U0126 significantly repressed the transcription of Suv39h1 (Figure 4A,B). Previously, low expression of SUV39H1 was implicated in high inflammatory cytokine production in peripheral blood monocytes [55] and its overexpression in macrophages decreases inflammatory cytokines [56]. Therefore, repression of Suv39h1 likely contributed to the priming effects of U0126. However, the selective SUV39H1/2 inhibitor chaetocin failed to mimic the priming effect of U0126 (Figure 4D). We speculate that non-specific [57] or cytotoxic effects at effective doses [58] could have complicated the results. Unlike chaetocin, the G9a inhibitor BIX01294 was able to mimic the priming effect of U0126 (Figure 4E and Figure 6) in both RAW264.7 cells and BMDMs, suggesting that inhibition of H3K9 methylation could be associated with the priming effect. In addition to the repression of the H3K9 methyltransferase, H3K9me2/3 demethylation could have been enhanced by induction of KDM7 which is a known H3K9 and H3K27 dual demethylase [59]. However, KDM7 inhibition alone did not affect the priming effect of U0126 in IL-1β expression (Figure 4D), suggesting its minor role.
Another histone H3K9 methylation regulator identified is CBX5 (Figure 4). CBX5 is one of the three heterochromatin protein 1 (HP1) family members CBX1/HP1-β, CBX3/HP1-γ and CBX5/HP1-α that directly bind to H3K9me2/3 and function as H3K9me2/3 readers [35,36]. These CBX members play a key role in the spreading of H3K9 methylation markers by recruiting the H3K9 methyltransferases SUV39H1/2 and other factors that induce chromatin compaction and gene silencing. Among the three members, expression of CBX5 in RAW264.7 cells was the most abundant based on the transcript counts with average read counts 34454, 15425, and 7087 for Cbx5 (gene id: 12419), Cbx3 (gene id: 12417), and Cbx1 (gene id: 12412), respectively. Importantly, Cbx5 was repressed by U0126 (Figure 4A,B). More conclusively, RAW264.7 cells stably transfected with Cbx5 failed to be primed by U0126 (Figure 4E). CBX5 is known to directly interact with SUV39H1 [60] or G9a [34], which is required for optimal gene repression. Based on the results shown by G9a inhibition (Figure 4E and Figure 6) and ectopic expression of CBX5, we speculate that lowering H3K9me3 levels by downregulating the G9a/CBX5/H3K9me2/3-mediated gene silencing pathway was a mechanism involved in the priming effect of the MEK1/2-ERK inhibition. More evidently, U0126-trained macrophages harbor lower H3K9me3 levels than those of non-treated cells in the genomic regions of IL-1β and other cytokines including CXCL10 and TNFα (Figure 5).
Previously, it was shown that the platinum-based anticancer drug carboplatin exerts both anti-proliferative and tolerance-reversing effects [45,61]. Whereas the anti-proliferative and cell death effects are due to its DNA alkylating activities that cause DNA damage [61], the tolerance-reversing effects are likely through the demethylation of H3K9me3 in macrophages [45]. Similar to our results, carboplatin when treated together with LPS during the tolerance-inducing stage derepressed TNFa and IL6 expression in LPS-tolerated macrophages. It was suggested that carboplatin selectively represses the expression of Suv39h1 and Cbx5, resulting in low H3K9 methylation. Since both U0126 and carboplatin can cause cell cycle arrest in macrophages, it is not clear if cell cycle arrest was the common contributor to priming macrophages through H3K9 demethylation. However, inhibition of cell cycle progression by the chemical inhibitors AZD5438 and nocodazole failed to train macrophages but rather inhibited IL-1β transcription (Figure S2), and the MEK/12-ERK inhibition had a similar tolerance reversing and priming effects in less proliferative BMDMs as highly proliferative RAW264.7 cells (Figure 6), ruling out the involvement of cell cycle arrest per se in training.
To date, several signaling mechanisms involved in training macrophages by β-glucan, BCG & oxLDL have been reported. β-glucan (a cell wall component of C. albicans) trains and reverses LPS tolerance in macrophages in expressing proinflammatory cytokines [3,4]. Mechanistically, β-glucan activates dectin-1 to induce the enrichment of genes involved in the cAMP-PKA and cortisol-mediated signaling axes that increase H3K4 methylation and H3K27 acetylation in the promoters and enhancers by recruiting H3K4 methyltransferases and histone acetylases likely through the transcription factors like ATF1/7 and CRE binding protein 3 [42]. BCG- and oxLDL also induce training of proinflammatory cytokines such as TNF and IL-1β by activating NOD2 and TLRs, respectively, leading to H3K4 methylation and H3K27 acetylation [40,43,62]. Concurrently, these training stimuli shift metabolic pathways toward high glycolytic and low oxidative phosphorylation pathways [63,64,65,66]. Preferred glycolytic metabolism is a key component of the training process through producing critical metabolic intermediates, such as acetyl-CoA, α-ketoglutarate, fumarate, and succinate [67]. The shift of the metabolic pathway is likely mediated by activating AKT/mTOR/HIF-1α signaling axis [66,67]. Inhibition of the MEK1/2-ERK signaling axis is also shown to activate the PI3K/AKT/mTOR pathway in tumor cells and macrophages [68,69], which could have caused changes in metabolic processes. Consistently, U0126-treated cells downregulated most genes involved in lipid metabolism (Figure S3), suggesting that a compensatory activation of PI3K/AKT could have also contributed to the training effects through H3K4 methylation and H3K27 acetylation. Therefore, the involvement of the PI3K/AKT/mTOR/HIF-1α signaling axis in the MEK1/2-ERK inhibition warrants further studies.
As expected, the MEK1/2-ERK signaling axis is required for the optimal expression of inflammatory cytokines in macrophages (Figure 1E) through activating various downstream signaling molecules, transcription factors, mRNA stability mechanisms, and chromatin remodelers [70,71,72]. Activated ERK translocates to the nucleus and regulates transcription by both kinase-dependent and -independent mechanisms. It is well-established that ERK co-localizes with pre-existing c-FOS (an AP-1 transcription factor involved in various cytokine production), enabling rapid and potent transcription activation of inflammatory cytokines [73]. ERK, through activating its downstream mitogen- and stress-activated kinases (MSKs), also induces phosphorylation of Histone 3 at Ser10 (H3S10) that displaces the H3K9me2/3 [74] and recruits the transactivation remodeler SWI/SNF complex [75]. These ERK-mediated events collaboratively enhance rapid and optimal inflammatory cytokines in activated macrophages. At the same time, ERK can function as a gene repressor in IL-12 expression by activating a suppressor element [76] and interferon-γ expression by directly binding to DNA and replacing the transcription factor C/EBPβ [77]. Therefore, inhibition of the MEK1/2-ERK signaling axis could enhance transcription by inactivating repressors or activating C/EBPβ. Also, ERK negatively regulates macrophage colony-stimulating factor (M-CSF) activation and inhibits the PI3K/AKT/mTOR activation in macrophages [78]. Therefore, prolonged inhibition of the MEK1/2-ERK signaling axis could lead to activation of the PI3K/AKT/mTOR required for the epigenetic training of macrophages. Further studies are required to unravel the involvement of these events in macrophage priming.
4. Materials and Methods
Reagents - LPS was purchased from Invivogen; U0126 from LC laboratories, selumetinib and MK-2206 from Cedarlane; SB203580 from Selleck Chemicals; SP600125 and nocodazole from Calbiochem; AZD-5438 from APExBIO, BIX01294; TC-E 5002, CPI455, and SGI-1027 from Cayman; 5-azacytidine from Sigma. The pGFP-mHP1α plasmid was purchased from Addgene (#181900); eEGFP-N1 vector control from YRGene (#6085-1). The primary antibodies for mouse IL-1β, β-actin, p38, and eGFP were purchased from Thermofisher (94040601), Rockland (#600-401-886), Cell Signalling Technologies (#9212), and Clontech Lab. (#632381), respectively; the secondary antibodies for rabbit IgG-HRP and mouse IgG-HRP were from Santa Cruz (#SC-2357) and Thermo Scientific (#32430), respectively. A polyclonal anti-histone H3-K9 antibody was purchased from AbClonal (#A2360).
Cell Culture and transfection - RAW264.7 cells (purchased from ATCC) were maintained in complete DMEM (Sigma Aldrich) supplemented with 8% heated-inactivated fetal bovine serum and 100 U/mL penicillin-streptomycin. Bone marrow was isolated from the tibia and femurs of 6–8-week-old male C57BL/6 mice (Charles River Laboratory) as previously described [79]. Cells were treated 10 ng/mL LPS to tolerize with or without various inhibitors targeting MEK1/2 (U0126 & selumetinib), p38 MAPK (SB203580), JNK (SP600125), AKT (MK-2206), NF-κB (NF-κBi), CDK1/2/9 (AZD-5438) or microtubule (nocodazole), G9a (BIX01294), SUV(3-9)VAR (Chaetocin), KDM2/7 (TC-E 5002), KDM5 (CPI455), DNMT1/3a/3b (SGI-1027), and pan-DNMT (5-azacytidine)) for 18-24 h. Cells were then washed with PBS and activated by 100 ng/mL LPS in fresh complete growth media for various time points. RAW264.7 cells were stably transfected with 2.5 μg of the pGFP-mHP1α or the pEGFP-N1 vector control plasmids using the Lipofectamine 3000 transfection kit following the manufacturer’s protocol. Cells cultured for 18-24 h and stably transfected cells were selected by culturing media containing G418 (2-5 mg/ml) for two weeks. Stably transfected colonies were pooled and used for the subsequent experiments. For adenoviral vector transfection, a replication-defective adenoviral vector (Ad5) harboring either none (Ad5-CMV vector), catalytically active mutant MEK1 (Ser 217 Glu & Ser 221 Asp; Ad5-CMV-MEKca) [80], or inactive mutant MEK1 (Ser 221 Ala; Adv5-CMV-MEK1dn; Seven Hills Bioreagents, Cincinnati) were prepared approximately 1 x 10⁸ MOI/ml from cell lysate of HEK293 cells as previously described [81]. RAW264.7 cells were infected with adenovirus at about 15 MOI/cell for 24 h. Cells were then washed and cultured with fresh cell culture media for the next 48 h. Cells were then activated with LPS (100 ng/ml) for 30 min (immunoblot analysis) or 6 h (qPCR analysis).
Quantitative real-time PCR (qPCR) - qPCR was carried out as previously described [82]. Briefly, the isolation of total cellular RNAs and reverse transcribing were performed using TRIzolTM (Ambion) and M-MuLV reverse transcriptase (New England Biotechnology). The qPCR was conducted using the Rotor-Gene RG3000 instrument (Montreal Biotech Inc) with the 2 x Universal Sybr Green Fast qPCR Mix (AbClonal), following the manufacturer’s protocol. Data are represented as fold change to the control or LPS-treated group after normalization to the glyceraldehyde 3-phosphate dehydrogenase (GAPDH) and beta-2-microglobulin (B2M) housekeeping genes. Primers were designed using the NCBI Primer Blast program and each primer set was validated for its amplification efficiency within 100 ± 10% (Table S4).
Immunoblotting - Immunoblotting was performed as previously described [69]. Briefly, cells were detached from plates with PBS containing 1 mM EDTA and lysed with an ice-cold lysis buffer containing 20 mM MOPS (pH7.2), 2 mM EGTA, 5 mM EDTA, 1 mM Na3VO4, 40 mM β-glycerophosphate, 30 mM sodium fluoride, 20 mM sodium pyrophosphate, 0.1% SDS, 1% Triton X-100, and phosphatase inhibitor tablets (Pierce). Cell extracts were then electrophoretically resolved in SDS-polyacrylamide gels, followed by transfer onto nitrocellulose membranes. The membranes were blocked at room temperature for 1 h with 5% (w/v) skim milk, and then incubated overnight at room temperature with primary antibodies, followed by the corresponding secondary antibody for 60 min. Membranes were exposed to the BioRad Clarity Max Western ECL system and images were obtained using the BioRad Chemidoc XR+ System. Densitometry analysis of the bands was performed using the ImageJ program.
RNA Sequencing and Transcriptomic Analysis – Total RNAs were prepared using the Qiagen RNeasy kit according to the manufacturer’s protocol and mRNAs were sequenced by Illumina NovaSeq PE100 sequencer using 50 million reads per sample in the Genome Quebec. Sequenced reads were aligned with NCBI37/mm9 mouse genome. Resulting BAM files were used to count for matched genes using the FeatureCount tool (with built-in gene annotation file, default settings) [83], and fold of changes and dispersions were estimated by the DESeq2 tool (c7<0.05) [84] in the Galaxy platform. The differential gene expression and gene counts were then visualized in volcano plots and bubble heat maps using GraphPad Prism 10 and R Studio, respectively. To perform Gene Set Enrichment Analysis (GSEA), the Limma-voom tool [85] was used to filter out counts lower than 10 in the Galaxy, and the resulting differential expression tables were used for GSEA [86], followed by Cytoscape visualization [32,87] with a node cut-off of 0.01 q-value and an edge cut-off of 0.5. Specific pathways were also further visualized using the KEGG pathways in Pathview [88] in the Galaxy platform.
ChIP-qPCR - ChIP analysis was conducted as described previously [89]. Briefly, MEK1-inhibited (5 μM U0126 for 18H) or non-treated control RAW264.7 cells were cross-linked with 1% formaldehyde which was terminated with 125 mM glycine. Cells were then lysed and sonicated for 21 cycles of 30 seconds on and 30 seconds off at 4°C using the Bioruptor UCD-200TM-EX water-bath sonicator from Diagenode. Sonicated chromatin was incubated with H3K9me3 antibody (#A2360, AbClonal) and conjugated to protein G DynaBeads overnight at 4°C. Bound beads were washed once with low-salt wash buffer (0.1% SDS, 1% Triton X-100, 2 mM EDTA, 20 mM Tris-Cl [pH 8.0], 150 mM NaCl), once with high-salt buffer (0.1% SDS, 1% Triton X-100, 2 mM EDTA, 20 mM Tris-HCl [pH 8.0], 500 mM NaCl), once with LiCl buffer (0.25 M LiCl, 1% NP-40, 1% sodium deoxycholate, 1 mM EDTA, 10 mM Tris-Cl [pH 8.1]), and twice with Tris-EDTA buffer at pH 8. Immunocomplexes were eluted with 300 μL of elution buffer (1% SDS, 0.1 M NaHCO3) with 200 mM NaCl, overnight at 65°C. DNA was purified using the Qiagen QIAquick Spin Columns according to the manufacturer’s protocol. RT-qPCR was then conducted using the percent input method. A complete list of the primers used, and their targets can be found in Table S4.
Enzyme-linked Immunosorbent Assay (ELISA) - Cell culture media samples were collected after culturing 60,000 cells per 96-well for 18 h. IL-1β amounts in the samples were measured by the Peprotech IL-1β Mini ABTS ELISA Development Kit according to the manufacturer’s protocol.
Statistics - Data were analyzed using Microsoft Excel (2016) and GraphPad Prism 10. The results were presented as individual replicates with at least three independent repeats. Statistical significance was determined by using a one-way ANOVA test with Dunnett’s multiple comparisons test, two-way ANOVA with Dunnett’s multiple comparisons test, or unpaired t-tests. Statistical significance was defined as p < 0.05.5.
5. Conclusions
This study found that prolonged inhibition of the MEK1/2-ERK-RSK signaling axis reverses LPS tolerance and primes macrophages in the expression of IL-1β and other inflammatory cytokines by inhibiting H3K9me2/3-mediated gene repression. Therefore, constitutive activation of the MEK1/2-ERK signaling axis may play a key role in suppressing inflammatory responses and cytokine expression in murine macrophages.
Supplementary Materials
The following supporting information can be downloaded at the website of this paper posted on Preprints.org. Supplemental Figure S1. RAW264.7 cells tolerized by LPS over 24 h activate ERK and NF-κ like non-tolerized cells. Supplemental Figure S2. Cell cycle inhibitor inhibited IL-1β mRNA expression in RAW264.7 cells. Supplemental Figure S3. Fatty acid biosynthesis pathway U0126 primed cells preferenctially downregulated genes involved in fatty acid biosynthesis. Supplemental Table S1. List of prominent functional clusters changed by U0126. Supplemental Table S2. List of genes annotated as histone modifiers. Supplemental Table S3. List of histone modifiers significantly changed by U0126. Supplemental Table S4. List of primers used.
Author Contributions
SOK conceived and coordinated the study, designed experiments and wrote the paper. RL designed, performed, and analyzed the experiments, and wrote the paper. SDH, NS and PM performed experiments and edited the paper.
Funding
This work was supported by NSERC Discovery Grant (RGPIN-2018-05514) to S.O.K.
Data Availability Statement
RNA-sequencing data on wild-type and U0126-primed RAW264.7 cells will be available from GEO database once this manuscript is accepted.
Acknowledgments
We thank Ma’az Syed (Western University) for R-studio coding and Dr. J. Han (Xiamen University Faculty of Medicine and Life Sciences) for providing the Adn5-CMV-MEK1ca vector.
Conflicts of Interest
The authors declare no conflict of interest.
References
- Bleriot, C.; Chakarov, S.; Ginhoux, F. Determinants of resident tissue macrophage identity and function. Immunity 2020, 52, 957–970. [Google Scholar] [CrossRef] [PubMed]
- Shapouri-Moghaddam, A.; Mohammadian, S.; Vazini, H.; Taghadosi, M.; Esmaeili, S.A.; Mardani, F.; Seifi, B.; Mohammadi, A.; Afshari, J.T.; Sahebkar, A. Macrophage plasticity, polarization, and function in health and disease. J Cell Physiol 2018, 233, 6425–6440. [Google Scholar] [CrossRef] [PubMed]
- Stothers, C.L.; Burelbach, K.R.; Owen, A.M.; Patil, N.K.; McBride, M.A.; Bohannon, J.K.; Luan, L.; Hernandez, A.; Patil, T.K.; Williams, D.L.; et al. Beta-glucan induces distinct and protective innate immune memory in differentiated macrophages. J Immunol 2021, 207, 2785–2798. [Google Scholar] [CrossRef] [PubMed]
- Novakovic, B.; Habibi, E.; Wang, S.Y.; Arts, R.J.W.; Davar, R.; Megchelenbrink, W.; Kim, B.; Kuznetsova, T.; Kox, M.; Zwaag, J.; et al. Beta-glucan reverses the epigenetic state of lps-induced immunological tolerance. Cell 2016, 167, 1354–1368.e1314. [Google Scholar] [CrossRef] [PubMed]
- Zuckerman, S.H.; Evans, G.F.; Snyder, Y.M.; Roeder, W.D. Endotoxin-macrophage interaction: Post-translational regulation of tumor necrosis factor expression. J Immunol 1989, 143, 1223–1227. [Google Scholar] [CrossRef]
- Nomura, F.; Akashi, S.; Sakao, Y.; Sato, S.; Kawai, T.; Matsumoto, M.; Nakanishi, K.; Kimoto, M.; Miyake, K.; Takeda, K.; et al. Cutting edge: Endotoxin tolerance in mouse peritoneal macrophages correlates with down-regulation of surface toll-like receptor 4 expression. J Immunol 2000, 164, 3476–3479. [Google Scholar] [CrossRef]
- Boone, D.L.; Turer, E.E.; Lee, E.G.; Ahmad, R.C.; Wheeler, M.T.; Tsui, C.; Hurley, P.; Chien, M.; Chai, S.; Hitotsumatsu, O.; et al. The ubiquitin-modifying enzyme a20 is required for termination of toll-like receptor responses. Nat Immunol 2004, 5, 1052–1060. [Google Scholar] [CrossRef]
- Kobayashi, K.; Hernandez, L.D.; Galan, J.E.; Janeway, C.A., Jr.; Medzhitov, R.; Flavell, R.A. Irak-m is a negative regulator of toll-like receptor signaling. Cell 2002, 110, 191–202. [Google Scholar] [CrossRef]
- Carmody, R.J.; Ruan, Q.; Palmer, S.; Hilliard, B.; Chen, Y.H. Negative regulation of toll-like receptor signaling by nf-kappab p50 ubiquitination blockade. Science 2007, 317, 675–678. [Google Scholar] [CrossRef]
- Seeley, J.J.; Ghosh, S. Molecular mechanisms of innate memory and tolerance to lps. J Leukoc Biol 2017, 101, 107–119. [Google Scholar] [CrossRef]
- Mages, J.; Dietrich, H.; Lang, R. A genome-wide analysis of lps tolerance in macrophages. Immunobiology 2007, 212, 723–737. [Google Scholar] [CrossRef]
- Foster, S.L.; Hargreaves, D.C.; Medzhitov, R. Gene-specific control of inflammation by tlr-induced chromatin modifications. Nature 2007, 447, 972–978. [Google Scholar] [CrossRef] [PubMed]
- Maheshwari, A. Innate immune memory in macrophages. Newborn (Clarksville) 2023, 2, 60–79. [Google Scholar] [CrossRef]
- Suarez-Alvarez, B.; Baragano Raneros, A.; Ortega, F.; Lopez-Larrea, C. Epigenetic modulation of the immune function: A potential target for tolerance. Epigenetics 2013, 8, 694–702. [Google Scholar] [CrossRef] [PubMed]
- Jarmasz, J.S.; Stirton, H.; Davie, J.R.; Del Bigio, M.R. DNA methylation and histone post-translational modification stability in post-mortem brain tissue. Clin Epigenetics 2019, 11, 5. [Google Scholar] [CrossRef]
- Chen, S.; Yang, J.; Wei, Y.; Wei, X. Epigenetic regulation of macrophages: From homeostasis maintenance to host defense. Cell Mol Immunol 2020, 17, 36–49. [Google Scholar] [CrossRef]
- El Gazzar, M.; Yoza, B.K.; Hu, J.Y.; Cousart, S.L.; McCall, C.E. Epigenetic silencing of tumor necrosis factor alpha during endotoxin tolerance. J Biol Chem 2007, 282, 26857–26864. [Google Scholar] [CrossRef]
- El Gazzar, M.; Yoza, B.K.; Chen, X.; Hu, J.; Hawkins, G.A.; McCall, C.E. G9a and hp1 couple histone and DNA methylation to tnfalpha transcription silencing during endotoxin tolerance. J Biol Chem 2008, 283, 32198–32208. [Google Scholar] [CrossRef] [PubMed]
- Chan, C.; Li, L.; McCall, C.E.; Yoza, B.K. Endotoxin tolerance disrupts chromatin remodeling and nf-kappab transactivation at the il-1beta promoter. J Immunol 2005, 175, 461–468. [Google Scholar] [CrossRef] [PubMed]
- Yoshida, K.; Maekawa, T.; Zhu, Y.; Renard-Guillet, C.; Chatton, B.; Inoue, K.; Uchiyama, T.; Ishibashi, K.; Yamada, T.; Ohno, N.; et al. The transcription factor atf7 mediates lipopolysaccharide-induced epigenetic changes in macrophages involved in innate immunological memory. Nat Immunol 2015, 16, 1034–1043. [Google Scholar] [CrossRef] [PubMed]
- Poltorak, A.; He, X.; Smirnova, I.; Liu, M.Y.; Van Huffel, C.; Du, X.; Birdwell, D.; Alejos, E.; Silva, M.; Galanos, C.; et al. Defective lps signaling in c3h/hej and c57bl/10sccr mice: Mutations in tlr4 gene. Science 1998, 282, 2085–2088. [Google Scholar] [CrossRef] [PubMed]
- Hoebe, K.; Du, X.; Georgel, P.; Janssen, E.; Tabeta, K.; Kim, S.O.; Goode, J.; Lin, P.; Mann, N.; Mudd, S.; et al. Identification of lps2 as a key transducer of myd88-independent tir signalling. Nature 2003, 424, 743–748. [Google Scholar] [CrossRef] [PubMed]
- Akira, S. Toll-like receptors: Lessons from knockout mice. Biochem Soc Trans 2000, 28, 551–556. [Google Scholar] [CrossRef] [PubMed]
- West, A.P.; Koblansky, A.A.; Ghosh, S. Recognition and signaling by toll-like receptors. Annu Rev Cell Dev Biol 2006, 22, 409–437. [Google Scholar] [CrossRef] [PubMed]
- Troutman, T.D.; Hu, W.; Fulenchek, S.; Yamazaki, T.; Kurosaki, T.; Bazan, J.F.; Pasare, C. Role for b-cell adapter for pi3k (bcap) as a signaling adapter linking toll-like receptors (tlrs) to serine/threonine kinases pi3k/akt. Proc Natl Acad Sci U S A 2012, 109, 273–278. [Google Scholar] [CrossRef] [PubMed]
- Keshet, Y.; Seger, R. The map kinase signaling cascades: A system of hundreds of components regulates a diverse array of physiological functions. Methods Mol Biol 2010, 661, 3–38. [Google Scholar]
- Fitzgerald, K.A.; Kagan, J.C. Toll-like receptors and the control of immunity. Cell 2020, 180, 1044–1066. [Google Scholar] [CrossRef]
- Medzhitov, R.; Horng, T. Transcriptional control of the inflammatory response. Nat Rev Immunol 2009, 9, 692–703. [Google Scholar] [CrossRef]
- Ostareck, D.H.; Ostareck-Lederer, A. Rna-binding proteins in the control of lps-induced macrophage response. Front Genet 2019, 10, 31. [Google Scholar] [CrossRef]
- Strniskova, M.; Barancik, M.; Ravingerova, T. Mitogen-activated protein kinases and their role in regulation of cellular processes. Gen Physiol Biophys 2002, 21, 231–255. [Google Scholar]
- Vergadi, E.; Ieronymaki, E.; Lyroni, K.; Vaporidi, K.; Tsatsanis, C. Akt signaling pathway in macrophage activation and m1/m2 polarization. J Immunol 2017, 198, 1006–1014. [Google Scholar] [CrossRef]
- Reimand, J.; Isserlin, R.; Voisin, V.; Kucera, M.; Tannus-Lopes, C.; Rostamianfar, A.; Wadi, L.; Meyer, M.; Wong, J.; Xu, C.; et al. Pathway enrichment analysis and visualization of omics data using g:Profiler, gsea, cytoscape and enrichmentmap. Nat Protoc 2019, 14, 482–517. [Google Scholar] [CrossRef]
- Du, J.; Johnson, L.M.; Jacobsen, S.E.; Patel, D.J. DNA methylation pathways and their crosstalk with histone methylation. Nat Rev Mol Cell Biol 2015, 16, 519–532. [Google Scholar] [CrossRef]
- Ligresti, G.; Caporarello, N.; Meridew, J.A.; Jones, D.L.; Tan, Q.; Choi, K.M.; Haak, A.J.; Aravamudhan, A.; Roden, A.C.; Prakash, Y.S.; et al. Cbx5/g9a/h3k9me-mediated gene repression is essential to fibroblast activation during lung fibrosis. JCI Insight 2019, 5. [Google Scholar] [CrossRef] [PubMed]
- van Wijnen, A.J.; Bagheri, L.; Badreldin, A.A.; Larson, A.N.; Dudakovic, A.; Thaler, R.; Paradise, C.R.; Wu, Z. Biological functions of chromobox (cbx) proteins in stem cell self-renewal, lineage-commitment, cancer and development. Bone 2021, 143, 115659. [Google Scholar] [CrossRef] [PubMed]
- Eissenberg, J.C.; Elgin, S.C. Hp1a: A structural chromosomal protein regulating transcription. Trends Genet 2014, 30, 103–110. [Google Scholar] [CrossRef] [PubMed]
- Chae, B.S. Pretreatment of low-dose and super-low-dose lps on the production of in vitro lps-induced inflammatory mediators. Toxicol Res 2018, 34, 65–73. [Google Scholar] [CrossRef]
- Deng, H.; Maitra, U.; Morris, M.; Li, L. Molecular mechanism responsible for the priming of macrophage activation. J Biol Chem 2013, 288, 3897–3906. [Google Scholar] [CrossRef]
- Maitra, U.; Deng, H.; Glaros, T.; Baker, B.; Capelluto, D.G.; Li, Z.; Li, L. Molecular mechanisms responsible for the selective and low-grade induction of proinflammatory mediators in murine macrophages by lipopolysaccharide. J Immunol 2012, 189, 1014–1023. [Google Scholar] [CrossRef]
- Kleinnijenhuis, J.; Quintin, J.; Preijers, F.; Joosten, L.A.; Ifrim, D.C.; Saeed, S.; Jacobs, C.; van Loenhout, J.; de Jong, D.; Stunnenberg, H.G.; et al. Bacille calmette-guerin induces nod2-dependent nonspecific protection from reinfection via epigenetic reprogramming of monocytes. Proc Natl Acad Sci U S A 2012, 109, 17537–17542. [Google Scholar] [CrossRef] [PubMed]
- Quintin, J.; Saeed, S.; Martens, J.H.A.; Giamarellos-Bourboulis, E.J.; Ifrim, D.C.; Logie, C.; Jacobs, L.; Jansen, T.; Kullberg, B.J.; Wijmenga, C.; et al. Candida albicans infection affords protection against reinfection via functional reprogramming of monocytes. Cell Host Microbe 2012, 12, 223–232. [Google Scholar] [CrossRef]
- Saeed, S.; Quintin, J.; Kerstens, H.H.; Rao, N.A.; Aghajanirefah, A.; Matarese, F.; Cheng, S.C.; Ratter, J.; Berentsen, K.; van der Ent, M.A.; et al. Epigenetic programming of monocyte-to-macrophage differentiation and trained innate immunity. Science 2014, 345, 1251086. [Google Scholar] [CrossRef]
- Bekkering, S.; Quintin, J.; Joosten, L.A.; van der Meer, J.W.; Netea, M.G.; Riksen, N.P. Oxidized low-density lipoprotein induces long-term proinflammatory cytokine production and foam cell formation via epigenetic reprogramming of monocytes. Arterioscler Thromb Vasc Biol 2014, 34, 1731–1738. [Google Scholar] [CrossRef]
- Findeisen, H.M.; Voges, V.C.; Braun, L.C.; Sonnenberg, J.; Schwarz, D.; Korner, H.; Reinecke, H.; Sohrabi, Y. Lxralpha regulates oxldl-induced trained immunity in macrophages. Int J Mol Sci 2022, 23. [Google Scholar]
- Boonmee, A.; Benjaskulluecha, S.; Kueanjinda, P.; Wongprom, B.; Pattarakankul, T.; Palaga, T. The chemotherapeutic drug carboplatin affects macrophage responses to lps and lps tolerance via epigenetic modifications. Sci Rep 2021, 11, 21574. [Google Scholar] [CrossRef] [PubMed]
- Netea, M.G.; Dominguez-Andres, J.; Barreiro, L.B.; Chavakis, T.; Divangahi, M.; Fuchs, E.; Joosten, L.A.B.; van der Meer, J.W.M.; Mhlanga, M.M.; Mulder, W.J.M.; et al. Defining trained immunity and its role in health and disease. Nat Rev Immunol 2020, 20, 375–388. [Google Scholar] [CrossRef]
- Otten, H.G.; Joosten, I.; Allebes, W.A.; van der Meer, A.; Hilbrands, L.B.; Baas, M.; Spierings, E.; Hack, C.E.; van Reekum, F.; van Zuilen, A.D.; et al. The procare consortium: Toward an improved allocation strategy for kidney allografts. Transpl Immunol 2014, 31, 184–190. [Google Scholar] [CrossRef] [PubMed]
- Padeken, J.; Methot, S.P.; Gasser, S.M. Establishment of h3k9-methylated heterochromatin and its functions in tissue differentiation and maintenance. Nat Rev Mol Cell Biol 2022, 23, 623–640. [Google Scholar] [CrossRef] [PubMed]
- Krishnan, S.; Horowitz, S.; Trievel, R.C. Structure and function of histone h3 lysine 9 methyltransferases and demethylases. Chembiochem 2011, 12, 254–263. [Google Scholar] [CrossRef]
- Kimball, A.S.; Davis, F.M.; denDekker, A.; Joshi, A.D.; Schaller, M.A.; Bermick, J.; Xing, X.; Burant, C.F.; Obi, A.T.; Nysz, D.; et al. The histone methyltransferase setdb2 modulates macrophage phenotype and uric acid production in diabetic wound repair. Immunity 2019, 51, 258–271.e255. [Google Scholar] [CrossRef] [PubMed]
- Hachiya, R.; Shiihashi, T.; Shirakawa, I.; Iwasaki, Y.; Matsumura, Y.; Oishi, Y.; Nakayama, Y.; Miyamoto, Y.; Manabe, I.; Ochi, K.; et al. The h3k9 methyltransferase setdb1 regulates tlr4-mediated inflammatory responses in macrophages. Sci Rep 2016, 6, 28845. [Google Scholar] [CrossRef]
- Tausendschon, M.; Dehne, N.; Brune, B. Hypoxia causes epigenetic gene regulation in macrophages by attenuating jumonji histone demethylase activity. Cytokine 2011, 53, 256–262. [Google Scholar] [CrossRef]
- Saccani, S.; Natoli, G. Dynamic changes in histone h3 lys 9 methylation occurring at tightly regulated inducible inflammatory genes. Genes Dev 2002, 16, 2219–2224. [Google Scholar] [CrossRef]
- Yang, B.; Yang, J.; Bai, J.; Pu, P.; Liu, J.; Wang, F.; Ruan, B. Suv39h1 protects from myocardial ischemia-reperfusion injury in diabetic rats. Cell Physiol Biochem 2014, 33, 1176–1185. [Google Scholar] [CrossRef]
- Chen, T.T.; Wu, S.M.; Ho, S.C.; Chuang, H.C.; Liu, C.Y.; Chan, Y.F.; Kuo, L.W.; Feng, P.H.; Liu, W.T.; Chen, K.Y.; et al. Suv39h1 reduction is implicated in abnormal inflammation in copd. Sci Rep 2017, 7, 46667. [Google Scholar] [CrossRef]
- Li, M.F.; Zhang, R.; Li, T.T.; Chen, M.Y.; Li, L.X.; Lu, J.X.; Jia, W.P. High glucose increases the expression of inflammatory cytokine genes in macrophages through h3k9 methyltransferase mechanism. J Interferon Cytokine Res 2016, 36, 48–61. [Google Scholar] [CrossRef] [PubMed]
- Mian, W.; Zhang, M.; Ma, Y.; Liu, F.; Chen, S.; Lu, J.; Chen, H. Chaetocin attenuates gout in mice through inhibiting hif-1alpha and nlrp3 inflammasome-dependent il-1beta secretion in macrophages. Arch Biochem Biophys 2019, 670, 94–103. [Google Scholar] [CrossRef]
- Chaib, H.; Nebbioso, A.; Prebet, T.; Castellano, R.; Garbit, S.; Restouin, A.; Vey, N.; Altucci, L.; Collette, Y. Anti-leukemia activity of chaetocin via death receptor-dependent apoptosis and dual modulation of the histone methyl-transferase suv39h1. Leukemia 2012, 26, 662–674. [Google Scholar] [CrossRef] [PubMed]
- Tsukada, Y.; Ishitani, T.; Nakayama, K.I. Kdm7 is a dual demethylase for histone h3 lys 9 and lys 27 and functions in brain development. Genes Dev 2010, 24, 432–437. [Google Scholar] [CrossRef] [PubMed]
- Stewart, M.D.; Li, J.; Wong, J. Relationship between histone h3 lysine 9 methylation, transcription repression, and heterochromatin protein 1 recruitment. Mol Cell Biol 2005, 25, 2525–2538. [Google Scholar] [CrossRef] [PubMed]
- Dasari, S.; Tchounwou, P.B. Cisplatin in cancer therapy: Molecular mechanisms of action. Eur J Pharmacol 2014, 740, 364–378. [Google Scholar] [CrossRef] [PubMed]
- Covian, C.; Fernandez-Fierro, A.; Retamal-Diaz, A.; Diaz, F.E.; Vasquez, A.E.; Lay, M.K.; Riedel, C.A.; Gonzalez, P.A.; Bueno, S.M.; Kalergis, A.M. Bcg-induced cross-protection and development of trained immunity: Implication for vaccine design. Front Immunol 2019, 10, 2806. [Google Scholar] [CrossRef] [PubMed]
- Keating, S.T.; Groh, L.; Thiem, K.; Bekkering, S.; Li, Y.; Matzaraki, V.; van der Heijden, C.; van Puffelen, J.H.; Lachmandas, E.; Jansen, T.; et al. Rewiring of glucose metabolism defines trained immunity induced by oxidized low-density lipoprotein. J Mol Med (Berl) 2020, 98, 819–831. [Google Scholar] [CrossRef]
- Sohrabi, Y.; Lagache, S.M.M.; Schnack, L.; Godfrey, R.; Kahles, F.; Bruemmer, D.; Waltenberger, J.; Findeisen, H.M. Mtor-dependent oxidative stress regulates oxldl-induced trained innate immunity in human monocytes. Front Immunol 2018, 9, 3155. [Google Scholar] [CrossRef]
- Arts, R.J.W.; Carvalho, A.; La Rocca, C.; Palma, C.; Rodrigues, F.; Silvestre, R.; Kleinnijenhuis, J.; Lachmandas, E.; Goncalves, L.G.; Belinha, A.; et al. Immunometabolic pathways in bcg-induced trained immunity. Cell Rep 2016, 17, 2562–2571. [Google Scholar] [CrossRef]
- Cheng, S.C.; Quintin, J.; Cramer, R.A.; Shepardson, K.M.; Saeed, S.; Kumar, V.; Giamarellos-Bourboulis, E.J.; Martens, J.H.; Rao, N.A.; Aghajanirefah, A.; et al. Mtor- and hif-1alpha-mediated aerobic glycolysis as metabolic basis for trained immunity. Science 2014, 345, 1250684. [Google Scholar] [CrossRef] [PubMed]
- Fanucchi, S.; Dominguez-Andres, J.; Joosten, L.A.B.; Netea, M.G.; Mhlanga, M.M. The intersection of epigenetics and metabolism in trained immunity. Immunity 2021, 54, 32–43. [Google Scholar] [CrossRef]
- McCubrey, J.A.; Steelman, L.S.; Chappell, W.H.; Abrams, S.L.; Franklin, R.A.; Montalto, G.; Cervello, M.; Libra, M.; Candido, S.; Malaponte, G.; et al. Ras/raf/mek/erk and pi3k/pten/akt/mtor cascade inhibitors: How mutations can result in therapy resistance and how to overcome resistance. Oncotarget 2012, 3, 1068–1111. [Google Scholar] [CrossRef]
- Ha, S.D.; Ng, D.; Pelech, S.L.; Kim, S.O. Critical role of the phosphatidylinositol 3-kinase/akt/glycogen synthase kinase-3 signaling pathway in recovery from anthrax lethal toxin-induced cell cycle arrest and mek cleavage in macrophages. J Biol Chem 2007, 282, 36230–36239. [Google Scholar] [CrossRef] [PubMed]
- Yang, S.H.; Sharrocks, A.D.; Whitmarsh, A.J. Map kinase signalling cascades and transcriptional regulation. Gene 2013, 513, 1–13. [Google Scholar] [CrossRef]
- Lopez-Pelaez, M.; Fumagalli, S.; Sanz, C.; Herrero, C.; Guerra, S.; Fernandez, M.; Alemany, S. Cot/tpl2-mkk1/2-erk1/2 controls mtorc1-mediated mrna translation in toll-like receptor-activated macrophages. Mol Biol Cell 2012, 23, 2982–2992. [Google Scholar] [CrossRef] [PubMed]
- Scherle, P.A.; Jones, E.A.; Favata, M.F.; Daulerio, A.J.; Covington, M.B.; Nurnberg, S.A.; Magolda, R.L.; Trzaskos, J.M. Inhibition of map kinase kinase prevents cytokine and prostaglandin e2 production in lipopolysaccharide-stimulated monocytes. J Immunol 1998, 161, 5681–5686. [Google Scholar] [CrossRef]
- Gonzalez, J.M.; Navarro-Puche, A.; Casar, B.; Crespo, P.; Andres, V. Fast regulation of ap-1 activity through interaction of lamin a/c, erk1/2, and c-fos at the nuclear envelope. J Cell Biol 2008, 183, 653–666. [Google Scholar] [CrossRef]
- Vicent, G.P.; Ballare, C.; Nacht, A.S.; Clausell, J.; Subtil-Rodriguez, A.; Quiles, I.; Jordan, A.; Beato, M. Induction of progesterone target genes requires activation of erk and msk kinases and phosphorylation of histone h3. Mol Cell 2006, 24, 367–381. [Google Scholar] [CrossRef] [PubMed]
- Drobic, B.; Perez-Cadahia, B.; Yu, J.; Kung, S.K.; Davie, J.R. Promoter chromatin remodeling of immediate-early genes is mediated through h3 phosphorylation at either serine 28 or 10 by the msk1 multi-protein complex. Nucleic Acids Res 2010, 38, 3196–3208. [Google Scholar] [CrossRef] [PubMed]
- Saito, S.; Matsuura, M.; Hirai, Y. Regulation of lipopolysaccharide-induced interleukin-12 production by activation of repressor element ga-12 through hyperactivation of the erk pathway. Clin Vaccine Immunol 2006, 13, 876–883. [Google Scholar] [CrossRef] [PubMed]
- Hu, S.; Xie, Z.; Onishi, A.; Yu, X.; Jiang, L.; Lin, J.; Rho, H.S.; Woodard, C.; Wang, H.; Jeong, J.S.; et al. Profiling the human protein-DNA interactome reveals erk2 as a transcriptional repressor of interferon signaling. Cell 2009, 139, 610–622. [Google Scholar] [CrossRef] [PubMed]
- Wang, L.; Iorio, C.; Yan, K.; Yang, H.; Takeshita, S.; Kang, S.; Neel, B.G.; Yang, W. A erk/rsk-mediated negative feedback loop regulates m-csf-evoked pi3k/akt activation in macrophages. FASEB J 2018, 32, 875–887. [Google Scholar] [CrossRef]
- Zhang, X.; Goncalves, R.; Mosser, D.M. The isolation and characterization of murine macrophages. Curr Protoc Immunol 2008, 14, 14 11 11–14 11 14. [Google Scholar] [CrossRef]
- Foschi, M.; Chari, S.; Dunn, M.J.; Sorokin, A. Biphasic activation of p21ras by endothelin-1 sequentially activates the erk cascade and phosphatidylinositol 3-kinase. EMBO J 1997, 16, 6439–6451. [Google Scholar] [CrossRef]
- Kim, S.O.; Sheikh, H.I.; Ha, S.D.; Martins, A.; Reid, G. G-csf-mediated inhibition of jnk is a key mechanism for lactobacillus rhamnosus-induced suppression of tnf production in macrophages. Cell Microbiol 2006, 8, 1958–1971. [Google Scholar] [CrossRef] [PubMed]
- Ha, S.D.; Lewin, N.; Li, S.S.C.; Kim, S.O. Hdac8 activates akt through upregulating plcb1 and suppressing desc1 expression in mek1/2 inhibition-resistant cells. Cells 2021, 10. [Google Scholar] [CrossRef]
- Liao, Y.; Smyth, G.K.; Shi, W. Featurecounts: An efficient general purpose program for assigning sequence reads to genomic features. Bioinformatics 2014, 30, 923–930. [Google Scholar] [CrossRef]
- Love, M.I.; Huber, W.; Anders, S. Moderated estimation of fold change and dispersion for rna-seq data with deseq2. Genome Biol 2014, 15, 550. [Google Scholar] [CrossRef]
- Law, C.W.; Chen, Y.; Shi, W.; Smyth, G.K. Voom: Precision weights unlock linear model analysis tools for rna-seq read counts. Genome Biol 2014, 15, R29. [Google Scholar] [CrossRef] [PubMed]
- Subramanian, A.; Tamayo, P.; Mootha, V.K.; Mukherjee, S.; Ebert, B.L.; Gillette, M.A.; Paulovich, A.; Pomeroy, S.L.; Golub, T.R.; Lander, E.S.; et al. Gene set enrichment analysis: A knowledge-based approach for interpreting genome-wide expression profiles. Proc Natl Acad Sci U S A 2005, 102, 15545–15550. [Google Scholar] [CrossRef] [PubMed]
- Otasek, D.; Morris, J.H.; Boucas, J.; Pico, A.R.; Demchak, B. Cytoscape automation: Empowering workflow-based network analysis. Genome Biol 2019, 20, 185. [Google Scholar] [CrossRef]
- Luo, W.; Brouwer, C. Pathview: An r/bioconductor package for pathway-based data integration and visualization. Bioinformatics 2013, 29, 1830–1831. [Google Scholar] [CrossRef]
- Ha, S.D.; Cho, W.; DeKoter, R.P.; Kim, S.O. The transcription factor pu.1 mediates enhancer-promoter looping that is required for il-1beta erna and mrna transcription in mouse melanoma and macrophage cell lines. J Biol Chem 2019, 294, 17487–17500. [Google Scholar] [CrossRef]
Figure 1.
Prolonged MEK1/2 inhibition reverses LPS tolerance in IL-1β mRNA expression. RAW264.7 cells were tolerized with LPS (10 ng/mL) for 24 h and then activated with LPS (100 ng/mL) for 4-6 h as indicated. Expression of Il1b was then measured by RT-qPCR. A. Tolerized cells were replated and cultured with fresh cell culture media for the time indicated before activation. B. Tolerized cells were treated concurrently with signaling pathway inhibitors targeting MEK1/2 (U0126, 5 µM), p38 MAPK (p38i, SB203580; 5 µM), JNK (JNKi, SP600125; 5 µM), NF-κB (NF-κBi, 2 µM) or AKT (AKTi, MK-2206; 5 µM). C. Tolerized cells were treated with two different MEK1/2 inhibitors U0126 or selumetinib (5 µM) concurrently to tolerization. D. The MEK1/2 inhibitor U0126 was added at the first 6 h of, last 6 h of, or throughout the 24-h tolerization period. E. Key signaling inhibitors were added 30 minutes before activation and activated with LPS (100 ng/mL) for 6 h. A one-way ANOVA test followed by Dunnett’s multiple comparisons test was performed for statistical analysis (n=3; * p≤ 0.05, ** p ≤ 0.01, *** p ≤ 0.001, **** p ≤ 0.0001).

Figure 2.
Inhibition of the MEK1/2-ERK signaling pathway enhances IL-1β expression in non-tolerized RAW264.7 cells. A-C. Cells were treated with key signaling inhibitors for 18 h (A), varying durations (3-24 h) with U0126 (B), or varying concentrations of U0126 for 24 h (C). Cells were then activated with LPS (100 ng/mL) for 6 h and the expression of Il1b mRNA was measured by qPCR. D. Production of IL-1β was measured by immunoblotting. LPS-tolerized or non-tolerized cells treated with U0126 for 18 h were activated by LPS (100 ng/mL) for 6 h. Whole-cell lysates were then used for immunoblotting against murine pro-IL-1β (upper panel). For loading controls, both β-actin and p38 immunoreactivities were examined. Relative amounts of IL-1β over β-actin (loading control) were expressed using LPS-activated samples as reference point 1. E. Cells were infected with the Ad5-CMV vector alone (VC), the vector containing catalytically active MEK1 (MEK1-CA), or catalytically inactive MEK1 (MEK1-CI) for 24 h. Cells were then washed and further cultured with fresh media for another 48 h before activation with LPS (100 ng/mL) for 30 mins for immunoblotting against pERK and β-actin (upper panel) or for 6 h for qPCR (lower panel). A one-way ANOVA test followed by Dunnett’s multiple comparisons test was performed for statistical analysis (n=3; * p≤ 0.05, ** p ≤ 0.01, *** p ≤ 0.001, **** p ≤ 0.0001).
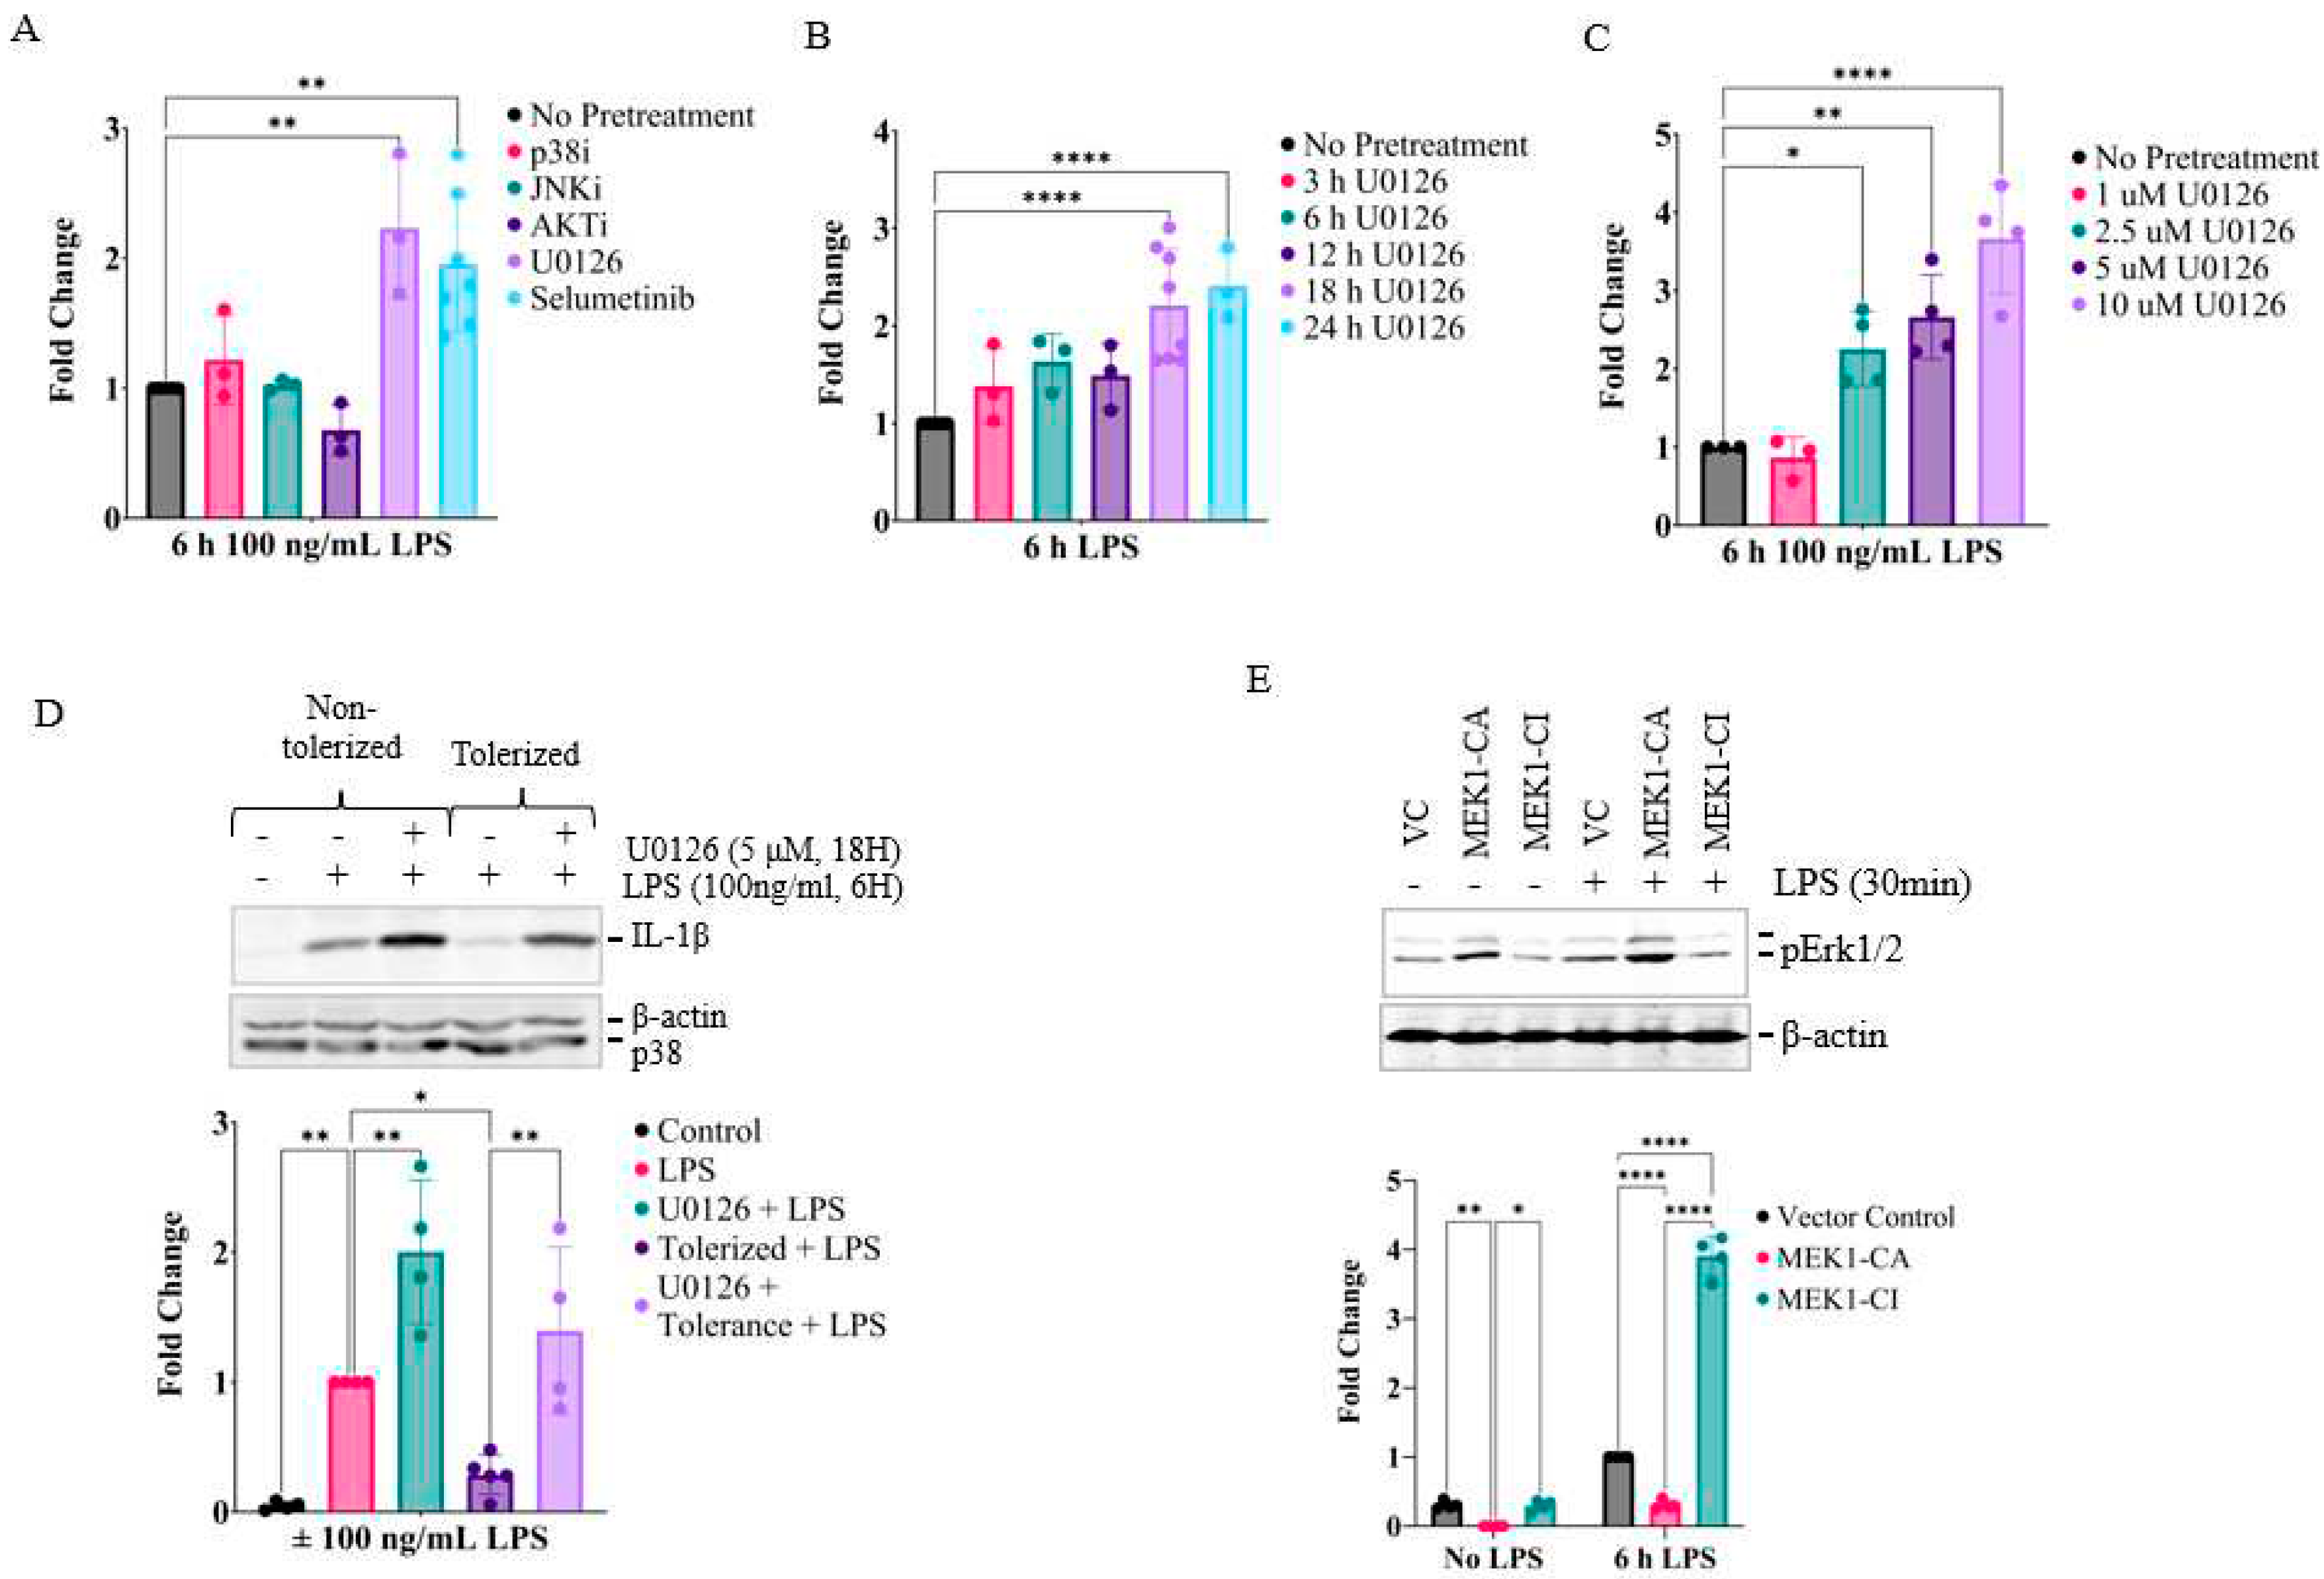
Figure 3.
Transcriptomic analysis of RAW264.7 cells primed with U0126. A. Total mRNAs of non-treated and U0126 (5 µM, 18 h)-treated cells were sequenced by Illumina sequencing, and differential gene expression was analyzed using the feature count and Limma-voom tools in the Galaxy platform as described in the Material and Methods. A. Results shown in the volcano plot indicate the top 3 genes in the fold of increase, decrease, and adjusted P value (Adj. P) categories. Red dots indicate genes with Adj. P <0.05; dotted vertical lines indicate fold of change (FC) > 1.5. B. Gene ontology analysis was performed by the GSEA program and visualized by Cytoscape. Dots represent gene sets (nodes) and dots with a common function were clustered by a circle. Red and blue dots represent positively and negatively enriched gene sets respectively. C. Three positively and negatively over-represented gene ontology pathways were presented by enrichment plots with a size corresponding to gene count and color contrast corresponding to Adj. p. D. The heat map shows the genes in the heterochromatin gene subsets. Expression values are represented as colors, where the range of colors (red, pink, light blue, dark blue) shows the range of expression values (high, moderate, low, lowest).
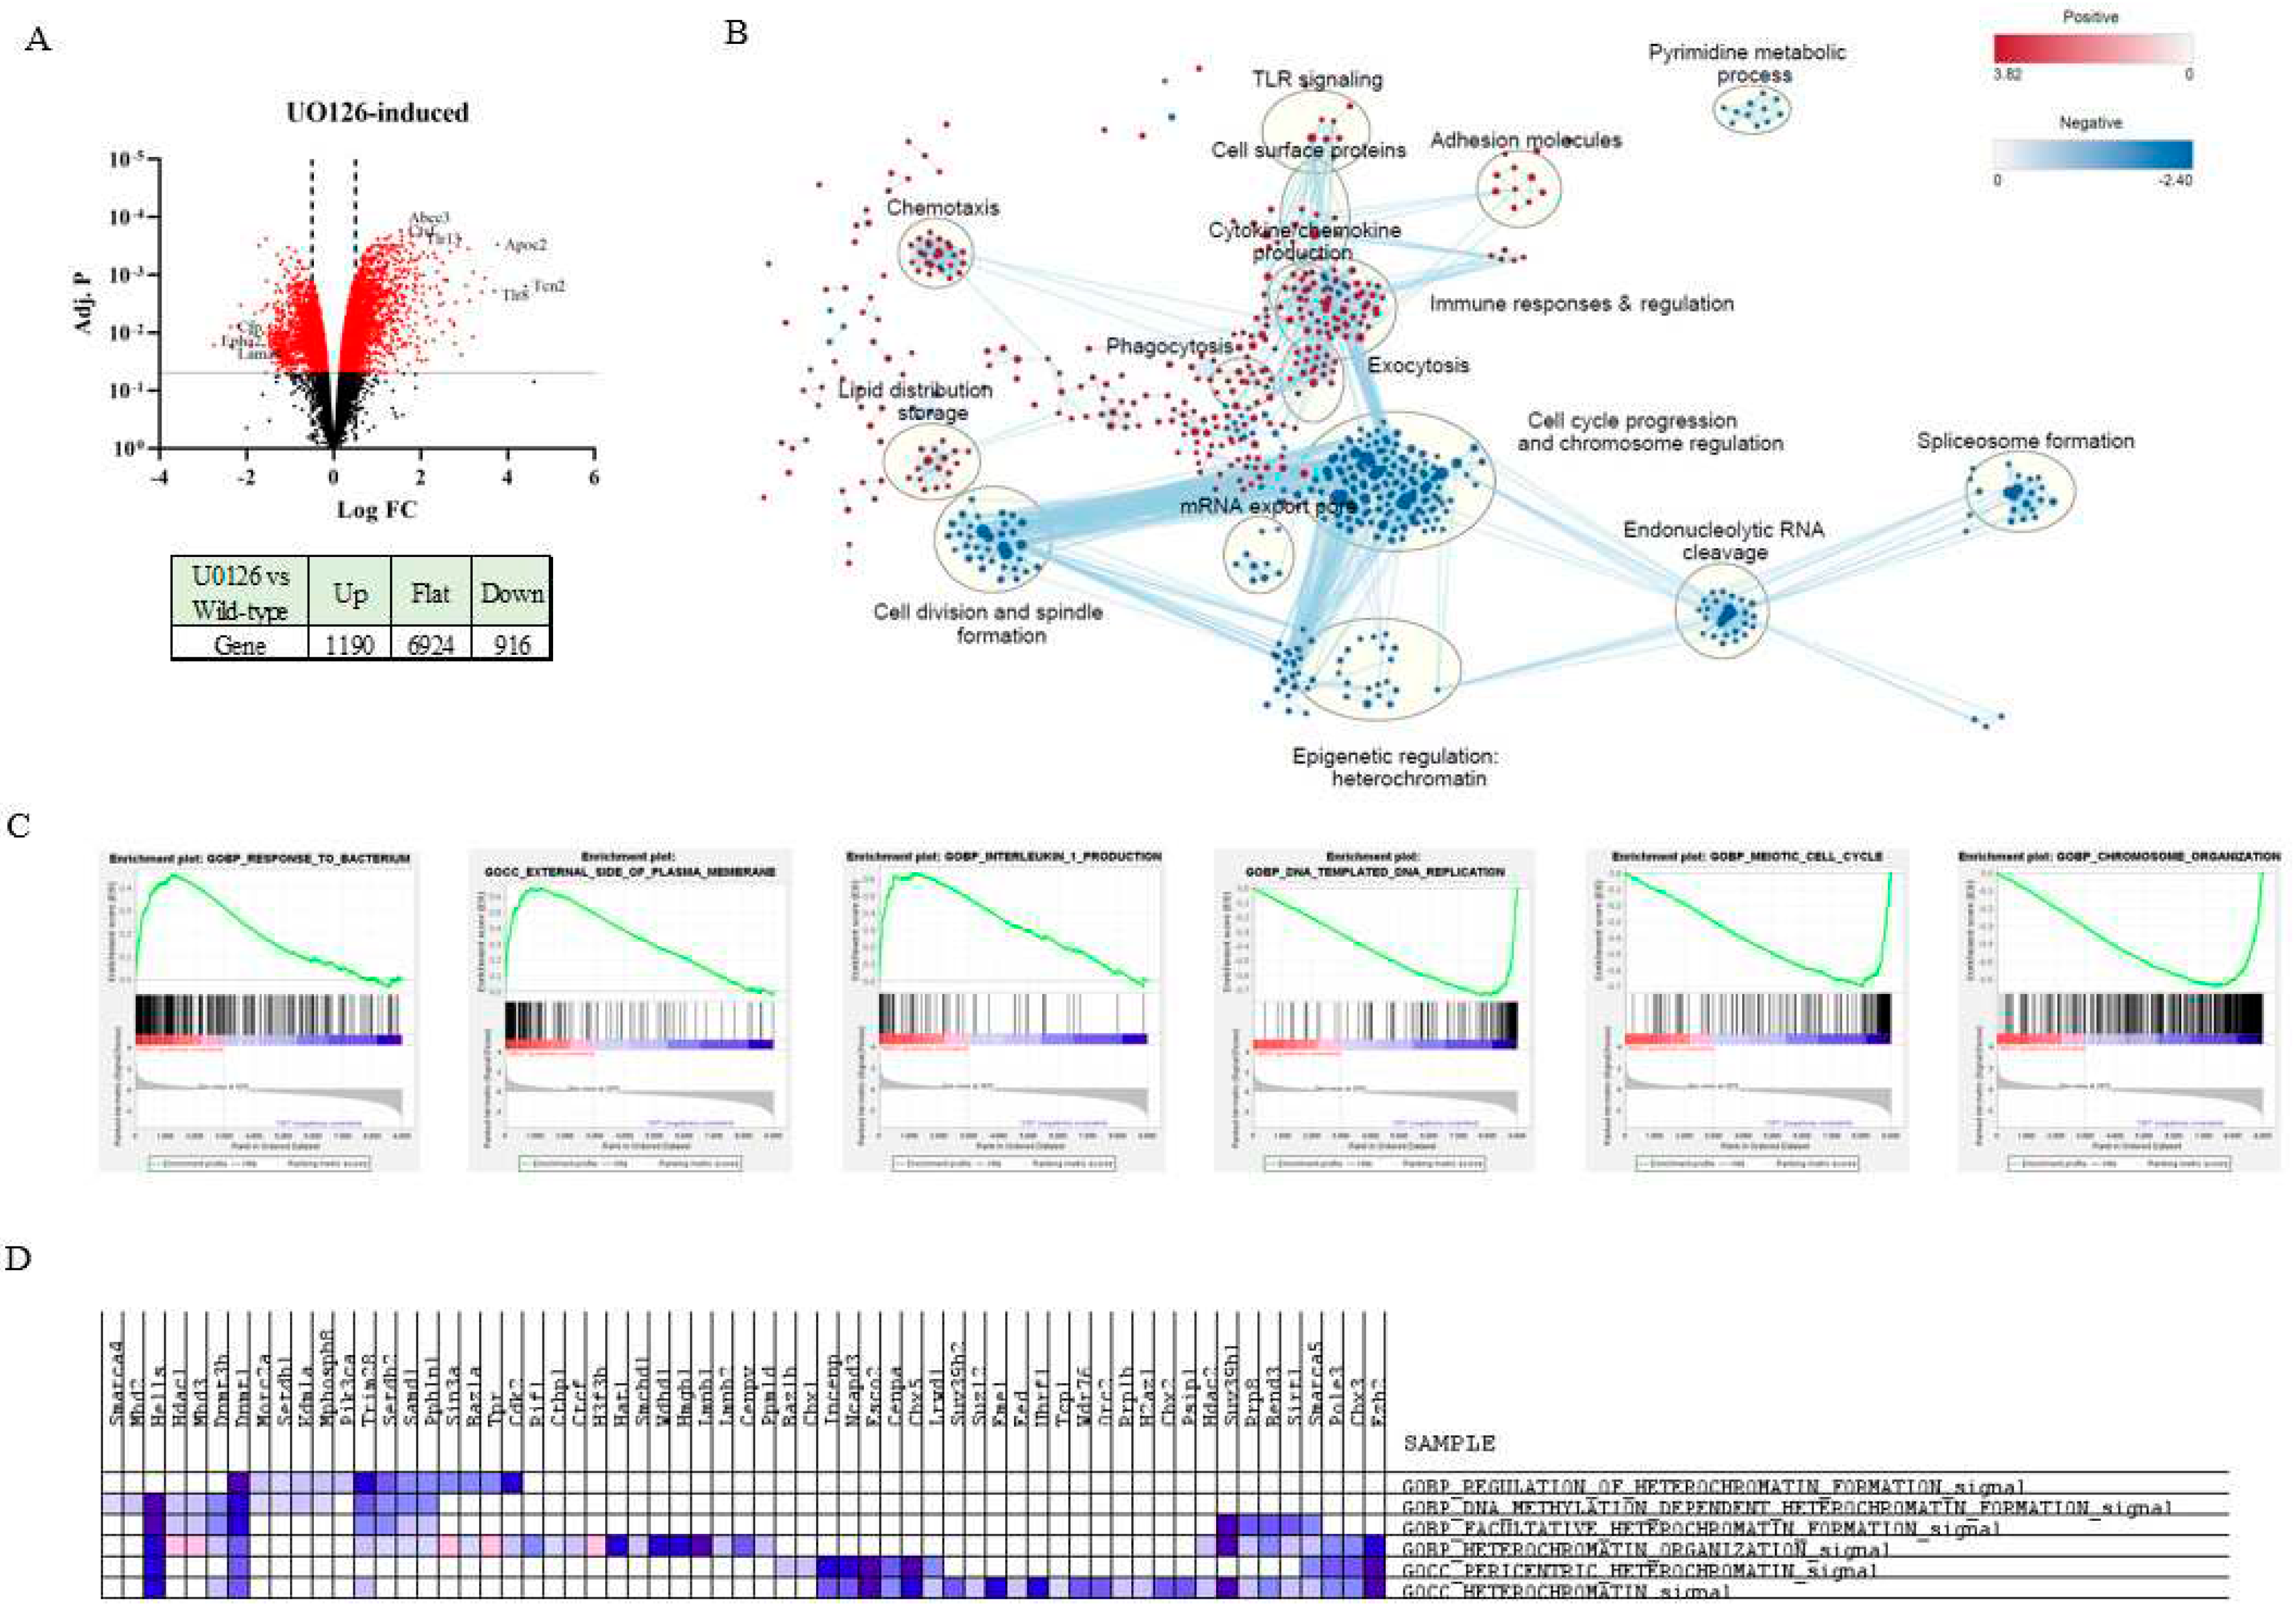
Figure 4.
Priming RAW264.7 cells by U0126 is partly mediated by repressing genes involved in H3K9 methylation. A. Based on the transcriptomic analysis, expression of epigenetic-related genes with greater than 2-fold changes in U0126-primed cells are grouped and plotted with bubble heat maps. B. Expression of Cbx5, Suv39h1, and Kdm7a were confirmed by qPCR in U0126-primed and non-primed cells. Statistical significance was determined by multiple unpaired two-tailed t-tests (n=3). C-D. Cells were treated with various inhibitors for 18 h and then activated by LPS (100 ng/mL) for 6 h. Expression of Il1b was quantified via qPCR. C. Cells were treated with U0126 together with or without KDM2/7 and/or KDM5 inhibitors. D. Cells were treated for 18 h with inhibitors against the H3K9 methyltransferases G9a (BIX01294, 1.5 µM) and/or SUV(VAR)3-9 (chaetocin, 100 nM) or DNMT inhibitors 5-azacytidine (2 µM) and SGI-1027 (10 µM). E. Cells were stably transfected with the eGFP-N1 vector control or the GFP-mCBX5 plasmid and stably transfected cells were pooled after culturing cells with media containing G418 (2-5 mg/mL) for 2 weeks. Expression of eGFP or eGFP-CBX5 was measured in the GFP (vector control) or GFP-mCBX5 transfected cells via immunoblotting using p38 antibody as a loading control (left panel). Cells were activated with LPS (100 ng/ml) for 6 h and Il1b expression was measured with qPCR (right panel). Statistical significance was determined by one-way ANOVA tests followed by Dunnett’s multiple comparison tests (n=3; * p≤ 0.05, ** p ≤ 0.01, *** p ≤ 0.001).
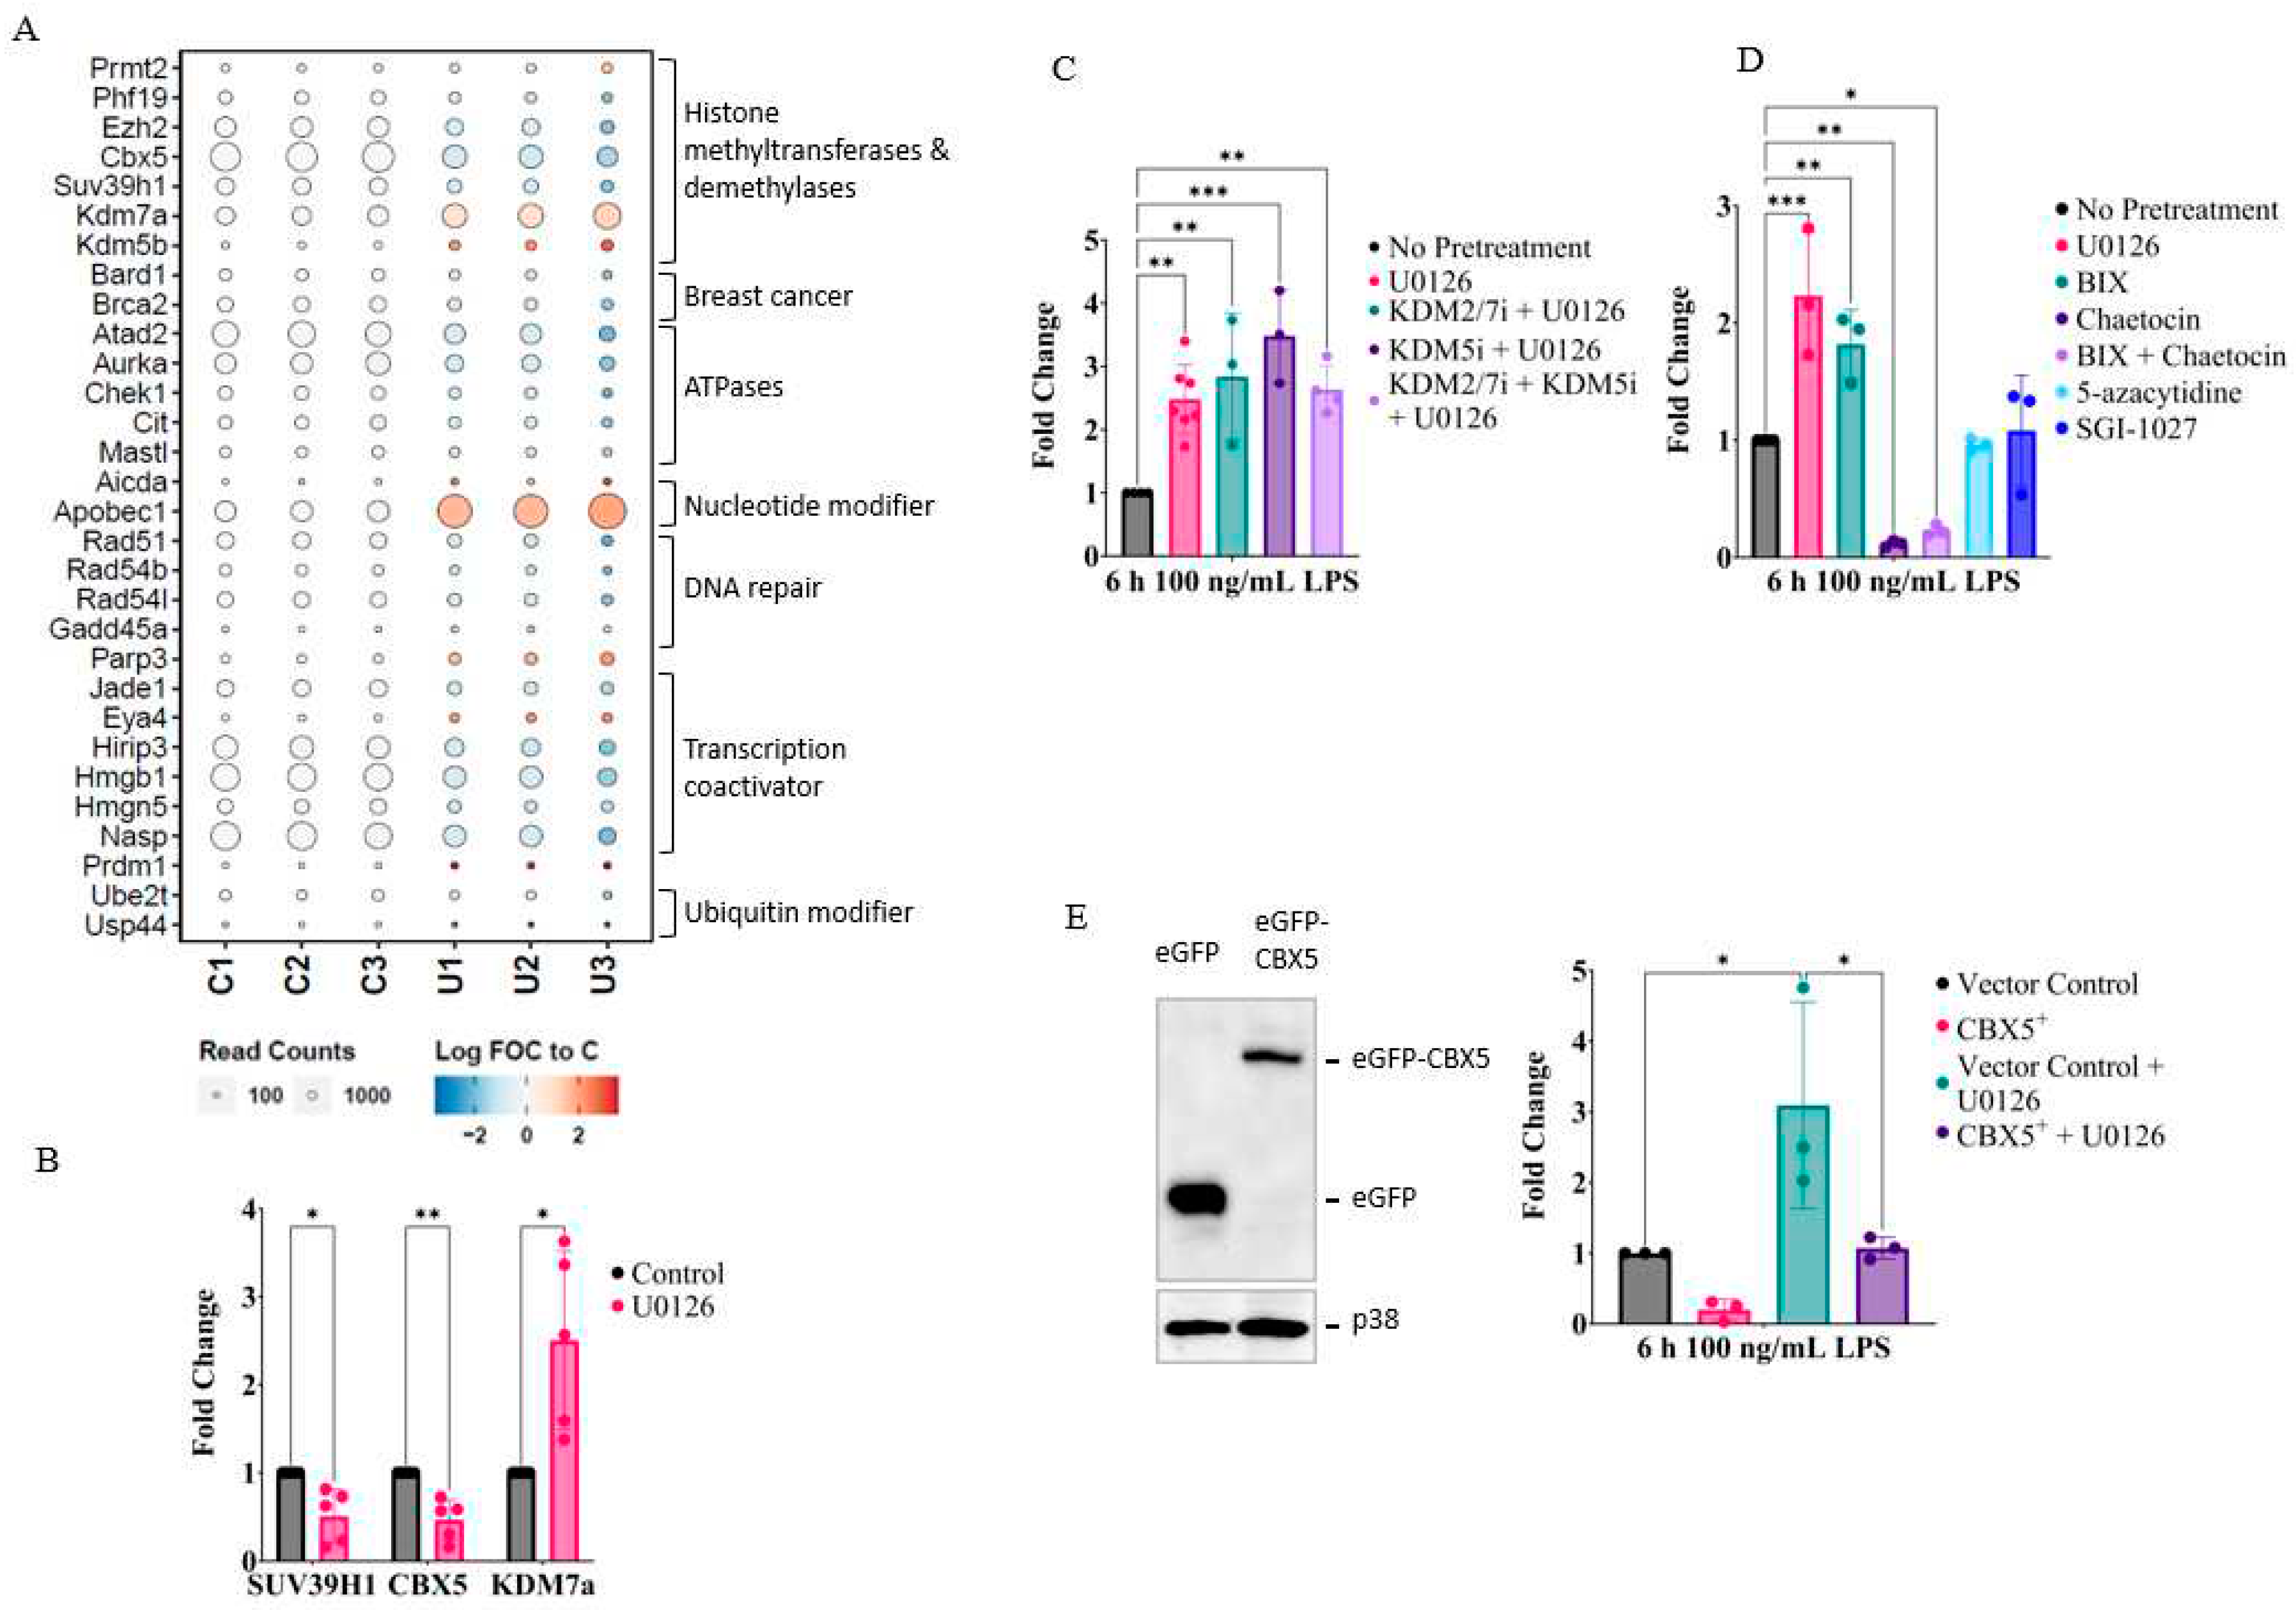
Figure 5.
Inhibition of the MEK1/2-ERK signaling pathway decreases H3K9me3 levels proximal to Il1b, Cxcl10, and TNF gene areas. A (upper panel) & C (left panel). H3K9me3 peaks in murine peritoneal macrophages from the GEO database (GSE107227), together with the built-in BMDM H3K4me1/3 and H3K27ac ENCODE database, were visualized in the UCSC mouse genome browser (mm9). For each gene, two peaks were selected: one located upstream of the promoter (Site 1) and an intragenic region (site 2). A (lower panel). RAW264.7 cells were treated with or without U0126 for 18 h and associations of H3K9me3 with the Il1b genomic area were examined by ChIP-qPCR as described in the Materials and Method. B. RAW264.7 cells were treated with or without U0126 for 18 h before activation with LPS (100 ng/mL) for 6 h. Expression of Il6, Tnfa, and Cxcl10 was analyzed by qPCR. C (right panel). Similar to A, associations of H3K9me3 with the Il6, Tnfa, and Cxcl10 genomic areas were examined by ChIP-qPCR. Statistical significance was determined by multiple unpaired two-tailed t-tests (n=3; * p≤ 0.05).
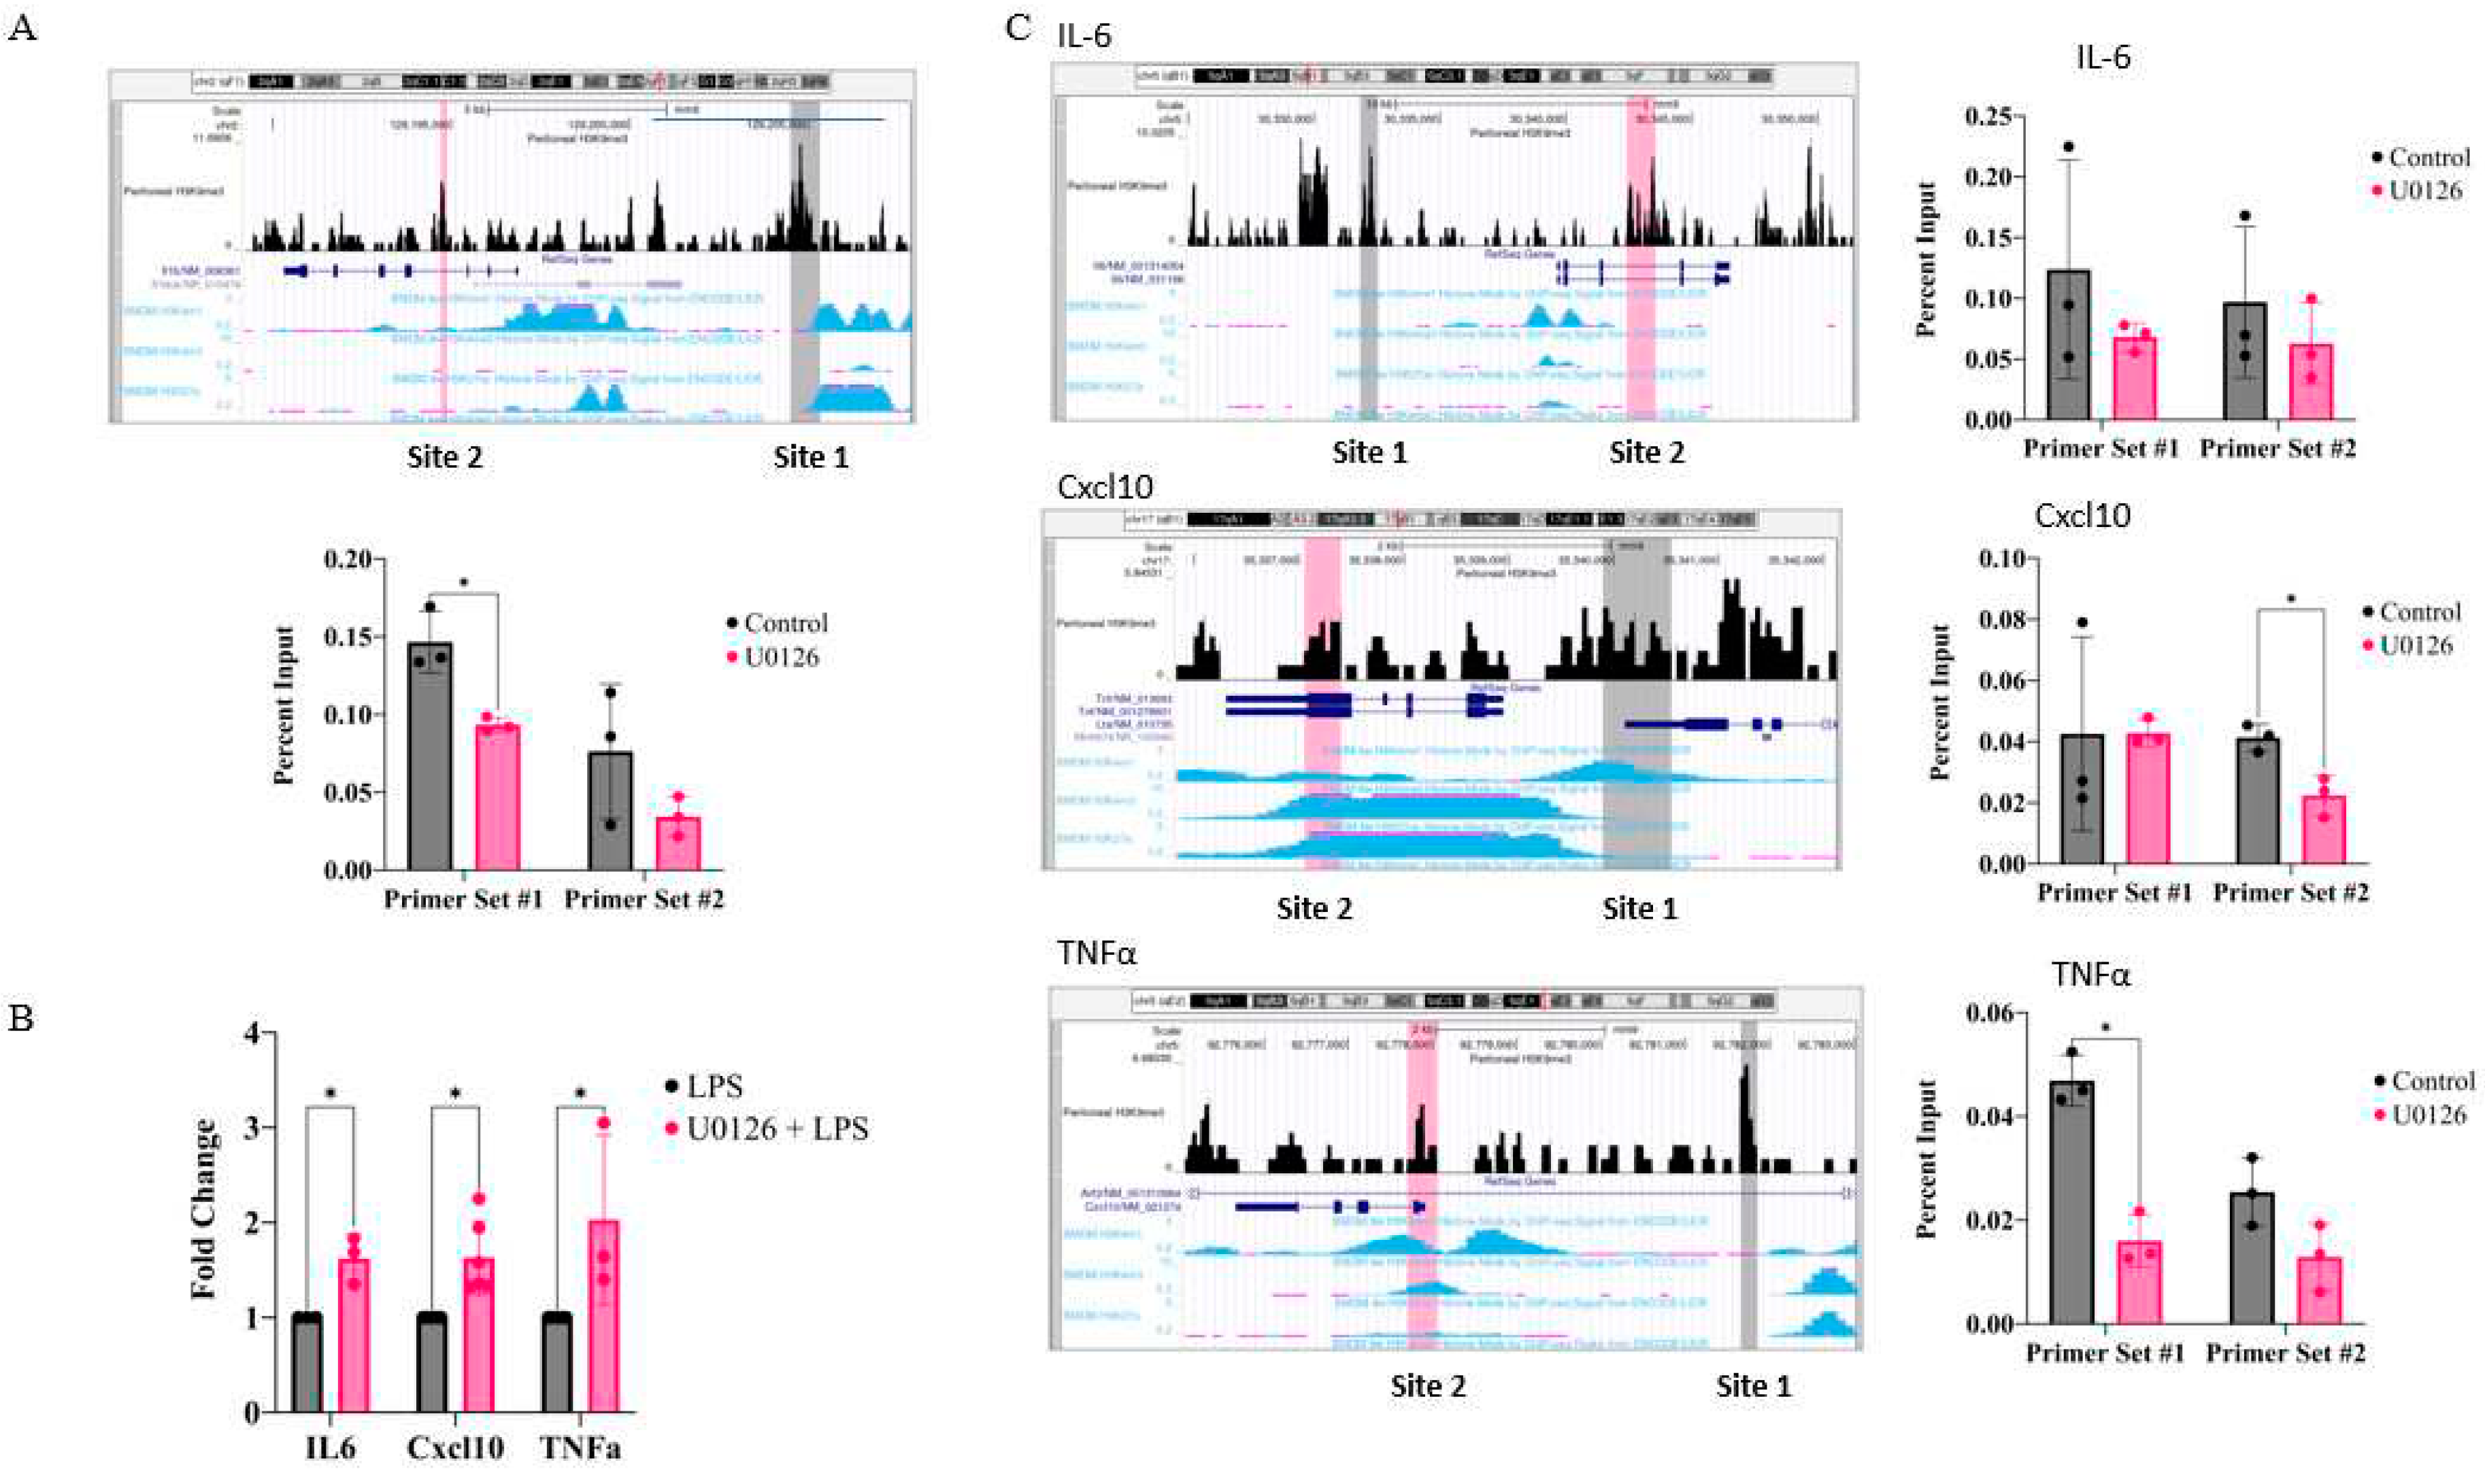
Figure 6.
Inhibition of the MEK1/2-ERK signaling pathway reverses LPS tolerance and enhances inflammatory cytokine expression in BMDMs in a G9a-dependent manner. A. BMDMs were tolerized with LPS for 24 h together with or without U0126 or BIX01294 (left panel) or treated 24 h before activation (middle panel). Cells were then activated with LPS (100 ng/mL) for 6 h for quantification of Il1b mRNA or for 18 h for IL-1β protein levels (right panel). B. Similarly, expression of Il6, Tnfa, and Cxcl10 mRNAs in BMDMs activated by LPS in tolerized with or without U0126 and BIX, and non-tolerized cells pretreated with U0126 and BIX was analyzed by qPCR. One-way ANOVA tests with Dunnett’s multiple comparisons test were done to calculate significance (n=3; * p≤ 0.05, ** p ≤ 0.01, *** p ≤ 0.001, **** p ≤ 0.0001).
Disclaimer/Publisher’s Note: The statements, opinions and data contained in all publications are solely those of the individual author(s) and contributor(s) and not of MDPI and/or the editor(s). MDPI and/or the editor(s) disclaim responsibility for any injury to people or property resulting from any ideas, methods, instructions or products referred to in the content. |
© 2023 by the authors. Licensee MDPI, Basel, Switzerland. This article is an open access article distributed under the terms and conditions of the Creative Commons Attribution (CC BY) license (https://creativecommons.org/licenses/by/4.0/).
Copyright: This open access article is published under a Creative Commons CC BY 4.0 license, which permit the free download, distribution, and reuse, provided that the author and preprint are cited in any reuse.


