Submitted:
22 August 2023
Posted:
24 August 2023
You are already at the latest version
Abstract
Inosine 5'-monophoaphate (IMP) allows animals to sense umami. Intake of IMP in C57/KsJ-db/db (db/db) mice induced lipohyperplasia causing the liver cirrhosis, however, how to that of in normal mammals injure health is still unclear. Thus, we had investigated that intake of IMP in C57BL/6J mice effected its metabolic functions. We found that intake of 255 M/d IMP in C57BL/6J mice for 4 months induced hyperlipidemia and body fat rate raised. In mechanism, the expressions of ACC1 and phosphorylated ACC2 in hepatocytes were increased though IMP promoting phosphorylation of AMPK. The increased ACC1 promoted the conversion of acetyl-CoA into TG. These TG were transported out of hepatocytes to avoid NAFLD, causing a deficiency of acetyl-CoA in liver, and then the increased phosphorylated ACC2 promoted cytoplasm fatty acids into mitochondria to convert into acetyl-CoA though the fatty acids β-oxidation pathway, causing a deficiency of fatty acids. Therefore, liver enhanced the absorption of exogenous fatty acids, which were converted into TG caused lipohyperplasia. Moreover, intake of IMP in normal mice induced complement system weaken in liver causing mild inflammation. Our data not only alerted that humans avoid excessive intake of IMP, but also provided novel insights into the adipose of metabolic dysfunctions.
Keywords:
Inosine 5’-monophosphate (IMP)
; AMPK
; Acetyl-CoA
; ACC
; Lipohyperplasia
1. Introduction
Inosine 5'-monophoaphate (IMP) is a purine nucleotide necessary for organism, which allows animals to sense umami [1,2,3]. As the IMP-disodium salt (IMP-Na2), IMP had been achieved industrial production [4]. Due to IMP-Na2 shows very low toxicity for mammals[5], the Codex Alimentarius Commission (CAC) had approved IMP-Na2 as a food additive, and had considered that it is not necessary to stipulate the acceptable daily intake (ADI) for human being (FAO/WHO, 1994). Results of in vitro assay revealed while IMP absorbed by mammalian cells, it cannot be degraded timely to accumulate in the cells[6], moreover IMP can be converted into other purine nucleotides[7], thus intake of IMP added in diet in mammal may cause excessive purine nucleotides in the body.
My co-worker and I found that C57/KsJ-db/db (db/db) mice treated with 50 mg/(kg mb·d) IMP-Na2 using the gavage for 8 weeks induced lipohyperplasia in liver, causing non-alcoholic fatty liver cirrhosis (NAFLC)[8], which easily evolved into hepatocellular carcinoma to promote death [9]. Due to the leptin receptor gene defects, db/db mice has severe leptin resistance to occur spontaneously metabolic syndrome such as NAFLD and type II diabetes[10]. Therefore, IMP should promote NAFLC in the humans with severe leptin resistance. Based on the Body Surface Area-Based Equivalent Dose Calculation Rule between mouse and humans[11,12], we can consider that intake of 285 mg/d IMP-Na2 added into diet in humans with the severe leptin resistance and a body weight of 70 kg may induce NAFLC. In addition, intake of glutamine in C57BL/6J mice from the drinking water induced excessive IMP and UA in body, causing the hypothalamic inflammation, leptin resistance, and oxidative stress, which caused together excessive caloric intake to promote metabolic syndromes such as adiposity and NAFLD[13]. These findings revealed that oral intake or metabolic disorder caused the IMP accumulation in mammal body is an important cause to promote metabolic syndrome.
As yet, how to intake of IMP added into diet in normal mammals effect the health is still unclear. Judging from the normal life habits of humans, IMP is usually ingested from food and food additive while diet, thus, we can consider that the metabolic functions of C57/BL6J mice effected by the gavage of IMP every day are consistent with those of intake of IMP from food in humans. Therefore, investigation of metabolic functions of 4-month-old C57BL/6J mice effected by various doses of IMP using the gavage for 4 months had been carried out in this study. A harmful dose of IMP-Na2 to C57/BL6J mice and the novel mechanisms of IMP inducing hyperlipidemia and body fat hyperplasia as well as IMP promoting inflammation in mice had been elucidated. Our data provided novel insights into the adipose of metabolic dysfunctions in mammal body as well as the food safety of IMP-Na2.
2. Results
2.1. Intake of IMP in C57BL/6J mice induced lipohyperplasia and inflammation
During the experimental period, the mice in each IMP-Na2 treatment group did not occur excessive food intake or weight gain in mice vs. that of the control group (Fig. 1A). At the end of the experiment, only the body fat rate of the mice in high-dose group increased approximate 55% vs. that of the control group (Figure 1B). Each of the contents of TG, NEFA or TC in liver tissue did not significant change vs. that of the control group (Fig. 1C). The serum TG content of mice in the high-dose group increased by approximate 2 times, the serum TC content of mice in low-dose group was reduced by approximate 50%, each of contents of serum LDL, HDL or uric acid of mice in each group treated by IMP had no change vs. that of control group (Fig. 1D).
The serum TNF-α content of the mice in each of IMP-Na2 treatment group was higher than that of control group respectively, and the content depended on the dose of IMP, while the contents of IL-1β, IL-6, ALP, AST, ALT and LDH did not change (Figure 2A). These results revealed that intake of more than 10 mg/(kg mb·d) IMP-Na2 could induce inflammation and the inflammation intensity was dependent on the intake of IMP. Intake of IMP-Na2 up to 100 mg/(kg mb·d) in the mice could not still promote IL-1β or IL-6 increasing, which suggested that organs were not still injured [17].
The contents of TG, NEFA or TC in liver tissue and AST, LDL and LAT in serum of individual members in each administration group were significantly higher than those of members in the same group (Fig. 1C, 2A). Their liver tissue sections were stained with Oil Red O and indicated that NAFLD occurred (Fig. 2B). Due to the interindividual variability of methabolism, some members of the normally raised C57/BL6J mice population could exhibit NAFLD[18], therefore, the intake of IMP by the gavage was not the cause of NAFLD occured in these C57/BL6J mice. Our data revealed that intake of 50 mg/(kg mb·d) IMP-Na2 in normal mice could not induce any metabolic syndrome, while the intake of dose of IMP-Na2 up to 100 mg/( kg mb·d) induced lipohyperplasia, shown as the body fat rate raised and hyperlipidemia.
2.2. AMPK is the unique target for IMP regulates TG metabolism
IMP or purine nucleotides such as AMP and adenylosuccinate forms a complex with γ-subunit of AMPK to promote phosphalytion of α-subunit of AMPK led to TG increasing in vivo, in contrast, that of led to TG decreasing in vitro[8,19]. To demonstrate that AMPK is the unique target for IMP regulation of lipid metabolism, we had measured the lipid-lowering activity of IMP in the adipose-accumulating HepG2 cells induced by OA with and without dorsomorphin, a AMPK inhibitor[20]. Results revealed when dorsomorphin absent, the lipid-lowering activity displayed by IMP was basically the same as that of lovastatin, in contrast, when dorsomorphin present, lipid-lowering function of IMP losted (Figure 3). AMPK is not the target of lovastatin, which achieves lipid-lowing effect targeting hydroxymethylglutaryl-CoA (HMG-CoA) reductase[21], therefore, the inactivation of AMPK did not alter the lipid-lowering activity of lovastatin. Our data demonstrated that IMP have to interact with AMPK to change the expression level of key proteins in the TG metabolic pathway causing the TG accumulation or disappearance.
2.3. Intake of IMP in normal mice promoted acetyl-CoA regeneration though enhancing phosphorylation of AMPK
Comparison of the protein expression level in hepatocytes of mice in the low-, middle- and high-dose groups with that of control group revealed that phosphorylated AMPK increased by about 0.8, 0.9 and 1.2 times respectively, ACC1 increased by about 0.5, 2.5 and 2.8 times respectively, ATGL in the hepatocytes of mice in all of the IMP treated groups increased by about 1.5 times, and phosphorylated ACC2 in hepatocytes of mice in high-dose group increased by about 0.5 times (Figure 4). ACC1 exists in the cytoplasm of hepatocyte and is a rate limiting enzyme in the acetyl-CoA to fatty acid pathway [22,23]. Fatty acids in hepatocytes are majorly converted to TG through the diglyceride pathway[24]. Thus, increasing ACC1 expression promoted the conversion of acetyl-CoA to TG in hepatocytes. ACC2 exists in the outer membrane of mitochondria, and increasing phosphorylated ACC2 in hepatocytes promotes that the fatty acids in the cytoplasm are transported into mitochondria and then converted into acetyl-CoA by the fatty acid β-oxidation pathway[20,25]. The increasing expression of ATGL promotes the degrade of intracellular TG to generate fatty acids and glycerol[26].
Our data revealed that the activities of the AMPK-ACC1 and AMPK-ACC2 pathways increased dependent on the intake of IMP, however the activity of the AMPK-ATGL pathway increased independent on the dose of intake of IMP. Therefore, intake of IMP should cause abnormal changes in the content of TG, fatty acids or acetyl-CoA in vivo, in fact, the content of TG and NEFA in liver of mice in low-, middle- and high-dose groups has not changed vs. that of the control group (Fig. 1C), while the content of acetyl-CoA in liver or serum was lower than that in control group, the content of acetyl-CoA increased dependent on the dose of intake of IMP (Figure. 5). These results suggested that intake of IMP promoted TG synthesis by promoting regeneration of acetyl-CoA in vivo, the mice in high-dose group shown the body fat accumulation and the hyperlipidemia (Figure 1D).
2.4. IMP reduced activity of complement system to induce inflammation
In order to elucidate the new mechanism of IMP promoting lipohyperplasia and inflammation in mice, identification of the differentially expressed proteins in liver of mice in the high-dose group vs. those of mice in the control group was carried out using the TMT-based proteomics analysis. The liver tissues of three mice in the high-dose group and three mice in the control group were randomly selected as test samples. The MS/MS data of proteins extracted from each sample after enzymatic hydrolysis and TMT modification met the quality requirements for the classification of all proteins in hepatocytes and quantitative analysis of each protein (Figure S1A). The distribution characteristics of peptide sequences identified by MS/MS data were in accordance with the law of protein cleavage (Figure S1B-D), and the proteins not successfully identified accounted for 3.98% of the total proteins of hepatocytes ( Figure S1E, F). 4955 proteins were identified in the livers of the control group and the high-dose group, and 4769 proteins were determined (Figure S2). The quantitative proteins in the liver tissue samples of normal mice were used as control, and the expressions of 4 proteins were increased (Table 1) and 23 proteins were decreased (Table 2) in the liver tissue of high-dose mice. The increased expression of elongation of very long chain fatty acids protein 5 (Q8BHI7) suggested that the conversion of acetyl-CoA into fatty acids was promoted by AMPK-ACC1 pathway[27]. The increased expression of mono-acylglycerol lipase ABHD2 (Q9QXM0) suggested that AMPK-ATGL pathway[26] was activated. Except the two proteins, TMT-based proteomics analysis did not find significant changes in the expression of proteins regulating adipose metabolism.
The results of GO annotation[15] for these 27 proteins suggested that eight biological functions involved to immune system in liver significantly changed induced by IMP (Figure 6A). The phenotype of mice in the high-dose group suggested that IMP induced significant changes in the function of hepatocyte immune process. Expression of up-regulated hepcidin (Q9EQ21) as well as expressions of down-regulated proteins CFAH (P06909), C4B (P01029), C8G (Q8VCG4), C8A (Q8K182), and HPT (Q61646) are directly related to changes in immune processes, causing the inflammation (Figure 6B). The results of signal-pathway enrichment using the KEGG mapping tool revealed that the change of complement signaling pathway in hepatocytes was the cause of immune process changes (Figure 6C). The expression changes of CFAH, C4B, C5(P06684), C8G, C8A and C9 (P06683) were directly involved in regulating the changes of complement system [28,29] (Figure 6D). The proteins C4B, C5, C8G, C8A, and C9 constitute signaling pathways that regulate the generation of C5α and MAC complexes in the complement system[29] (Figure 6E). The expression levels of C4B, C5, C8G, C8A and C9 are all decreased induced by IMP resulting in formation of C5α and MAC complex were inhibited, which caused the function of the complement system weaken to promote inflammation. Mechanism of IMP binding to AMPK to cause the complement system weaken could not be elucidated based on our data.
3. Discussion
Results of this study revealed that phenotypes of the C57/BL6J mice induced by IMP-Na2 at 24-hr intervals were obviously different from those of intake of glutamine from drinking water[13]. Our data suggested that intake of IMP in normal mice though promoting phosphorylation of AMPK activated AMPK-ACC1, AMPK-ACC2 and AMPK-ATGL pathways in hepatocytes causing TG accumulation in vivo, therefore, elucidating the mechanism of periodic intake of IMP induced lipohyperplasia is important to understand the purine nucleotides metabolic disorder relating to TG metabolic disorder and detail of food safety of IMP-Na2.
If the diglycerol pathway in hepatocytes of the mice in low-dose group was completely inhibited by AMPK-ATGL pathway, the fatty acids converted by acetyl-CoA would accumulate in the hepatocytes. In fact, the contents of NAFA and TG in the liver of mice in the low-dose group had not changed (Figure 1C). Therefore, even though the activity of AMPK-ACC1 pathway was similar to that in the high-dose group, the diglycerol pathway could not be completely inhibited. Once AMPK-ACC1 pathway was activated by IMP, a metabolic pathway was formed in hepatocytes to promote the conversion of acetyl-CoA into TG and its transport outside the liver. As NEFA and TG contents remained unchanged, liver cells simply consumed their own acetyl-CoA, and severe deficiency of acetyl-CoA would inevitably inhibit TC generation. Therefore, the serum TC content of mice in low-dose group decreased (Figure 1D). With the IMP dose increase, the activity of AMPK-ACC2 pathway was enhanced, and acetyl-CoA converted from the absorption of exogenous fatty acids by hepatocytes was increased. The content of acetyl-CoA in mice was turned to rising, and acetyl-CoA for TC synthesis were no longer scarce. It was observed that the content of TC in the serum of mice in the middle- and high-dose groups was unchanged compared with the control group. Thus, the AMPK-ATGL pathway dose not contribute to the inhibition of hyperlipidemia in mice, suggesting activation of AMPK-ACC1 and AMPK-ACC2 pathways are a necessary condition for the mouse liver to enhance the absorption of exogenous fatty acids, which are then converted into TG and transferred outside the liver.
Based on our data, mechanism of periodic intake of IMP induced body fat accumulation and the hyperlipidemia in normal mice was shown in Figure 7. IMP was absorbed by the small intestine and entered hepatocyte through blood circulation, then phosphorylation of AMPK was promoted, resulting in activation of the AMPK-ACC1 pathway, AMPK-ACC2 pathway, and AMPK-ATGL pathway. AMPK-ACC1 pathway promoted the conversion of acetyl-CoA into TG in cytoplasm. The TG content of liver tissue remained unchanged (Fig. 1C) indicated that AMPK-ATGL pathway could not completely inhibit the conversion of acetyl-CoA into TG in cytoplasm, and excess TG was transported outside hepatocytes, resulting in the deficiency of acetyl-CoA in hepatocytes. At the same time, the activated AMPK-ACC2 pathway promoted the transport of cytoplasmic fatty acids into mitochondria through fatty acid β-oxidation pathway to generate acetyl-CoA, and then transported acetyl-CoA to cytoplasm, which led to the deficiency of fatty acids in hepatocytes. Thus, IMP forced that hepatocytes enhanced the absorption of external fatty acids and converted them into TG, and then transported the TG outside of hepatocytes to inhibit NAFLD. Due to leptin resistance level dependent on IMP content in mice body[13], once these TG could not be degraded timely, hyperlipidemia and body fat rate raised would occur. The occurrence of hyperlipidemia in mice depends on whether the TG secreted by the liver induced by IMP exceeds its metabolic limit. Our data confirmed that intake of IMP of 255 μM/d in mice caused the inability of TG transported outside the liver to be metabolized by other organs, resulting in hyperlipidemia and an increase in body fat rate.
In case of periodic intake of IMP in db/db mice, IMP promoted AMPK phosphorylation to induce phosphorylated ACC2 expression increased, the expressions of ACC1 and ATGL was no significant changed in hepatocytes[8]. The inceased phosphorylated ACC2 promoted the conversion of fatty acids in hepatocytes into acetyl-CoA causing fatty acid deficiency in liver. Thus, liver enhanced the absorption of fatty acids from peripheral blood to promote TG generation causing the lipohyperplasia[8]. Results of in vivo assay revealed that the ACC2 phosphotylation increasing is the requirement to promote absorption of exogenous fatty acids and convert into TG synthesis in liver to cause the lipohyperplasia. In addition, results of in vitro assay revealed that purine nucleotide though promoting AMPK phosphorylation increase the expression of phosphorylated ACC2 and ATGL, while there was no significant change in the expressions of ACC1[8,19]. The phosphorylated ACC2 also caused an intracellular deficiency of fatty acids. Due to the cell culture middle did not contain additional fatty acids, the fatty acids absorbed from the outside could not maintain the content of acetyl-CoA in the cells, then, the expression of ATGL increased to promoting lipolysis to generate fatty acids converted into acetyl-CoA, therefore, IMP shown a high activity of lipid lowering in vitro.
In addition, our data revealed that mice in the low- and medium-dose groups did not develop any metabolic syndrome but developed inflammation, which was caused by the weakening of complement system in liver. Due to lipohyperplasia in mammal body may induce meta-inflammation[30], the inflammation in mice in the high-dose group included inflammation caused by the weakening of complement system in liver and meta-inflammation, however, the combined action of these two kinds of inflammation did not injure organs. Thus, it can be considered that the inflammation induced by periodic intake of IMP is harmless to health.
4. Materials and Methods
4.1. Mice feeding, IMP treatment and physiological data determination
Twenty C57/BL6J mice (male; weight, 25-30 g; age, 16 weeks) from Vital River Laboratories (Qualified Certificate No. SCXK Jing 2019-0010) were randomly divided into four groups. Five mice in each group housed were in a cage and in a specific-pathogen-free environment, which was maintained at the temperature of 22 ± 2.0 °C and the relative humidity of 50-70%, with the 12 hr of light/dark cycle and free access to diet and purified water. The Beijing SPF Biotechnology Co. Ltd provided the standard diet, which was designed to meet all the nutritional requirements of normal mice.
After the mice were fed for one week, mice in one group were normaly feeding as control, mice in other three groups were treated with IMP-Na2 at the dose of 10, 50, 100 mg/kg of IMP respectively (referred as low-, middle-, and high-dose group, respectively) using the gavage. The IMP treatment were performed once every 24 hr. The drug treatments were carried out for 4 months. Measure the body weight of mice at an interval of one month. At the end of IMP-Na2 treatment, the of body fat rate of mice were measured us the body composition analyzer (Bruker LF50/90). After euthanasia of mice, the eyeball blood was taken to measure respectively content of TG, TC, HDL and LDL in each group using the automatic biochemical analyzer (Biobase BK-400). To detect adipose accumulation in the liver, frozen sections were rinsed with distilled water, stained with 0.2% Oil-Red O (Sigma-Aldrich, Shanghai, China) and 60% 2-propanol (Sigma-Aldrich, Shanghai, China) for 10 min at 37°C, and then rinsed with distilled water. The liver tissues were observed using a microscope (Leica DM4000B, Benshein, Germany). Acetyl-CoA content in serum and liver were determined respectively following the methods of the published articles[8]. Corresponding assay kits (Zhongsheng Beikong Biotechnology, Beijing, China) were used to determine the content in liver of AST, ALP, ALT, LDH, TNF-α, IF-6, IF-β, as well as content in serum of UA.
4.2. Western-blotting analysis
The liver tissue of each group were lysed with RIPA buffer containing protease and phosphatase inhibitor cocktail for 30 min at 4°C. Protein concentrations were determined using a BCA protein estimation kit (Biodragon, Beijing, China). Equal amount of proteins was separated by SDS-PAGE and transferred to PVDF membranes (Merck Millipore Ltd, USA). The membranes were then incubated in blocking buffer containing 5% non-fat milk for 2 hr and probed with primary antibody overnight at 4°C. The membranes were then washed with the TBS-T buffer for three times and incubated at the room temperature for 2 hr with the secondary antibody that was conjugated with horseradish peroxidase. Three more washes were applied to the membranes, which went through the immunodetection by using the promote chemilumine science kit (Biodragon, Beijing, China). The levels of protein expression were quantified by Image J software (National Institutes of Health, Bethesda, MD, USA) and normalized to the relative internal standards. All of the antibodies used to Westen-blotting analysis were purchased from the Protein Thec., Inc.
4.3. In vitro assay of lowing-lipid of IMP with and without AMPK inhibitor
HepG2 cell line were provided by National Infrastructure of Cell Line Resource (Beijing, China). Lovastatin (99%), IMP (99.5%) and dorsonmorphin (6-[4-(2-piperidine-1-ethoxy) phenyl]-3-pyridine-4-pyrazolazo [1, 5-a] pyrimidine), which is a highly effective AMPK inhibitor, was purchased from Sigma-Aldrich company. HepG2 cells were cultured in dulbecco's modified eagle's middle (DMEM, HyClone) supplemented with 10% fetal bovine serum (Gibco) and 1% penicillin/strep-tomycin (Biodragon) in a humidified atmosphere of 5% CO2 and 37°C. The cells were seeded in 96-well plates as approximate 1 × 10⁴ cells in each well. After the cells were totally attached, the cells were divided in two groups, one group added 0.1% (v/v) DMSO, and the other added 10 μM AMPK inhibitor, both cultured for 6 hr. Then using a DMEM middle containing 100 μM OA, a DMEM middle containing 10 μM lovastatin and 100 μM OA as model and positive control. The drug treatment of HepG2 cells were carried out using DMEM middle containing 100 μM OA and10 μM IMP for 24 hr. The HepG2 cells were cultured using DMEM solution for 24 hr as control. After drug treatment, the cells in each well were washed with PBS and fixed with 4% paraformaldehyde for at least 30 min. After the paraformaldehyde was discarded, HepG2 cells in each hole were stained using 100 μL of Bodipy 493/503 solution (2 μM) at 37℃ for 30 min without light. Discard the dye and rinse each hole with PBS three times. The cells were observed and photographed using an inverted fluorescence microscope. The fluorescence value is scanned into gray value by Image J software (National Institutes of Health, Bethesda, MD, USA) and normalized to the relative internal standards.
4.4. TMT-based proteomics analyses
The liver tissues of mice from control group and high-dose group respectively were frozen and ground with liquid nitrogen to powder and then transferred to a 5 mL centrifuge tube. Subsequently, extraction of total proteins, digestion using trypsin, peptides of TMT labeling and LC-MS/MS analysis for the peptides were carried out following the reported methods[14].
The MS/MS data were processed with the Maxquant Search Engine (v.1.5.2.8). The mass spectra were searched in the UniProt Data Base concatenated with the reverse decoy database. To identify differentially expressed proteins, relative protein expression was compared between control group and high-dose group. The two-sample equal variance T-test was utilized. The criteria used to define differentially abundant proteins were based on P < 0.05 and fold change (FC) > 1.2.
4.5. Bioinformatics analyses
The contents of bioinformatic analysis include gene ontology (GO) annotation and online Kyoto Encyclopedia of Genes and Genomes (KEGG) annotation. Classifications of the biological function for the differentially expressed proteins induced by IMP were determined using the GO annotation based on the UniProt-GO database (http://www.ebi.ac.uk/GOA/)[15]. The signal pathways involved these protein were determined using the KEGG mapping tool based on the database (http://www.genome.jp/kegg/)[16].
4.6. Statistical analyses
The results were expressed as mean ± standard deviation (SD). Data statistical analysis was carried out using the GraphPad Prism 5.0 software. The statistical significance of group differences was analyzed with one-way ANOVA followed by Tukey's test or Newman–Kueuls test. P < 0.05 was considered statistically significant.
5. Conclusions
Intake of IMP-Na2 added into the diet in normal mammals promotes excessive generation of TG, which is a cause to induce matabolic syndrome. Due to intake of 100 mg/(kg mb·d) IMP-Na2 induced adipose accumulation in C57/BL6J mice, as a food additive, intake of IMP-Na2 should be less than 569 mg every day in humans with a body weight of 70 kg.
Supplementary Materials
The following supporting information can be downloaded at the website of this paper posted on Preprints.org.
Author Contributions
Y.X. (Yong Xie) designed the project. B.Z., Y.X. (Yang Xu), J.L., C.W., X.Z. L.Z. and Y.X. (Yong Xie) performed most of the experiments. B.Z., Y.X. (Yang Xu), J.L., and Y. X. (Yong Xie) analyzed the data and discussed the article. J.L., and Y. X. (Yong Xie) wrote the manuscript. All authors contributed to the article and approved the submitted version. All authors have read and agreed to the published version of the manuscript.
Funding
This research was funded by the National Natural Science Foundation of China (No.81473114 to Y. X. and No. 81891012 to B. Z.)
Institutional Review Board Statement
The study was conducted in accordance with the Declaration of Helsinki, and approved by the Animal Care and Welfare Committee of Institute of Medicinal Plant Development, Chinese Academy of Medical Science & Peking Union Medical college (Qualified Certificate No. SYXK Jing 2013-0023).”
Informed Consent Statement
Not applicable.
Data Availability Statement
The data presented in this study are within the paper and supplementary materials
Conflicts of Interest
All of authors announced that no conflict of interest exits in the submission of this manuscript, and manuscript has been approved by all authors for publication, moreover, this paper has not been published previously, and it’s not under consideration for publication elsewhere, in whole or in part.
Abbreviations
ACC, Acetyl-CoA carboxylase; ADI, Acceptable daily intake; ALP, Alkaline phosphatase; ALT, Alanine aminotransferase; AMP, Adenosine 5’-monphosphate; AMPD2, Adenosine monphosphate deaminase 2; AMPK, Adenosine 5’-monphosphate activated protein kinase; AST, Aspartate aminotransferase; ATGL, Adipose triglyceride lipase; HDL, High-density lipoprotein cholesterol; IMP, Inosine 5’-monphosphate; IL-1β, Interleukin-1β; IL-6, Interleukin-6; LDH, Lactate dehydrogenase; LDL, Low-density lipoprotein cholesterol; MAC, Membrane attacking complex; NEFA, Non-esterified fatty acid; NAFLD, Non-alcoholic fatty liver disease; NAFLC, Non-alcoholic fatty liver cirrhosis; OA, oleic acid; TC, Total cholesterol; TG, Triglyceride; TMT, Tandem Mass Tag; TNF-α, Tumor necrosis factor-α; UA, Uric acid; C, Complement component.
References
- Chaudhari, N.; Roper, S.D. Molecular and physiological evidence for glutamate (umami) taste transduction via a G protein-coupled receptor. Ann N Y Acad Sci 1998, 855, 398–406. [Google Scholar] [CrossRef]
- Kurihara, K.; Kashiwayanagi, M. Physiological studies on umami taste. J. Nutr. 2000, 130, 931S–934S. [Google Scholar] [CrossRef]
- Kinnamon, S.C. Umami taste transduction mechanisms. Am. J. Clin. Nutr. 2009, 90, 753S–755S. [Google Scholar] [CrossRef]
- Ledesma-Amaro, R.; Jiménez, A.; Santos, M.A.; Revuelta, J.L. Biotechnological production of feed nucleotides by microbial strain improvement. Process Biochem. 2013, 48, 1263–1270. [Google Scholar] [CrossRef]
- Kojima, K. Safety evaluation of disodium 5'-inosinate, disodium 5'-guanylate and disodium 5'-ribonucleotide. Toxicology 1974, 2, 185–206. [Google Scholar] [CrossRef]
- Gooding, J.R.; Jensen, M.V.; Dai, X.; Wenner, B.R.; Lu, D.; Arumugam, R.; Ferdaoussi, M.; MacDonald, P.E.; Newgard, C.B. Adenylosuccinate Is an Insulin Secretagogue Derived from Glucose-Induced Purine Metabolism. Cell Rep. 2015, 13, 157–167. [Google Scholar] [CrossRef]
- Becker, M.A. Summary of the 2015 Purine and Pyrimidine Society/Purine Metabolic Patients Association H. Anne Simmonds Memorial Lecture. Nucleosides Nucleotides Nucleic Acids 2016, 35, 502–506. [Google Scholar] [CrossRef]
- Yunjia, J.; Jinyan, L.; Saijun, X.; Yang, W.; Bin, Z.; Zhong, C.; Yang, X.; Yong, X. The Freshener Inosine 5’-Monophosphate Disodium Aggravates Lipid Metabolic Disorder in Elderly db/db Mice. Food Sci. 2021, 42, 150–158. [Google Scholar] [CrossRef]
- Jiang, Y.; Liu, J.; Xu, S.; Wang, Y.; Zhang, B.; Cheng, Z. , Xu, Y.; Xie, Y.; The freshener inosine 5’-monophosphate disodium aggravates lipid metabolic disorder in elderly db/db mice, Food Science 2021, 42, 150-158. [CrossRef]
- Guo, W.; Ge, X.; Lu, J.; Xu, X.; Gao, J.; Wang, Q.; Song, C.; Zhang, Q.; Yu, C. Diet and Risk of Non-Alcoholic Fatty Liver Disease, Cirrhosis, and Liver Cancer: A Large Prospective Cohort Study in UK Biobank. Nutrients 2022, 14. [Google Scholar] [CrossRef]
- Islam, M.S. Animal models of diabetic neuropathy: progress since 1960s. J. Diabetes Res. 2013, 2013, 149452. [Google Scholar] [CrossRef]
- Liu, W.; Yu, Z.; Wang, Z.; Waubant, E.L.; Zhai, S.; Benet, L.Z. Using an animal model to predict the effective human dose for oral multiple sclerosis drugs. Clinical and translational science 2022, 16. [Google Scholar] [CrossRef] [PubMed]
- Xia, W.; Huang, Z.; Feng, Y.; Tang, A.; Liu, L. Body surface area-based equivalent dose calculation in tree shrew. Science progress 2021, 104. [Google Scholar] [CrossRef] [PubMed]
- Andres-Hernando, A.; Cicerchi, C.; Kuwabara, M.; Orlicky, D.J.; Sanchez-Lozada, L.G.; Nakagawa, T.; Johnson, R.J.; Lanaspa, M.A. Umami-induced obesity and metabolic syndrome is mediated by nucleotide degradation and uric acid generation. Nat Metab 2021, 3, 1189–1201. [Google Scholar] [CrossRef] [PubMed]
- Liu, Y.; Ding, R.; Li, M.; Ou, W.; Zhang, X.; Yang, W.; Huang, X.; Chai, H.; Wang, Q. TMT proteomics analysis of cerebrospinal fluid from patients with cerebral venous sinus thrombosis. J. Proteomics 2023, 275, 104820. [Google Scholar] [CrossRef] [PubMed]
- Aleksander, S.A.; Balhoff, J.; Carbon, S.; Cherry, J.M.; Drabkin, H.J.; Ebert, D.; Feuermann, M.; Gaudet, P.; Harris, N.L.; Hill, D.P. The Gene Ontology knowledgebase in 2023. Genetics 2023, 224. [Google Scholar] [CrossRef]
- Kanehisa, M.; Sato, Y.; Kawashima, M. KEGG mapping tools for uncovering hidden features in biological data. Protein Sci. 2022, 31, 47–53. [Google Scholar] [CrossRef]
- Jiang, J.X.; Tian, K.L.; Chen, H.S.; Zhu, P.F.; Wang, Z.G. Plasma cytokines and endotoxin levels in patients with severe injury and their relationship with organ damage. Injury 1997, 28, 509–513. [Google Scholar] [CrossRef]
- de Conti, A.; Tryndyak, V.; Willett, R.A.; Borowa-Mazgaj, B.; Watson, A.; Patton, R.; Khare, S.; Muskhelishvili, L.; Olson, G.R.; Avigan, M.I. Characterization of the variability in the extent of nonalcoholic fatty liver induced by a high-fat diet in the genetically diverse Collaborative Cross mouse model. FASEB J. 2020; 34. [Google Scholar] [CrossRef]
- Yang, W.; Yunjia, J.; Zhong, C.; Xiaohong, Z.; Peng, G.; Dayong, C.; Yong, X. Mechanism of AMPK activated by adenylosuccinic acid to inhibit lipid accumulation in hepatocytes. China Med. Biotechnol. 2020, 15, 240–248. [Google Scholar] [CrossRef]
- Wang, Y.; Jiang, Y.; Cheng, Z.; Zhao, X.; Guo, P.; Cai, D.; Xie, Y. ; Adenylosuccinate, a metabolite in purine salvage pathway, binds to AMP-activated protein kinase (AMPK) γ subunit and enhances the metabolic efficiency of lipid, Chin Med Biotechnol 2020, 15, 240-248. [CrossRef]
- Dasgupta, B.; Seibel, W. Compound C/Dorsomorphin: Its Use and Misuse as an AMPK Inhibitor. Methods Mol Biol 2018, 1732, 195–202. [Google Scholar] [CrossRef]
- Tobert, J.A. Lovastatin and beyond: the history of the HMG-CoA reductase inhibitors. Nat. Rev. Drug Discov. 2003, 2, 517–526. [Google Scholar] [CrossRef]
- Hunkeler, M.; Hagmann, A.; Stuttfeld, E.; Chami, M.; Guri, Y.; Stahlberg, H.; Maier, T. Structural basis for regulation of human acetyl-CoA carboxylase. Nature 2018, 558, 470–474. [Google Scholar] [CrossRef] [PubMed]
- Wang, Y.; Yu, W.; Li, S.; Guo, D.; He, J.; Wang, Y. Acetyl-CoA Carboxylases and Diseases. Front Oncol 2022, 12, 836058. [Google Scholar] [CrossRef] [PubMed]
- O'Donnell, V.B. New appreciation for an old pathway: the Lands Cycle moves into new arenas in health and disease. Biochem Soc Trans 2022, 50, 1–11. [Google Scholar] [CrossRef] [PubMed]
- Pang, Y.; Xu, X.; Xiang, X.; Li, Y.; Zhao, Z.; Li, J.; Gao, S.; Liu, Q.; Mai, K.; Ai, Q. High Fat Activates O-GlcNAcylation and Affects AMPK/ACC Pathway to Regulate Lipid Metabolism. Nutrients 2021, 13. [Google Scholar] [CrossRef]
- Patel, R.; Santoro, A.; Hofer, P.; Tan, D.; Oberer, M.; Nelson, A.T.; Konduri, S.; Siegel, D.; Zechner, R.; Saghatelian, A. ATGL is a biosynthetic enzyme for fatty acid esters of hydroxy fatty acids. Nature 2022, 606, 968–975. [Google Scholar] [CrossRef]
- Tripathy, S.; Lytle, K.A.; Stevens, R.D.; Bain, J.R.; Newgard, C.B.; Greenberg, A.S.; Huang, L.S.; Jump, D.B. Fatty acid elongase-5 (Elovl5) regulates hepatic triglyceride catabolism in obese C57BL/6J mice. J. Lipid Res. 2014, 55, 1448–1464. [Google Scholar] [CrossRef]
- Santiesteban-Lores, L.E.; Carneiro, M.C.; Isaac, L.; Bavia, L. Complement System in Alcohol-Associated Liver Disease. Immunol. Lett. 2021, 236, 37–50. [Google Scholar] [CrossRef]
- Vignesh, P.; Rawat, A.; Sharma, M.; Singh, S. Complement in autoimmune diseases. Clin. Chim. Acta 2017, 465, 123–130. [Google Scholar] [CrossRef]
- Mintoff, D.; Agius, R.; Benhadou, F.; Das, A.; Frew, J.W.; Pace, N.P. Obesity and Hidradenitis Suppurativa: Targeting meta-inflammation for therapeutic gain? Clin. Exp. Dermatol. 2023. [Google Scholar] [CrossRef]
Figure 1.
Effects on lipid metabolism in mice treated by various intake dose of IMP (n = 5). (A) Statistics of body weights measured at an interval of 1 month during IMP treatment. (B) Statistics of body fat rates measured at the end of IMP treatment. (C) Statistics of the liver contents of TG, NEFA, TC from each group mice. (D) Statistics of the serum contents of TG, TC, LDL, HDL and UA from each group mice. Data were expressed as mean ± SD; Compared with normal group, *P < 0.05, **P < 0.01, ***P < 0.001.
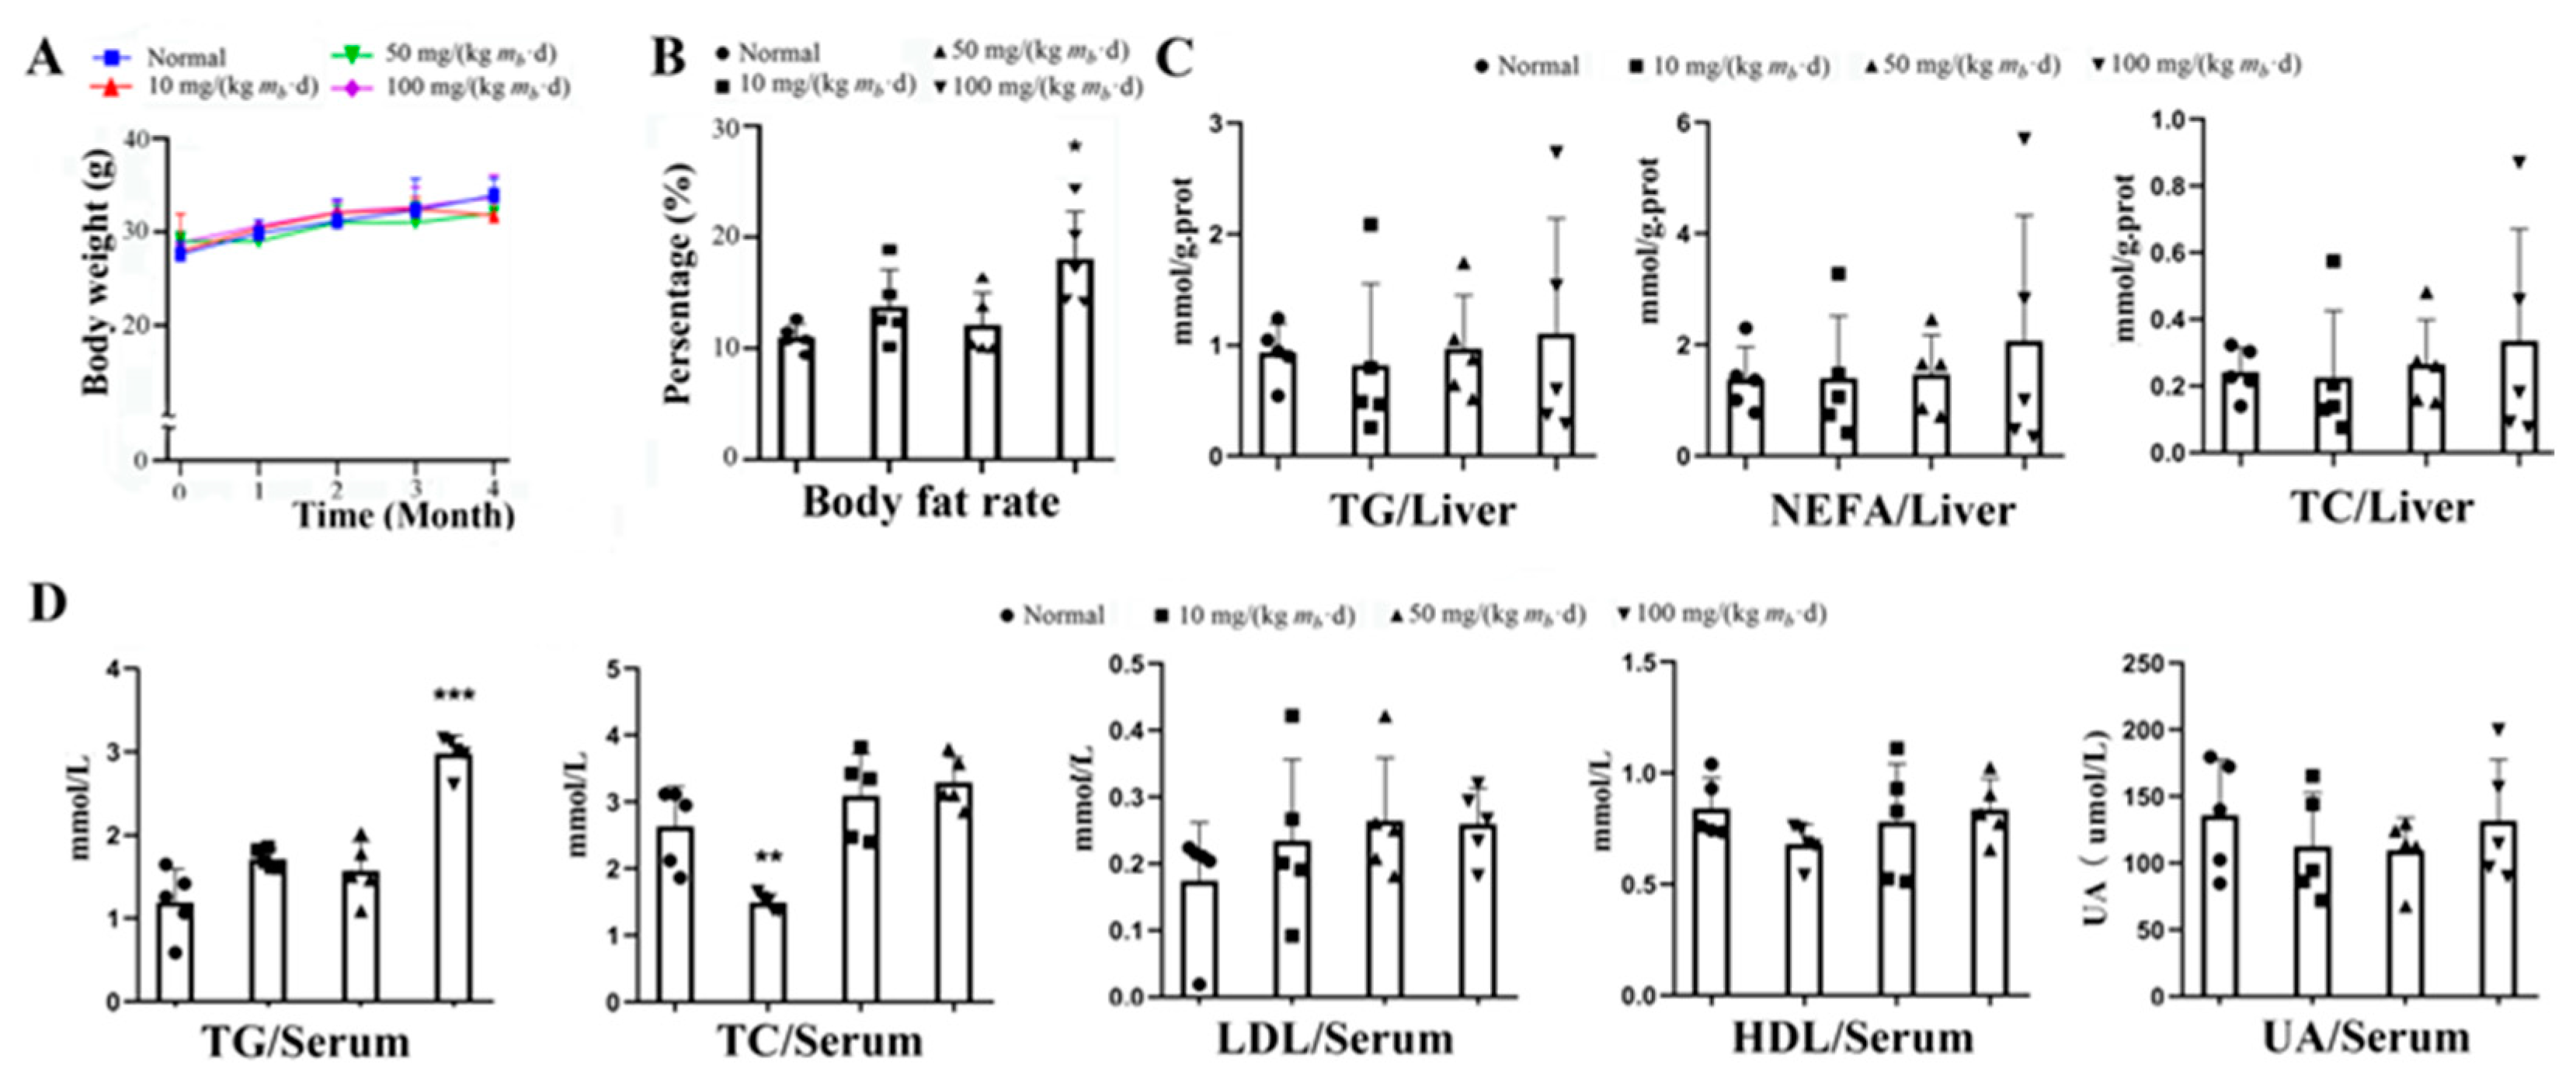
Figure 2.
Effects on inflammation in mice treated by various intake dose of IMP (n = 5). (A) Content changing trend of TNF-α IL-1β, IL-6, ALP, AST, LDL and ALT in the serum of mice induced by various oral intake dose of IMP. Statistics of the Data were expressed as mean ± SD; Compared with normal group, **P < 0.01, ***P < 0.001. (B) Histological morphology of liver tissue stained by oil red O. Each photo obtained from a mouse, which TG content is higher than other members in a same group.
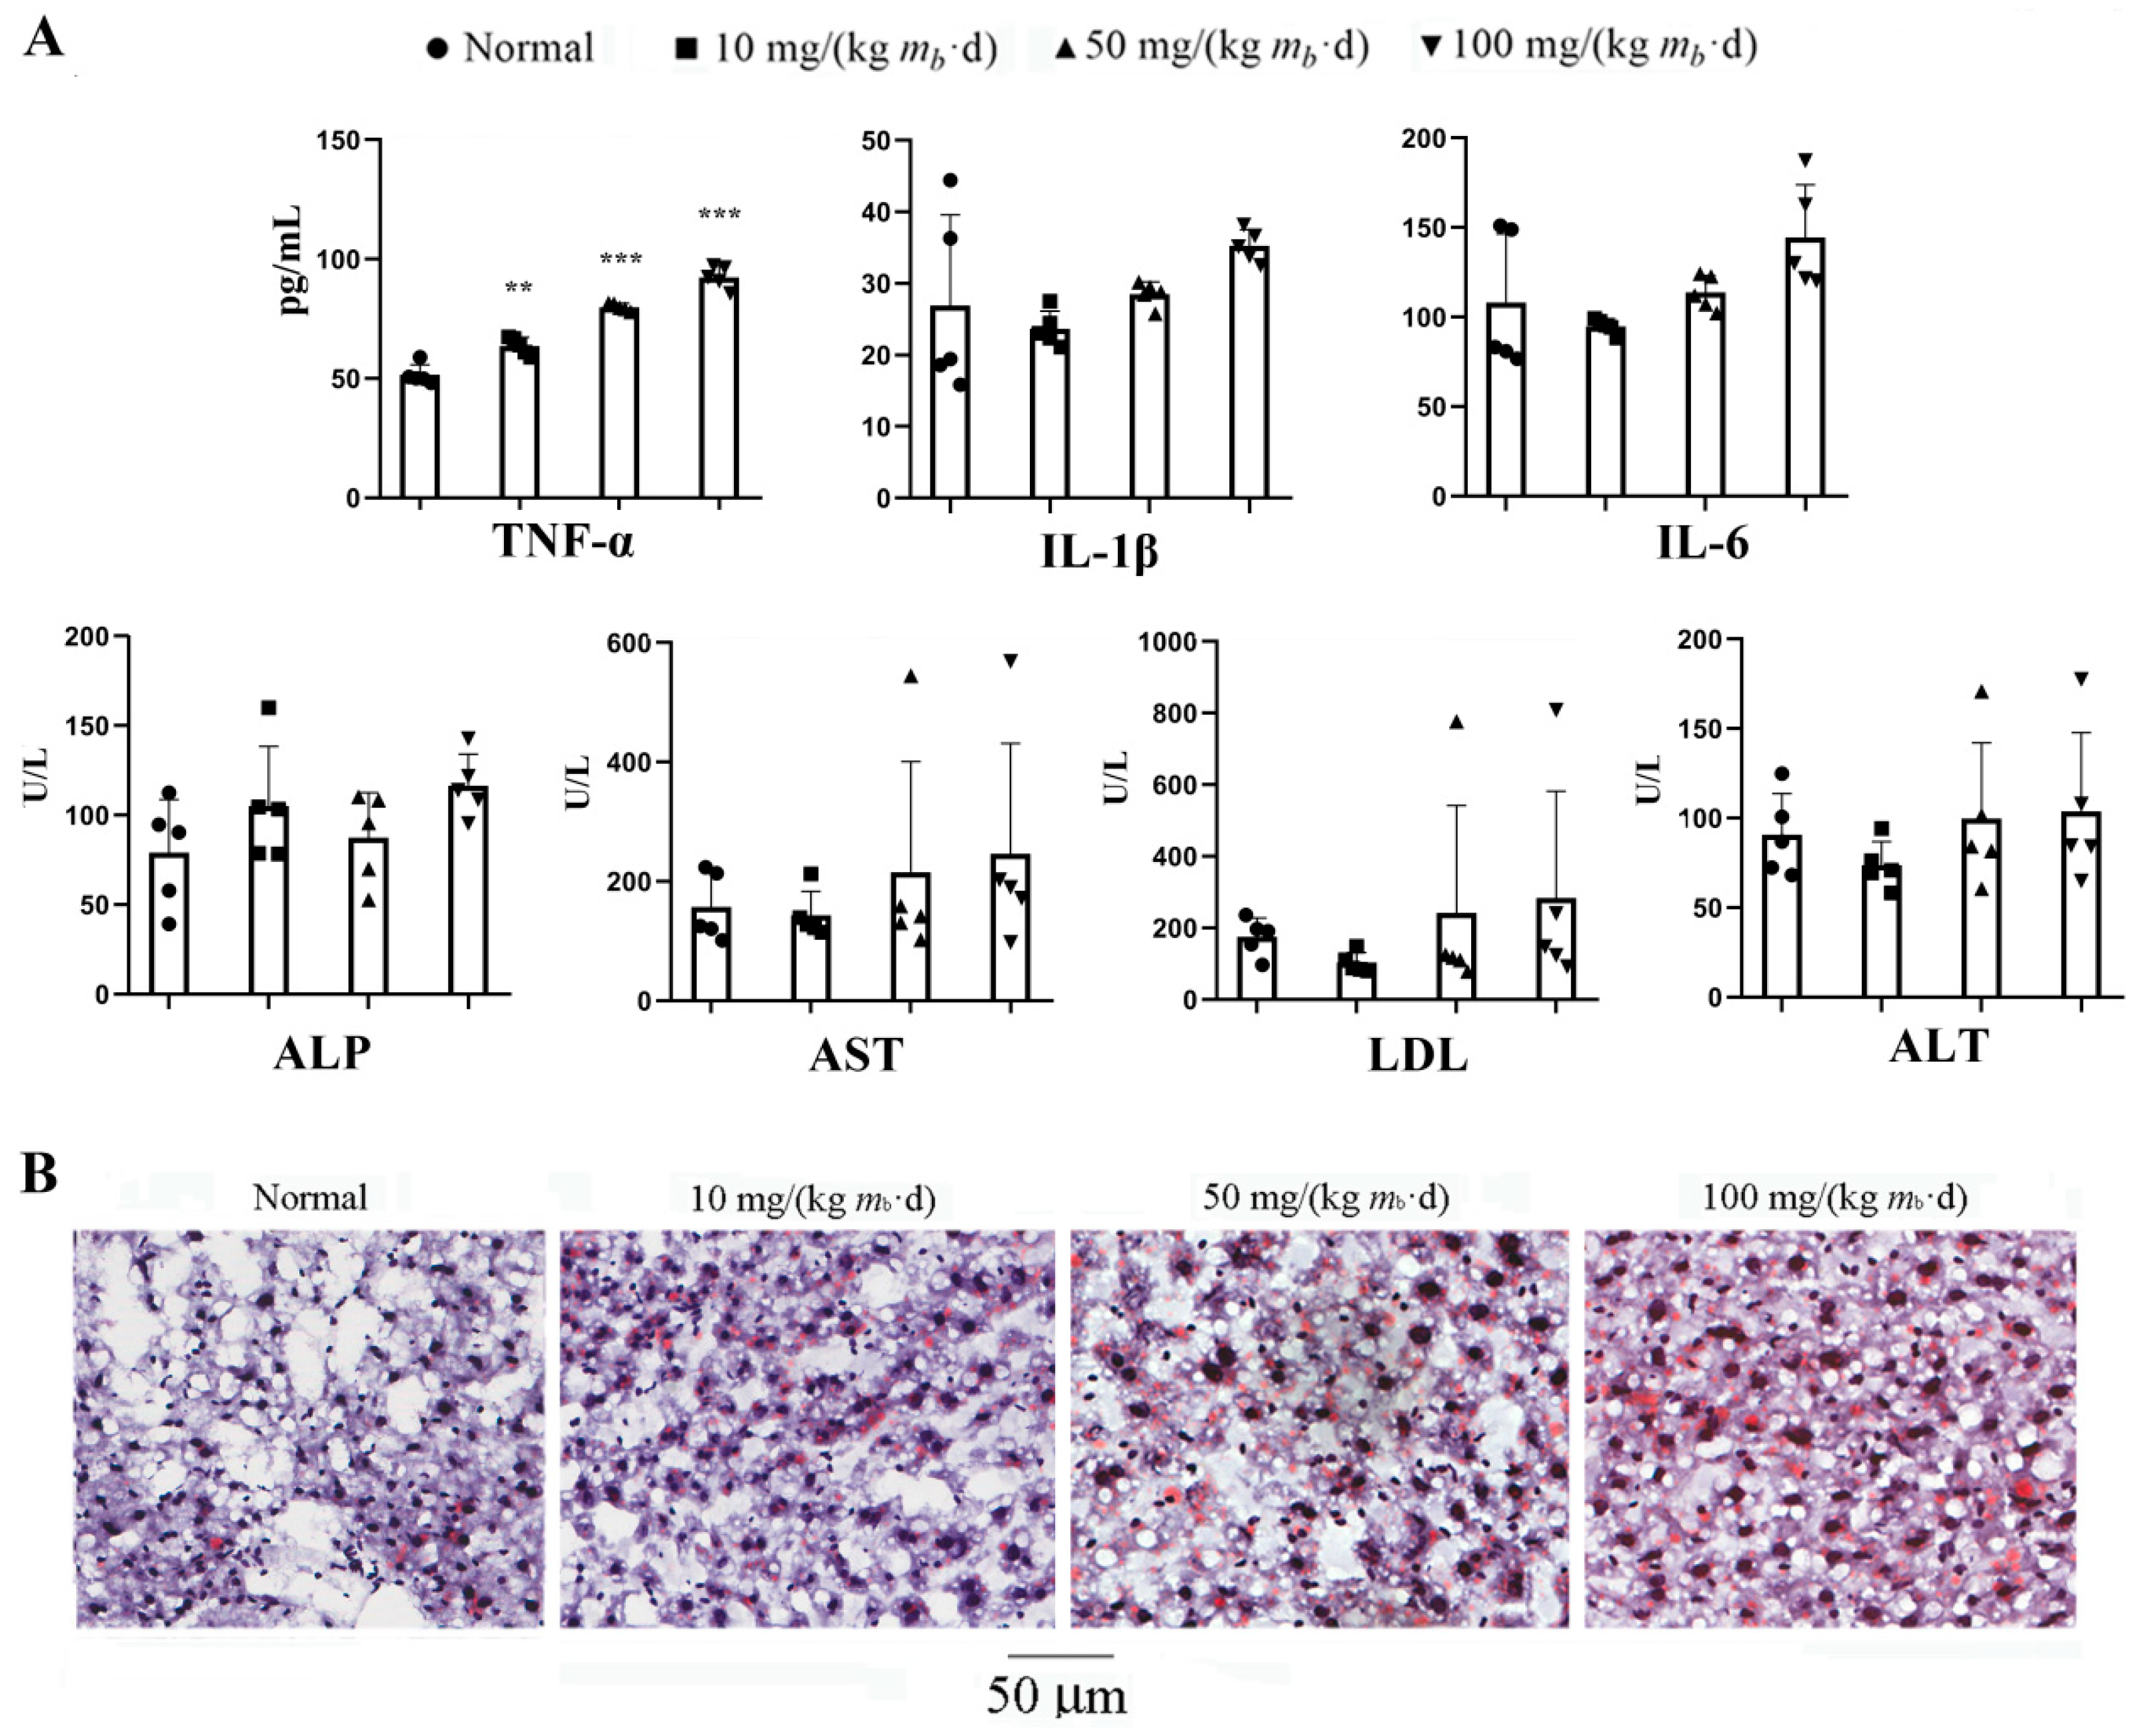
Figure 3.
IMP lowing lipid activity with and without AMPK inhibitor in vitro assay (n = 5). The intensity of green fluorescence represents the number of lipid droplets. Data were expressed as mean ± SD; Compared with normal control group, *P < 0.05, with model group, ## P < 0.01, ### P < 0.001.
Figure 3.
IMP lowing lipid activity with and without AMPK inhibitor in vitro assay (n = 5). The intensity of green fluorescence represents the number of lipid droplets. Data were expressed as mean ± SD; Compared with normal control group, *P < 0.05, with model group, ## P < 0.01, ### P < 0.001.
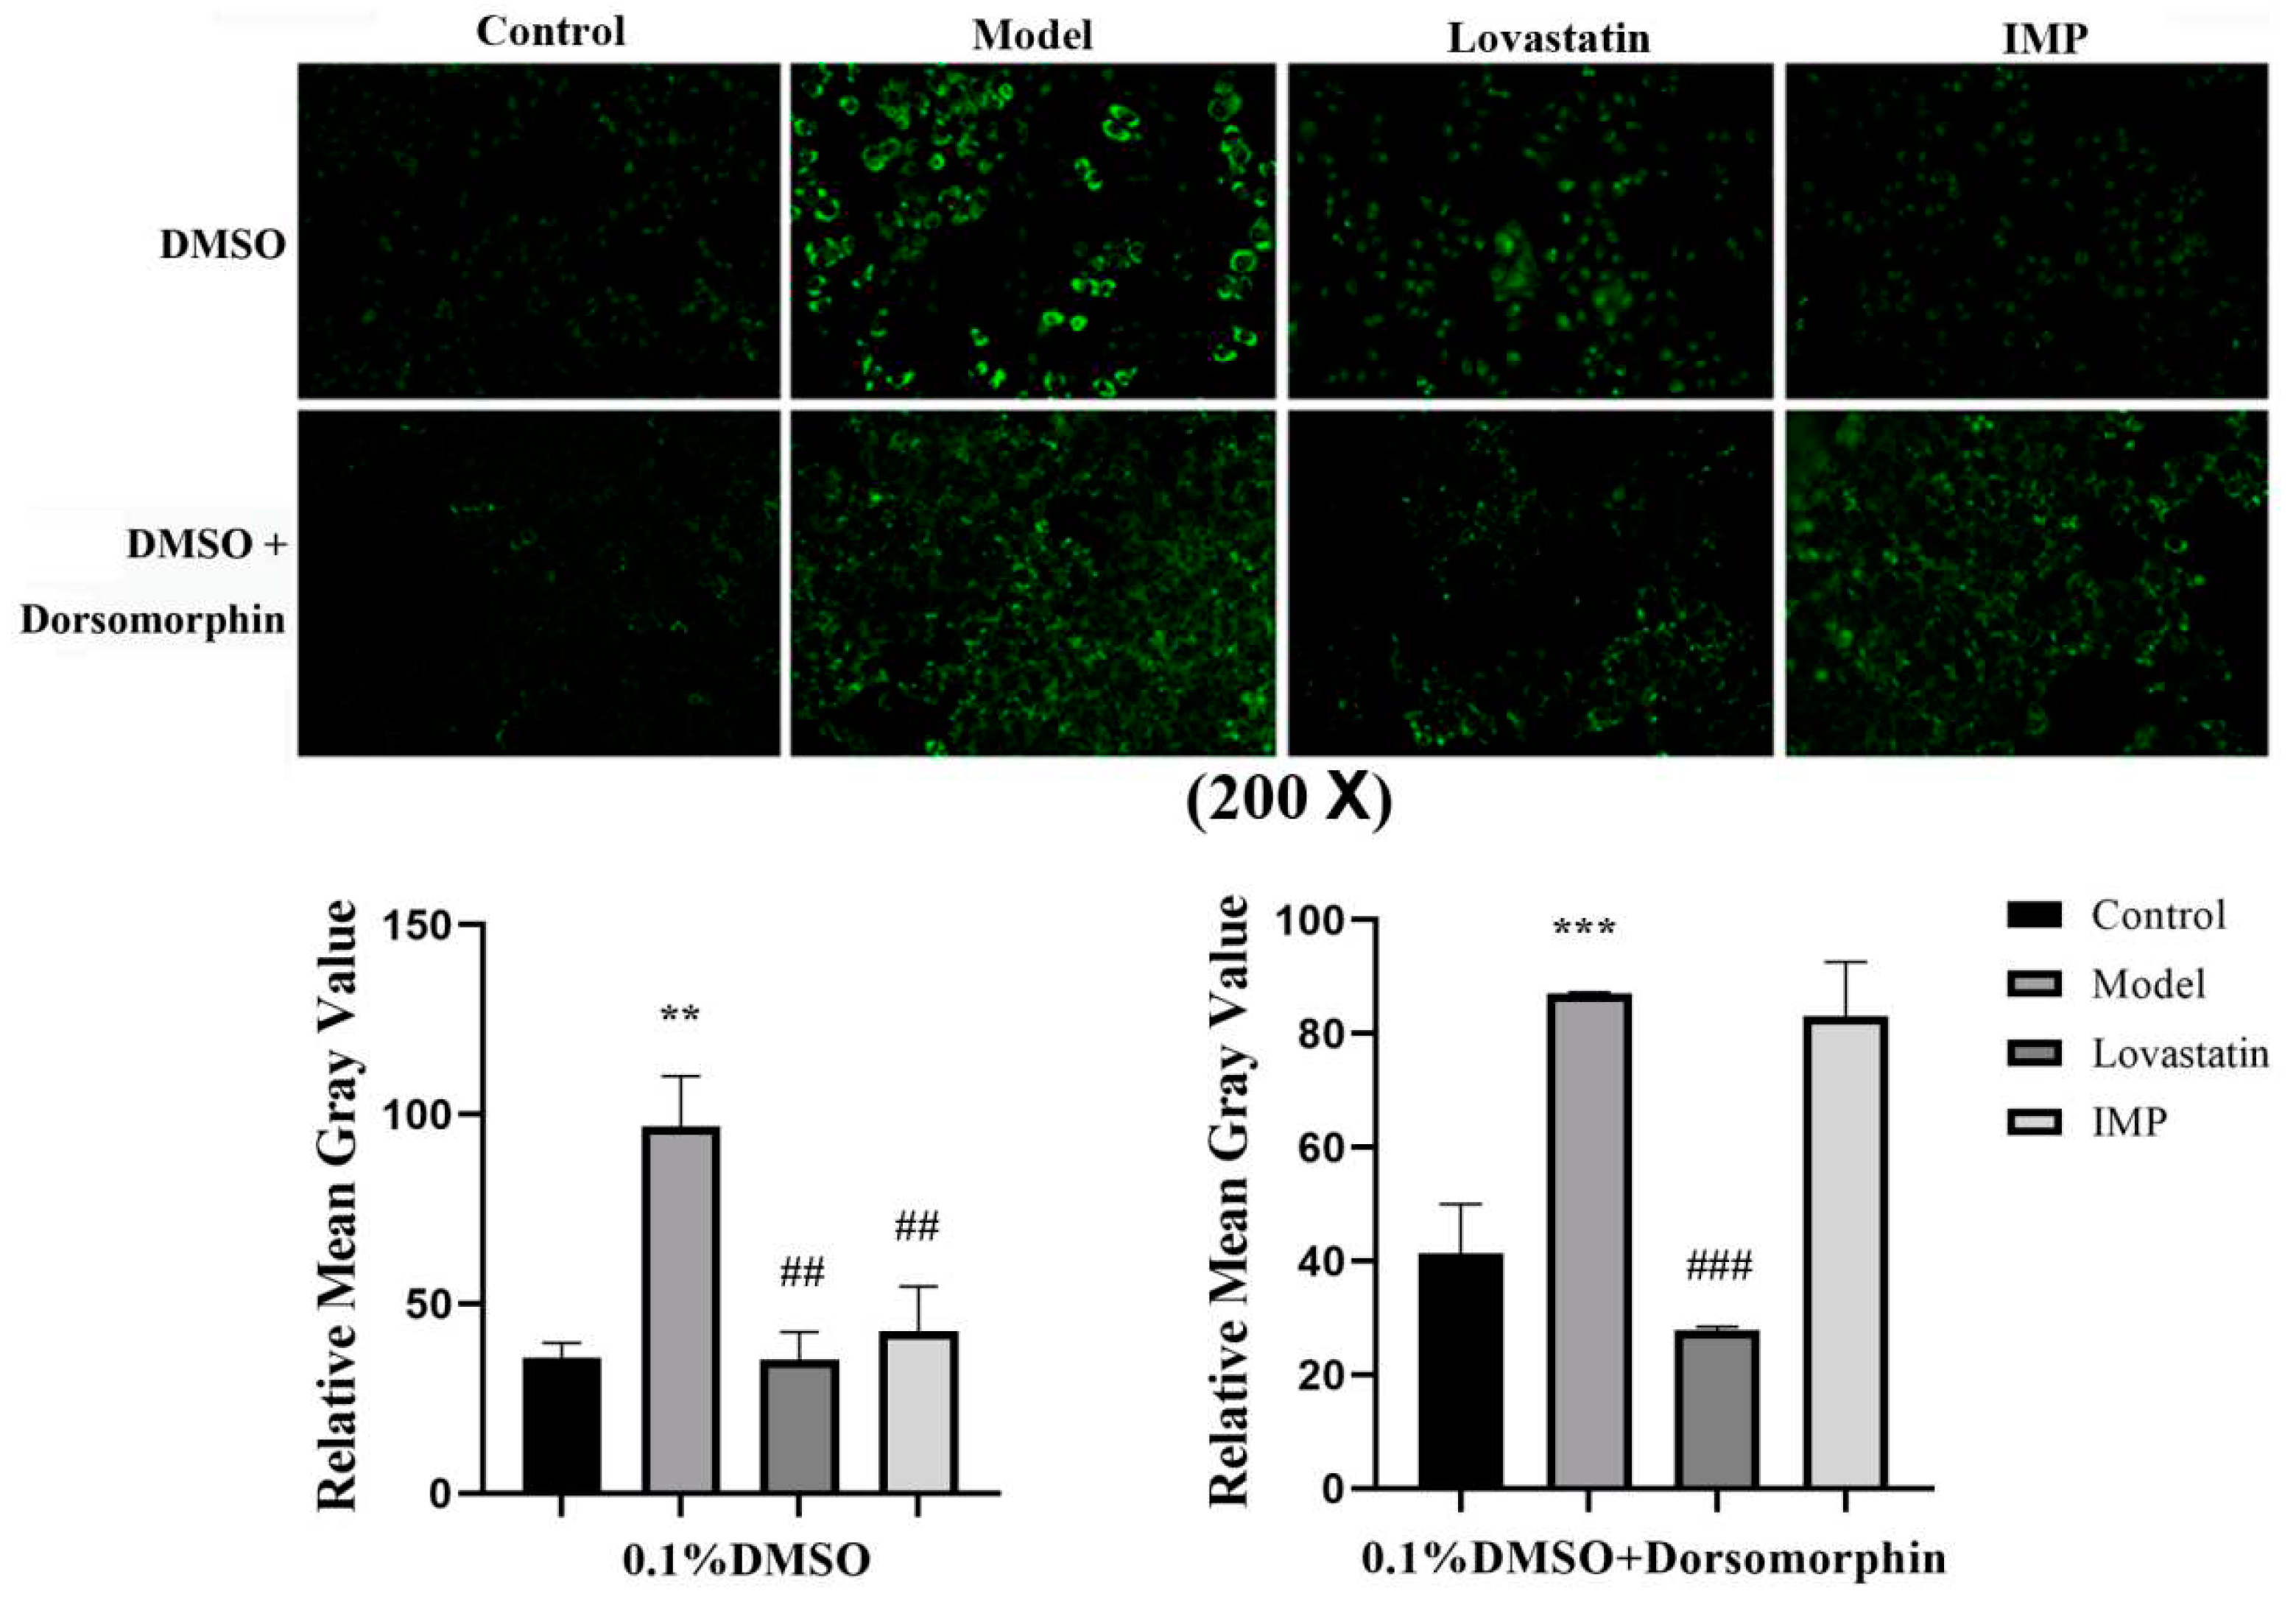
Figure 4.
Results of Western-blot assay (n = 3). Expression levels of AMPK, ACC1, ACC2, and ATGL as well as phosphorylation levels of AMPK and total ACC in liver of mice in each group were determined using Western Blot assay. Data were expressed as mean ± SD; Compared with normal control group, *P < 0.05; Compared with model group, ## P < 0.01, ### P < 0.001.
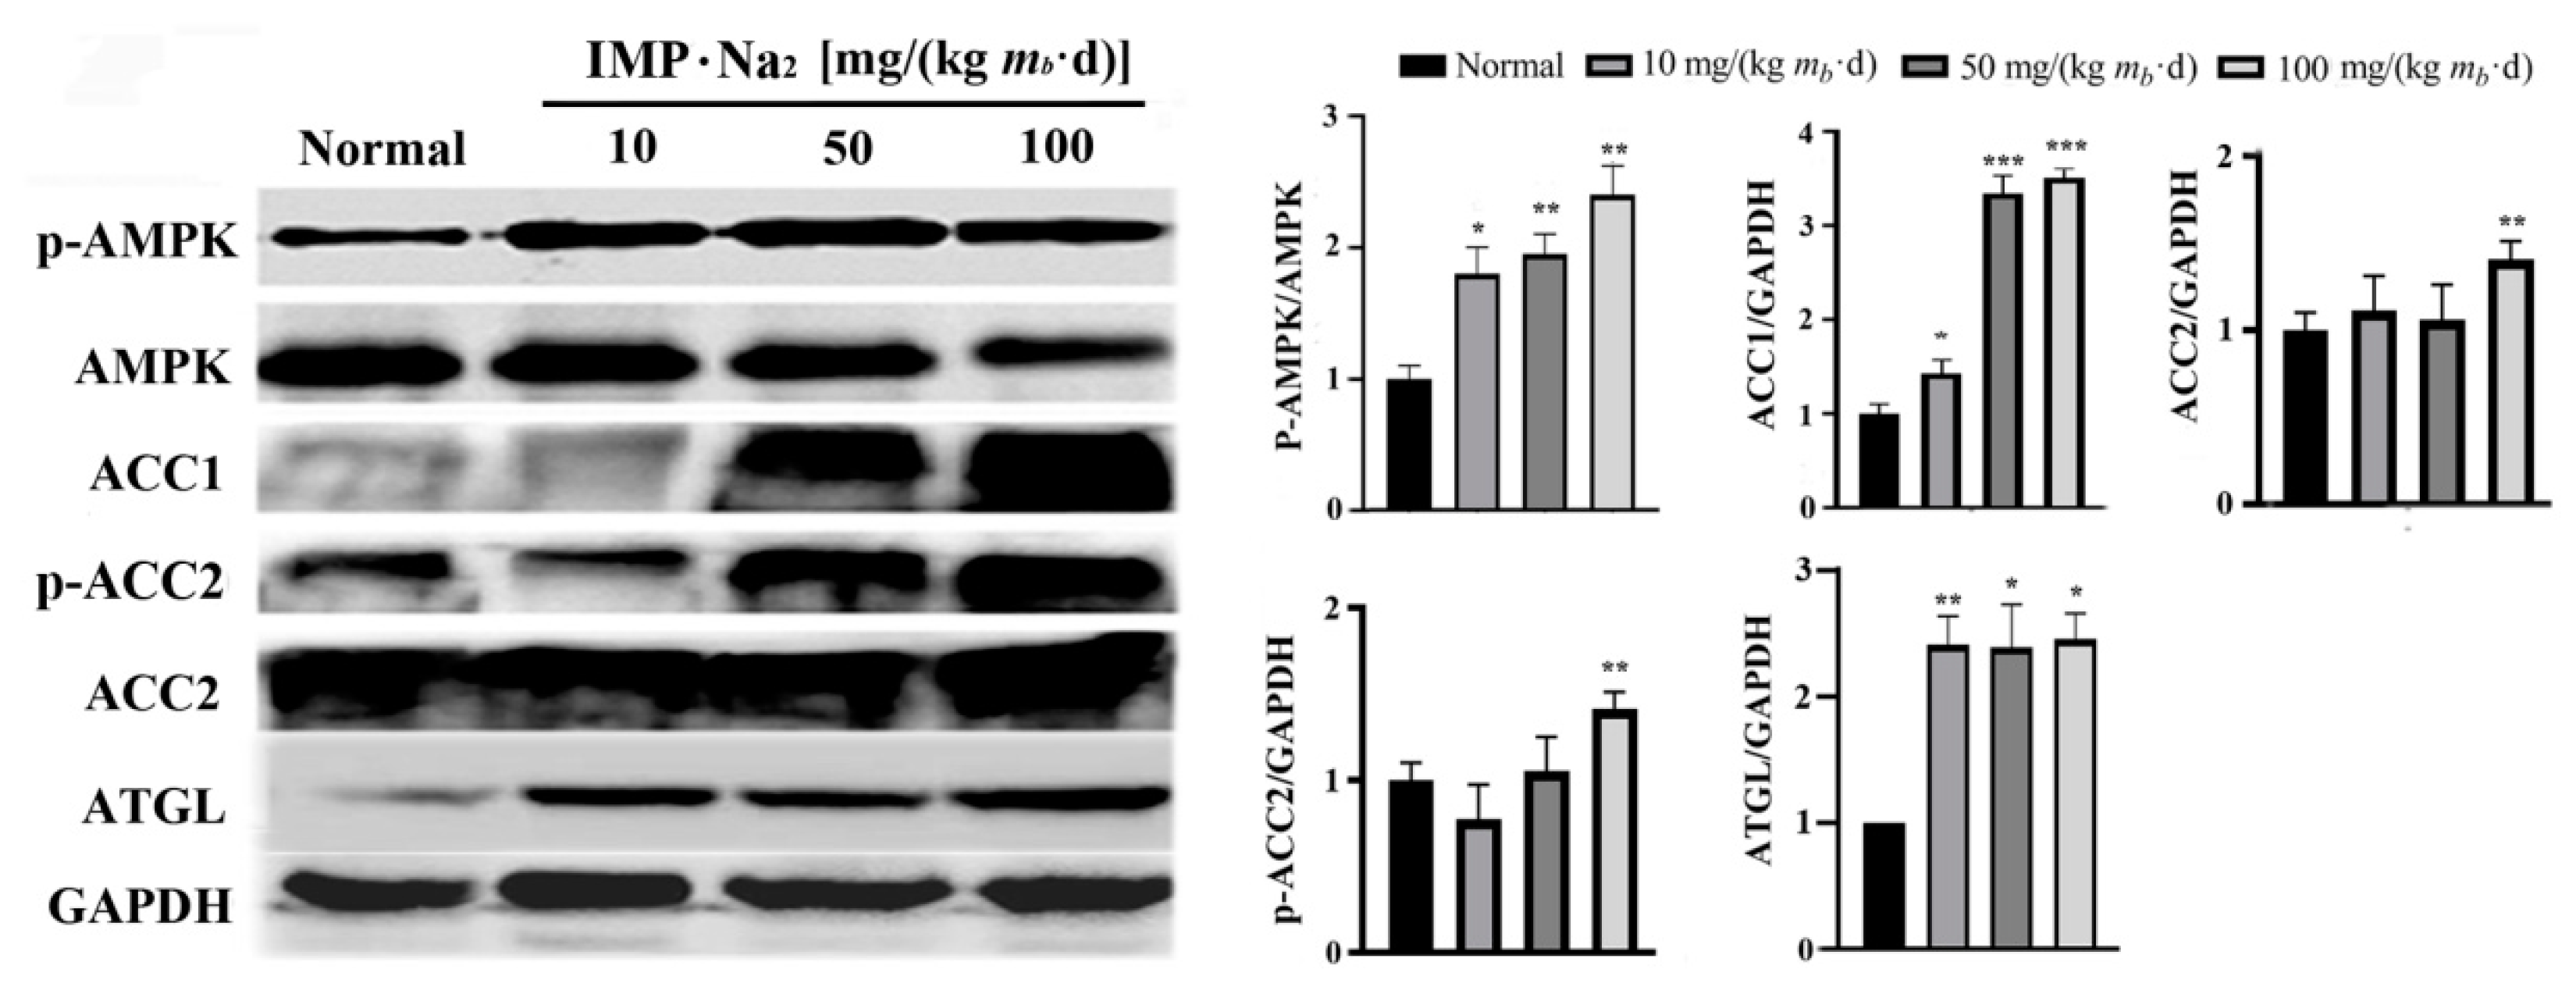
Figure 5.
Content changes of Actetyl-CoA in liver tissue and serum of mice induced by various oral intake dose of IMP (n = 5). Data were expressed as mean ± SD; Compared with normal control group, *P < 0.05, **P < 0.01, ***P < 0.001.
Figure 5.
Content changes of Actetyl-CoA in liver tissue and serum of mice induced by various oral intake dose of IMP (n = 5). Data were expressed as mean ± SD; Compared with normal control group, *P < 0.05, **P < 0.01, ***P < 0.001.
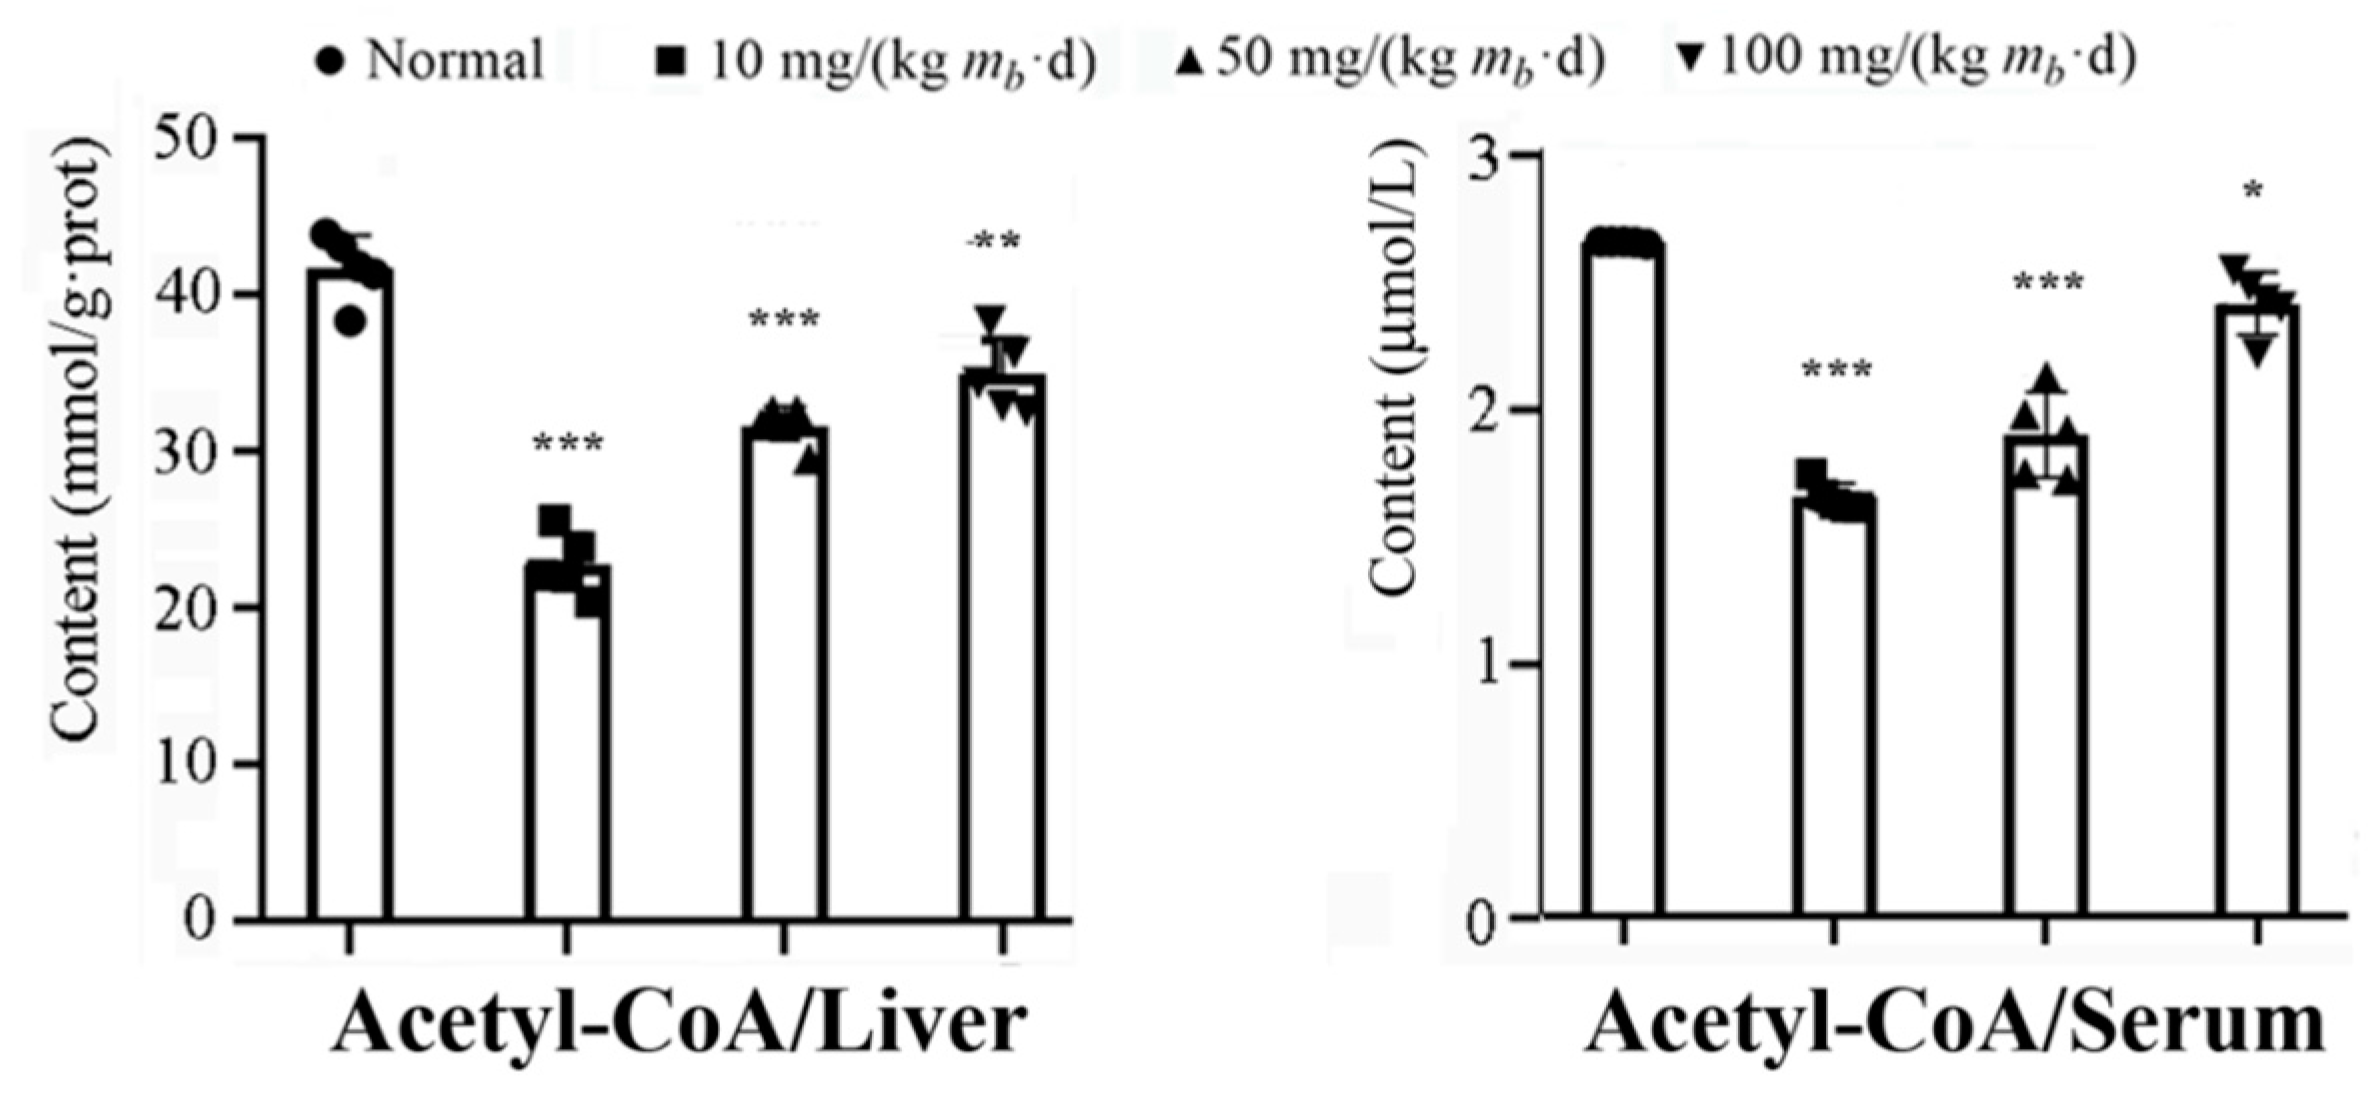
Figure 6.
Results of bioinformatics analysis. (A) Riched GO functions and (B) proteins associated with these GO functions, (C) Riched KEGG pathways and (D) Proteins associated with these pathways KEGG pathway. (E) Diagram of IMP induced inflammation pathway based on the up-regulated and down-regulated proteins in hepatocyte of mice (n = 3). IMP induced down-regulated proteins locating in the in complement system were shown in blue colour.

Figure 7.
Diagram of Pathway of IMP induced hyperlipidemia in normal mice.
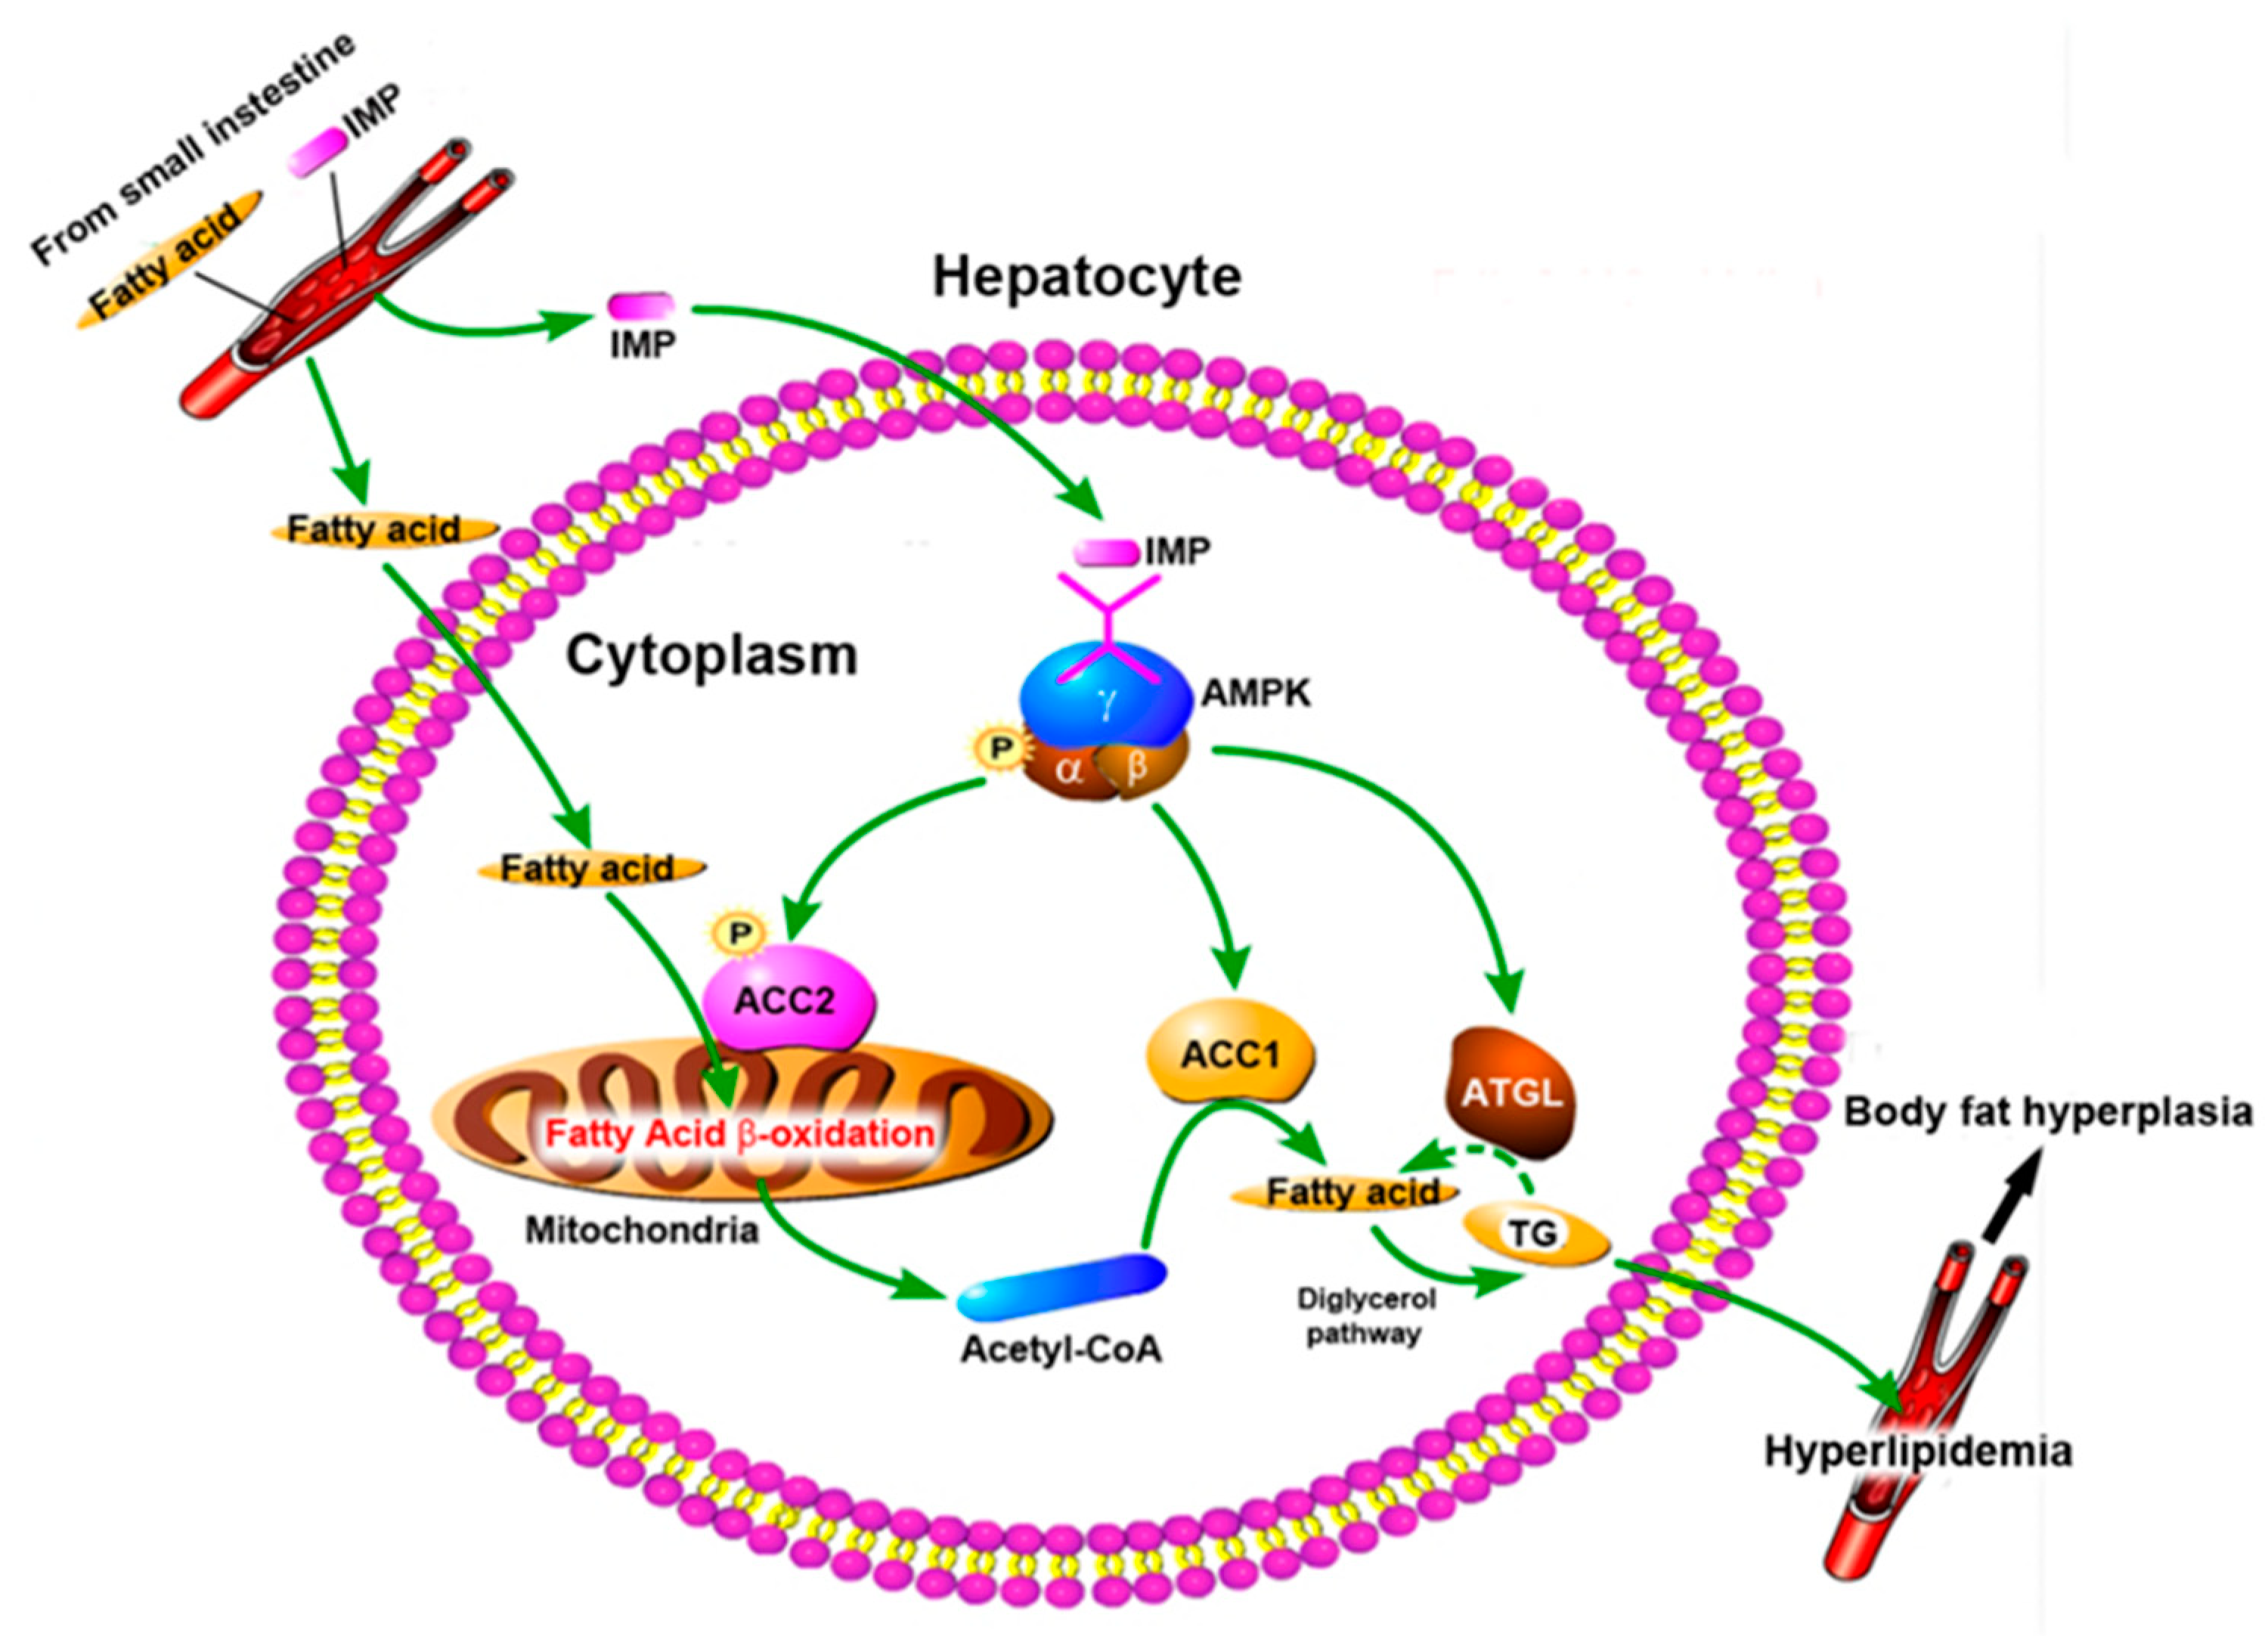

Table 1.
List of IMP induced up-expressed proteins in the normal mice hepatocytes.
| Accession No. | Symbol | Description | Ratio | P-Value (n = 3) |
| Q9EQ21 | HEPC | Hepcidin | 1.20 | 0.0257 |
| P52840 | ST1A1 | Sulfotransferase 1A1 | 1.26 | 0.0331 |
| Q9QXM0 | ABHD2 | Mono-acylglycerol lipase ABHD2 | 1.30 | 0.0353 |
| Q8BHI7 | ELOV5 | Elongation of very long chain fatty acids protein 5 | 1.24 | 0.0436 |
Table 2.
List of IMP induced down-expressed proteins in the normal mice hepatocytes.
| Accession No. | Symbol | Description | Ratio | P-Value (n = 3) |
| Q8K182 | C8A | Complement component C8 α chain | 0.79 | 0.0024 |
| A6X935 | ITIH4 | Inter α-trypsin inhibitor, heavy chain 4 | 0.78 | 0.0049 |
| P06684 | C5 | Complement C5 | 0.81 | 0.0069 |
| P06909 | CFAH | Complement factor H | 0.82 | 0.0081 |
| P06683 | C9 | Complement component C9 | 0.78 | 0.0091 |
| Q61646 | HPT | Haptoglobin | 0.60 | 0.0114 |
| Q9ET22 | DPP2 | Dipeptidyl peptidase 2 | 0.81 | 0.0129 |
| Q8K558 | TRML1 | Trem-like transcript 1 protein | 0.81 | 0.0143 |
| Q8VCG4 | C8G | Complement component C8 γ chain | 0.81 | 0.0170 |
| Q9D1M7 | FKB11 | Peptidyl-prolyl cis-trans isomerase FKBP11 | 0.78 | 0.0230 |
| P58044 | IDI1 | Isopentenyl-diphosphate Delta-isomerase 1 | 0.81 | 0.0264 |
| P01029 | C4B | Complement C4-B | 0.81 | 0.0320 |
| P53798 | FDFT | Squalene synthase | 0.72 | 0.0320 |
| Q61704 | ITIH3 | Inter-α-trypsin inhibitor heavy chain H3 | 0.81 | 0.0341 |
| O35988 | SDC4 | Syndecan-4 | 0.77 | 0.0346 |
| Q91X72 | HEMO | Hemopexin | 0.70 | 0.0356 |
| P33146 | CAD15 | Cadherin-15 | 0.78 | 0.0372 |
| Q8R2E9 | ERO1B | ERO1-like protein β | 0.79 | 0.0391 |
| Q9D964 | GATM | Glycine amidinotransferase, mitochondrial | 0.81 | 0.0408 |
| Q6P5D3 | DHX57 | Putative ATP-dependent RNA helicase DHX57 | 0.79 | 0.0434 |
| P01642 | KV5A9 | Ig κ chain V-V region L7 (Fragment) | 0.78 | 0.0440 |
| Q9R112 | SQOR | Sulfide:quinone oxidoreductase, mitochondrial | 0.80 | 0.0465 |
| P63168 | DYL1 | Dynein light chain 1, cytoplasmic | 0.82 | 0.0485 |
Disclaimer/Publisher’s Note: The statements, opinions and data contained in all publications are solely those of the individual author(s) and contributor(s) and not of MDPI and/or the editor(s). MDPI and/or the editor(s) disclaim responsibility for any injury to people or property resulting from any ideas, methods, instructions or products referred to in the content. |
© 2023 by the authors. Licensee MDPI, Basel, Switzerland. This article is an open access article distributed under the terms and conditions of the Creative Commons Attribution (CC BY) license (https://creativecommons.org/licenses/by/4.0/).
Copyright: This open access article is published under a Creative Commons CC BY 4.0 license, which permit the free download, distribution, and reuse, provided that the author and preprint are cited in any reuse.


