
Submitted:
21 August 2023
Posted:
23 August 2023
You are already at the latest version
Abstract
Polyhedral Oligomeric Silsesquioxanes (POSS) are one of the smallest silica nano particles. The presence of ordered ladder-like or cage conformation in their structure leads to remarkable thermal stability far greater than that for a linear polysiloxane. Reinforcement with nano particles is one of the recently favored strategy used to enhance the performance of polymers materials. The cyclic silica structure present in POSS ensures excellent thermal and mechanical stability. As a reinforcing filler, POSS can enhance the resistance of polymer matrix against pyrolysis and corrosion. In this paper, amine-terminated POSS with ladder like structure was synthesized by condensation of hydrolyzed aminosilane coupling agent. The ladder-like structure of POSS severely limits the motion of the chain backbone. The absence of phase transition for the synthesized POSS was confirmed by differential scanning calorimetry (DSC). Thermogravimetric analysis (TGA) was utilized to evaluate the thermal stability of POSS. TGA data show that the ladder-like POSS reported here has high char yield of about 75 % in nitrogen atmosphere and 54% in air atmosphere at 800℃. The TGA derivative curves show that the degradation of ladder-like POSS involves multiple stages and that the degradation rate is directly proportional to the heating rate. With the aid of Fourier Transform Infrared Spectroscopy (FT-IR), the cyclic structure of Si-O-Si bonding was determined to be the predominant structure. By analyzing the FTIR spectra of the cured POSS residue obtained at the specified temperatures, the detailed degradation mechanism of POSS was inferred. From the FTIR spectra of the low temperature cured samples, it was shown that the terminal silanol group was eliminated below 400℃. Some intermediate polymeric siloxane structures were observed by means of FT-IR and they eventually transitioned into silica which is the final product of pyrolysis of POSS.
The presence of the FTIR transmission peaks at 1000 and 1100 cm-1, due to asymmetrical vertical and horizontal stretching of Si-O-Si, were the key evidence for the inferred ladder-like structure of POSS.
Keywords:
Amine terminated Polyhedral Oligomeric Silsesquioxanes
; Silica nanoparticles
; Degradation rate
; Degradation mechanism
; Activation energy
1. Introduction
Polymeric materials play a crucial role in multiple aspects of modern industry. However, the presence of flammable carbon-based backbone is always considered to be an inevitable shortcoming of polymer products, especially for the applications in the aerospace and electronics industries. One frequently applied solution is introducing thermally stable additives.
Silicone-based materials are well-known for their thermal stability. They are regarded as a promising class of flame-retardant materials for carbon-based polymeric materials [1,2,3,4,5,6]. The favorable heat resistance of silicone-based materials originates at the atomistic level from the superior silicon-oxygen, Si-O bond strength when compared to the carbon-carbon, C-C bond. The dissociation energy of Si-O bond is 108 kcal/mol, while that for the C-C and carbon-oxygen, C-O bond are 85.2 and 82.6 kcal/mol, respectively[7]. The formation of silica (SiO2) which is the major product of thermal degradation of silicone involves massive consumption of oxygen. This process is also known as oxygen sink, which enables protection of the polymer matrix by suppressing the breakage of the carbon backbones[8]. A similar mechanism is also observed in other silicon based covalent bonding, for instance, Si-Si or Si-N bonding. These types of silicon bonding can even consume more oxygen during thermal degradation process.
The variability of the structures of silicone is partially responsible for their thermal behavior. For instance, presence of silanol terminated structure might result in a unique unzipping mechanism for polysiloxanes[9]. Generally, an inter or intra molecular structure redistribution, commonly occur between siloxane backbones, resulting in the formation of cyclic oligomers and silica. This mechanism is also known as random scission reaction. High temperature treatment of POSS produces thermally stable residues and silica. The fraction of residues formed is dependent on the heating conditions[7,10]. The possible pathways of thermal oxidation of silicone-based materials are shown in Figure 1.
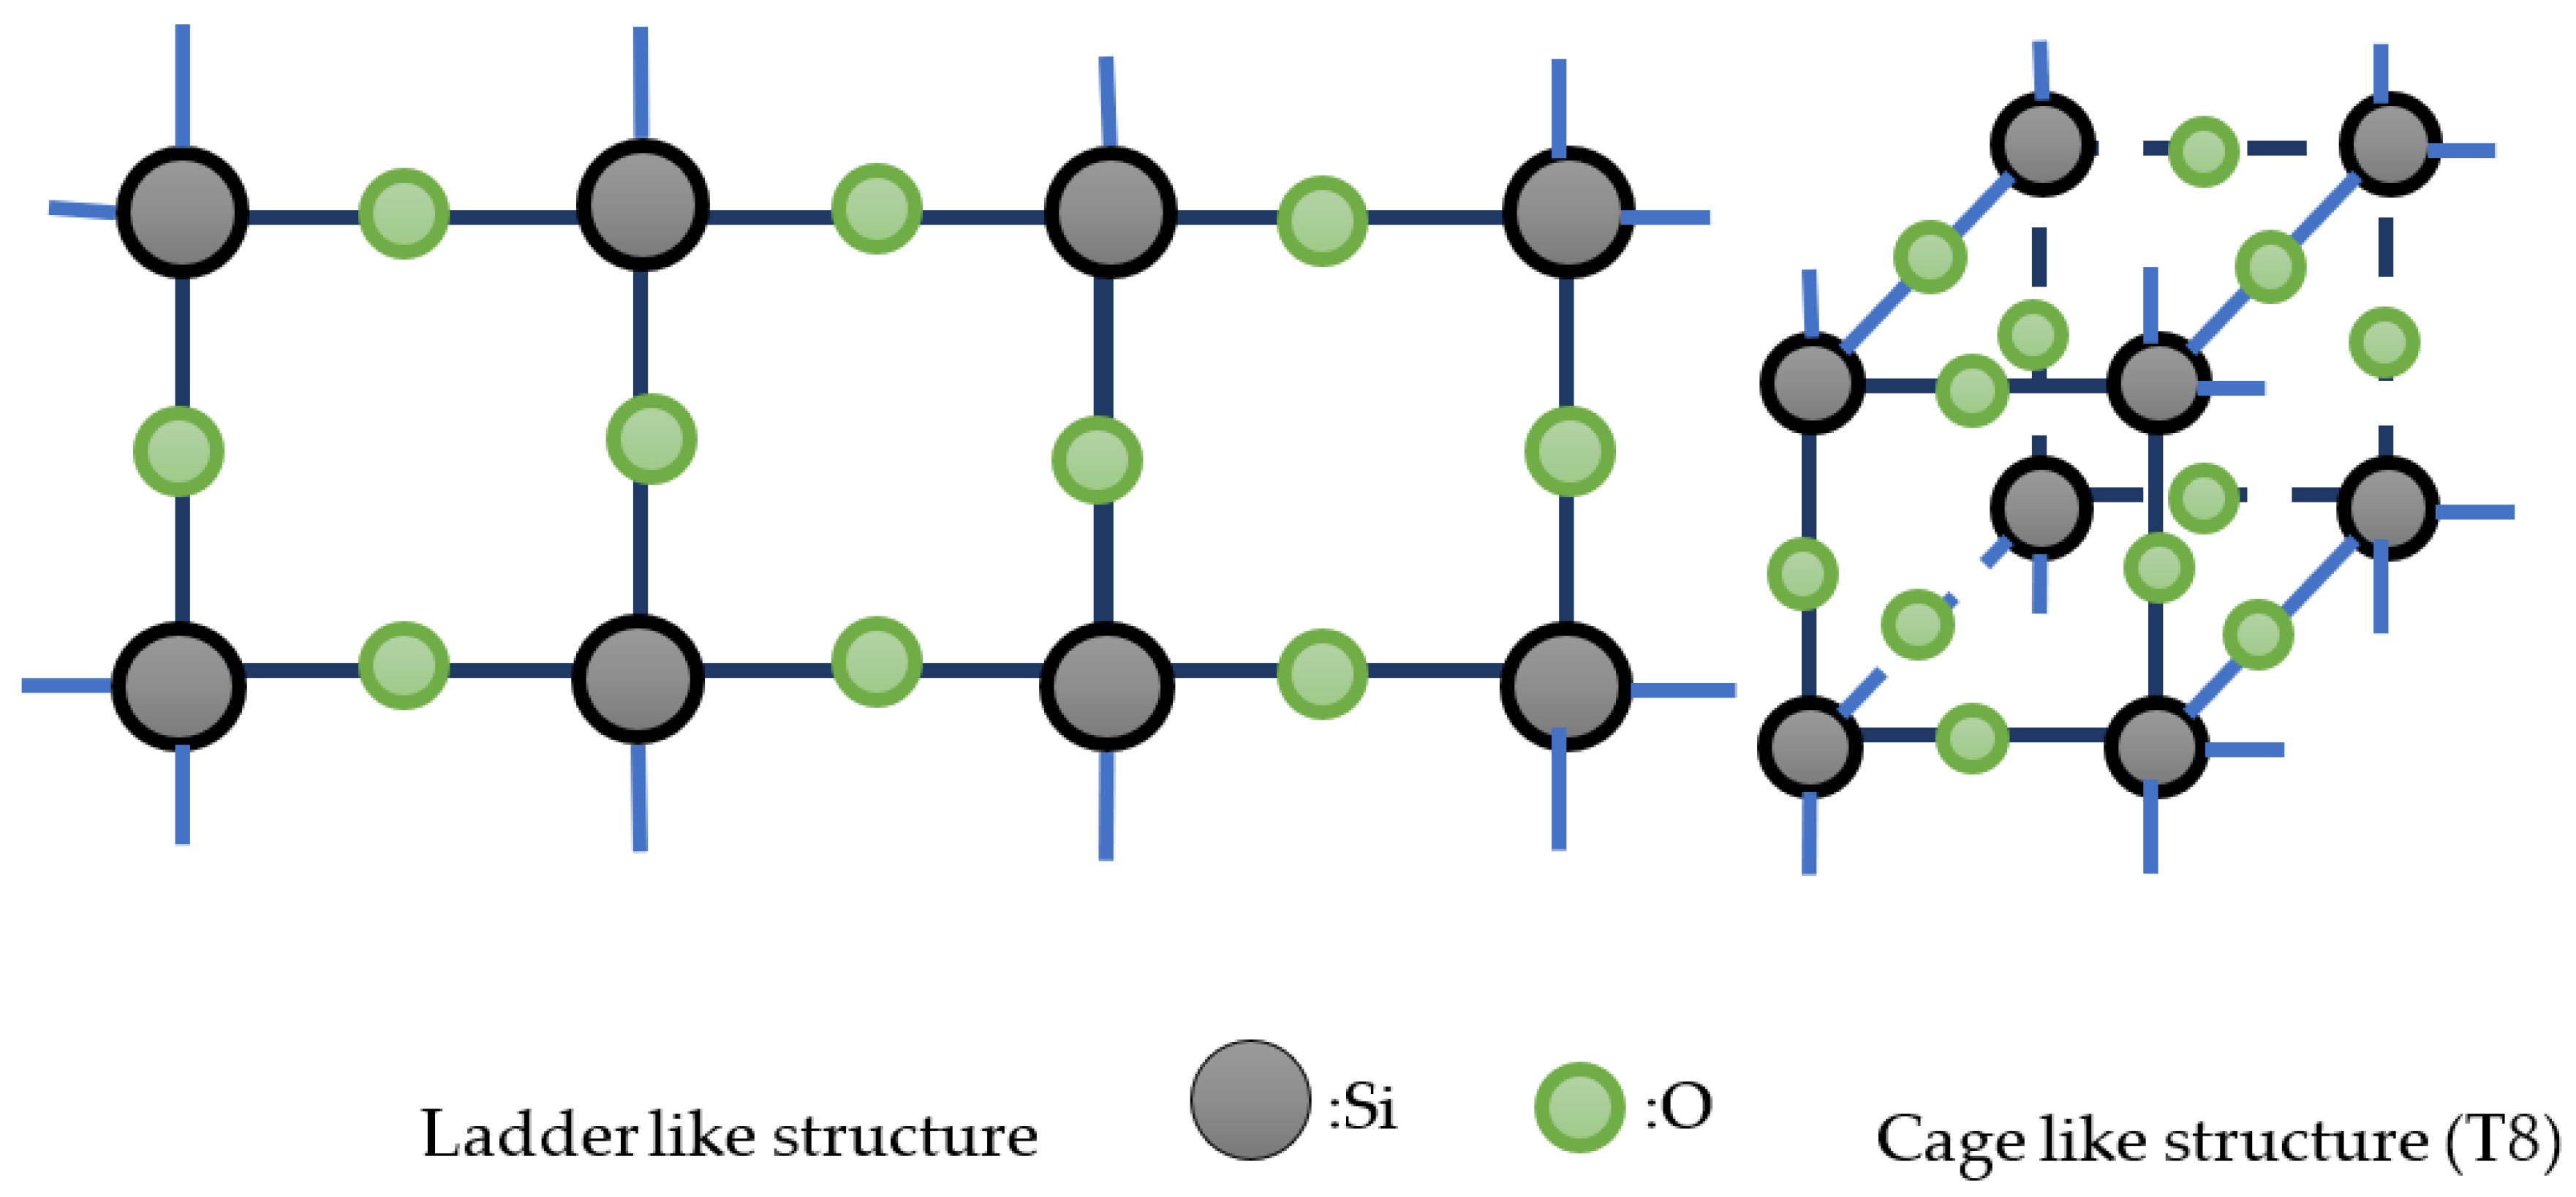
Development of nanoparticles is frequently reported in materials engineering research. Organic-inorganic composites are believed to be the keystone of designing a novel high-performance materials system. Combination of high rigidity inorganic compounds and flexible polymer matrix results in synergistic enhancement in thermal stability [11,12,13,14,15]. Polyhedral Oligomeric Silsesquioxanes (POSS) with the empirical formula of RSiO1.5 (where R can be a hydrogen atom, alkyl, alkylene, or acrylate) was first reported by Scott in 1946[16]. It is regarded as one of the smallest silica nanoparticles with diameters of 1-3 nm[17,18]. Structures of silsesquioxanes can be found in two major shapes, ladder-like and cube-like, as shown in Figure 2. Compared to traditional silicone-based materials, POSS has better thermal stability while maintaining good mechanical properties when incorporated with organic polymer[19,20,21,22,23,24,25,26,27,28,29,30,31,32], there-by debunking the concern that incorporation of polysiloxane blocks into carbon-based backbones might severely impact the flexibility of polymers[33]. POSS based copolymers overcome this draw-back and effectively enhance mechanical and thermal properties of the polymer matrix.
In this paper, amino terminated ladder-like POSS (ATL-POSS) was synthesized from a commercially available silane, 3-aminopropyltrimethoxysilane (APTMS). The APTMS was initially hydrolyzed by acid. Then the hydrolyzed silanol was heated in organic base to form the ladder-like POSS via condensation reaction. Thermogravimetric analysis (TGA) and differential scanning calorimetry (DSC) were used to monitor the thermal behavior of the synthesized POSS. The activation energy for decomposition of POSS was calculated by using the Kissinger-Akahira-Sunose equation (KAS) (Equation 1). For this purpose, the TGA tests was performed at different heating rate. Fourier Transform Infrared Spectroscopy (FT-IR) was used to determine the chemical structure of synthesized product and the residues resulting from thermal degradation. The detailed degradation mechanism of amino terminated ladder like POSS was obtained by combining the results of the analysis of the derivative TGA thermograms with the analysis of the FT-IR spectra of residues.
(R represents the functional group such as hydroxyl and amine) . .
Where α is the degree of conversion, β is the heating rate, g(α) is the integral conversion function, A is the pre-exponential factor, R is the gas constant and Ea is the activation energy.
2. Materials and Methods
Materials3-aminopropyltrimethoxysilane (APTMS) was purchased from the Gelest, toluene and triethyl amine (TEA) were purchased from Sigma-Aldrich. These chemicals were used as received. The hydrochloric acid was purchased from the Fisher Scientific and diluted with deionized water. The concentration of HCl/H2O was maintained at 0.1M.
Synthesis APTMS (0.02 mol) was dissolved in 20 ml toluene at room temperature. 25 ml HCl/H2O solution (0.1M) was added in a drop-wise manner into APTMS solution under stirring. The hydrolysis of APTMS was carried out for 24h at 100℃ in an oil-bath. Then, 0.1g TEA was added to the reactor after 24h of hydrolysis. Temperature of oil bath was raised to 120℃ and a water-cooling condenser was used for refluxing. The reaction was carried out for another 72h. The reaction scheme is shown in Scheme 1. The reaction mixture naturally forms a two-phase system. The organic layer is crystal clear and aqueous phase is cloudy. The liquid product was washed in toluene three times to remove the remaining silane. The aqueous layer was separated by means of a separatory funnel and collected in a round bottomed flask. The resulting liquid samples were dried at 120℃ for overnight (14h) under vacuum. The final product is clear transparent solid.
Characterization: DSC (TA Q20) was used to observe the phase transition of athe synthesized POSS. Using the TA Q20 model, three ramping sequences were conducted. The sample temperature was raised up to 100℃, 300℃ and 700℃ in three cycles with a ramping rate of 10℃/min and cooled back to 80℃ with the same rate. The TGA (TA Q50) is the major characterization tool for monitoring the degradation behavior of ladder-like POSS. During TGA run, the samples were heated from room temperature (~25℃) to 800℃ at 5, 10, 15, 20, 25, 30, 40 and 50℃/min, respectively. TGA study was performed in an inert nitrogen atmosphere as well as in an oxidizing air atmosphere. A FT-IR (Nicolet 6700) with ATR model was utilized here to investigate the functional group and chemical structure of the freshly prepared POSS as well as the heat-treated residues. The samples were heated up to the target temperature of 100, 150, 200, 250, 300, 350, 400, 450, 500 and 600℃, respectively, at a heating rate of 30℃/min and the final testing temperature was maintained for additional 30 minutes.
3. Results and Discussion
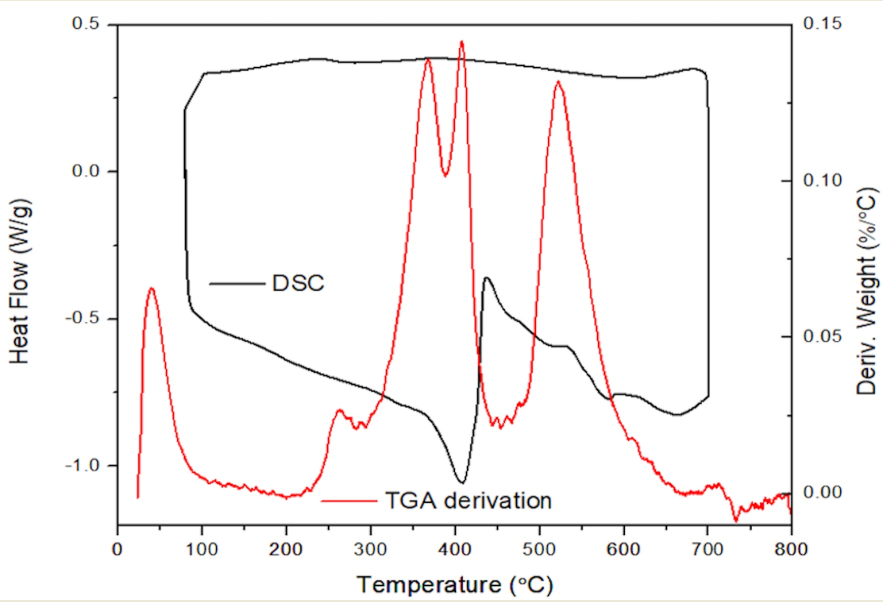
General thermal behavior studyA comparison of the TGA traces of ATL-POSS obtained in nitrogen and air atmospheres is shown in Figure 3. Both curves indicate excellent thermal stability for the samples at a heating rate of 10˚C/min. The char yield of ATL-POSS is about 74.37% in nitrogen and 53.99% in air atmosphere. In comparison, a linear amino terminated PDMS shows char retention of about 4.3 and 10.48 % in nitrogen and air atmosphere, respectively[34]. The significant advantage in char yield of ATL-POSS over the linear polysiloxane counterpart, symbolizes the superior thermal stability of ladder-like conformation. The weight loss in early stage (peak I) of heating (T<150℃) is believed to be mainly attributed to condensation of unreacted silanol and solvent residue. This assertion is supported by the presence of δ(Si-OH) in IR spectrum of low-temperature treated samples. In Figure 4, the derivative TGA weight loss curves of ATL-POSS are shown. There are three major derivative peaks labelled as Peak II, III, and IV and located in the range of 300℃ to 600℃. In air atmosphere, the derivative peaks II and III are slightly shifted to higher temperatures, while peak IV is very intense and shifted to lower temperature. As shown in Figure 4, there is a noticeable increase in the peak heights for the samples tested in oxygen atmosphere. Under inert nitrogen condition, cyclic siloxanes are formed by intramolecular reaction resulting in structure redistribution. The presence of oxygen can catalyze this process and self-assemblage.
For the same testing atmosphere, the degradation process varies with the heating rate. Clearly, the derivative TGA peaks shift to higher temperature with increasing heating rate in both nitrogen and air atmospheres. Because of changing degradation rate, the final char yields are affected by the heating rate as shown in Figure 5. Based on the integration of TGA derivative peaks, the degradation rate for the different stages were calculated and plotted as a function of the heating rate (Figure 6 and Figure 7). The plots of degradation rate against heating rate show that increasing heating rate accelerated the degradation process, especially for the phenomenon occurring in stage II. The activation energies obtained from using the KAS model are listed in Table 1 and based on the heating rates of 5, 10, 15, 20, 25 and 30℃/min. The plots of ln(β/T2) vs. 1/T used to determine the activation energy, are shown in Figure 8 and Figure 9. The activation energy for decomposition is calculated from the slope, -Ea/R (where R is the gas constant) of ln(β/T2) vs. 1/T plot.
The data from DSC analysis is shown in Figure 10 is in agreement with the TGA results. The absence of a phase transition was observed from the heating and cooling circles. In DSC tests carried out up to 300℃, a peak located around 200℃ is related to the early stage of decomposition. As for the samples subjected to the 700℃ heating range, a large exothermic peak was observed between 400 and 700℃ which is consistent with the TGA derivative peaks from TGA tests. The exothermic signal shown around 400℃ indicates the redistribution of Si-O cyclic structure and endothermic peaks located between 400 and 600℃ may be ascribed to the weight loss from volatiles evaporation resulting from complete pyrolysis of the backbone.
FT-IR analysis FT-IR is a powerful tool for chemical structure characterization, especially for organic-insoluble solid samples. By analyzing the spectrum of ATL-POSS and their ceramic residue cured in controlled conditions, it is possible to picture the detailed chemical structure change caused by heat. By analyzing the combined TGA derivative thermograms, and the FTIR spectra, the thermal degradation mechanism of ATL-POSS was inferred.
The FT-IR spectra of synthesized ATL-POSS is shown in Figure 11. The most important peaks shown around 1000 cm−1 and 1100 cm−1 are due to asymmetrical vertical and horizontal directions stretching of Si-O-Si bonding[35]. This is the key evidence of formation of ladder like structure. The other notable FTIR peaks shown here are the peaks at 3200cm−1 and 1600 cm−1 associated with the terminal amine functional group. The peak around 900 cm−1 indicates the presence of terminal Si-OH functional group. The FTIR peaks in the range of 2800-3000 cm−1 are due to the Si-C-H asymmetric stretching.
As mentioned in previous section, the thermal behavior of ATL-POSS is quite different in air and nitrogen atmosphere given the presence of oxygen in air. Supporting Information 2 and 3 show the FTIR spectra of ATL-POSS thermally treated at different temperature range from 100-600˚C. Figure 12 and Figure 13 indicate that the peak intensity decreased significantly with increasing testing temperature. The details about specific structure of the degraded POSS will be addressed in later sections.
There is one common trend in the changes of the FTIR peaks for both atmospheres. The disappearance of the peaks due to Si-OH (~900 cm−1) occurred at testing temperature above 150˚C and below 300˚C, i.e T > 150˚C ≤ 300˚C. (Figure 14). The condensation of silanol, Si-OH seems to be nearly completed about 250℃ in both nitrogen and air atmospheres. This process contributes to the slight weight loss observed before the major weight loss occurred. Another early decomposition process occurred on the side group of ATL-POSS as shown by the height decrease of the FTIR peaks around the 2900 cm−1 shown in Figure 12 and Figure 13. It is shown that the intensity of Si-C-H group transmittance at 2900 cm−1, decreased with increasing testing temperature and this peak completely disappeared at about 300℃ in air atmosphere and 400℃ in nitrogen atmosphere. The presence of oxygen seems to accelerate this process and results in the formation of a minor TGA derivative peak at 250℃. This peak is also observed in the TGA derivative weight loss peak trace for samples tested at slow heating rate (<20 ℃/min). Once the temperature reaches around 400℃, a minor side peak was formed at around 940-950 cm−1 which corresponds to the vibration of the C-C bond. This temporary structure, however, only survive in the range of 400-500℃ in air shown in Figure 15. On the other hand, this structure signal is relatively weak for samples tested in nitrogen atmosphere but retained at higher temperatures. The broad shape of these peaks also indicates that this C-C bonding is relatively polymeric. The formation of such peak could be attributed to the decomposition of side methyl group on POSS. Part of the carbon based structure is volatilized while the rest are trapped into silicone cyclic structure. The amine terminated structure also decomposed at similar temperature range, based on the disappearance of peaks at 3200 cm−1. The presence of peaks around 1600 cm−1 shown in Figure 16 also confirms the presence of the primary amine structure in low temperature cured samples. These peaks shift to higher wavenumber under high temperatures, which indicates the transformation of primary amine to C=N structure which was found amongst the product of oligomeric volatiles.
For tests performed under nitrogen atmosphere, once temperatures reached about 300℃, the ladder like structure starts to transform into complex Si-OX-Si structure similar to (-Si(OH)-O-Si-), resulting in first derivative TGA weight loss peak. The evidence of such structure is the broad FTIR band shown in the wavenumber range of 3680 to 2900 cm−1. This structure is present at high temperature up to about 500℃ in nitrogen and eventually decomposed into silica. The shift of the Si-O-Si peak from 990 to 1017 cm−1 and from ~746 to 790 cm−1 (Figure 17) suggests that redistribution or re-assemblage has occurred in this temperature range. This peak shift mainly occurs at the range of 250-450℃. As the testing temperatures reaches about 400℃, an intermolecular reconfiguration seems to occur resulting in a -OSi-Cn-SiO- structure which produces the second derivative peak at about 500℃.
Similar phenomenon occurred in samples tested under oxidizing air atmosphere. However, presence of oxygen catalyzes all reactions as shown in previous section. For instance, peak shift for Si-O-Si from 746 cm−1 to higher wavenumbers occurred earlier (in the range of 200-250℃) compared to samples cured in nitrogen. The major difference of the thermal behavior in the range of second derivative peaks is decided by whether the external oxygen is involved in the pyrolysis. KAS model indicated that the activation energy of forming -OSi-Cn-SiO- structure is the highest in all the tests carried out under air atmosphere. On the other hand, the failure of the whole structure consumes the highest energy in nitrogen. This stage is also known as the keystone of oxygen sink by forming a temporary thermal resistance structure.
4. Conclusions
Amine terminated ladder-like POSS was synthesized by condensation of hydrolyzed aminopropylsilane. The thermal behavior of ATL-POSS was studied by TGA and DSC. The DSC analysis confirmed the absence of any phase transition before the major chemical structure failure because of the cyclic ladder-like Si-O bonding. The TGA results indicated that the char yield of ladder-like ATL-POSS is much higher than that for linear amine terminated PDMS. Also, the thermal degradation rate of ATL-POSS, is significantly affected by heating rate. With the aid of FT-IR analysis of the resulting ATL-POSS residue, the details about the multiple stages of thermal decomposition of POSS was determined. Condensation of terminal silanol units mainly occurs at about 100℃ resulting in formation of the first derivation peak. The scission of side chain also proceeds and is completed at about 350℃ in nitrogen and 300℃ in air atmosphere. The major scission of the ladder like backbones starts around 250℃ in nitrogen atmosphere and 200℃ in air atmosphere. Once the testing temperature reaches 400℃, reorganization and re-assembly of the ATL-POSS structure occurred. The occurrence of a temporary structure was suggested by FTIR spectral analysis. Finally, ATL-POSS completely decomposes into silica-like structure at testing temperature T ≥ 600℃. The possibility of forming SiC-SiO2 and SiC-SiO2-NH2 compounds exist above 700˚C.
Author Contributions
“Conceptualization, S. Xiao. and J. Iroh.; methodology, S .Xiao.; software, S.Xiao, J. Iroh.; validation, S.Xiao., J.Iroh.; formal analysis, S.Xiao.; investigation, S.Xiao.; resources, J.Iroh.; data curation, S.Xiao.; writing—original draft preparation, S.Xiao.; writing—review and editing, S.Xiao., J. Iroh; visualization, J.Iroh.; supervision, J.Iroh.; project administration, J.Iroh.; funding acquisition, J.Iroh. All authors have read and agreed to the published version of the manuscript.”. Authorship must be limited to those who have contributed substantially to the work reported.
Funding
This research received no external funding.
Acknowledgments
The authors acknowledge the Department of Mechanical and Materials Engineering for administrative and technical support.
Conflicts of Interest
The authors declare no conflict of interest.
References
- Kirby, R.; Mosurkal, R.; Li, L.; Kumar, J.; Soares, J.W. Polysiloxane-Based Organoclay Nanocomposites as Flame Retardants. Polym Plast Technol Eng 2013, 52, 1527–1534. [Google Scholar] [CrossRef]
- Lu, Z.; Feng, W.; Kang, X.; Wang, J.; Xu, H.; Wang, Y.; Liu, B.; Fang, X.; Ding, T. Synthesis of Siloxane-containing Benzoxazine and Its Synergistic Effect on Flame Retardancy of Polyoxymethylene. Polym Adv Technol 2019, 30, 2686–2694. [Google Scholar] [CrossRef]
- Mosurkal, R.; Tucci, V.; Samuelson, L.A.; Smith, K.D.; Westmoreland, P.R.; Parmar, V.S.; Kumar, J.; Watterson, A.C. Novel Organo-Siloxane Copolymers for Flame Retardant Applications. In; 2010; pp. 157–165.
- Long, J.; Shi, X.; Liu, B.; Lu, P.; Chen, L.; Wang, Y. Semi-Aromatic Polyamides Containing Siloxane Unit toward High Performance. ACTA POLYMERICA SINICA 2020, 51, 681–686. [Google Scholar]
- Song, R.; Chang, L.; Li, B. Flame Retardancy and Thermal Properties of Carboxyl-Containing Polysiloxane Derivatives in Polycarbonate. J Appl Polym Sci 2014, 131. [Google Scholar] [CrossRef]
- Xiao, S.; Akinyi, C.; Longun, J.; Iroh, J.O. Polyimide Copolymers and Nanocomposites: A Review of the Synergistic Effects of the Constituents on the Fire-Retardancy Behavior. Energies (Basel) 2022, 15, 4014. [Google Scholar] [CrossRef]
- Zielecka, M.; Rabajczyk, A.; Pastuszka, Ł.; Jurecki, L. Flame Resistant Silicone-Containing Coating Materials. Coatings 2020, 10, 1–14. [Google Scholar] [CrossRef]
- Camino, B.; Camino, G. The Chemical Kinetics of the Polymer Combustion Allows for Inherent Fire Retardant Synergism. Polym Degrad Stab 2019, 160, 142–147. [Google Scholar] [CrossRef]
- Hamdani, S.; Longuet, C.; Perrin, D.; Lopez-cuesta, J.M.; Ganachaud, F. Flame Retardancy of Silicone-Based Materials. Polym Degrad Stab 2009, 465–495. [Google Scholar] [CrossRef]
- Deshpande, G.; Rezac, M.E.; Irisawa, T. The Effect of Phenyl Content on the Degradation of Poly(Dimethyl Diphenyl) Siloxane Copolymers. Polym Degrad Stab 2001, 74, 363–370. [Google Scholar] [CrossRef]
- Huang, J.; He, C.; Xiao, Y.; Mya, K.Y.; Dai, J.; Siow, Y.P. Polyimide/POSS Nanocomposites: Interfacial Interaction, Thermal Properties and Mechanical Properties. Polymer (Guildf) 2003, 44, 4491–4499. [Google Scholar] [CrossRef]
- Yan, L.; Fu, L.; Chen, Y.; Tian, H.; Xiang, A.; Rajulu, A.V. Improved Thermal Stability and Flame Resistance of Flexible Polyimide Foams by Vermiculite Reinforcement. J Appl Polym Sci 2017, 134. [Google Scholar] [CrossRef]
- Faghihi, K.; Hajibeygi, M.; Shabanian, M. Polyimide–Silver Nanocomposite Containing Phosphine Oxide Moieties in the Main Chain: Synthesis and Properties. Chinese Chemical Letters 2010, 21, 1387–1390. [Google Scholar] [CrossRef]
- Seckin, T.; Köytepe, S. Synthesis and Characterization of Borax-Polyimide for Flame Retardant Applications. Macromol Symp 2010, 296, 575–582. [Google Scholar] [CrossRef]
- Fina, A.; Abbenhuis, H.C.L.; Tabuani, D.; Camino, G. Metal Functionalized POSS as Fire Retardants in Polypropylene. Polym Degrad Stab 2006, 91, 2275–2281. [Google Scholar] [CrossRef]
- Scott, D.W.; Scott, B.D.W. Thermal Rearrangement of Branched-Chain Methylpolysiloxanes1 Branched-Chain Methylpolysiloxanes. 1946, 68, 356–358.
- Mohamed, M.G.; Kuo, S.W. Functional Polyimide/Polyhedral Oligomeric Silsesquioxane Nanocomposites. Polymers (Basel) 2019, 11. [Google Scholar] [CrossRef]
- Turgut, G.; Dogan, M.; Tayfun, U.; Ozkoc, G. The Effects of POSS Particles on the Flame Retardancy of Intumescent Polypropylene Composites and the Structure-Property Relationship. Polym Degrad Stab 2018, 149, 96–111. [Google Scholar] [CrossRef]
- Devaraju, S.; Vengatesan, M.R.; Selvi, M.; Kumar, A.A.; Alagar, M. Synthesis and Characterization of Bisphenol-A Ether Diamine-Based Polyimide POSS Nanocomposites for Low K Dielectric and Flame-Retardant Applications. High Perform Polym 2012, 24, 85–96. [Google Scholar] [CrossRef]
- Jothibasu, S.; Premkumar, S.; Alagar, M.; Hamerton, I. Synthesis and Characterization of a POSS-Maleimide Precursor for Hybrid Nanocomposites. High Perform Polym 2008, 20, 67–85. [Google Scholar] [CrossRef]
- Leu, C.M.; Chang, Y. te; Wei, K.H. Synthesis and Dielectric Properties of Polyimide-Tethered Polyhedral Oligomeric Silsesquioxane (POSS) Nanocomposites via Poss-Diamine. Macromolecules 2003, 36, 9122–9127. [Google Scholar] [CrossRef]
- Kuo, S.W.; Chang, F.C. POSS Related Polymer Nanocomposites. Progress in Polymer Science (Oxford) 2011, 36, 1649–1696. [Google Scholar] [CrossRef]
- Wu, H.; Zeng, B.; Chen, J.; Wu, T.; Li, Y.; Liu, Y.; Dai, L. An Intramolecular Hybrid of Metal Polyhedral Oligomeric Silsesquioxanes with Special Titanium-Embedded Cage Structure and Flame Retardant Functionality. Chemical Engineering Journal 2019, 374, 1304–1316. [Google Scholar] [CrossRef]
- Zhai, C.; Xin, F.; Cai, L.; Chen, Y.; Qian, L. Flame Retardancy and Pyrolysis Behavior of an Epoxy Resin Composite Flame-retarded by Diphenylphosphinyl-POSS. Polym Eng Sci 2020, 60, 3024–3035. [Google Scholar] [CrossRef]
- Safarikova, B.; Kalendova, A.; Habrova, V.; Zatloukalova, S.; Machovsky, M. Synergistic Effect between Polyhedral Oligomeric Silsesquioxane and Flame Retardants.; 2014; pp. 106–109.
- Bourbigot, S.; Duquesne, S.; Fontaine, G.; Bellayer, S.; Turf, T.; Samyn, F. Characterization and Reaction to Fire of Polymer Nanocomposites with and without Conventional Flame Retardants. Molecular Crystals and Liquid Crystals 2008, 486 325/[1367]-339/[1381]. [Google Scholar] [CrossRef]
- Xue, M.; Zhang, X.; Wu, Z.; Wang, H.; Ding, X.; Tian, X. Preparation and Flame Retardancy of Polyurethane/POSS Nanocomposites. Chinese Journal of Chemical Physics 2013, 26, 445–450. [Google Scholar] [CrossRef]
- Handke, M.; Handke, B.; Kowalewska, A.; Jastrzębski, W. New Polysilsesquioxane Materials of Ladder-like Structure. J Mol Struct 2009, 924–926, 254–263. [Google Scholar] [CrossRef]
- Feng, Y.; Qi, S.; Wu, Z.; Wang, X.; Yang, X.; Wu, D. Preparation and Characterization of Polyimide/Ladder like Polysiloxane Hybrid Films. Mater Lett 2010, 64, 2710–2713. [Google Scholar] [CrossRef]
- Shi, H.; Yang, J.; You, M.; Li, Z.; He, C. Polyhedral Oligomeric Silsesquioxanes (POSS)-Based Hybrid Soft Gels: Molecular Design, Material Advantages, and Emerging Applications. ACS Mater Lett 2020, 2, 296–316. [Google Scholar] [CrossRef]
- Mohamed, M.G.; Kuo, S.-W. Progress in the Self-Assembly of Organic/Inorganic Polyhedral Oligomeric Silsesquioxane (POSS) Hybrids. Soft Matter 2022, 18, 5535–5561. [Google Scholar] [CrossRef]
- Linqian Feng; Jude O Iroh Synthesis, Characterization and Dynamic Mechanical Properties of Polyimide-Polyurea-Polysilsesquioxane Block Terpolymers. Journal of Chemistry & its Applications 2022, 1–9. [CrossRef]
- Wen-Chang Liaw, K.-P.C. Preparation and Properties of Poly(Imide Siloxane) Segmented Copolymer/Silica Hybrid Nanocomposites. J Appl Polym Sci 2007, 105, 809–820. [Google Scholar] [CrossRef]
- Xiao, S.; Iroh, J.O. Novel Polyimide-Block-Poly(Dimethyl Siloxane) Copolymers: Effect of Time on the Synthesis and Thermal Properties. High Perform Polym 2021, 0, 095400832110404. [Google Scholar] [CrossRef]
- Choi, S.-S.; Lee, A.S.; Hwang, S.S.; Baek, K.-Y. Structural Control of Fully Condensed Polysilsesquioxanes: Ladderlike vs. Cage Structured Polyphenylsilsesquioxanes. Macromolecules 2015, 48, 6063–6070. [Google Scholar] [CrossRef]
Figure 1.
The thermal oxidative decomposition of silicone-based materials at varying heating rates [10].
Figure 1.
The thermal oxidative decomposition of silicone-based materials at varying heating rates [10].
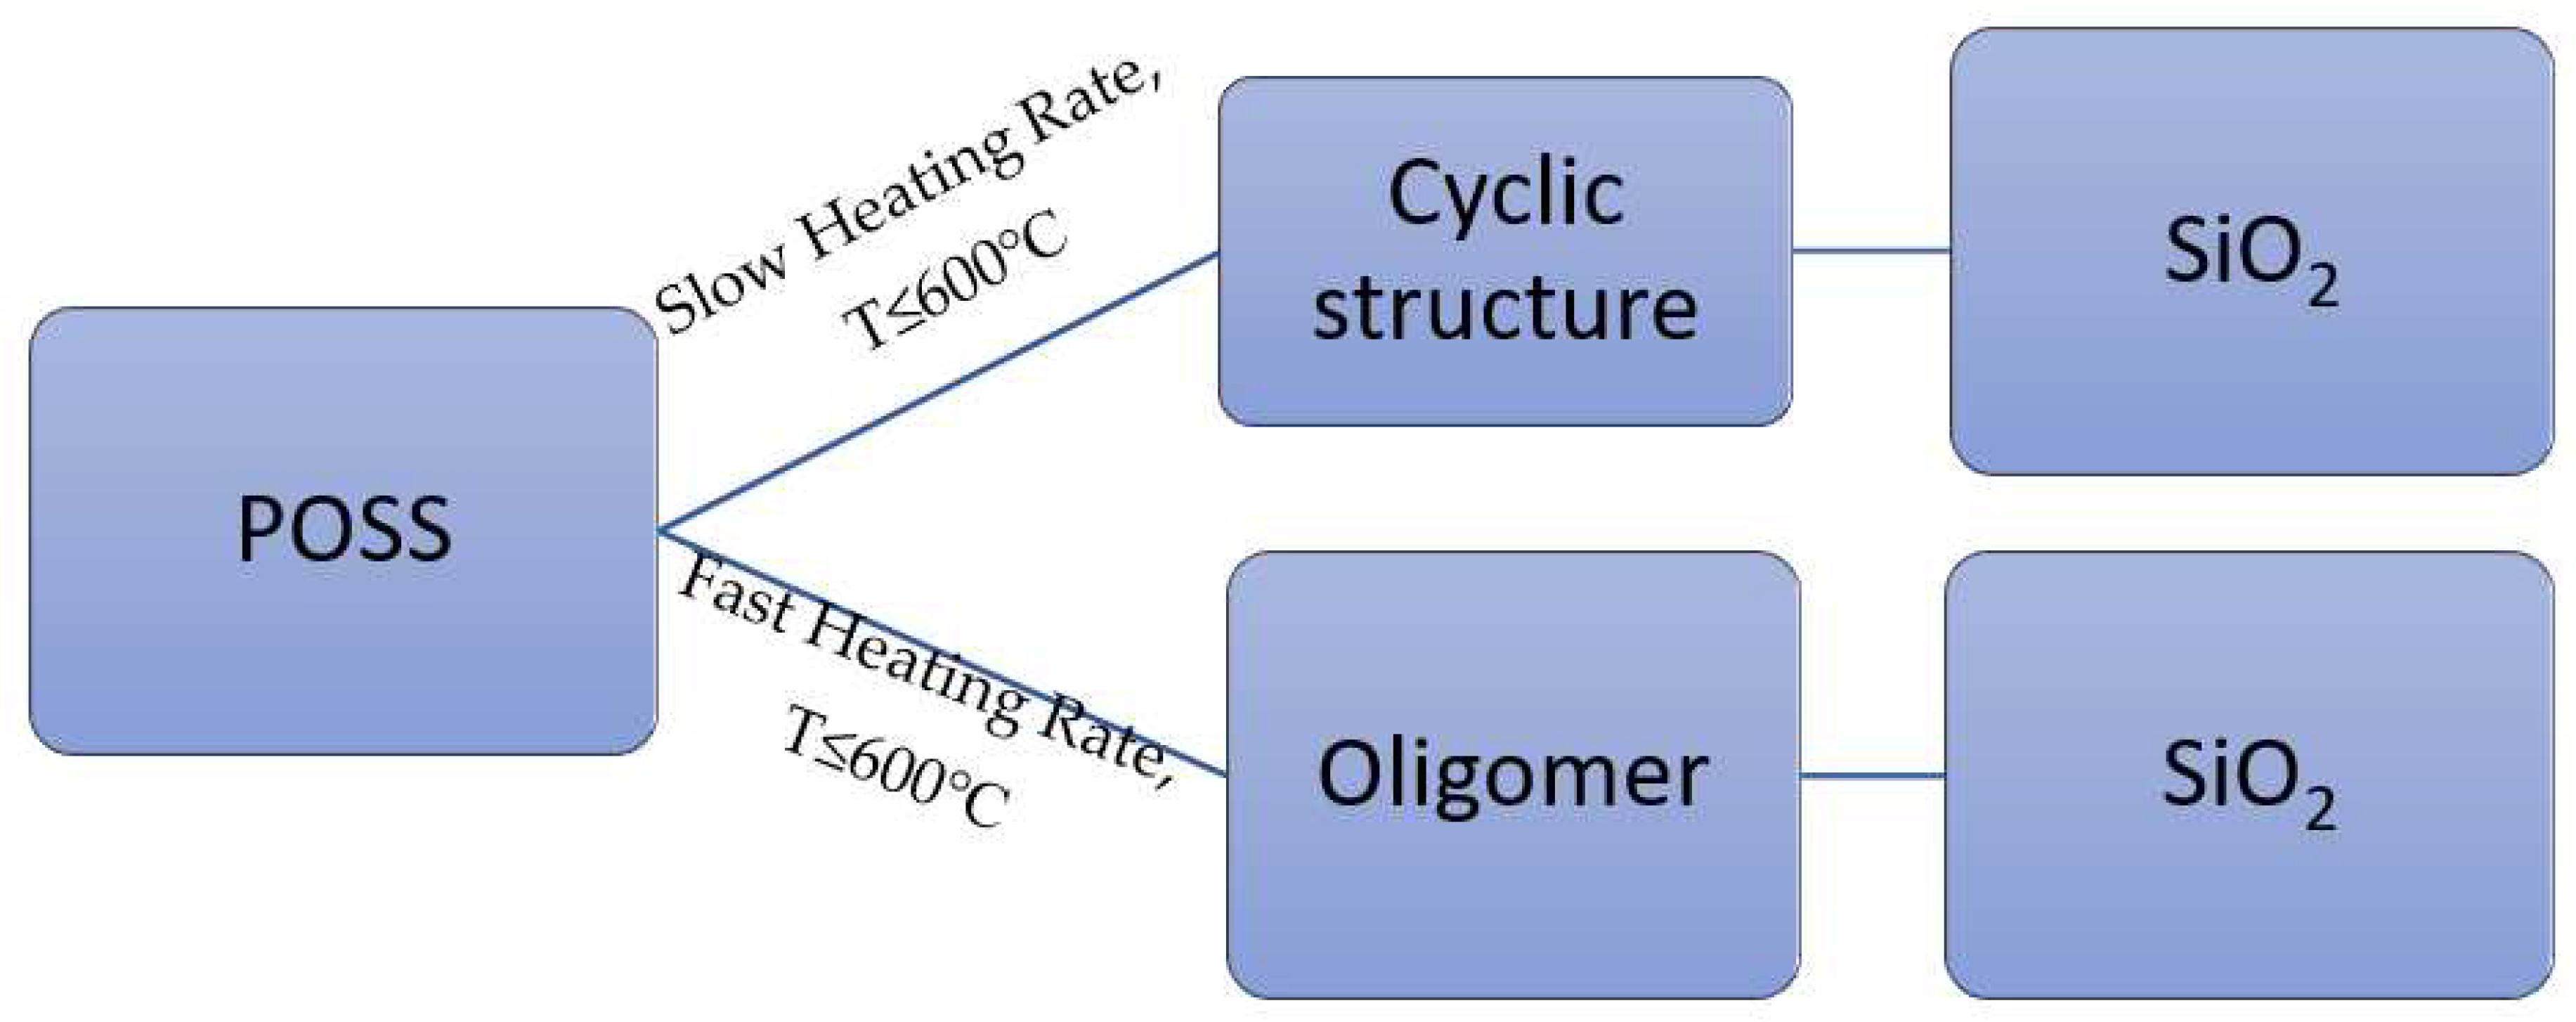
Figure 2.
Schematic for formation of Silsesquioxanes.
Scheme 1.
Representation of the synthesis of amine terminated ladder-like POSS from APTMS.
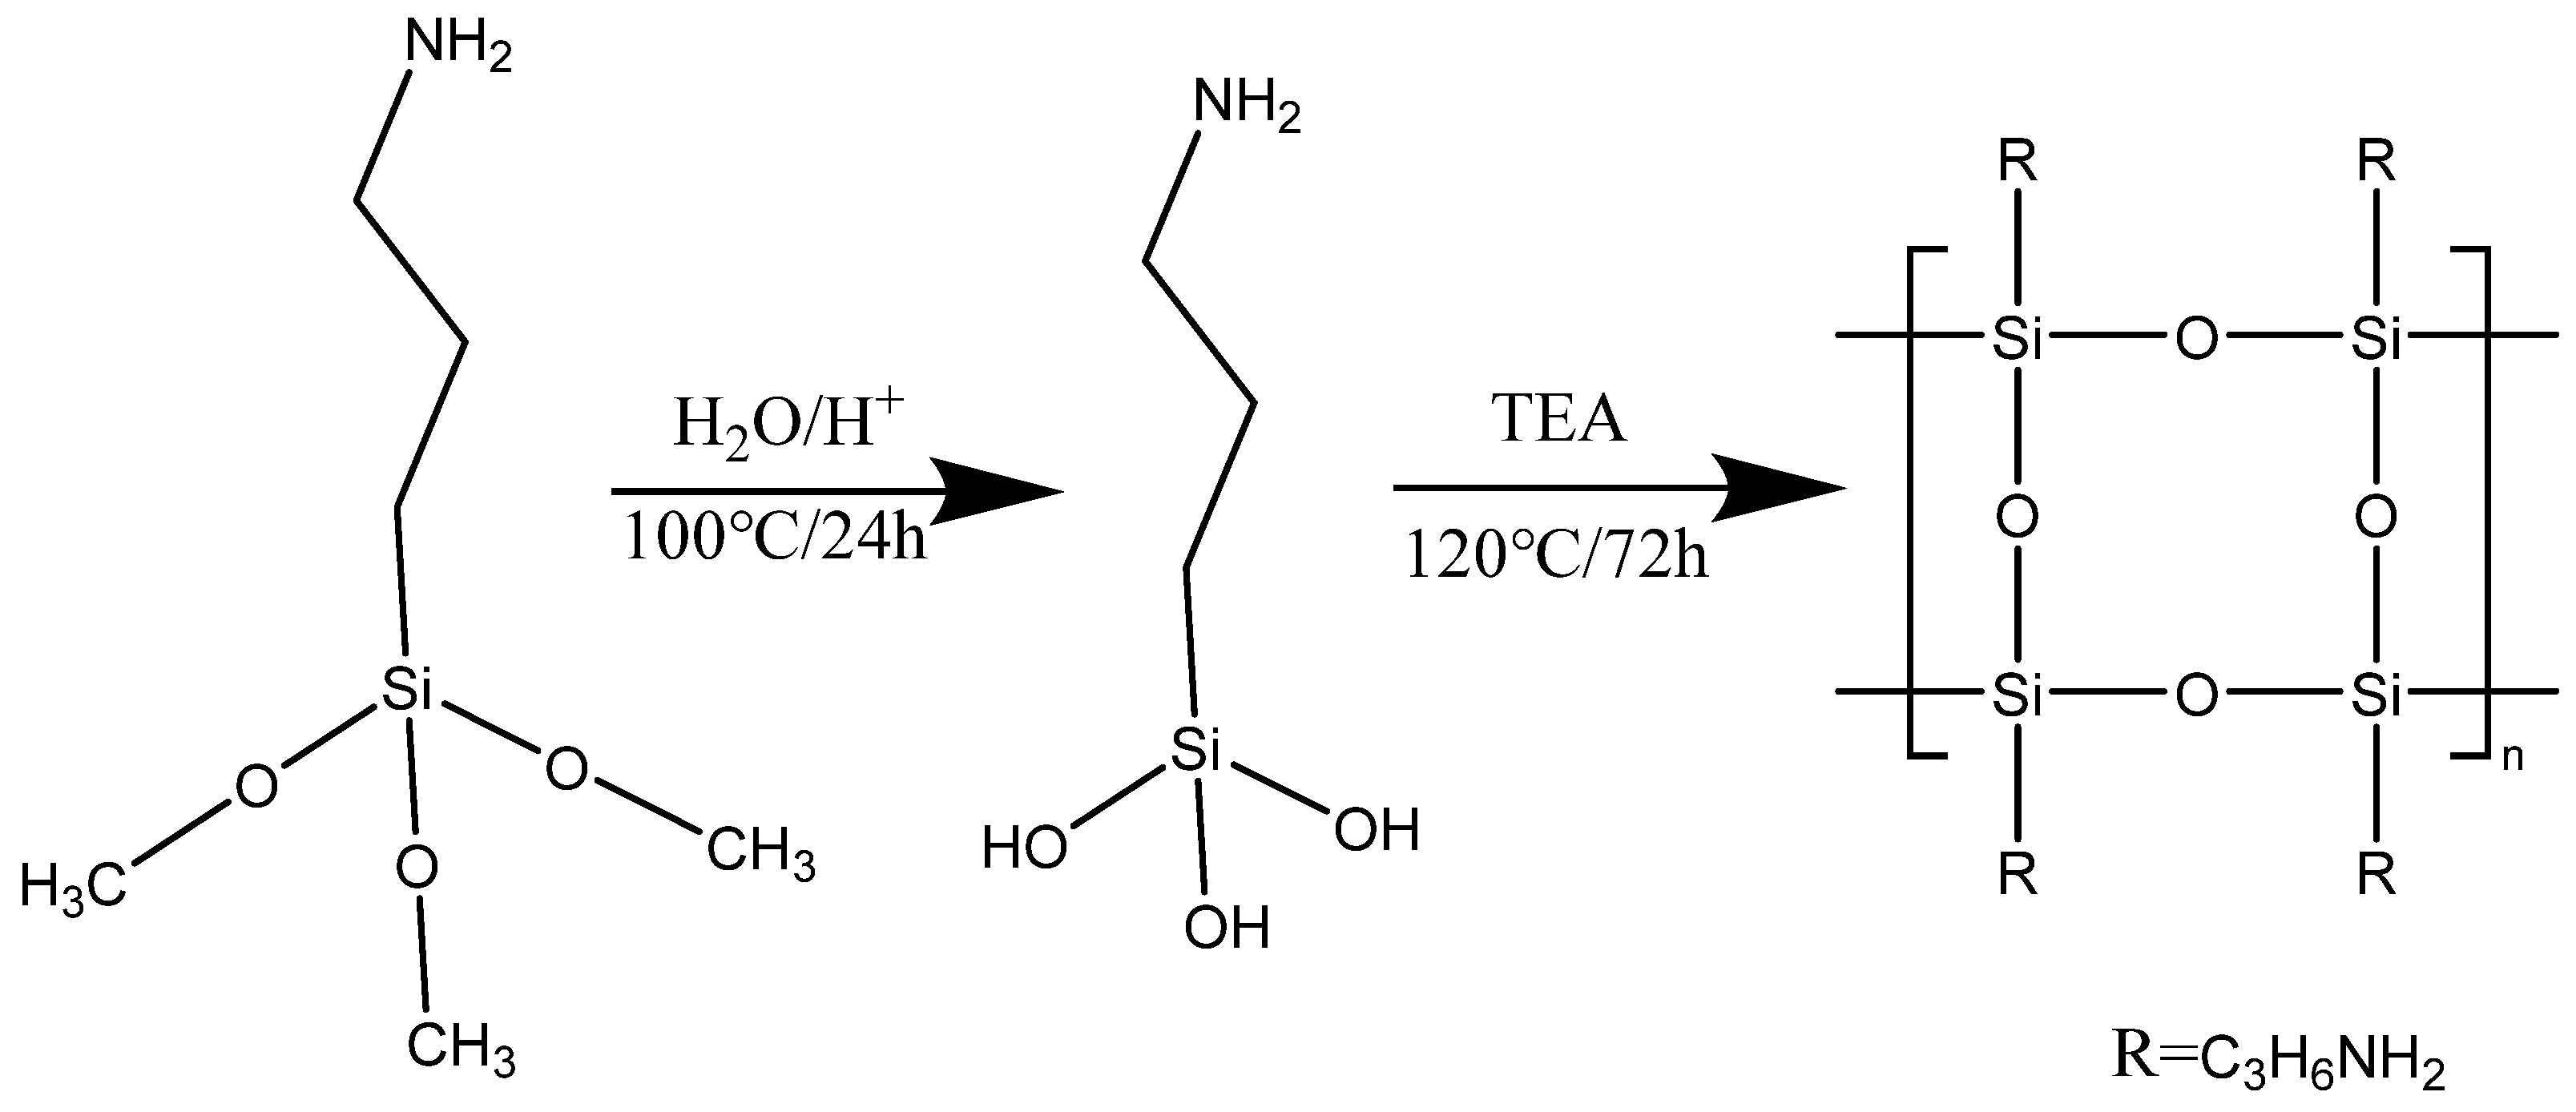
Figure 3.
Weight loss traces of ATL-POSS in nitrogen (a) and air (b) at a heating rate of 10℃/min.
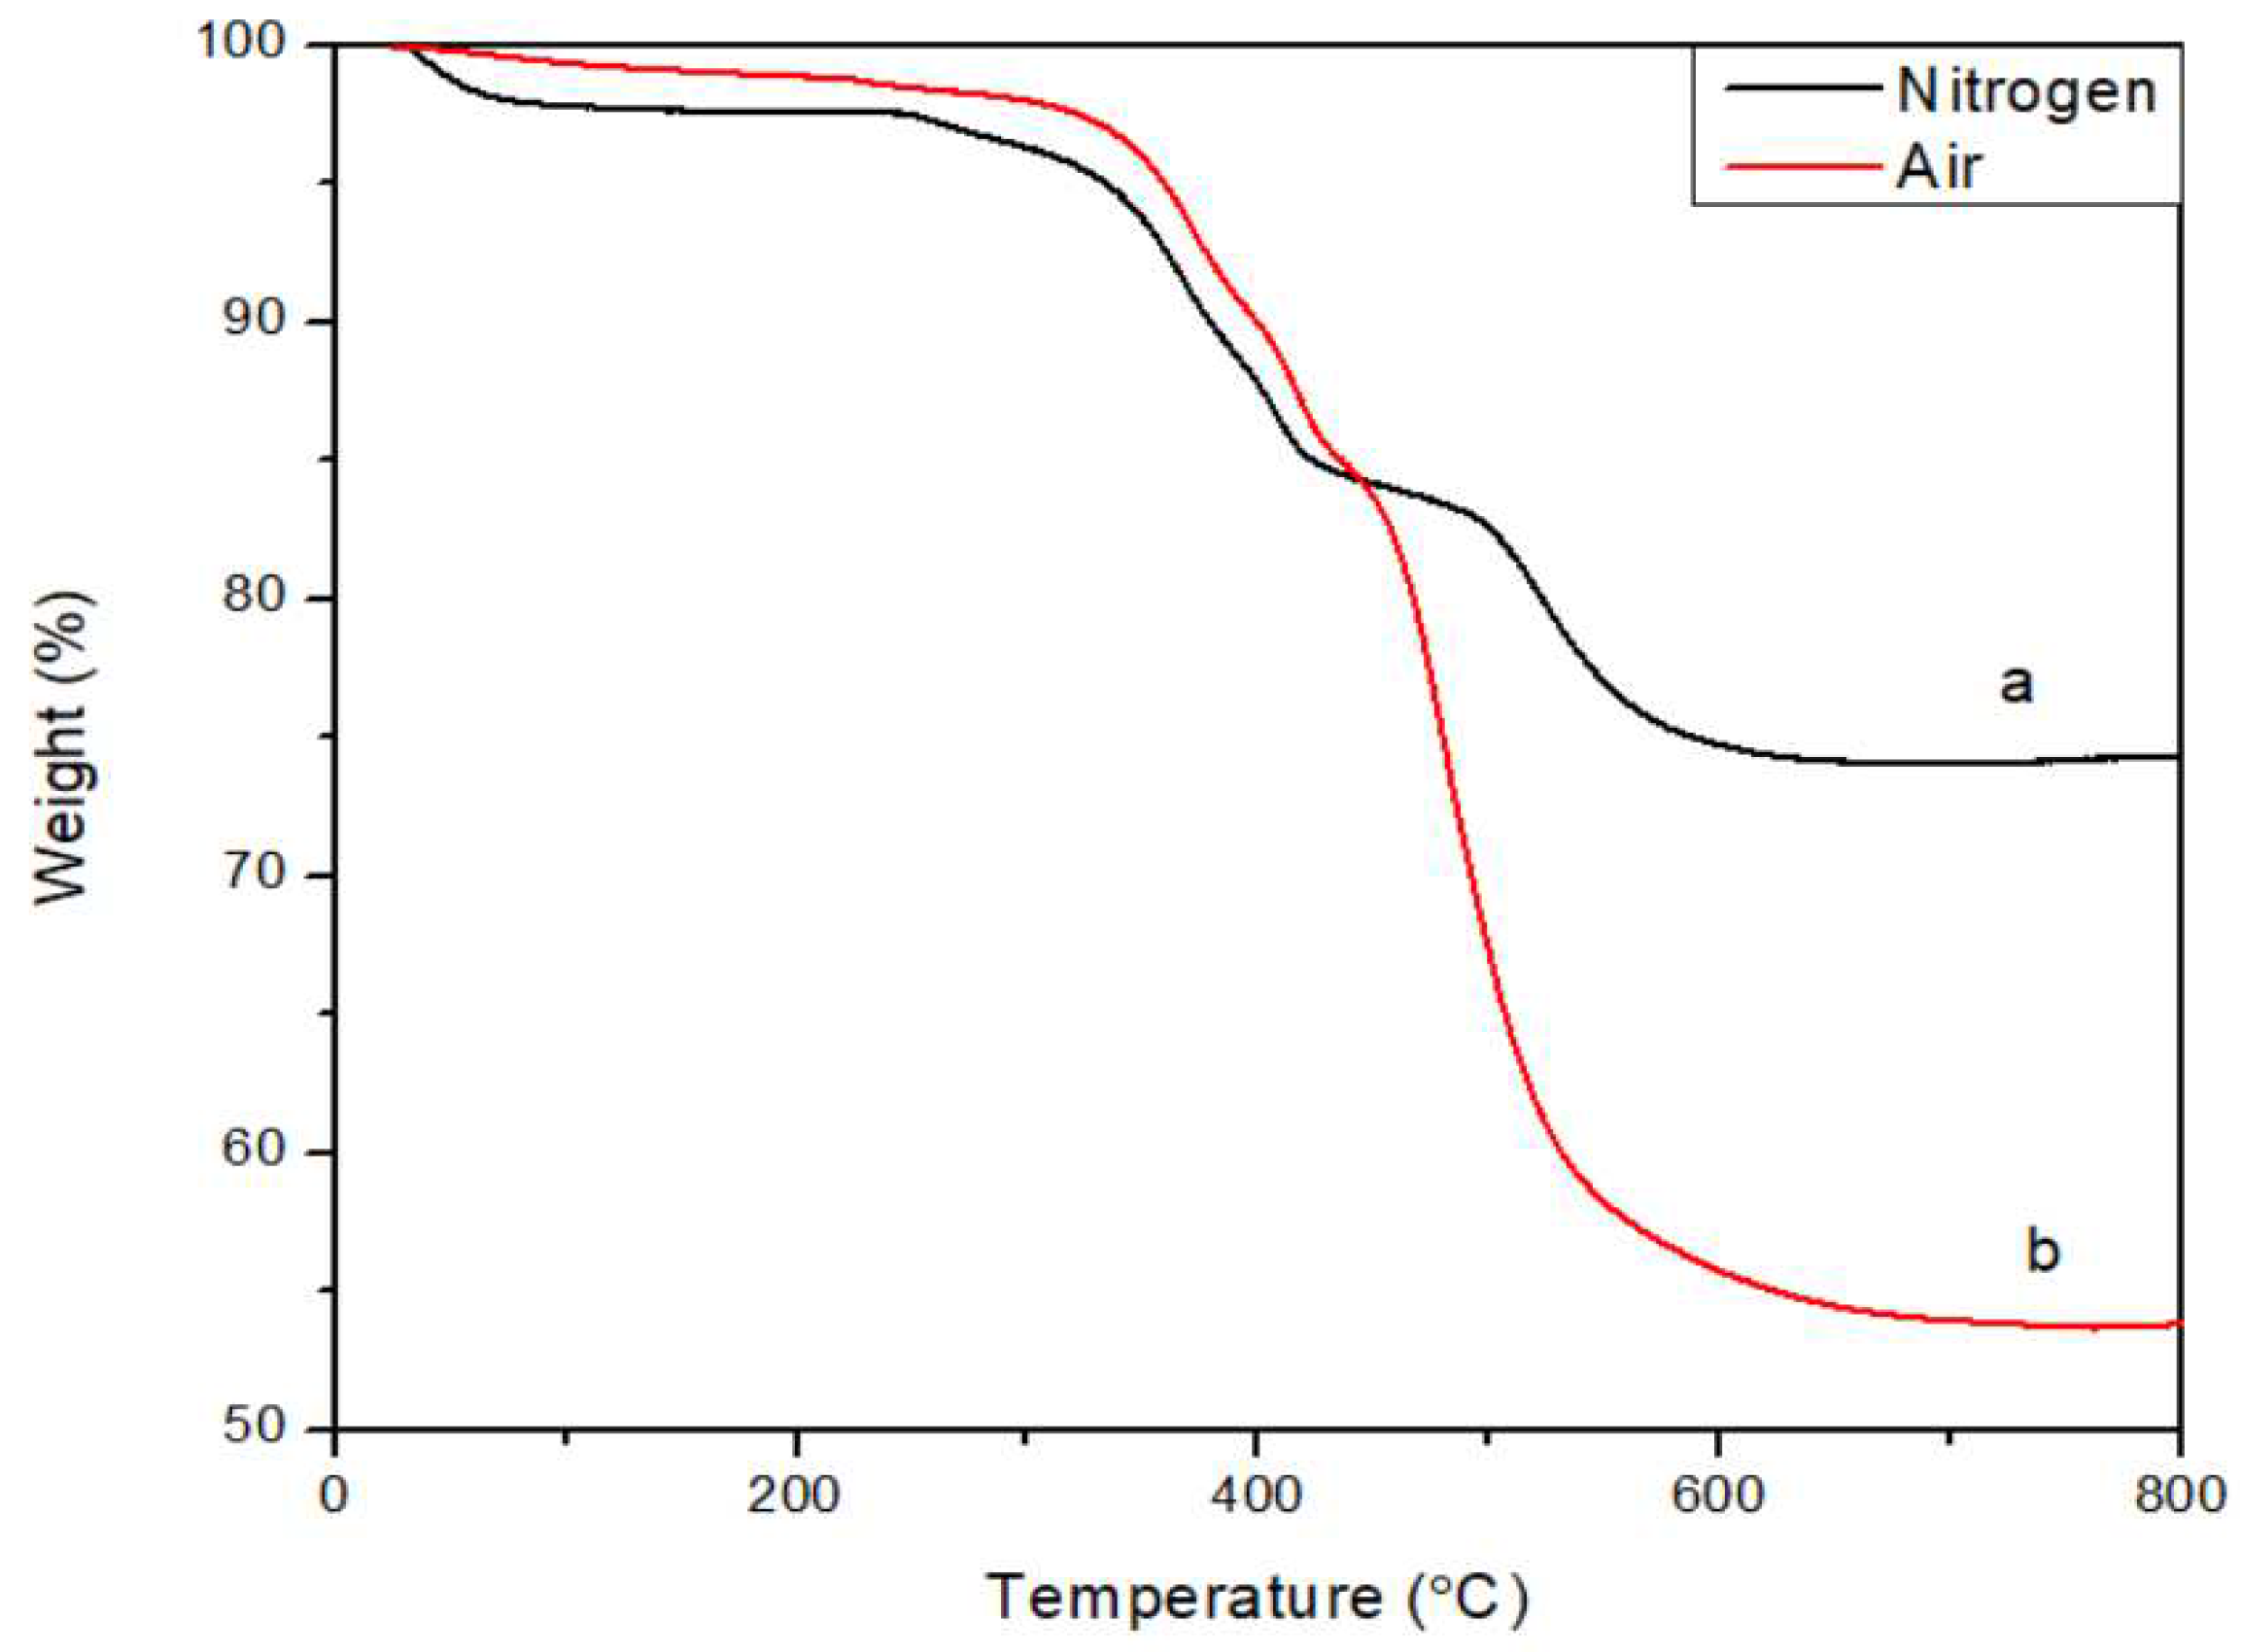
Figure 4.
TGA derivative weight loss curves of ATL-POSS in nitrogen (a) and air (b) at a heating rate of 10℃/min.
Figure 4.
TGA derivative weight loss curves of ATL-POSS in nitrogen (a) and air (b) at a heating rate of 10℃/min.
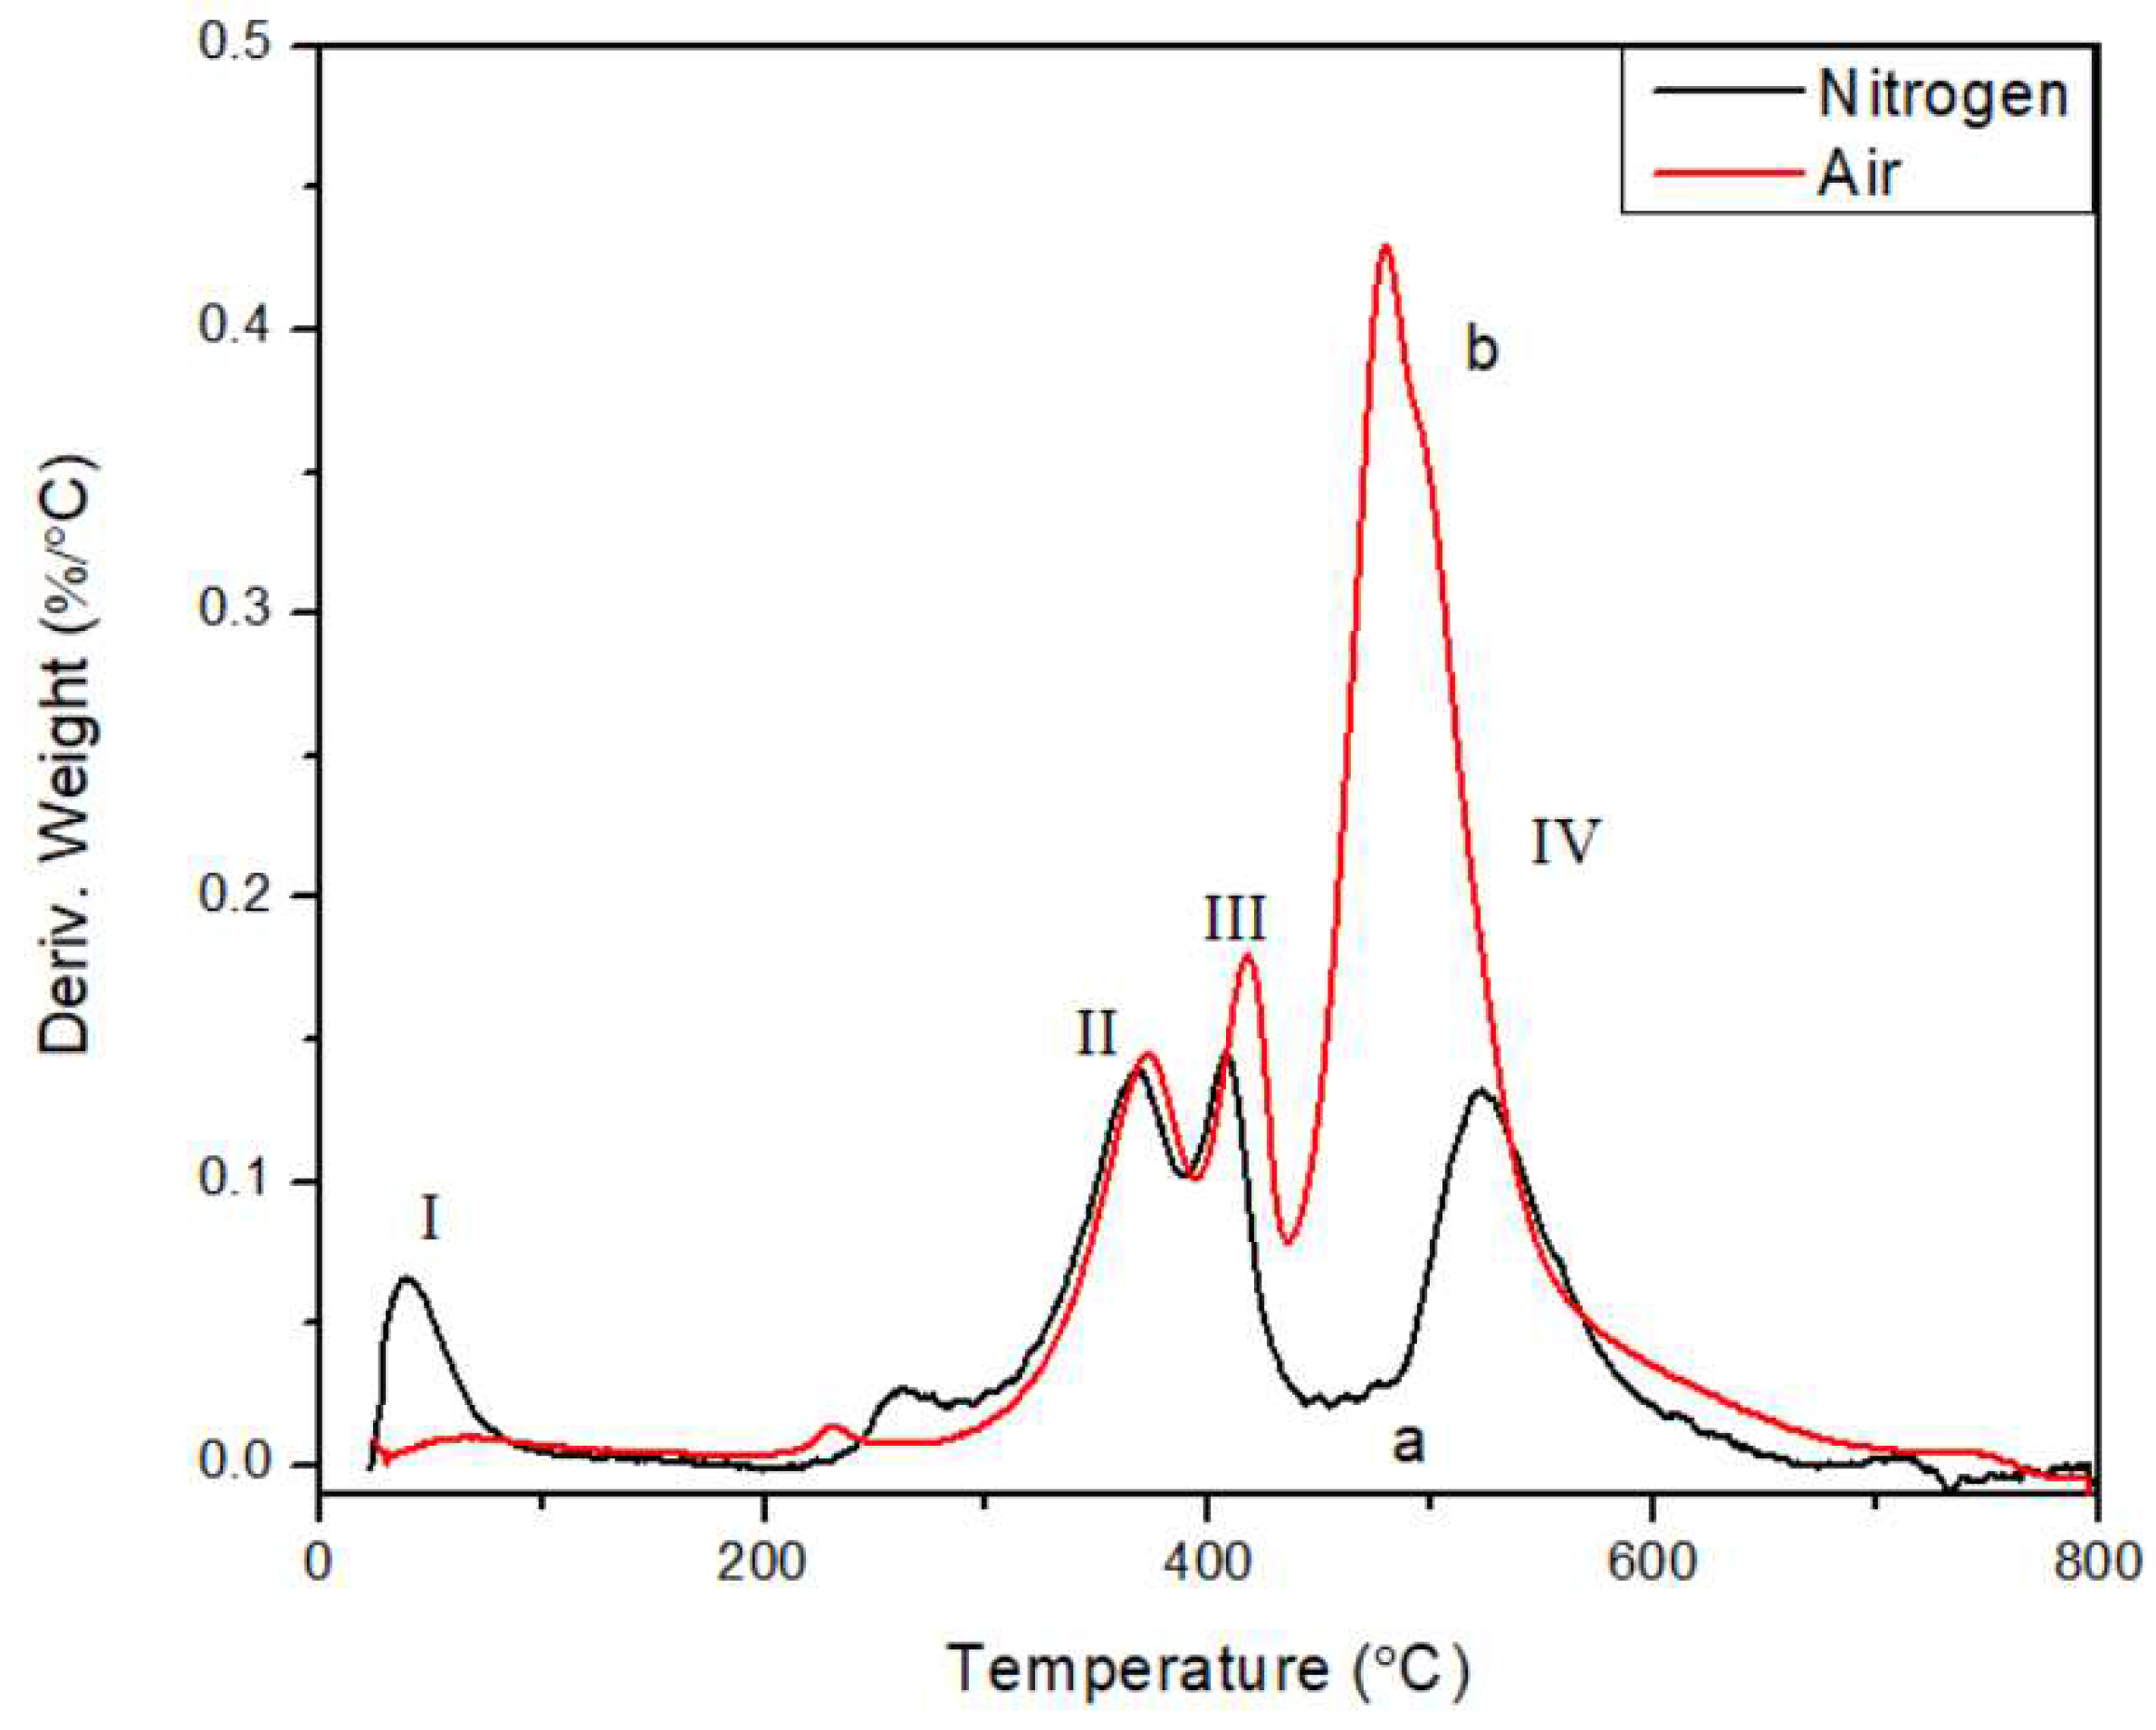
Figure 5.
Dependence of char yield of ATL-POSS on the heating rate under nitrogen atmosphere:● and air atmosphere:■.
Figure 5.
Dependence of char yield of ATL-POSS on the heating rate under nitrogen atmosphere:● and air atmosphere:■.
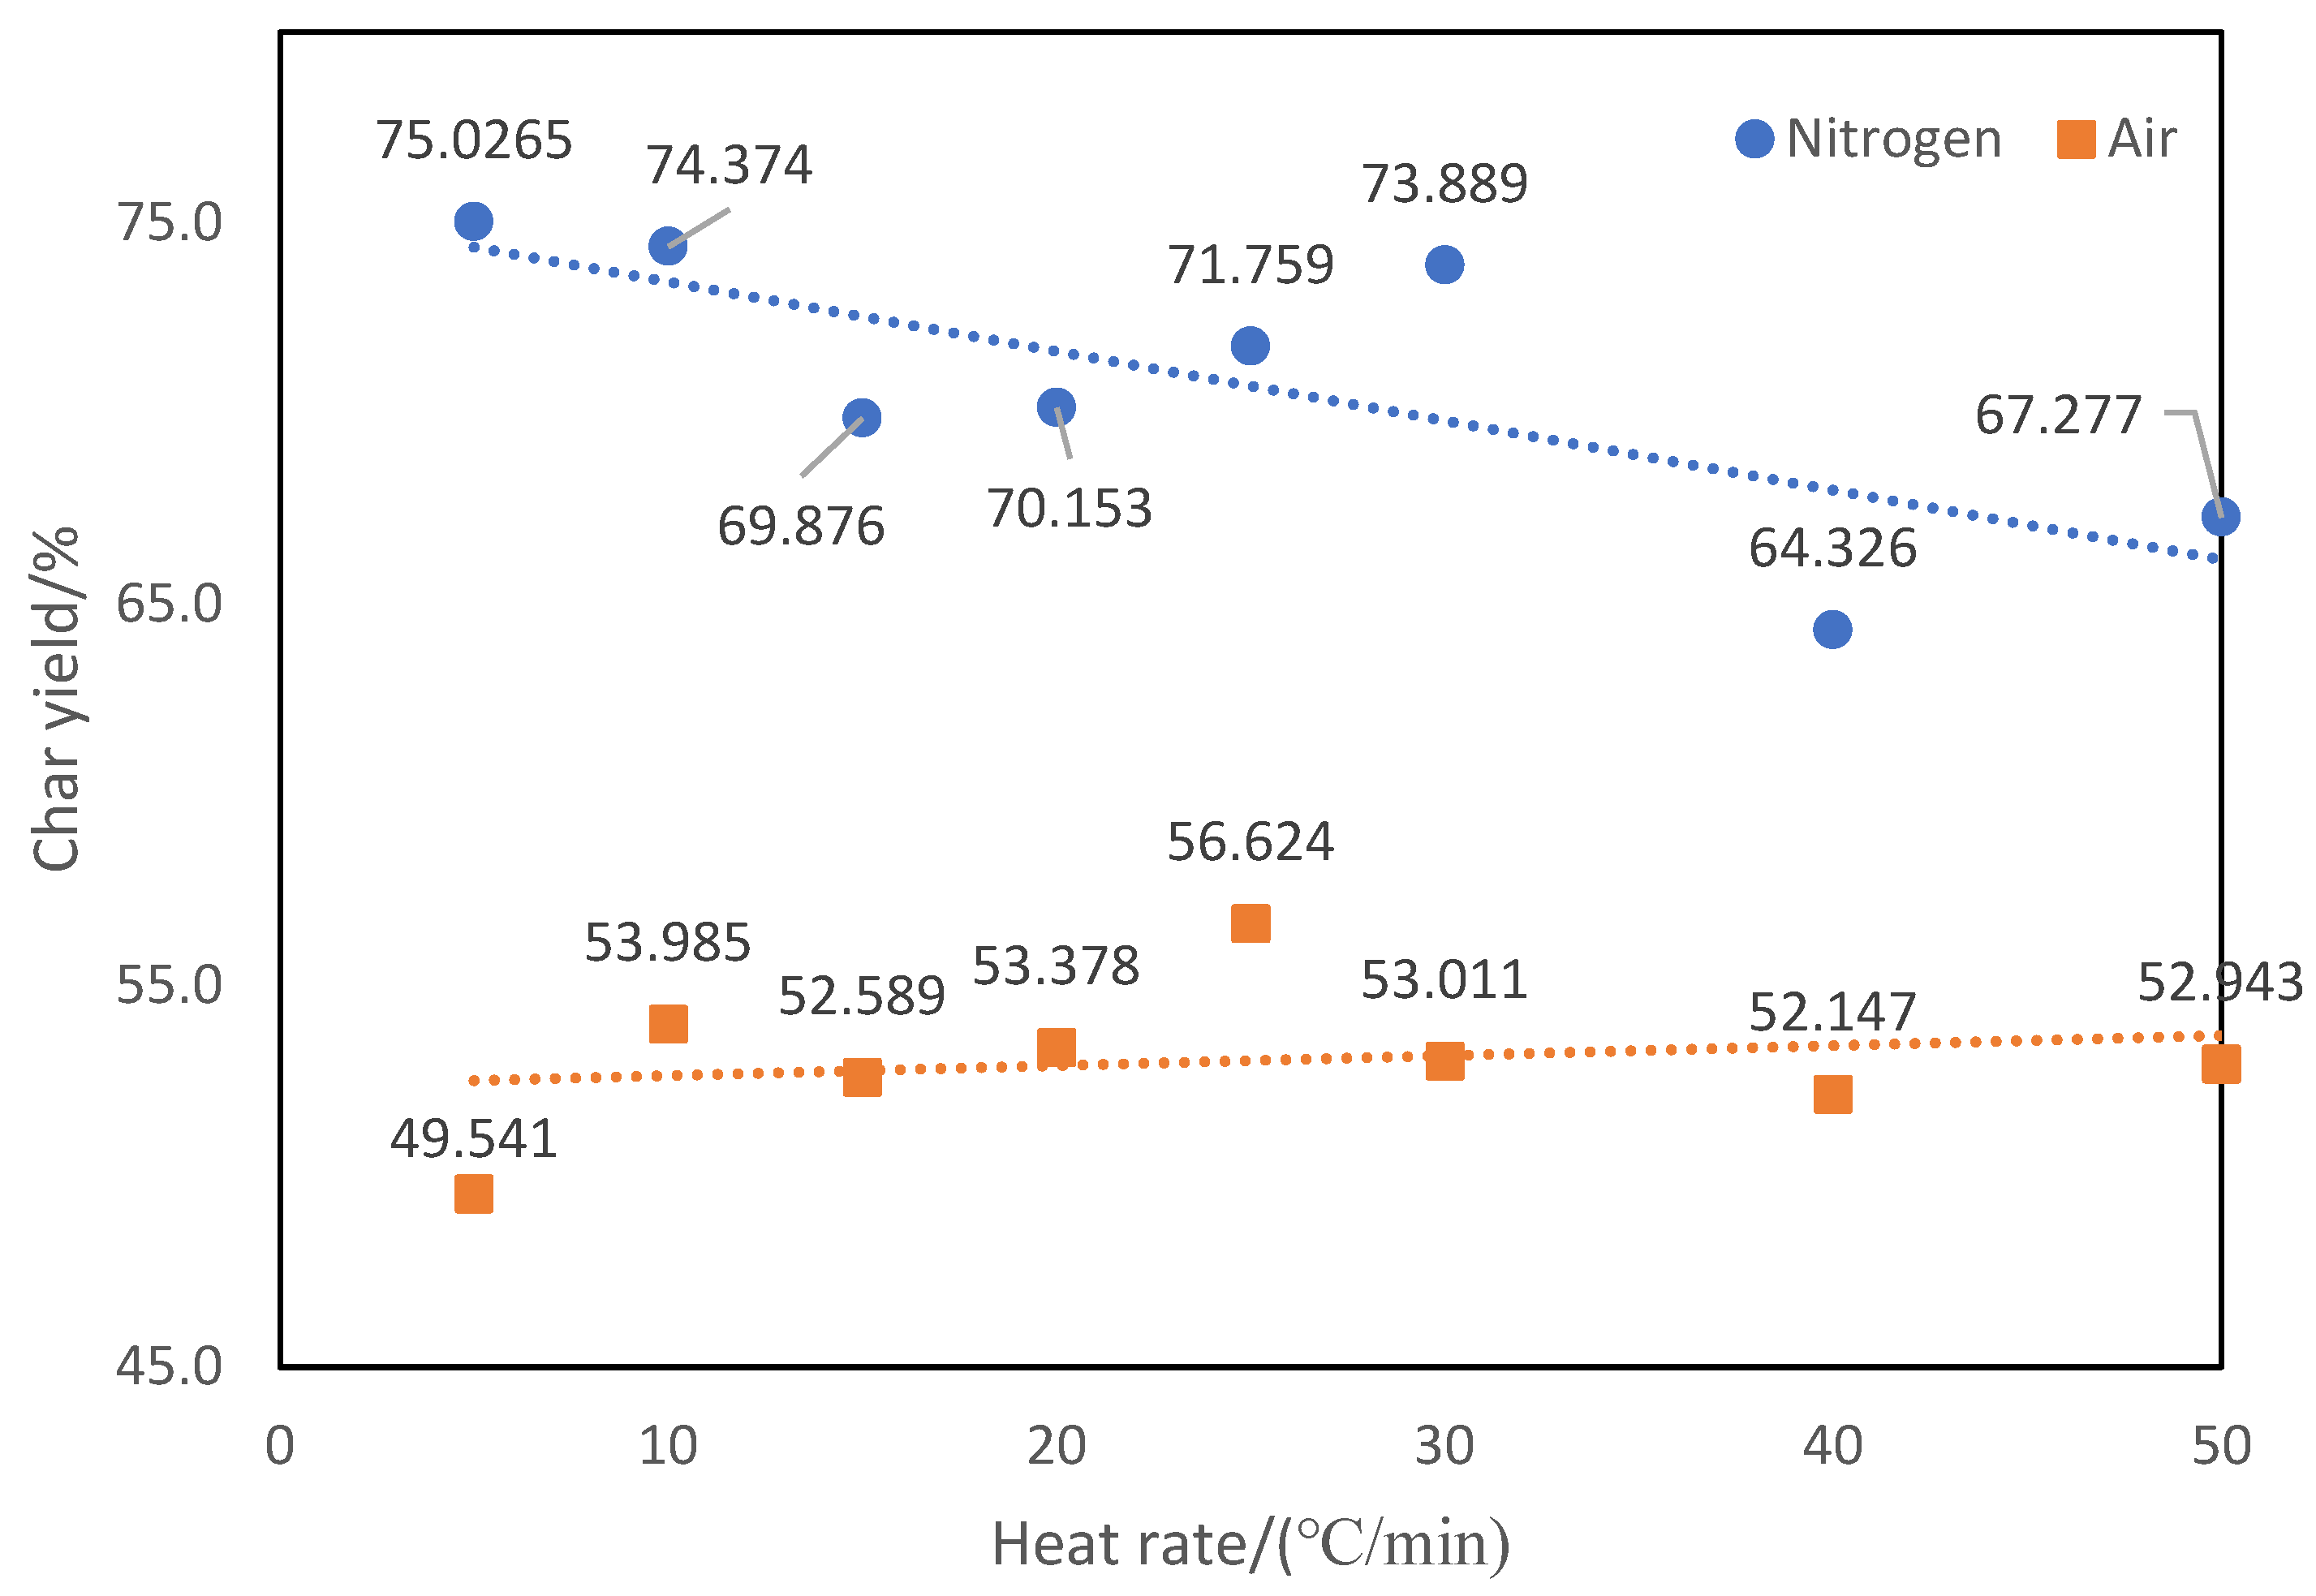
Figure 6.
Degradation rate for different stages of thermal decomposition of ATL-POSS based on TGA tests conducted under nitrogen atmosphere as a function of the heating rate.
Figure 6.
Degradation rate for different stages of thermal decomposition of ATL-POSS based on TGA tests conducted under nitrogen atmosphere as a function of the heating rate.
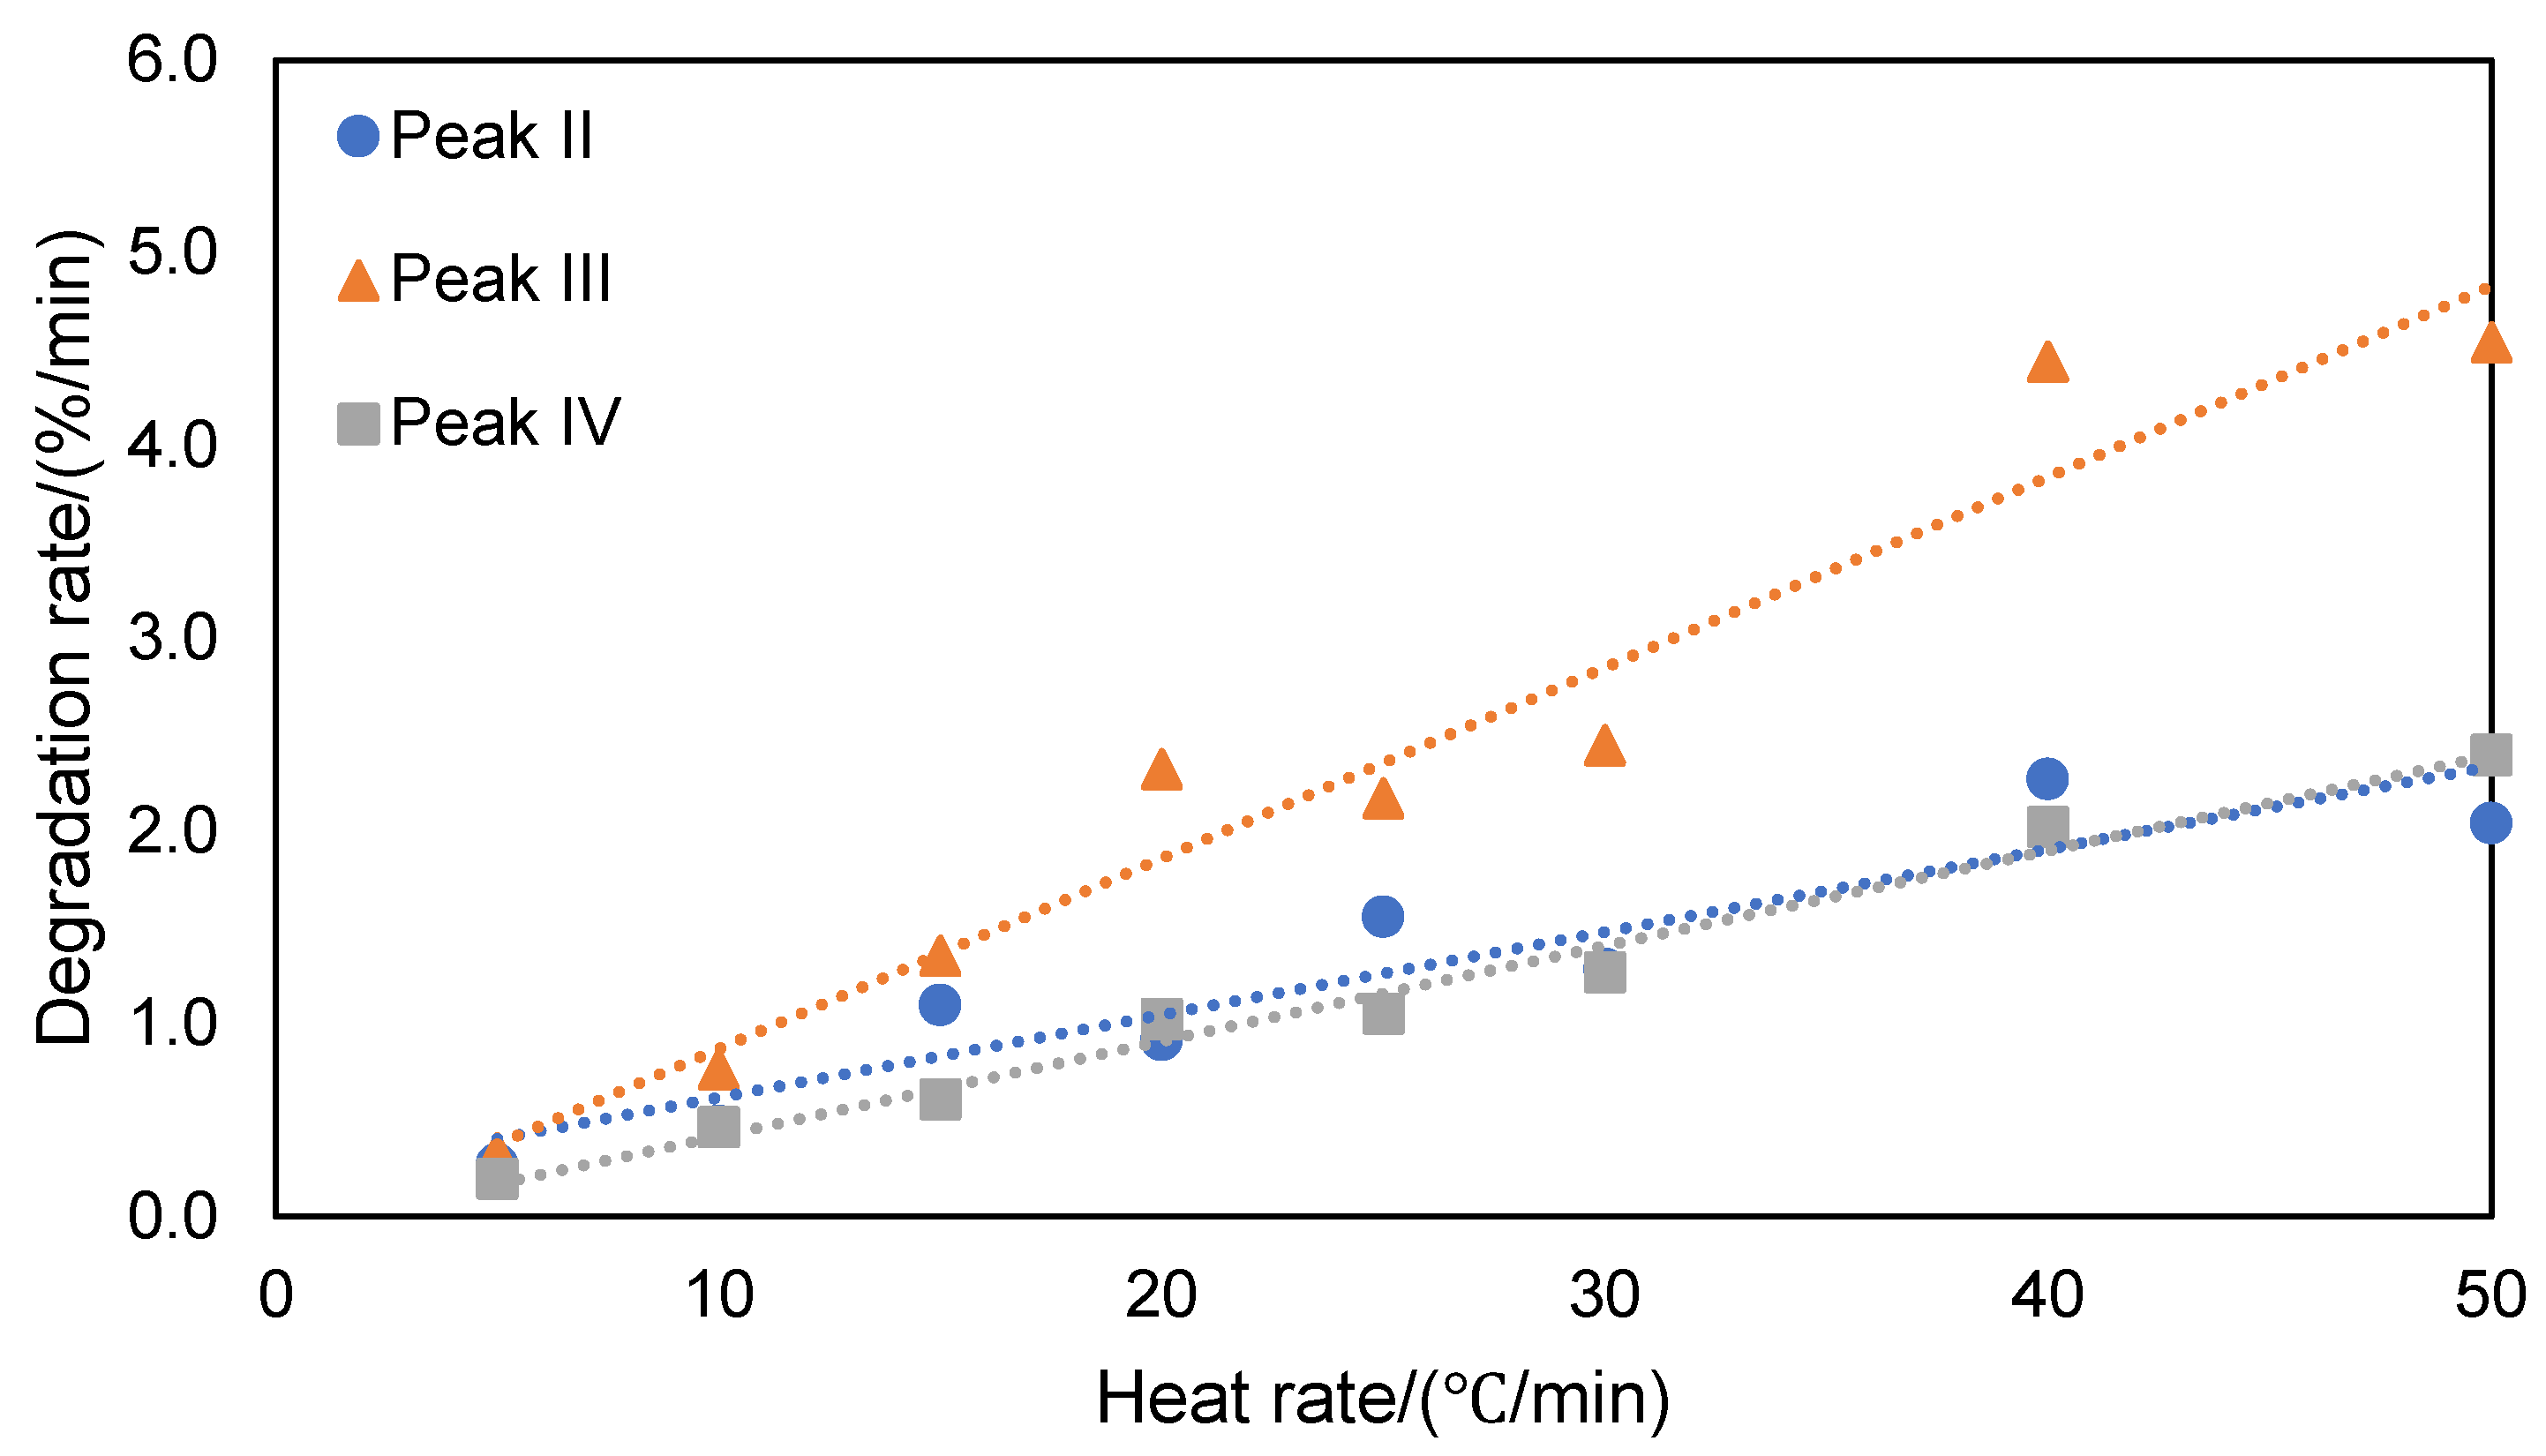
Figure 7.
Degradation rate for different stages of thermal decomposition based on TGA tests conducted under air atmosphere with changing heat rate.
Figure 7.
Degradation rate for different stages of thermal decomposition based on TGA tests conducted under air atmosphere with changing heat rate.
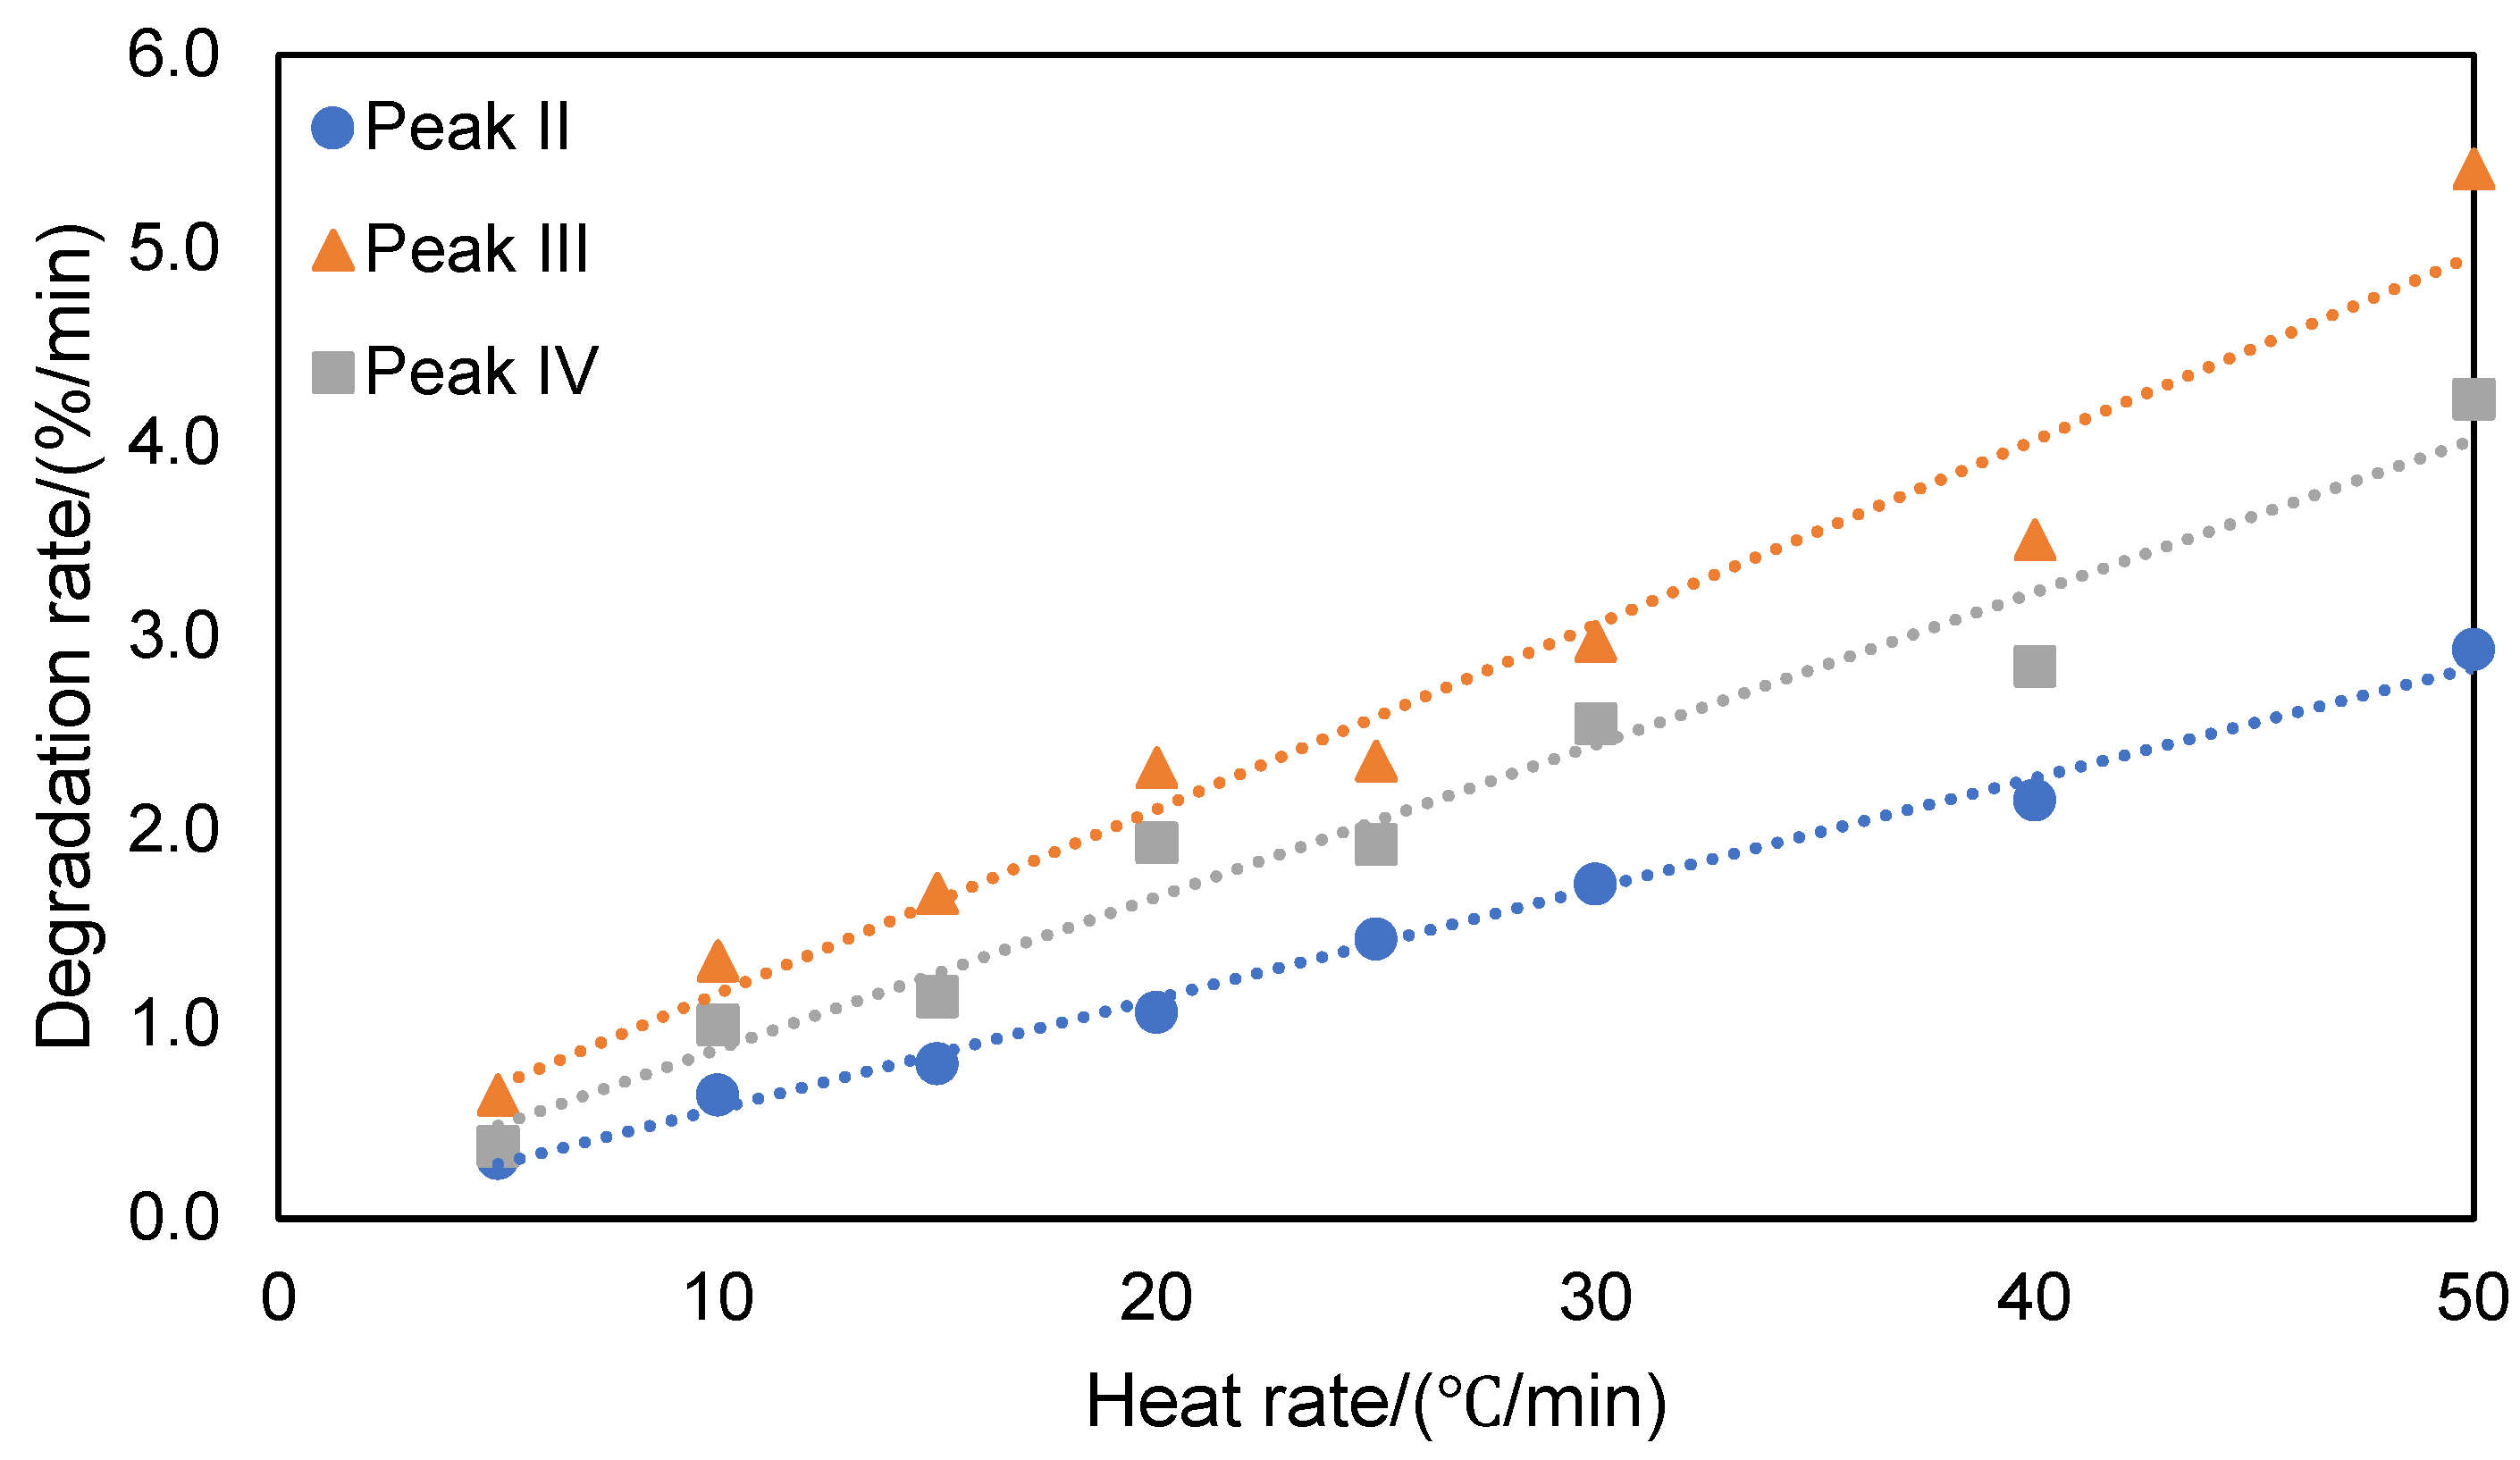
Figure 8.
Analysis using the KAS model (nitrogen) for activation energy calculation.
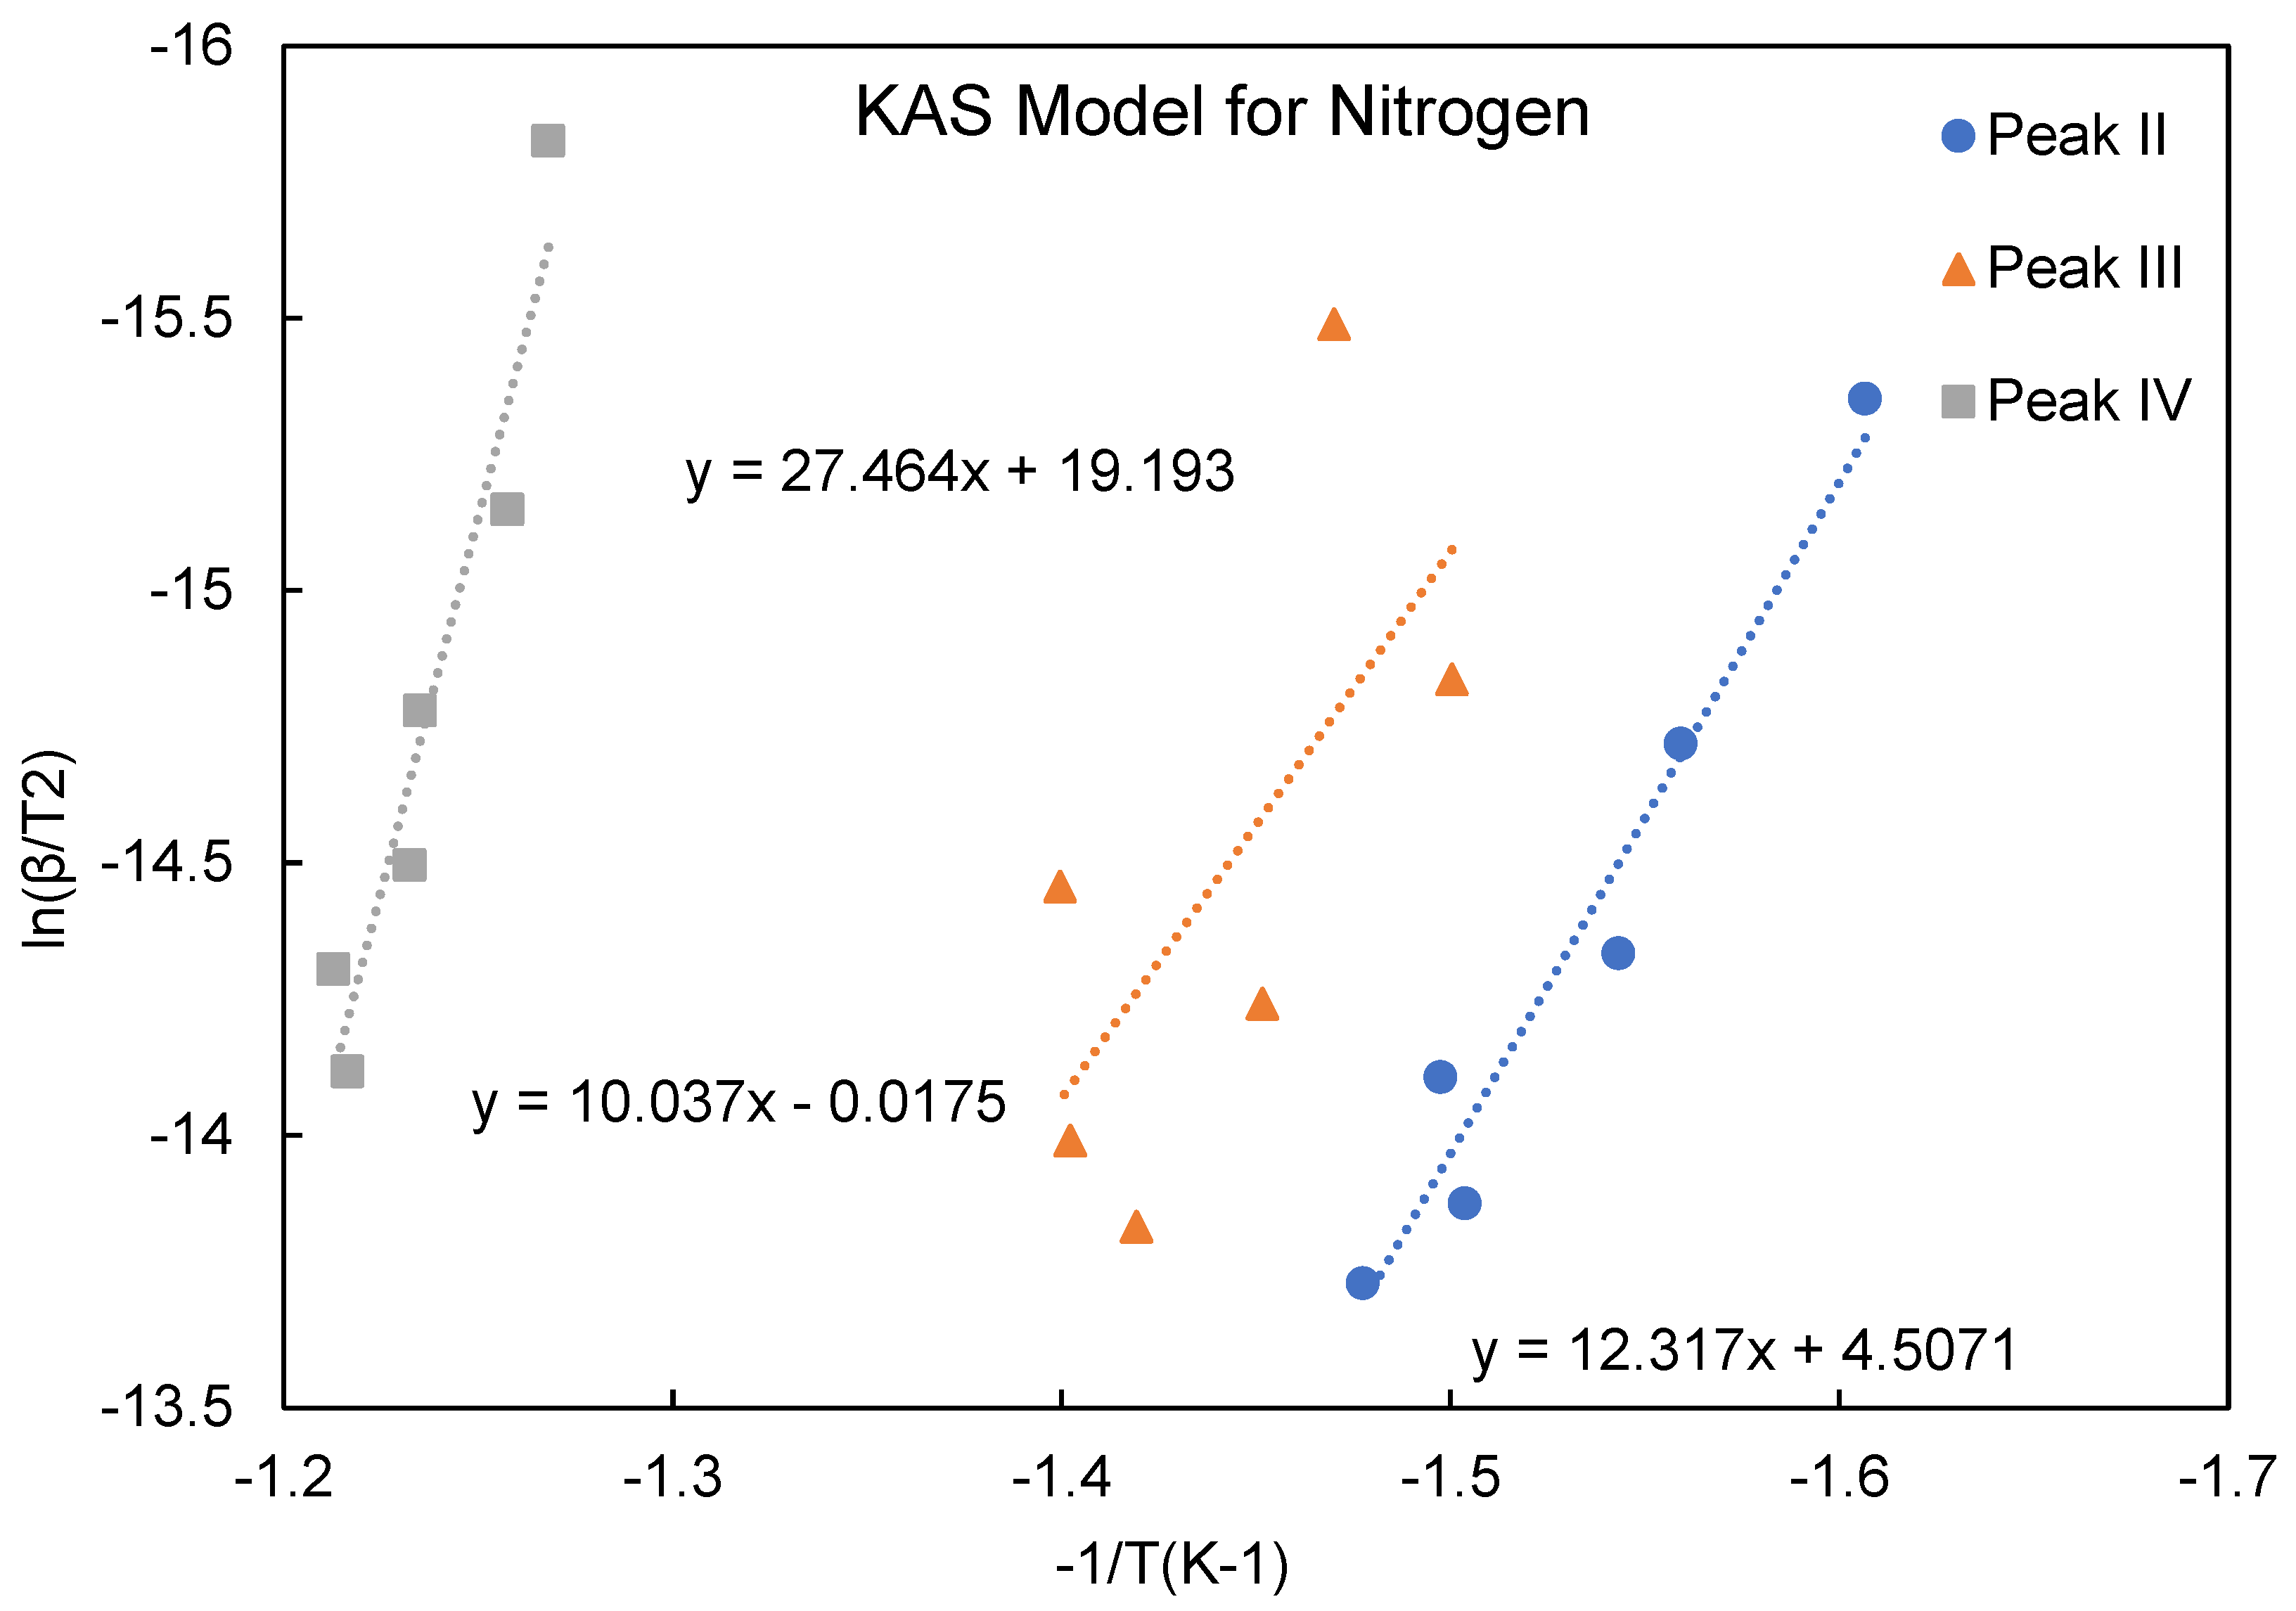
Figure 9.
Analysis using the KAS model (air) for activation energy calculation.
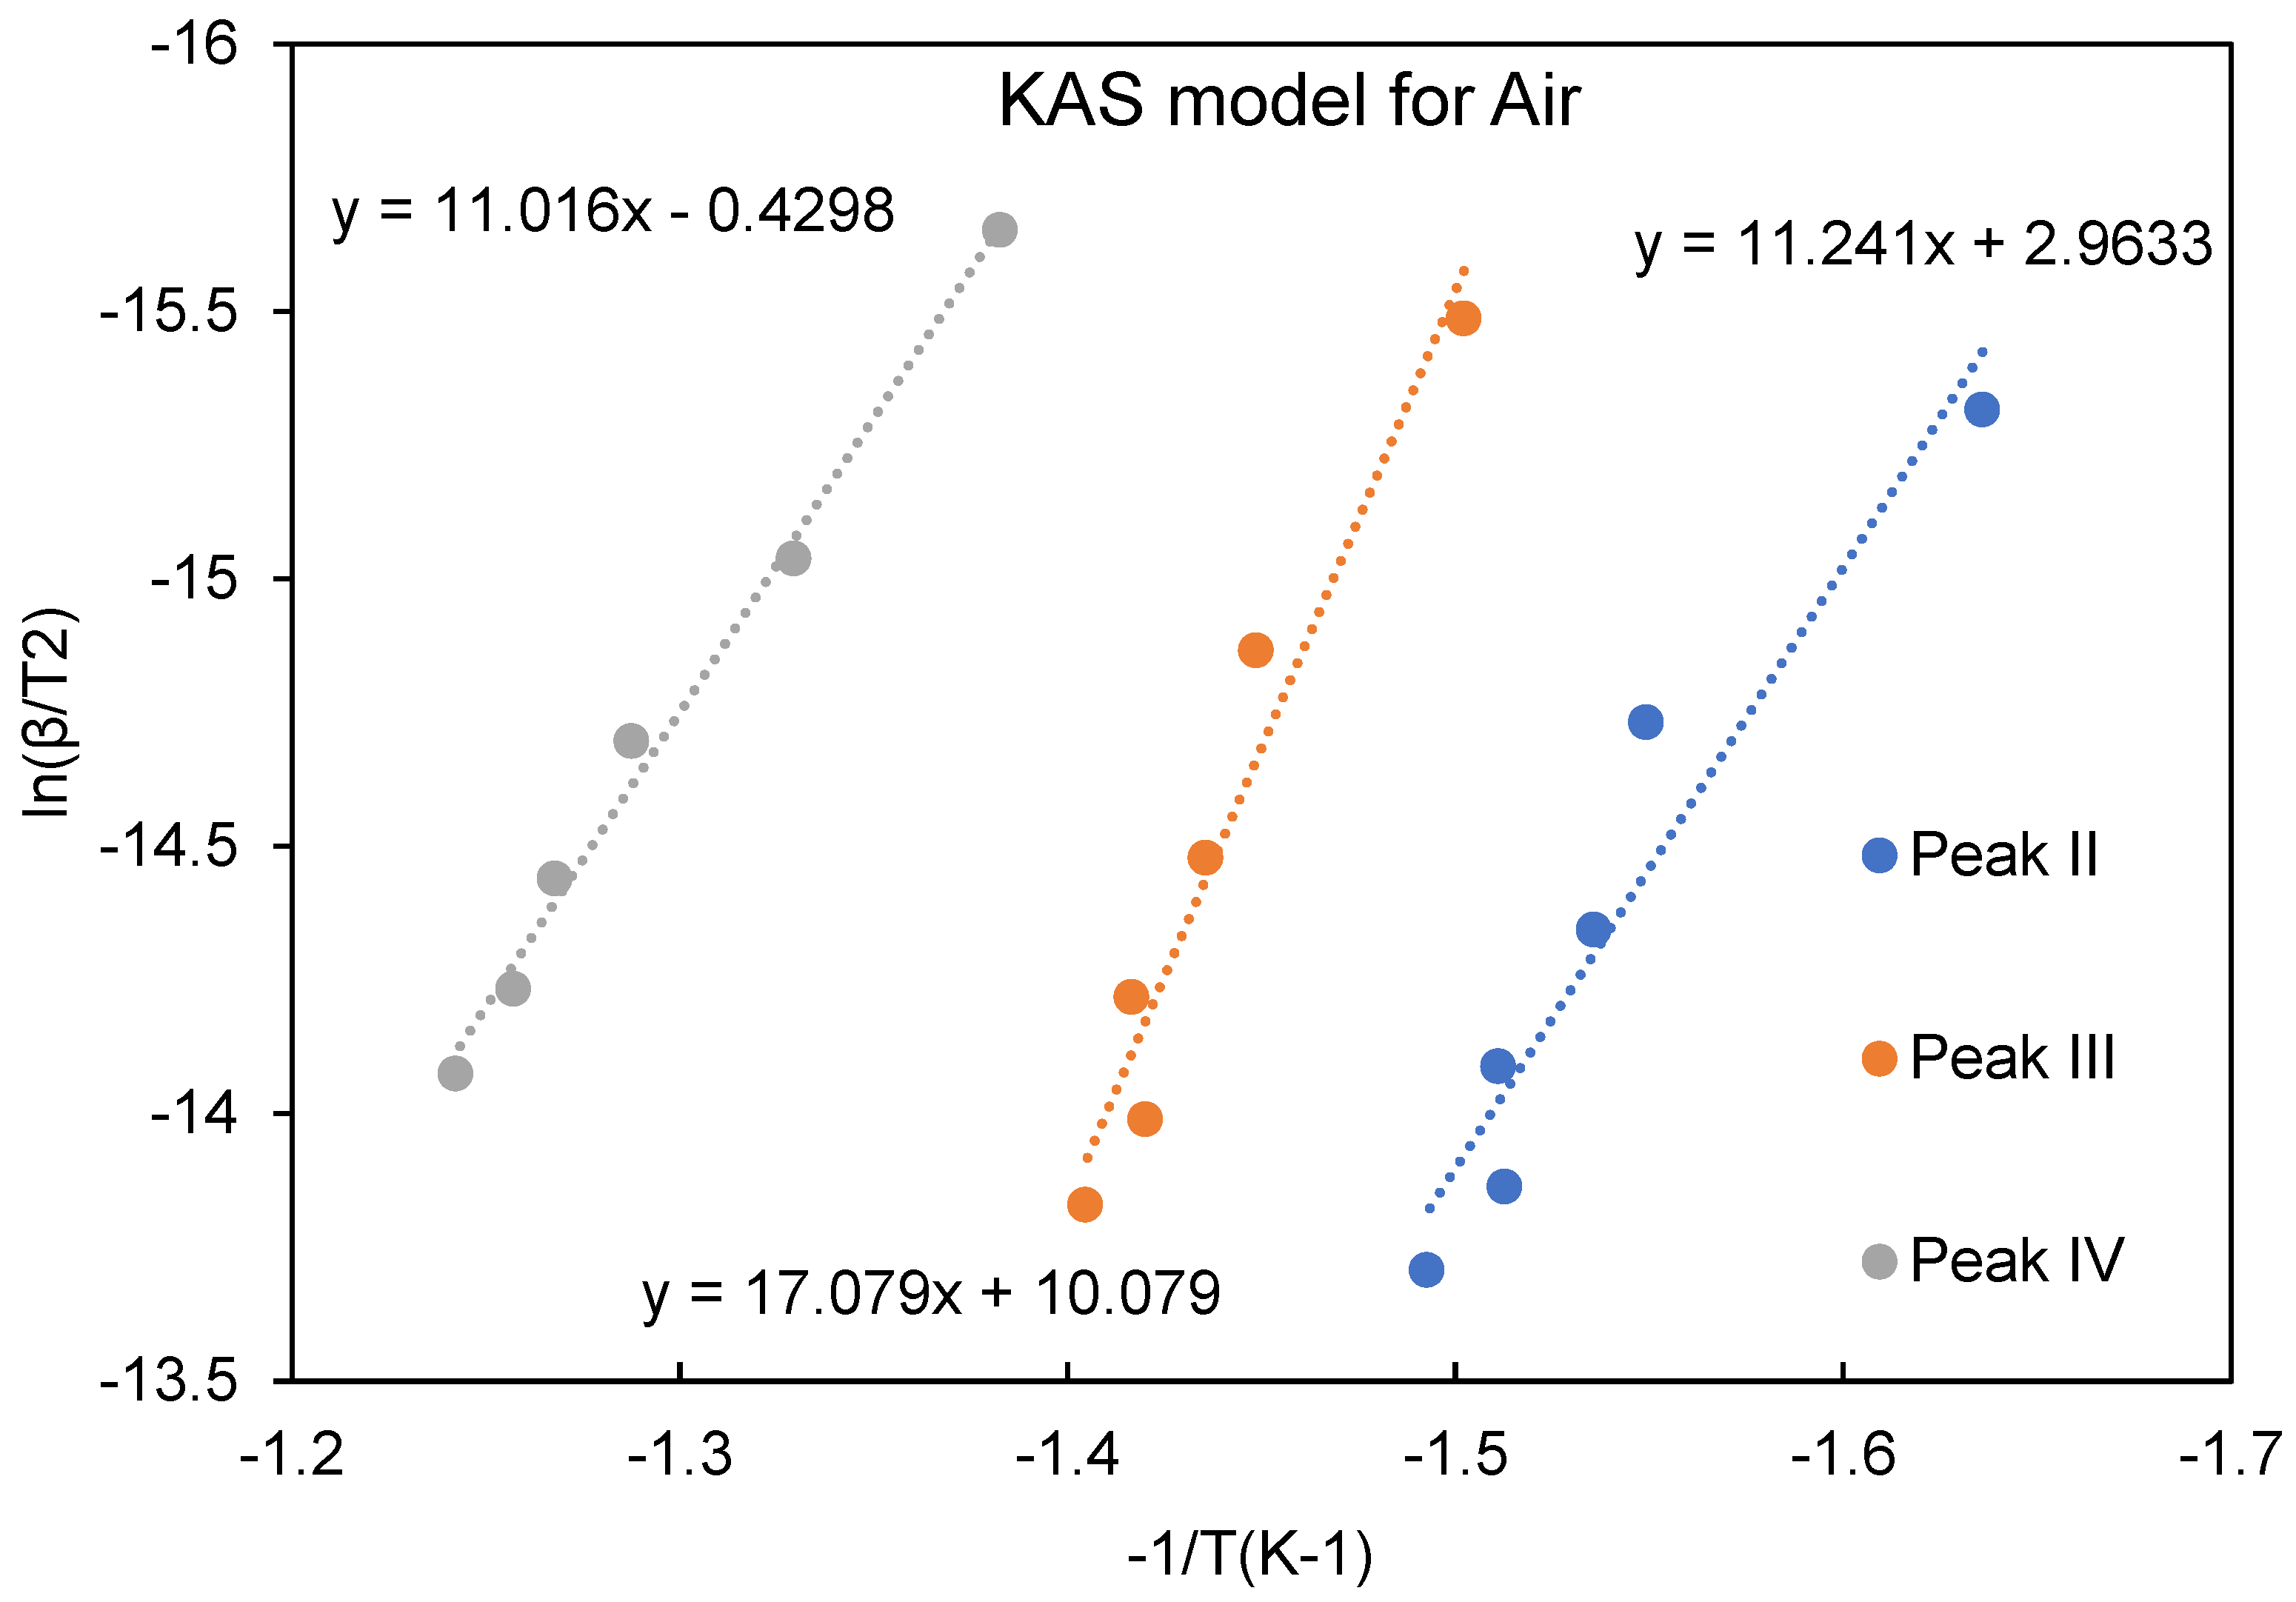
Figure 10.
DSC thermograms for ATL-POSS overlaid with derivative curves from TGA, under nitrogen atmosphere at a heating rate of 10℃/min, (a) 100-300℃ cycle; (b) 100-700℃ cycles.
Figure 10.
DSC thermograms for ATL-POSS overlaid with derivative curves from TGA, under nitrogen atmosphere at a heating rate of 10℃/min, (a) 100-300℃ cycle; (b) 100-700℃ cycles.
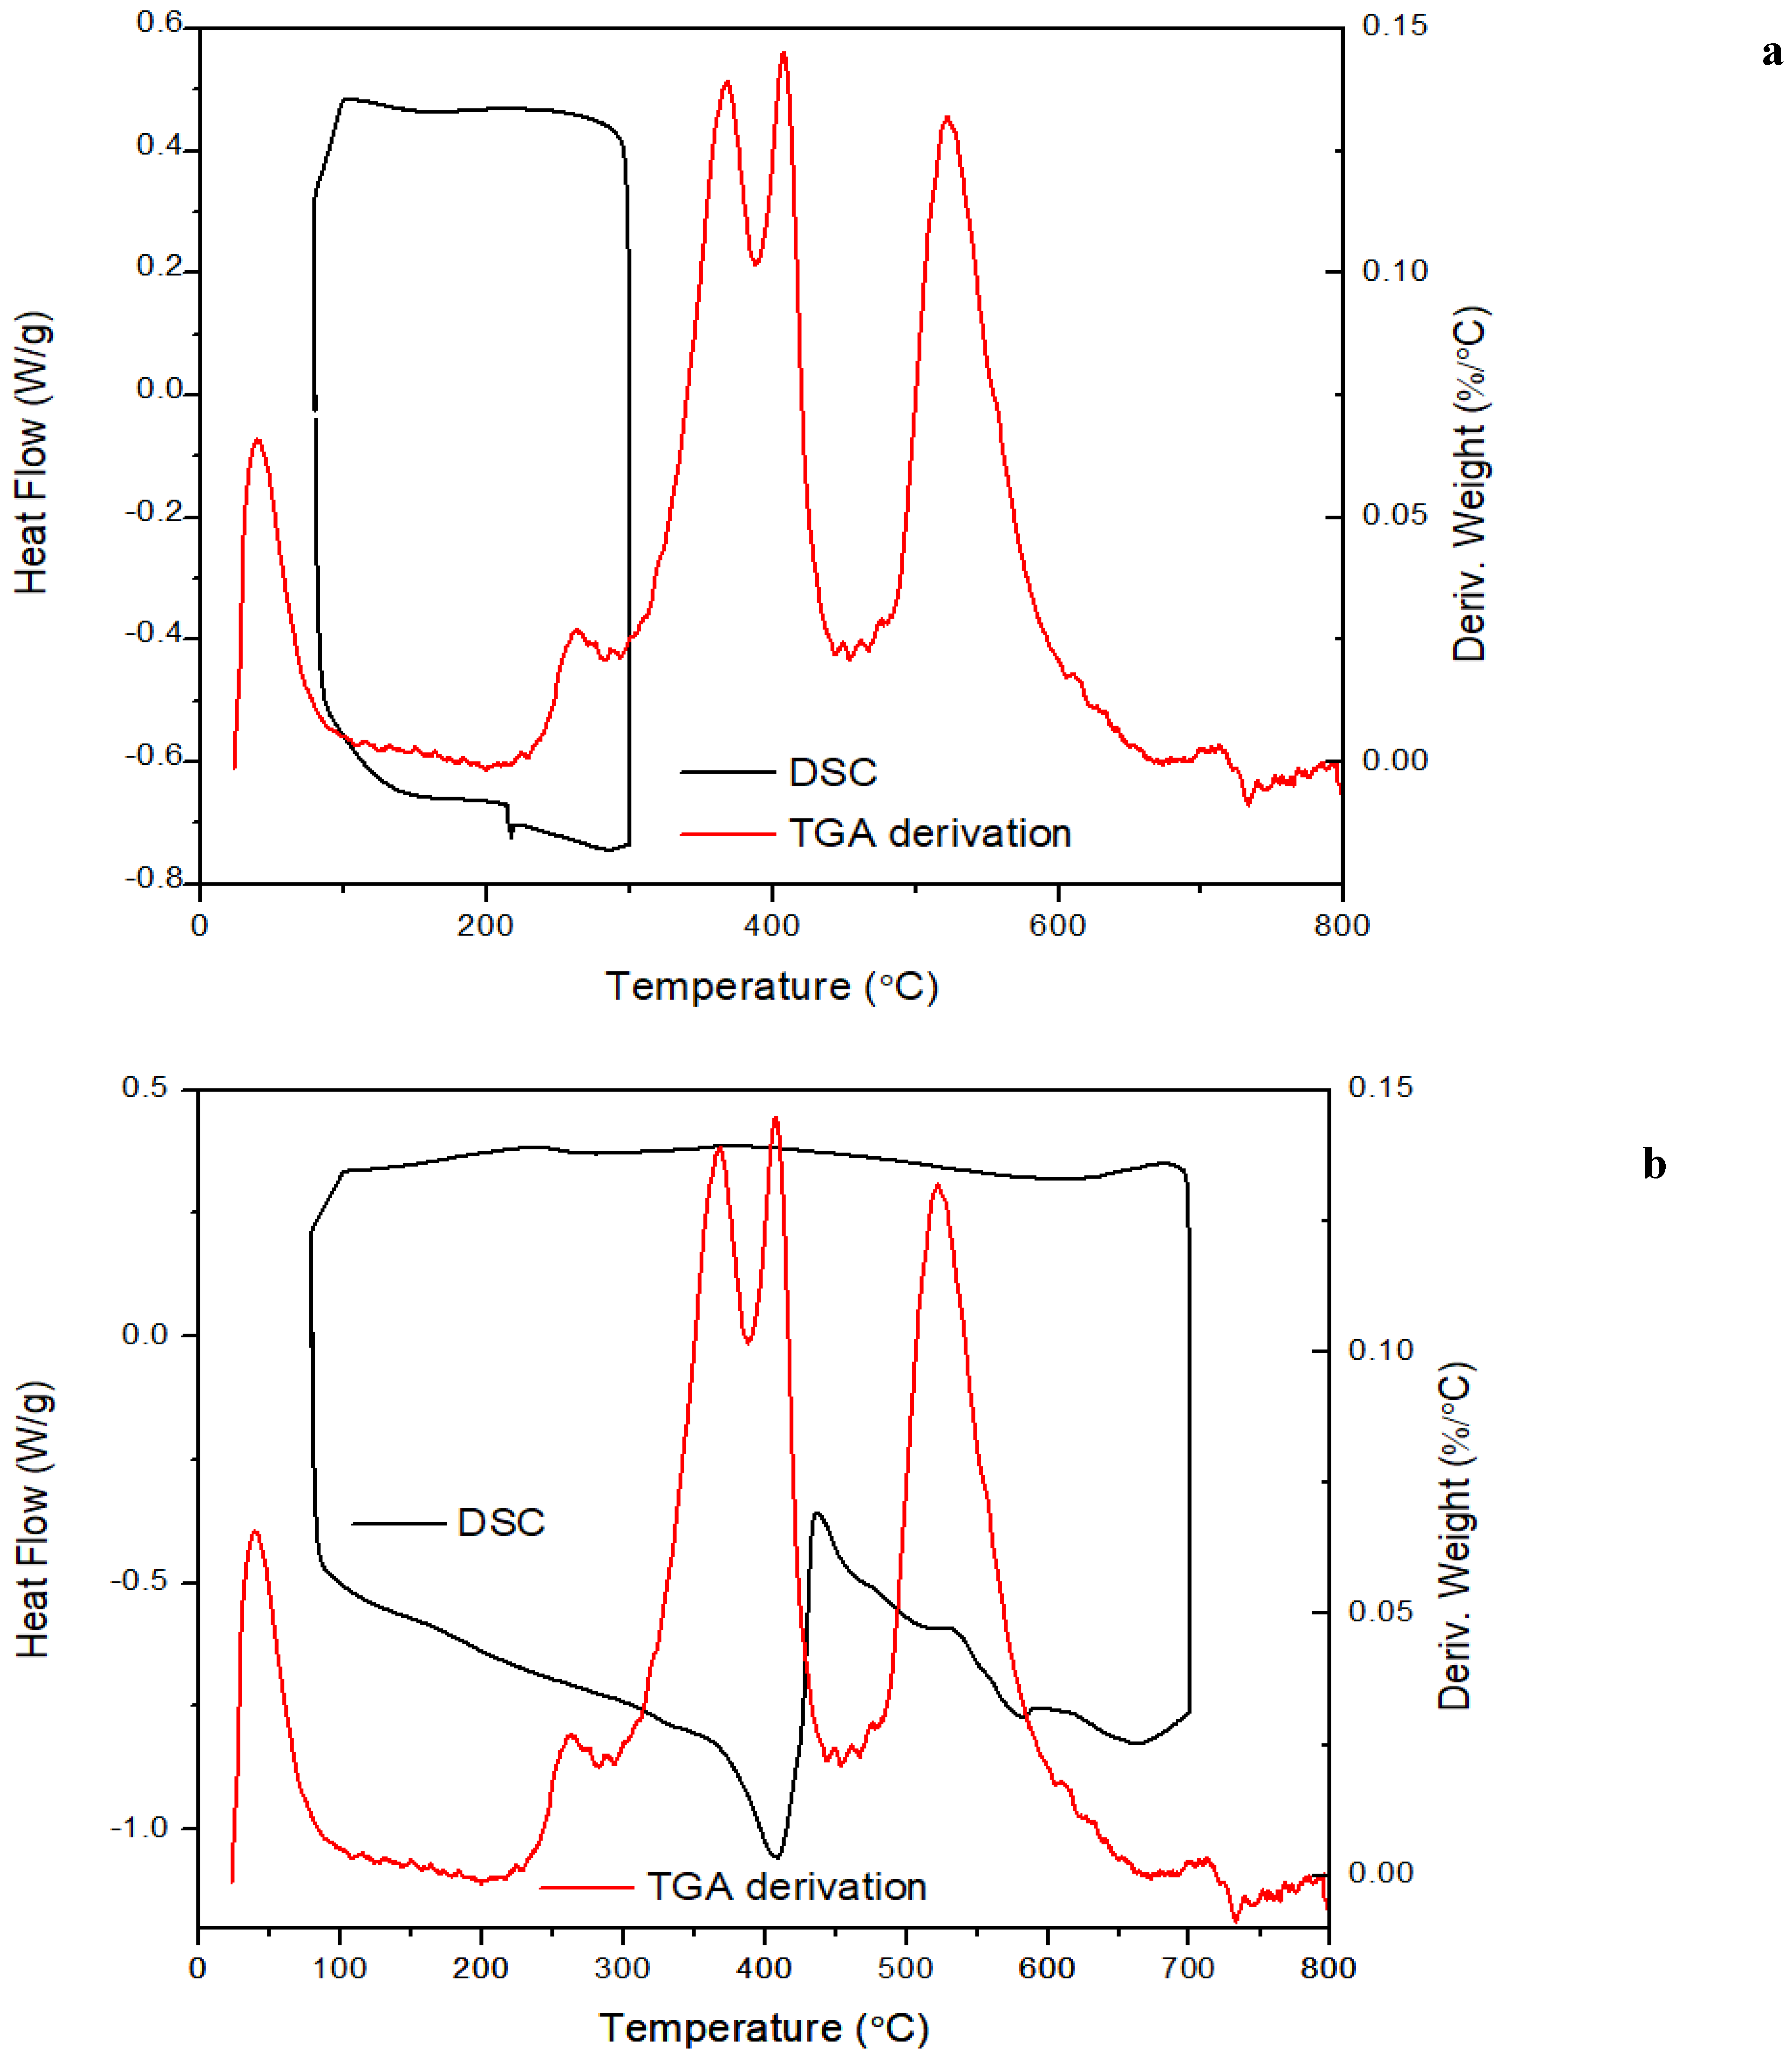
Figure 11.
FT-IR spectra of ATL-POSS.
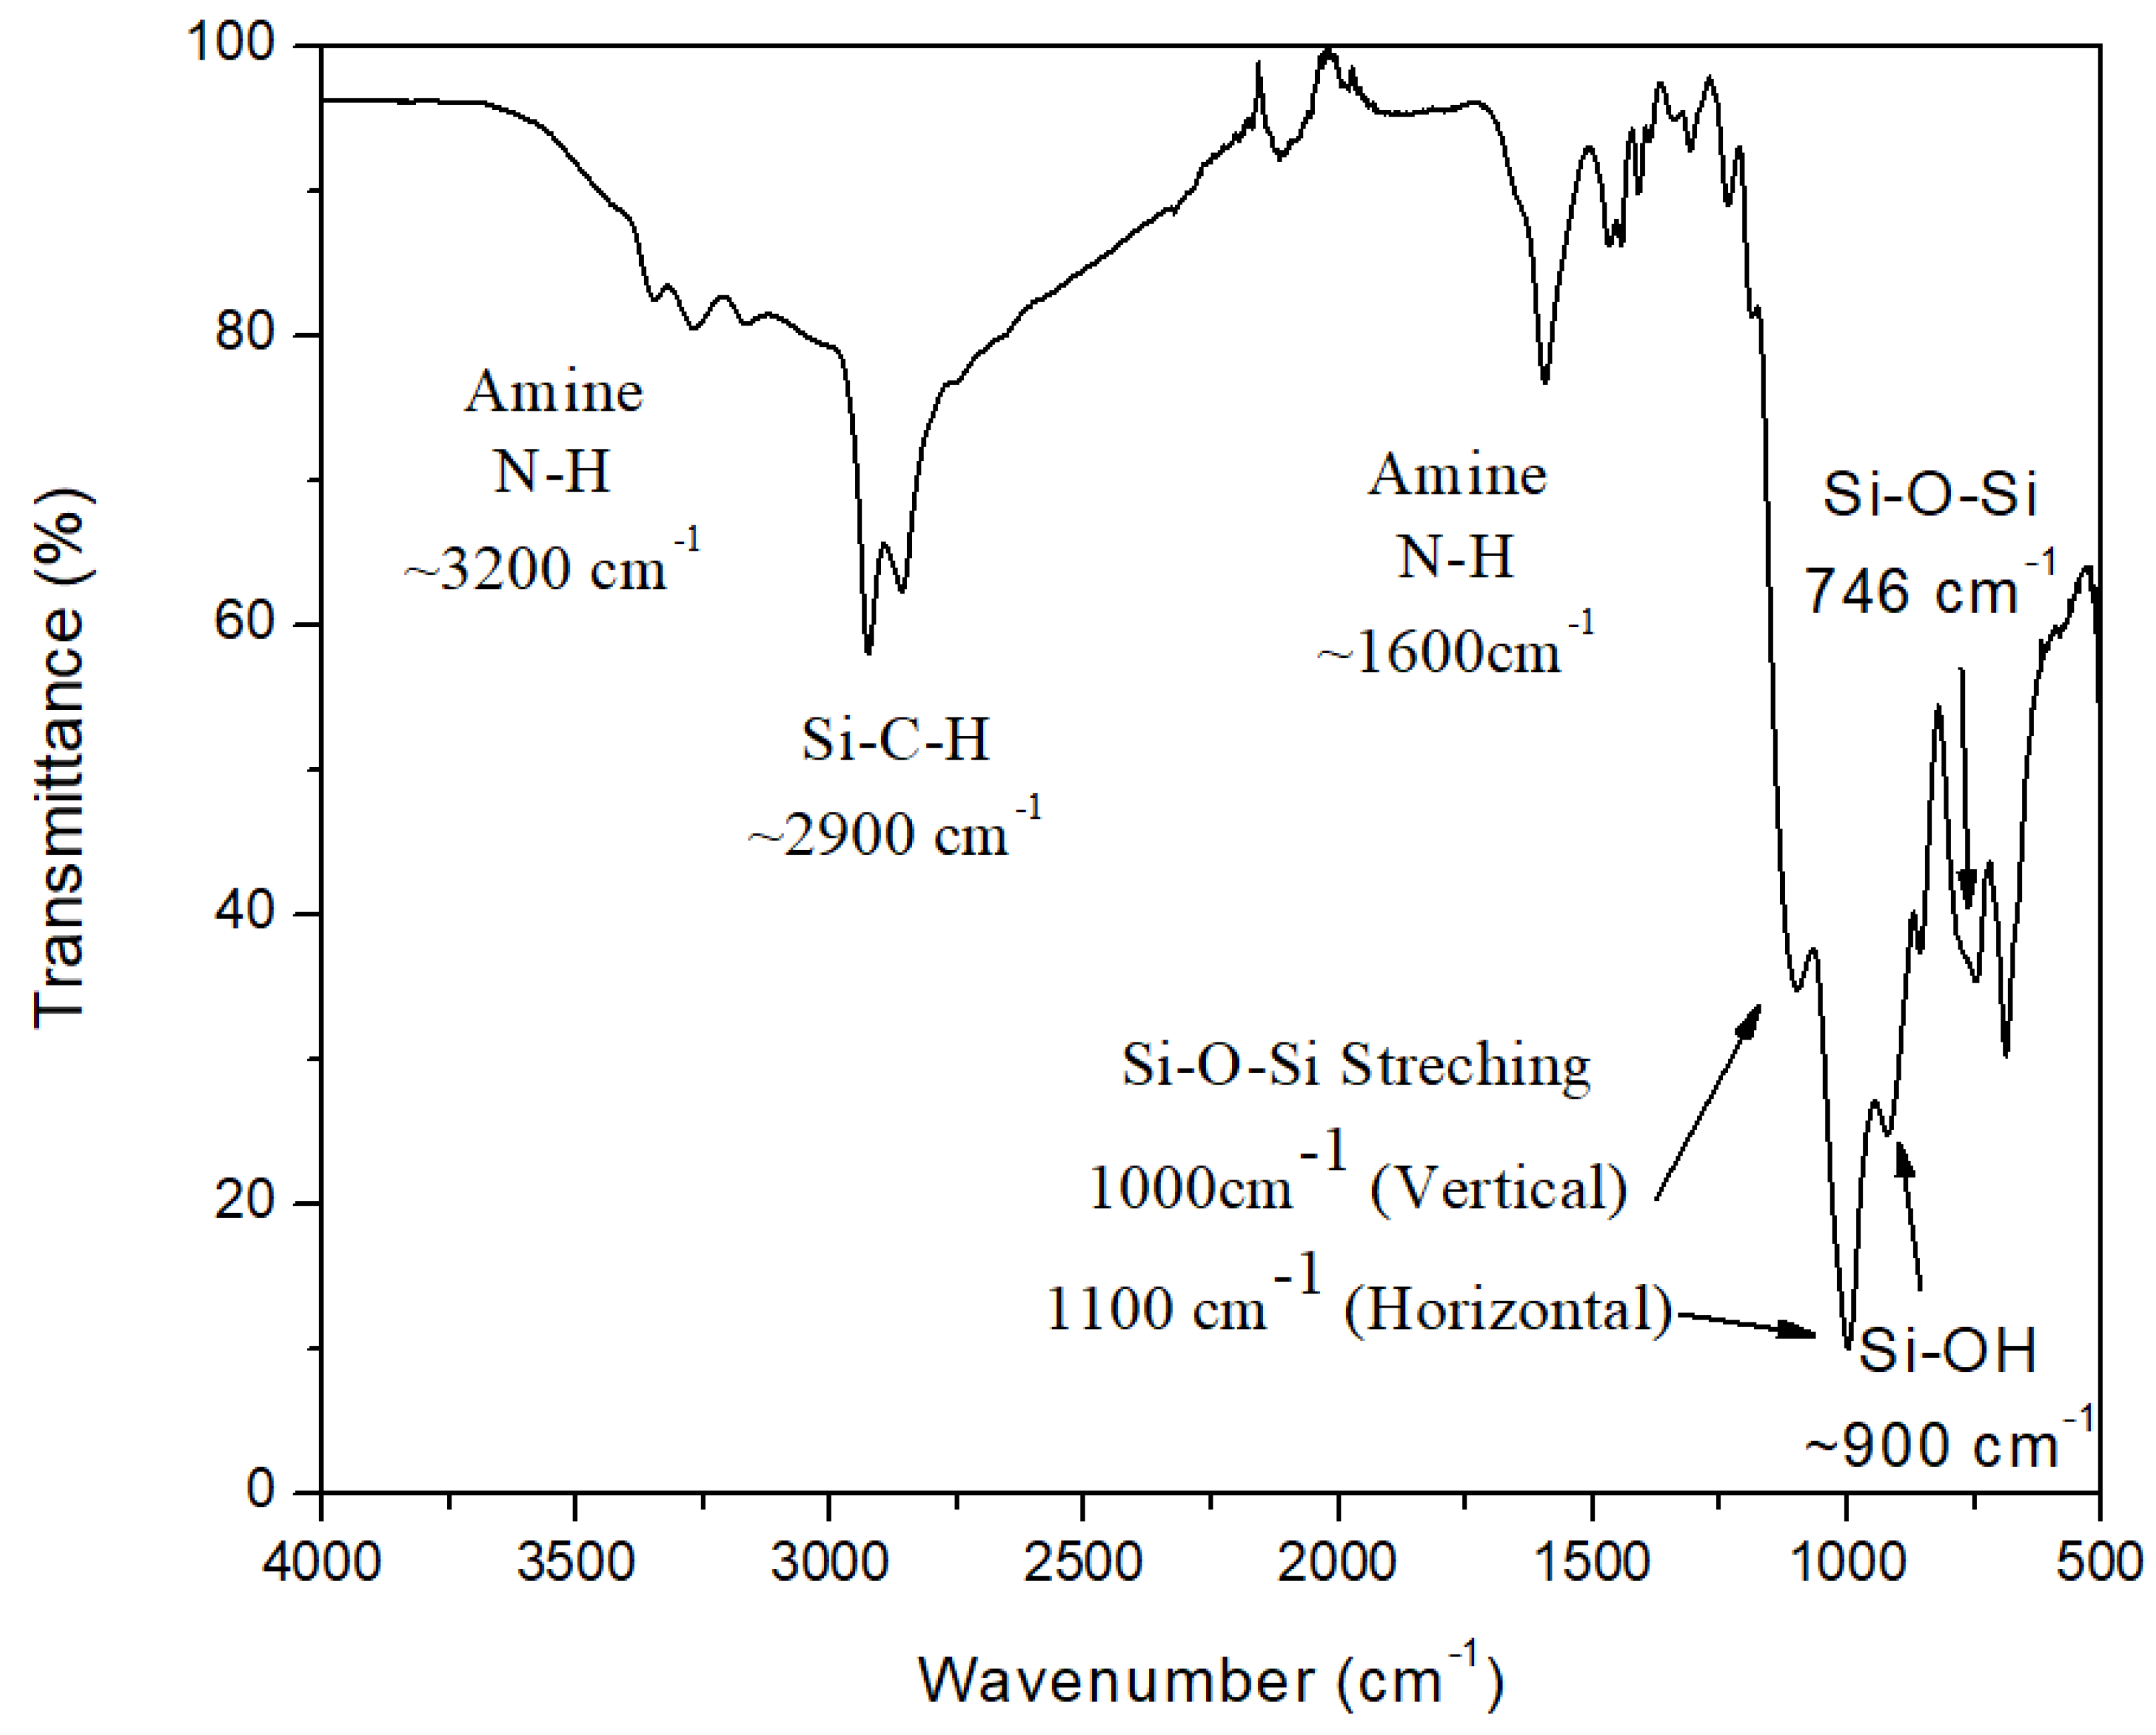
Figure 12.
Analysis of the FT-IR data of ATL-POSS, showing changes in the transmittance intensities for the wavenumbers, 2900, 1600, 1000, and 780 cm−1 as a function of testing (curing) temperatures: (a) 100℃ to 300 ℃ and (b) 350℃ to 600℃ for ATL-POSS cured in nitrogen atmosphere.
Figure 12.
Analysis of the FT-IR data of ATL-POSS, showing changes in the transmittance intensities for the wavenumbers, 2900, 1600, 1000, and 780 cm−1 as a function of testing (curing) temperatures: (a) 100℃ to 300 ℃ and (b) 350℃ to 600℃ for ATL-POSS cured in nitrogen atmosphere.
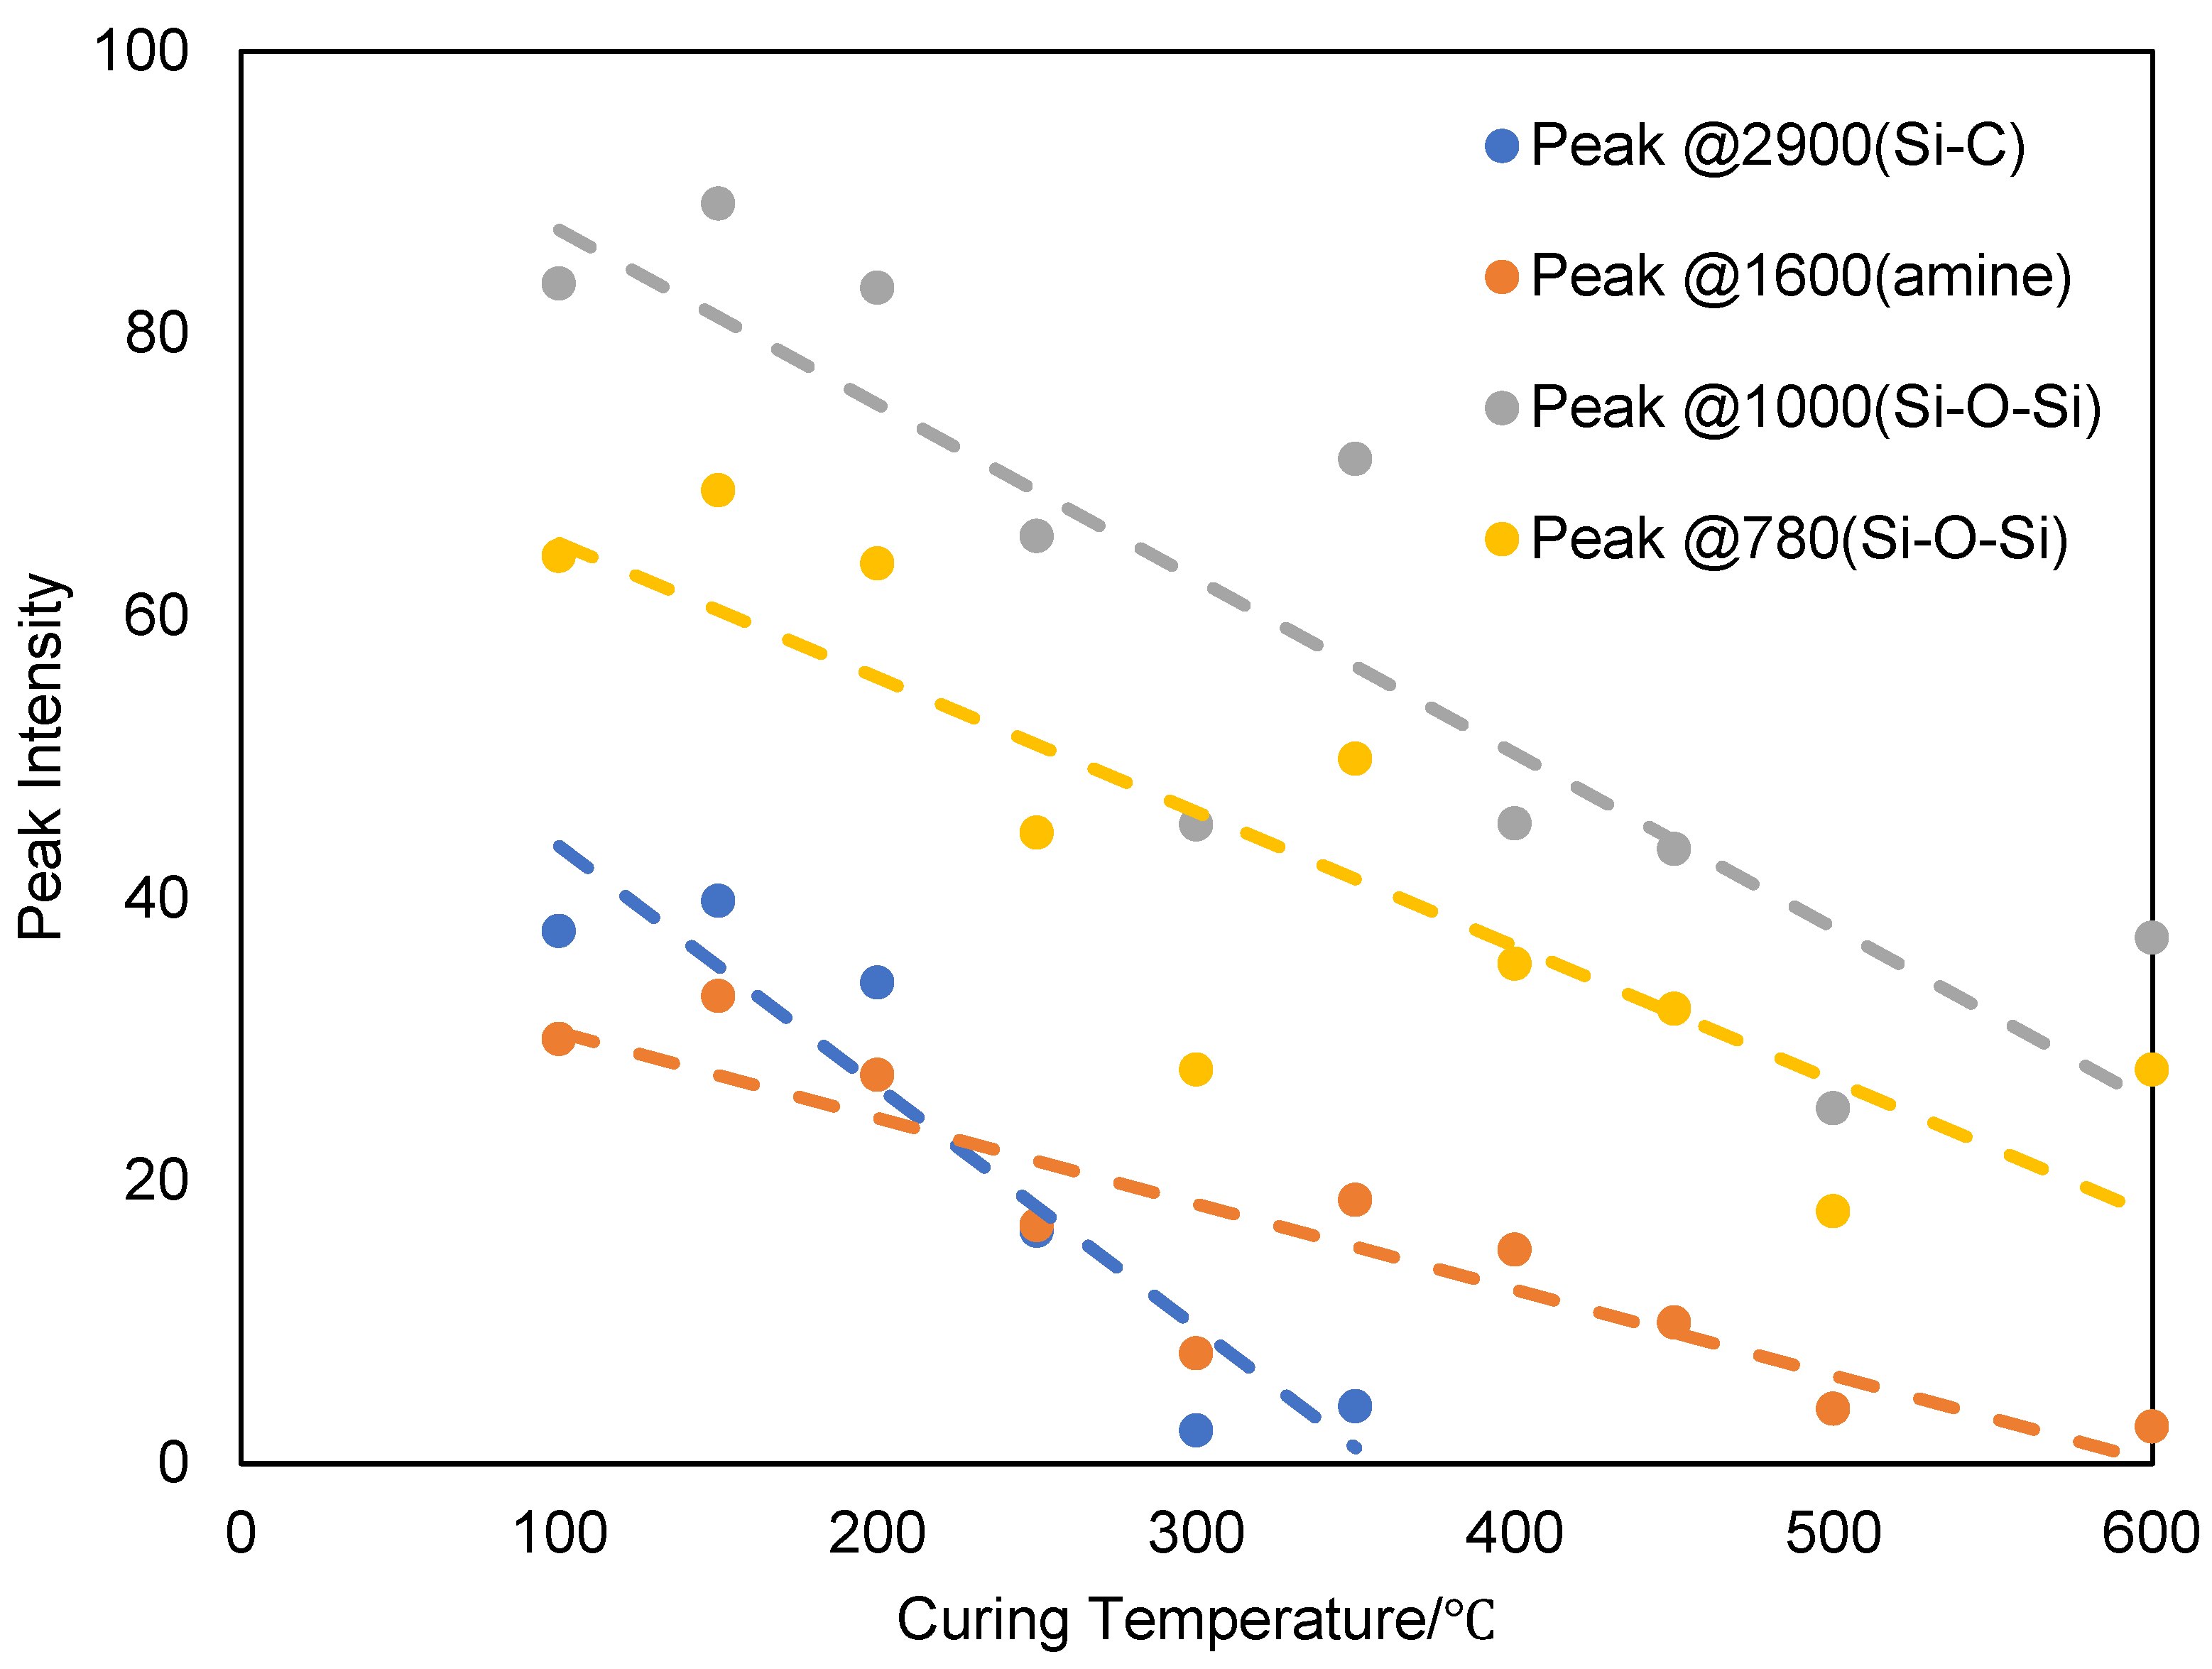
Figure 13.
Analysis of the FT-IR data of ATL-POSS, showing changes in the transmittance intensities for the wavenumbers, 2900, 1600, 1000, and 780 cm−1 as a function of testing (curing) temperatures: (a) 100℃ to 300 ℃ and (b) 350℃ to 600℃, for ATL-POSS cured in air atmosphere.
Figure 13.
Analysis of the FT-IR data of ATL-POSS, showing changes in the transmittance intensities for the wavenumbers, 2900, 1600, 1000, and 780 cm−1 as a function of testing (curing) temperatures: (a) 100℃ to 300 ℃ and (b) 350℃ to 600℃, for ATL-POSS cured in air atmosphere.
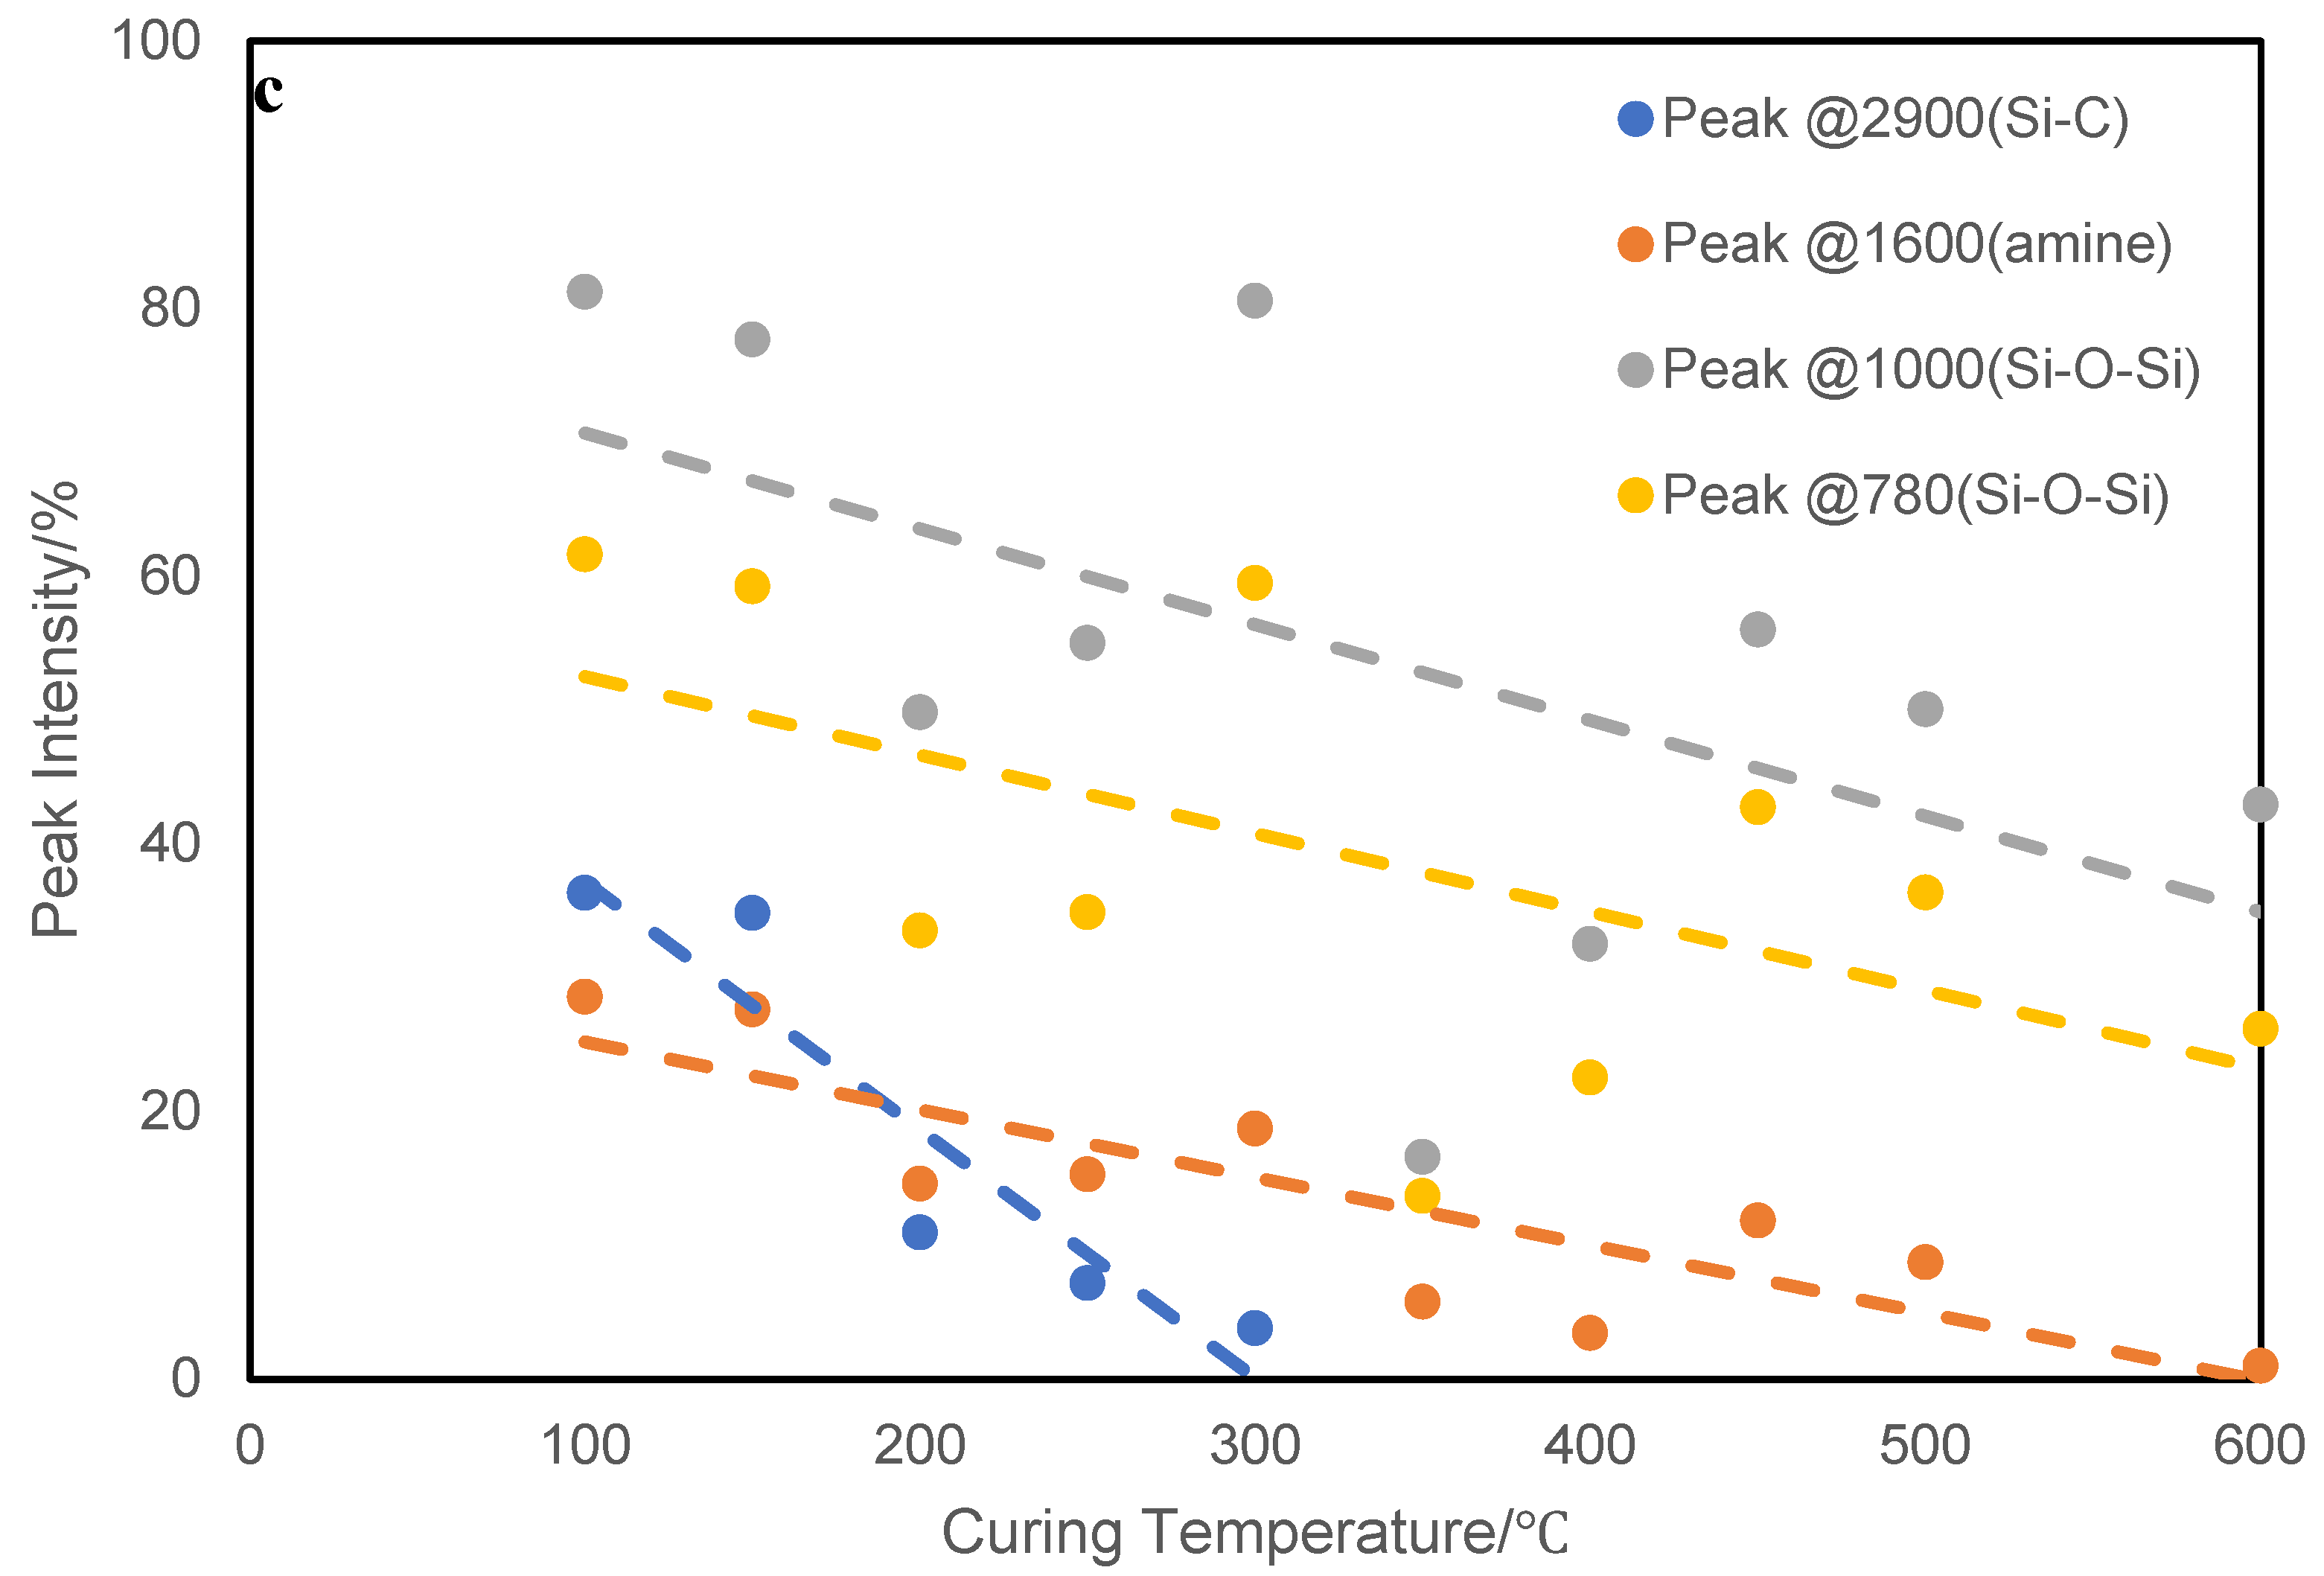
Figure 14.
FTIR spectra indicating the disappearance of Si-OH transmittance peak shoulder at (~900 cm−1) between 100 and 250℃ in nitrogen (left) and air (right).
Figure 14.
FTIR spectra indicating the disappearance of Si-OH transmittance peak shoulder at (~900 cm−1) between 100 and 250℃ in nitrogen (left) and air (right).
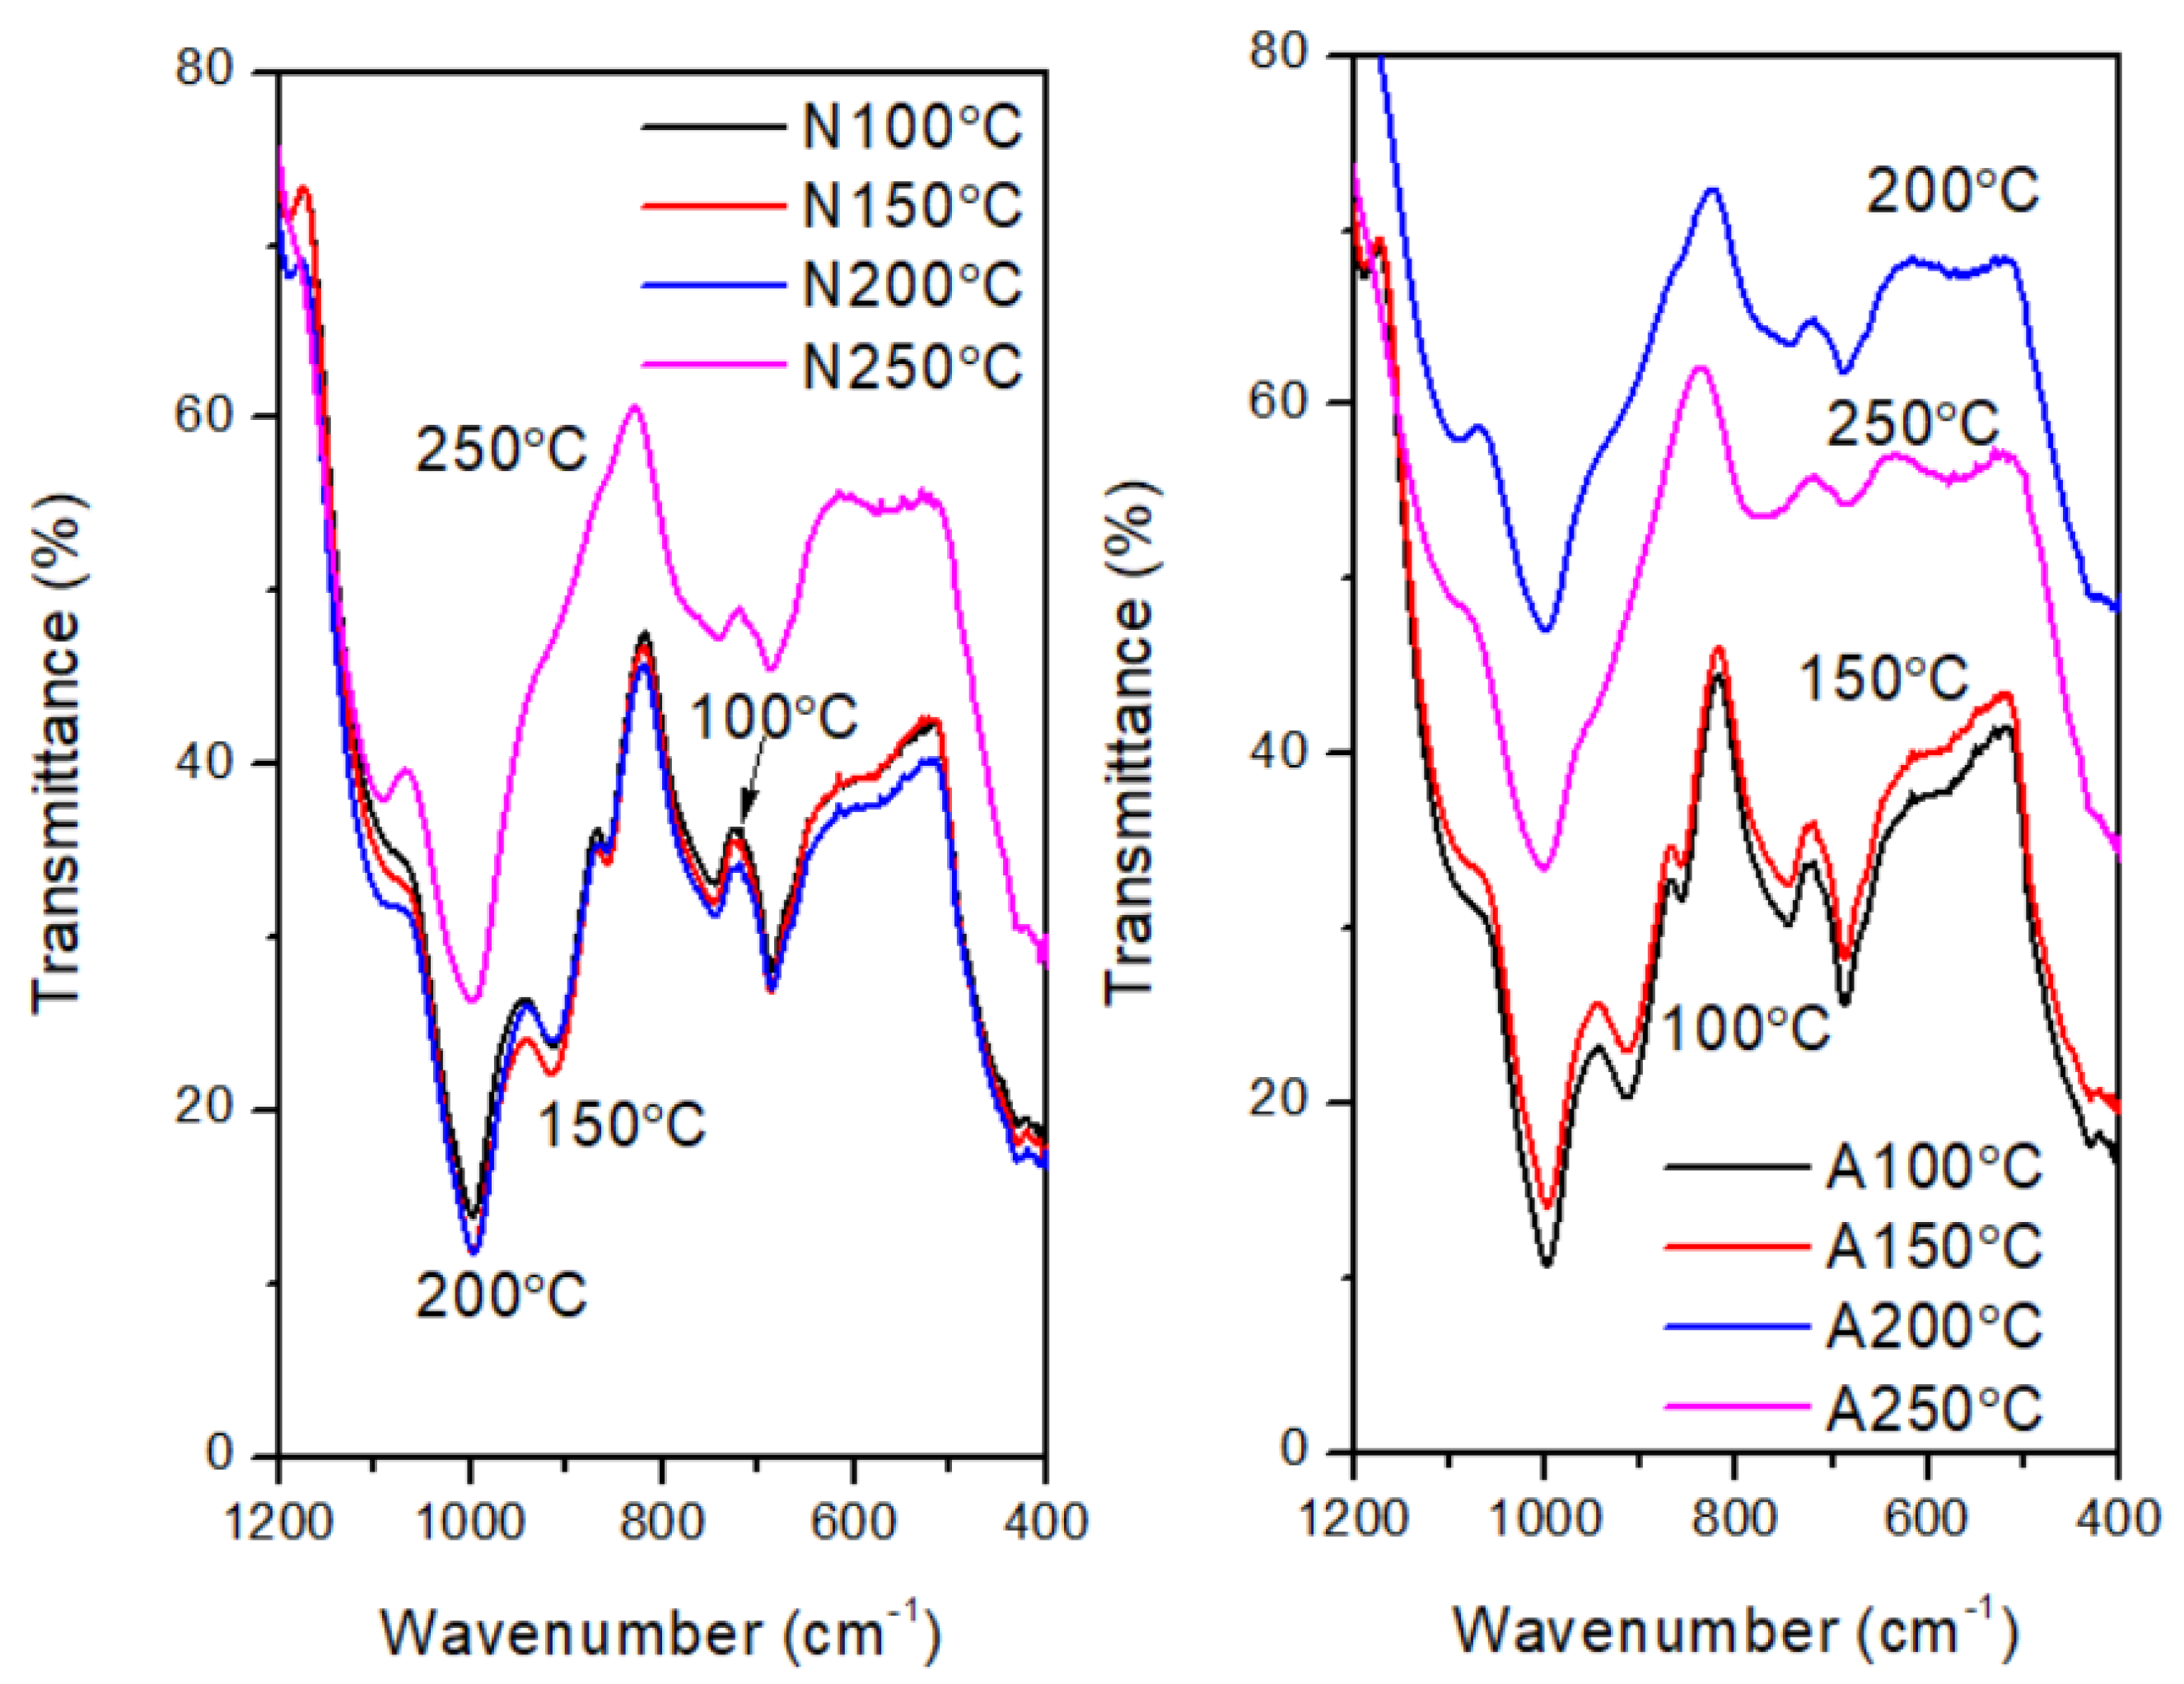
Figure 15.
Indication of formation of temporary C-C and SiC bond at (940-950 cm−1) in the heating range of 400-500℃ in nitrogen (Left) and air (Right).
Figure 15.
Indication of formation of temporary C-C and SiC bond at (940-950 cm−1) in the heating range of 400-500℃ in nitrogen (Left) and air (Right).
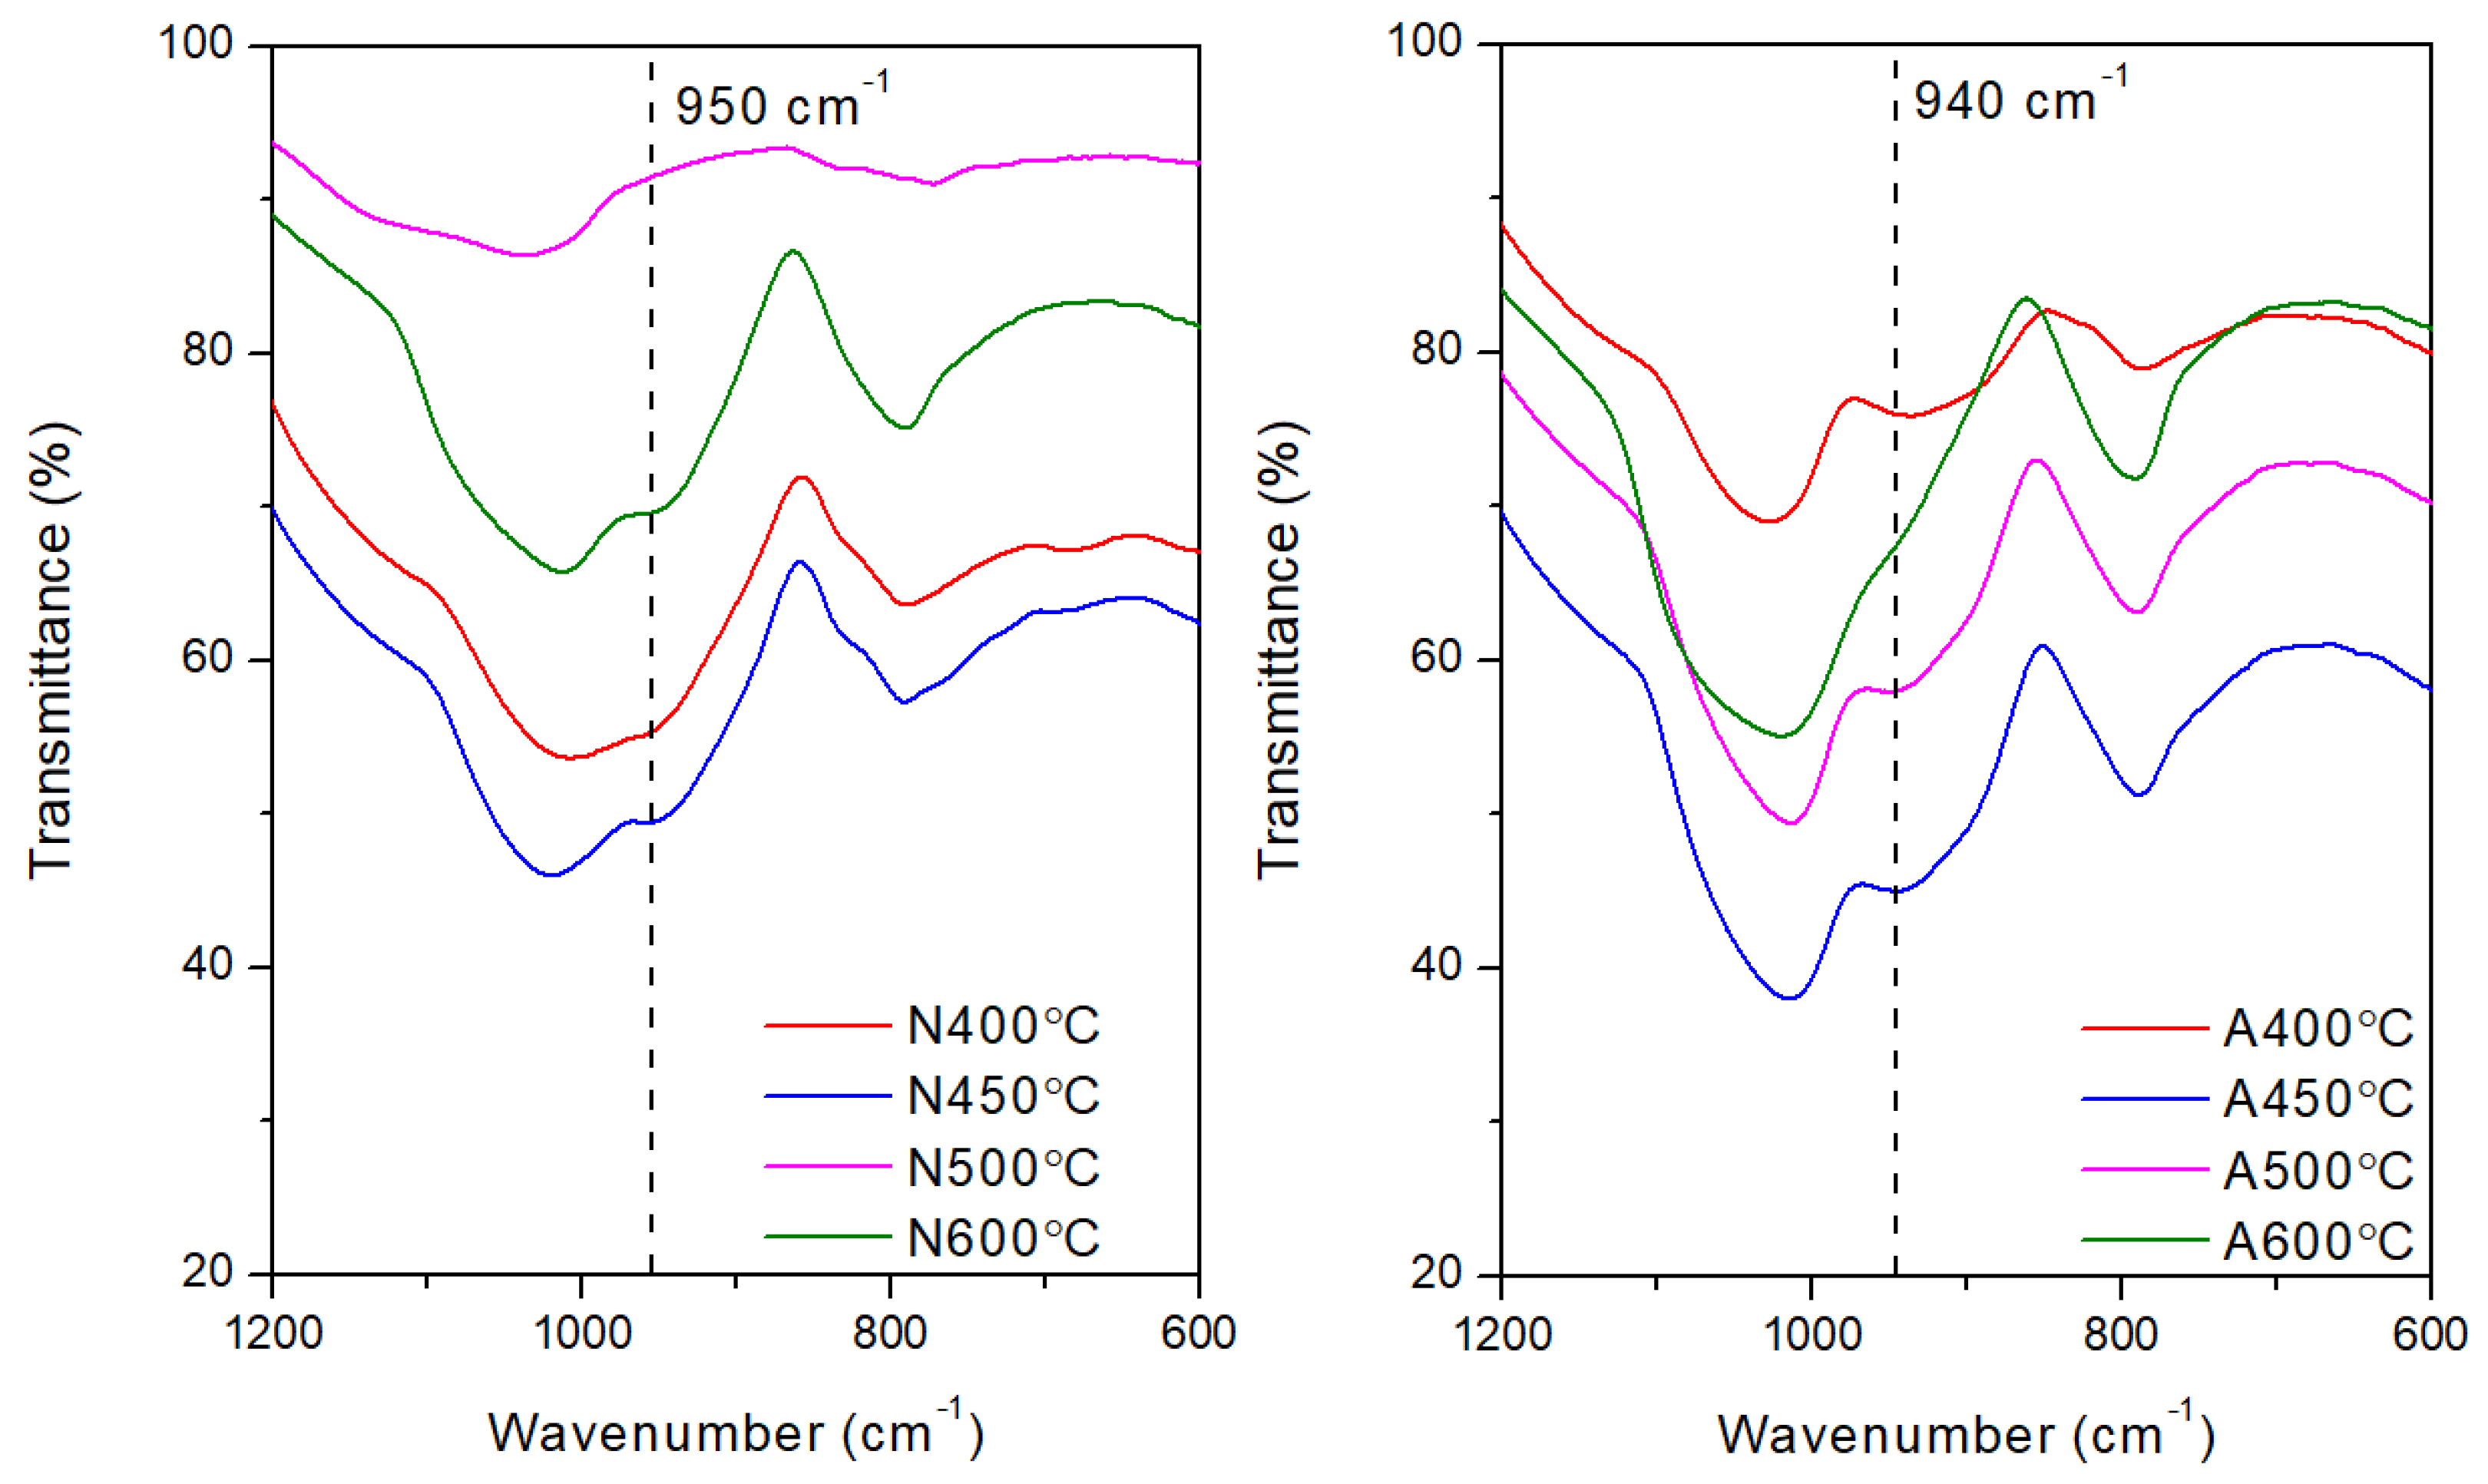
Figure 16.
FT IR spectra showing changes in the transmittance peaks around 1600 cm−1 with changing testing temperature (a:100℃, b: 200℃, c:300℃, d: 400℃, e:500℃, f:600℃), samples heated in air (Left)/nitrogen (Right) a rate of 30℃/min.
Figure 16.
FT IR spectra showing changes in the transmittance peaks around 1600 cm−1 with changing testing temperature (a:100℃, b: 200℃, c:300℃, d: 400℃, e:500℃, f:600℃), samples heated in air (Left)/nitrogen (Right) a rate of 30℃/min.
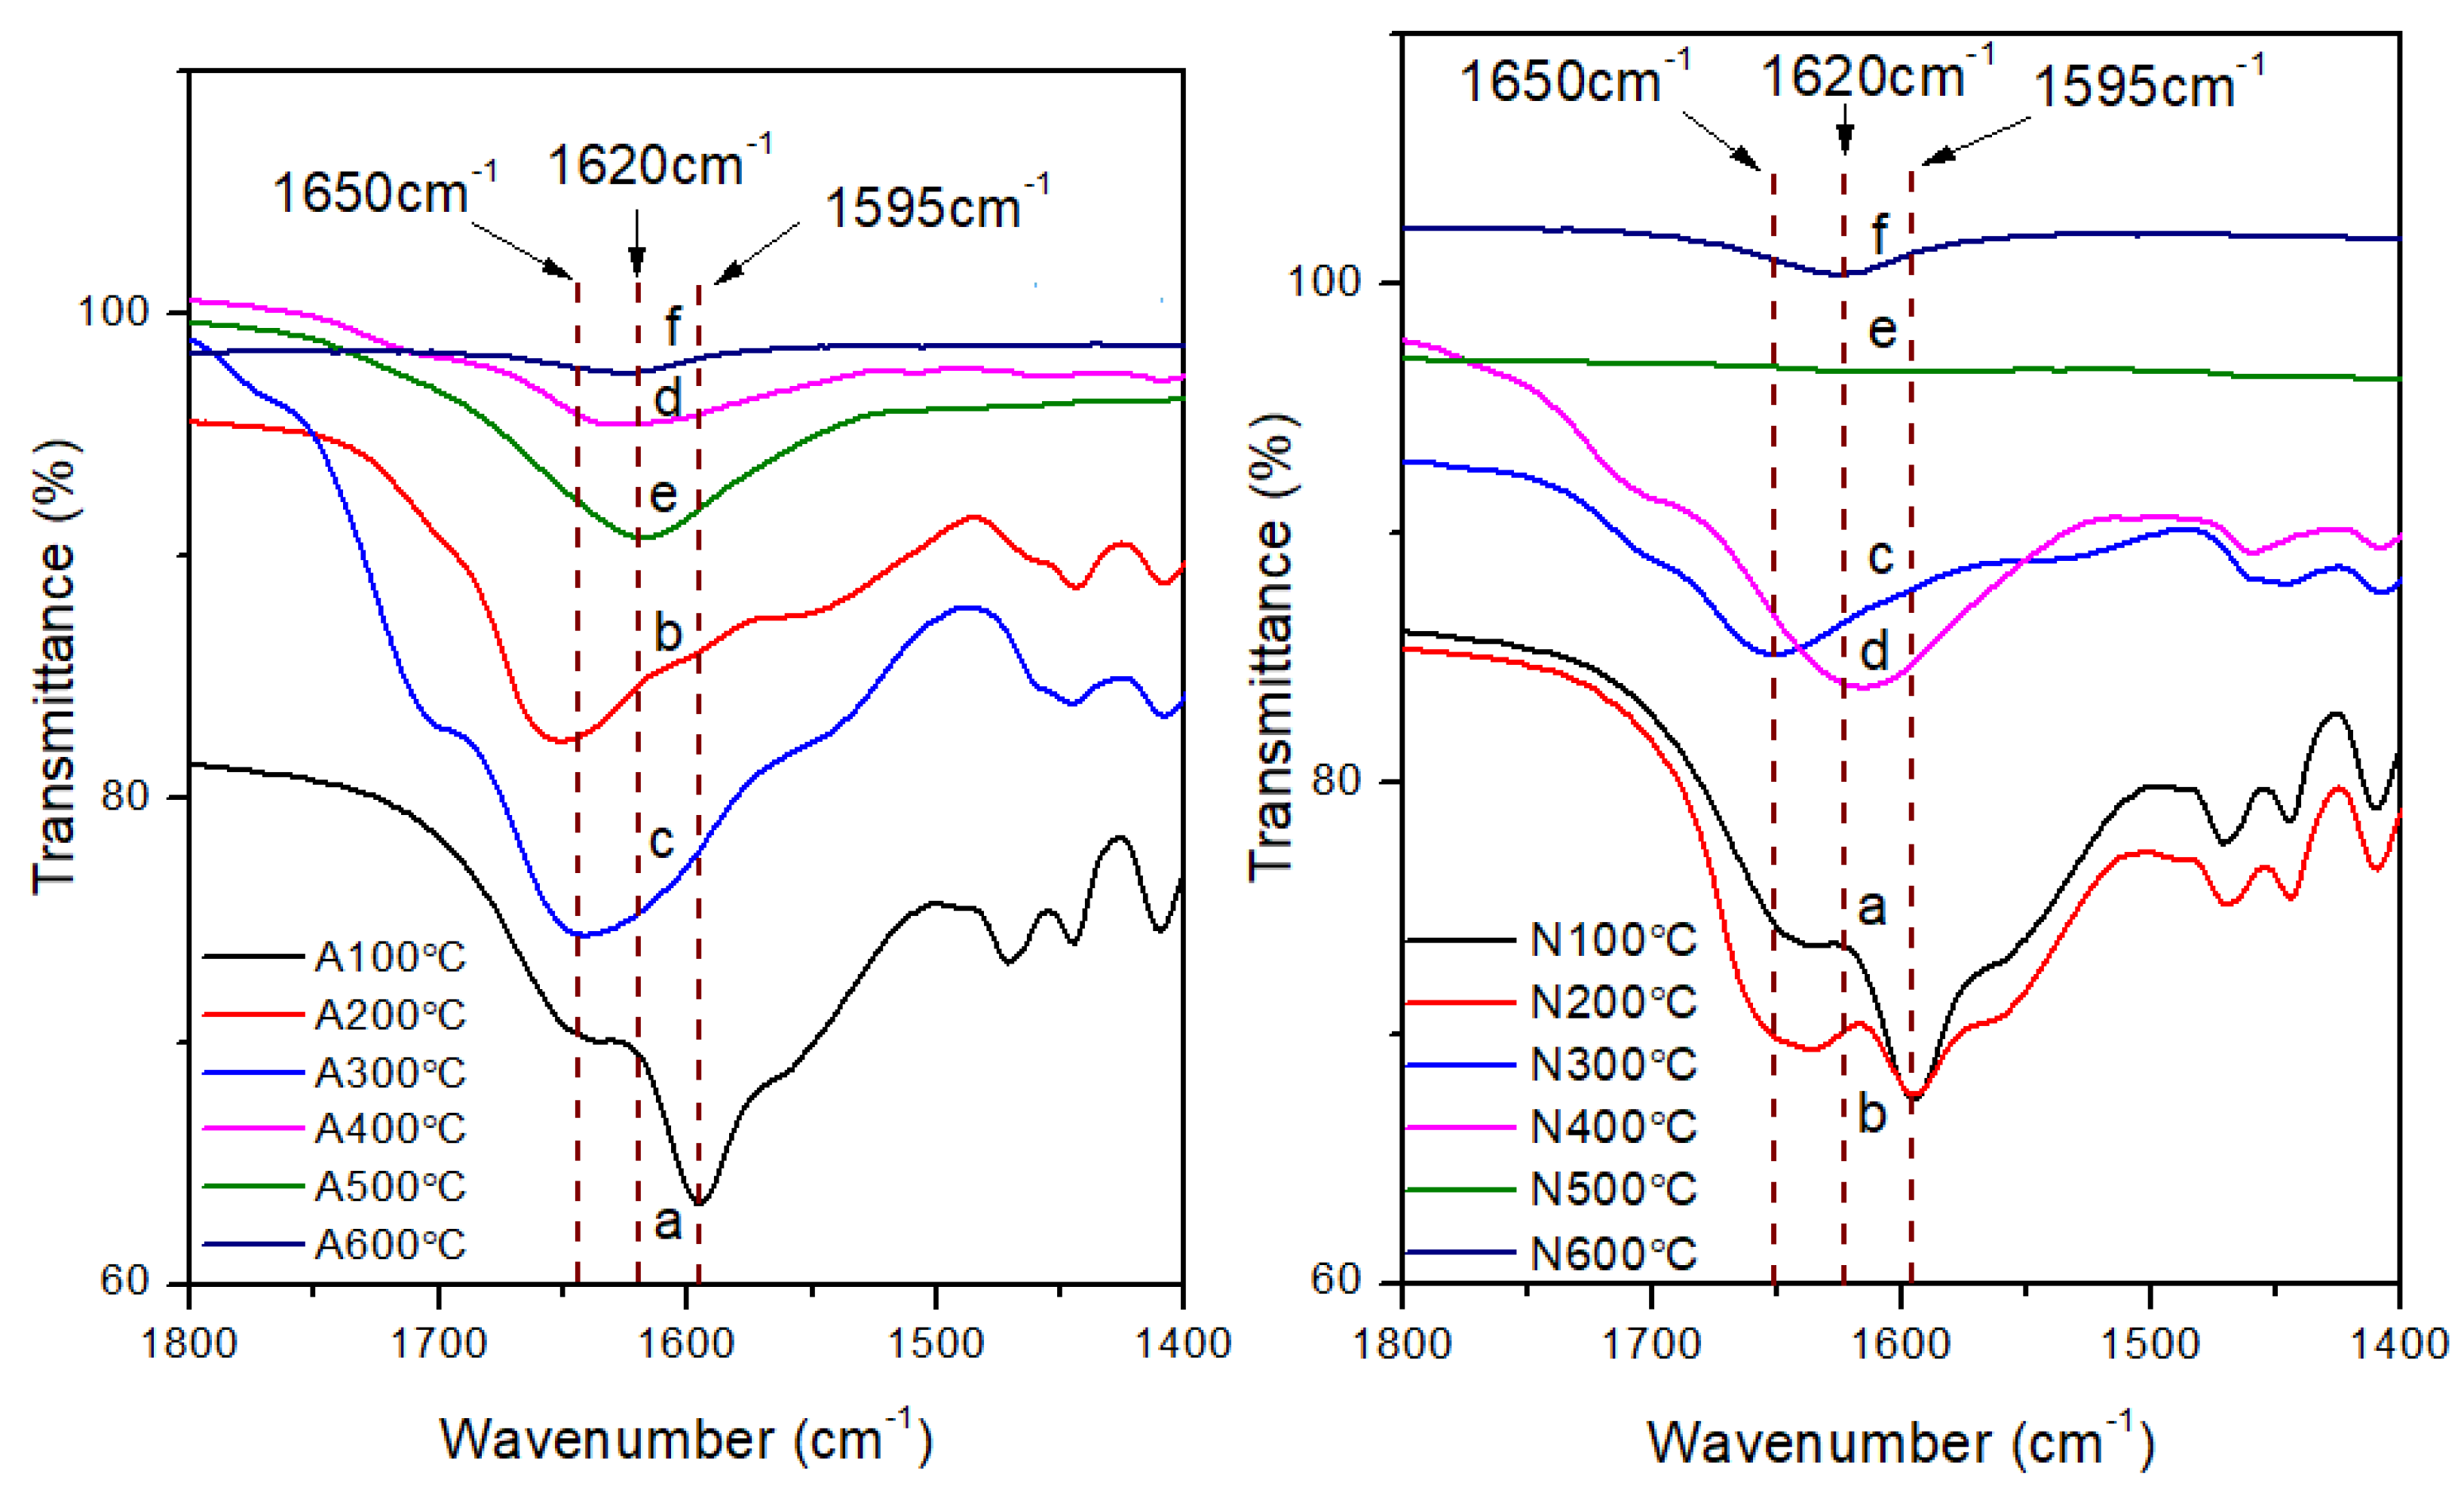
Figure 17.
FTIR transmittance peak shifting of Si-O-Si bond from 991 cm−1 (under 250℃) to 1017 cm−1 (450℃) and from 744 cm−1 (250℃) to 790 cm−1 (450℃) in nitrogen atmosphere at a heating rate of 30℃/min.
Figure 17.
FTIR transmittance peak shifting of Si-O-Si bond from 991 cm−1 (under 250℃) to 1017 cm−1 (450℃) and from 744 cm−1 (250℃) to 790 cm−1 (450℃) in nitrogen atmosphere at a heating rate of 30℃/min.
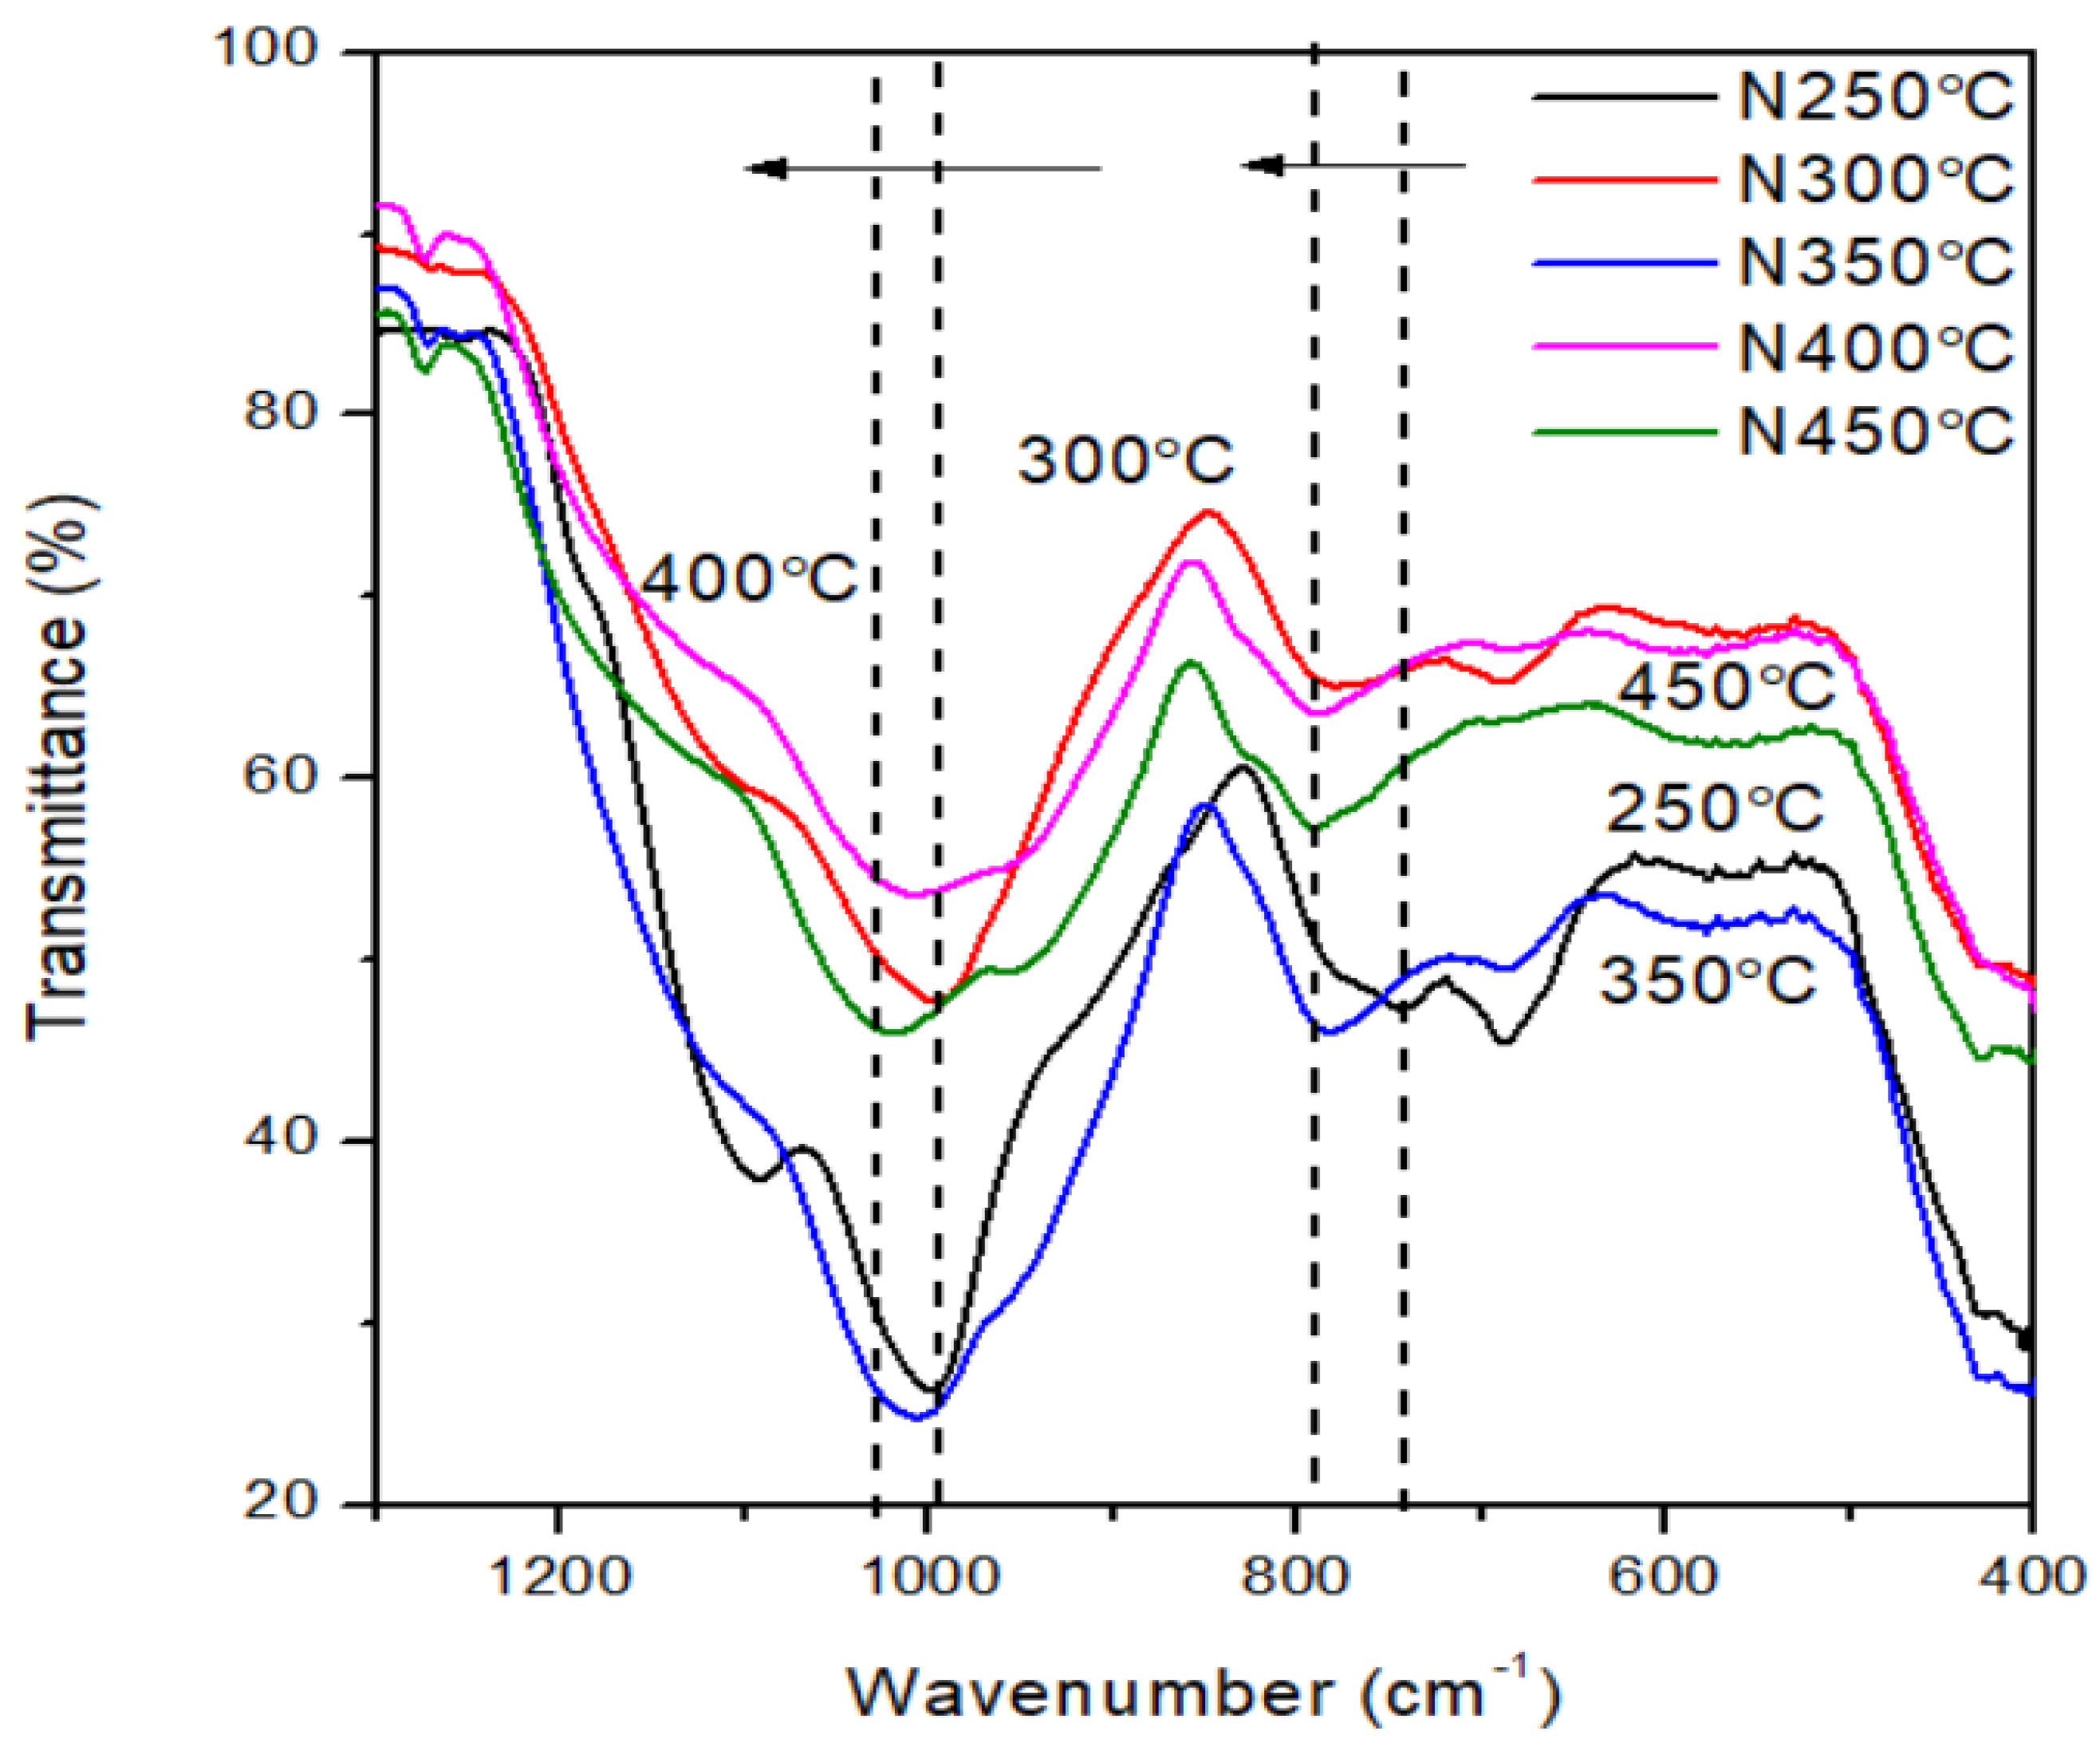

Table 1.
Activation energies for ATL-POSS based on KAS model.
| Activation Energy/(kJ/mol) | Peak II | Peak III | Peak IV |
|---|---|---|---|
| Nitrogen | 100.186 | 81.641 | 223.392 |
| Air | 93.458 | 141.995 | 91.587 |
Disclaimer/Publisher’s Note: The statements, opinions and data contained in all publications are solely those of the individual author(s) and contributor(s) and not of MDPI and/or the editor(s). MDPI and/or the editor(s) disclaim responsibility for any injury to people or property resulting from any ideas, methods, instructions or products referred to in the content. |
© 2023 by the authors. Licensee MDPI, Basel, Switzerland. This article is an open access article distributed under the terms and conditions of the Creative Commons Attribution (CC BY) license (http://creativecommons.org/licenses/by/4.0/).
Copyright: This open access article is published under a Creative Commons CC BY 4.0 license, which permit the free download, distribution, and reuse, provided that the author and preprint are cited in any reuse.


