1. Introduction
We live in a society where lifelong learning is part of life. Children start learning from the day they are born and the environment they grow up in supports their mental, emotional, and social development. This development lays the foundations for future success in life, including academic success. Achievements in formal education often pave the way to social and economic success in life (Alan B. Krueger & Mikael Lindahl, 2001) Therefore in many countries, education has always been at the center of governments’ attention (Eric Hanushek, 2016; United Nations, 2020).
Information Systems used in education accumulate massive amounts of data about students, their demographics, educational background, and progress through their studies. Educational data analytics can be a valuable tool to support educators in the early identification of students with demographic factors putting them at risk. It has been established that early intervention can improve developmental and study outcomes (Ramey & Ramey, 1992).
Previous research studied a diverse range of factors that could predict success or impede it. One set of factors is classified as socio-economic status which is pre-determined by parents’ education and occupation as well as family (or household) income level (Avvisati, 2020). Families where parents obtained high education degrees usually provide an environment fostering the need and desire to study and to strive for higher levels of achievement (Chevalier & Lanot, 2002).
The rise of online learning during the COVID-19 pandemic, its continuity post-pandemic, the explosion of eLearning resources, and the use of ChatGPT (OpenAI, 2022) led to the creation of state databases and the establishment of large repositories. In addition, new types of learning environments have been emerging at unprecedented pace, such as ubiquitous mobile learning, virtual reality, games, and metaverse, in a world that becomes smarter, thanks to the advancement in technologies to support various domains including education (Ismail & Zhang, 2018). A huge amount of data about students and their learning is being produced in different formats, making it very challenging to analyze manually to get insights about the factors which impact students’ performance and take the necessary actions. Artificial Intelligence machine learning technology has been used to predict the benefits of an educational environment, and the academic performance of students to develop a prevention plan for failures (Ismail et al., 2021). Predicting students’ performance also enables educational policymakers and school administration to put in place a plan to improve the educational system and propose strategies to help weak learners, and prevent academic failure, based on factors affecting students learning outcomes, such as demographic, psychological, environmental, and socio-economic.
Research work on machine learning evaluates the accuracy of students’ performance classification models using heterogeneous datasets and evaluation metrics. In addition, those works do not provide an analysis of the features that impact students’ performance and the rationale behind the models’ performance. In this chapter, we evaluate and compare the performance of two mostly used classification models in the literature, Support Vector Machine (SVM), and Random Forest (RF). This is in a unified environmental setup using the same dataset (Cortez & Silva, 2008). We evaluate the performance of the models in terms of accuracy and F-measure. The machine learning models, generated, after being trained on the dataset, are evaluated using F1-measure and accuracy. F1-measure is the harmonic mean of precision and recall. Accuracy refers to the degree to which the result of a prediction conforms to the correct value.
The key research contributions are as follows:
We propose a taxonomy of students’ performance factors based on their common characteristics and analyze which categories are more significant than others in predicting school students’ performance.
We design, develop, and implement a machine-learning-based framework for the prediction of students’ failures/successes.
We evaluate the performance of the two most used machine learning algorithms in the literature in terms of accuracy and F-measure in a unified environmental setup, using a real-world student dataset with and without feature selection.
The rest of the chapter is organized as follows. In section 2, we present a taxonomy of factoring impacting students’ successes for failures.
Section 3 discusses the related work. The classification models used in this study are explained in section 4 in the context of students’ performance prediction. The machine learning models under study are explained in section 5. The experimental setup, experiments, and the analysis of the results in terms of accuracy, F-measure are described in section 6. The chapter is concluded in section 7 along with recommendations and future research directions.
2. Taxonomy of Students Performance Factors
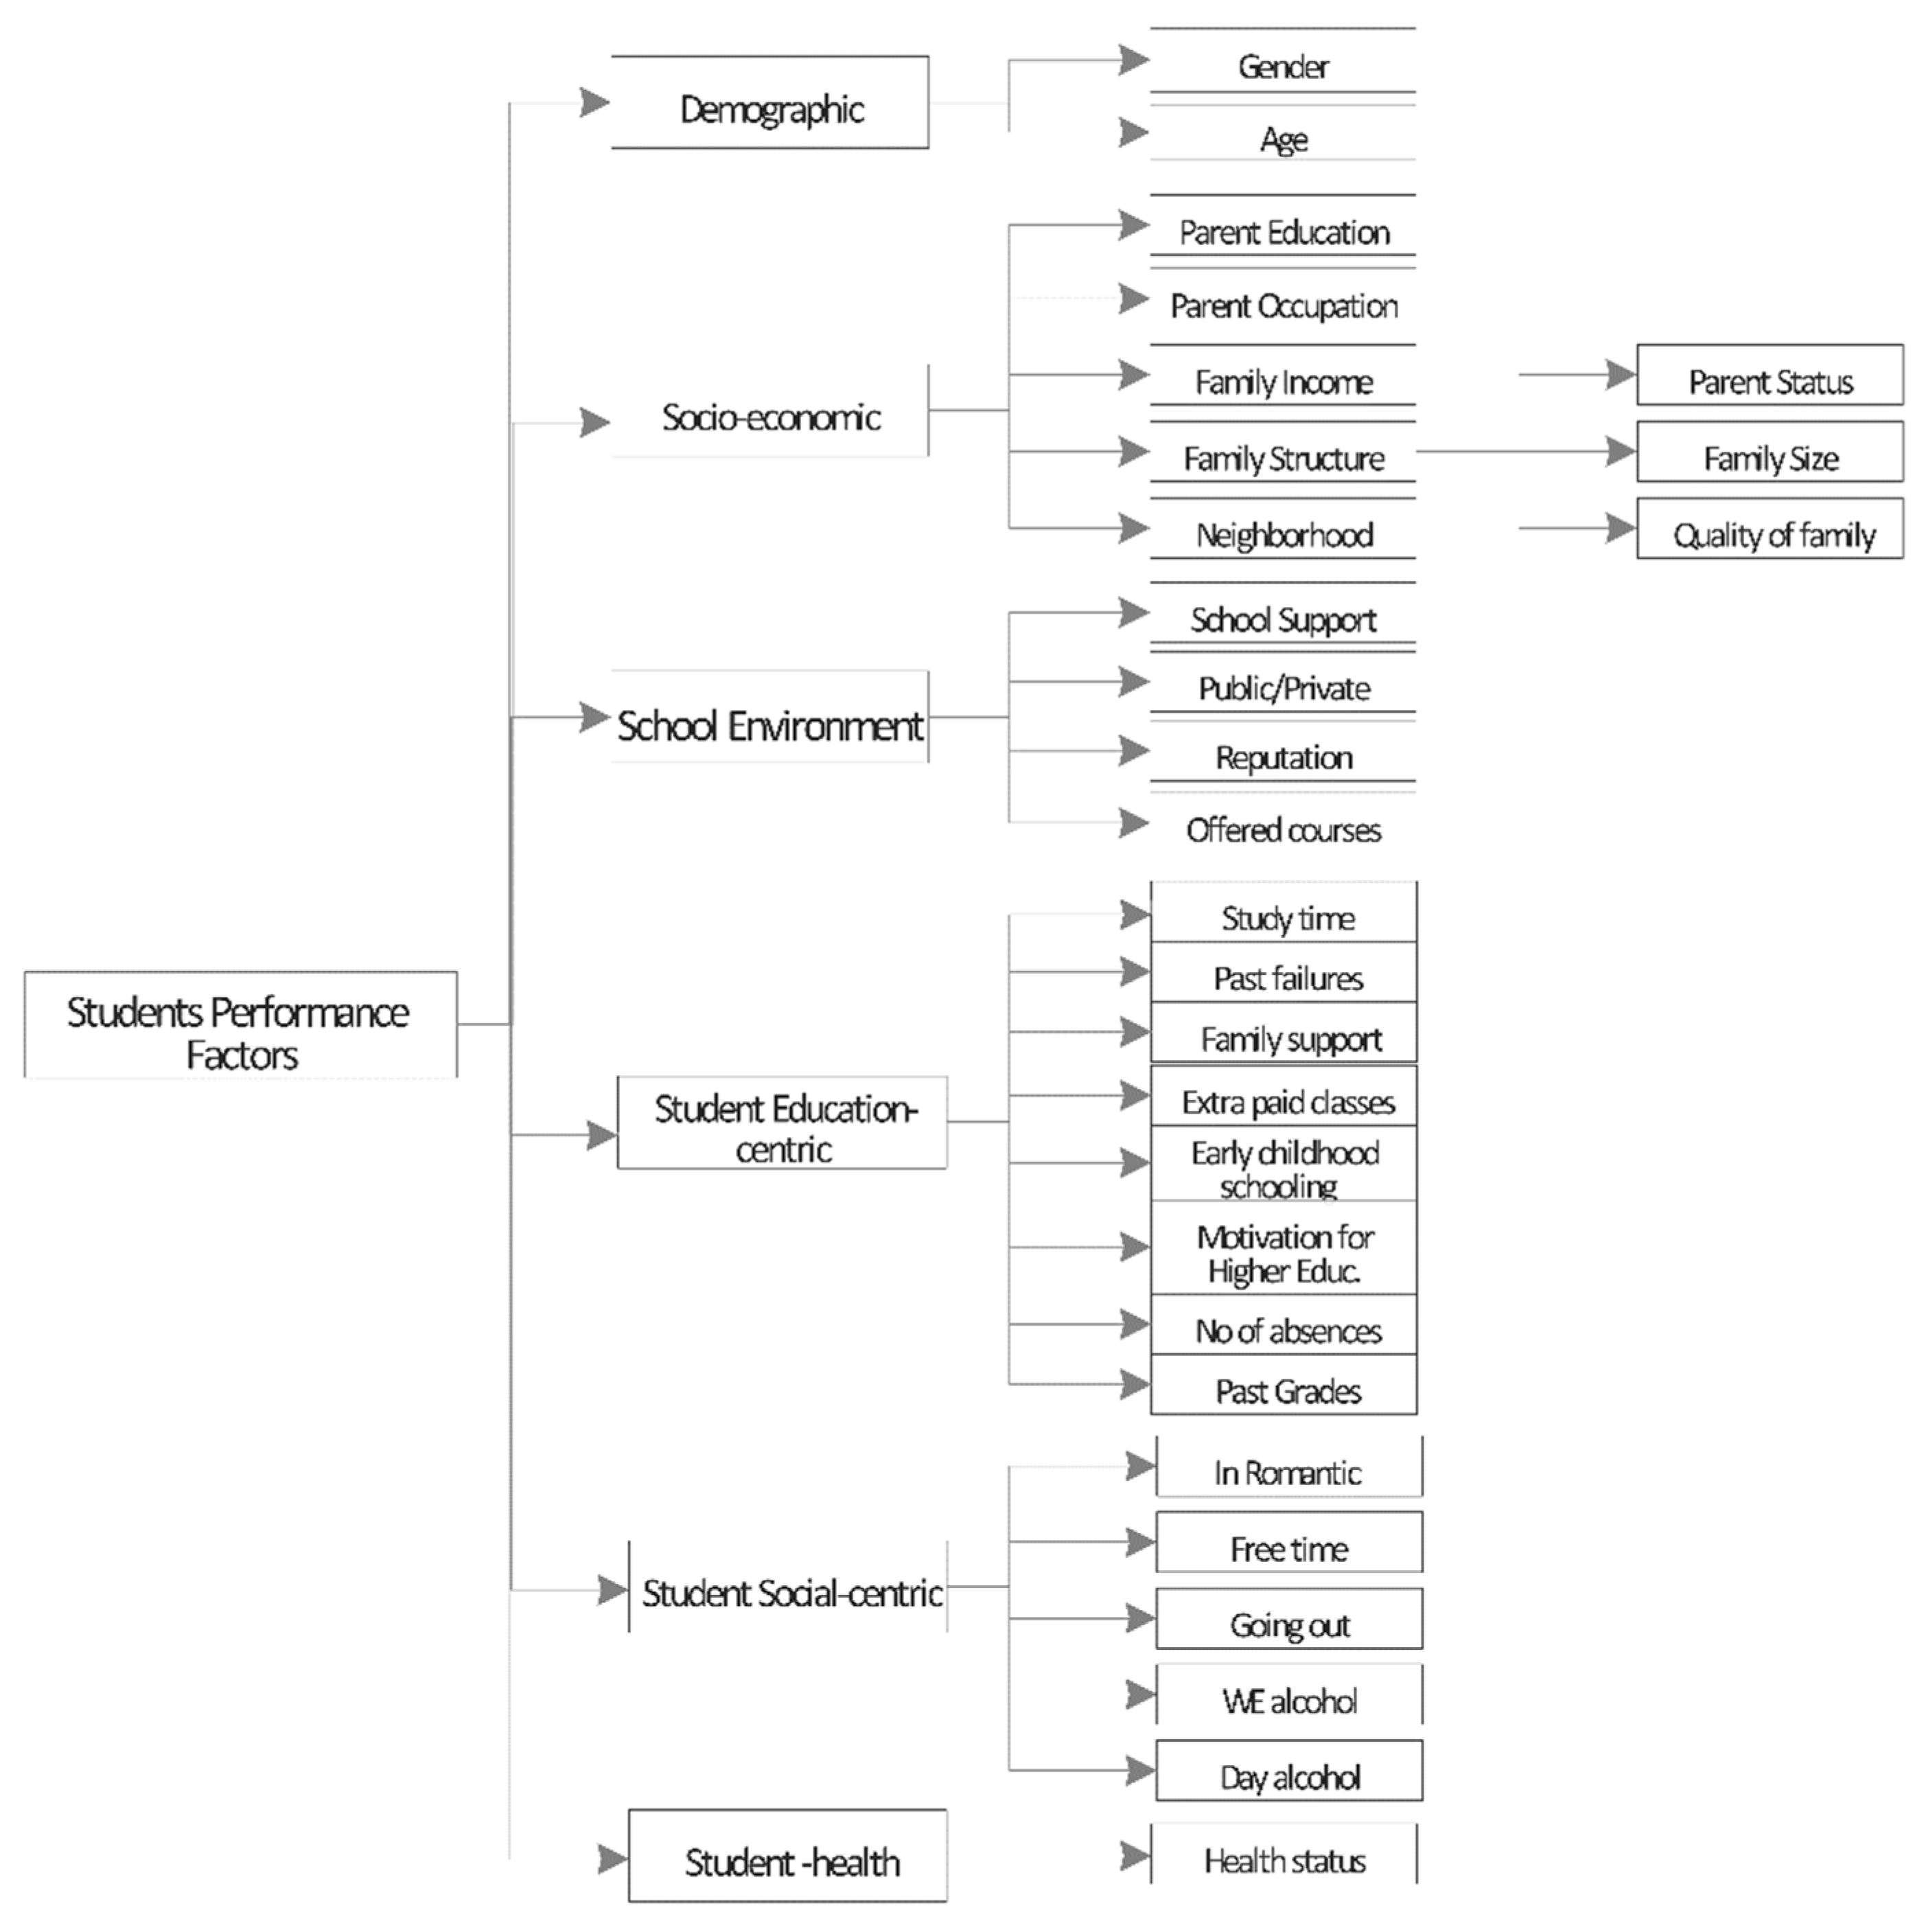
This section presents a taxonomy of students’ performance factors (
Figure 1). We classify them into 6 categories 1) demographic, 2) socio-economic, 3) school environment, 4) student education-centric, 5) student social-centric, and 6) student health-centric. This classification aims to analyze which categories of the students’ performance factors significantly contribute to the prediction of students’ failures or successes.
The majority of past studies discuss gender and age as important factors affecting students’ success. In terms of gender, many studies point out that female students often perform better than their male counterparts (Bugler et al., 2015; Sheard, 2009). The reason is that girls often inspire to achieve better results in their school studies to lay the foundations of success for their future since historically it has been more challenging for females to get ahead in life (Spencer et al., 2018). However, some studies also point out that family circumstances and ethnic culture have an impact on female students interfering with their success, especially in developing world countries or within poorer groups of the population (Chavous & Cogburn, 2007; Ramanaik et al., 2018). Studies that examined age association with pathways to the university observed a negative correlation between mature-age students and intentions to continue to university (Shulruf et al., 2008). The study suggests that if mature-age students experienced challenges in their secondary education, they are likely to continue experiencing challenges in the follow-up studies. Other research pointed out the family demands on mature-age students, thus interfering with the success of their studies (Lincoln & Tindle, 2000). However, there are other studies demonstrating that mature-age students are more likely to succeed in the first year of university studies than school leavers (McKenzie & Gow, 2004).
Socioeconomic factors often pre-determine students’ success in their studies. These factors include parents’ education and occupation (Daleure et al., 2014), family income (Farooq et al., 2011), family structure, and neighborhood as influencing parameters. Parents are important influencers on their children. Parents from middle-class financial backgrounds want their children to achieve more and motivate them as role models, with financial support as well as learning resources (Irwin & Elley, 2013). In some cases, parents from lower classes attempt to provide a roadmap to success for their children. They work hard, and they immigrate or send their children to countries with better opportunities so their children can study and have a better life than their parents. But they also apply motivational strategies to keep their children inspired (Gutman & McLoyd, 2000). However, there is a negative correlation between parents’ social status and the achievements of their children due to the inability to provide access to learning resources and therefore hindering their children’s prospects (Eamon, 2005).
Family structure refers to incomplete (single-parent) vs complete families and fragile vs non-fragile families (i.e., families with a high risk of homelessness and families with both parents) (O’Malley et al., 2015). Complete and non-fragile families are considered to provide a stable nourishing environment for children’s development (McLanahan & Garfinkel, 2000). Disadvantaged neighborhoods (e.g., with high unemployment rates and lack of positive role models because a father figure is missing) are more likely to outweigh the family and school influence and would create a contradictive environment where attitudes and behavioral patterns encouraged by schools are not supported in children’s surroundings and therefore the children would not consider success in traditional understanding and behaviors leading to it as necessary or useful (Ainsworth, 2002).
Schools can be considered significant contributors to children’s development and significantly impact their students’ future. A school environment can create a pathway into higher education. It has been demonstrated that type of school (public vs private where fees are high) may affect student’s performance and therefore their path into the higher education sector. Private schools are expensive but they often have better-trained teachers and better school facilities and study equipment, therefore providing a nourishing learning environment (Bragg et al., 2002). Public schools were created to be available for every child regardless of socio-economic background and to provide equal opportunities. In reality, public schools are often understaffed, and underfunded and seek contributions from parents and private sources (Thompson et al., 2019). This lack of funding could result in deteriorating facilities and out-of-date equipment, leading to teachers’ and students’ dissatisfaction (Moore, 2012), which in turn affects students’ grades. A similar impact is played by the school location (which could be evaluated by the prestigiousness of a suburb and house prices in the area as well as by comparing metropolitan schools vs regional and socio-economic factors). In the USA, students’ success is determined by the state and the socio-economic characteristics of the community they live in and where the school is located (Hochschild, 2003; Shulruf et al., 2008).
3. Related Work
Several works discuss the use of machine learning to predict students’ performance.
Table 1 presents a comparison. Work in the literature evaluated the performance of machine learning classification models for students’ performance.
Table 1 shows the work on SVM, and RF, the most used models in the literature. However, they are trained and developed using different datasets containing different features, and evaluated with the means of different performance metrics making an objective comparison difficult. None of these studies compare these models using a public dataset with a large number of observations. Using a private dataset does not enable the research community to reproduce the results. Moreover, these works evaluate the models in terms of accuracy only. We argue that for an imbalanced dataset, it is important to use F-measure as accuracy alone can be misleading.
In this chapter, we compare the models under study in terms of both accuracy and F-measure on a public large dataset. In addition, this study generates insights into the features impacting students’ performance and provides a taxonomy.
4. Students Performance Features Exploration
The dataset under study consists of data collected during the 2005-2006 school year from two public schools, in the Alentejo region of Portugal. The students and families answered some questionnaires, and data were completed with the school reports.
Table 2 presents the list of features in the dataset. There is a total of 33 features which encompass the six categories of our taxonomy (
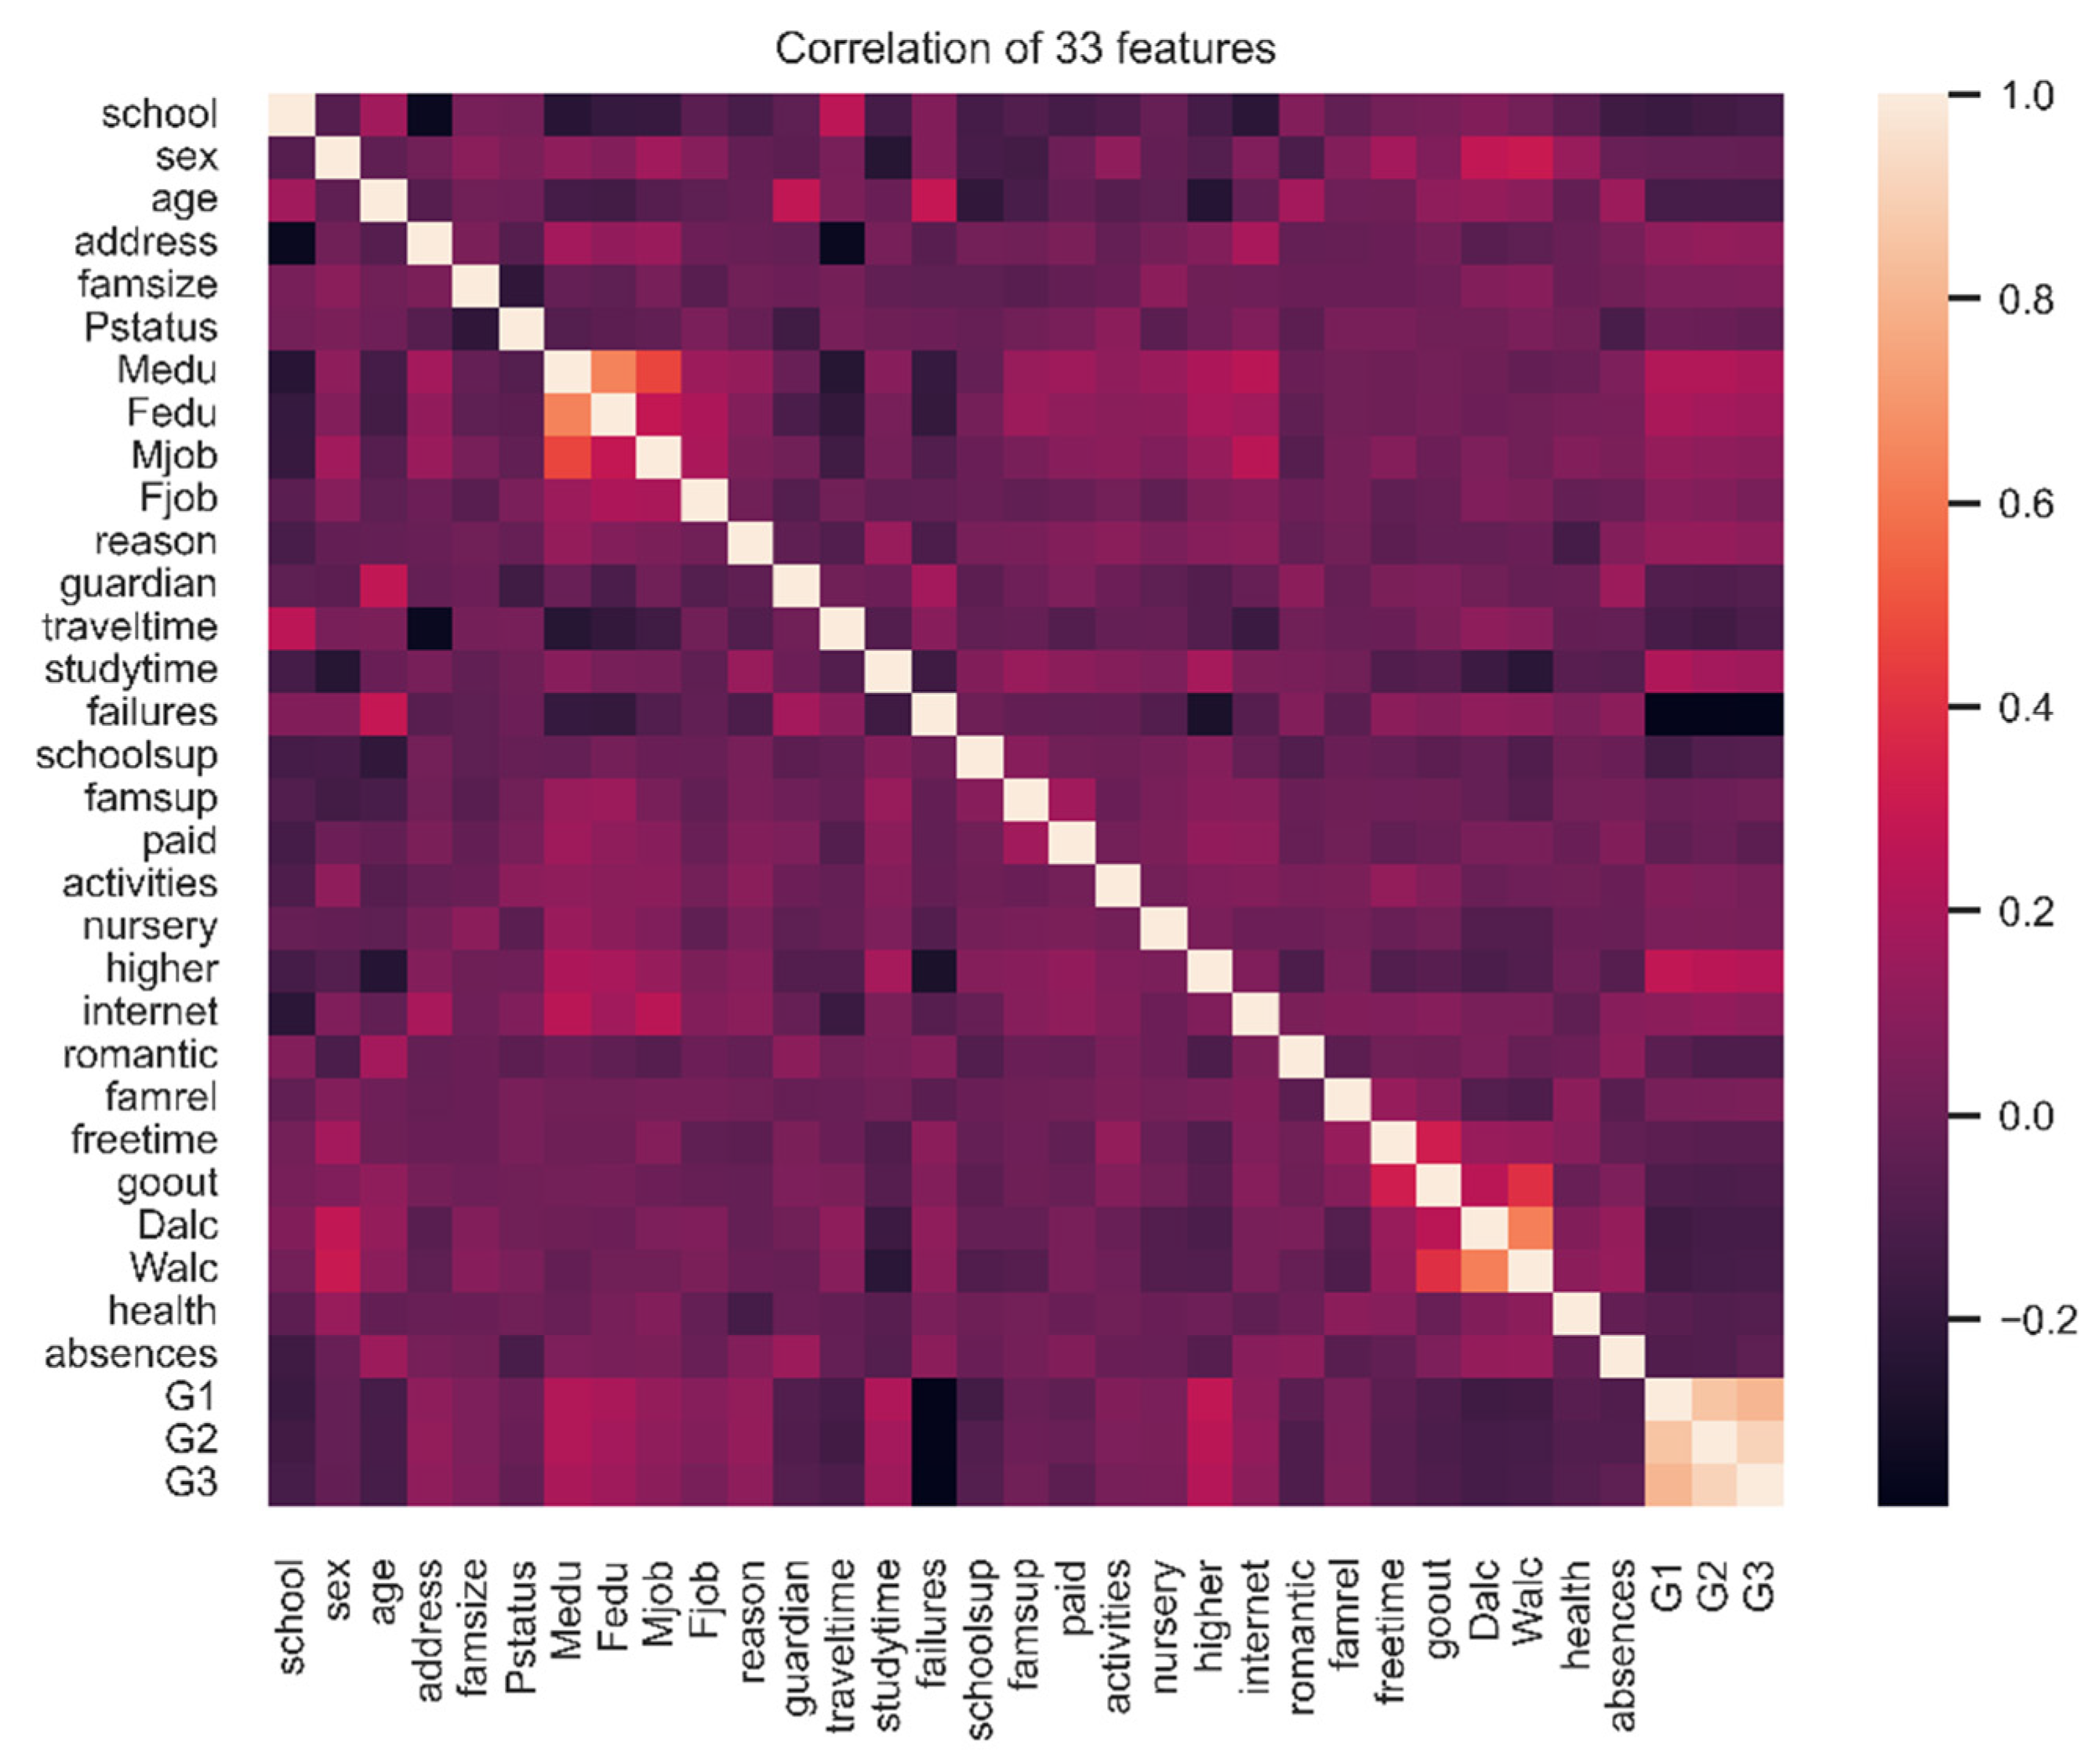
Figure 1). In this study, our main goal is to predict the outcome corresponding to G3 (grade at the end of the school year). To determine the features which are impactful on the classification decision, we identify the correlation between the different features and classification outcome as shown in Fig 2. The figure shows that that the target class G3 is highly correlated with previous grades during the year.
Figure 2 show an important negative correlation between G3 and the number of previous failures during the student school history, indicating that in general repeating a class will not improve the student’s level in future year level. Other negative correlations with academic results include alcohol consumption and age. It confirms that alcohol is a negative indicator for school students a far as the grade is concerned. The age negative correlation is expected as the number of failures will result in an increased age for the student. On the other hand, we can see the quality of family relationship is negatively correlated with alcohol consumption. The mother and father education level (Fedu, Medu) are highly correlated, which tends to show that family are created with parents having the same education level. The higher positive correlation for G3 is the desire to take higher education, which seems that motivation cat as a booster for school achievement. Next positive correlations are with mother and father education and study time. Study time can somehow be expected, and importance of parents’ education pinpoints the influence of the family environment and especially the “knowledge” of education system that experienced parent can dispense to their children, together with a will to go for higher education.
In summary, there is a strong correlation between the target class grade (G3) and the previous grades. To generalize the model and capture the relative importance of features related to demographic, socio-economic, school environment, social, and health factors, we develop a machine learning model to predict student performance without considering the previous grades.
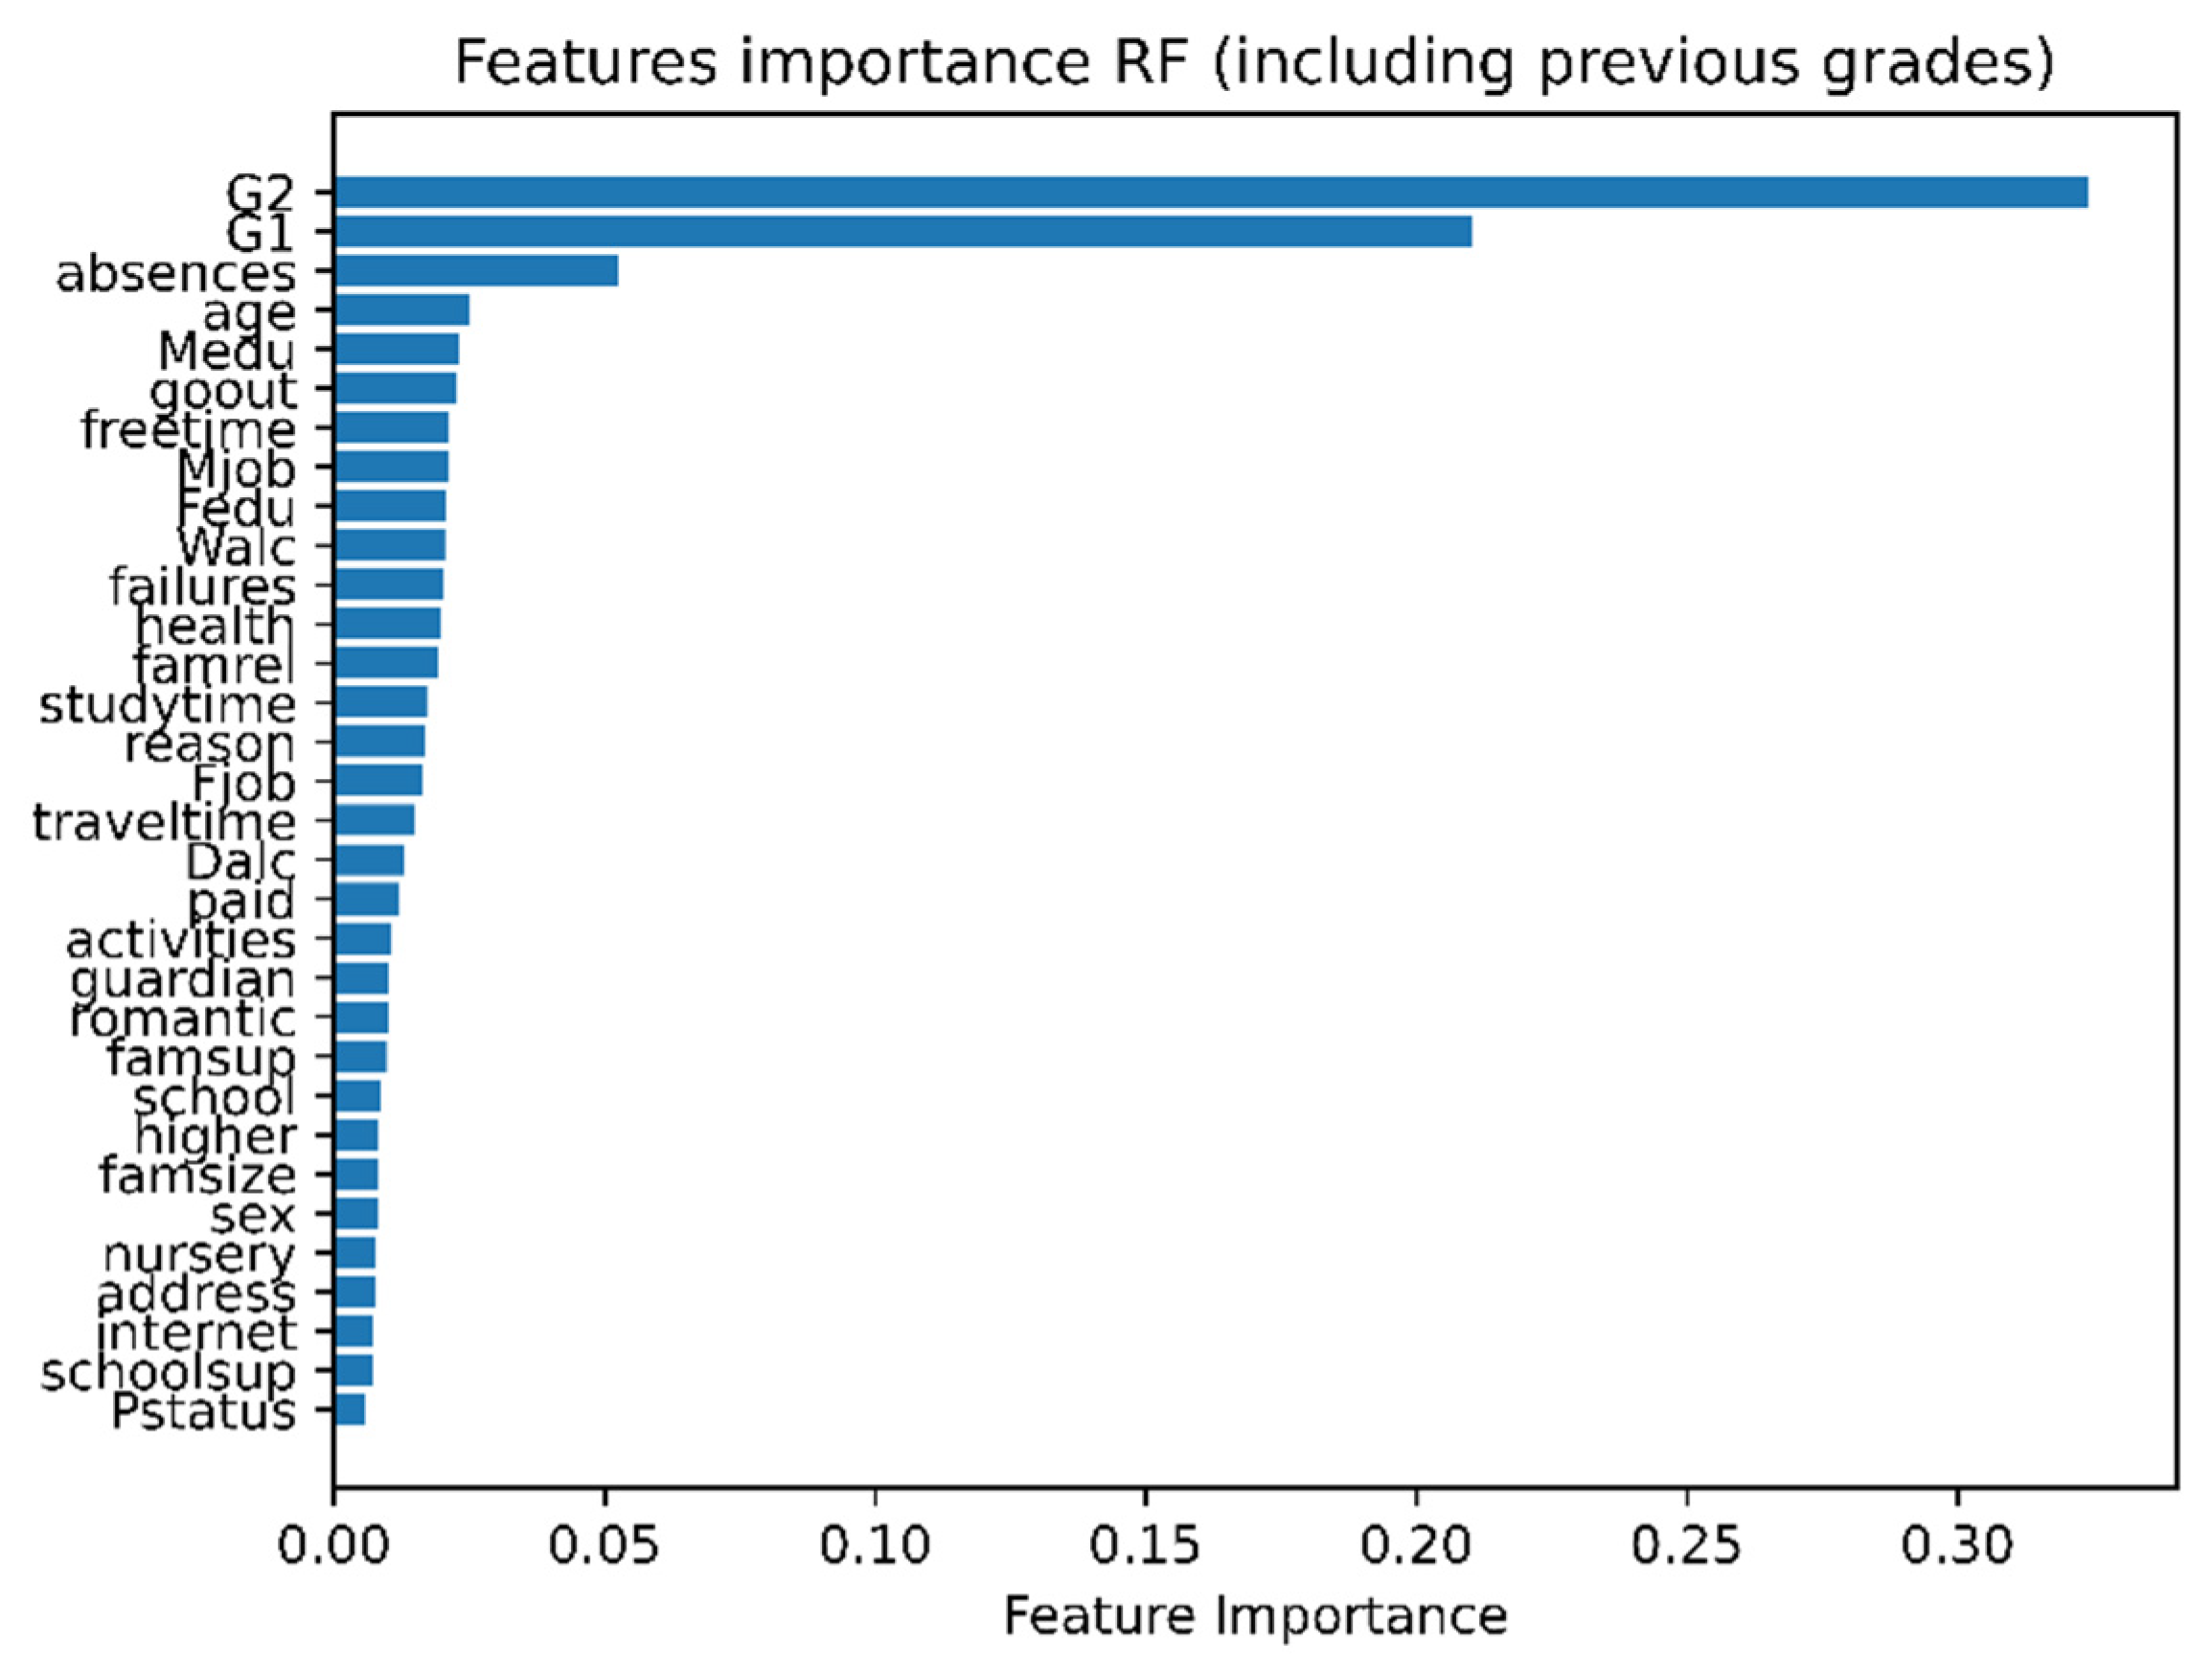
To extract the most relevant features for the prediction of students’ performance, we use RF regression model and generate “feature importance” (
Figure 3). The figure shows that the previous grades G1 and G2 are the most important features which determine the students’ performance. In addition, the number of absences during the year is the top second factor for the model prediction.
In summary, some features are more important than others for the prediction of students’ performance. For instance, previous grades G1 and G2, the number of absences, student age, and mother education are among the features that should be captured by a machine learning model.
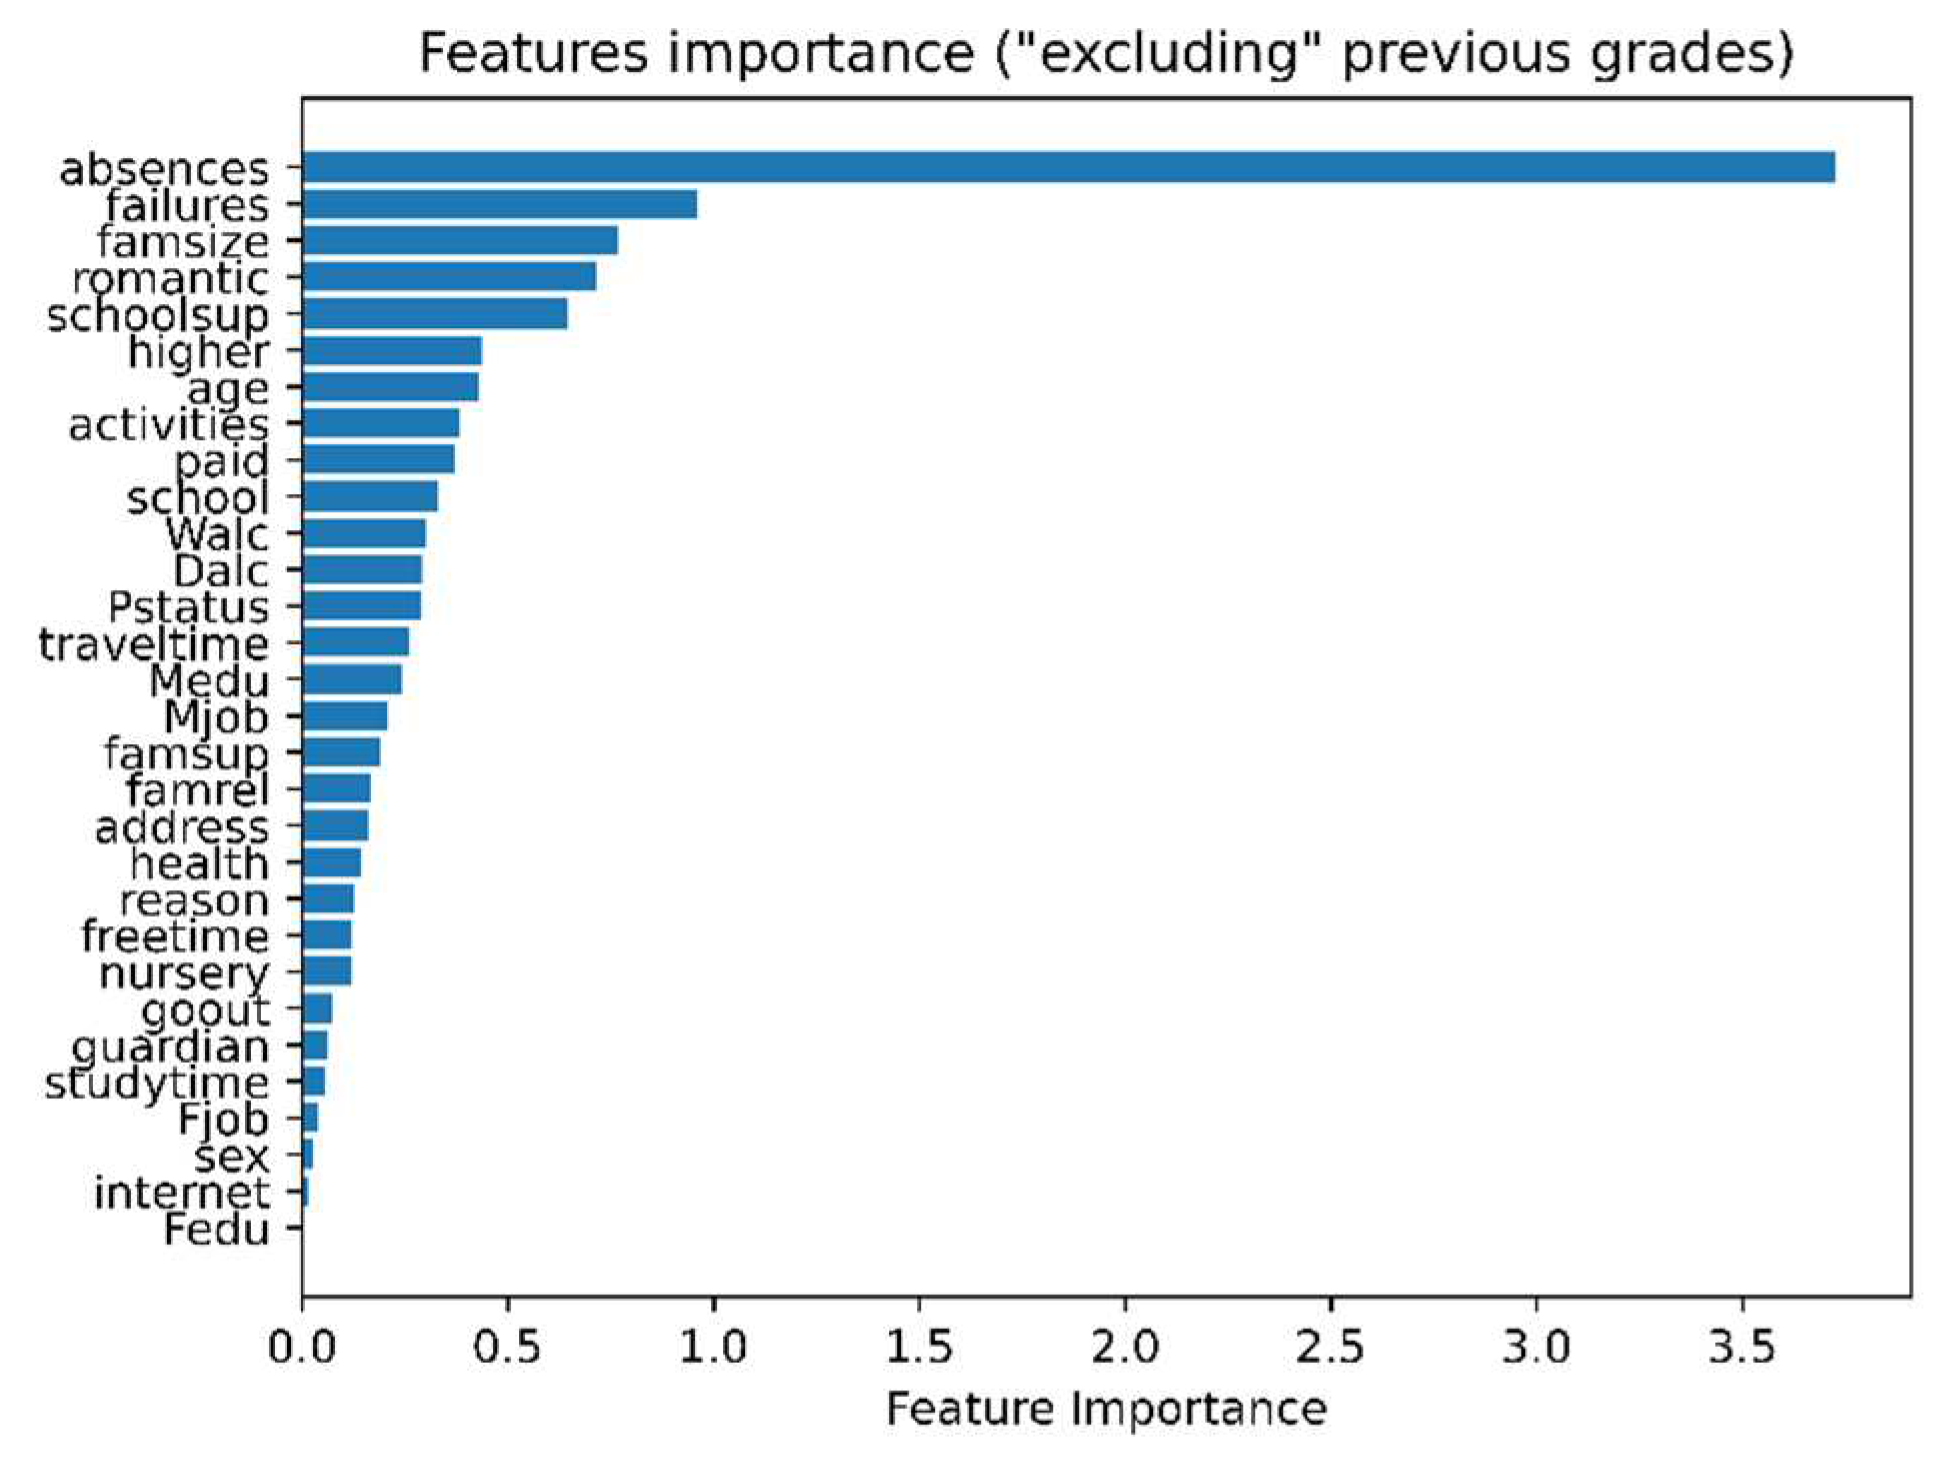
In addition, we extract the importance of the dataset features by applying RF regression after the removal of the previous grades (G1, G2). This is to get insights on the influence other factors, for instance socio-economic and social factors (
Figure 4). For instance,
Figure 4 shows that the number of absences, and the number of failures, both numerical features, influence most the model for the prediction of students’ results.
5. Machine Learning Models for Students Performance Prediction
In this section, we explain the machine learning classification models under study for students’ performance prediction. We take an example of classifying students’ marks into three levels: high, medium, and low. However, other classification labels, such as A, B, C, D, and F can be used.
5.1. Support Vector Machine
The SVM model separates the n-dimensional students’ information into high, medium, and low classes. This is by creating a decision boundary, known as a hyperplane, for separation. The hyperplane is generated with the help of the data points in each class that are the closest to the data points in the other class. These data points are known as support vectors. The generation of a hyperplane is an iterative process where the objective is to find the maximum possible margin between the support vectors of the opposite classes. For a students’ performance dataset with a set of
F features and
C ={High, Medium, Low} classes, the hyperplane that separates these classes can be represented using Equation (8).
where
w is normal to the hyperplane and
b is the bias.
To find the maximum possible margin for optimal hyperplane, the norm of the margin should be minimized as stated in Equation (9).
5.2. Random Forest
RF is an ensemble technique that uses a set of Decision Trees. Each tree is constructed using a randomly selected sample of the dataset (Liaw & Wiener, 2002). Each Decision Tree predicts the class for a student (high/medium/low) based on the features and voting is performed on the output of each tree. In RF, each DT model will consider only a randomly selected subset of features at each node for splitting the tree and traversing down. The RF model then decides on the high/medium/low class based on the majority of the votes as stated in Equation (10).
where
N represents the number of Decision Trees used.
6. Performance Analysis
In this section, we compare the performance of the two most used classification models in the domain of students’ performance prediction. RF and SVM. The models are evaluated in terms of Accuracy, and F-measure, with and without feature selection.
6.1. Experimental Environment
To evaluate the performance of the models under study with the feature selection algorithm, we use the Information-Gain Attribute Evaluator algorithm as it is found to be the most accurate among others in education machine learning (Ramaswami & Bhaskaran, 2009). For implementation, we use the sklearn Python library.
6.2. Experiments
Data preprocessing. For the dataset under study, we first convert the categorical features into numerical ones. For this dataset. the separate files for the Mathematics and Portuguese language subjects are combined. We created class labels for the grade to be predicted (‘G3′). This is done by mapping the grades to 5 classes based on the Erasmus grade conversion system (Erasmus Programme, n.d.), i.e., grade A (16-20), grade B (14-15), grade C (12-13), grade D (10-11) and grade F (0-9).
Model Building and Testing. For model building and testing, we use a 10-fold cross-validation method to obtain the training and testing datasets respectively. For the SVM model, we implement the linear kernel. We measure the accuracy, F-measure, for each model. The accuracy is calculated using Equation (11).
where
TP = True Positive = #observations in positive class that are predicted as positive
TN = True Negative = #observations in negative class that are predicted as negative
FP = False Positive = #observations in negative class that are predicted as positive
FN = False Negative = #observations in positive class that are predicted as negative
The F-measure is calculated using precision and recall as stated in Equation (12). The values of precision and recall are calculated using Equations (13) and (14) respectively.
6.3. Experimental Results Analysis
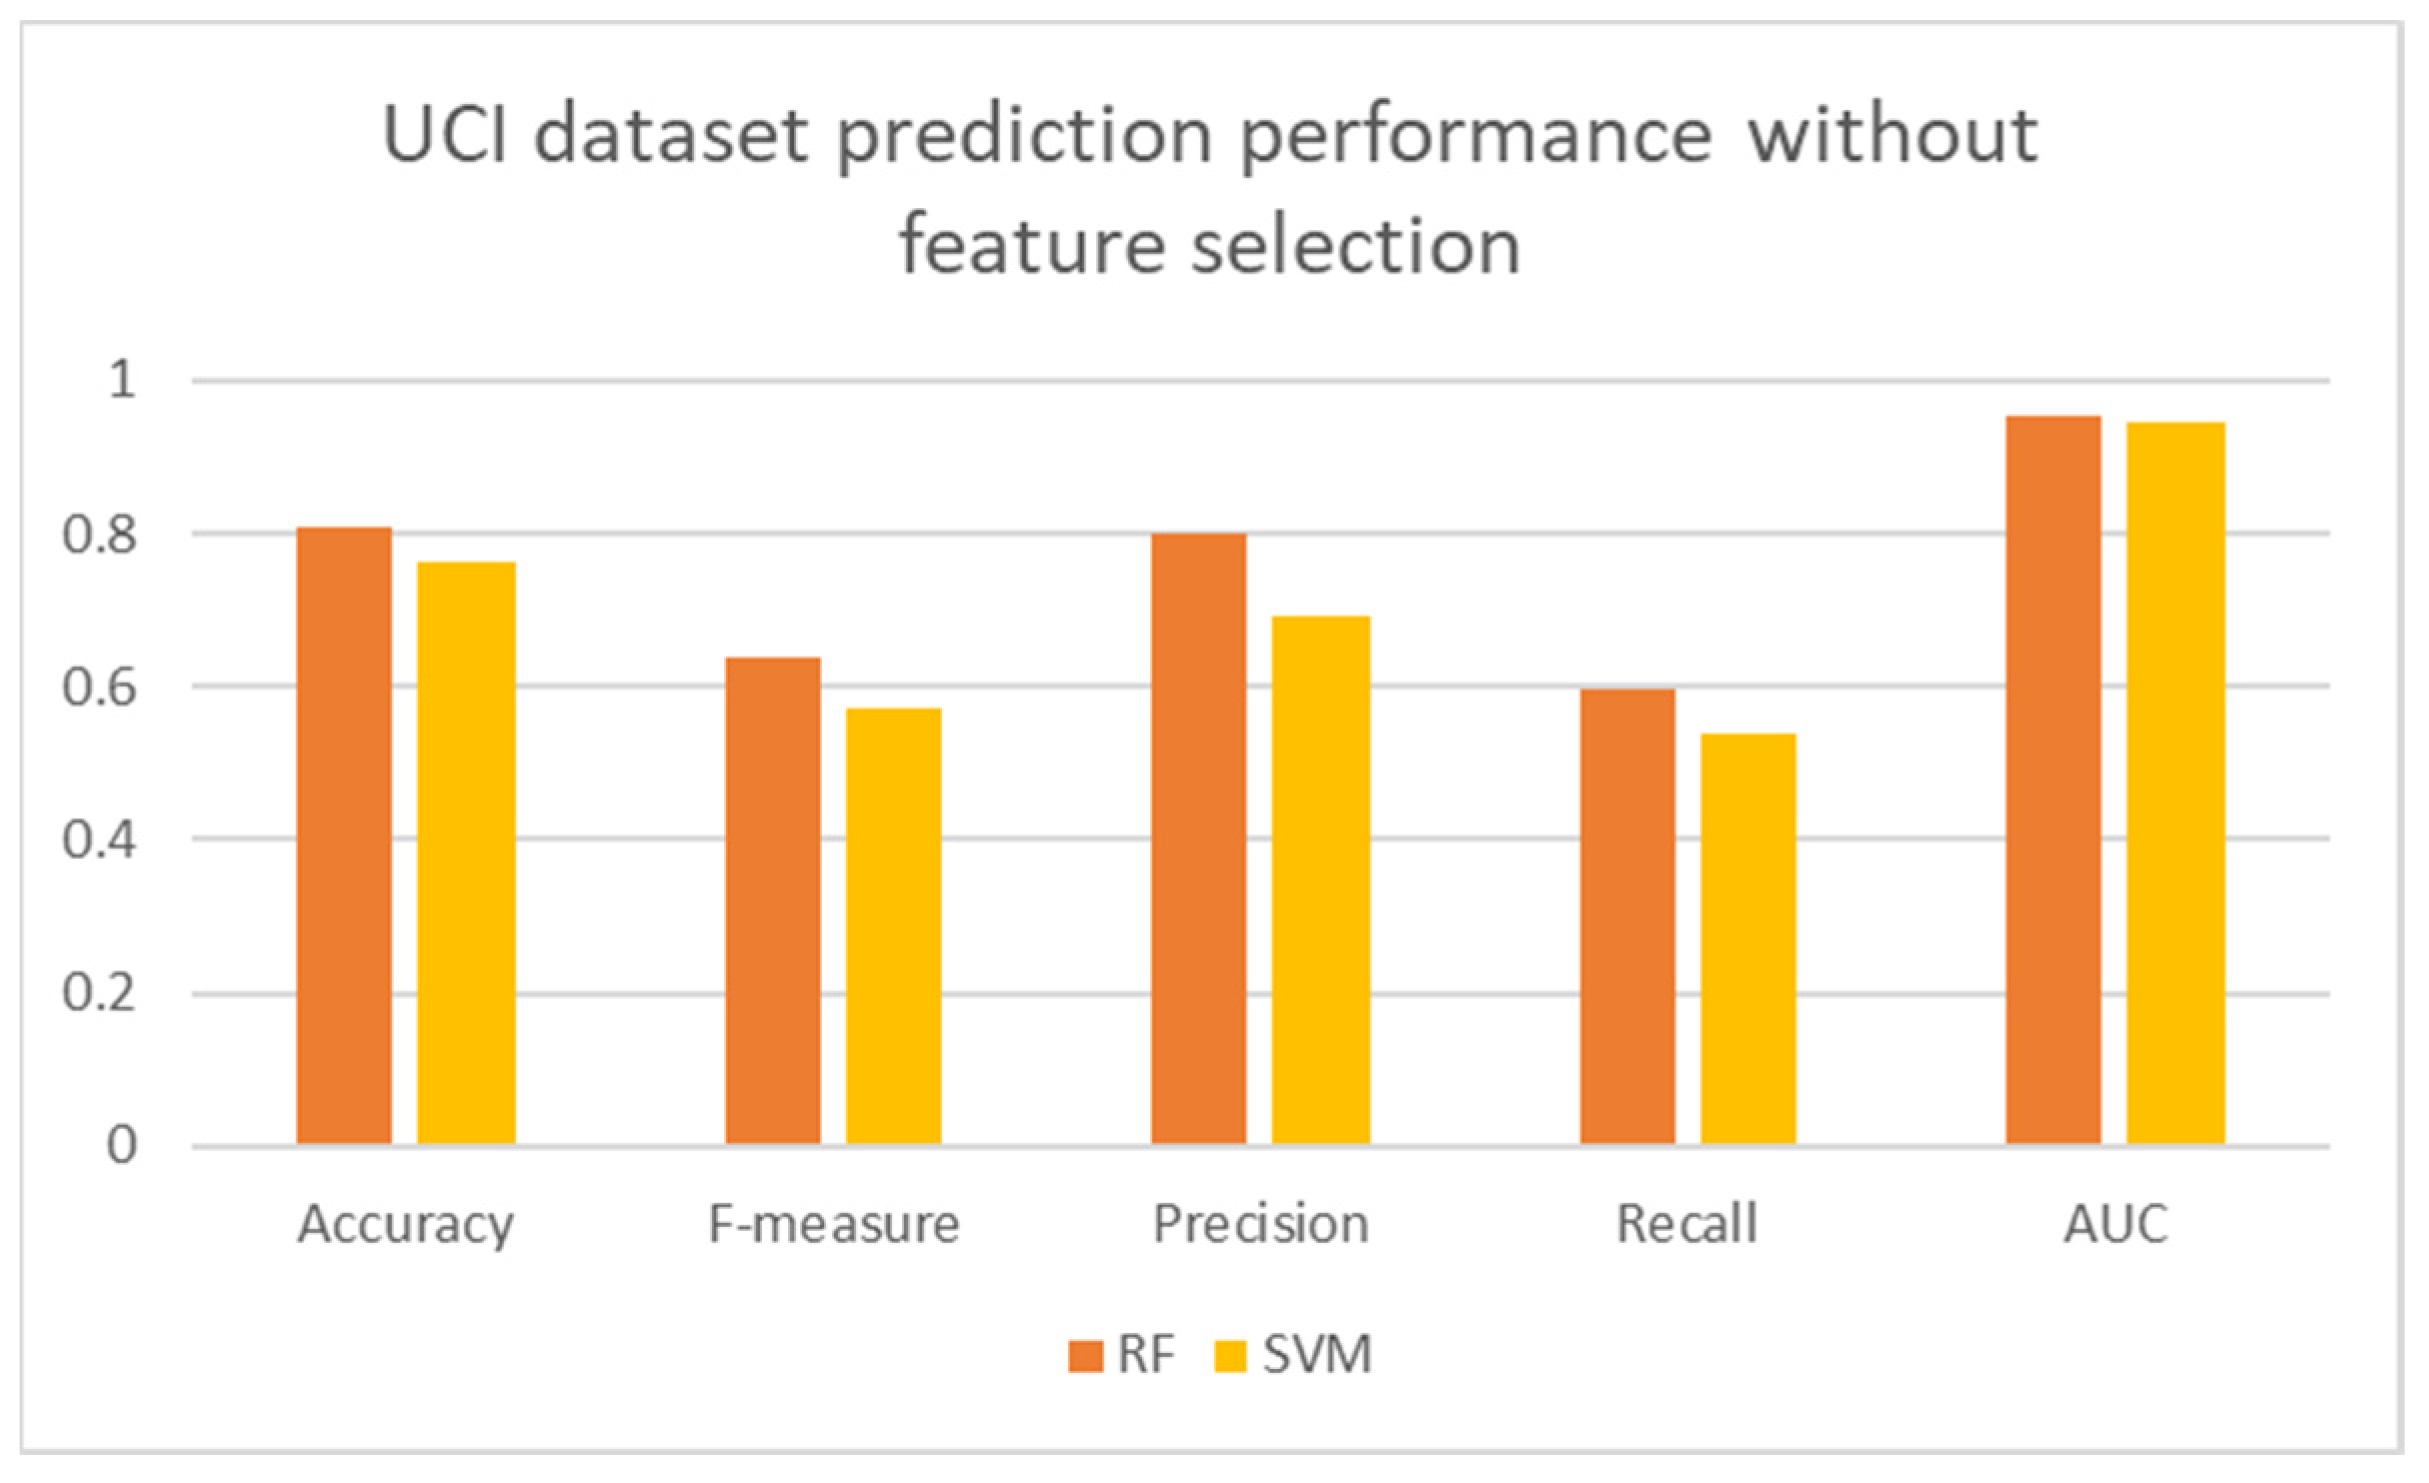
Figure 5 shows the accuracy and F-measure for the dataset without using feature selection. It shows that the RF model has the highest accuracy and F-measure values compared to the other models. This is because RF selects a subset of the features randomly to fit the data while the other models use all the features resulting in overfitting and consequently inaccurate prediction. When applying the feature selection algorithm on the dataset, the selected 10 features are: the previous two grades, G1 and G2, the number of past class failures, the number of school absences, going out with friends, desire for higher education, study time, father’s education, mother’s education. With this dataset we then can see the great influence of the historical results, like previous grade and number of failures in previous years. This importance of previous failures seems to confirm the analysis in section 2, about mature-age students showing less intention to continue to university, because they have lower results, they will not pursue higher education (Shulruf et al., 2008) . The next important factor is the health, it is important in the fact that bad health is associated with lower achievement. This can be correlated and explained by an increased number of absences, and less availability for studying.
Figure 6 shows the accuracy and the F-measure with feature selection. It shows that the performance of the models is enhanced by using the selected features. In particular, the accuracy of SVM is increased by 4.64% and the accuracy for RF is increased by 1.54%.
6.4. Study of data without previous grades
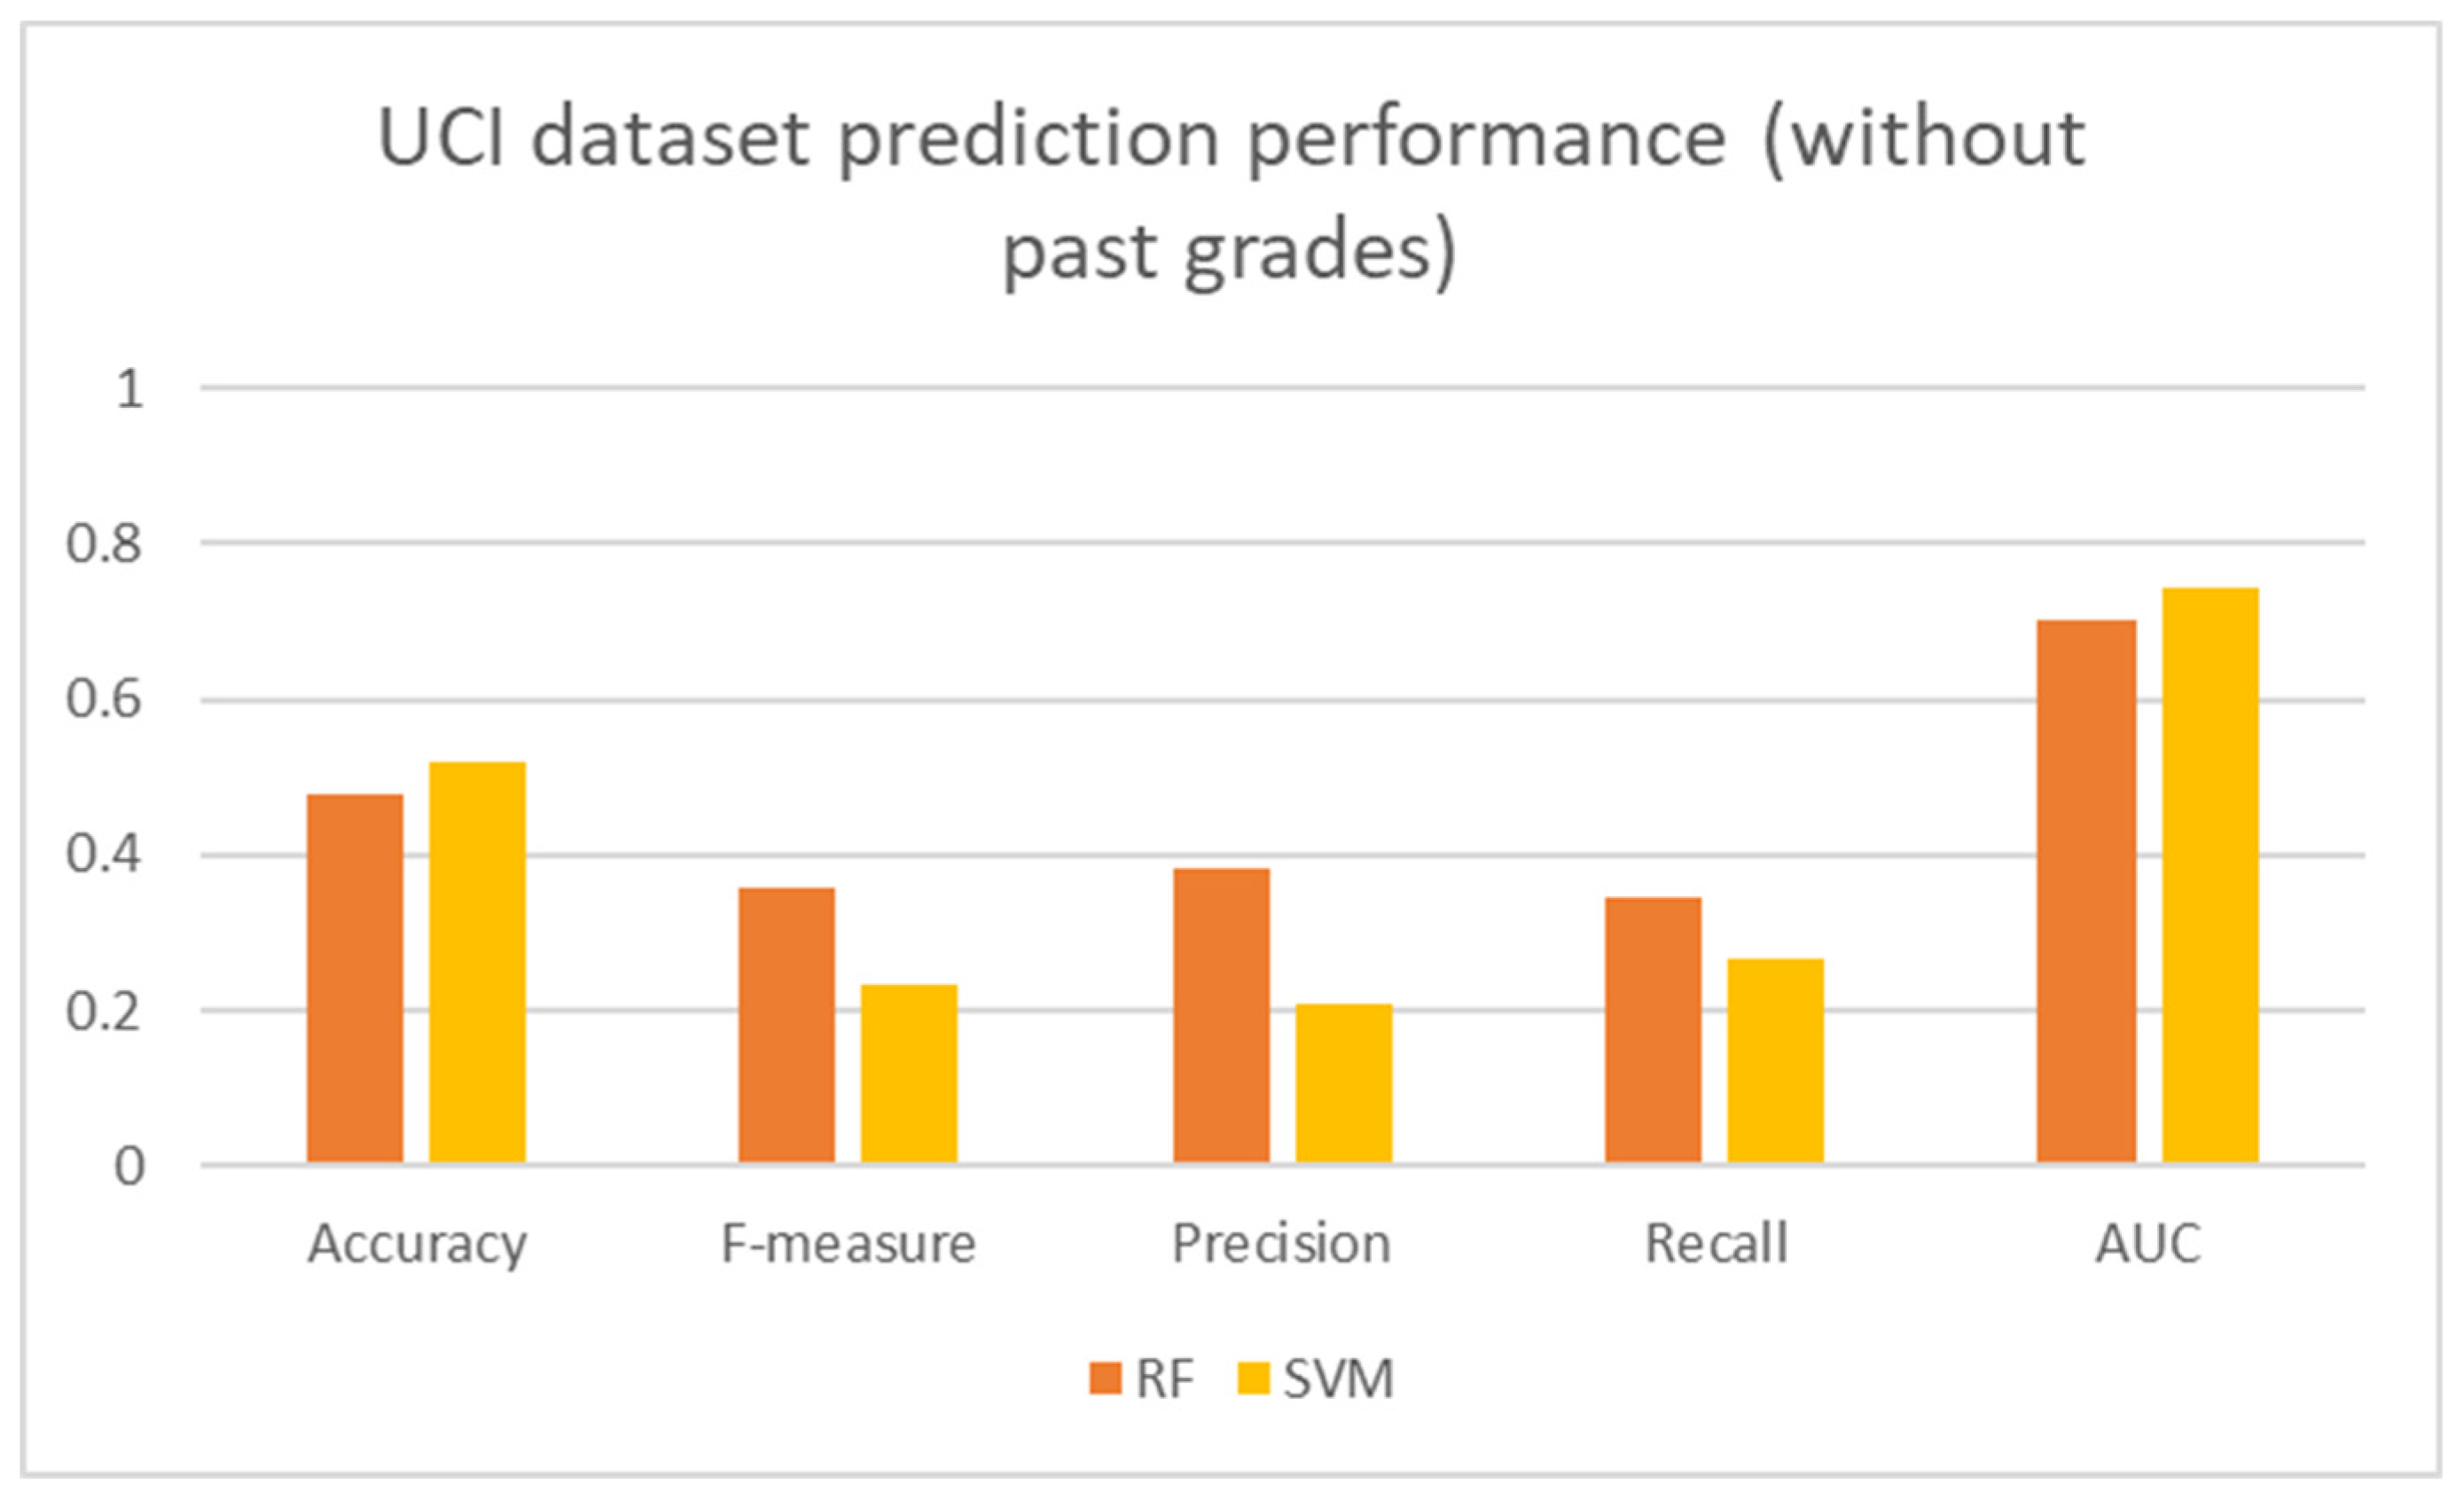
Figure 7 shows that the performance of the models under study decreases significantly when the training is performed on the dataset without the previous grades.
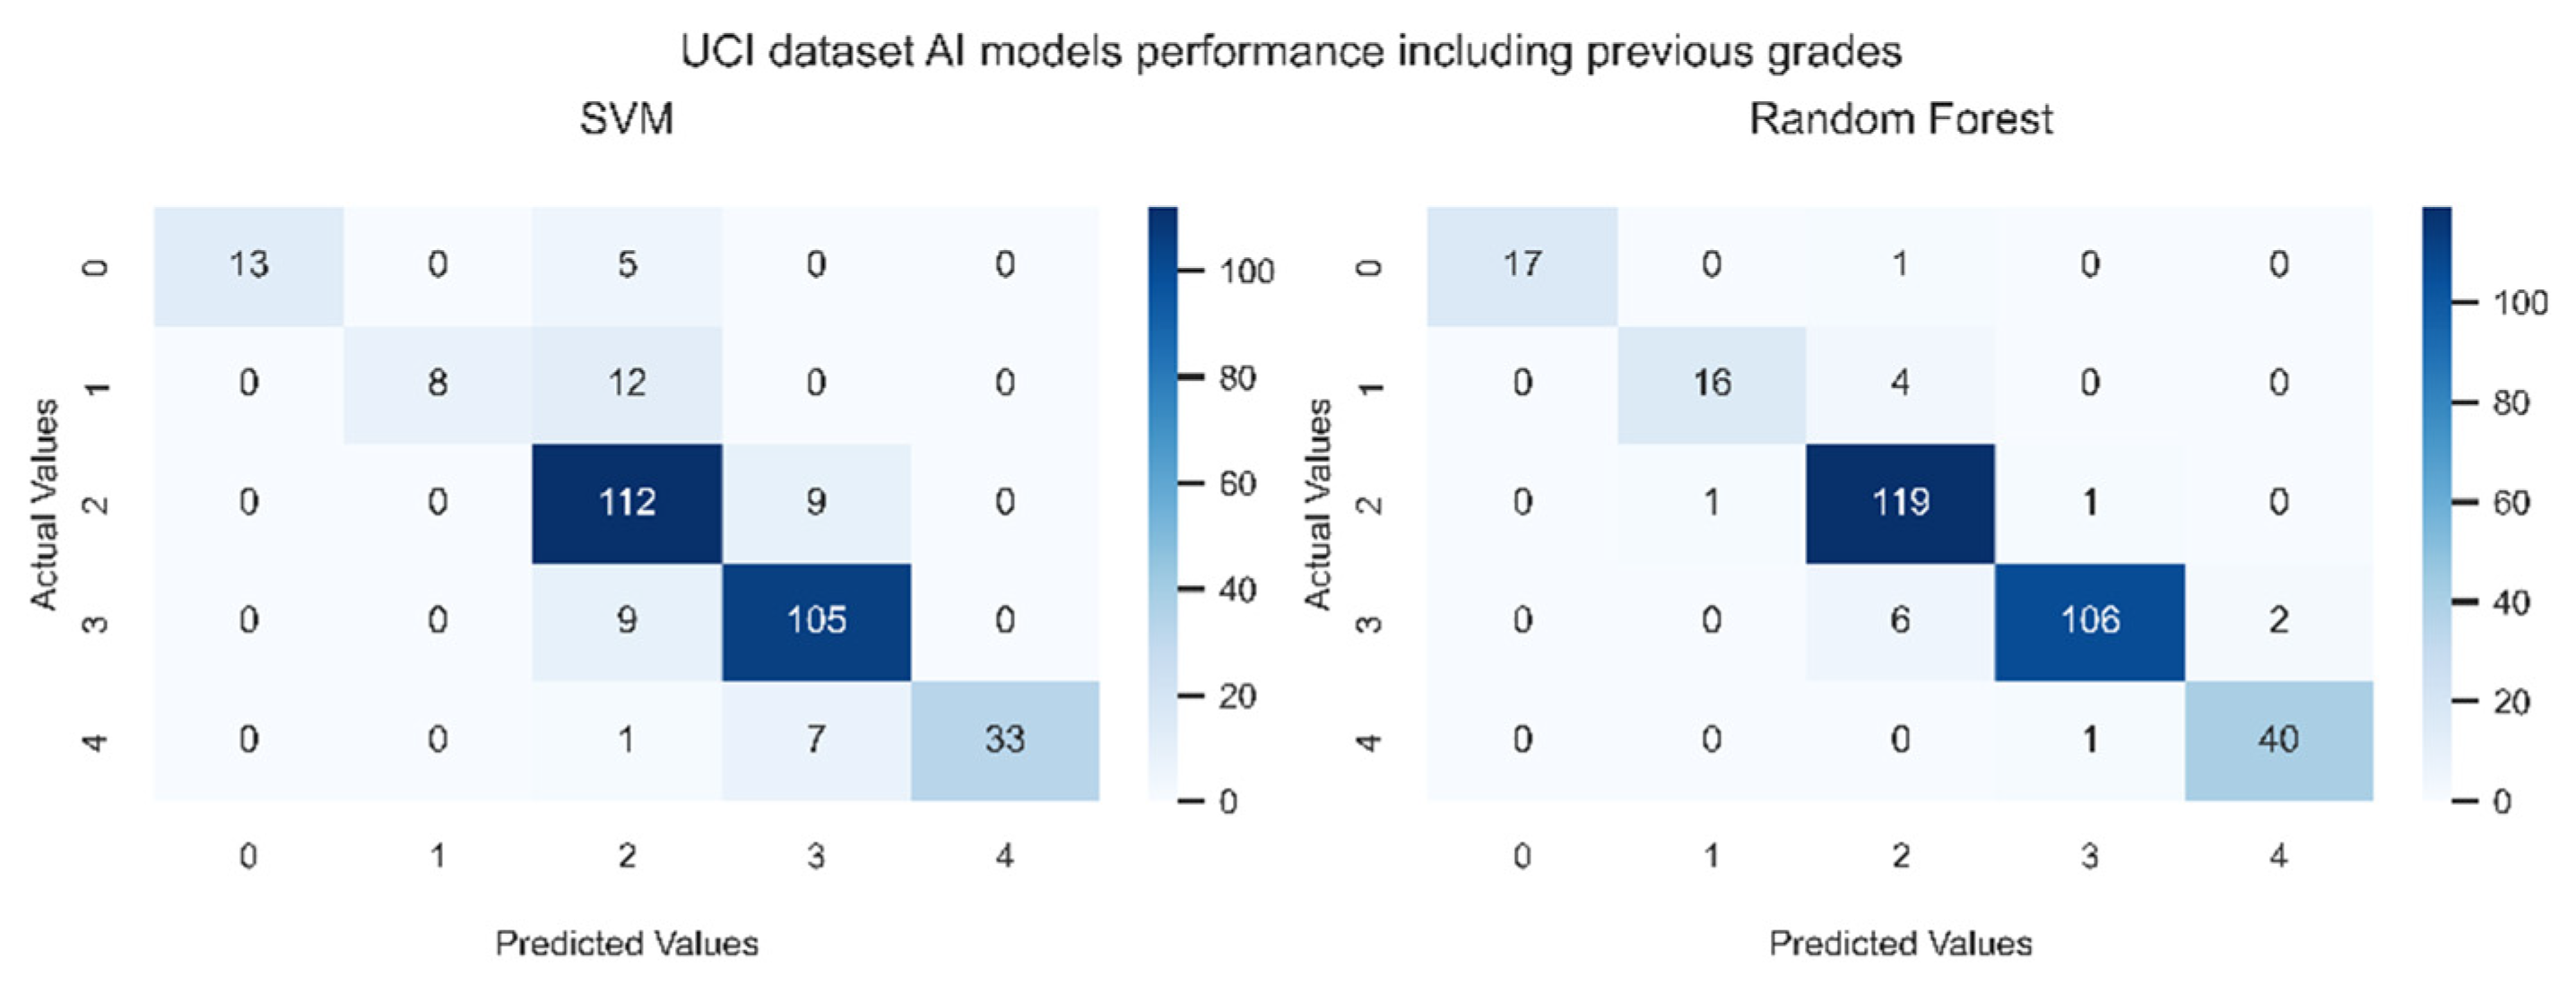
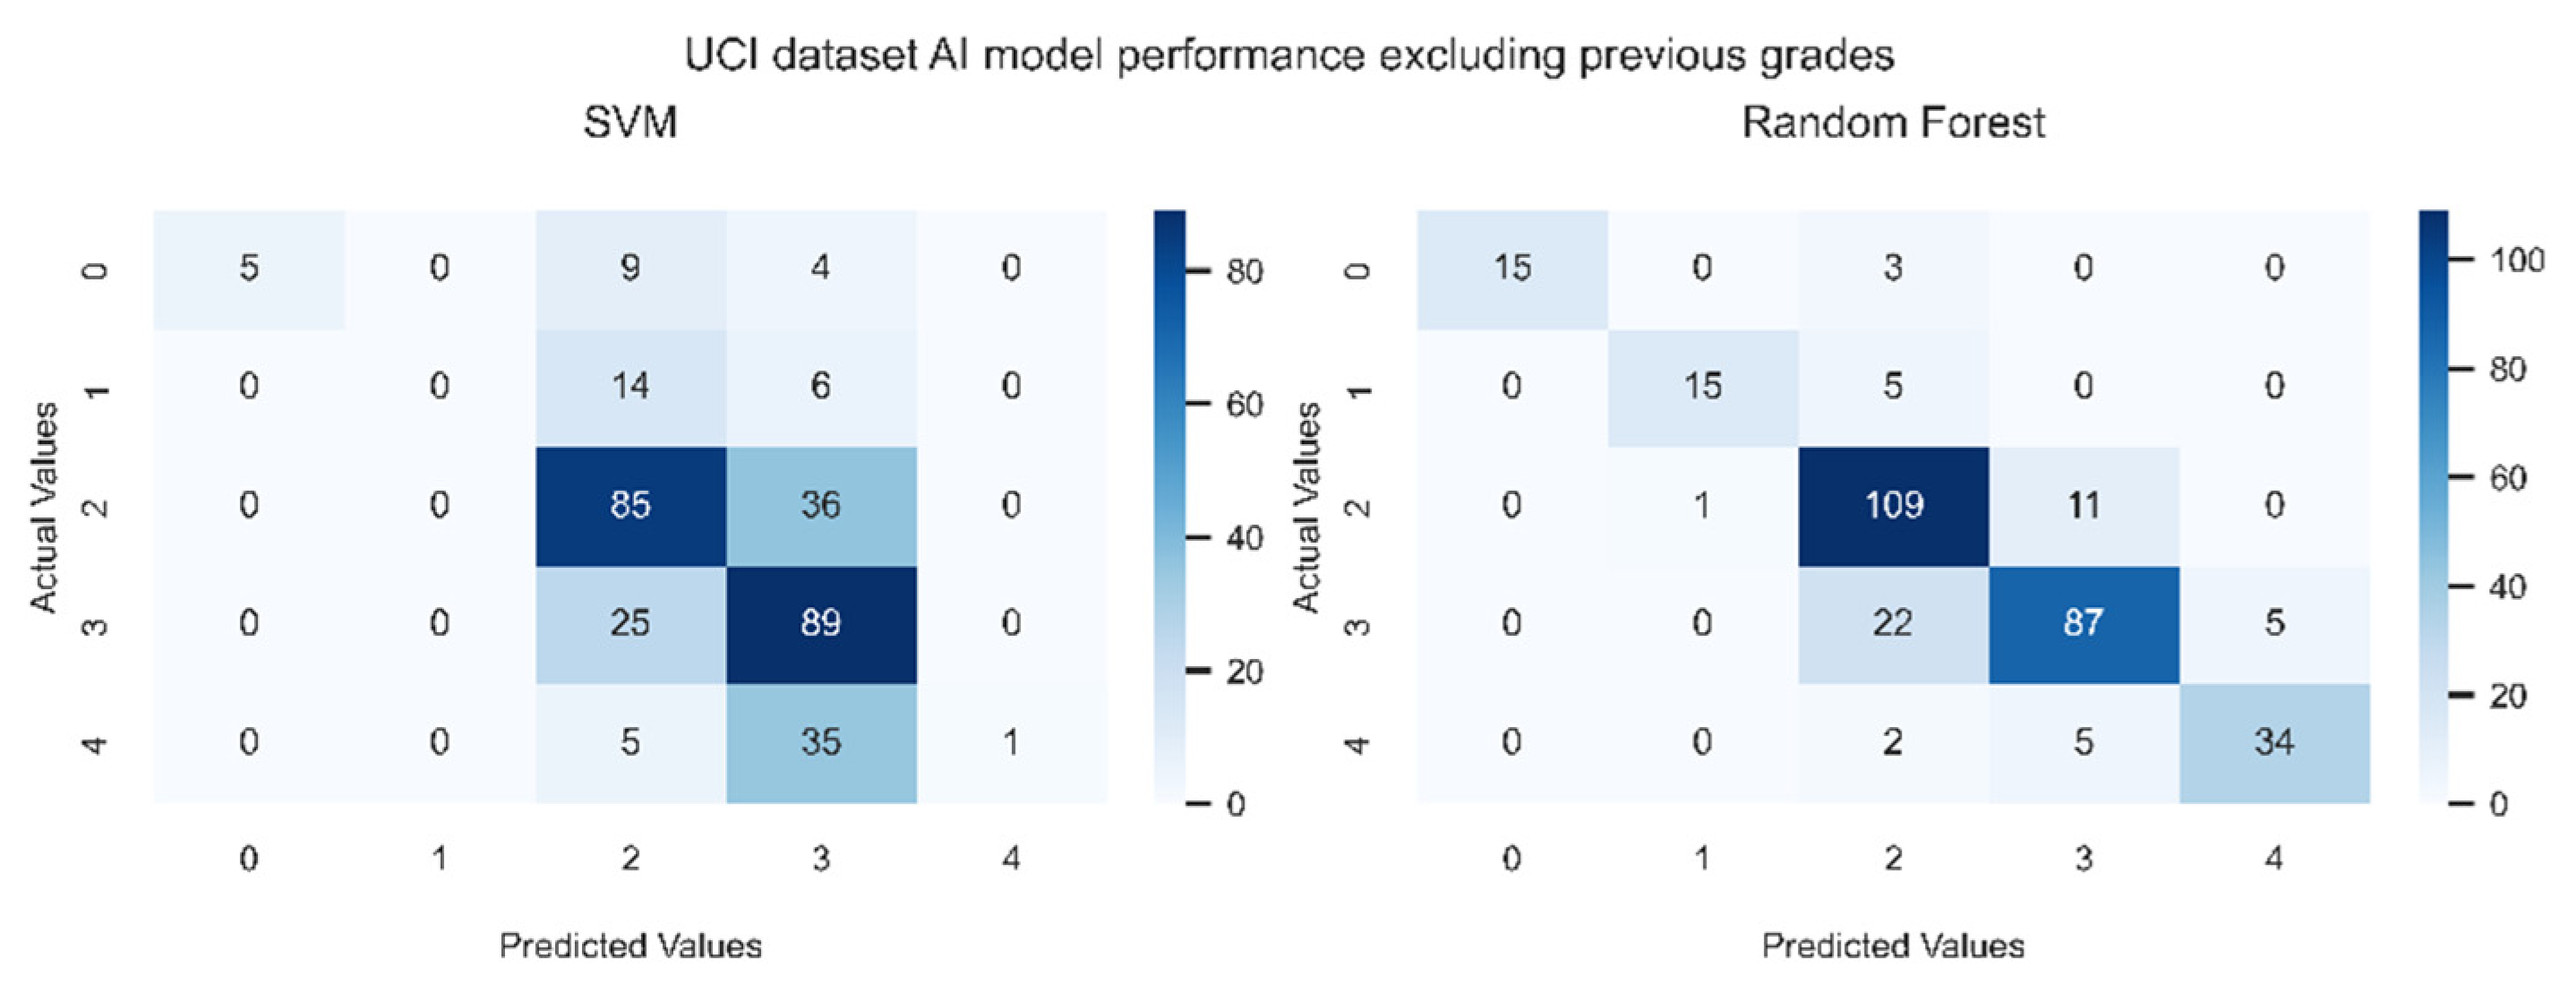
Figure 8 and
Figure 9 show the confusion matrices generated by the models under study with and without using previous grades respectively.
Figure 9 indicates without the previous grades, RF and SVM models are less accurate than when previous grades are available (
Figure 8). However,
Figure 9 reveals that the prediction is not far from the true values, exhibiting the predictive power of the models for students’ performance. In particular, the errors occur in cells where B is chosen instead of C, or C is chosen instead of B, showing that most of the data stays “near” the diagonal of the matrix.
In summary, for the UCI Portuguese dataset having 1044 observations, RF outperforms SVM. Furthermore, the performance of SVM in our experimental environment is the same as in (Tekin, 2014). However, our results are not consistent with the ones obtained by (Ajibade et al., 2019; Kostopoulos et al., 2017; Mehboob et al., 2017; Migueis et al., 2018). The discrepancy in the results is due to heterogeneity in the features used in these works, and they also rely more on grades obtained in previous period of time. The size of the dataset and the features impact the performance of the models. The study of the model’s performance also reveals that prediction is better when using information from the student education-centric category like study time, desire for higher education and number of past failures, from socio-economic category like parent’s education, and from student social centric category like going out with friends.
7. Conclusions
Machine learning is an emerging technology to predict the performance of students with the main goal of developing strategies by educational professionals to improve the learning environment. Several works in the literature have used various machine-learning approaches for the prediction of students’ performance. However, these studies used different datasets and evaluation metrics, making it difficult to compare the developed models. In addition, they did not provide insights into the features from socio-economic and social perspectives. In this chapter, we evaluate and compare the performance of the two most used machine learning classification models, i.e., SVM, and RF, to predict students’ performance using a dataset with a large number of features impacting the performance. We provide a taxonomy categorizing these features and analyze their impact on student performance. Our taxonomy is based on demographic, socio-economic, school environment, student education-centric, student social-centric, and student health-centric factors. We conduct a comparative analysis of the models under study using a real-life student information dataset. Our experimental results show that RF outperforms SVM. In addition, when selecting a machine learning model, it is essential to consider features such as parents’ educational and work background, student study time, number of past class failures, plan for higher education, number of school absences, previous grades, and information about the school. This is because these features improve prediction accuracy. Furthermore, to enable insightful analysis of the features’ impact into student’s performance, it is important to provide a mapping between those features and their corresponding categories that we identified: 1) demographic, 2) socio-economic, 3) school environment, 4) student education-centric, 5) student social-centric, and 6) student health-centric.
References
- Ainsworth, J.W. Why Does It Take a Village? The Mediation of Neighborhood Effects on Educational Achievement. Soc. Forces 2002, 81, 117–152. [Google Scholar] [CrossRef]
- Ajibade, S.-S.M.; Ahmad, N.B.B.; Shamsuddin, S.M. Educational Data Mining: Enhancement of Student Performance model using Ensemble Methods. IOP Conf. Series: Mater. Sci. Eng. 2019, 551. [Google Scholar] [CrossRef]
- Alan, B.K.; Mikael, L. Education for Growth: Why and for Whom? Journal of Economic Litterature 2001, 39, 1101–1136. [Google Scholar]
- Almutairi, S.; Shaiba, H.; Bezbradica, M. Predicting Students’ Academic Performance and Main Behavioral Features Using Data Mining Techniques. International Conference on Computing 2019, 245–259. [Google Scholar]
- Avvisati, F. The measure of socio-economic status in PISA: a review and some suggested improvements. Large-scale Assessments Educ. 2020, 8, 8. [Google Scholar] [CrossRef]
- Bragg, D. D., Loeb, J. W., Gong, Y., Deng, C.-P., Yoo, J. & Hill, J. L. (2002). Transition from High School to College and Work for Tech Prep Participants in Eight Selected Consortia.
- Bugler, M.; McGeown, S.P.; Clair-Thompson, H.S. Gender differences in adolescents’ academic motivation and classroom behaviour. Educ. Psychol. 2013, 35, 541–556. [Google Scholar] [CrossRef]
- Chavous, T.; Cogburn, C. D. Superinvisible Women: Black Girls and Women in Education. Black Women, Gender + Families 2007, 1, 24–51. [Google Scholar]
- Chevalier, A.; Lanot, G. The Relative Effect of Family Characteristics and Financial Situation on Educational Achievement. Educ. Econ. 2002, 10, 165–181. [Google Scholar] [CrossRef]
- Cortez, P. & Silva, A. M. G. (2008). Using data mining to predict secondary school student performance.
- Costa, E.B.; Fonseca, B.; Santana, M.A.; De Araújo, F.F.; Rego, J. Evaluating the effectiveness of educational data mining techniques for early prediction of students' academic failure in introductory programming courses. Comput. Hum. Behav. 2017, 73, 247–256. [Google Scholar] [CrossRef]
- Daleure, G.M.; Albon, R.; Hinkston, K.; Ajaif, T.; McKeown, J. Family Involvement in Emirati College Student Education and Linkages to High and Low Achievement in the Context of the United Arab Emirates. FIRE: Forum Int. Res. Educ. 2014, 1, 2. [Google Scholar] [CrossRef]
- Daud, A. , Aljohani, N. R., Abbasi, R. A., Lytras, M. D., Abbas, F. & Alowibdi, J. S. (2017). Predicting Student Performance using Advanced Learning Analytics. S. ( 2017). Predicting Student Performance using Advanced Learning Analytics. Proceedings of the 26th International Conference on World Wide Web Companion, 415–421.
- Eamon, M.K. Social-Demographic, School, Neighborhood, and Parenting Influences on the Academic Achievement of Latino Young Adolescents. J. Youth Adolesc. 2005, 34, 163–174. [Google Scholar] [CrossRef]
-
Erasmus Programme. (n.d.). Retrieved December 18, 2020. Available online: https://en.wikipedia.org/wiki/Erasmus_Programme.
- Eric Hanushek. (2016). Education and the nation’s future. In Blueprint for America (pp. 89–108).
- Farooq, M.S.; Chaudhry, A.H.; Shafiq, M.; Berhanu, G. Factors affecting students’ quality of academic performance: A case of secondary school level. Journal of Quality and Technology Management 2011, 77, 1–14. [Google Scholar]
- Gutman, L.M.; McLoyd, V.C. Parents' Management of Their Children's Education Within the Home, at School, and in the Community: An Examination of African-American Families Living in Poverty. Urban Rev. 2000, 32, 1–24. [Google Scholar] [CrossRef]
- Hochschild, J.L. Social Class in Public Schools. J. Soc. Issues 2003, 59, 821–840. [Google Scholar] [CrossRef]
- Irwin, S.; Elley, S. Parents' Hopes and Expectations for Their Children's Future Occupations. Sociol. Rev. 2013, 61, 111–130. [Google Scholar] [CrossRef]
- Ismail, L., Materwala, H. & Hennebelle, A. (2021). Comparative Analysis of Machine Learning Models for Students’ Performance Prediction. International Conference on Advances in Digital Science, 149–160.
- Ismail, L. & Zhang, L. (2018). Information innovation technology in smart cities. [CrossRef]
- Kiu, C.-C. (2018). Data Mining Analysis on Student’s Academic Performance through Exploration of Student’s Background and Social Activities. 2018 Fourth International Conference on Advances in Computing, Communication & Automation (ICACCA).
- Kostopoulos, G., Lipitakis, A.-D., Kotsiantis, S. & Gravvanis, G. (2017). Predicting student performance in distance higher education using active learning. International Conference on Engineering Applications of Neural Networks, 75–86.
- Liaw, A.; Wiener, M. Classification and Regression by RandomForest. R News 2002, 2, 18–22. [Google Scholar]
- Lincoln, D. & Tindle, E. (2000). Mature age students in transition : factors contributing to their success in first year. 4th Pacific Rim First Year in Higher Education Conference (FYHE) : Creating Futures for a New Milennium.
- Lopez, M. I., Luna, J. M., Romero, C. & Ventura, S. (2012). Classification via clustering for predicting final marks based on student participation in forums. International Educational Data Mining Society.
- McKenzie, K.; Gow, K. Exploring the first year academic achievement of school leavers and mature-age students through structural equation modelling. Learn. Individ. Differ. 2004, 14, 107–123. [Google Scholar] [CrossRef]
- McLanahan, S. & Garfinkel, I. (2000). The Fragile Families and Child Wellbeing Study: Questions, Design and a Few Preliminary Results.
- Mehboob, B.; Muzamal Liaqat, R.; Abbas, N. Student performance prediction and risk analysis by using data mining approach. Journal of Intelligent Computing 2017, 8. [Google Scholar]
- Miguéis, V.; Freitas, A.; Garcia, P.J.; Silva, A. Early segmentation of students according to their academic performance: A predictive modelling approach. Decis. Support Syst. 2018, 115, 36–51. [Google Scholar] [CrossRef]
- Moore, C.M. The Role of School Environment in Teacher Dissatisfaction Among U.S. Public School Teachers. SAGE Open 2012, 2, 215824401243888. [Google Scholar] [CrossRef]
- O'Malley, M.; Voight, A.; Renshaw, T.L.; Eklund, K. School climate, family structure, and academic achievement: A study of moderation effects. Sch. Psychol. Q. 2015, 30, 142–157. [Google Scholar] [CrossRef] [PubMed]
- OpenAI. (2022). ChatGPT. Available online: https://chat.openai.com.
- Ramanaik, S.; Collumbien, M.; Prakash, R.; Howard-Merrill, L.; Thalinja, R.; Javalkar, P.; Murthy, S.; Cislaghi, B.; Beattie, T.; Isac, S.; et al. Education, poverty and "purity" in the context of adolescent girls' secondary school retention and dropout: A qualitative study from Karnataka, southern India. PLOS ONE 2018, 13, e0202470. [Google Scholar] [CrossRef] [PubMed]
- Ramaswami, M.; Bhaskaran, R. A Study on Feature Selection Techniques in Educational Data Mining. Journal of Computing 2009, 1, 7–11. [Google Scholar]
- Ramey, S.L.; Ramey, C.T. Early educational intervention with disadvantaged children—To what effect? Appl. Prev. Psychol. 1992, 1, 131–140. [Google Scholar] [CrossRef]
- Rimadana, M. R., Kusumawardani, S. S., Santosa, P. I. & Erwianda, M. S. F. (2019). Predicting Student Academic Performance using Machine Learning and Time Management Skill Data. 2019 International Seminar on Research of Information Technology and Intelligent Systems (ISRITI), 511–515.
- Rivas, A.; González-Briones, A.; Hernández, G.; Prieto, J.; Chamoso, P. Artificial neural network analysis of the academic performance of students in virtual learning environments. Neurocomputing 2020, 423, 713–720. [Google Scholar] [CrossRef]
- Sheard, M. Hardiness commitment, gender, and age differentiate university academic performance. Br. J. Educ. Psychol. 2009, 79, 189–204. [Google Scholar] [CrossRef]
- Shulruf, B.; Hattie, J.; Tumen, S. Individual and school factors affecting students’ participation and success in higher education. High. Educ. 2008, 56, 613–632. [Google Scholar] [CrossRef]
- Spencer, R.; Walsh, J.; Liang, B.; Mousseau, A.M.D.; Lund, T.J. Having It All? A Qualitative Examination of Affluent Adolescent Girls’ Perceptions of Stress and Their Quests for Success. J. Adolesc. Res. 2016, 33, 3–33. [Google Scholar] [CrossRef]
- Tekin, A. Early Prediction of Students’ Grade Point Averages at Graduation: A Data Mining Approach. Eurasian J. Educ. Res. 2014, 14, 207–226. [Google Scholar] [CrossRef]
- Thompson, G.; Hogan, A.; Rahimi, M. Private funding in Australian public schools: a problem of equity. Aust. Educ. Res. 2019, 46, 893–910. [Google Scholar] [CrossRef]
- United Nations. (2020, 4. August). Policy Brief: Education during COVID-19 and beyond (August 2020). Available online: https://reliefweb.int/report/world/policy-brief-education-during-covid-19-and-beyond-august-2020.
|
Disclaimer/Publisher’s Note: The statements, opinions and data contained in all publications are solely those of the individual author(s) and contributor(s) and not of MDPI and/or the editor(s). MDPI and/or the editor(s) disclaim responsibility for any injury to people or property resulting from any ideas, methods, instructions or products referred to in the content. |
© 2023 by the authors. Licensee MDPI, Basel, Switzerland. This article is an open access article distributed under the terms and conditions of the Creative Commons Attribution (CC BY) license (http://creativecommons.org/licenses/by/4.0/).
