
Submitted:
16 August 2023
Posted:
18 August 2023
You are already at the latest version
Abstract
Consumer preference for products made from transgenic technology has been widely studied, yet few studies exist exploring the factors influencing producers’ adoption of transgenic technology. Based on field surveys in Chinese provinces of Shanxi, Henan and Shandong, we employed a gambling experiment to capture producers’ risk preferences by estimating their risk aversion coefficients. We further estimated producers’ risk amplification and risk perception of GM technology. Using ordered logit model and Poisson model we identified the major factors influencing producers’ adoption of transgenic technology. We found the factors impacted the decision of producers from different regions in different ways. The results showed that over 60% of participants amplified the risk of transgenic crops. When there was potential risk, producers might not be rational even if they had high level of knowledge and cognition about the technology. Our results shed light on government policies aiming to increase the adoption of new technologies by producers.
Keywords:
Risk amplification effect
; Risk preference
; GM agricultural products
; China
1. Introduction
Innovation and reform promote economic and societal
development [1], but it is often accompanied
by uncertainty and risk [2]. According to the
society amplification framework of risk (SARF), the risk of events can be
amplified through government authority, expert opinions, traditional mass
media, relatives and friends, internet communities and other channels [3,4]. This “groundless worry” behavior will hinder
the effectiveness of market or policy interventions, which can slow down
product or technology adoption and even the speed of economic growth [5]. This paper uses transgenic crops as an example
product to investigate the factors influencing producers’ adoption of new
technologies under risk amplification. In the 1990s, transgenic cash crops such
as insect-resistant cotton were introduced into in China’s Henan and Shandong
provinces and achieved great success [6].
Transgenic crops mainly include soybean, corn, cotton and rapeseed. China has
carried out transgenic research for these crops and developed transgenic
varieties. However, few varieties have yet to be commercialized on a large
scale.
Risk involves uncertainty about the effects of an
activity with respect to something of value. Risk amplification theory says
that certain aspects of a risk portrayed in mediated sources can interact with
psychological processes in ways that might decrease or amplify people’s
perceptions of the risk and, in turn, shape their behaviors. Based on previous
research, three aspects of risk are key to understand producers’ technology
adoption behavior: risk amplification effects, individual risk preferences, and
individual characteristics.
The risk amplification effect was first proposed by
Kasperson et al. [4]. A risk signal may
strengthen or weaken the public’s cognitive ability through the joint action of
a variety of factors. Risks are amplified at different levels and links. Taking
gender imbalance as an example, Slovic stated that in group events, the risk
has been amplified in information fermentation, psychological identity, and
absence of government to public response [7].
According to the “anchoring effect,” Tversky and Kahneman believed that in
uncertain situations, people often estimate the target value through the
initial value, and the public’s risk perception is difficult to correct itself [8]. As a topic most closely related to people’s
health, the risk of food safety is very easy to be amplified. In addition, SARF
is often used as a classic auxiliary tool for learning risk concepts. Using
SARF, Kim et al. discussed the influence of risk perception of pesticide
residues on purchase intention [9]; Lee et al.
studied consumers’ risk perception and willingness to pay for genetically
modified food [10]; and Li and Zhang examined
Chinese consumers’ willingness to buy GM papaya, and investigated how different
dimensions of media-reported risk impacted consumers’ acceptance of GM
agricultural products [11].
Individual and household characteristics of
producers are also important factors impacting their risk perception. When
describing individual characteristics, the most frequently used variables are
age, farming experience (in years), gender, capital status, education level,
etc. Awotide et al. found that in reality, men are more likely to adopt
technology than women [12]. Tanaka et al.
investigated how wealth, political history, occupation and other demographic
variables are related to risk perception, time discounting and trust in Vietnam
[13]. The study showed people in richer
villages are less averse to loss and more patient compared to those in poorer
ones. Farmers with more household members are in the labor force are more
willing to adopt new technologies [14]. Korir
et al. found that the higher the level of education, the higher the likelihood
of adoption [15]. The financial status affects
the adoption of new technologies to a certain extent [16].
Huang et al. studied how cotton farmers’ knowledge, risk preference, market
regulation, and pesticide price and education level influence their pesticide
application [17]. More recent research added
more variables to individual characteristics.
Finally, producer risk preference plays an
important role in their new technology adoption decision. Previous research has
found producers are generally risk averse and the higher the degree of risk
aversion, the more likely the producers do not adopt or delay the adoption of
new technologies. Liu discussed how Chinese farmers’ risk attitudes impact
Chinese farmers’ adoption of a new form of agricultural biotechnology and
concluded risk-averse farmers adopt GM cotton later than the farmers who are
less risk-averse [6]. When asked why
insect-resistant cotton was not adopted immediately, 97% farmers indicated it
was mainly because of its uncertainty in reducing insect pests [18]. Risk aversion is an important factor hindering
the extension of agricultural technology [19,20].
Luo et al. found that risk seeking has a significant positive impact on the
adoption of new technologies [21].
Researchers have also reached similar conclusions
when studying consumer new product adoption decisions. Lusk and Coble, Zhou et
al. and Zhang et al. found that the higher the degree of risk aversion, the
less likely for consumers to adopt new technologies [22–24].
The former two studies found that most individuals are risk averse, and only a
small number of individuals are risk seeking; the third study concluded that
risk-seeking consumers are more likely to choose uncertain promotional
activities. Gambling experiments, which asks individuals to make lottery
choices, are often used capture an individual’s risk preference. The most
classic methods are Binswanger’s orderly lottery selection design (OLS design) [25] and Holt and Laury’s multiple price sequence
design (MPL design) [26], in which MPL design
is regarded as the “gold standard” for risk preference measurement experiment.
The former designs eight different lotteries and then sorts them. The subjects
choose one of them, and the income is determined by the selected lottery. In
MPL, subjects see a series of paired options and choose one for each row.
Harrison et al. expanded MPL and developed turning multiple price sequence
design (sMPL) and iterative multiple price sequence design (iMPL) [27]. The difference between sMPL experimental
design and MPL design is that in sMPL subjects only need to choose the
switching point from lottery A to lottery B.
Based on the risk amplification degree and risk
preference of Chinese producers for GM crops, this paper explores the major
factors influencing producers’ adoption of new technologies. Specifically, we
aim to find answers the following questions: Are producers’ perceived risks of
GM crops amplified? What are the factors influencing producers’ adoption of GM
crops? What the government can do to speed up GM technology adoption by
producers? Using data collected through questionnaire survey and economic
experiments with producers in three Chinese provinces this study measures
producers’ risk aversion degree, explores the impacts of producers’ risk
amplification, individual characteristics, risk cognition and preference on
their adoption of transgenic technologies.
2. Materials and Methods
2.1. Field Surveys
Field surveys were carried out with producers in
rural areas of China’s Henan, Shanxi, and Shandong provinces to understand
producers’ cognition and attitude towards GM crops. After dropping unusable
questionnaires, 338 valid questionnaires were used in this analysis, including
95 participants in Henan, 149 participants in Shanxi, and 94 participants in Shandong.
Each participant who completed the survey received 5 yuan, plus the earnings
from lottery series in the gambling experiment.
The questionnaire consisted of three sections: The
first section is about individual and household characteristics. Participants
need to answer eight questions about household and individual information.
Before filling in the questionnaire, the experiment moderator repeatedly
stressed that the information obtained was completely confidential and only
used for academic research, to obtain real information. The second part
included multiple-choice questions on consumption habits, genetic knowledge,
and attitude towards the risk of GM technology, risk perception and the
acceptance of GM agricultural products. Participants were told in advance that
there was no right or wrong choice for these questions1. The third
part consisted of the sMPL experiment. The experimental difficulty of this part
mainly lies in the complexity of the rules of the game and the way to determine
the income. To help participants better understand the sMPL experiment, two
moderators provided detailed explanations about how the experiment would work
and answered questions related to mechanism of the experiment. The sMPL
experiment consisted of three series of lotteries. Participants needed to
select a switching point for each series. After the selection was done by a
participant, one of the three selected lotteries was randomly drawn to
determine the participant’s monetary return. The participants were paid off
according to the lottery randomly drawn. Because participants did not know
which lottery will be drawn in advance, this experimental method made
participants pay attention to each choice and were more likely to reveal their
true preferences. This experiment will be described in detail in the next
section.
The second part of the questionnaire was
deliberately designed to check the validity of participants’ answers. Some
questions were asked multiple times in different ways, and some options were
reverse coded.
2.2. Economic Experiment Design
In the gambling experiment using experimental
economics, participants needed to answer questions in the following form:
“I choose lottery A from line 1 to line n”; “I
choose lottery B from lines n to 14.”
Under the hypothesis of rationality of economics,
in each series, participants can only switch from option A to option B once, or
would not switch at all (only choose A or only choose B)2. The first
two series had only positive returns. In series 1, option A is “30% chance to
get 8 yuan and 70% chance to get 2 yuan;” In option B, when moving down, the
return with small probability was increasing. In series 2, option A is “90%
chance to get 8 yuan and 10% chance to get 6 yuan;” in option B, when moving
down, the return with high probability was increasing. The return in option B
of series 2 was lower than that of series 1. In prospect theory, people’s risk
preference in the domain of gain differs from that in the domain of loss.
Therefore, series 3 was to measure whether producers maintained the same risk
preference when facing both gain and loss. The three lottery series used in the
experiment are shown in Table 1.

Table 1.
Lottery series used in the gambling experiment.
| TL | Option A | Option B |
| Series1 | ||
| 1 | get 8 yuan with 30%,get 2 yuan with 70% | get 0.5 yuan with 90%,get 10 yuan with 10% |
| 2 | get 8 yuan with 30%,get 2 yuan with 70% | get 0.5 yuan with 90%,get 13 yuan with 10% |
| 3 | get 8 yuan with 30%,get 2 yuan with 70% | get 0.5 yuan with 90%,get 16 yuan with 10% |
| 4 | get 8 yuan with 30%,get 2 yuan with 70% | get 0.5 yuan with 90%,get 19 yuan with 10% |
| 5 | get 8 yuan with 30%,get 2 yuan with 70% | get 0.5 yuan with 90%,get 22 yuan with 10% |
| 6 | get 8 yuan with 30%,get 2 yuan with 70% | get 0.5 yuan with 90%,get 25 yuan with 10% |
| 7 | get 8 yuan with 30%,get 2 yuan with 70% | get 0.5 yuan with 90%,get 28 yuan with 10% |
| 8 | get 8 yuan with 30%,get 2 yuan with 70% | get 0.5 yuan with 90%,get 33 yuan with 10% |
| 9 | get 8 yuan with 30%,get 2 yuan with 70% | get 0.5 yuan with 90%,get 38 yuan with 10% |
| 10 | get 8 yuan with 30%,get 2 yuan with 70% | get 0.5 yuan with 90%,get 45 yuan with 10% |
| 11 | get 8 yuan with 30%,get 2 yuan with 70% | get 0.5 yuan with 90%,get 55 yuan with 10% |
| 12 | get 8 yuan with 30%,get 2 yuan with 70% | get 0.5 yuan with 90%,get 65 yuan with 10% |
| 13 | get 8 yuan with 30%,get 2 yuan with 70% | get 0.5 yuan with 90%,get 80 yuan with 10% |
| 14 | get 8 yuan with 30%,get 2 yuan with 70% | get 0.5 yuan with 90%,get 100 yuan with 10% |
| Series 2 | ||
| 1 | get 8 yuan with 90%,get 6 yuan with 10% | get 0.5 yuan with 30%,get 9 yuan with 70% |
| 2 | get 8 yuan with 90%,get 6 yuan with 10% | get 0.5 yuan with 30%,get 10 yuan with 70% |
| 3 | get 8 yuan with 90%,get 6 yuan with 10% | get 0.5 yuan with 30%,get 11 yuan with 70% |
| 4 | get 8 yuan with 90%,get 6 yuan with 10% | get 0.5 yuan with 30%,get 12 yuan with 70% |
| 5 | get 8 yuan with 90%,get 6 yuan with 10% | get 0.5 yuan with 30%,get 13 yuan with 70% |
| 6 | get 8 yuan with 90%,get 6 yuan with 10% | get 0.5 yuan with 30%,get 14 yuan with 70% |
| 7 | get 8 yuan with 90%,get 6 yuan with 10% | get 0.5 yuan with 30%,get 15 yuan with 70% |
| 8 | get 8 yuan with 90%,get 6 yuan with 10% | get 0.5 yuan with 30%,get 17 yuan with 70% |
| 9 | get 8 yuan with 90%,get 6 yuan with 10% | get 0.5 yuan with 30%,get 19 yuan with 70% |
| 10 | get 8 yuan with 90%,get 6 yuan with 10% | get 0.5 yuan with 30%,get 21 yuan with 70% |
| 11 | get 8 yuan with 90%,get 6 yuan with 10% | get 0.5 yuan with 30%,get 23 yuan with 70% |
| 12 | get 8 yuan with 90%,get 6 yuan with 10% | get 0.5 yuan with 30%,get 25 yuan with 70% |
| 13 | get 8 yuan with 90%,get 6 yuan with 10% | get 0.5 yuan with 30%,get 29 yuan with 70% |
| 14 | get 8 yuan with 90%,get 6 yuan with 10% | get 0.5 yuan with 30%,get 35 yuan with 70% |
| Series 3 | ||
| 1 | get 12 yuan with 50%,lose 2 yuan with 50% | get 15 yuan with 50%,lose 10 yuan with 50% |
| 2 | get 2 yuan with 50%,lose 2 yuan with 50% | get 15 yuan with 50%,lose 10 yuan with 50% |
| 3 | get 0.5 yuan with 50%,lose 2 yuan with 50% | get 15 yuan with 50%,lose 10 yuan with 50% |
| 4 | get 0.5 yuan with 50%,lose 2 yuan with 50% | get 15 yuan with 50%,lose 8 yuan with 50% |
| 5 | get 0.5 yuan with 50%,lose 4 yuan with 50% | get 15 yuan with 50%,lose 8 yuan with 50% |
| 6 | get 0.5 yuan with 50%,lose 4 yuan with 50% | get 15 yuan with 50%,lose 7 yuan with 50% |
| 7 | get 0.5 yuan with 50%,lose 4 yuan with 50% | get 15 yuan with 50%,lose 5 yuan with 50% |
| *percentage means probability, TL means transition line | ||
2.3. Basic Information of the Sampled Area
This study selected three provinces in China as the research areas. From west to east, they were Yangquan City, Shanxi Province, Anyang City, Henan Province and Rizhao City, Shandong Province. The information of these three provinces is shown in Table 2.
Due to the mountainous terrain around Yangquan City in Shanxi, large-scale agricultural production is very limited. During the experiment, we found that 90% of the cultivated land was terraced, the crops were mainly cash crops, and the proportion of the primary industry was relatively low. Anyang City, Henan Province was selected in the eastern plain. The proportion of primary industry in GDP was 11.8%, which was the highest among the three regions, but the per capita GDP was the lowest. Rizhao City, Shandong Province has a port. Thanks to its export-oriented economy, Rizhao City’s per capita GDP was the highest among the three selected cities, and the proportion of primary industry in GDP was the second. Regional differences between inland and coastal cities may also affect producers’ risk preference. Henan Province and Shandong Province are the “hardest hit areas of the college entrance examination” and they invest more resources in education, and there are a large number of colleges and universities. Transgenic insect-resistant cotton was also first introduced into Henan province and Shandong province.
2.4. Empirical Analysis
The dependent variable was the acceptance of genetically technology and the willingness to purchase GM crops. Building upon Lusk (2005) [22], we developed questions about the acceptance of genetically technology using five Likert-scale statements: I am willing to accept GM crops; I am willing to purchase GM crop seeds; I will recommend GM crops to others; I agree with China’s large-scale import of GM crops; I support the development of GM crops. Participants chose “strongly disagree”, “disagree”, “neutral” “agree”, or “strongly agree” based on their levels of agreement to these statements. For each participant, a score was generated by taking the mean of these five variables and rounded to integer of five levels: 1, 2, 3, 4, and 5. A higher score indicates a higher level of willingness to grow and the acceptance of GM agricultural products.
The explanatory variables include three core explanatory variables and control variables.
The first explanatory variable is the degree of risk amplification of GM crops(ra). A health hazard ranking question was used to measure whether participants overestimate the harm of GM crops. 4Participants were asked to rank the following five hazards from high to low according to their perceived harmfulness of these five items.
a. Smoking hazards in the workplace;
b. Food additives that exceed the regulatory limit;
c. GM agricultural products;
d. Bacteria infected food and expired food;
e. The impact of avian influenza on humans through live birds.
The scientifically proved harm of GM agricultural products was the smallest among these five hazards. The widely held opinions about the harmfulness of GMO varieties are groundless, and GMO food can be considered to be the most thoroughly tested in the world [28]. If it was ranked first, the risk amplification is recorded as 4; by analogy, if ranked fifth, the risk amplification is recorded as 0. Therefore, the risk amplification had the value of 0, 1, 2, 3 and 4. The greater the value, the higher the degree of risk amplification. The frequency distribution is shown in Figure 1.
Figure 1 shows that only 37.3% of participants did not amplify the GM risk (ra = 0) and 9.8% of participants strongly exaggerated the risk of GM (ra = 4). In terms of regions, the percentage of participants who amplify the GM risk were 65.3%, 62.4% and 60% respectively in Henan, Shanxi and Shandong.
The second explanatory variable is the relative risk preference coefficient. We assume the producer has the utility function shown in Equations (1), (2) and (3).
is producers’ utility function, is value function, x is the high income obtained by the producer when the “unexpected luck” occurs, y is the low income obtained when the “unexpected luck” does not occur, p is the probability of obtaining the high income, and q is the probability of obtaining the low income. 、 are weights of two probabilities in the utility function. 、、 represent three risk preference coefficients. measures the curvature of the value function; the higher value, the lower the producer’s willingness to take risks. , the higher the value, the greater the negative utility brought by the loss than the positive utility brought by the same amount of gain, and the lower the producers’ willingness to take risks. is the attraction of “unexpected luck” to producers. The higher the value, the lower the attraction of such events to producers, that is, the lower the willingness to take risks.
The calculation of relative risk preference coefficient follows the formula of Lusk (2005): ,indicates the utility of a benefit. The range of relative risk preference coefficient is calculated using MATLAB 2016 software. The greater the coefficient, the more risk averse. Taking the first line of series 2 as an example, if a participant chooses option A, it must be because the utility of option A exceeds that of option B i.e.,, the following inequality can be obtained5:
Following the same logic, the relative risk coefficient estimation results are obtained and shown in Table 3. The TL (transform Line) is the line that the subject made a change when choosing the lottery ticket. TL=1 means that the subject chose option B on each row; TL=2 means that the subjects all chose option B starting from the second row. Similarly, TL= “NEVER” indicates that the subject chose option A in each row and never chose option B. Frequency is the number of people on its corresponding transform line. For example, and in series1, the number of people who choose option B starting from line 1 is 29.
Table 3 demonstrates the relative risk coefficient increases with the higher transform line, and a larger rr indicates that subjects are more risk-averse. Over 230 farmers are risk-averse in both Series 1 and Series 2, which accounts for over two thirds of the whole subjects.
The third explanatory variable measures the risk perception of GM technology(rp). Seven statements were presented to participants, including: Genetic modification in food production may bring risks to me and my family; The national control over the safety of GM agricultural products is sufficient; Genetic modification in food production may bring new diseases to human; The promotion of GM agricultural products will cause gene pollution or environmental pollution; I am worried that transgenic technology will destroy natural selection; Eating GM agricultural products will cause allergic reaction; Regular consumption of GM agricultural products will have an uncertain impact on human offspring. Participants were asked to indicate their degree of agreement to these statements using a Liker-scale with 1 meaning “strongly disagree” and 5 meaning “strongly agree.” The mean of these variables was used to measure producers’ risk perception of GM technology. The frequency distribution of rp is shown in Figure 2.
A lower score indicates a higher perceived risk by participants. Overall, the perceived risk by participants follows a normal distribution. Among the 338 observations, one observation in Shandong Province had the highest perceived risk; The number of observations at the medium level (rp = 3) is the largest, accounting for 49.4% of the total sample.
(2) Individual and household characteristic variables
The demographic variables included gender, age, marital status, household size, whether there were children under 7 years old in the household, whether there were elderly people over 60 years old in the household, education level and monthly household income.
We also included a series of control variables. Variable char measures whether a participant was in charge of purchasing food in the household. Variable freq captures how often a participant read the production date, shelf life or ingredient and nutrition information on food package when buying food. The options were: “every time,” “often,” “sometimes,” “not often,” and “not at all.” freq was measured on a 1-5 Likert scale, and the higher the score, the lower the frequency. The third variable trust measures participants’ trust in Chinese food industry. Two 5-Likert scale questions were included. The first question was “Are you confident with the safety provided by the national food quality and safety certification?” The options are “completely confident,” “confident,” “neutral,” “unconfident,” and “completely unconfident.” The second question was “What do you think of the current food safety problems in China?” The options were “very problematic,” “problematic,” “neutral,” “not problematic,” and “not problematic at all.” The variable trust took the mean of the answers to these questions after the first question was reversely coded. A higher score indicates a greater degree of trust in the Chinese food industry. Variable cog measures participants’ knowledge or cognition of GM agricultural products. Five questions related to participants’ knowledge about GM crops were asked. The first question was “Do you agree with the following statements? The GM products allowed to grow in China are disease-resistant papaya and insect-resistant cotton; and additionally China is allowed to import five kinds of GM products, including cotton, corn, soybean, rape and sugar beet.” A participant got one point if he/she selected “agree.” The second question was “Before this survey, have you heard of GM agricultural products?” A participant got one point if she/he selected “yes.” The third question was “Have you ever heard of homologous transgene?” If a participant selected “yes,” he/she got one point. The fourth question was “It is said on the Internet that virgin fruit, large colored pepper and small pumpkin are GM agricultural products. Do you agree?” If a participant selected “disagree,” he/she got one point. The last Question was “What is the most widely cultivated GM crop in the world?” If a participant selected “soybean,” he/she got one point. These points were summed up to get a score (cog) measuring participants’ knowledge about GM agricultural products. A higher score implies a better understanding of GM crops.
Variable atti measures participants’ attitudes towards GM agricultural products. Two 5-Likert scale questions were asked to measure participants’ attitude: “Are you worried about the safety of GM agricultural products?” and “Do you have confidence in the future of GM agricultural products?” Three statements related to different world organizations’ views about GM agricultural products were included: “The World Health Organization believes that GM agricultural products currently available on the international market have passed the safety assessment and will not pose a risk to human health;” “The EU believes that only controlling GM products is not enough to ensure the safety of GM products. Only by controlling from the source can the harm of GM products be controlled within the minimum range;” and “The US Food and Drug Administration clearly stipulates that the management methods of foods derived from GM crops and foods derived from traditional crops are exactly the same.” Participants were asked to indicate their levels of agreement with these statements on 5-Liker scales. Variable atti takes the average of the answers to these questions. The higher the score, the more likely a participant have a negative attitude towards GM agricultural products. Variable knowl measures participants’ genetic knowledge. Participants chose right or wrong for the following four statements: “The gender of a child is determined by the father’s genes;” “Tomatoes do not contain genes, and transgenic tomatoes contain genes;” “It is impossible to transfer animal genes to plants;” “Hybrid rice uses transgenic technology.” A higher score indicates better genetic knowledge. Variable label measures participants’ attitude toward labeling of GM agricultural products. The question was “Do you think GM agricultural products need to be labeled mandatorily?” Participants need to answer “yes” or “no” to this question.
The details of these variables are shown in Table 4.
According to the risk amplification theory and experimental design, we aim to test the following hypotheses:
H1:
The degree of risk aversion and risk perception significantly impact producers’ willingness to adopt GM crops;
H2:
The more attention is paid to food information on packages (production data, shelf life, and nutrition information) when shopping, the less likely for the producers to accept GM technology;
H3:
The more knowledgeable about GM technology, the more willing for producers to adopt the technology;
H4:
The higher the level of trust in Chinese food industry, the less likely the amplification of GM risk would impact producers’ willingness to adopt GM technology.
3. Results
3.1. Descriptive Statistics
The summary statistics of the variables measuring producer’s acceptance of GM crops are shown in Table 5.
A higher the score indicates a higher level of acceptance. Overall, ten percent of participants were willing to adopt GM agricultural products at relatively higher degrees (4-5). But there were differences in different regions: Shanxi had the highest level, followed by Shandong, and then Henan; Overall, less than 10% of participants were (strongly) willing to recommend GM agricultural products to others. In terms of regions, Shanxi participants had the highest willingness to recommend (13.42%), followed by Shandong (11.73%), then by Henan (only 1.05%). About 35% participants (strongly) disagreed that China should import a large number of GM agricultural products, and highest percentage of participants in Shanxi province (strongly) disagreed with the imports of GM agricultural products. About 20% of participants (strongly) supported the development of GM agricultural products, which was the highest among the four acceptance measurements. It can be seen that although participants had some reservations about GM crops, they showed some level of support for the development of GM agricultural products. The acceptance of GM crops was the highest in Shanxi, the lowest in Henan and with coastal Shandong in the middle. However, the degree of agricultural development in Shanxi is not as high as that of the other two provinces. The results showed the different levels of acceptance of GM crops between large agricultural and non-agricultural provinces in China. Participants who strongly disagreed with the purchasing GM plant seeds accounted for the largest proportion (30.5%), and the proportion in the other three provinces was 37.9%, 26.2% and 29.8% respectively. Relatively high levels of agreement (4-5) accounted for 16%, Henan province had the lowest percentage(4.2%), Shanxi province had the highest percentage (27.6%), and Shandong province accounted for 9.6%.
3.1.1. Summary Statistics of Core Risk-Related Explanatory Variables
The summary statistics of core risk-related explanatory variables are shown in Table 6. For the whole sample, the average risk amplification (ra), risk perception (rp), and relative risk coefficients (rr1 and rr2) were 1.33, 3.31, -0.09 and 0.30, respectively. All these risk measures had the highest value for participants from Shandong province and lowest value for those from Shanxi province, indicating participants form Shandong province tended to amplify the risk of GM crops the most, perceived the risk of GM crops the most and were most risk averse among the three provinces.
3.1.2. Participants’ Sociodemographic Background
The summary statistics of individual and household characteristics are shown in Table 7. Men and women often have different risk preferences and consumption habits, which may lead to different choices. Therefore, we tried to balance the number of male and female participants Overall, the gender distribution was relatively balanced with men slightly more than women.
In the survey, we asked participants to choose their age categories. Since the average marriage age in rural China is 25 years old, we took 25 years old as the first dividing point, and then takes 10 years as the interval for the age categories. Although there were differences among the three regions, most participants’ ages were between 25 and 55 years old. Among them, there were full-time agricultural producers and part-time ones. For example, there is a large number of migrant workers in Henan, but they return home to work on their farms during busy farming season.
The percentage of married participants was 80%, which was as high as 90.43% in Shandong. The household size was about 4-5 people, which is in line with the basic situation in rural areas. Households with fewer than three people accounted for 41.72% of the sample, this was because most of participants were in their early stage of marriage and had no children and elderly people living with them. More than 70% of participants had no children under the age of 7, and more than half of the sample had elderly people over the age of 60 in their households. About 67% of participants had education below undergraduate level, and the education levels of older participants were mostly primary school and junior middle school. With the implementation of relevant national policies and economic development, the education level of farmers has also been improved, so participants with senior high school and undergraduate education accounted for more than 50% of the sample. Sixty percent of participants had low-income, but there is a trend that the higher the level of education, the higher the income. For participants with master’s degrees, the monthly income can be more than 20000 yuan, which is not different from urban households’ income.
3.1.3. Producer Risk Preference when Facing Loss
In the gambling experiment, series 3 was used to test participants’ risk preference when there was 50% probability of loss. The number of participants switching at various rows are shown in Figure 1. Switching row 1 means option B was selected at the first row, switching row 2 means option B was selected at the second row and so on.
Figure 3.
Number of participants switching at different rows in the gambling experiment series 36.
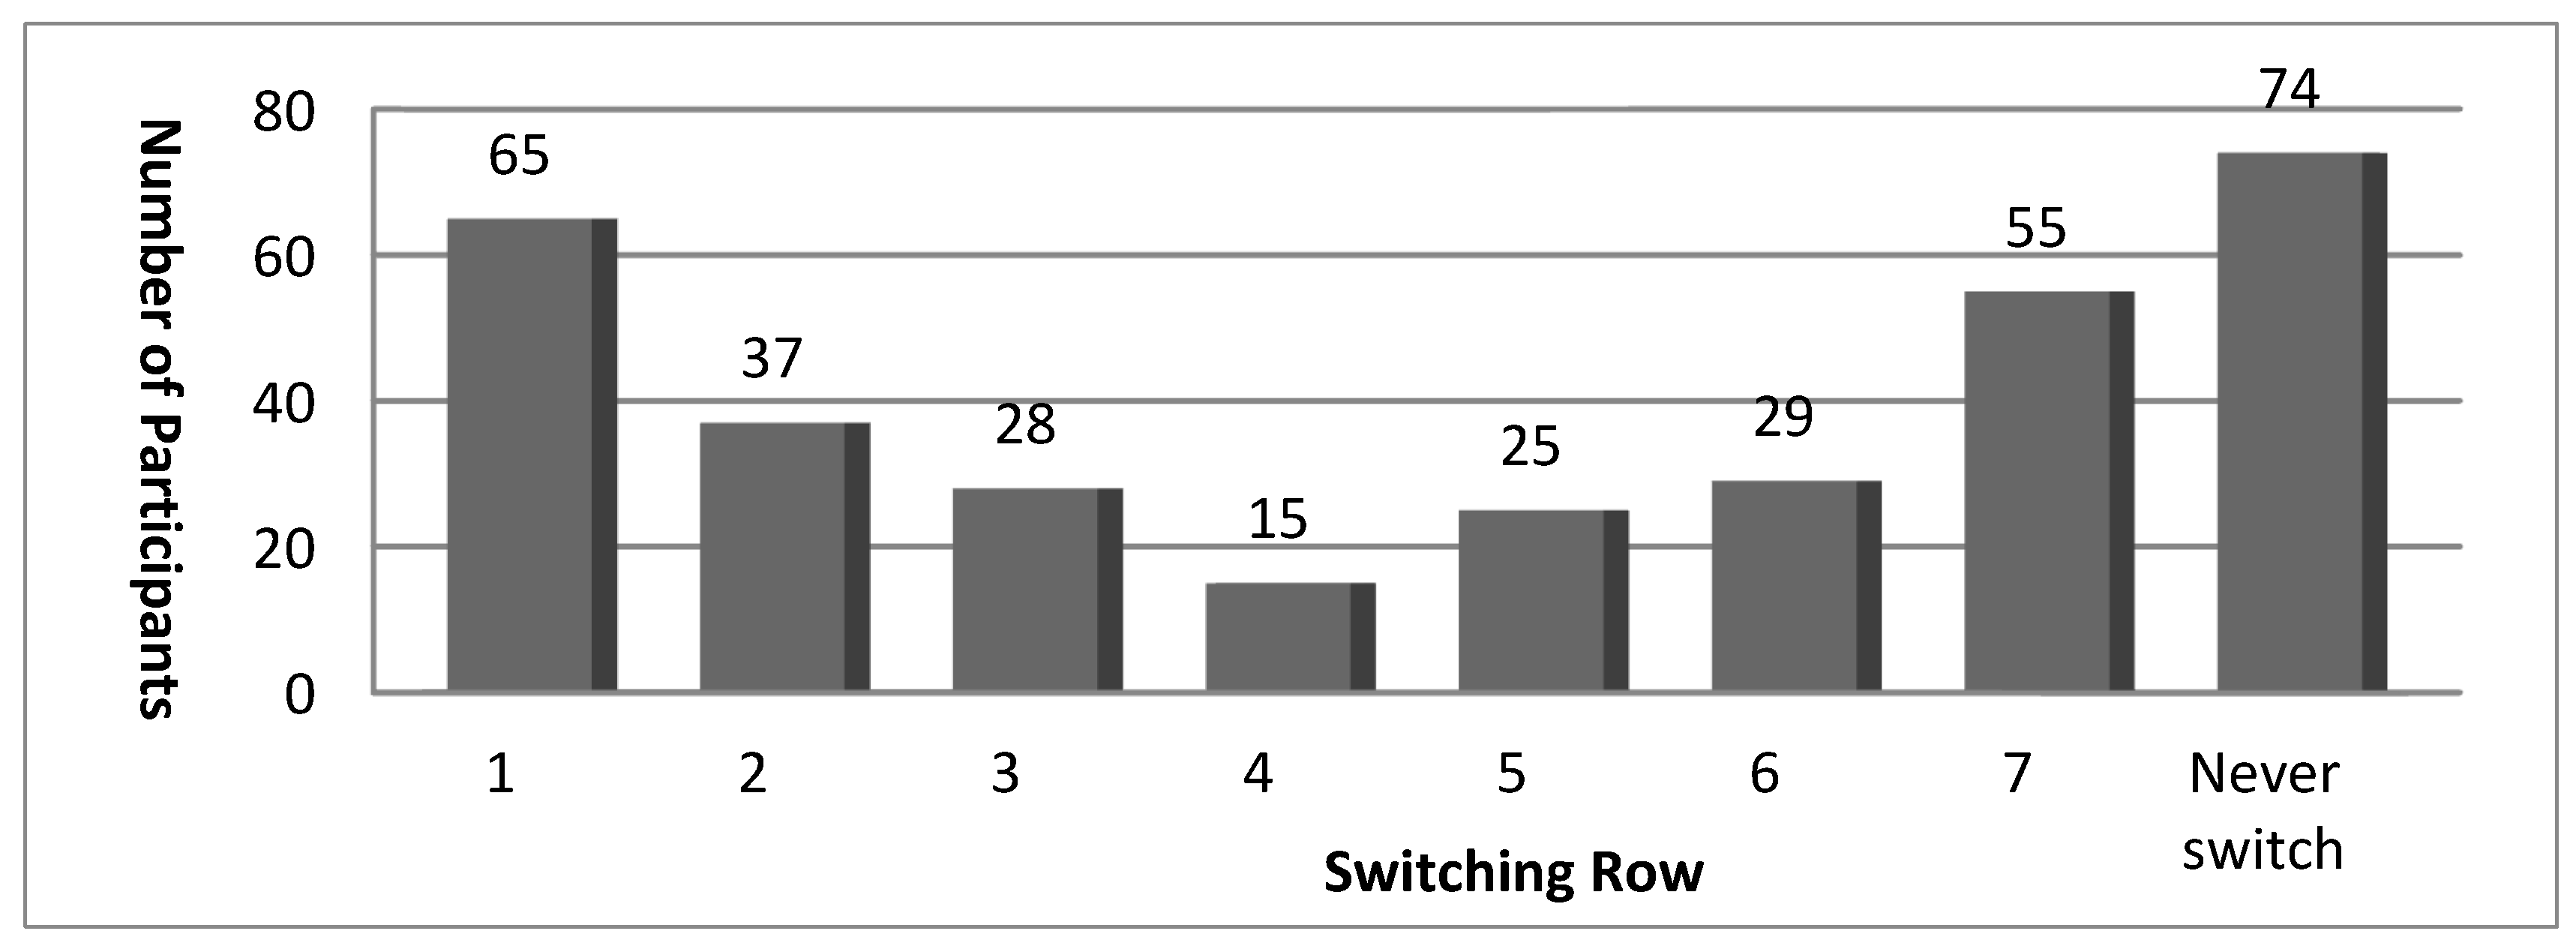
The later the switching row, the more sensitive a participant was to loss. The frequency distribution has “U” shape. Nineteen point eight percent of participants made the choice of “large negative return but large positive return” at row 1. This group of participants did not have obvious loss aversion. At row 2-6, the negative return and return of option B were higher than that of option A, but the gap between the returns brought by the two options narrows down, and about 40.9% participants switched at row 2-6. At the last row, the negative returns of the two options were similar, but the positive return of option B was 30 times that of option A, and 16.8 % participants switched at the last row. The remaining 22.6% of participants always chose option A and never switched. When considering those who switched at row 4 and 5 as “risk neutral,” 55.8% of participants were risk averse.
3.2. Full Sample Estimation Results
The full sample estimation results of how different factors impact GM crop acceptance by producers are showed in Table 8.
Columns 2-3 are the estimation results of the whole sample using ordered logit models, columns 4 and 5 show Poisson model estimation results. Compared to model 1 and 3, model 2 model 4 add two interaction items, ra*trust and label * cog. The results show that three core risk-related explanatory variables, two demographic variables, four other control variables and two interactive items significantly affect the acceptance of GM agricultural products by producers.
3.2.1. Ordered Logit Estimation Results
- (1)
- Hypotheses testing results
H1:
The degree of risk aversion and risk perception significantly impact producers’ willingness to adopt GM crops.
The two variables, relative risk coefficient (rr) and risk perception (rp), have significantly negative impacts on GM acceptance, that is, participants who are more risk averse and with higher perceived risks of GM agricultural products are less likely to accept GM crops. The results are consistent across the two models and the coefficients are highly significant. Thus, the null hypothesis 1 cannot be rejected. Most of the coefficients of demographic variables and the interaction terms are not significant.
The results are intuitive because the more conservative the attitude towards transgenic crops, the lower the acceptance of them. Producers’ risk preferences affect their decisions to a great extent. This indicates producers’ risk amplification might lead to irrational decisions in the adoption of GM crops.
H2:
The more attention is paid to food information on packages (production date, shelf life, and nutrition information) when shopping, the less likely for the producers to accept the transgenic technology.
We found that participants who read information on packages when buying food had a low acceptance of GM agricultural products. The coefficients of freq are significant and are consistent across the two models. The coefficient of char is significantly positive. Because participants in charge of household food purchase had more responsibility for food safety of their households, their acceptance of GM crops is significantly lower than that of participants who were not in charge. Participants who paid more attention to production date, shelf life and nutrition information of food cared more about the safety of their food. So it is intuitive that those participants were more conservative on the acceptance of GM crops. Obviously, participants who had more trust in the food industry believe the industry only allows the production of GM crops if the crops are safe so they would have higher acceptance of GM technology.
H3:
The more knowledgeable about GM technology, the more willing for producers to adopt the technology.
We found that the knowledge and cognition level of GM agricultural products does significantly impact the acceptance of GM crops. After adding interaction term cog*label cognitive level has a significantly positive impact on the acceptance of GM agricultural products and the coefficient increases significantly. The coefficient of the interaction is positive, indicating that among participants who think GM agricultural products should be labeled, those who are more knowledgeable about GM agricultural products are more likely to accept GM technology.
H4:
The higher the level of trust in Chinese food industry, the less likely the amplification of GM risk would impact producers’ willingness to adopt GM technology. There is a negative relationship between the degree of risk amplification (ra) and the acceptance of GM crops. The psychological amplification of the risk for GM crops would significantly reduce the possibility of accepting GM crops. After adding interaction term between risk amplification and trust in the food industry in model 2 (ra*trust), the coefficient is doubled and becomes very significant. This shows that when the trust in the food industry is high, it is very likely to alleviate the inhibitory effect of risk amplification on producers’ GM crop acceptance.7
- (2)
- Demographic variable coefficients
Among the demographic variables, only age and education significantly affected the acceptance of transgenic technology. Older participants are less likely to accept GM crops than younger ones. On one hand, the education level of the older generation in China’s rural areas is relatively low; On the other hand, older participants’ witnesses of the hard times before the Chinese economic reform and open-up make them very cautious about adopting new things with uncertainty. Therefore, their possibility of accepting GM crops is low. As expected, participants with higher education level are more likely to accept GM crops.
3.2.2. Poisson Regression Results
In this study, we ran Poisson regression to validate the results of ordered logit model.
Model 3 and model 4 show that the coefficients of three core risk-related explanatory variables (ra, rp, and rr) are significantly negative at the levels of 1%, 10% and 1%, respectively. In addition, age, education, being the person in charge of household food purchase, frequency of looking at information on food package, attitude towards GM agricultural products, genetic knowledge, views on whether GM agricultural products should be labeled and the interaction terms are significant and have the same signs as the results from the ordered logit model.
The calculation of incident rate ratios (IRR) value can help us more intuitively understand the impact of each explanatory variable on the dependent variable. Suppose a participant’s original probability of accepting GM crops is p0, the IRR results show that the probability of accepting GM crops will be reduced to 0.951p0, 0.913p0 and 0.948p0 for each level increase in risk amplification (ra), risk perception (rp) and relative risk coefficient (rr), respectively. The probability of acceptance decreases to 0.996p0 when the age increases by one year. When the household size increases by one, the acceptance probability increases to 1.015p0. With the education level and income increase by 1 level, the probability of GM acceptance level will rise to 1.064p0 and 1.007p0, respectively. When the frequency of reading the food package information decreases by one level, the acceptance degree increases to 1.025p0. When trust in the food industry increase by one level, the GM acceptance probability increases to 1.015p0. The GM acceptance probability increases to 0.992p0, 0.827p0 and 0.951p0 when the GM cognition, GM attitude and genetic knowledge scores increase by 1 level, respectively.
3.3. Estimation Results for the Three Provinces
To understand how the factors impact the detailed producers’ response to GM agricultural products in different regions, we further ran the models for three individual questions which measures participants’ acceptance intention (willingness to accept GM agricultural products), purchase intention (willingness to purchase GM plant seeds) and recommendation intention (willingness to recommend GM agricultural products to others). Table 9 reports the estimation results for the whole sample and the three provinces.
For willingness to accept GM agricultural products, the coefficients of the degree of risk amplification (ra) are significant and negative for the whole sample as well as the samples from the three provinces. For Shandong Province, risk perception (rp) has a significant positive impact on willingness to accept. The relative risk coefficient (rr) and education level have more significant effects on the willingness to accept GM agricultural products in Shanxi province than the other two provinces. For participants from Henan province and Shandong province, the older the age, the higher their willingness to accept GM crops, but the coefficient of age for Henan province is more significant. For participants from Henan province, the marital status significantly impacts their willingness to accept GM crops: married participants are more likely accept GM crops, which is opposite to other two places. For participants from Shandong province, household size significantly impacts participants’ degree of GM crop acceptance. For participants from Shanxi and Shandong, the acceptance of GM crops by those who had people “over 60 years old” in the household is significantly lower, indicating that participants are more cautious about the choice of food for elderly people. For the whole sample, the acceptance level by participants who are in charge of food purchase, read information on food package more frequently and have richer genetic knowledge is significantly lower, but coefficients are not significant for the three provinces. For participants from Shanxi province, the higher the cognitive level about GM technology, the lower acceptance level of GM agricultural products. For Henan participants who thought GM crops should be labeled, the more negative their attitudes towards GM technology, the lower the degree of their acceptance GM crops (negative and significant coefficient of atti*label). The interaction term between the degree of risk amplification and the degree of trust in the food industry (ra*trust) is significantly positive, similar to the results in Table 8.
For purchase intention, the degree of risk amplification has no significant impact on participants from Henan province; For participants from Shandong province, the risk perception has no significant impact on the purchase intention. The relative risk coefficient for Shandong participants is significantly higher than those of the other two samples. Gender has a significant impact on willingness to accept for Shanxi participants: women are more willing to accept GM agricultural products than men, while gender has not significant impact on purchase intention for Shandong and Henan participants. For the Henan sample, older participants have stronger purchase intention than younger ones. For the Shanxi sample, the GM agricultural products purchase intention of participants with family members younger than 7 years old is significantly higher, but the purchase intention of participants with family members over 60 years old is significantly lower; The higher the level of education, the higher the purchase intention. For the three provinces, only the coefficient for the interaction between the degree of risk amplification and the degree of trust in the food industry for Shanxi participants is significantly positive. It indicates that the higher the degree of trust in food industry, the greater the Shanxi participants’ willingness to buy GM plant seeds.
For recommendation intention, the coefficient for risk perception (rp) of Henan participants is significantly negative, the coefficient for relative risk coefficient (rr) of Shanxi participants is significantly negative, and the coefficients for the risk-related variables are not significant for the sample of Shandong province; Older and married participants from Henan province have a significantly higher willingness to recommend GM agricultural products. The coefficient of education level for Shanxi participants is significantly positive, similar to the that of the whole sample. In the whole sample, the recommendation intention by participants in charge of food purchase is significantly lower than those who are not in charge, but it is not significant for the three individual provinces. For participants from Shanxi province, those who read information on food package more frequently and have a higher the degree of cognition of GM technology are less willing to recommend GM agricultural products, which is the same as the willingness to accept and willingness to purchase estimation results. The coefficient for label is significantly negative for the sample of Shanxi province, which means that participants who believe that GM agricultural products should be labeled have lower willingness to recommend GM agricultural products. The coefficients for the two interaction terms in the whole sample are significantly positive, which is consistent with the results in Table 8.
These results show the risk-related factors, producers’ demographic background and food purchasing behavior impact new technology acceptance, purchase, and recommendation intentions of producers in different areas in different ways.
4. Discussion
Factors impacting consumers’ willingness to accept or consume GM food have been analyzed extensively. The early literature includes Bredahl (1999), Lusk (2004), De Steur (2010) [29,30,31]. Bredahl showed that risk perception of GM food impacted purchase willingness of GM food [29]. Based on surveys from the United States, the United Kingdom and France, Lusk found that information has a significant impact on their consumption behavior, and the benefits to the environment brought by transgenic technology will greatly improve consumers’ willingness to purchase [30]. De Steur conducted a survey on consumer groups in Shanxi, China, and found that consumers have a relatively high willingness to accept GM rice, and that objective knowledge and risk perception will affect consumers’ acceptance of GM rice [31].
More recently, Kubisz et al. found that the negative attitude of Polish society towards GM food could be considered irrational which was based on fears [28]. Guo et al. surveyed 573 consumers from Shandong Province, China and found that perceived risk negatively impacted purchase intention of GM food and that risk communication was vital for acceptance of GM foods using structural equation model [32].
There are abundant researches on consumer risk perception and consumer purchase intention. However, there are few literatures from aspects of farmers.
It mainly focuses on economic benefit of GM crops and the planting intention of producers. Much evidence has shown transgenic technology increases crop yields [33]. There has also been much success with crop varieties that are drought and cold resistant [34]. Economic benefits and low planting cost have been shown [35,36]. Regarding the planting intention, Lu and Sun believed that education was an important factor affecting farmers’ adoption of new technologies [37]. Zhu found that high yield was an important factor affecting farmers’ planting intention of transgenic rice [38], but and Qaim and De Janvry proposed that farmers had realized that high yield and high profit were not exactly the same [39].
The present study studied the impact of producers’ amplified risk and risk preferences on adoption of GM technology.
Figure 1 shows that only 37.3% of participants did not amplify the GM risk and about 10% of participants strongly exaggerated the risk of GM from the whole sample. In terms of regions, the percentage of participants who amplify the GM risk were 65.3%, 62.4% and 60% respectively in Henan, Shanxi and Shandong. This conclusion is consistent with the findings of Kubisz et al., who demonstrated that the low level of understanding and acceptance of GMO technologies in Polish society is based on stereotypes rather than on scientific knowledge to a large extent [28]. This result is also supported by Li and Zhang, who believed that Media promoted the social amplification of GMO risk and had a serious impact on residents’ perception of GMO risk and purchase intention [40].
Regarding the risk preferences, Table 3 demonstrates the relative risk coefficient increases with the higher transform line, and a larger variable of rr indicates that subjects are more risk-averse. Over two thirds of farmers are risk-averse in both Series 1 and Series 2. This result is consistent with Jin et al. [41] and Sulewski and Kloczko-Gajewska [42].
In accordance with Table 8, relative risk coefficient and risk perception have significantly negative impacts on GM acceptance. In another word, participants who are more risk averse and with higher perceived risks of GM agricultural products are less likely to accept GM crops. The results are consistent across the ordered logit model and Poisson regression and the coefficients are highly significant. The results are intuitive because the more conservative the attitude towards transgenic crops, the lower the acceptance of them. Producers’ risk preferences affect their decisions to a great extent. This indicates producers’ risk amplification might lead to irrational decisions in the adoption of GM crops. This result is supported by Jin et al. [41] which showed that farmers’ risk preferences play an important role in agricultural production decisions.
5. Conclusion
In this paper, using producer samples from three Chinese provinces, we estimated participants’ relative risk preference coefficient through gambling experiments, and explored participants’ risk amplification degree and risk perception of GM crops. We then investigated how these risk-related variables impacted producers’ willingness to adopt GM crops. We also included a series of other variables in the analysis including: the attitude towards GM crops, the degree of trust in Chinese food industry, the level of genetic knowledge, the cognition of GM agricultural products, socio-demographic information and some purchasing behavior variables.
We had several findings. First, in the context of risk, higher levels of knowledge and cognition does not necessarily make a producer more rational. Risk perception and attitude significantly affect how producers make decisions and play a key role in their risk management and decision-making. Second, labeling GM agricultural products helps producers with high cognitive level reduce psychological uncertainty and improve their acceptance of GM agricultural products. Third, a higher level of trust in a country’s food industry can help prevent the non-adoption-behavior caused by the excessive risk amplification of transgenic technology. Fourth, producers’ demographic background and purchasing behavior impact their acceptance intention, purchase intention and recommendation intention of GM agricultural products in different ways. For example, the marital status of a producer impacts the acceptance intention differently from its impact on purchase intention and recommendation intention. Similarly, there are regional differences in terms of which variables impact the acceptance, purchase and recommendation intentions.
Based on the results, we make the following recommendations to improve producers’ adoption of new technologies such as GM crops. First, a supportive production environment and consumer market will reduce producers’ risk aversion and producers can adopt new technologies with less hesitation [43]. Government should improve agricultural insurance, improve risk dispersion mechanisms, and provide sufficient financial support to ensure that producers will not suffer large losses due to the adoption of new technologies. Second, government or organizations can conduct trainings to educate producers about new technologies to help them establish accurate risk perceptions and improve their risk management strategies and set up effective risk avoidance mechanisms. Third, although some producers have a correct understanding of new technologies, they are still affected by the uncertainty of new technologies, reducing their enthusiasm of adopting them. Therefore, the government should be open and transparent in the efficacy, advantages and disadvantages of new technologies. Take GM technology as an example, government should remain transparent and keep producers informed about the management and labeling GM agricultural products. Only by eliminating producer concerns and improving their trust in the food industry can we minimize the risk amplification of GM technology. Fourth, different regions have different sub-culture, education levels and economic development levels. When promoting new technologies to different areas, government should develop differentiated strategies and adopt publicity methods accordingly by considering the distinct key factors impacting producers of different areas’ adoption decisions [44]. Fifth, China’s rural labor force is aging considerably and older producers are more reluctant to adopt new technologies. The government should develop policies to attract young talents to build villages, improve the income of producers relying on new agricultural technologies and value-added agriculture, and make young people more receptive to emergent technologies, which is also conducive to the adoption of new technologies.
Author Contributions
Conceptualization: Li Zhao, Shumin Liu, Chengyan Yue, Haiying Gu, David Ahlstrom; Methodology: Li Zhao, Shumin Liu, Haiying Gu; Writing: Li Zhao, Shumin Liu; Providing idea: Li Zhao; Chengyan Yue; Haiying Gu; Providing revised advice: Haiying Gu; Chengyan Yue; David Ahlstrom.
Funding
Thank you for the supports from the National Science Foundation of China (Grant No. 71803132) and National Social Science Foundation of China (Grant No. 22ZDA058).
Institutional Review Board Statement
Not applicable.
Informed Consent Statement
A consent was waived-all respondents voluntarily replied to questions, there were no sensitive private data collected, identification of persons responding is not possible.
Data Availability Statement
Data collected are deposited in an Excel file at Shanghai Maritime University.
Conflicts of Interest
The authors declare no conflict of interest.
References
- McCloskey, D. N. The great enrichment: A humanistic and social scientific account. Social Science History 2016, 40(4), 583–598. [Google Scholar] [CrossRef]
- Zhao, L., H. Gu, C. Yue and D. Ahlstrom. Consumer welfare and GM food labeling: A simulation using an adjusted Kumaraswamy distribution. Food Policy 2013, 42, 58-70. [CrossRef]
- Kubisz, P.; Dalton, G.; Majewski, E.; Pogodzi’ nska, K. Facts and Myths about GM Food-The Case of Poland. Agriculture 2021, 11, 791. [Google Scholar] [CrossRef]
- Kasperson R. E., O. Renn and P. Slovic. The social amplification of risk: A conceptual framework. Risk Analysis 1988, 8(2), 178-187. [CrossRef]
- McCloskey, D. N. and A. Carden. Leave Me Alone and I’ll Make You Rich. In Leave Me Alone and I’ll Make You Rich. University of Chicago Press. 2020. [CrossRef]
- Liu, E. M. Time to change what to sow: Risk preferences and technology adoption decisions of cotton farmers in China. Review of Economics and Statistics 2013, 95(4), 1386–1403. [Google Scholar] [CrossRef]
- Slovic,P. Perception of risk. Science. 1987, 236, 280–285. [CrossRef]
- Tversky, A. and D. Kahneman. Judgment under Uncertainty: Heuristics and Biases, Science 1974, 185(4157),1124-1131. [CrossRef]
- Kim, J., D. Lee, M. Lee, K. Ryu and J. B. Kim. Monitoring and Risk Assessment of Pesidues in School Foodservice Agricultural Products in Gwangju Metropolitan Area. Journal of Food Hygiene and Safety 2019, 34(3), 283-289.
- Lee,S., N.Lee, and C.E Dockte. Effects of Message Presentation Type on GM Food Risk Perception, Similarly Judgment, and Attitude. Health Communication 2020, 6(9), 1-11. [CrossRef]
- Li, D. and Q. Zhang. The influence of media risk amplification on consumers’ willingness to buy genetically modified agricultural products. Journal of Zhejiang Agricultural Sciences 2020, 61(05), 1011-1015(in Chinese).
- Awotide B. A., A. A. Karimov and A. Diagne. Agricultural technology adoption, commercialization and small holder rice farmers’ welfare in Rural. Agricultural and Food Economics 2016, 4(1), 1-24. [CrossRef]
- Tanaka T., C. F. Camerer and N. Quang. Risk and time preferences: Linking experimental and household survey data from Vietnam. American Economic Review 2010, 100(1), 557-571. [CrossRef]
- Ofuoku A. U., E. O. Egho and E. C. Enujeke.. Integrated Pest Management (IPM) Adoption among Farmers in Central Agro-Ecological Zone of Delta State, Nigeria. African Journal of Agricultural Research 2008, 83-84 (12), 123-130. [CrossRef]
- Korir J. K., H. D. Affognon and C. N. Ritho. Grower adoption of an integrated pest management package for management of mango- infesting fruit flies (Diptera:Tephritidae) in Embu, Kenya. International Journal of Tropical Insect Science 2015,35(2), 80-89. [CrossRef]
- Rezaei M. M., D. Hayati and Z. Rafiee. Analysis of administrative barriers to pistachio integrated pest management: A case study in Rafsanjan City. International Journal of Modern Management & Foresight 2014, 1(1), 35-43.
- Huang, J., L. Qi and R. Chen. Technical information knowledge, risk preference and pesticide application by farmers. Management World 2008, (05), 71-76 (in Chinese). [CrossRef]
- Yang, P., I. Malcolm, Y. Su and J. Flavia. Farmers Knowledge, Perceptions and Practices in Transgenic Bt Cotton in Small Producer Systems in Northern China. Crop Protection 2005, 24(3), 229-239. [CrossRef]
- Karlan D., R. Osei and L. Osei-Akoto. Agricultural decisions after relaxing credit and risk constraints. The Quarterly Journal of Economics 2014, 129(2), 597-652. [CrossRef]
- Brick, K. and M. Visser. Risk preferences, technology adoption and insurance uptake: A framed experiment. Journal of Economic Behavior and Organization 2015, 118, 383-396. [CrossRef]
- Luo, M., Y. Lin and H. Qiu. Risk preferences, training participation and farmers’adoption of new technology: case of Henan province. Journal of Arid Land Resources and Environment 2021, 35(01), 43-48(in Chinese). [CrossRef]
- Lusk, J. L and K. H. Coble. Risk perceptions, Risk preference, and Acceptance of risky food. Journal of Agricultural Economics 2005, 87(2), 393-405. [CrossRef]
- Zhou, Y., C. Zuo, Y. Chen, H. Lian and H. Ye. An experimental study on risk aversion of individuals with social preferences. Management World 2012, (06), 86-95(in Chinese). [CrossRef]
- Zhang, S., C. Sun and J. Zhang.. Research on the psychological mechanism of uncertain promotion-Experiment based on risk preference. Journal of Commercial Economics 2021, (06), 60-64 (in Chinese). [CrossRef]
- Binswanger, H. P. Attitudes Toward Risk: Experimental Measurement in Rural India,American Journal of Agricultural Economics 1980, 62, 395-407. [CrossRef]
- Holt, C. A. and S. K. Laury. Risk Aversion and Incentive Effects. American Economic Review 2002, 92(5), 1644-1655. [CrossRef]
- Harrison, G. W., M. I. Lau, E. E. Rutström and M. B. Sullivan. Eliciting Risk and Time Preferences Using Field Experiments: Some Methodological Issues. Research in Experimental Economics 2005, 10, 125-218. [CrossRef]
- Kubisz, P.; Dalton, G.; Majewski, E.; Pogodzi´ nska, K. Facts and Myths about GM Food--The Case of Poland. Agriculture 2021, 11, 791. [Google Scholar] [CrossRef]
- Bredahl, L. Consumers Cognitions with Regard to Genetically Modified Foods. Results of a Qualitative Study in Four Countries, Appetite, 1999, 33(3), 343-360.
- Lusk, J.L., L.O. House, C. Valli, et al., Effect of Information about Benefits of Biotechnology on Consumer Acceptance of Genetically Modified Food: Evidence from Experimental Auctions in United States, England, and France, European Review of Agricultural Economics 2004, 31, 179-204. [CrossRef]
- De Steur H, et al., Willingness-to-Accept and Purchase Genetically Modified Rice with High Folate Content in Shanxi Province, China, Appetite 2010, 54(1), 118-25. [CrossRef]
- Guo, Q., Yao, N., and Zhu, W. How consumers’ perception and information processing affect their acceptance of genetically modified foods in China: A risk communication perspective. Food Research International, 2020, 137, 109518. [CrossRef]
- Rymuza, K.; Radzka, E.; Cała, J. The Effect of Applied Biostimulants on the Yielding of Three Non-enetically Modified Soybean Cultivars. Agriculture 2023, 13, 900. [Google Scholar] [CrossRef]
- Umezawa T, M. Fujita and Y. Fujita Y. 2006. Engineering Drought Tolerance in Plants: Discovering and Tailoring Genes to Unlock the Future. Current Opinion in Biotechnology 17(2), 113-122. [CrossRef]
- Hancock J.F. 2003. Frame work for assessing the risk of transgenic crops. Bioscience. 53 (5), 512-519. [CrossRef]
- Bennett. R., Y. Ismael, U. Kambhampati and S. Morse. 2004. Economic Impact of Genetically Modified Cotton in India, AgBioForum 7 (3), 96-100.
- Lu Q., Sun J.:Study on the influence of farmers’ cognition about genetically modified crops on planting intention,Journal of China Agricultural University, 2014, (3) (in Chinese). [CrossRef]
- Zhu, S. Research on rice farmers’ cognition, planting intention and influencing factors of transgenic rice: Based on the empirical analysis of rice farmers in Huai ‘an City, Jiangsu Province, Science and Technology Management Research, 2011, (21) (in Chinese). [CrossRef]
- M. Qaim, A. De Janvry. Genetically modified crops, corporate pricing stratigies and farmers’ adoption: the case of Bt Cotton in Argentina, Am. J. Agric. Econ. 2003, 85 (4), 814-828. [CrossRef]
- Li C., Zhang Q. The effect of mediated risk amplification on consumers’ willingness to purchase genetically modified agricultural products. Zhejiang agricultural sciences,2020 ,61 (5): 1011-1015 (in Chinese). [CrossRef]
- Jin J., Gao Y., Wang X., Pham K. N. Farmers’ risk preferences and their climate change adaptation strategies in the Yongqiao District, China. Land Use Policy. 2015, 47: 365-372. [CrossRef]
- Sulewski, P. and Kloczko-Gajewska, A. Farmers’ risk perception, risk aversion and strategies to cope with production risk: an empirical study from Poland. Studies in Agricultural Economics 116 (2014) 140-147. [CrossRef]
- Möhring, N. and R. Finger. Pesticide-free but not organic: Adoption of a large-scale wheat production standard in Switzerland. Food Policy 2022,106, 102-188. [CrossRef]
- Tomizawa, A., L. Zhao, G. Bassellier and D. Ahlstrom. Economic growth, innovation, institutions, and the Great Enrichment. Asia Pacific Journal of Management 2019,37(1), 7-31. [CrossRef]
| 1 | Some participants with low education level said that some questions were beyond the scope of knowledge and could not be answered, so the experiment moderator needed to make some necessary explanations without affecting the authenticity of the results. |
| 2 | We dropped the observations in which participants switched between options A and B repeatedly. |
| 3 | The primary industry is mainly agriculture, including hunting, fishery, animal husbandry and forestry. |
| 4 | Simple and understandable examples - "excessive preservatives" and "moldy rice" are given in " food additives that exceed the regulatory limit " and " bacteria infected food and expired food,” respectively. |
| 5 | 0.9, 0.1, 0.7 and 0.3 are the probability of obtaining different benefits. |
| 6 | Switching at row 1 means that only option B is selected. The number of valid observations is 328. |
| 7 | 5% of the subjects made it clear that many agricultural products in life are genetically modified, and there are no major safety problems. |
Figure 1.
Frequency distribution diagram of producers’ risk amplification degree.
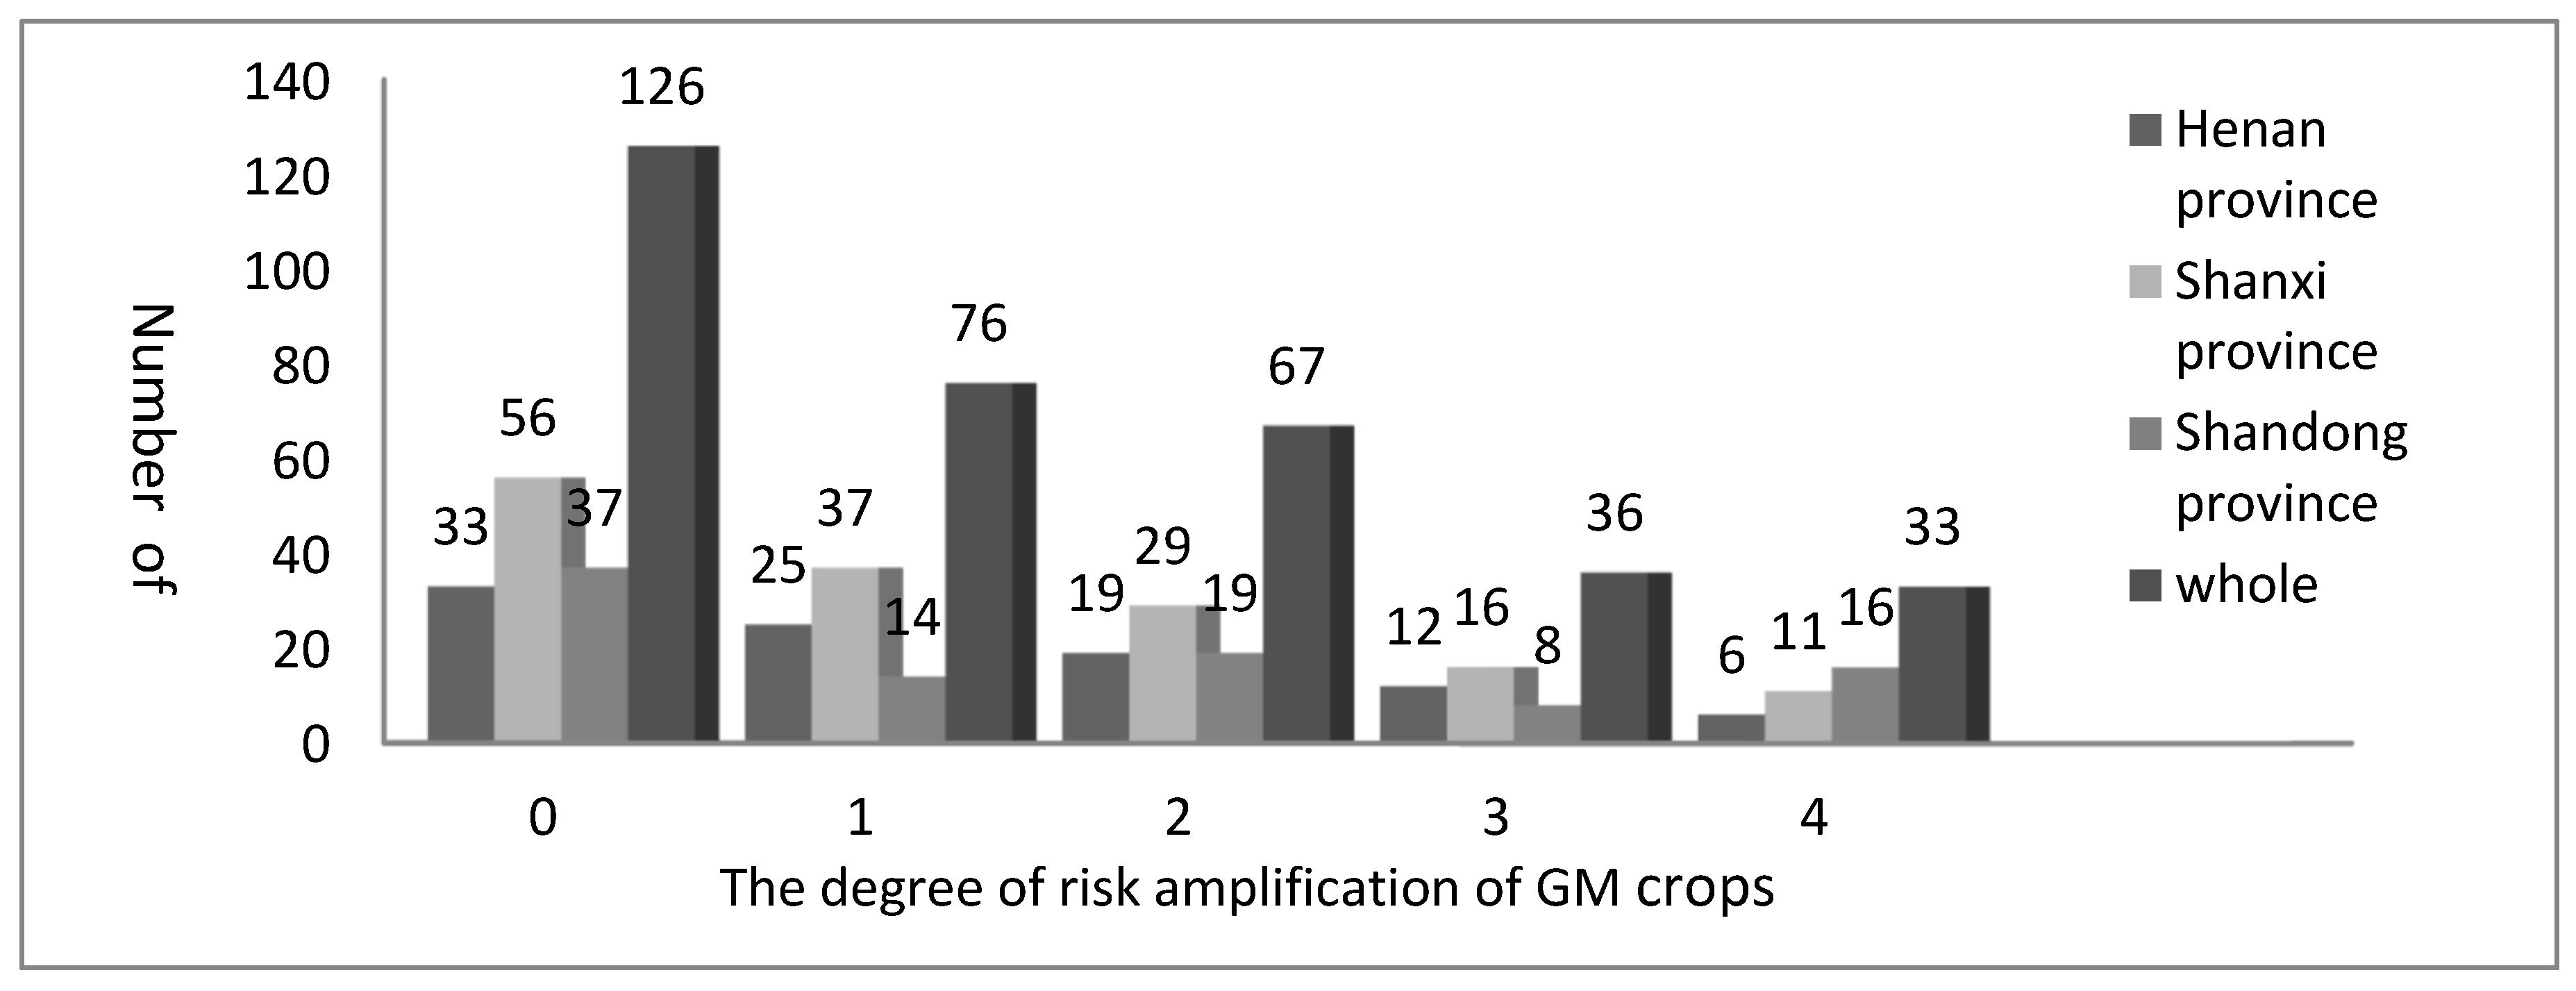
Figure 2.
Frequency distribution diagram of producers’ risk perception.
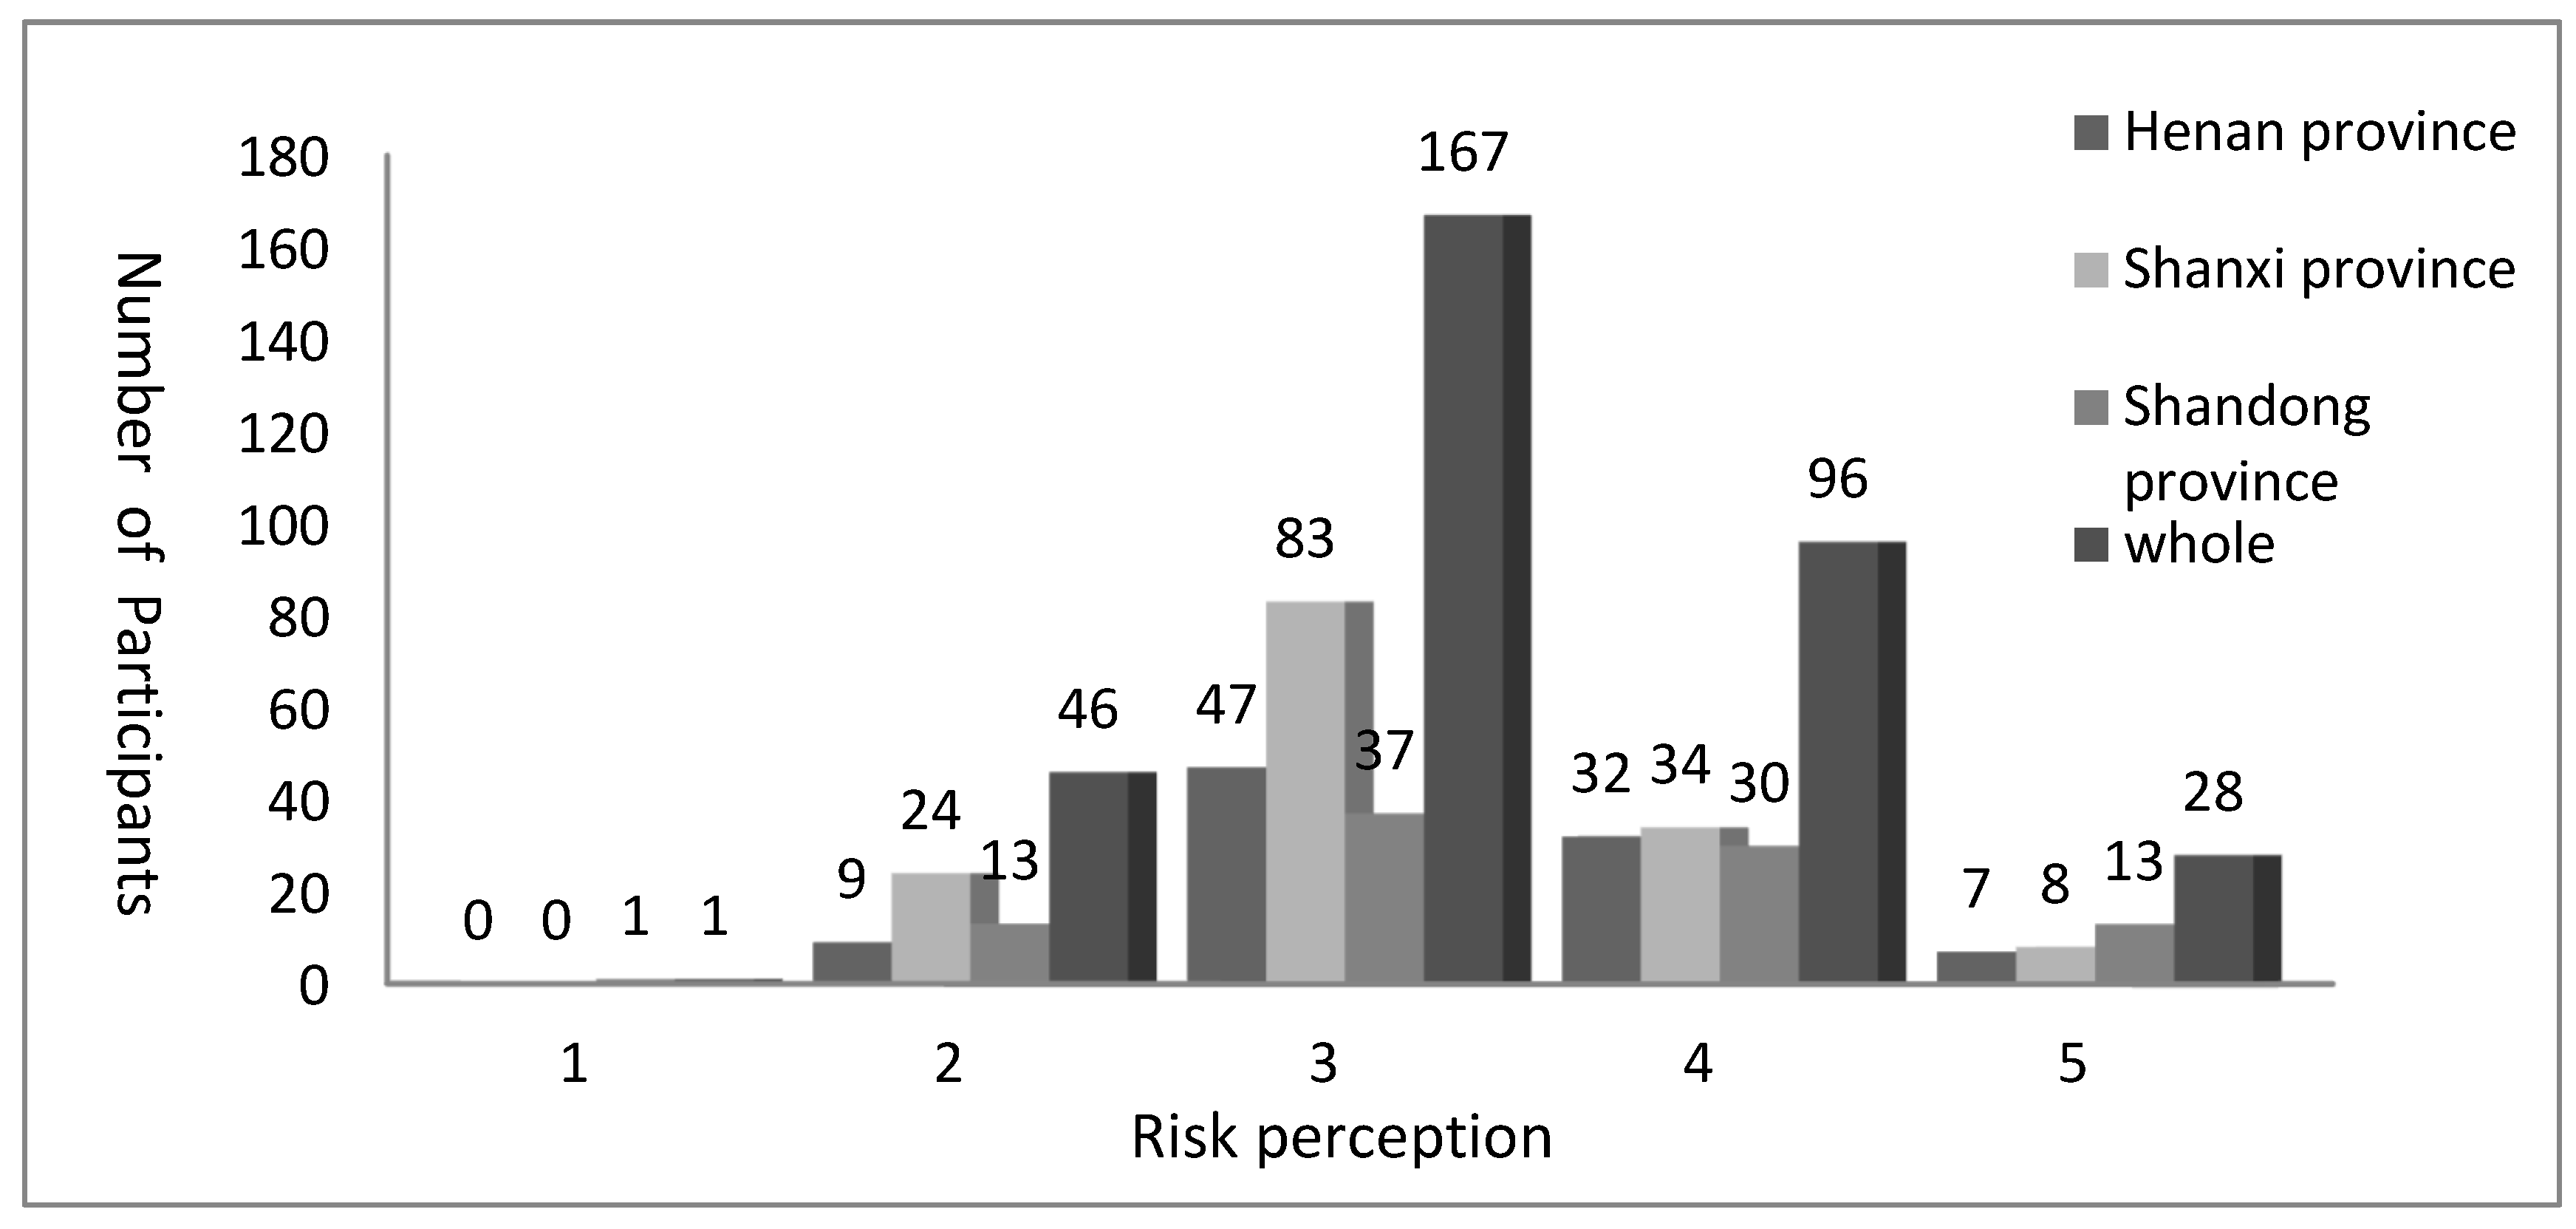
Table 2.
Basic information of the sampled area.
| Shanxi Province | Henan Province | Shandong Province | |
| landforms | West of central Taihang Mountain | Mountains in the West and plains in the East | Back to the mountain and facing the sea, mountains, hills and plains are distributed alternately |
| Resident population | 1408.8thousand | 5192.2thousand | 2959.5thousand |
| Per capita GDP | 47790yuan | 42936yuan | 58110yuan |
| Number of universities | 3 | 7 | 6 |
| Proportion of primary industry 3in GDP | 1.50% | 11.80% | 8.40% |
Table 3.
Relative risk coefficient distribution of Series 1 and Series 2.
| TL | Range of rr1 | rr1 | Frequency | Range of rr2 | rr2 | Frequency |
| 1 | rr<-3.93 | -3.93 | 29 | rr<-1.57 | -1.57 | 91 |
| 2 | -3.93<rr<-1.42 | -2.675 | 12 | -1.57<rr<-0.42 | -0.995 | 7 |
| 3 | -1.42<rr<-0.96 | -1.19 | 9 | -0.42<rr<0.02 | -0.2 | 7 |
| 4 | -0.96<rr<-0.52 | -0.74 | 10 | 0.02<rr<0.27 | 0.145 | 8 |
| 5 | -0.52<rr<-0.34 | -0.43 | 7 | 0.27<rr<0.43 | 0.35 | 7 |
| 6 | -0.34<rr<-0.21 | -0.275 | 10 | 0.43<rr<0.55 | 0.49 | 9 |
| 7 | -0.21<rr<-0.12 | -0.165 | 13 | 0.55<rr<0.63 | 0.59 | 10 |
| 8 | -0.12<rr<-0.01 | -0.065 | 16 | 0.63<rr<0.77 | 0.7 | 20 |
| 9 | -0.01<rr<0.07 | 0.03 | 12 | 0.77<rr<0.84 | 0.805 | 11 |
| 10 | 0.07<rr<0.15 | 0.11 | 17 | 0.84<rr<0.91 | 0.875 | 18 |
| 11 | 0.15<rr<0.24 | 0.195 | 31 | 0.91<rr<0.96 | 0.935 | 16 |
| 12 | 0.24<rr<0.30 | 0.27 | 24 | 0.96<rr<1 | 0.98 | 18 |
| 13 | 0.30<rr<0.36 | 0.33 | 33 | 1<rr<1.06 | 1.03 | 15 |
| 14 | 0.36<rr<0.42 | 0.39 | 43 | 1.06<rr<1.12 | 1.09 | 16 |
| Never | 0.42<rr | 0.42 | 72 | 1.12<rr | 1.12 | 85 |
| SUM | 338 | 338 |
*rr1 represents the relative risk coefficient of series 1 and rr2 represents the relative risk coefficient of series 2.
Table 4.
Summary of explanatory variables.
| Variable symbol | Explanatory variable | Notes | Expected direction |
| Core explanatory variable | |||
| ra | Risk amplification | 0-4,the larger the value, the higher the degree of risk amplification. | - |
| rr | Relative risk preference coefficient | The larger the value, the more risk averse. | - |
| rp | Risk perception | 1-5,the higher the score, the stronger the risk perception. | - |
| Demographic variables | |||
| gender | The gender of participant | Dummy variable, male=0,female=1 | - |
| age | The age of participant | Continuous variable, 13-70 years old | - |
| marry | The marital status | Dummy variable, unmarried =0,married =1 | - |
| nm | Number of people in the household | continuous variable | - |
| Under7 | If there are children under 7 years old in the household | Dummy variable, no=0,yes=1 | - |
| Byond60 | If there are elderly people who are 60 years and older in the household | Dummy variable no=0,yes=1 | - |
| edu | Participants’ education level | Categorical variable, primary school =1,junior high school =2,high school =3,undergraduate and junior college =4,master degree or above =5 | + |
| mhi | Monthly household income | 1-10 levels,the higher the level, the higher the monthly income of the household. | + |
| Other control variables | |||
| char | If a participant was in charge of purchasing food | no=0,yes=1 | - |
| freq | How often participants read production date, shelf life and nutrition information on food package when purchasing food | 1-5, the higher the score, the lower the frequency. | + |
| trust | Degree of trust in Chinese food industry | 1-5, the higher the score, the higher the trust | + |
| cog | Cognition of GM agricultural products | 0-5, the higher the score, the higher the understanding. | + |
| atti | Attitude towards GM agricultural products | 1-5, the higher the score, the more negative the attitude | - |
| knowl | Genetic knowledge | 0-4, the higher the score, the richer the genetic knowledge | + |
| label | GM agricultural products must be labeled | no=0,yes=1 | - |
Table 5.
Descriptive statistics of explanatory variables.
| Henan province | Shanxi province | Shandong province | whole | |||||
| number | proportion | number | proportion | number | proportion | number | proportion | |
| Level of willingness to accept GM agricultural products | ||||||||
| 1 | 32 | 33.68% | 58 | 38.93% | 38 | 40.43% | 128 | 37.87% |
| 2 | 23 | 24.21% | 23 | 15.44% | 27 | 28.72% | 73 | 21.60% |
| 3 | 33 | 34.74% | 45 | 30.20% | 21 | 22.34% | 99 | 29.29% |
| 4 | 3 | 3.16% | 12 | 8.05% | 5 | 5.32% | 20 | 5.92% |
| 5 | 4 | 4.21% | 11 | 7.38% | 3 | 3.19% | 18 | 5.33% |
| Level of willingness to recommend GM agricultural products to others | ||||||||
| 1 | 35 | 36.84% | 47 | 31.54% | 38 | 40.43% | 120 | 35.50% |
| 2 | 27 | 28.42% | 37 | 24.83% | 34 | 36.17% | 98 | 28.99% |
| 3 | 32 | 33.68% | 45 | 30.20% | 11 | 11.70% | 88 | 26.04% |
| 4 | 1 | 1.05% | 16 | 10.74% | 7 | 7.45% | 24 | 7.10% |
| 5 | 0 | 0.00% | 4 | 2.68% | 4 | 4.26% | 8 | 2.37% |
| Level of agreement with importing a large number of GM agricultural products | ||||||||
| 1 | 36 | 37.89% | 46 | 30.87% | 35 | 37.23% | 117 | 34.62% |
| 2 | 27 | 28.42% | 30 | 20.13% | 32 | 34.04% | 89 | 26.33% |
| 3 | 27 | 28.42% | 56 | 37.58% | 14 | 14.89% | 97 | 28.70% |
| 4 | 3 | 3.16% | 10 | 6.71% | 11 | 11.70% | 24 | 7.10% |
| 5 | 2 | 2.11% | 7 | 4.70% | 2 | 2.13% | 11 | 3.25% |
| Level of support for the development of GM agricultural products | ||||||||
| 1 | 33 | 34.74% | 42 | 28.19% | 34 | 36.17% | 109 | 32.25% |
| 2 | 22 | 23.16% | 18 | 12.08% | 26 | 27.66% | 66 | 19.53% |
| 3 | 32 | 33.68% | 47 | 31.54% | 20 | 21.28% | 99 | 29.29% |
| 4 | 3 | 3.16% | 22 | 14.77% | 8 | 8.51% | 33 | 9.76% |
| 5 | 5 | 5.26% | 20 | 13.42% | 6 | 6.38% | 31 | 9.17% |
| Level of willingness to purchase GM agricultural products | ||||||||
| 1 | 36 | 37.9% | 39 | 26.2% | 28 | 29.8% | 103 | 30.5% |
| 2 | 19 | 20% | 24 | 16.1% | 39 | 41.5% | 82 | 24.3% |
| 3 | 36 | 37.9% | 45 | 30.2% | 18 | 19.1% | 99 | 29.3% |
| 4 | 2 | 2.1% | 19 | 12.8% | 5 | 5.3% | 26 | 7.7% |
| 5 | 2 | 2.1% | 22 | 14.8% | 4 | 4.3% | 28 | 8.3% |
Table 6.
Summary statistics of core risk-related explanatory variables.
| Mean | Std. Error | Mean | Std. Error | ||
| ra | rr1 | ||||
| Henan province | 1.29 | 1.26 | Henan province | -0.07 | 1.08 |
| Shanxi province | 1.26 | 1.27 | Shanxi province | -0.12 | 1.10 |
| Shandong province | 1.49 | 1.50 | Shandong province | -0.06 | 0.74 |
| Whole sample | 1.33 | 1.33 | Whole sample | -0.09 | 1.00 |
| rp | rr2 | ||||
| Henan province | 3.39 | 0.77 | Henan province | 0.22 | 1.16 |
| Shanxi province | 3.17 | 0.76 | Shanxi province | 0.13 | 1.20 |
| Shandong province | 3.44 | 0.93 | Shandong province | 0.66 | 0.45 |
| Whole sample | 3.31 | 0.82 | Whole sample | 0.30 | 1.06 |
Table 7.
Summary statistics of participants’ sociodemographic background.
| Henan province | Shanxi province | Shandong province | Whole sample | ||||||||
| number | proportion | number | proportion | number | proportion | number | proportion | ||||
| Gender(0=male,1=female) | |||||||||||
| 1 | 46 | 48.42% | 80 | 53.69% | 37 | 39.36% | 163 | 48.22% | |||
| 0 | 49 | 51.58% | 69 | 46.31% | 57 | 60.64% | 175 | 51.78% | |||
| Age | |||||||||||
| ≤25 | 18 | 18.95% | 24 | 16.11% | 3 | 3.19% | 45 | 13.31% | |||
| 25-35 | 21 | 22.11% | 33 | 22.15% | 15 | 15.96% | 69 | 20.41% | |||
| 35-45 | 12 | 12.63% | 47 | 31.54% | 36 | 38.30% | 95 | 28.11% | |||
| 45-55 | 29 | 30.53% | 33 | 22.15% | 34 | 36.17% | 96 | 28.40% | |||
| >55 | 15 | 15.79% | 12 | 8.05% | 6 | 6.38% | 33 | 9.76% | |||
| Marital status (0=unmarried,1=married) | |||||||||||
| 1 | 77 | 81.05% | 111 | 74.50% | 85 | 90.43% | 273 | 80.77% | |||
| 0 | 18 | 18.95% | 38 | 25.50% | 9 | 9.57% | 65 | 19.23% | |||
| Number of family members | |||||||||||
| ≤3 | 35 | 36.84% | 57 | 38.26% | 49 | 52.13% | 141 | 41.72% | |||
| 4-5 | 52 | 54.74% | 81 | 54.36% | 40 | 42.55% | 173 | 51.18% | |||
| >5 | 8 | 8.42% | 11 | 7.38% | 5 | 5.32% | 24 | 7.10% | |||
| Members under the age of 7 | |||||||||||
| no | 69 | 72.63% | 110 | 73.83% | 60 | 63.83% | 239 | 70.71% | |||
| yes | 26 | 27.37% | 39 | 26.17% | 34 | 36.17% | 99 | 29.29% | |||
| Members beyond the age of 60 | |||||||||||
| no | 54 | 56.84% | 66 | 44.30% | 43 | 45.74% | 163 | 48.22% | |||
| yes | 41 | 43.16% | 83 | 55.70% | 51 | 54.26% | 175 | 51.78% | |||
| Education (1=primary school degree,2=junior high school degree,3=high school degree,4=college degree,5=Master’s degree or above) | |||||||||||
| 1 | 13 | 13.68% | 13 | 8.72% | 12 | 12.77% | 38 | 11.24% | |||
| 2 | 30 | 31.58% | 40 | 26.85% | 42 | 44.68% | 112 | 33.14% | |||
| 3 | 22 | 23.16% | 31 | 20.81% | 25 | 26.60% | 78 | 23.08% | |||
| 4 | 27 | 28.42% | 59 | 39.60% | 15 | 15.96% | 101 | 29.88% | |||
| 5 | 3 | 3.16% | 6 | 4.03% | 0 | 0.00% | 9 | 2.66% | |||
| Monthly household income (1=4000-5999yuan, 2=6000-9999yuan, 3= 10000 yuan above) | |||||||||||
| 1 | 56 | 58.95% | 107 | 71.81% | 38 | 40.43% | 201 | 59.47% | |||
| 2 | 23 | 24.21% | 30 | 20.13% | 35 | 37.23% | 88 | 26.04% | |||
| 3 | 16 | 16.84% | 12 | 8.05% | 21 | 22.34% | 49 | 14.50% | |||
Table 8.
Full sample estimation results using ordered logit model and Poisson model.
| Explanatory variable | Ordered logit model | Poisson regression | ||
| Model 1 | Model 2 | Model 3 | Model 4 | |
| ra | -0.249***(0.088) | -0.691***(0.214) | -0.050***(0.030) | -0.194***(0.101) |
| rp | -0.488***(0.169) | -0.471***(0.170) | -0.092*(0.054) | -0.091*(0.055) |
| rr | -0.300***(0.104) | -0.307***(0.112) | -0.053**(0.036) | -0.059***(0.036) |
| gender | 0.26(0.230) | 0.295(0.231) | 0.067(0.080) | 0.067(0.080) |
| age | -0.022*(0.012) | -0.020*(0.012) | -0.004**(0.004) | -0.004*(0.004) |
| marry | -0.297(0.279) | -0.243(0.275) | -0.062(0.085) | -0.048(0.084) |
| nm | 0.049(0.102) | 0.049(0.102) | 0.015(0.035) | 0.014(0.035) |
| under7 | -0.049(0.257) | -0.075(0.257) | -0.028(0.089) | -0.019(0.090) |
| beyond60 | -0.203(0.226) | -0.201(0.226) | -0.037(0.078) | -0.040(0.078) |
| edu | 0.366***(0.119) | 0.363***(0.119) | 0.062*(0.041) | 0.057*(0.042) |
| mhi | 0.007(0.059) | 0.004(0.059) | 0.007(0.020) | 0.009(0.020) |
| char | -0.387*(0.242) | -0.409*(0.244) | -0.090**(0.084) | -0.091**(0.085) |
| freq | 0.132*(0.082) | 0.137*(0.082) | 0.025**(0.028) | 0.091**(0.028) |
| trust | 0.063(0.151) | 0.015(0.051) | 0.068(0.075) | |
| cog | -0.029(-0.090) | -0.008(0.032) | -0.094(0.066) | |
| atti | -0.097***(0.183) | -0.988***(0.184) | -0.190***(0.058) | -0.186***(0.058) |
| knowl | -0.254**(0.112) | -0.266**(0.112) | -0.051*(0.038) | -0.051*(0.038) |
| label | -0.815***(0.304) | -0.992***(0.373) | -0.142***(0.096) | -0.269***(0.172) |
| ra*trust | 0.178**(0.077) | 0.058**(0.038) | ||
| cog*label | 0.063(0.095) | 0.059*(0.074) | ||
Note: *, **, ***Significant at 0.1, 0.05, or 0.01, respectively. Standard errors are in parentheses.
Table 9.
Estimation results of factors impacting the willingness to accept, willingness to purchase, and willingness to recommend GM technology of producers in different provinces.
Table 9.
Estimation results of factors impacting the willingness to accept, willingness to purchase, and willingness to recommend GM technology of producers in different provinces.
| Willingness to accept | Willingness to purchase seeds | Willingness to recommend | ||||||||||
| Explanatory variable | Full sample | Shanxi | Henan | Shandong | Full sample | Shanxi | Henan | Shandong | Full sample | Shanxi | Henan | Shandong |
| ra | -0.920***(0.238) | -1.212***(0.446) | -1.693* (1.058) |
-4.383***(1.142) | -0.402* (0.216) |
-0.865** (0.370) |
-0.873 (0.750) |
-0.891* (0.518) |
-0.579*** (0.219) |
-0.345 (0.361) |
-1.627 (1.043) |
-1.074 (0.747) |
| rp | -0.320** (0.170) |
-0.361 (0.270) |
-1.896***(0.447) | 1.043** (0.408) |
-0.686*** (0.171) |
-0.647** (0.274) |
-1.425*** (0.406) |
-0.159 (0.365) |
-0.522*** (0.171) |
-0.389 (0.271) |
-1.429*** (0.412) |
-0.226 (0.356) |
| rr | -0.298***(0.105) | -0.395** (0.155) |
-0.244 (0.212) |
-0.230 (0.340) |
-0.246** (0.108) |
-0.226 (0.158) |
-0.231 (0.206) |
-0.800** (0.323) |
-0.199* (0.107) |
-0.330** (0.159) |
-0.227 (0.210) |
-0.209 (0.322) |
| gender | 0.288 (0.234) |
0.418 (0.376) |
0.732 (0.594) |
0.096 (0.546) |
0.139 (0.227) |
0.745** (0.369) |
-0.261 (0.574) |
-0.345 (0.519) |
0.293 (0.233) |
0.404 (0.366) |
0.412 (0.577) |
0.279 (0.524) |
| age | -0.006 (0.012) |
-0.011 (0.021) |
0.076*** (0.028) |
0.052 (0.051) |
-0.023* (0.012) |
-0.016 (0.020) |
0.063** (0.027) |
-0.086** (0.043) |
-0.030** (0.012) |
-0.024 (0.020) |
0.048* (0.028) |
-0.058 (0.045) |
| marry | 0.080 (0.230) |
-0.630 (0.479) |
2.259** (0.939) |
-0.597 (1.192) |
-0.540* (0.289) |
-0.703 (0.485) |
1.387 (0.924) |
-1.506 (1.076) |
-0.482* (0.301) |
-0.398 (0.463) |
1.519* (0.918) |
-0.919 (1.035) |
| nm | 0.124 (0.102) |
-0.183 (0.162) |
0.311 (0.243) |
0.642** (0.277) |
0.085 (0.098) |
0.089 (0.156) |
0.420* (0.238) |
0.118 (0.242) |
-0.057 (0.102) |
-0.006 (0.160) |
0.105 (0.249) |
-0.158 (0.243) |
| under7 | -0.245 (0.255) |
0.222 (0.487) |
-0.514 (0.509) |
0.196 (0.675) |
-0.083 (0.253) |
0.929** (0.467) |
-0.502 (0.497) |
-0.384 (0.639) |
0.194 (0.250) |
0.490 (0.451) |
-0.203 (0.514) |
0.554 (0.616) |
| beyond60 | -0.504** (0.225) |
-0.788* (0.405) |
-0.766 (0.501) |
-1.350** (0.611) |
-0.101 (0.221) |
-0.720* (0.403) |
-0.291 (0.485) |
-0.630 (0.553) |
0.049 (0.226) |
-0.301 (0.409) |
-0.451 (0.498) |
0.239 (0.539) |
| edu | 0.198* (0.120) |
0.495** (0.199) |
0.358 (0.304) |
0.134 (0.335) |
0.386*** (0.120) |
0.52*** (0.186) |
0.245 (0.299) |
-0.186 (0.308) |
0.317*** (0.120) |
0.549*** (0.187) |
0.374 (0.305) |
-0.016 (0.313) |
| mhi | 0.057 (0.059) |
0.111 (0.105) |
0.019 (0.142) |
-0.039 (0.146) |
-0.0019 (0.057) |
-0.054 (0.099) |
0.157 (0.147) |
0.136 (0.134) |
0.031 (0.058) |
0.033 (0.105) |
-0.054 (0.139) |
0.111 (0.126) |
| char | -0.497** (0.244) |
-0.425 (0.417) |
-0.369 (0.568) |
-0.271 (0.566) |
-0.088 (0.241) |
-0.426 (0.417) |
0.317 (0.564) |
0.333 (0.515) |
-0.513** (0.246) |
-0.031 (0.425) |
-0.515 (0.573) |
-0.703 (0.512) |
| freq | 0.146* (0.087) |
0.152 (0.127) |
0.094 (0.189) |
-0.180 (0.258) |
0.112 (0.083) |
0.017 (0.130) |
0.128 (0.188) |
-0.068 (0.228) |
0.144* (0.082) |
0.194* (0.118) |
0.092 (0.196) |
0.03 (0.229) |
| cog | -0.230 (0.197) |
-0.488* (0.293) |
0.473 (0.488) |
0.148 (0.566) |
-0.069 (0.199) |
-0.184 (0.288) |
0.435 (0.501) |
0.037 (0.575) |
-0.540*** (0.208) |
-0.648** (0.288) |
-0.272 (0.543) |
-0.546 (0.611) |
| atti | -0.653***(0.184) | -0.842** (0.313) |
0.171 (0.377) |
-1.358***(0.429) | -0.953*** (0.187) |
-1.845*** (0.356) |
-0.171 (0.392) |
-0.676* (0.406) |
-0.893*** (0.188) |
-1.160*** (0.333) |
-0.012 (0.342) |
-1.129*** (0.395) |
| knowl | -0.186* (0.111) |
-0.116 (0.182) |
-0.002 (0.259) |
-0.035 (0.293) |
-0.244* (0.108) |
-0.200 (0.172) |
0.026 (0.249) |
-0.311 (0.271) |
-0.147 (0.111) |
0.025 (0.173) |
-0.413 (0.263) |
-0.093 (0.260) |
| label | -1.056** (0.513) |
-1.593** (0.775) |
0.21 (0.986) |
-0.674 (1.683) |
-0.460 (0.522) |
-0.773 (0.821) |
0.331 (0.990) |
1.002 (1.611) |
-1.181** (0.528) |
-1.722** (0.799) |
-0.855 (1.114) |
-0.190 (1.690) |
| ra*trust | 0.225*** (0.084) |
0.445** (0.183) |
0.513 (0.422) |
1.193*** (0.351) |
0.052 (0.079) |
0.291* (0.156) |
0.171 (0.277) |
0.099 (0.155) |
0.165** (0.079) |
0.134 (0.154) |
0.493 (0.416) |
0.290 (0.241) |
| cog*label | 0.240 (0.219) |
0.577* (0.322) |
-0.458 (0.533) |
-0.237 (0.617) |
-0.030 (0.221) |
0.005 (0.329) |
-0.538 (0.541) |
-0.265 (0.604) |
0.456** (0.229) |
0.420 (0.325) |
0.374 (0.580) |
0.548 (0.650) |
| Pseudo R2 | 12.46% | 16.41% | 22.76% | 27.72% | 14.58% | 21.34% | 19.73% | 22.34% | 14% | 18.61% | 21.24% | 17.8% |
| Sample size | 338 | 149 | 95 | 94 | 338 | 149 | 95 | 94 | 338 | 149 | 95 | 94 |
Note: *, **, ***Significant at 0.1, 0.05, or 0.01, respectively. Standard errors are in parentheses.
Disclaimer/Publisher’s Note: The statements, opinions and data contained in all publications are solely those of the individual author(s) and contributor(s) and not of MDPI and/or the editor(s). MDPI and/or the editor(s) disclaim responsibility for any injury to people or property resulting from any ideas, methods, instructions or products referred to in the content. |
© 2023 by the authors. Licensee MDPI, Basel, Switzerland. This article is an open access article distributed under the terms and conditions of the Creative Commons Attribution (CC BY) license (http://creativecommons.org/licenses/by/4.0/).
Copyright: This open access article is published under a Creative Commons CC BY 4.0 license, which permit the free download, distribution, and reuse, provided that the author and preprint are cited in any reuse.


