Submitted:
16 August 2023
Posted:
17 August 2023
You are already at the latest version
Abstract
(1) The study using the quails of the Manchurian golden breed was aimed at the efficacy of the food supplement based on micro-incapsulated phytase of Obessumbacterium proteus in the recombinant yeast producer Yarrowia lipolytica at a dose of 500 FYT/kg of the feed. (2) The effect of the supplement in the poultry diets on the productivity of young and adult quails was assayed; (3) It was found that the keeping the quails on the diets using the microencapsulated phytase O. proteus provided the highest live weight, the highest intensity of egg production, and the slaughter yield of animals, the lowest feed conversion compared to those in control groups and the groups getting a commercial phytase supplement based on Aspergillus ficuum. Taken together the data obtained in our experiments indicate a high degree of assimilation of phytate-containing products by the quails when using the encapsulated phytase compared to both the control and commercial preparation of phytase of the PhyA class. It can be concluded that it is a highly expedient and promising supplement based on the microencapsulated phytase of class D for feeding, which shows the best kinetic features compared to the phytases of PhyA and PhyC classes when working in the chyme of the poultry.
Keywords:
phytase
; microencapsulation
; quail
; feed additive
; nutrient digestibility
; Yarrowia lipolytica
; Obesumbacterium proteus
1. Introduction
Currently, the world population need the increasing amount of dietary meat that promote the dynamic development of a new branch of poultry farming, namely quail farming, as the source of eggs and quail meat. The meat of the bird is of delicate consistency, juiciness, and aroma [1]. The poultry shows high egg productivity and rapid precocity. Females start laying eggs at the age of 35 – 40 days giving up to 250 – 280 eggs per year. Moreover, the feed consumption per 1 kg of egg quantity is of 2.8 – 3.1 kg, and the weight of the eggs laid by one female for a year 24-fold excesses the body weight of the female, whereas in the best chicken breeds this ratio is 1:8 [2]. The egg trend in the quail farming has been most popular in Japan and in the countries of The Far East where the quail eggs are mainly used for medical and dietary nutrition [3]. But in the countries of Europe, the meat direction of the quail farming is the most developed. Both quail meat and eggs are produced in the USA [4]. The products of this industry in some countries are used not only for food but also as raw materials in the perfume industry to prepare high-quality creams, shampoos, and some other cosmetic products [5].
Successful cost-effective breeding of quails is possible only if the production supposes to provide the conditions for the biological features of the poultry, the latest development in the field of feeding and poultry keeping technology [6-9]. Obtaining high productivity of the poultry including the quails needs applying the balanced feed with phosphorus as an important component. In the cells of all living organisms, there are both forms of phosphorus, namely ortho- and pyrophosphates and moreover the phosphorus is present in the composition of phosphoproteins, phospholipids, nucleic acids, hexosophosphates, etc. In the vertebrates, phosphorus, along with calcium, is part of bone tissue. The main form of organic phosphorus in the plant feed for the poultry is myo-inositol hexakisphosphoric or phytic acid being a derivative of myo-inositol, a cyclic alcohol phosphorylated by all 6 hydroxyl groups (Figure 1) [10, 11]. The negatively charged phosphoric acid residues in the phytic acid molecule form the salts (phytates) with cations of iron, zinc, calcium, magnesium, and some other elements, and also react with proteins, starch, and lipids to form insoluble conglomerates (Figure 1). In the plants, most of the phosphorus is represented by insoluble phytates present most of phosphorus, Ca2+, and Mg2+. Grains of cereals, sunflower seeds, cotton, pumpkin, and legumes are the richest sources of phytates containing more than 60% of total phosphorus [12]. Phytates are also found in tubers and some other plant organs.
Both phytate phosphorus and mio-inositol get available for assimilation only if being eliminated under phytase action. The grains of cereals and legumes, seeds of oilseeds forming the basis of feed give 60-88% of the total phosphorus. Because of the absence of phytases in the digestive system of monogastric animals they can’t assimilate the most of the phosphorus in the plant feeds. In its turn, the phosphorus lack causes the evident disorders in the formation of the animal skeleton. Upon the limited amount of available phosphorus in the feed the content of phytic phosphorus increases, which is assimilated by the adult poultry by 50%, and is by young ones only by 30 % [13]. Recently, more and more attention has been paid to the use of various phytase preparations in the poultry industry [14]. Thus, there are some data that up to 90% of the mixed feed for the poultry are enriched with phytases, the enzyme preparations eliminating indigestible phytate-containing complexes [15-17] The use of those is provided not only by the effect on the phytate complex of the plant feed but also by a decrease in the inorganic phosphates, as well as by a decrease in the phosphorus excretion with the faeces into the environment [18, 19]. The use of the feed additives containing phytases in the poultry and animal husbandry permits to effectively reduce the specific feed consumption spent per a unit of production, which means the reduction of the wastes generated, thereby increasing the profitability of agricultural production.
Phytase catalyzes the phytate hydrolysis (myo-inositol 1,2,3,4,5,6-hexakisphosphate) (Figure 1), which is the main form of the phosphorus depot in the plants and is not assimilated by monogastric animals because of the lack of the sufficient phytase production in the gastrointestinal tract [20]. The current market offers a wide range of phytase preparations mainly based on phytases of microbial origin of class A (PhyA) and class C (PhyС) [21, 22]. However, while passing through the chyme of the poultry the enzyme significantly reduces due to acid denaturation and proteolysis. The technology of phytase encapsulation in the yeast-producing cells as microcontainers can essentially decrease the loss of the enzyme and facilitate its thermal stability. Extremophilic yeast Yarrowia lipolytica is a promising object of modern biotechnology, in particular, for the production of encapsulated phytase owing also to the full sequence of its genome and the availability of special tools to creating highly effective strains-producers of recombinant proteins [23-25].
In our previous studies [26] we assayed the phytase activity of the Y. lipolytica Po1f pUV3-Op transformant producing intracellular (encapsulated) phytase from Obsumbacterium proteus (OPP) based on the pUVLT2 vector with the mitochondrial porin promoter VDAC (Voltage Dependent Anion Channel). When cultured under alkaline conditions (pH 8.0), close to the pH in the intestine of the poultry the VDAC promoter as the pUV3-Op genetic construct part in the Y. lipolytica Po1f pUV3-Op transformant was induced, it was accompanied by an increase in phytase activity. The results obtained during the cultivation of the transformant pUV3-Op-2 in the fermenter confirmed a high activity of extracellular phytase upon assimilating of phytate-containing substrates. The high stability of the intracellular phytase of the transformant Y. lipolytica pUV3-Oр for heat treatment when using a spray dryer was also noted [27]. In addition, we have received encouraging results from testing a phytase supplement based on transformed yeast in broiler chickens [28].
This study is aimed at performing the experiments on the quails using the new encapsulated phytase additives based on the recombinant producer of Y. lipolytica Po1f pUV3-Op in the poultry diets and evaluating the effect of the additives on the productivity of young and adult quails.
2. Materials and Methods
2.1. Experimental Design and Bird Husbandry
The research was performed in the Russian Research and Technological Poultry Institute of Russian Academy of Sciences using the Manchurian golden quail (Coturnix japonica) (Figure 2) breed listed in the International Register of Quail Breeds and Lines. It is a very productive breed with good egg production of rather large size. In the experiments the males and females were raised in the common cell batteries for young animals up to 42 days. 42-day old quails were separated into males and females and transferred to the cage batteries for adult birds where they were kept until 60-day age with a sex ratio of 1:4 (male: female). The humidity was maintained at 65±5% during the whole experiment while the indoor temperature varied: it was 30°C for the first week, in the second one it was 28°C, in the third one it decreased up to 26 – 25°C, in the fourth and further ones it was 23 – 22°C.
The experimental protocol was approved at the assembly of the Local Ethics Committee of The Federal Research Center “Fundamental Bases of Biotechnology” of Russian Academy of Sciences (Protocol No. 22/1 dated from 09.07.2022). In total, 150 one-day-old Manchurian golden quail were cooped into battery cages (25 heads in each colony cage for 42 days, and then they were reared in mixed-sex groups in pens, 20/1394 cm2). 42-day old quails were separated into males and females and transferred to the cage batteries for adult birds where they were kept until 60-day age with a sex ratio of 1:4 (male: female). The experiment was performed in the Russian Research and Technological Poultry Institute of Russian Academy of Sciences and kept at a temperature of 30°C for the first week, then it gradually decreased up to 22-23°C by the fourth week. The experiment was performed at humidity of 65±5% using a 12 h photoperiod. The quails had ad libitum access to water. A bird bath per nine heads was provided. The sex of the birds was not distinguished at the moment.
Feeds were prepared from vegetable raw materials (corn, wheat, soybean meal, full-fat soybeans, sunflower meal, vitamin premix with the addition of synthetic feed amino acids of lysine, methionine, and threonine, but without raw materials of animal origin). For the first 28 days, the quails were fed using a starter diet (Table S1). The basic feed was used in a crushed form; in the experimental groups, the additives were supplied as powder. Then, each quail was weighed, and the experimental groups of 25 heads each were assembled using the method of analogous pairs. Furthermore, the experiment was performed for 60 days. Every group had ad libitum access to feed. The diet was supplied in excess twice a day to control consumption, and each feed provision was weighed. Be-fore supplying a fresh feed provision, the remaining residue was weighed again, and the amount was subtracted from the initial weight of the feed to determine the feed consump-tion and calculate the FCR.
2.2. Dietary Plan
In the experiments the pilot batches of feed additive containing microencapsulated O. proteus phytase and commercial Ladozym proxy phytase from Aspergillus ficuum, with an activity of 5000 FYT/g, were used to study the efficiency of feeds with a total phosphorus of ~0.6% (available phosphorus 0.31-0.33%). The feed included: 1) the first diet of food for quail from the first day of life up to 4- week age; 2) the second diet of feed for the quails of 5 to 6 weeks of age; 3) the third diet for adult quails of the initial egg-laying period of 42 to 60 days of life. The feed was prepared using vegetable raw materials (corn, wheat, soy meal, full-fat soy, sunflower cake, vitamin premix with some synthetic feed amino acids of lysine, methionine, and threonine) No animal raw materials were used. The total phosphorus in the three types of feed was 0.6 g per kg of feed while the available phosphorus reached 0.35–0.45% g per kg of feed that was 20-25% lower than those recommended for the quails. The feed for the three periods is in Tables S1-S3.
In the experiment, six groups of one-day old quails were formed with 25 heads in each differing in the types of feed:
Control group 1 got the feed with total phosphorus of 0.8% (0.45% of available phosphorus) without any additives;
Control group 2 got the feed with a total phosphorus of 0.6% (0.35% of available phosphorus) without any additives;
Experimental group 3 got the feed containing total phosphorus of 0.6% (0.35% of available phosphorus) supplied with the microencapsulated O. proteus phytase at a dose of 500 FYT per a kg of feed;
Experimental group 4 got the feed containing total phosphorus content of 0.8% (0.45% of available phosphorus) supplied with the microencapsulated O. proteus phytase at a dose of 500 FYT per kg of feed;
Experimental group 5 got the feed containing a total phosphorus content of 0.8% (0.45% of available phosphorus) supplied with the commercial phytase Ladozim proxy from A. ficuum at a dose of 4500 FYT per a kg of feed;
Experimental group 6 got the feed containing a total phosphorus content of 0.6% (0.35% of available phosphorus) supplied with the commercial phytase Ladozim proxy from A. ficuum at a dose of 4500 FYT per a kg of feed.
2.3. Preparing Feed Additives by Cultivation of the Yeast Strain
The preparation of bioadditives was carried out as described in [28] with some modifications. The Y. lipolytica strain was raised on a complete solid medium of the following composition (g/L): yeast extract—10, Bacto Peptone—20, glucose—20, and Bacto agar—20 at 28°C for 48 h. Then, the biomass was washed out with sterile water and used as an inoculum. The yeast was raised in batches of 100 mL in the medium (g/L): Mg2SO4—0.5, (NH4)2SO4—0.3, KH2PO4—2.0, K2HPO4—0.5, NaCl—0.1, and CaCl2—0.05), with different substrates. The substrate from the waste was prepared as it was described in [28].
The inoculation medium had the following composition (g/L): yeast extract—10, Bacto Peptone—20, fat of the chicken intestine—5, and sophexyl antifoam—0.35 mL/L, at pH 6.1; it was prepared and sterilized in a 3-litre fermenter for an hour (Miniforce Infors AG CH-4103 Bottmingen («INFORS HT», Switzerland) equipped with controlled рН и рО2, at 28°C for 21 h at a rotation of 350 rpm and aeration of 3 L/min
The culture medium pH and the partial pressure of oxygen were monitored using a sterilizable Clark-type oxygen sensor with a quick response. The final cultivation was performed in a 10-litre fermenter with a working volume of 7.5 litres (LabMakelaa, Baar, Switzerland). The medium contained yeast extract (Difco, Leeuwarden, The Nether-lands)—10 g/L; Bacto Peptone (Difco, Leeuwarden, Netherlands)—20 g/L; and chicken fat—5 g/L. The defatted chicken intestine paste was sterilized for 40 min at 120°C. The ini-tial pH of the cultivation medium was 5.5. The fermentation was performed at 28°C for 72 h at a rotation of 350 rpm with a sterile air input of 3 L/min. The antifoam solution was prepared using 150 mL sophexyl in 500 mL distilled water and sterilized for 40 min at 120°C. The cultivation medium pH was monitored, and the concentration of dissolved oxygen was measured using the Clark-type electrode with a glass-reinforced TEFLON membrane (Sea&Sun Technology, Trappenkamp, Germany).
The cell pellets and insoluble residue of the medium were concentrated using flow separation. The biomass was dried using spray drying at 75°C, with 1 L of the concen-trated suspension per hour (Buchi Mini Spray Dryer B-290, Switzerland). The resulting powder was weighed and assayed for phytase activity.
2.4. Assay of Phytase Activity
The phytase activity in the feed additives was assayed with a colorimetric method to assess the phosphate ion, which is released from phytate as described before [27]. A ten-milligram aliquot of the ground additive was placed into an Eppendorf tube. The sample was mixed with 50 mg of 0.3 mm glass beads and 500 mL of 250 mM sodium acetate buffer at pH 5.5; then the mixture was kept in an ice-cold bath for 10 min. The swollen cells were homogenised using triple stirring with a vortex for 2 min each. The homogenates were centrifuged at 14,000 g for 10 min. The suspensions obtained were diluted in a 250 mM sodium acetate buffer (pH 5.5), and 5 µL aliquots of dilutions 1, 2, and 4 were put into the wells of a flat-bottom immunological plate (Nunc Low-Sorb, Roskilde, Denmark). The medium contained 100 µL of substrate mix (5.1 mM sodium phytate in the same buffer). The plate was closed to prevent exsiccation and exposed at 37°C for an hour. Then, 50 µL of Fiske & Subbarow reagent was applied to each well, and the plate was incubated at a room temperature for 10 min. The absorbance at 415 nm was assayed using a Uniplan plate spectrophotometer (Pikon, Moscow, Russia). The phytase unit was calculated as the amount of the enzyme, which releases 1 _mol of phosphate ions per minute in those conditions.
2.5. Sample Collection and Processing
To determine the quality of the meat and internal organs of the bird, the slaughter of some 42-day old quails was performed. Three hen-quails and three cock-quails were selected from each group. There was performed an anatomical dressing of the poultry where the average weight of the carcasses, the slaughter yield, the yield of the main parts of the carcasses including the main internal organs were assayed.
2.6. Assay of Egg Production
The intensity level of egg laying is the main feature of the egg productivity of the poultry. This indicator was assayed using the ratio of the number of eggs laid for a certain period to the number of laying hens for the same period.
2.7. Assay of the Experimental Diets and the Chicken Faeces Composition
All the samples used for element assay were dried at 60°C until they reached constant weight. Then, 10 g samples were ground in a porcelain mortar, and 0.5 g of sample was picked up for assay. The chemical compositions of the feeds for the experimental groups and the chicken faeces were assayed at Dokuchaev Soil Science Institute of the RAS using the method of energy-dispersive X-ray fluorescence EDXRF (Thermo scientific,Waltham, Massachusetts, USA) analysis with the Respect instrument (Tolokonnikov Plant LLC, Moscow, Russia) as it was described in [29].
2.8. Feed Conversion Ratio (FCR)
The FCR was calculated as described in [30].
2.9. Statistical Analysis
The standard error of the mean (SEM) was calculated as described in [31]. All the data collected were analyzed using STATISTICA 10 (2011) (StatSoft, Inc., Tulsa, OK, USA, www.statsoft.com, accessed on 15 September 2022. All the data were presented as group mean values± standard deviation (mean± SD), continuous data were compared using ANOVA, and frequency data were compared using a chi-square test. Differences were considered statistically significant at p < 0.05.
3. Results
The study was performed in 2 stages. Until 42 days, all the animals were caged together (Stage 1). On the 42-nd day, the animals were separated by sex into females and males in a ratio of 1:4 and we went on the study to assess all the indicators and the egg production, up to 60 days (Stage 2). Figure 3 shows the scheme of the tests performed.
3.1. Stage 1
3.1.1. The Influence of the Phytases Additives on Body Weight, Weight Gain, Feed Assimilability, and FCR on the 42-th day of life.
At the first stage of the research, the Productivity, the Feed Assimilability, and FCR of the 42-day old quails were assayed. Table 1 shows the results of the quails live weight from one day to 42-days of age. As it can be seen from the table, the live weight of daily quails in all the studied groups was equal being on average 8 g. The live weight of the quails from 7 to 28 days of age in all the groups studied differed insignificantly. However, at the age of 35 days the average live weight in experimental group four where the poultry got the feed with the microencapsulated O. proteus phytase at a dose of 500 FYT per kg of feed and the total phosphorus content of 0.8% (0.45% of available phosphorus) exceeded the live weight of those in control group 1 by 1.1%, and did those control group 2 by 2.1%. At the same time, the weight of the quails in experimental group 4 was 3.0 and 4.1% higher than that in experimental groups 5 and 6, respectively where the poultry got a feed ration with an additive containing commercial phytase Ladozim proxy from A. ficuum at a dose of 4500 FYT per a kg of feed and the total phosphorus of 0.8 and 0.6% (0.45 and 0.35% of available phosphorus).
The 42- day old quails in all the groups were divided into females and males upon weighing. The results presented in Table 1 the highest live weights of 240 g among the females were noted in experimental group 4 as well as in both control groups, of 238.5 g for the first group and of 239.4 g for the second one, respectively. The live weight of females in experimental groups 3 and 4 getting the microencapsulated phytase of O. proteus with the total phosphorus of 0.8 and 0.6% compared to those in experimental groups 5 and 6 getting the commercial phytase of Ladozim proxy from A. ficuum with the total phosphorus of 0.8 and 0.6% was higher by 1.0 and 0.4%, and by 2.8 and 2.0%, in groups 3 and 4, respectively (Table 1).
As for the live weight of the males the experimental group 4 showed the highest rates. The average live weight of the males in experimental group 4 was 1.1 and 3.3% higher than that in control groups 1 and 2, respectively (Table 1). While compared to experimental groups 5 and 6 in experimental group 4 it was higher by 4.2 and 9.2%, respectively. It is worth noting that the data for experimental group 4 were statistically significantly different (at p<0.01) from those of the experimental group 6. The live weight of the females and males in experimental group 3 differed insignificantly compared to those control groups 1 and 2, and those in experimental group 4 exceeding only by 1.0 and 0.3% (for the females) and by 1.4 and 6.3% (for the males) the indicators of experimental groups 5 and 6, respectively (Table 1).
Thus, the experiment showed that the highest average live weight of quail, both males and females, were obtained in experimental group 4, namely 218.1 g, where the poultry got a feed diet supplemented with the microencapsulated O. proteus phytase at a dose of 500 FYT per a kg of feed and the total phosphorus of 0.8% (0.45% of available phosphorus). Hence, the total average live weight of the quail in experimental group 4 was higher by 0.2 and 1.2% than those in control groups 1 and 2, respectively. And it was higher by 3.3 and 5.5% compared to those in experimental groups 5 and 6, respectively.
The results of the quail growth up to 42 days were analyzed and the main zootechnical productivity indicators were calculated (Table 2). The data in the table display that during the 42-day experiment the percent alive in all the studied groups reached 100%, the highest average daily gain of the poultry during the whole growing period was observed in experimental group 4, where it amounted 5.00 g (Table 2). The lowest indicators for the average daily gain were found in experimental groups 5 and 6, where those were of 3.87 and 3.89 g, respectively.
Feed conversion is the most important feature characterizing the efficiency of animal growth, demonstrating how many units of feed were spent per unit of live weight gain. The lowest feed expense per 1 kg of live weight gain were obtained in experimental group 4. Thus, in experimental group 4 the feed expenses were lower by 0.5 and 1.8% compared to those in control groups 1 and 2, and by 3.6 and 4.1% compared to those in experimental groups 5 and 6 (Table 2). The FCR in groups 3 and 4 decreased by 1% and 2.01% compared to that in control groups 1 and 2, respectively (Table 2). However, FCR in groups 5 and 6 receiving the commercial phytase increased by more than 2% (Table 2).
3.1.2. The Influence of the Phytases on quail Meat quality on the 42-th day of life
To assay the quality of the meat and the internal organs of the poultry, at the age of 42 days the quails were killed floor. The anatomical cutting of the bird was performed with the assay of the weight of eviscerated carcass, slaughter yield, and the mass and yield of the main internal organs of the poultry. Figure 4 shows the data on the eviscerated carcass weight (on average for males and females), slaughter yield, the mass of the main parts and muscles. The highest average weight of the eviscerated carcass being 139.0 g was obtained in experimental group 4 due to the highest average live weight of the quails in this group.
The weight of the eviscerated carcasses in experimental group 4 was higher by 2.6 and 2.8% than those in control groups 1 and 2, respectively. It was higher by 6.6% (at p<0.05) in experimental group 4 than that in experimental group 5, and was significantly higher by 9.9% (at p<0.001) than that in experimental group 6. In experimental group 3 where the quails got a feed diet supplemented with microencapsulated phytase at a dose of 500 FYT per a kg of feed and the total phosphorus of 0.6% (0.35% of available phosphorus), the average weight of the eviscerated carcass was slightly lower than that in control groups 1 and 2, and that in experimental group 4 (Figure 4A). However, compared to that in experimental groups 5 and 6, it was higher by 2.6 and 5.8%. The best data for slaughter yield based on the weight and fatness of carcasses were obtained in experimental group 4. It was higher by 0.7 and 1.1% compared to control groups 1 and 2, and was by 2.2 and 2.6%. compared to those in experimental groups 5 and 6. The results in experimental group 3 exceeded by 0.8 and 1.2% than that in experimental groups 5 and 6, respectively (Figure 4B).
A similar trend was observed in experimental group 4. This indicator in experi-mental group 4 was higher by 0.3 and 1.3% and by 2.7 and 3.5% compared to that in con-trol groups 1 and 2, and 5 and 6, respectively. Experimental group 3 was inferior both in the weight and yield of breast and legs compared to those in control groups 1 and 2 and experimental group 4. However, the yield of breast in this group was higher by 0.5 and 1.4% compared to that in experimental groups 5 and 6, and the yield of chicken legs was higher by 1.1 and 1.9%, respectively.
The results of the anatomical cutting on the main parts and muscles in the carcasses (breast and ham) are presented in Table 3.
The highest yield of breast was obtained in experimental group 4, since the highest total breast weight in this group was 56.3 g (Table 3). The breast yield in experimental group 4 was higher by 1.2 and 2.1% than that in control groups 1 and 2, and it was more by 3.9 and 4.8% compared to that in experimental groups 5 and 6, respectively. A similar trend was observed in experimental group 4. This indicator in experimental group 4 was higher by 0.3 and 1.3% and by 2.7 and 3.5% compared to control groups 1 and 2, and 5 and 6, respectively. Experimental group 3 was inferior in both weight and yield of breast and hams to control groups 1 and 2 and experimental group 4. However, compared with experimental groups 5 and 6, breast yield in this group was higher by 0.5 and 1.4%, and the yield of hams was higher by 1.1 and 1.9%., respectively (Table 3).
The yield of the pectoral muscles in experimental group 4 was higher by 1.1 and 1.9% and 4.2 and 4.6%, compared to those in control groups 1 and 2 and in experimental groups 5 and 6, respectively (Table 3). Muscle yield in the legs in experimental group 4 was higher by 1.1 and 1.2%, and by 2.6 and 3.0%, compared to those in control groups 1 and 2 and experimental groups 5 and 6, respectively. In experimental group 3, the output of pectoral muscles and muscles in the legs was higher by 0.7 and 1.1% and 1.1 and 1.5% than in experimental groups 5 and 6, respectively (Table 3).
3.1.3. The Influence of the Phytases on the quail internal organs mass on the 42-th day of life.
During the anatomical cutting, the internal organs of the quails in each group were weighed and assayed. Figure 5 shows the data on the weight of the main internal organs of the 42-day old quails. The data in the table manifest that the internal organs, namely the muscular stomach, liver, and heart were within the physiological standard. Moreover, there was no significant difference in the weight of the main internal organs among the groups studied. The amount of the internal fat in all the groups tested was also almost at the same level.
3.2. Stage 2
3.2.1. The Influence of the Phytases on Body Weight, Weight Gain, Feed Assimilability, and FCR on the 60-th day of life.
At the second stage of the experiment, the Productivity, Feed Assimilability, FCR, and egg production of the adult quails were studied for the age from 42 to 60 days. So, the 42-day old quails of the similar live weight were transferred to the cell batteries with a sex ratio of males and females of 1:4. The adult quails were weighed at the age of 60 days and the average live weight of females and males was calculated and for each group. Moreover, their total average live weight was calculated, too. The results are presented in Table 4.
The best live weight indicators were obtained in both experimental group 4 and in control group 1. The highest average live weight 0f 264.8 g was noted in experimental group 4. The average live weight of females was higher by 1.1 and 3.0%, and for males it was more by 3.3 and 4.7% than those in control groups 1 and 2, respectively (Table 4). Comparing the average live weight of females and males in experimental group 4 to those in experimental groups 5 and 6, it was found that the live weight of females in experimental group 4 exceeded those in experimental groups 5 and 6 by 7.2 and 10.9%, and those for the males did by 11.1 and 8.9%, respectively (Table 4). Moreover, the live weight of females in experimental group 4 was statistically significantly higher compared to the live weight of females in both control group 2 (at p ≤0.05) and experimental group 6 (at p≤0.01). It is also worth noting that the live weight of the males in experimental group 4 was significantly higher compared to that in control group 2 (at p <0.05) and to both experimental groups 5 and 6 (at p <0.01). In general, the total average live weight of the quails in experimental group 4 was higher by 1.5 and 9.1% than those in control groups 1 and 2 and was by 7.7 and 10.6% (at p< 0.05) than those in experimental groups 5 and 6. In experimental group 3 the average live weight of females and males exceeded those in experimental groups 5 and 6 by 4.1 and 5.1% and 7.7 and 3.0%, respectively (Table 4).
Table 5 shows the main zootechnical features of the adult quails from 42 to 60 days of life. Throughout the whole experiment from 42 to 60 days of life the percent alive in all the studied groups reached 100%. The highest average daily gain of the poultry during the whole growing period was observed in experimental group 4. The data on feed expenses per a single average live weight showed that it was the lowest in experimental groups 3 and 4. The feed conversion ratio in experimental group 3 was lower by 2.6 and 8.2% than those in control groups 1 and 2 and by 7.4 and 8.5% compared to those in experimental groups 5 and 6, respectively. Feed expenses in experimental group 4 were lower by 3.5 and 9.0% compared to those in control groups 1 and 2 and they were 8.2 and 9.3% lower than those in experimental groups 5 and 6, respectively. The FCR indicators in groups 3 and 4 were lower than the control ones by 2.6% and 9.98%, respectively (Table 5). However, the similar indicators in groups 5 and 6 using the commercial phytase were either comparable to the control ones or even slightly higher them.
3.2.2. The Influence of the Phytases on Quail Egg Laying on the 60-th day of life
The intensity of egg production is the key feature characterizing the productive poultry. It is determined by the ratio of the laid eggs number for a certain time to the number of laying hens during the same time, expressed as a percentage. According to the calculation results the highest intensity of egg production of 86.8% was detected in experimental group 4. Thus, the intensity in experimental group 4 was 9.7 and 13.2% higher than that in control groups 1 and 2, and it was 11.8 and 9.0% more than that in experimental groups 5 and 6, respectively (Table 5).
3.2.3. The Influence of the Phytases on quail Meat quality on the 60-th day of life
Figure 6 shows the results of cutting of the quail eviscerated carcasses (on average for males and females). The highest average weight of the eviscerated carcass of 165.9 g was obtained in experimental group of 4, due to the highest average live weight of the 60-day old quails in this group. The weight of the eviscerated carcass in experimental group 4 was 1.7 and 11.5% more than that in control groups 1 and 2, respectively. The advantage of the experimental group 4 compared to control group 2 was statistically highly significant, at p≤0.001 (Figure 6).
Concerning experimental groups 5 and 6 experimental group 4 also had an advantage of 10.5 and 13.6% (at p≤ 0.001), respectively (Figure 6). In experimental group 3 the average weight of the eviscerated carcass, was 6.2% higher than that in control group 2, and it was 5.3 and 8.2% higher than that in experimental groups 5 and 6, respectively. The best slaughter yield based on the live weight and fatness of carcasses were also obtained in experimental group 4. Thus, the slaughter yield in experimental group 4 was higher by 0.2 and 1.4% compared to that in control groups 1 and 2, and by 1.5 and 1.8% compared to that in experimental groups 5 and 6. For experimental group 3 it exceeded that in control group 2 by 0.5%, and experimental groups 5 and 6 by 0.6 and 0.9%, respectively (Figure 6).
Table 6 demonstrates the data on the output of the main parts and muscles in the carcasses (breast and ham) in the adult quails. Experimental group 4 presented the highest breast yield of 65.9 g. Thus, the breast yield in the experimental group 4 was higher by 0.6 and 2.0 %, compared to that in control groups 1 and 2 and it was higher by 3.1 and 4.0% compared to that in experimental groups 5 and 6, respectively. A similar trend was observed in the yield of quail legs (thigh + drumstick) in experimental group 4. It was higher by 0.6 and 1.1% compared to that in control groups 1 and 2, and it was also higher by 2.1 and 2.9% compared to that in experimental groups 5 and 6, respectively (Table 6).
The yield of breast in experimental group 3 was higher by 1.5 and 2.4% compared to that in experimental groups 5 and 6, and the yield of quail legs was higher by 0.9 and 1.7%, respectively. The breast and leg yield in experimental group 3 was second only to that in control group 1 and experimental group 4. The output of pectoral muscles in experimental group 4 was almost at the same level as that in control group 1 and it was 1.5%, 3.1, and 3.7% higher compared to those in control group 2 and experimental groups 5 and 6, respectively (Table 6). The muscle output in the legs in experimental group 4, control groups 1 and 2, as well as in experimental group 3 differed insignificantly. The output of the pectoral muscles and muscles in the legs in experimental group 3 had a slight advantage of 0.7 and 1.1% and 1.1 and 1.5% compared to those in experimental groups 5 and 6, respectively (Table 6).
3.2.4. The Influence of the Phytases on the quail internal organs weight on the 60-th day of life
Upon anatomical cutting of each group the internal organs of the quails (liver, muscular stomach, and heart), as well as the amount of internal fat in the carcasses were weighed and visually examined. The results on the average weight of the internal organs and fat are presented in Figure 7. There was no significant difference in the weight of the internal organs among the groups studied. Also, there was no evident difference in the amount of internal fat among the experimental and control groups. The weight and condition of the internal organs of the quails in all the groups were within the physiological standard. It indicates that the application of new phytase preparations in the diets of the quails had no negative effect on the growth and development of the internal organs in the poultry throughout the experiment.
3.2.5. The Impact of the Phytases on Residual Phosphorus and Macro- and Microelements in the Broilers’Faeces
The balance experiments were performed using the 14-day old and 28-day old quails (Table 7 and Table 8). Ten quails were selected from each group and taken in separate cages. Within 3 days, three litter samples were taken from each group. These litter samples were analyzed for macro- and microelements composition. The assay of the composition of the experimental feed diets and quail excreta for phosphorus amount showed that the level of residual phosphorus in groups 3 and 4 (feed supplemented with microencapsulated phytase at a dose of 500 FYT per a kg of feed) decreased by the 28th day of the experiment gompared to that in control group 1 by 10% and 7%, respectively, while in group 5 using the commercial phytase Ladozim proxy from A. ficuum (PhyA) in an excess dose of 4500 FYT per a kg of feed, the phosphorus level increased by 9.5% (Table 7 and Table 8). On the 42-th day of the experiment, the phosphorus level in the quail excreta of group 4 decreased by 0.8%, while in group 5 it increased by 7.7%.
The application of the encapsulated phytase almost halved the residual phosphorus in the excreta compared to that in both control groups, which could be a key argument in favor of a high efficiency of the encapsulated phytase in the intestinal tract of quails, in contrast to the free enzyme. Along with the phosphorus release the encapsulated enzyme at a high dose (500 FYT/kg of feed) significantly reduced the residual level of valuable macro- and microelements, namely Mg, K, Ca, Zn, and Cu (Table 7).
4. Discussion
Animals get phosphorus from plant feeds mainly as hardly soluble phytates. In monogastric animals, including poultry, the only source of phytases for releasing phosphate groups from phytates are plant phytases coming from feed and their own intestinal microflora. Phytases are enzymes of the phosphatase class that catalyze the cleavage of phytic acid to inorganic phosphate [32]. They are reported to strengthen bones and facilitate the the efficiency of animal nutrition [33-35]. Phytase dietary supplements improve intestinal health by reducing the secretion of the gastrointestinal tract, which leads to the increased productivity and energy used [36]. However, because of various reasons (low activity of phytases in feedstocks, a decrease in their activity during heat treatment and feed storage, the difference in the pH optimum of the enzyme and the acidity of the gastrointestinal tract), the assimilation of phytates in the tract exceeds no more than 10%, and the remaining need for phosphorus should be substituted by mineral additives [37]. Most of the phytates from animal feed are not digested and excreted into the external environment with faeces. Phytic acid binds cations so its high level in the diet, for example in the grain-based feeds could cause a deficiency of some elements, namely calcium, iron, zinc, etc. and reduce their assimilation. [38]. The main trend in solving the problem is to decrease the introduction of mineral additives and to apply the phytases for providing the animals in phosphorus from phytates [39-41].
Currently, phytases from Escherichia coli of the PhyC class, formerly manufactured under the brand name of Quantum and Quantum Blue by Vista AG are the main type of feed phytases used in the poultry farming. They have replaced the PhyA class phytases from deuteromycete fungi (Natuphos (BASF), Ronozyme HiPhos (DSM NP), Phyzyme XP (Danisco Animal Nutrition), which before dominated in the market of the poultry enzymes. The instability of microbial enzymes at an acidic pH (~1) in the poultry stomach is an evident disadvantage of phytase technologies. Moreover, the optimum pH of the phytase of classes PhyA (~2.2 and ~5.2) and PhyC (~5.5) does not coincide with the pH of the poultry gastrointestinal tract where phytate hydrolysis undergoes: duodenal department (6.4-6.6), the small intestine department (6.5-7.0) and the colon (6.5-7,5) [42]. It proves that the residual phosphorus in the excreta, even upon using the phytases is from 40 to 60% of their original level in the feed. The application of either phytases with a pH optimum within 6.0-7.5 or the encapsulation of phytases in the microcontainers which are stable in the stomach of the poultry, but can dissolve in the duodenum should significantly increase the efficiency of phytases.
Before in our studies, using the phytase from O. proteus (the Enterobacteriaceae family), a technology for microencapsulation of phytase inside the cells of the Y. lipolytica extremophilic yeast was proposed. The encapsulation had success if the secretory systems were blocked upon designing the producer. There was some drop in the target enzyme yield per a unit of the medium, on average, from 15,000-40,000 FYT/l in a secretory producer based on the same yeast species to 1,000-1,500 FYT/l. However, it significantly improved the technological features of the producer since it needn’t concentration and drying of the enzyme preparation that reduces the energy costs by 10-50 times and makes the technology completely waste-free [26]. An essential increase in the phytase stability in the stomach of the animal was the maim result. In the experiments using mice we observed significantly higher weight gain at a dose of encapsulated enzyme 100 FYT per a kg of feed than upon using the commercial water-soluble phytase from A. ficuum at a dose of 3,000 FYT per a kg of feed [43].
Upon performing the present study on assay of the effect of microencapsulated phytase applied as a feed supplement on the weight gain of the quails, it proved that the highest average live weight of 218.1 g, of the 42-day old quails was obtained in experimental group 4, using a diet with the microencapsulated O. proteus phytases based on Y. lipolytica yeast at a dose of 500 FYT per a kg of feed and the total phosphorus of 0.8% (0.45% of available phosphorus). The average live weight of the quails in experimental group 4 was 0.2 and 1.2% higher than that in control groups 1 and 2 (without phytase) respectively, and was higher by 3.3 and 5.5% compared to that in experimental groups 5 and 6, using the diet with the commercial water-soluble phytase from A. ficuum, respectively (Table 1). The highest average daily gain in live weight of the young quails up to 42 days of life was noted in experimental group 4 where it amounted to 5.0 g (Table 1). Moreover, FCR in groups 3 and 4 decreased compared to that in control groups 1 and 2 by 1% and 2.01%, respectively (Table 2). However, FCR increased by more than 2% for groups 5 and 6 using the feed with the commercial phytase. It should also be noted that in group 4 using microencapsulated O. proteus phytase, the highest slaughter yield, pectoral muscle, thigh, and leg weight were observed in the poultry both at the age of 42 days (Figure 4) and 60 days (Figure 6). The data indicate that the encapsulated phytase showed higher efficiency on the productivity of the quails than extracellular phytase from A. ficuum, belonging to the class of water-soluble phytases of the PhyA and PhyC. In the paper by [44] the authors studied the efficacy of the phytase-containing supplement of Agrofit in the feeds for the meat quails. They found that feeding phytase in the amount of 75 g/t of the feed (~330 FYT per a kg of feed) increased the average daily gain in live weight of the quails by 4.8%, increased the percent alive by 1.5% and improved the feed conversion by 12.2%. The enzyme preparation of Agrofit ("Agroferment", Russia) contains the enzyme phytase with an activity of at least 5000 units/g (the producer of Penicillium canescens PhPl-33 BKM F-3867D) and according to its features it can belong to class A phytases. A comparative analysis of the productivity of the experimental groups used by the authors and the results obtained in our experiments showed that under the similar feeding conditions (0.4-0.45% of available phosphorus, 500 FYT a kg of feed), we got the similar productivity of 1.2% versus 1.3% stated in the paper and the comparable feed costs (3.73-3.71 kg per 1 kg of live weight gain). However, it should be noted that unlike the composition of the feed used by the authors (fish flour, 7.98%, and meat and bone flour, 5.26%), the feed in our experiments contained no animal products and the phytase preparation we applied caused 100% percent alive of the quail population unlike those in the paper (97.5%). Thus, we have practically confirmed that the encapsulated phytase from O. proteus applied to the quail feed, is highly effective even compared to the commercial preparations.
It should be noted that there are some studies in the world references [35, 45] where various aspects of the phytase effect on the morphological and biochemical features of the quails, the properties of their eggs and meat were assayed. However, there are no comparative data on the effect of water-soluble phytases on the productivity of the quails, which makes it difficult to compare the data obtained in our experiments to the results of other authors. In the study by [46] it was shown that the introduction of 500-2500 FYT per a kg feed (Ronozyme P, Roche Corporate Headquarters, Basel, Switzerland), along with xylanase, released the transportation stress in Japanese quails (Coturnix Coturnix japonica). In the paper by [47] the positive role of phytase (Natuphos E 10000, BASF, Brazil) in the concentration of 300 FTU/kg of feed in daily weight gain of the quails fed without animal components, phosphorus deficient by 65%, was proved. The authors concluded that phytase itself suppresses the negative effects of moderate phosphorus restriction in the cultivation of Japanese quails, but doesn’t cope with it upon strict phosphorus restriction. In another study, Japanese quails were fed with the diets containing 500 and 1000 FTU ru-1 phytases, and the best results were obtained in FCR [48]. Moreover, in the paper by [45], using the quails, there were no positive effects of the phytase (Natuphos 500) at a dose of 1000 phytase units (FTU) per a kg of the feed on the poultry productivity. Ravindran et al. [49] supposed that such difference between the effects obtained using the diets with a high phytase concentration may be due to some factors, including the source of phytase, ingredients, dietary features in each study using the poultry.
The assay of the composition of the experimental feed diets and the excreta of the quails for phosphorus amount showed that on the 28th day of the experiment the level of residual phosphorus in groups 3 and 4 (feed with the microencapsulated O. proteus phytase at a dose of 500 FYT a kg of feed) decreased compared to that in control group 1 by 10% and 7%, respectively. While in group 5 using the commercial phytase Ladozim proxy from A. ficuum (PhyA) at an abundant dose of 4500 FYT a kg of feed, the phosphorus level even increased by 9.5% (Table 7). By the forty second day of the experiment the phosphorus level in the excreta of group 4 decreased by 0.8%, while in group 5 that increased by 7.7%. The similar data were obtained by us before in the experiments on broiler chickens [28]. The application of the encapsulated phytase almost halved the residual phosphorus in the excreta compared to those in both control groups, which could be a key argument in favor of the high efficiency of the encapsulated phytase in the intestinal tract of broilers unlike the free enzyme. Along with the phosphorus release the encapsulated enzyme at a high dose (500 FYT a kg of feed) significantly reduced the residual content of valuable macro- and microelements, namely Mg, K, Ca, Zn, and Cu [28]. Taken together, these data indicate a high degree of assimilation of phytate-containing products in the presence of encapsulated phytase by the quails and broiler chickens compared as to the control as to the commercial phytase preparation of the PhyA class.
At the second stage of the experiment, we first assayed the quail egg production and demonstrated that the highest one was obtained in experimental group 4, where it reached 86.8% (Table 5) exceeding those in 1,2,5, and 6 by 9.7, 13.2%, 11.8, and 9.0%, respectively (Table 5). The positive effects of the phytase on egg production and egg properties are well known for laying hens. So, Lim et al. [50] showed that the application of the microbial phytase at a dose of 300 FTU a kg of feed can improve the egg production, reduce the percent of broken and soft eggs, and phosphorus excretion. Furthermore, the effects of phytase supplement depended much on the level of Ca and non-phytate phosphorus. The interaction between the level of the phytase and non-phytate phosphorus showed that phytase increased the egg production in the chickens with a diet containing 0.25% phosphorus, but not in the chickens using a diet with 0.15% non-phytate phosphorus and 4.0% Ca. Casartelli et al [51] assayed the effect of phytase (0 and 100 FTU/kg) in diets including various sources of phosphorus and calcium (Ca and sodium phosphate, microgranulated di-Ca phosphate and triple superphosphate). They showed that the application of the phytase significantly affected the egg production traits.
Reports of the effects of the phytase on the egg production are very few. There is some information of an important influence of the ratio of Ca and P concentrations in the feed on the egg production of Japanese egg quails [52]. We tried to perform the experiment according to the factorial scheme. The experiment was an entirely randomized design, where 2.68% Ca and 0.38% P were considered as the optimal concentrations. It can be assumed that the high degree of digestibility of Ca and P, which are provided upon applying the encapsulated phytase O. proteus (Table 7), could favorably affect not only the weight gain of the poultry and the feed conversion, but also the egg production.
5. Conclusions
Taken together the data obtained in our experiments indicate a high degree of assimilation of phytate-containing products in the presence of encapsulated phytase by the quails compared both to the control and commercial preparation of phytase of the PhyA class. It can be concluded that it is a highly expedient and promising supplement based on microencapsulated phytase of class D for feeding, which has the best kinetic characteristics compared to phytases of PhyA and PhyC classes when working in the gastrointestinal tract of the poultry.
Supplementary Materials
Table S1: The composition of the basal diet for the one-day old to 4-weeks old quails, % (period 1); Table S2: The composition of the basal diet for the 5 - 6-weeks old quails, % (2 period); Table S3: The composition of the basal diet for the 6-weeks to 8-weeks old quails, % (period 3).
Author Contributions
E.A.O. performed the animal experiments and performed the experiment on the birds; N.N.G. developed the encapsulated phytase specimen, performed the preparations of the transformant cultures; O.I.K. performed the statistical data analysis; N.V.B. cultured the yeast in the fermenter; Y.I.D., E.PI. and V.S.L. performed data analysis and participated in writing of the manuscript; Y.I.D. designed the experiments and wrote the final draft of the paper with E.P.I.; and, E.P.I. conceived the project and participated in all the aspects of the study and writing of the final manuscript.
Funding
The study was supported by the Russian Science Foundation (Grant No 22-16-00093 dated from 12 May 2022).
Institutional Review Board Statement
Not applicable
Informed Consent Statement
Not applicable
Acknowledgments
We thank The Core Shared Research Facility “Industrial Biotechnologies” of The Federal Research Centre “Fundamentals of Biotechnology” of the Russian Academy of Sciences for assistance in obtaining enzyme preparations for dietary supplements
Conflicts of Interest
The authors declare no conflict of interest
References
- Lisunova, L.I. Perepelovodstvo - it's profitable. Our agriculture. 2021, 252, 4, 79–81. [Google Scholar]
- El Sabry, M.I.; Hassan, S.S.A.; Zaki, M.M.; Stino, F.K.R. Stocking density: a clue for improving social behavior, welfare, health indices along with productivity performances of quail (Coturnix coturnix)-a review. Trop Anim Health Prod. 2022, 54, 83. [Google Scholar] [CrossRef] [PubMed]
- Stefanova, I.L.; Gushchin, V.V.; Yukhina, M.A. Meat of quails in the nutrition of young children. Poultry and poultry products. 2006, 3, 57–59. [Google Scholar]
- Ivanov, S. Quail farming as an alternative to broilers. Poultry industry. 2015, 3, 27, 74–76. [Google Scholar]
- Kundeková, B.; Máčajová, M.; Meta, M.; Čavarga, I.; Bilčík, B. Chorioallantoic Membrane Models of Various Avian Species: Differences and Applications. Biology (Basel). 2021, 10, 301. [Google Scholar] [CrossRef]
- Osmanyan, A.K.; Slashcheva, Yu. V.; Komarchev, A.S. Planting density when growing quail depending on the age at slaughter. Poultry and poultry products. 2022, 2, 28–32. [Google Scholar]
- Osmanyan, A.K.; Slashcheva, Yu. V.; Komarchev, A.S. Efficiency of quail meat production under various light conditions. Poultry farming. 2022, 6, 37–41. [Google Scholar]
- Reuter, Ya.S.; Degtyareva, T.N.; Degtyareva, O.N. Selection features and acquisition of a breeding herd of quails. Bulletin of Agrarian Science. 2022, 1, 94, 60–64. [Google Scholar] [CrossRef]
- Akupiyan, O.S.; Sheveleva, N.A. Breeding quails as a promising direction in agricultural business. Problems and solutions of modern agrarian economy. XXI International Scientific and Industrial Conference. 2017, 170–171. [Google Scholar]
- Maga, J.A. Phytate: Its chemistry, occurrence, food interactions, nutritional significance and methods of analysis. J. Agric. Food Chem 1982, 30, 1–9. [Google Scholar] [CrossRef]
- Raboy, V. Myo-Inositol-1,2,3,4,5,6-hexakisphosphate. Phytochemistry. 2003, 64, 6, 1033–1043. [Google Scholar] [CrossRef] [PubMed]
- Azeke, M.A.; Egielewa, S.J.; Eigbogbo, M.U.; Ihimire, I.G. Effect of germination on the phytase activity, phytate and total phosphorus contents of rice (Oryza sativa), maize (Zea mays), millet (Panicum miliaceum), sorghum (Sorghum bicolor) and wheat (Triticum aestivum) J. Food Sci. Technol. 2011, 48, 6, 724–729. [Google Scholar] [CrossRef] [PubMed]
- Lenkova, T.N.; Egorov, I.A.; Egorova, T.A.; Manukyan, V.A.; Vertiprakhov, V.G.; Gromina, A.A.; Nikonov, I.N. How to increase the digestibility of phosphorus from compound feeds for broiler chickens. Poultry and poultry products 2019, 30–32. [Google Scholar] [CrossRef]
- Egorov, I.A.; Vertiprakhov, V.G.; Lenkova, T.N.; Manukyan, V.A.; Egorova, T.A.; Grozina, A.A. The effects of diets supplemented with phytase on the productive performance, biochemical and morphological blood indices in broilers and layers of broiler preparental lines. Bioscience research. 2020, 17, 4, 2465–2471. [Google Scholar]
- Sysoeva, I.G.; Egorova, T.A.; Lenkova, T.N. A new concentrated phytase preparation in compound feeds for broiler chickens with a reduced phosphorus level. Poultry farming. 2020, 4, 35–38. [Google Scholar] [CrossRef]
- Sysoeva, I.G.; Egorova, T.A.; Lenkova, T.N. A new phytase in compound feeds for laying hens. Poultry farming 2020, 5-6, 46–50. [Google Scholar]
- Kashirskaya, M.; Voronin, S.; Gumenyuk, A.; Davydova, D.; Egorov, I.; Andrianova, E.; Sineoksky, S. Phytase and organic forms of trace elements in compound feeds for broiler chickens. Compound feed. 2020, 12, 54–59. [Google Scholar] [CrossRef]
- Anchikov, E.V. The use of phytase in compound feeds for pigs and poultry (review of foreign literature. Agricultural Biology 2008, 4, 3–4. [Google Scholar]
- Lenkova, T.N.; Egorova, T.A.; Sysoeva, I.G. Domestic phytase. Poultry farming 2015, 1, 2–9. [Google Scholar]
- Lenkova, T.N. Intestinal microbiota and productive qualities broilers using phytase to increase the digestibility of phosphorus and nutrients from compound feeds. Agricultural Biology. 2020, 55, 2, 406–416. [Google Scholar] [CrossRef]
- Bhavsar, K.; Khire, J.M. Current research and future perspectives of phytase bioprocessing. RSC Advances. 2014, 4, 26677–26691. [Google Scholar] [CrossRef]
- Gessler, N. N.; Serdyuk, E. G.; Isakova, E. P.; Deryabina, Y.I. Phytases and the Prospects for Their Application. Applied Biochemistry and Microbiology. 2018, 54, 4, 352–360. [Google Scholar] [CrossRef]
- Filippovich, S.Y.; Isakova, E.P.; Gessler, N.N.; Deryabina, Y.I. Advances in immobilization of phytases and their application. Bioresour Technol. 2023, 379, 129030. [Google Scholar] [CrossRef] [PubMed]
- Miller, K.K.; Alper, H.S. arrowia lipolytica: more than an oleaginous workhorse. Appl Microbiol Biotechnol 2019, 103, 23-24, 9251–9262. [Google Scholar] [CrossRef]
- Lu, R.; Cao, L.; Wang, K.; Ledesma-Amaro, R.; Ji, XJ. Engineering Yarrowia lipolytica to produce advanced biofuels: Current status and perspectives. Bioresour Technol. 2021, 341, 125877. [Google Scholar] [CrossRef]
- Park, Y.K.; Ledesma-Amaro,, R. What makes Yarrowia lipolytica well suited for industry? Trends Biotechnol. 2023, 41, 2, 242–254. [Google Scholar] [CrossRef]
- Serdyuk, E.G.; Isakova, E.P.; Gessler, N.N.; Trubnikova, E.V.; Antipov, A.N.; Deryabina, Y.I. Prikl Biochemistry and Microbiology. 2019; 55, 5, 498–505. [CrossRef]
- Isakova, E.P.; Gessler, N.N.; Deryabina, Yu.I. Comparative Assay of Phytase Activity in Yarrowia lipolytica Strains Transformed with the Neutrophilic Phytase Genome from Obesumbacterium proteus in Batch Cultivation. Applied Biochemistry and Microbiology. 2022, 58, 1, S126–S131. [Google Scholar] [CrossRef]
- Danilova, M.A.; Epova, E.Y.; Trubnikova, E.V.; Badrutdinov, N.V.; Kokoreva, A.S.; Pusev, M.S.; Deryabina, Y.I.; Isakova, E.P. Encapsulated Phytase Produced by Recombinant Yarrowia lipolytica Exhibits High Efficiency on Broiler Chickens in Low Dosage. Appl. Sci. 2022, 12, 11999. [Google Scholar] [CrossRef]
- Tabinda, A.B.; Butt, A. Replacement of Fish Meal with Poultry By–Product Meal (Chicken Intestine) as a Protein Source in Grass Carp Fry Diet. Pak. J. Zool. 2012, 44, 1373–1381. [Google Scholar]
- Ziarat, M.M.; Kermanshahi, H.; Mogaddam, H.N.; Heravi, R.M. Performance of an Escherichia coli phytase expressed in Lactococcus lactis on nutrient retention, bone traits and intestinal morphology in broiler chickens. J. Anim. Physiol. Anim. Nutr. 2020, 104, 909–917. [Google Scholar] [CrossRef] [PubMed]
- Norton, J.D.; Yang, S.P.; Diffley, P. Influence of source and quantity of protein on the development of immunity and resistance to African trypanosomiasis. Infect. Immun. 1986, 51, 455–460. [Google Scholar] [CrossRef] [PubMed]
- Abd El-Hack, M.; Alagawany, M.; Arif, M.; Emam, M.; Saeed, V.; Arain, M.A.; Siyal, F.A.; Patra, A.; Elnesr, S.S.; Ullah Khan, R. The uses of microbial phytase as a feed additive in poultry nutrition-a review. Annals of Animal Science 2018, 18, 639–658. [Google Scholar] [CrossRef]
- Rath, N.C.; Huff, GR.; Huff, W.E.; Balog, J.M. Factors regulating bone maturity and strength in poultry. Poultry Science. 2000, 79, 1024–1032. [Google Scholar] [CrossRef]
- Kim, T.W.; Lei. X.G. An improved method for a rapid determination of phytase activity in animal feed. Journal of Animal Science. 2005, 83, 1062–1067. [Google Scholar] [CrossRef]
- Alam, S.; Masood, S.; Zaneb, H.; Rabbani, I.; Khan., R.U.; Shah, M.; Ashraf, S.; Alhidary, I.A. Effect of Bacillus cereus and Phytase on the Expression of Musculoskeletal Strength and Gut Health in Japanese Quail (Coturnix japonica). J Poult Sci 2020, 25, 57, 3, 200–204. [Google Scholar] [CrossRef]
- Oduguwa, O.; Pirgozliev, V.; Acamovic, T. Energy metabolizability and digestibility of amino acids by broilers fed malted sorghum sprouts supplemented with polyethylene glycol, charcoal phytase and xylanase. British Poultry Science 2007, 48, 55–63. [Google Scholar] [CrossRef]
- Mitchell, D.B.; Vogel, K.; Weimann, B.J.; Pasamontes, L.; van Loon, A.P.G.M. The phytase subfamily of histidine acid phosphatases: isolation of genes for two novel phytases from the fungi Aspergillus terreus and Myceliophthora thermophila. Microbiol. 1997, 143, 1, 245–52. [Google Scholar] [CrossRef]
- Troesch, B.; Jing, H.; Laillou, A.; Fowler, A. Absorption Studies Show that Phytase from Aspergillus niger Significantly Increases Iron and Zinc Bioavailability from Phytate-Rich Foods. Food Nutr. Bull. 2013, 34, 2, 90–101. [Google Scholar] [CrossRef]
- Prasad, C.; Mandal, A.; Gowda, N.; Sharma, K.; Pattanaik, A.; Tyagi, P. Enhancing phosphorus utilization for better animal production and environment sustainability. Curr. Sci. 2015, 108, 7, 1315–1319. [Google Scholar]
- Kumar, A.; Chanderman, A.; Makolomakwe, M.; Perumal, K.; Singh, S. Microbial production of phytases for combating environmental phosphate pollution and other diverse applications. Critical Rev. Environ. Sci. Technol 2016, 46, 6, 556–591. [Google Scholar] [CrossRef]
- Balaban, N.P.; Suleimanova, A.D.; Valeeva, L.R.; Chastukhina, I.B.; Rudakova, N.L.; Sharipova, M.R. Microbial Phytases and Phytate: Exploring Opportunities for Sustainable Phosphorus Management in Agriculture. Amer. J. Mol. Biol. 2017, 7, 1, 11–29. [Google Scholar] [CrossRef]
- Ptak, A.; Bedford, M.R.; Świątkiewicz, S.; Żyła, K.; Józefiak, D. Phytase modulates ileal microbiota and enhances growth performance of the broiler chickens. PLoS One 2015, 10, 3, e0119770. [Google Scholar] [CrossRef]
- Danilova, M.A.; Epova, E.Y.; Trubnikova, E.V.; Shevelev, A.B. A Feed Additive Containing Encapsulated 6-Phytase within Recombinant Yarrowia lipolytica Cells Produced by Cultivation on Fat-Containing Waste. Appl. Sci. 2022, 12, 3094. [Google Scholar] [CrossRef]
- Mikityuk, A.; Epifanov, V.; Simonov, G.; Zoteev, V.; Kerzhner, A.; Moseev, P. An enzyme supplement in the diet of quails. Compound feed 2019, 7-8, 49–51. [Google Scholar] [CrossRef]
- Rezaeipour, V.; Barsalani, A.; Abdullahpour, R. Effects of phytase supplementation on growth performance, jejunum morphology, liver health, and serum metabolites of Japanese quails fed sesame (Sesamum indicum) meal-based diets containing graded levels of protein. Trop Anim Health Prod. 2016, 48, 1141–1146. [Google Scholar] [CrossRef]
- Mehraei Hamzekolaei, M.H.; Zamani Moghaddam, A.K.; Tohidifar, S.S.; Dehghani Samani, A.; Heydari, A. The effects of transportation stress on Japanese quail (Coturnix Coturnix japonica) fed corn-based diet in comparison with wheat-based diet supplemented with xylanase and phytase. J Anim Physiol Anim Nutr (Berl). 2016, 100, 4, 618–22. [Google Scholar] [CrossRef]
- Vieira, B.S.; Caramori Junior JG, Correa GSS, Colvara IG, Brusamarelo E, Pereira TVS, Barbosa SAPV, Oliveira CFS. Combination of phytase and citric acid, but not phytase alone, ensures regular rates of growth and bone mineralization in quails under severe phosphorus restriction. J Anim Physiol Anim Nutr. 2019, 103, 555–563. [CrossRef]
- Saima, M.; Shad, A.; Pasha, T.N.; Akram, M.; Ditta, Y.A.; Khan, M.Z.U. Effect of microbial phytase supplementation on growth performance of Japanese quails. The Journal of Animal and Plant Science. 2014, 24, 19–23. [Google Scholar]
- Ravindran, V.; Bryden, W.L.; Kornegay, E.T. Phytate: occurrences, bioavailability and implications in poultry nutrition. Avian and Poultry Biology Reviews. 1995, 6, 125–143. [Google Scholar]
- Lim, H.S.; Namkung, H.; Paik, I.K. Effects of phytase supplementation on the performance, egg quality, and phosphorous excretion of laying hens fed different levels of dietary calcium and nonphytate phosphorous. Poult Sci. 2003, 82, 1, 92–99. [Google Scholar] [CrossRef]
- Casartelli, E.M.; Junqueira, O.M.; Laurentiz, A.C.; Filardi, R.S.; Lucas Júnior, J.; Araujo, L.F. Effect of phytase in laying hen diets with different phosphorus sources. Brazilian Journal of Poultry Science. 2005, 7, 2, 93–98. [Google Scholar] [CrossRef]
- Stanquevis, C.E.; Furlan, A.C.; Marcato, S.M.; Oliveira-Bruxel, T.M.; Perine, T.P.; Finco, E.M.; Grecco, E.T.; Benites, M.I.; Zancanela, V.T. Calcium and available phosphorus requirements of Japanese quails in early egg-laying stage. Poult Sci. 2021, 100, 1, 147–158. [Google Scholar] [CrossRef] [PubMed]
Figure 1.
Scheme of phytate cleavage in the phytase reaction.
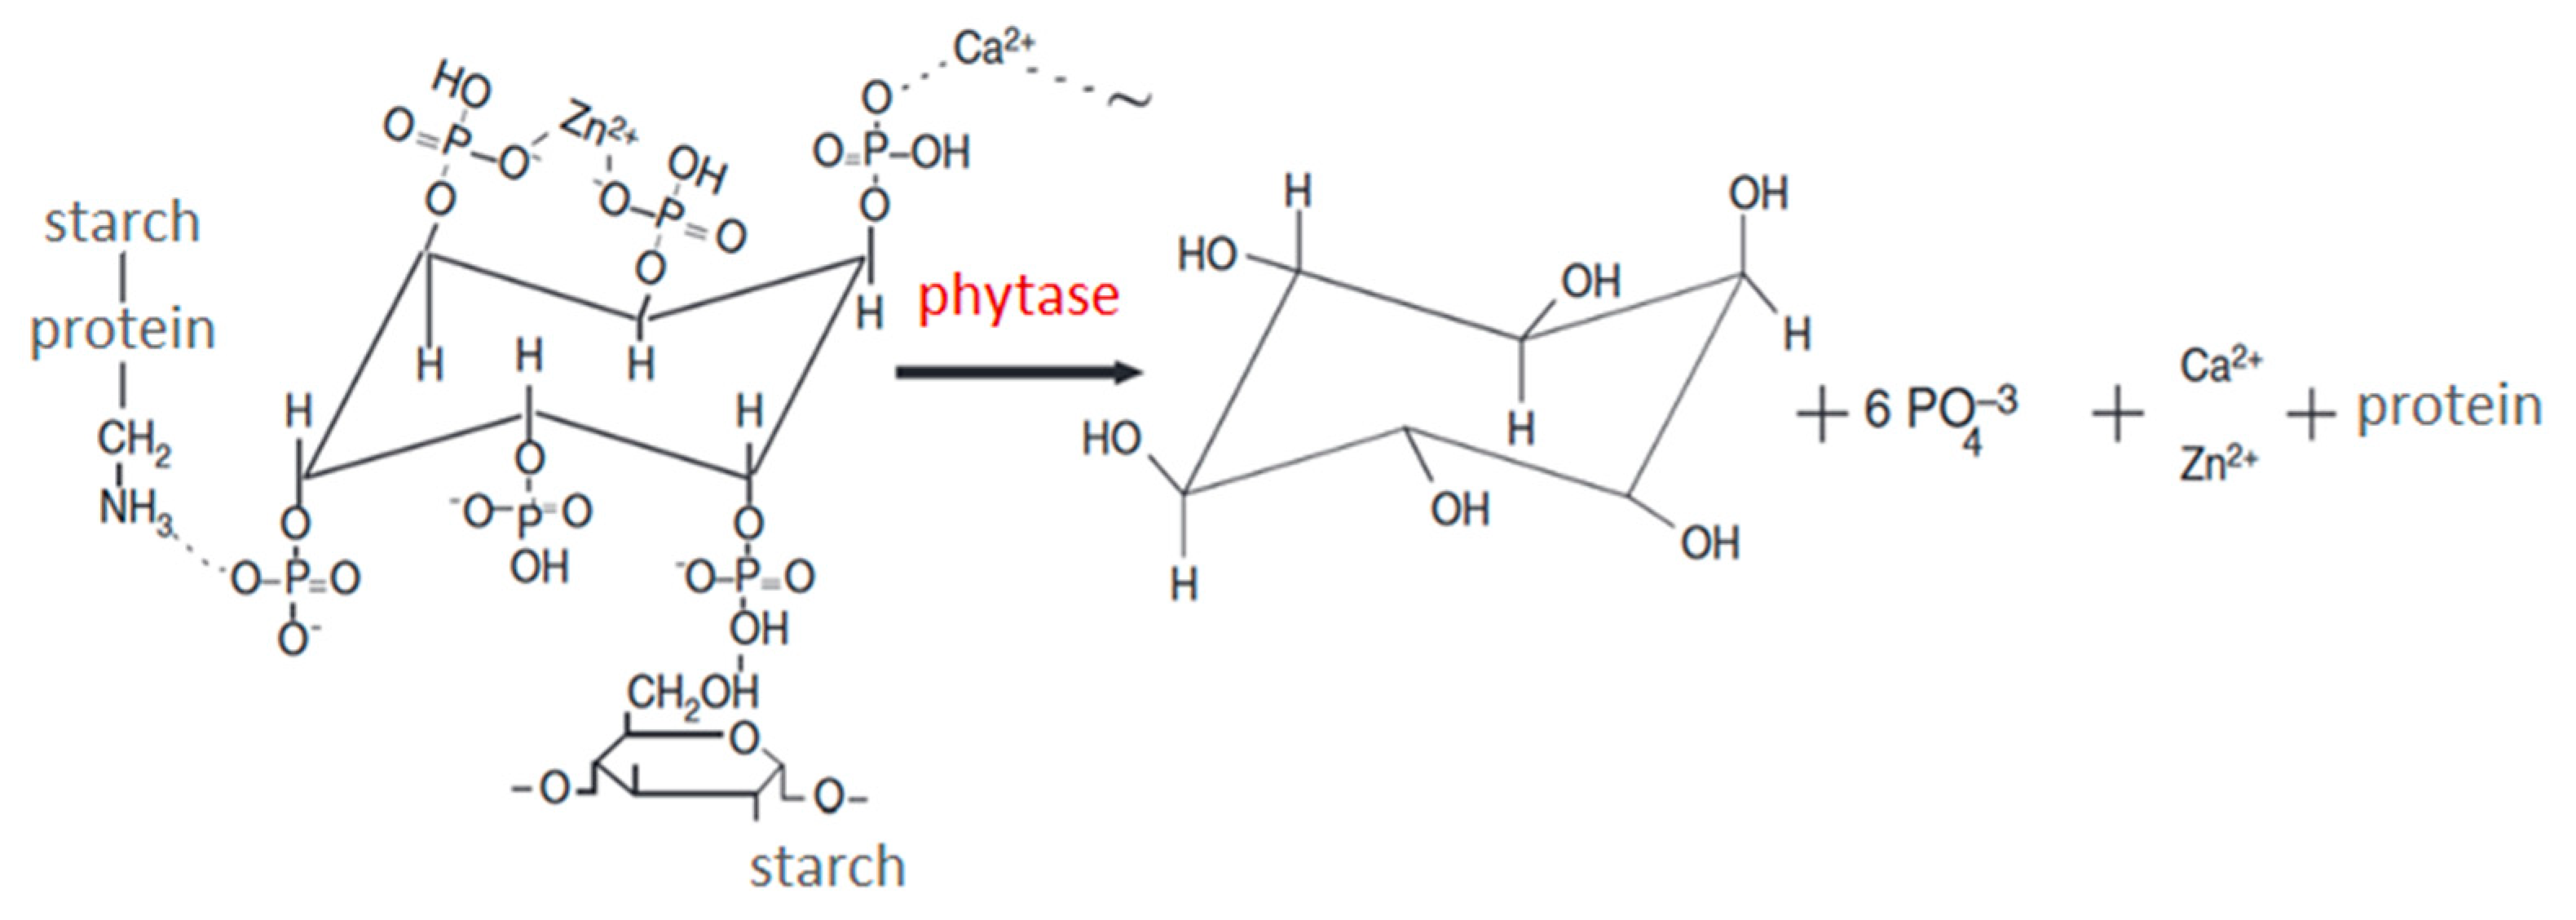
Figure 2.
The quails of the Manchurian golden breed. A – chicks; B – the adult birds.
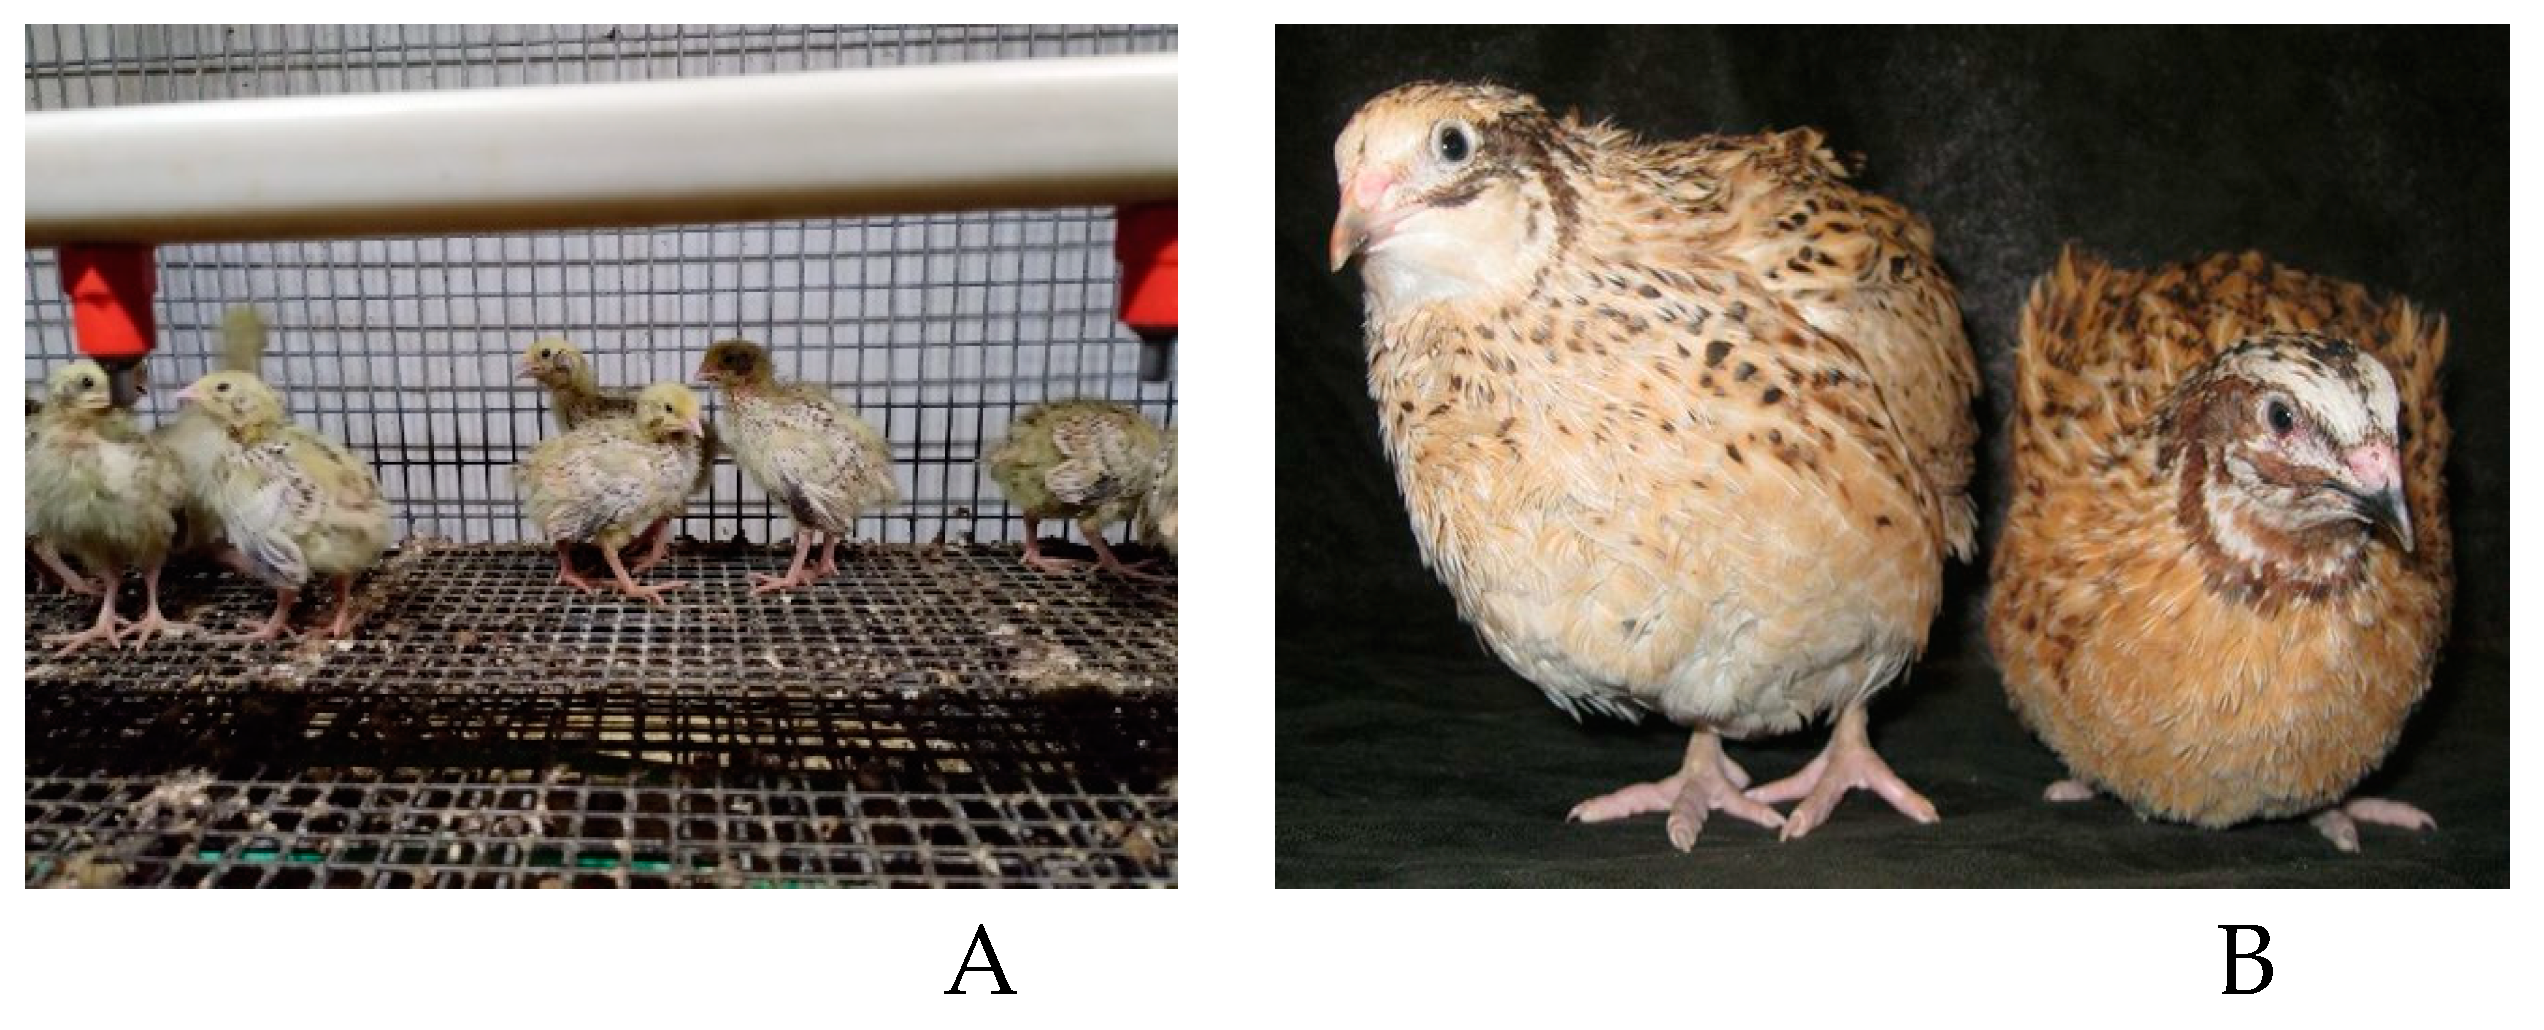
Figure 3.
Scheme of the experiment for testing bioadditives on experimental animals (1) Production of the yeast biomass using the fermentation of the waste as the substrate (temperature - 28°C; at a rotation of 350 rpm; pH 5.5, at pH of 5.5 and 8 0). (2) Drying the product using a spray dryer (Mini Spray Dryer B-290, BÜCHI) at 70°C. (3) Grinding and granulation of the biomass; (4) the preparation of feed mixtures based on the recombinant Y. lipolytica PO1f (pUV3-Op) tranformant. (5) The analysis of the efficacy of the encapsulated phytase in the Y. lipolytica PO1f (pUV3-Op) transformant for increasing the phosphorus bioavailability and reducing anti-nutritional phytate activity of plant feed using the model of quails compared to the commercial phytase efficacy.
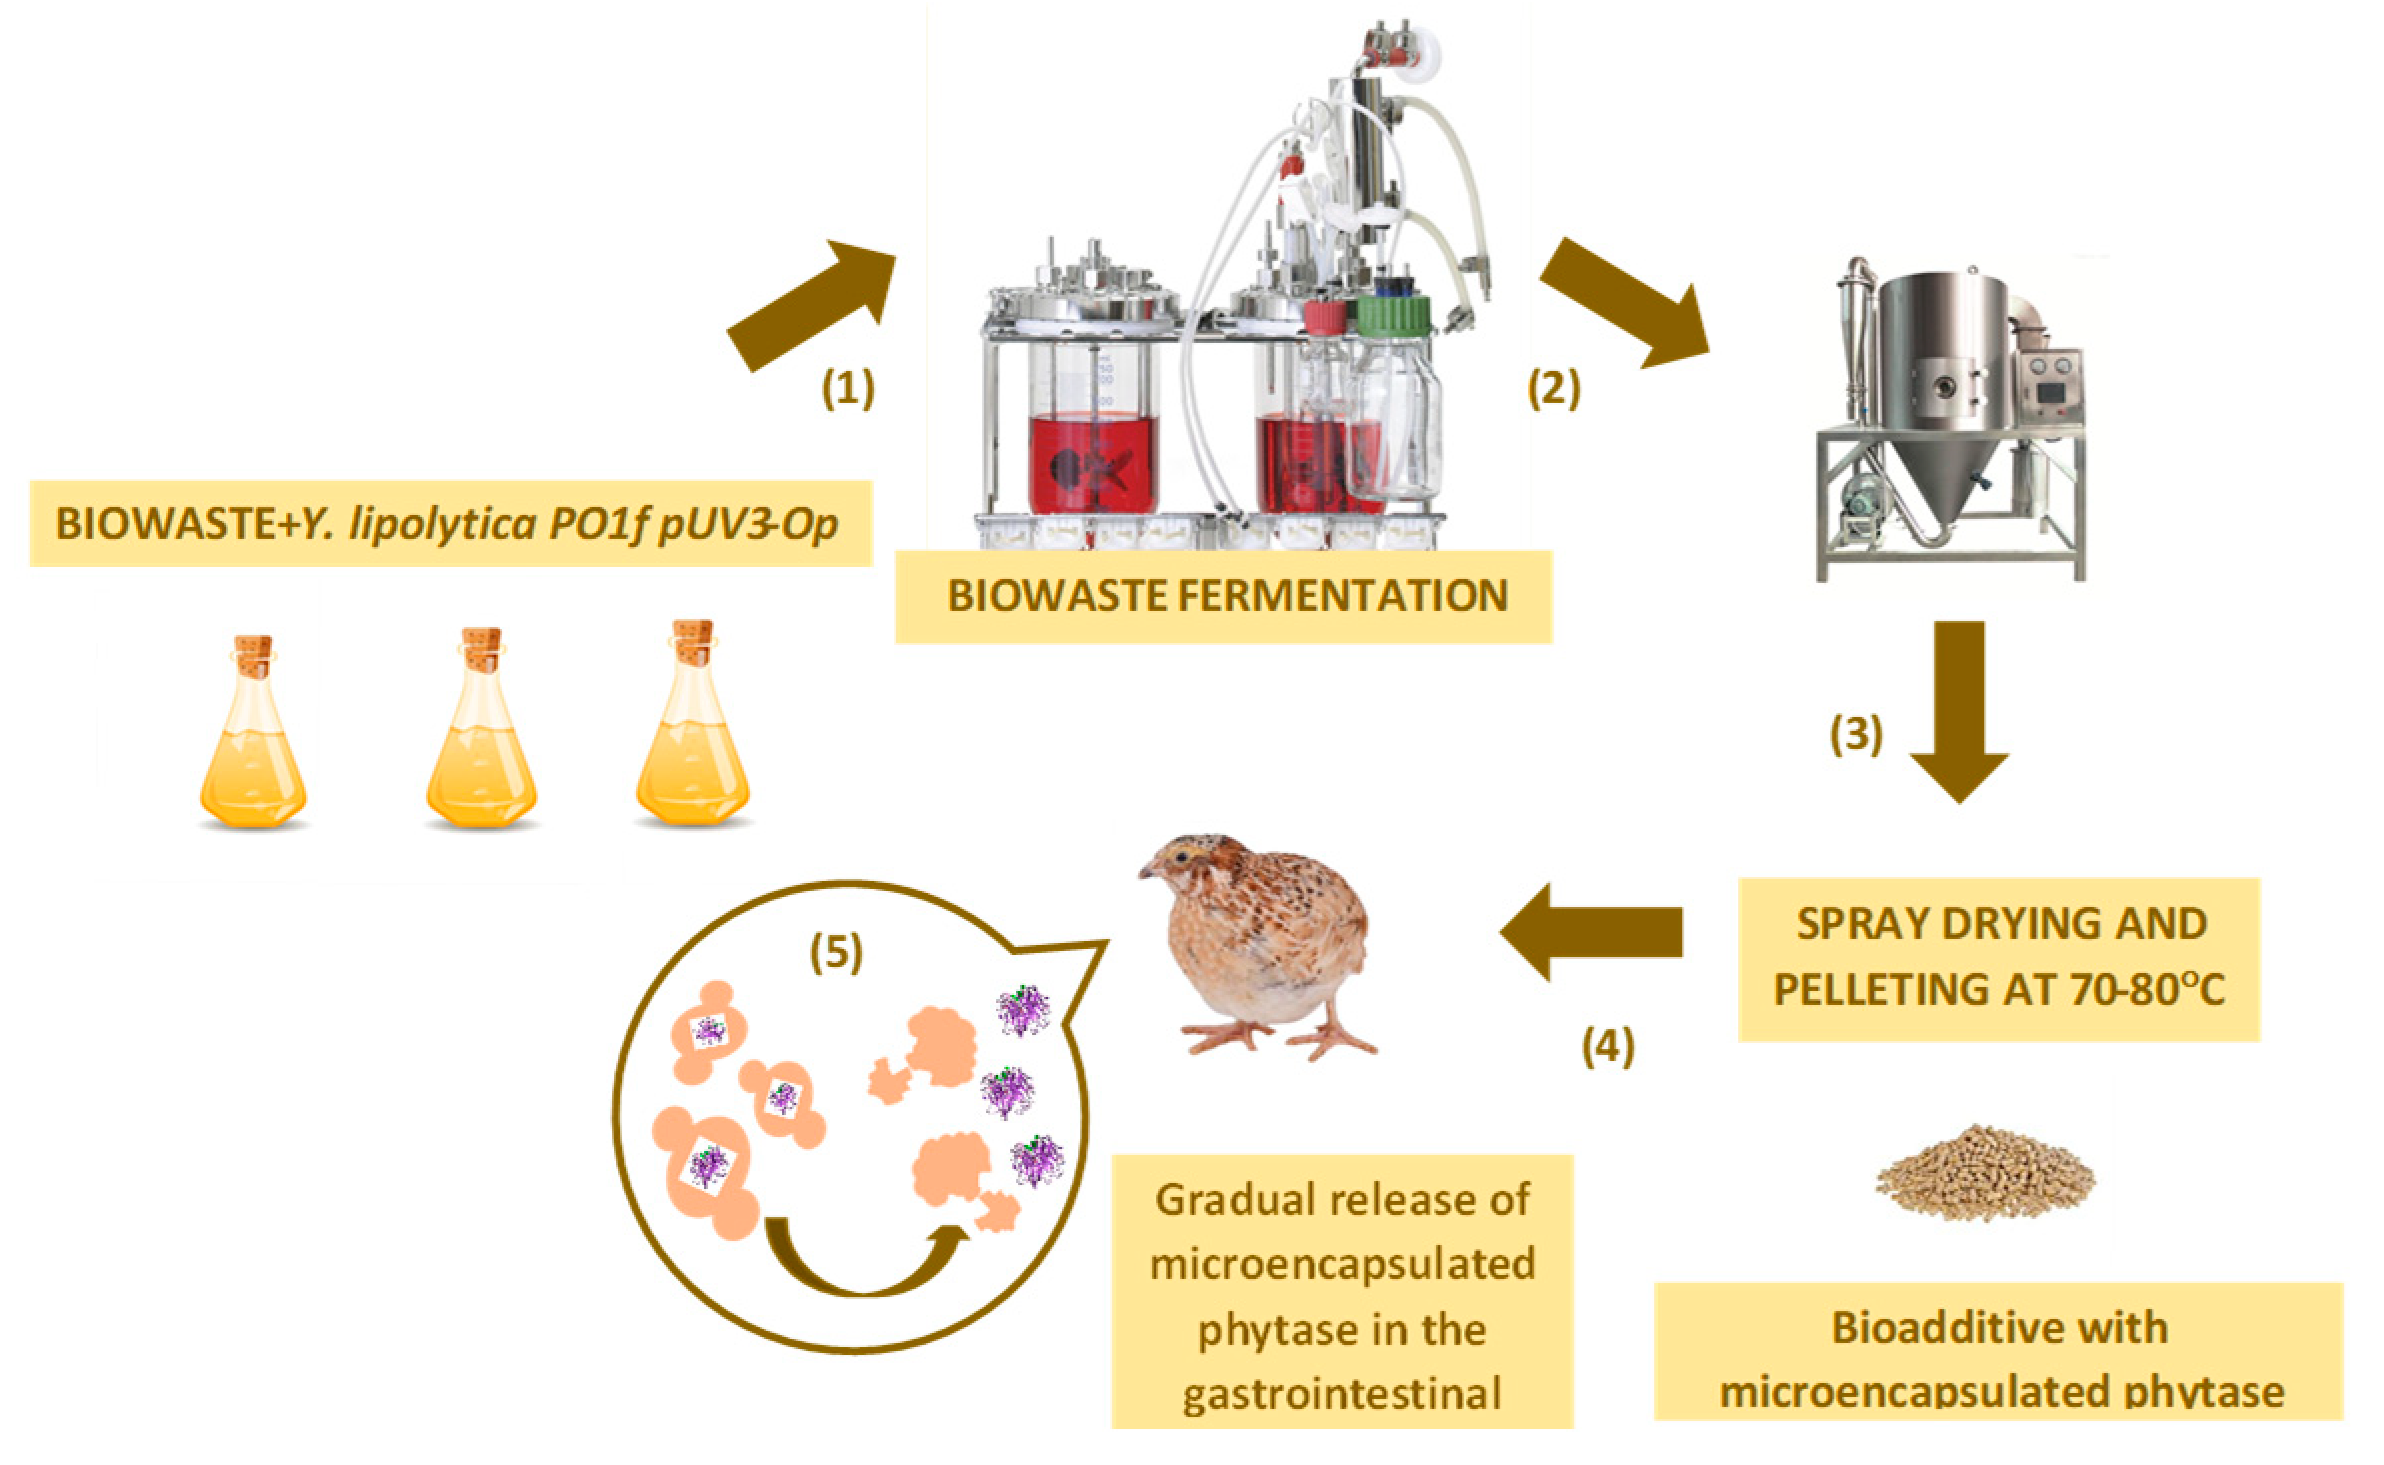
Figure 4.
Meat qualities (A) and Slaughter yield (B) of 42-day old quails. *- the difference in the mass of the gutted carcass of the experimental group 4 is reliable in relation to the experimental group 5 at p≤0.05; **- the difference in the mass of the gutted carcass of the experimental group 4 is reliable in relation to the experimental group 6 at p≤0.001.
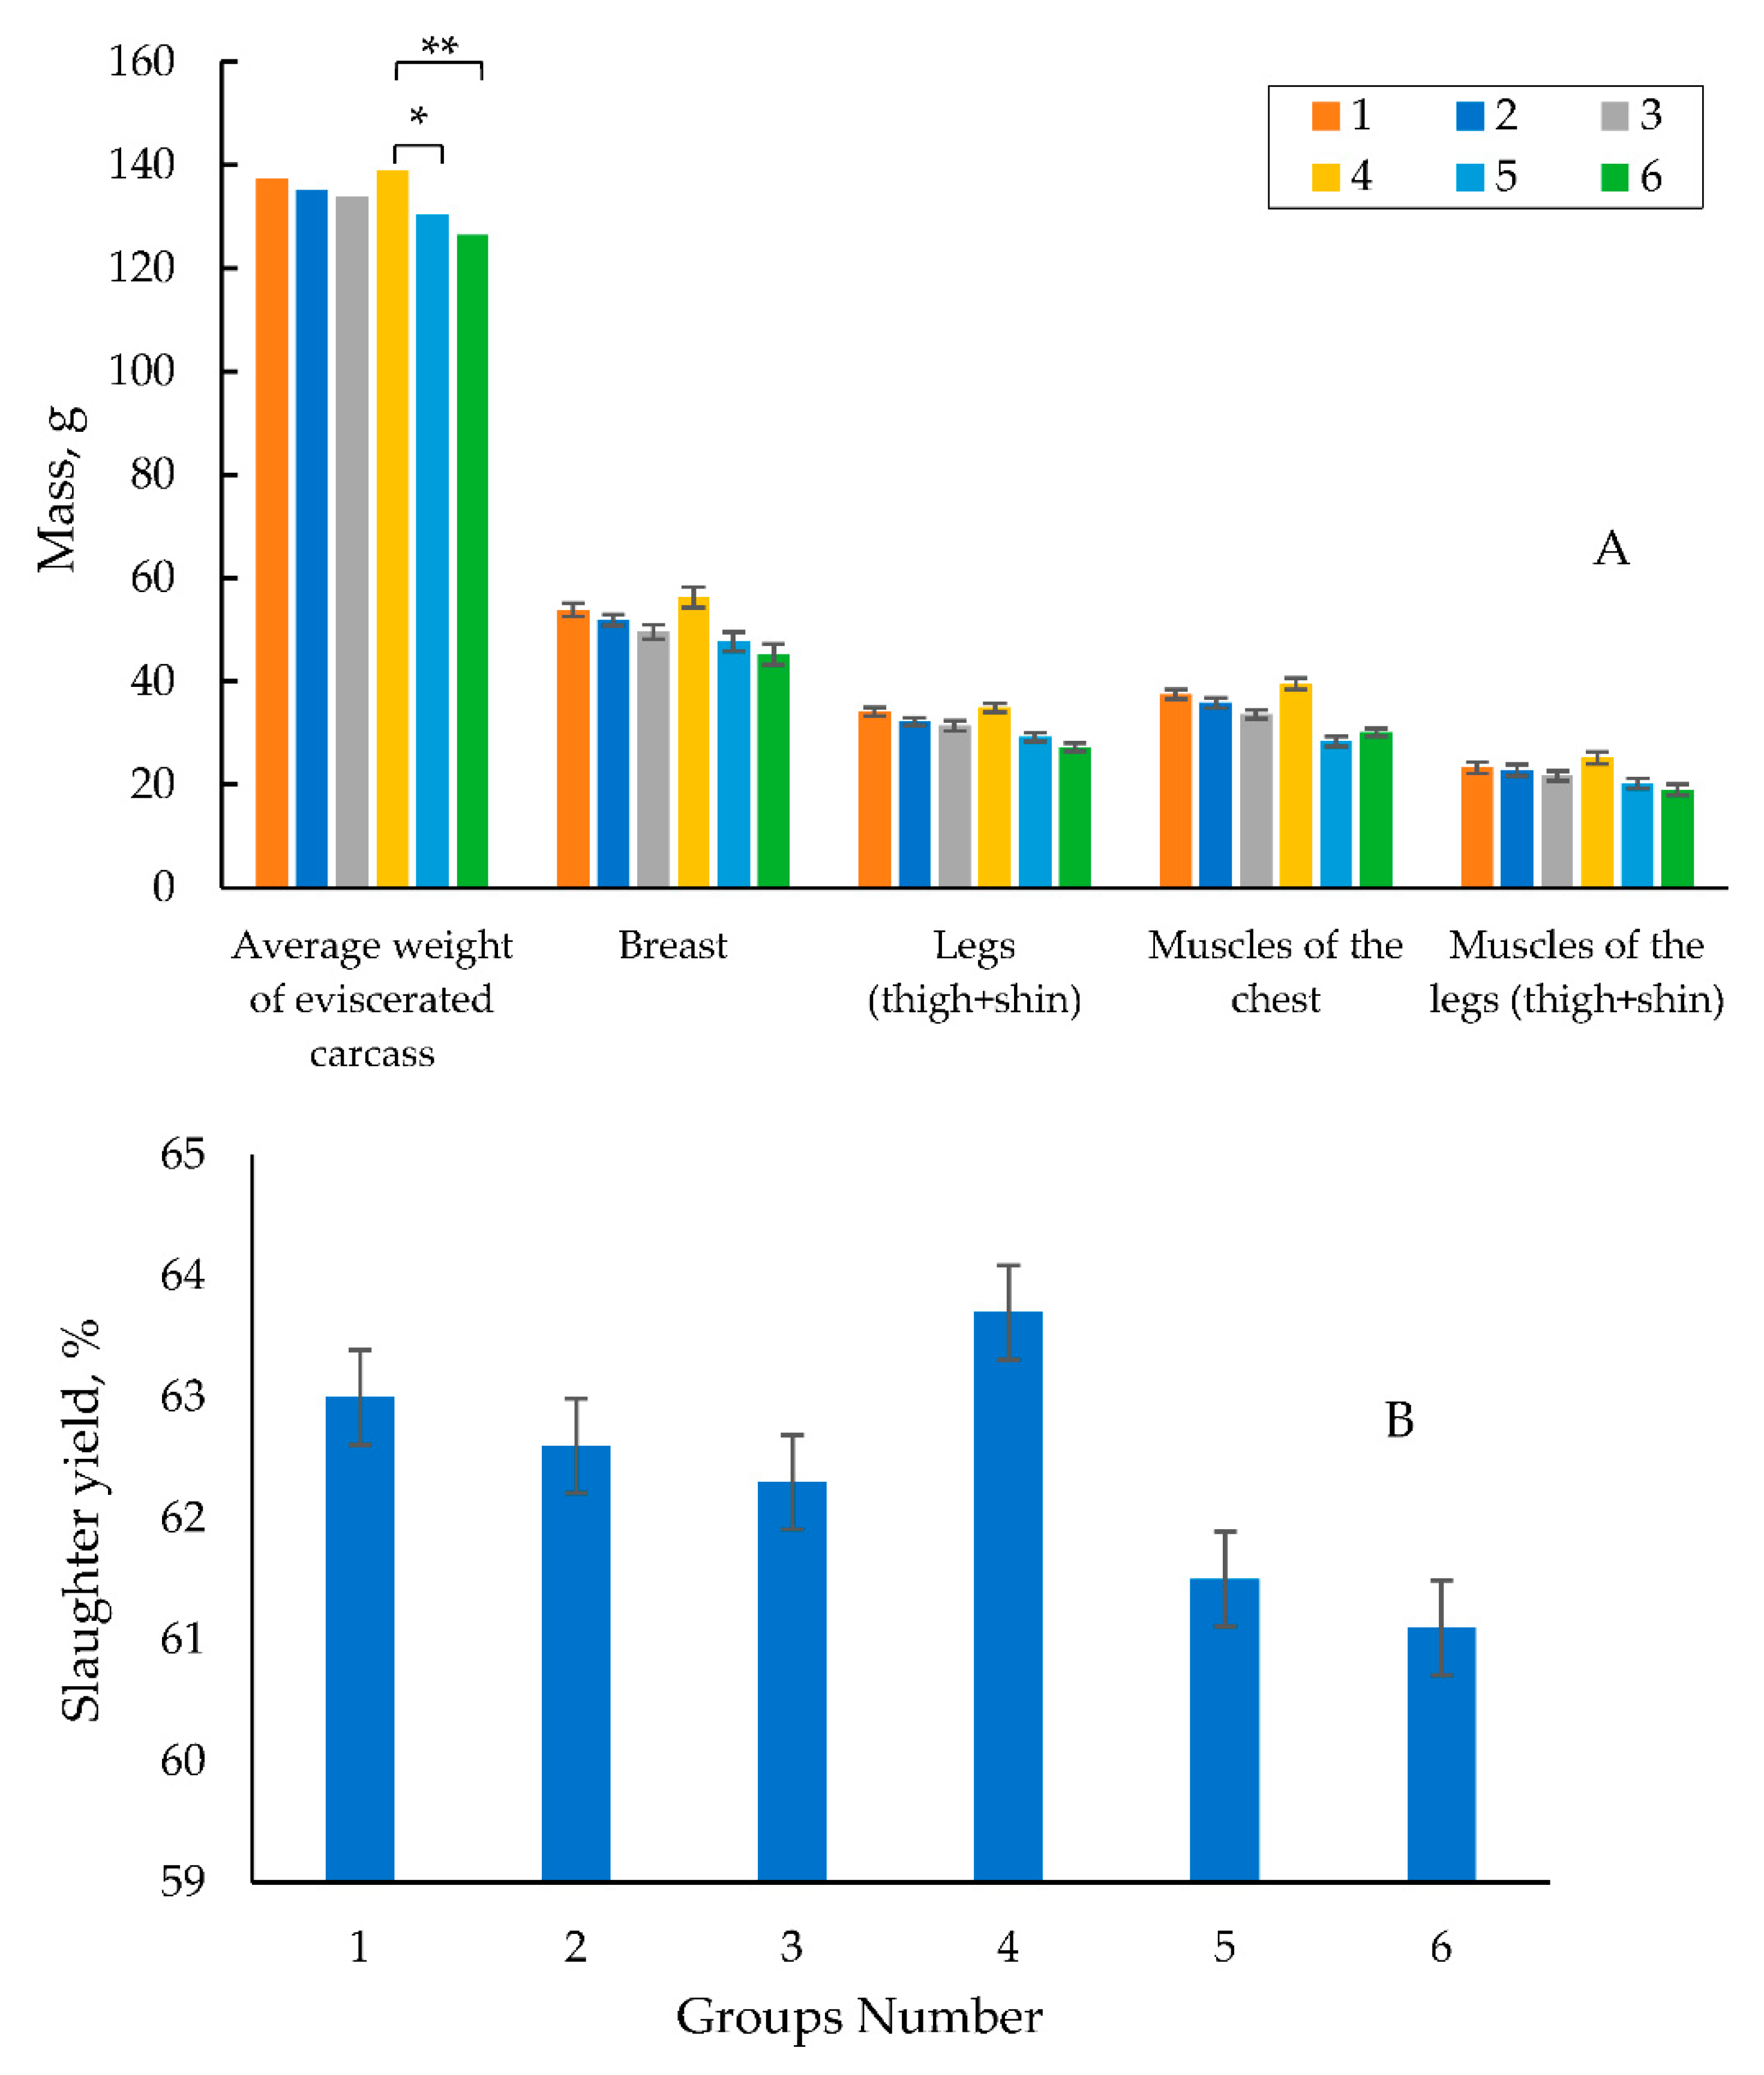
Figure 5.
The mass of internal organs of quails at 42 days.
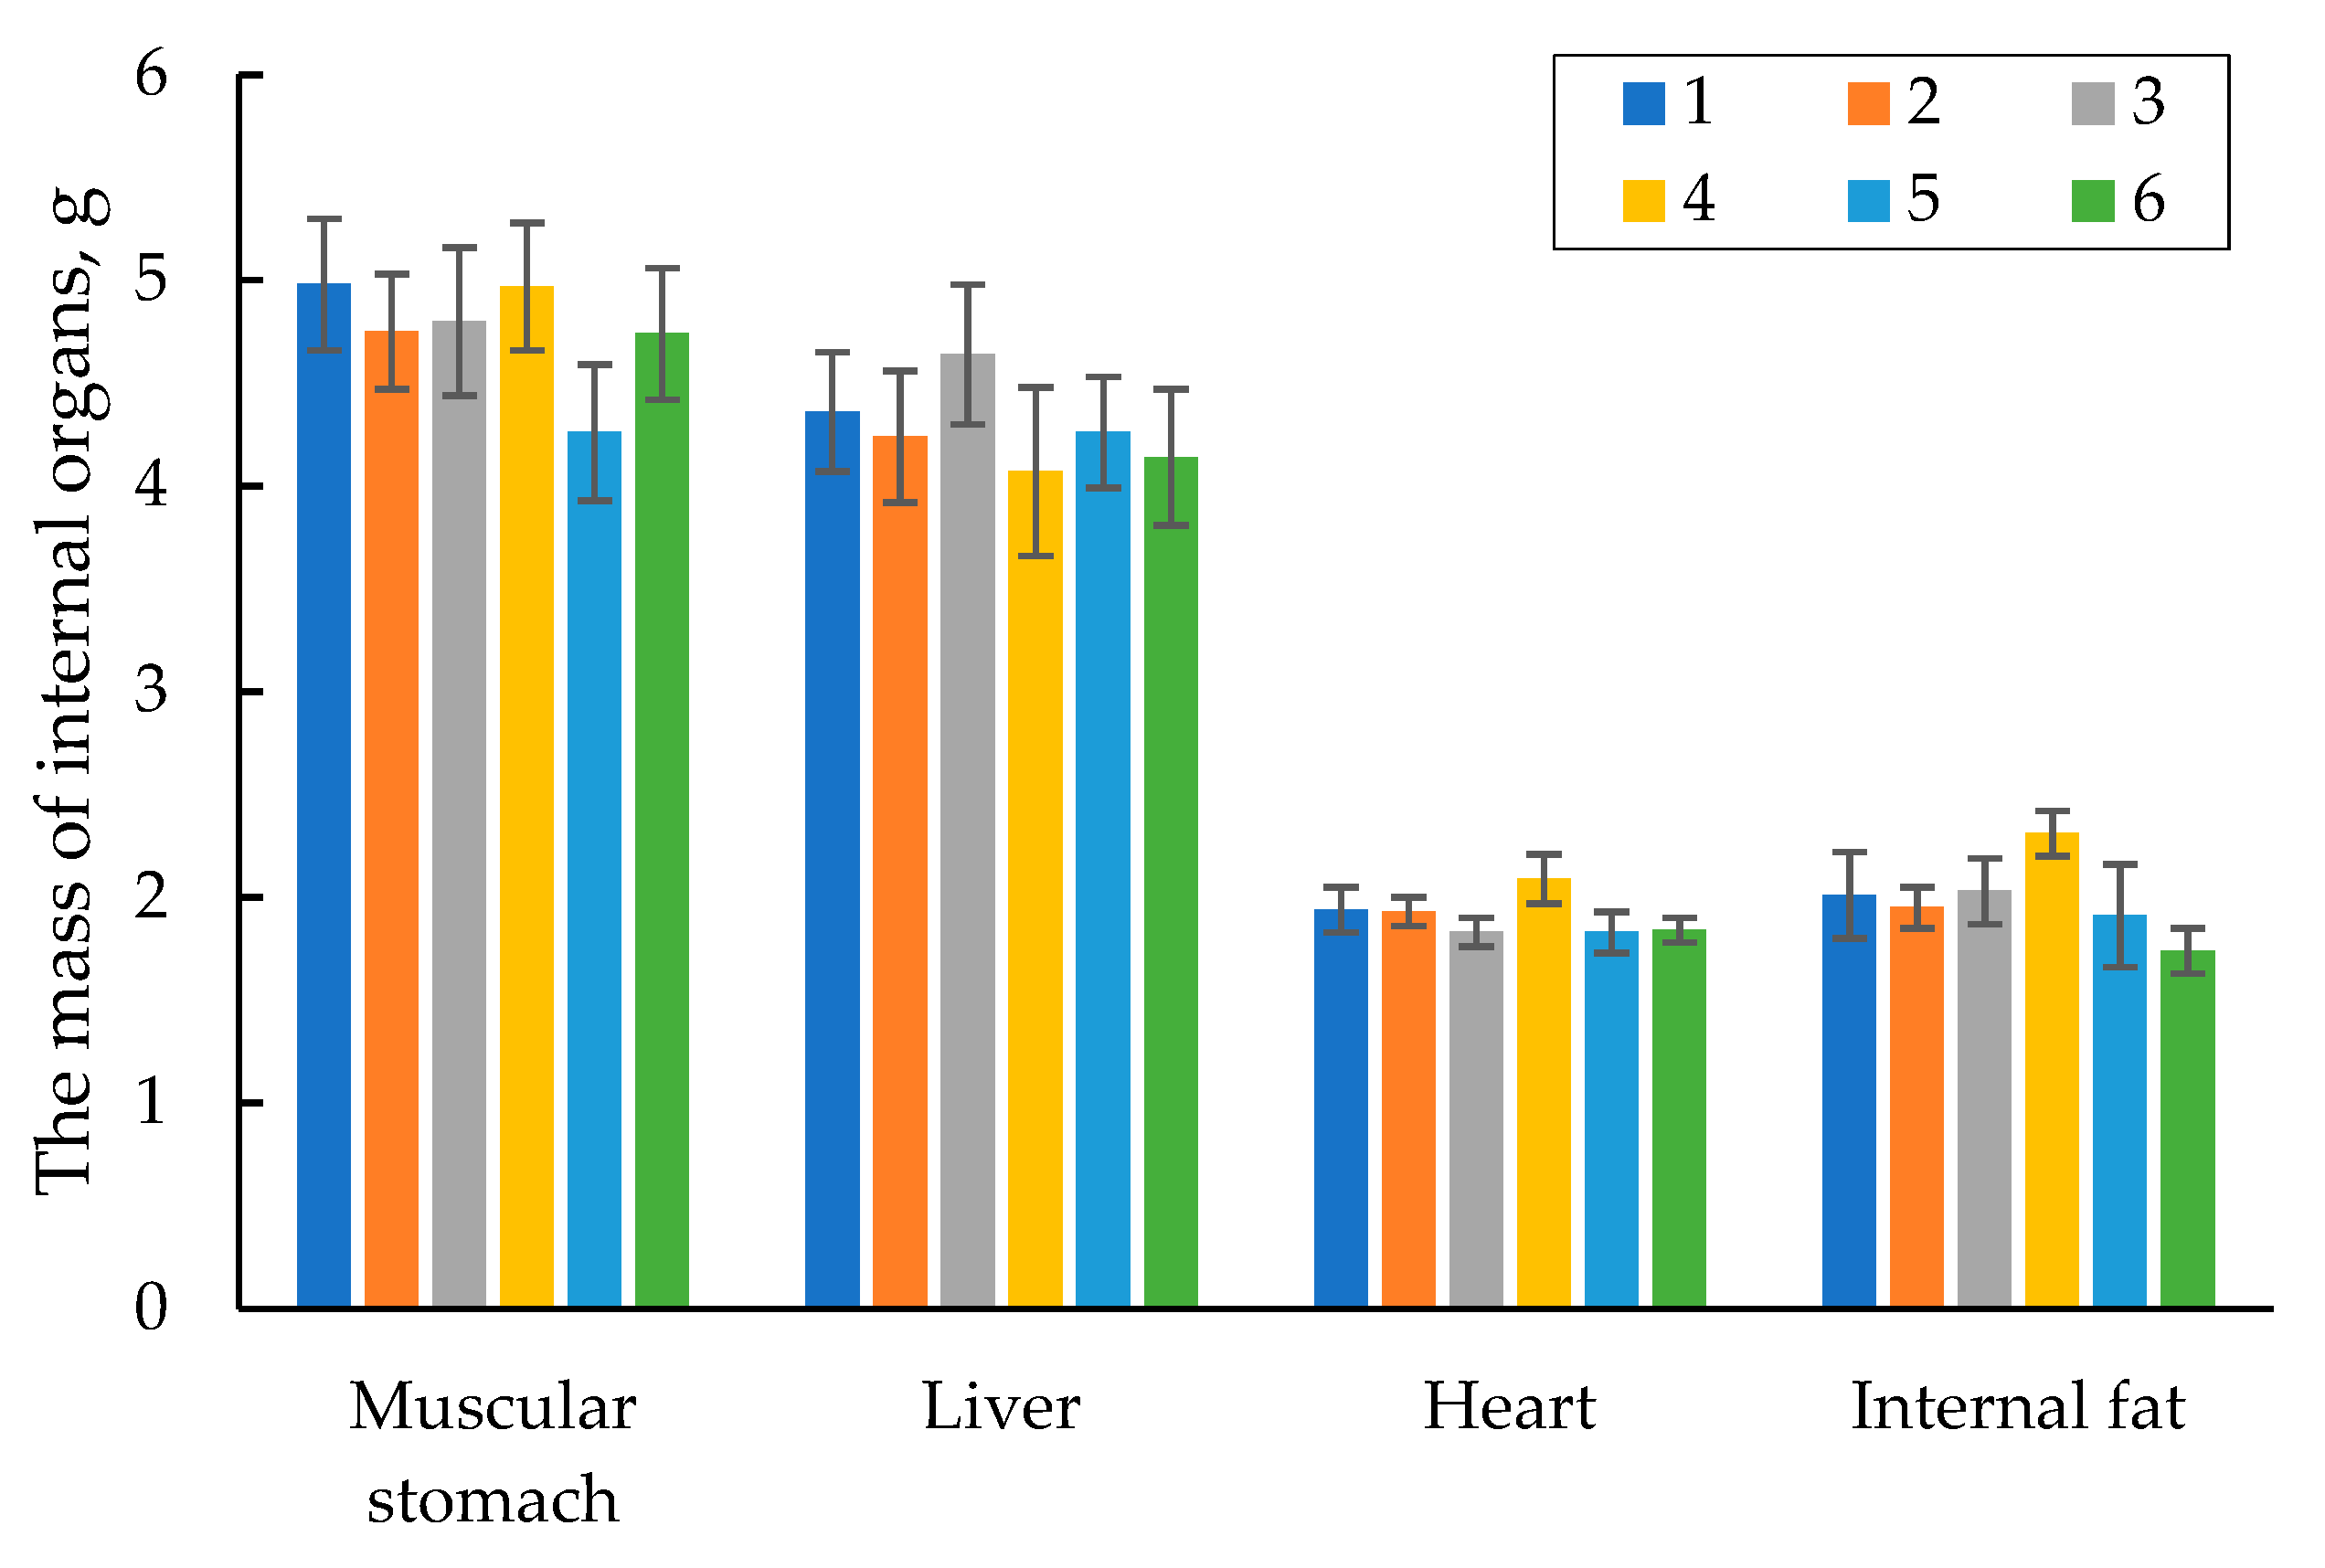
Figure 6.
Meat qualities (A) and Slaughter yield (B) of 60-day old quails. *,**, ***- the difference in weight of the eviscerated carcass in experimental group 4 is significant in relation to the control group 2 and experimental groups 5 and 6 at p≤0.001.
Figure 6.
Meat qualities (A) and Slaughter yield (B) of 60-day old quails. *,**, ***- the difference in weight of the eviscerated carcass in experimental group 4 is significant in relation to the control group 2 and experimental groups 5 and 6 at p≤0.001.
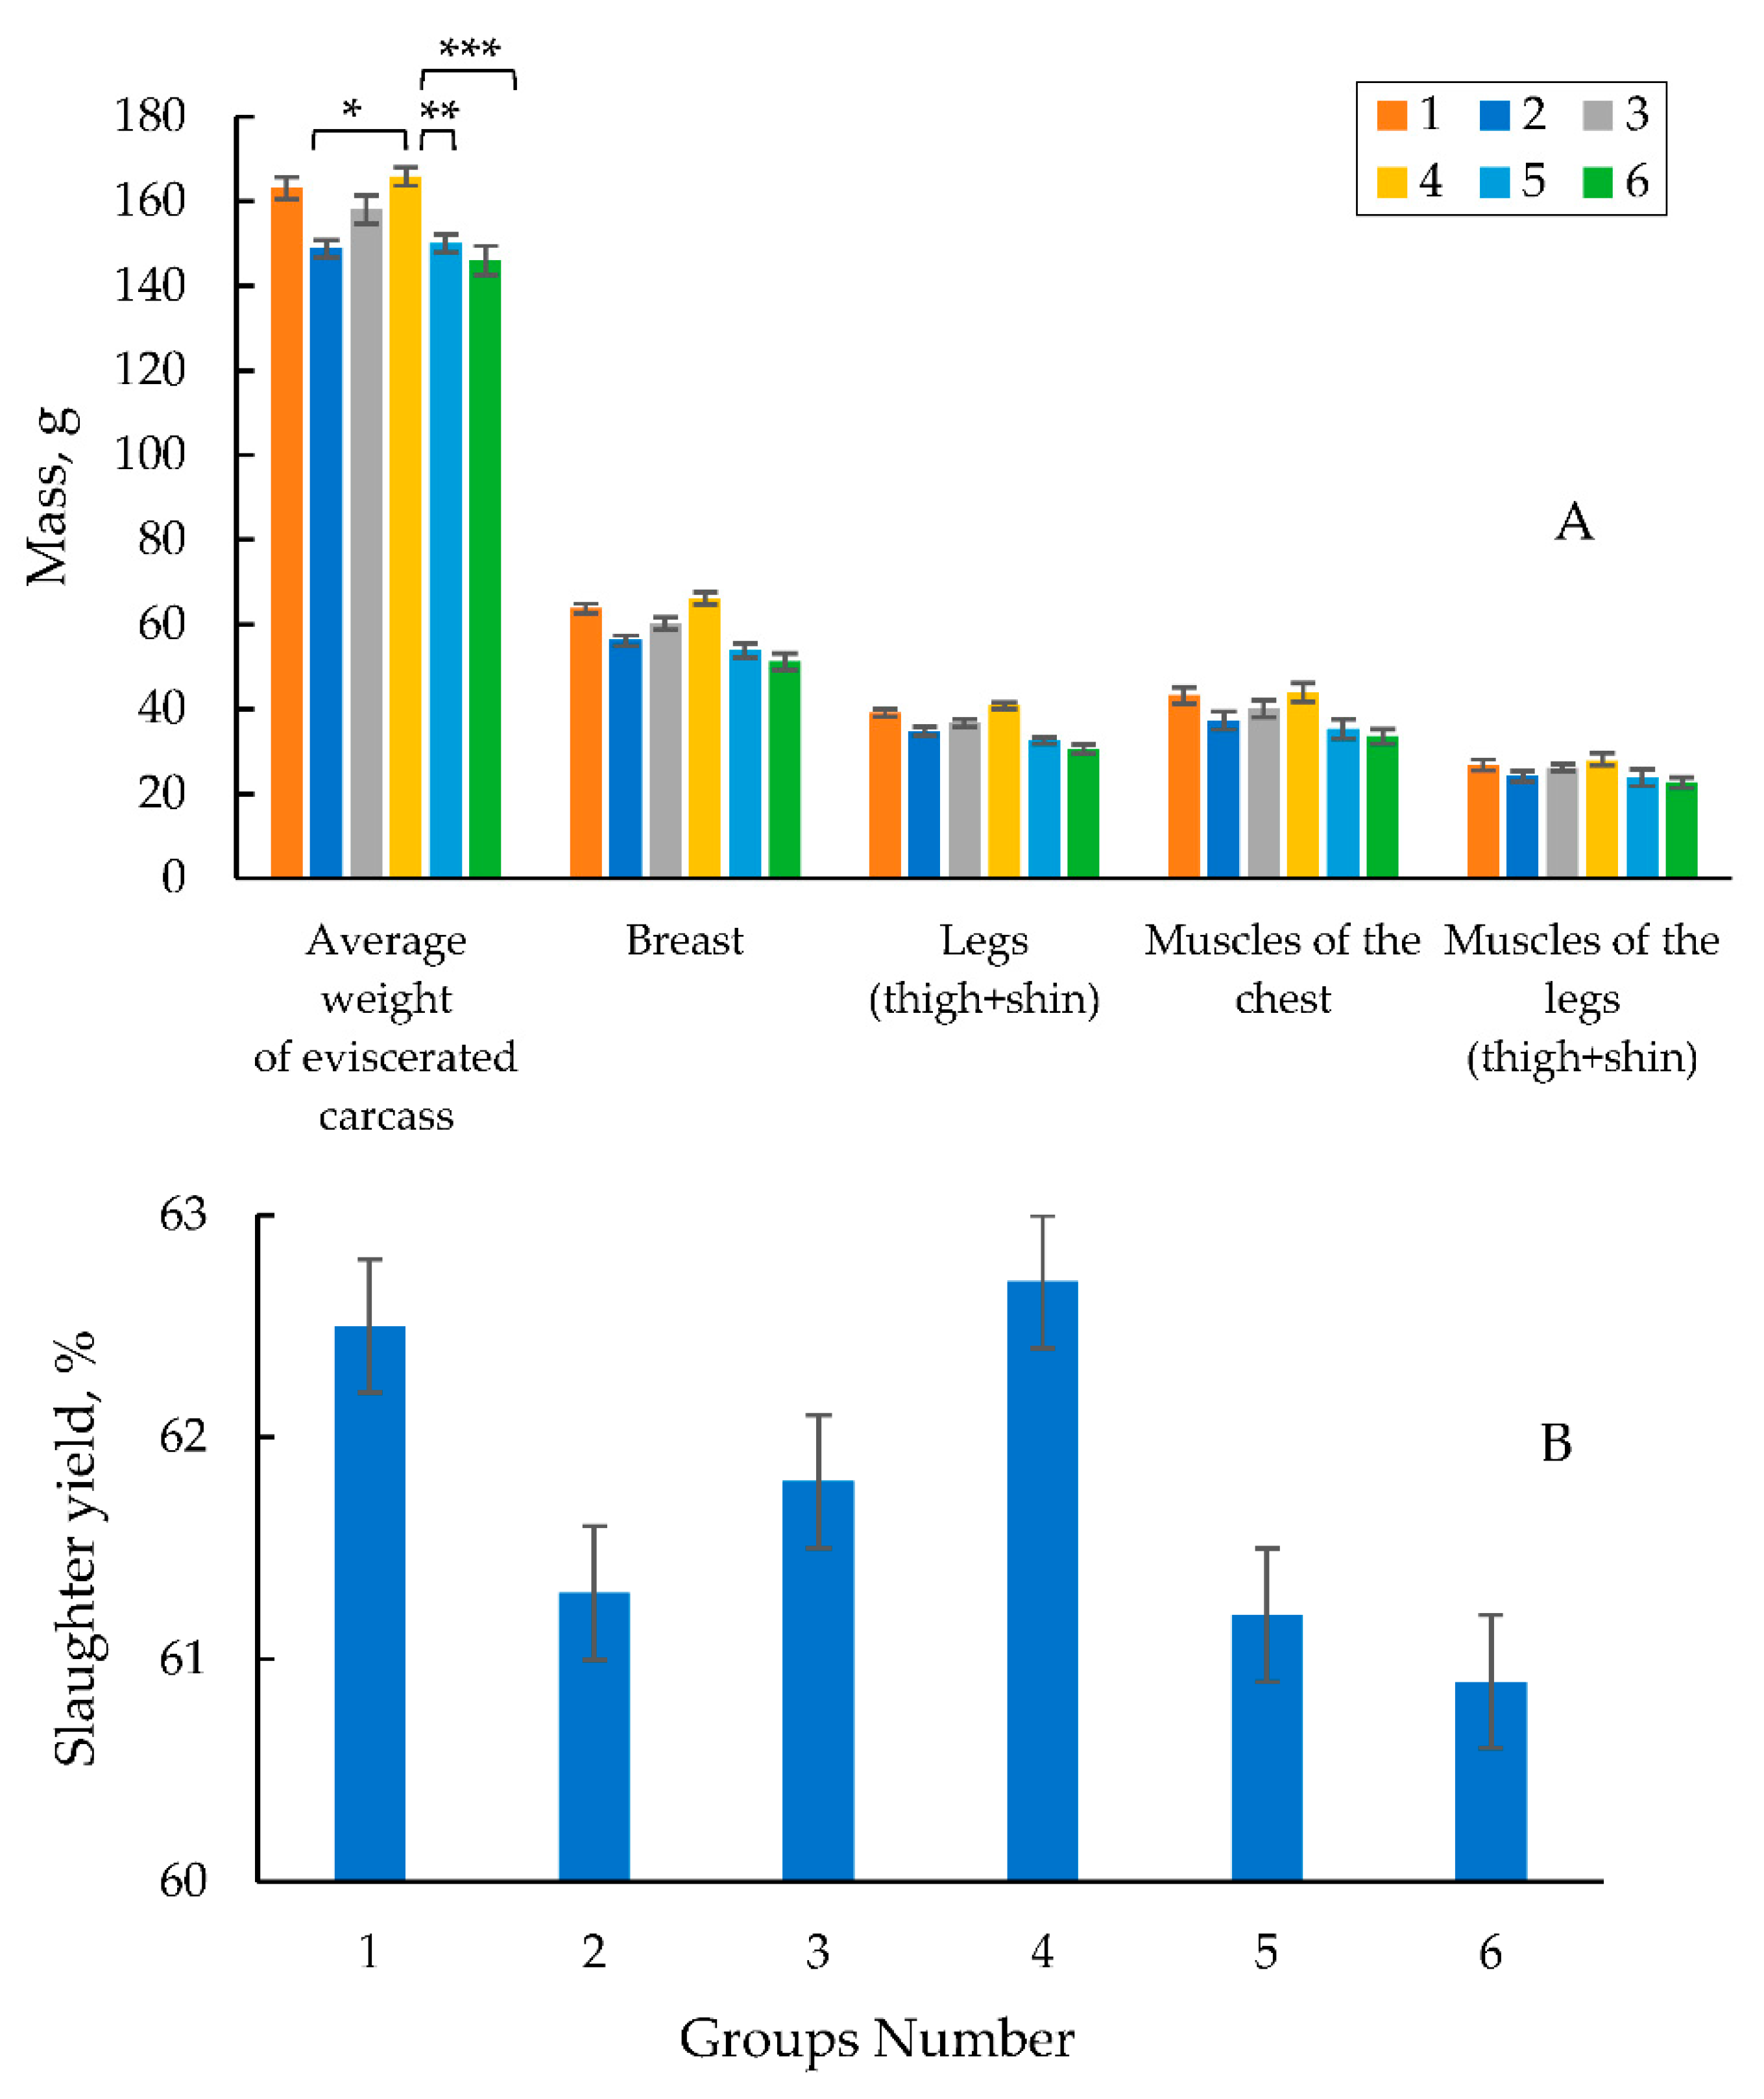
Figure 7.
The mass of internal organs of quails at 60 days.
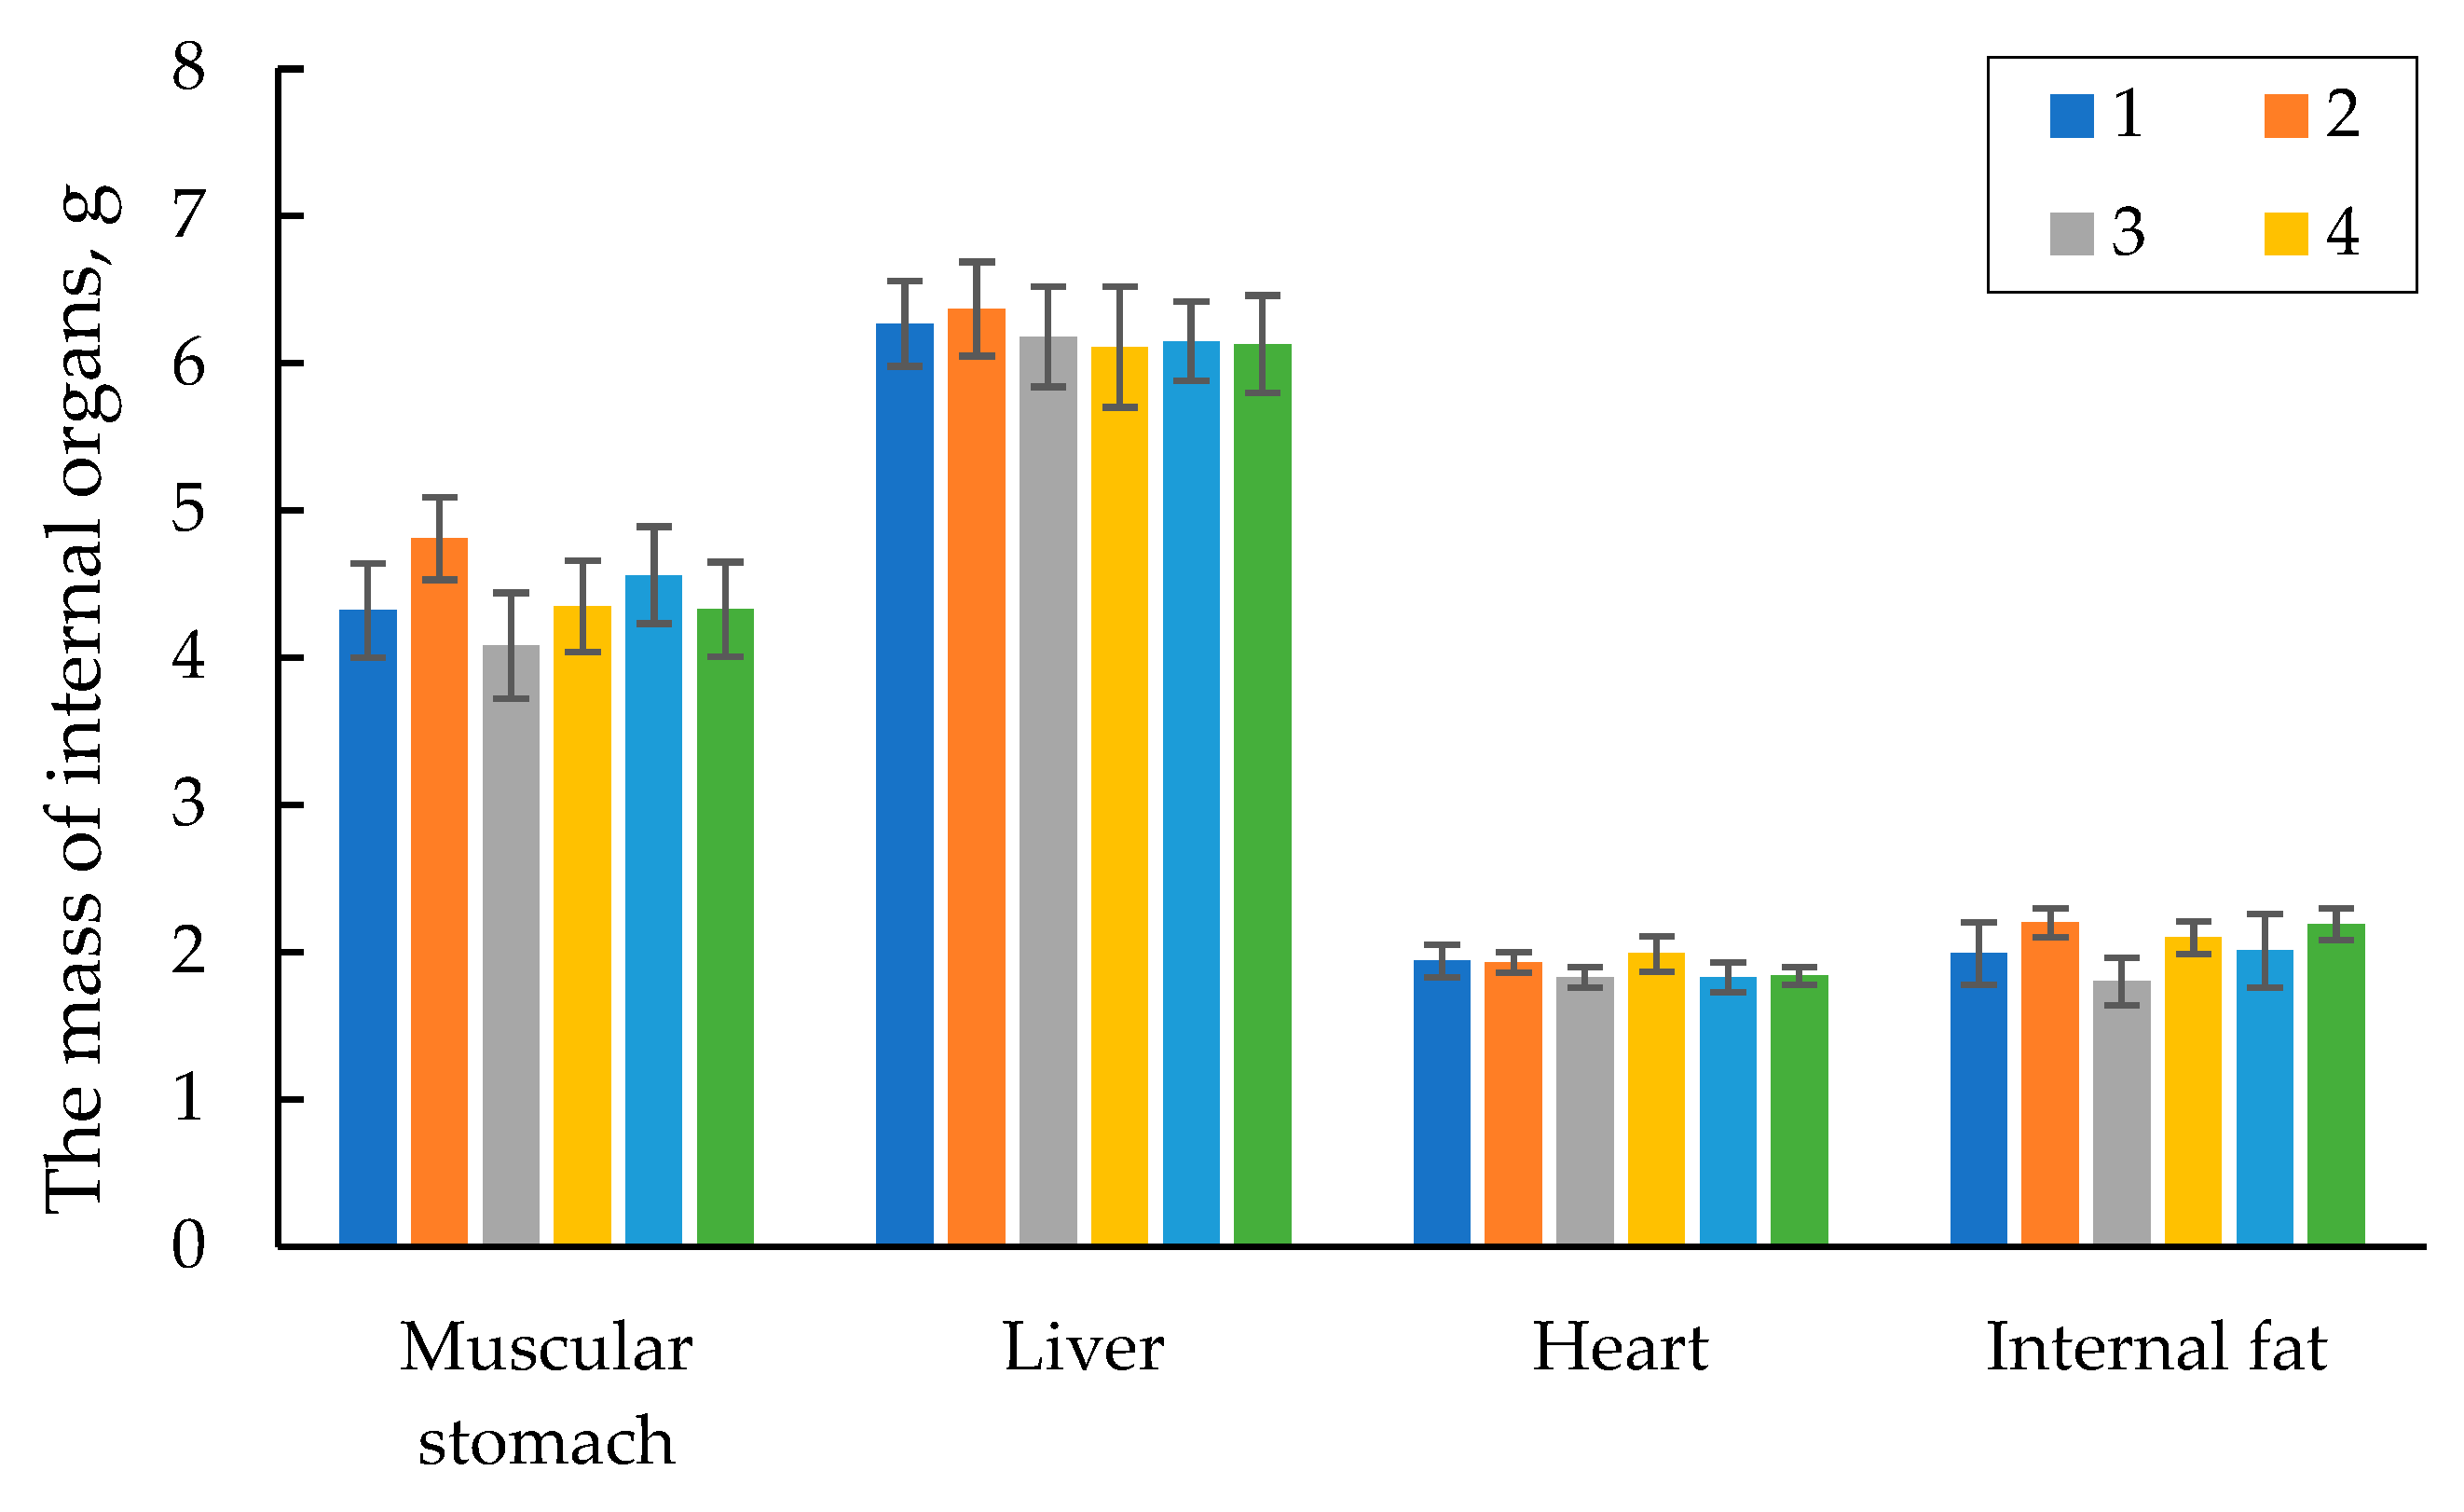

Table 1.
Body weight of the quails at different age, from 1 to 42 days of life, g (M ±m).
| Age of the poultry, days | Groups Number | ||||||||||
|---|---|---|---|---|---|---|---|---|---|---|---|
| 1 | 2 | 3 | 4 | 5 | 6 | ||||||
| 1 | 8.0±0.00 | 8.0±0.00 | 8.0±0.00 | 8.0±0.00 | 8.0±0.00 | 8.0±0.00 | |||||
| 7 | 39.2±0.52 | 37.5±0.68 | 38.2±0.50 | 38.5±0.55 | 39.0±0.51 | 37.88±0.68 | |||||
| 14 | 80.4±1.08 | 78.7±1.08 | 78.8±1.06 | 80.9±0.89 | 81.0±1.14 | 79.6±1.38 | |||||
| 21 | 140.9±1.81 | 138.9±1.87 | 139.7±1.47 | 141.0±1.43 | 139.0±1.80 | 136.3±1.94 | |||||
| 28 | 171.8±1.88 | 168.2±2.24 | 167.9±1.69 | 168.2±1.80 | 166.6±2.19 | 164.4±2.18 | |||||
| 35 | 197.9±3.52 | 195.9±4.90 | 196.5±2.73 | 200.0±3.28 | 194.2±2.92 | 192.1±3.61 | |||||
| 42 days: | |||||||||||
| hens roosters average |
238.5±4.04194.7±4.73217.7±6.55 | 239.4±5.39 190.6±4.89 215.5±5.70 |
236.3±3.60 191.7±4.14 214.2±4.84 |
240.4±4.15 196.9±3.94** 218.1±5.54 |
233.9±6.96 189.0±4.23 211.2±5.36 |
235.6±6.09 180.3±3.18 206.8±6.42 |
|||||
| % to control 1 | 100 | 100 | -1.6 | +0.2 | -3.0 | -5.0 | |||||
| % to control 2 | 100 | 100 | -0.6 | +1.2 | -2.0 | -4.0 | |||||
** - the difference in body weight in the males of experimental group 4 is significant compared to that for the males of experimental group 6 at p= 0.01.
Table 2.
Zootechnical features and FCR* of the 42-days old quails.
| Groups Number | ||||||
|---|---|---|---|---|---|---|
| 1 | 2 | 3 | 4 | 5 | 6 | |
| Percent alive, % | 100 | 100 | 100 | 100 | 100 | 100 |
| Average daily gain, g | 4.99±0.13 | 4.94±0.15 | 4.91±0.09 | 5.00±0.1 | 4.84±0.11 | 4.73±0.13 |
| Feed consumption per a head per a day, g |
19.66±0.8 |
19.71±0.7 |
19.43±0.8 |
19.59±0.9 |
19.66±0.8 |
19.33±0.9 |
| Feed consumption per a kg of live weight, kg |
3.75±0.3 |
3.80±0.2 |
3.77±0.4 |
3.73±0.3 |
3.87±0.2 |
3.89±0.1 |
| FCR* | 3.99 | 3.99 | 3.95 | 3.91 | 4.06 | 4.08 |
*K = k(feed)/M is the formula of the FCR, where k (feed) is the amount of the feed consumed by one bird in kg throughout the whole experiment (42 days), and M is the body weight gain.
Table 3.
The yield of parts and muscles from the mass of the eviscerated carcass, %.
| Groups Number | ||||||
| 1 | 2 | 3 | 4 | 5 | 6 | |
| Yield of carcass parts: breast ham (thigh+shin) |
39.3±2.4 24.8±3.0 |
38.4±1.9 23.8±1.7 |
37.1±1.8 23.5±2.0 |
40.5±3.1 25.1±2.3 |
36.6±3.1 22.4±1.9 |
35.7±3.2 21.6±1.9 |
| Yield of muscle parts: breast (fillet) legs (thigh+shin) |
27.3±1.9 17.0±1.2 |
26.5±1.7 16.9±1.2 |
25.3±1.7 16.2±1.3 |
28.4±1.8 18.1±1.3 |
24.2±1.9 15.5±1.4 |
23.8±1.8 15.1±1.4 |
Table 4.
Body weight of the 60-day old quails, g (M ±m).
| Groups Number | Females | Males | Average live weight |
|---|---|---|---|
| 1 | 273.3 ± 5.78 | 211.5 ± 5.50 | 260.9 ± 9.48 |
| 2 | 251.3 ± 6.15 | 208.5 ± 2.50 | 242.7 ± 10.29 |
| 3 | 268.2 ± 6.80 | 206.5 ± 2.80 | 255.7 ± 9.92 |
| 4 | 276.3 ± 8.86*## | 218.4 ± 3.50*## | 264.7 ± 10.40* |
| 5 | 257.6 ± 6.34 | 196.5 ± 6.50 | 245.4 ± 9.48 |
| 6 | 249.1 ± 4.50 | 200.5 ± 4.50 | 239.4 ± 6.15 |
*- the difference in the live weight of females of experimental group 4 compared that control group 2 at p < 0.05. ##- compared to that in experimental group 6 at p < 0.01. *- the difference in the live weight of the males of experimental group 4 is significant compared to that in control group 2 at p< 0.05. ## - compared to that in experimental group 5 and 6 at p<0.01; *- the difference in the total average live weight of experimental group 4 is significant compared to that in experimental group 6 at p < 0.05.
Table 5.
Zootechnical features of quails and FCR* from 42 to 60 days.
| Groups Number | ||||||
|---|---|---|---|---|---|---|
| 1 | 2 | 3 | 4 | 5 | 6 | |
| Percent alive, % | 100 | 100 | 100 | 100 | 100 | 100 |
| Average daily gain, g | 2.4±0.2 | 1.51±0.1 | 2.31±0.1 | 2.59±0.2 | 1.90±0.2 | 1.81±0.2 |
| Feed consumption per 1 head per day, g | 33.49±2.3 | 33.02±2.4 | 31.95±2.4 | 32.82±2.3 | 33.15±2.4 | 32.75±2.1 |
| Feed expenses per average body weight, kg | 2.31±0.1 | 2.45±0.1 | 2.25±0.1 | 2.23±0.2 | 2.43±0.1 | 2.46±0.2 |
| Egg productivity, % | 77.1±4.8 | 73.6±4.6 | 77.8±4.7 | 86.8±4.9 | 75.0±4.5 | 77.8±4.6 |
| FCR* | 2.31 | 2.45 | 2.25 | 2.23 | 2.43 | 2.46 |
*K = k(feed)/M is the formula of the FCR, where k (feed) is the amount of the feed consumed by one head in kg for 42 days, and M is the body weight gain.
Table 6.
The output of the parts and muscles from the weight of the eviscerated carcass, %.
| Groups Number | ||||||
|---|---|---|---|---|---|---|
| 1 | 2 | 3 | 4 | 5 | 6 | |
| Yield of carcass parts: breast legs (thigh+shin) |
39.1±2.3 23.9±1.9 |
37.7±2.1 23.4±1.7 |
38.1±2.4 23.3±1.8 |
39.7±1.9 24.5±1.9 |
36.6±1.8 22.4±1.8 |
35.7±1.8 21.6±1.3 |
| Muscle yield parts: breast (fillet) legs (thigh+shin) |
26.5±1.8 16.4±0.6 |
25.1±1.7 16.3±0.9 |
25.4±1.8 16.5±1.1 |
26.6±1.7 16.7±0.6 |
23.5±1.8 15.9±0.7 |
22.9±1.8 15.5±0.7 |
Table 7.
Chemical assay of macro- and microelements in the quail excreta.
| Groups | Macro-element amount, % of dry weight |
Trace element amount, µg/g of dry weight | ||||
|---|---|---|---|---|---|---|
| P | Mg | K | Ca | Zn | Cu | |
| 14days of the experiment | ||||||
| 1 | 1.27 | 0.38 | 2.06 | 1.37 | 1148 | 92 |
| 3 | 0.96 | 0.36 | 2.05 | 1.01 | 1158 | 113 |
| 4 | 1.30 | 0.46 | 2.35 | 1.21 | 1071 | 89 |
| 5 | 1.24 | 0.39 | 2.19 | 1.04 | 1205 | 91 |
| 28 days of the experiment | ||||||
| 1 | 1.47 | 0.44 | 1.91 | 1.93 | 681 | 55 |
| 3 | 1.32 | 0.45 | 2.00 | 1.66 | 784 | 65 |
| 4 | 1.38 | 0.44 | 1.90 | 1.63 | 723 | 62 |
| 5 | 1.61 | 0.47 | 1.89 | 1.85 | 642 | 48 |
| 42days of the experiment | ||||||
| 1 | 1.42 | 0.41 | 1.85 | 1.82 | 539 | 51 |
| 3 | 1.47 | 0.43 | 1.79 | 1.79 | 565 | 49 |
| 4 | 1.41 | 0.46 | 1.83 | 1.81 | 551 | 48 |
| 5 | 1.53 | 0.42 | 1.81 | 1.93 | 558 | 50 |
Table 8.
Chemical assay of macro- and microelements in the feed for the quails (start feed).
| Diets for the groups | Macro-element amount, % of dry weight | Trace element amount, µg/g of dry weight | ||||
|---|---|---|---|---|---|---|
| P | Mg | K | Ca | Zn | Cu | |
| 1 | 0.71 | 0.23 | 1.31 | 1.05 | 373 | 41 |
| 2 | 0.61 | 0.28 | 1.27 | 1.37 | 366 | 64 |
| 3 | 0.73 | 0.24 | 1.40 | 1.42 | 448 | 49 |
| 4 | 0.69 | 0.21 | 1.30 | 0.93 | 246 | 30 |
| 5 | 0.73 | 0.22 | 1.34 | 1.16 | 340 | 42 |
| 6 | 0.58 | 0.22 | 1.39 | 0.90 | 320 | 41 |
Disclaimer/Publisher’s Note: The statements, opinions and data contained in all publications are solely those of the individual author(s) and contributor(s) and not of MDPI and/or the editor(s). MDPI and/or the editor(s) disclaim responsibility for any injury to people or property resulting from any ideas, methods, instructions or products referred to in the content. |
© 2023 by the authors. Licensee MDPI, Basel, Switzerland. This article is an open access article distributed under the terms and conditions of the Creative Commons Attribution (CC BY) license (http://creativecommons.org/licenses/by/4.0/).
Copyright: This open access article is published under a Creative Commons CC BY 4.0 license, which permit the free download, distribution, and reuse, provided that the author and preprint are cited in any reuse.


