Submitted:
15 August 2023
Posted:
16 August 2023
You are already at the latest version
Abstract
In Japan, where the working population is declining, there is a growing expectation that the potential working population will play an active role, and in this context, administrative measures such as the promotion of women's activities have been implemented. However, there is no end to the number of women who leave the workforce after life events such as childbirth or child rearing. For example, in Fukuoka Prefecture (population 5.1 million) alone, where we are based, it is estimated that there are 43,300 potential female workers. Many of these women have have been employed in the past, but have left the workforce due to childbirth, family care, or other reasons, and still wish to work. However, although this group has potential employment needs, they have not yet engaged in specific job-hunting activities, and thus are on the periphery of the labor market, without access to the current active labor market. There are many promising potential employees there, and support for their career redevelopment and participation in the labor market is required. On the other hand, few studies have been conducted in Japanese prefectures to systematically estimate social value, i.e., to determine the scope of impact on society and the stakeholders. This is an obstacle to the formulation of policies for women's advancement and the establishment of related social projects. This paper is aware of this problem and, based on the support for women seeking to re-enter society (career redevelopment) that the authors are implementing, selects seven prefectures in Kyushu, which is also a wide economic zone, as a support area and estimates the social value to companies and families in these areas by using SROI. As a result, it was derived that if 3,586 individuals were reemployed, the SROI ratio (1:X) X would be 76.1 in the first year of reintegration assistance activities and X would be 313.3 in the fourth year.
Keywords:
SROI
; employment support measures
; employment measures for potential working women
; economic revitalization of local cities in Japan
1. Introduction
Since 2015, Japan has been pursuing new policies to promote the advancement of women, but the country is currently ranked 125th in the 2023 Gender Gap Index*, the lowest ever. Although there is no gap in educational opportunities and healthy life expectancy between men and women, there are concerns that the gender gap in areas such as politics and the economy will significantly affect the country’s growth. In particular, there are few women in leadership positions, and it has been pointed out that this is due to the fact that the length of time required to continue a career differs greatly between men and women. In addition, as Japan’s working population declines, there is a growing expectation that the potential workforce will play an active role, and government measures to promote women’s careers have been implemented. However, there is no end to the number of women who leave the workforce after life events such as childbirth or child rearing. For example, in Fukuoka Prefecture (population 5.1 million) alone, where we are based, it is estimated that there are 43,300 potential female workers*. Many of these women have been employed in the past, but have left the workforce due to childbirth, family care, or other reasons, and still wish to work. However, although this group has potential employment needs, they have not engaged in specific job search activities, and therefore are not accessing the current active labor market, and are located on the periphery of the labor market. There are many promising potential employees out there, and support for their career redevelopment and participation in the labor market is required. The period of underemployment can also be viewed as a period of unemployment despite positive work intentions, which can lead to negative experiences such as social exclusion (Schmid and Gazier, 2002 [1]) and living in poverty (Gallie, Paugam, and Jacobs, 2003 [2]), with serious consequences for individuals and families.
As described above, there are potential working women who are not being fully utilized in Japan, but there is little data or research that systematically shows their social value. This is thought to be an obstacle to the formulation of policies and the establishment of social projects related to the active participation of women in the workforce. This paper is aware of this problem, and in order to provide an opportunity to reaffirm the social value of “career redevelopment support” for potential working women, we use Social Return on Investment (SROI), which is one of the most effective methods for estimating the social value of social projects in various fields, and convert it into monetary value, The authors will convert this value into monetary value and discuss the results. Specifically, based on the support (career development) for women who wish to return to society and find new employment that the authors have been implementing, we selected seven prefectures in Kyushu as support areas and used SROI to estimate the social value of the project to companies and families in these areas. SROI was developed by the Roberts Enterprise Development Fund (REDF), a US foundation, at the end of the 20th century to estimate the social value of social projects for job creation, and is consistent with the estimates of social reintegration assistance described above.
In the following sections, we will describe the project summary, the survey summary, and the estimation results and discussion. In the summary, we will summarize the new directions and future possibilities for SROI measurement according to the areas of implementation that have emerged from the project in practice now, five years after the 2016 estimates.
1.1. ”From Housewife to Strategic General Affairs” Project: A Model Project of the Cabinet Office in FY 2015 to Support Women Who Want to Reenter the Workforce in this Study
1.1.1. Outline of reemployment support project for women
In 2015, there was a movement to promote women’s active participation, but 60% of women left their jobs for reasons such as marriage and childbirth. In addition, many of the women who left their jobs had a desire to work, but they were worried about balancing work and family, and there were many who did not take action toward practical job hunting. Such women are hereinafter referred to as potential working women.
According to the 2012 Employment Structure Basic Survey by the Statistics Bureau of the Ministry of Internal Affairs and Communications, there are 43,300 women in Fukuoka Prefecture alone, and a total of 94,400 in Kyushu as a whole. Since the average age of first childbirth is over 30 years old, human resources with 5 to 10 years of working experience after graduating from university or vocational school are sleeping. In fiscal year 2015, the NPO Mama Work Institute (Fukuoka City) launched the Cabinet Office’s model project targeting women, the ‘From Housewives to Strategic General Affairs’ Project: Accelerating business in the founding period with female human resources. 2015 model project) was implemented. It was a new model business that utilizes potential working women as “strategic general affairs human resources.” The project was also linked to the direction of industrial development in Fukuoka City. Fukuoka City has promoted new businesses, and the rate of new business establishments was 7.1%, the highest among cities in Japan for the past few years. Our project had the aim of discovering and linking potential working women to the business growth of new business establishments.
1.1.2. Project Outcomes and Expected Ripple Effects
In the FY2015 model project, we first identified the needs of companies for “strategic general affairs human resources.” Next, we developed a retraining program that incorporated those needs, and conducted a model school that actually recruited students to attend. Of the 12 graduates of this school, 4 have been re-employed.
Based on this result, we have positioned “potential working women” with high educational backgrounds and careers in business as important organizational management players during the growth phase of start-up companies, and have calculated the SROI if they were actually utilized. As a result, the initial investment of 1.3 million yen will produce effects such as an increase in disposable income through re-employment and an increase in the use of childcare services. It became clear that adding up each effect could generate a monetary value equivalent to 31.76 million yen in the first year and 139.08 million yen in total over four years.
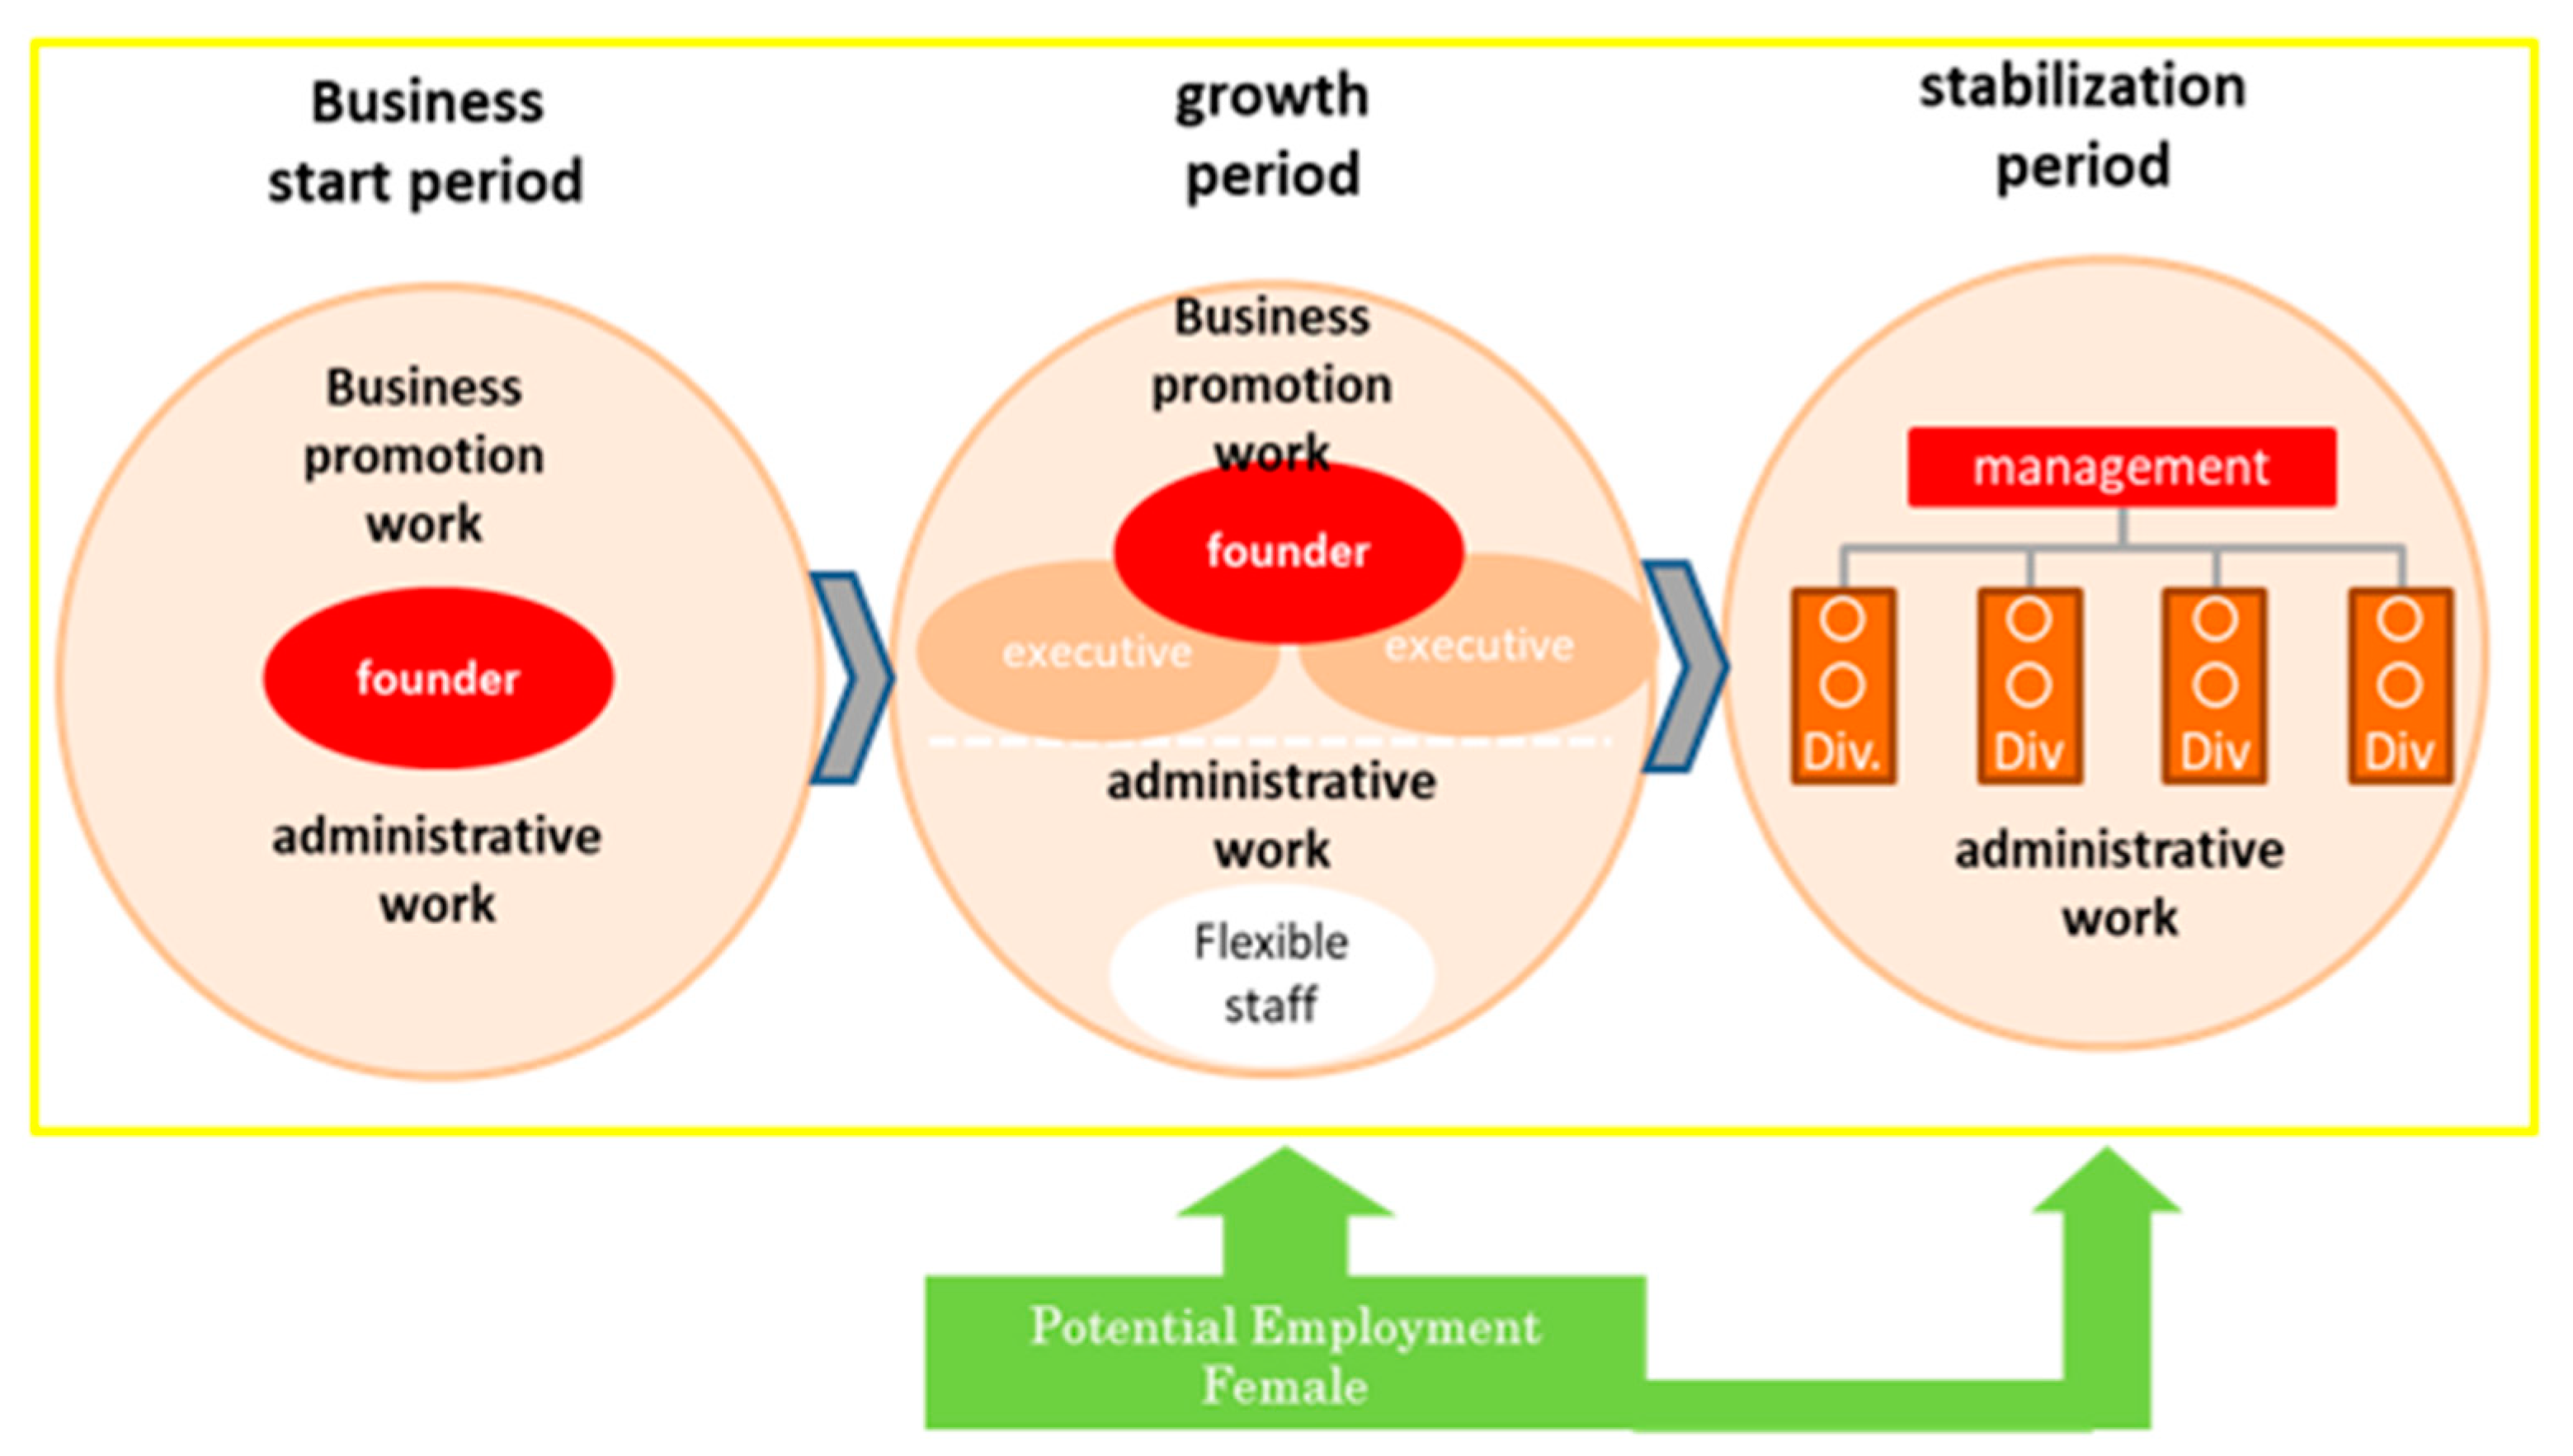
Figure 1.
Image of utilization of potential working women (A start-up company with an immature organizational management system can expand its management by utilizing potential working women who can multitask. Leading to career advancement for potential working women themselves).
Figure 1.
Image of utilization of potential working women (A start-up company with an immature organizational management system can expand its management by utilizing potential working women who can multitask. Leading to career advancement for potential working women themselves).
2. Theoretical Background
2.1. Potential Working Women
This study assumes that there are a large number of potentially employed women who have left the workforce due to family reasons, and that there is a need to support their career redevelopment and participation in the labor market. This period of underemployment can be viewed as a period of unemployment that occurs despite a positive work ethic, leading to negative experiences such as social exclusion (Schmid and Gazier, 2002[1]) and living in poverty (Gallie, Paugam, and Jacobs, 2003[2]), This can have serious consequences for individuals and families. In contrast, around the 2000s, research began to focus on the positive aspects of the interaction between work and family in the U.S. Greenhaus and Powell (2006[3]) proposed the concept of “work-family enrichment” (WFE) based on the augmentation hypothesis (Sieber, 1974[4]). WFE is defined as “the improvement in the quality of life of one work role and one family role, viewed at the individual level, as the experience of the other role. As evidence of this, in an example discussing how the experience of raising children at home can benefit work, it is known that women are more likely than men to perform more easily and more fully in their work roles due to behaviors gained or learned in their home roles (van Steenbergen, Ellemers, & Mooijaart, 2007[5]). This has been recognized within research areas such as work-family enrichment and work-family facilitation (Wayne, Musisca, & Fleeson, 2004[6]).
In fact, research on adult development through parenting has been conducted since the 1970s, and Palkovitz (1996[7]) reviewed research on parental development with the aim of examining the relationship between parenting involvement and adult development. Galinsky (1987[8]) conducted an interview survey of parents with children from the fetus to 18 years of age, and found that parents were more likely to be involved in parenting during the image formation period, the nurturing period, the authority period, the interpretation (explanation) period, the interdependence period, the departure (separation) period, and the separation (separation) period than during the parenting period. Galinsky (1987[8]) conducted interviews with parents of children from the fetus to age 18 and clarified the developmental tasks of parents at each of the six stages of child development: image formation, nurturing, authority, interpretation (explanation), and departure (separation). In addition, Stern, Bruschweiler-Stern, & Freeland (1998[9]) pointed out that there are three stages in the process of becoming a mother. First, during the nine-month gestation period, the mother prepares the way for her new identity; second, in the months following the birth of the child, motherhood is clearly formed through involvement in feeding and nurturing the child; and finally, the new identity is integrated into the rest of life, and the desire to be recognized by others and to seek encouragement from other mothers The above mentioned family members are the ones who are responsible for the development of the new identity. In light of the above, the aforementioned view that there are many potential workers among women who have left the workforce due to family circumstances seems to have some validity.
2.2. The Role of SROI
SROI is a framework for quantitative social impact evaluation developed at the end of the 20th century by the Roberts Enterprise Development Fund (REDF), a U.S. foundation that provides funding and management capacity building support to nonprofit organizations and social enterprises primarily engaged in job creation. REDF has developed the SROI evaluation framework by applying the Return On Investment concept of cost-benefit analysis and financial analysis to quantitatively evaluate the effectiveness of the activities of recipient organizations and to use it as a benchmark for funding and support activities (Emerson et al., 2000[10]). ROI is mainly a “financial indicator that can be applied to traditional companies operating within a market that aims to maximize profits,” but in the third sector, such as social enterprises and non-profit organizations, the limitations of ROI were obvious due to the significant impact of the triple bottom line, which includes economic, environmental, and social aspects (Mertens et al., 2015[11]). In other words, the third sector required a broader concept of value that “transcends the transaction costs themselves and encompasses the impact of the transaction on other affected parties,” which led to the need for SROI (Ryan and Lyne, 2008[12]). The SROI evaluation thus developed is based on a quantitative assessment of the outcomes generated as a result of the implementation of projects with funds and resources invested in social activities, which are considered as social impacts. In addition, by presenting such return on investment as a 1:X ratio (net SROI ratio = discounted present value/value of inputs), or SROI ratio, it is possible to compare the social impact of different projects. Thus, SROI can be viewed as an assessment of the value of the social outcomes created by a social project enterprise in relation to the relative cost of achieving those outcomes (Rotheroe and Richards 2007[13]). In other words, SROI analysis, including the calculation of the SROI ratio, which is a measure of monetized social value, typically involves the following steps in sequence (Nicholls, et al., 2012[14])
- Determination of scope and identification of stakeholders
- Mapping of results
- Proving results and valuing results
- Determination of impact
- Calculation of SROI
- Reporting, utilization and integrationThird item.
The SROI obtained through the procedure described above is advantageous in that it allows social enterprises to play a role in making all stakeholders (e.g., customers, funders, volunteers, mentors, future employers, etc.) aware of the relationship between inputs and final outcomes, thereby increasing transparency and accountability (Rotheroe and Richards, 2007[13]). Thus, the SROI is used by stakeholders (governments and other funders) as useful information in their funding decisions (Cellini and Kee, 2010[15]). For this reason, the SROI can be used to inform the decisions of various social projects, such as construction design businesses (Hopkins, et al., 2023[16]), social enterprises that create jobs for people with disabilities (Morera, et al., 2022[17]), art gallery management (Jackson and McManus, 2019[18]), healthcare management (Millar and Hall, 2013[19]), volunteers involved in food supply in food insecure communities (Classens, 2015[20]), public health interventions (Banke-Thomas et al., 2015[21]), and disability programs that have gained competitive employment (Hopkins [16]) Used to estimate the value.
2.3. Advantages and Concerns of SROI
The following is a consensus among researchers on the pros and cons of using the SROI.
The SROI can estimate the positive or negative economic, social, and environmental impacts of a social project (Arvidson, Lyon, McKay and Moro, 2013[22]; Krlev et al. Moro, 2013[23]). In doing so, they identify not only internal factors, but also various external factors. This also allows for a bird’s-eye view of the overall social project that one is pursuing. Through this, it is also possible to determine the level of involvement of the stakeholders involved in the project. In other words, from the initial stage, it is possible to define the objectives of the stakeholders’ involvement in the project and identify the project’s outputs and outcomes (Krlev et al., 2013[23]). When the most important stakeholders can be involved in this step, it can be used as an opportunity for them to find the intrinsic meaning of their involvement in the social project (Arvidson et al., 2013[22]) SROI can also be used as a management tool because of its ROI origin. That is, SROI provides basic information for forecasting, planning, and managing social activities, as well as a source of information for allocating resources to areas of impact and establishing missions and strategies. It can identify indicators to be tracked and guide the organization to set clear objectives and targets. Through this process, stakeholders can be clarified and organizational learning is facilitated to advance the social project in its favor (Krlev et al., 2013[23]) Finally, the SROI is an open and transparent statement. Various scenarios and financial indicators can be identified and transparently communicated to stakeholders prior to project implementation (Krlev et al., 2013[23]) This helps to bring stakeholders on board, which is essential for project promotion, as the SROI has an investment information aspect, advantage of acting as a tool to bridge the potential gap between social projects and investors (Arvidson et al., 2013[22]).
In addition to the above, the following SROI concerns can be found in prior studies. For example, conducting an SROI study requires not only superficial monetary costs, but also the collection of non-standardized indicators and financial metrics. It is important to understand that these will be subjective and therefore dependent on the experience and judgment of experts (Lawlor et al., 2008[24]; Arvidson et al., 2013[22]). Another important aspect is the allocation of costs in SROI analysis. A common view among practitioners is that direct costs (excluding indirect costs) tend to be the primary component of SROI. When direct costs are the primary component, the total costs associated with the project are underestimated (Pathak and Dattani, 2014[25]). Another view is that some researchers place too much emphasis on the calculation of the SROI ratio, which may affect the legitimacy of the report. There the argument is that the ratio is only an indicator of the study, but it should be supported by an accurate and strong story (Arvidson et al., 2013[22]; Jönsson, 2013[26]; Krlev et al., 2013[23]).
On the philosophical side, some scholars warn that there may be a disconnect between SROI analysis and social programs. In other words, this is due to the fact that SROI is founded on “different epistemological assumptions, assumptions that emphasize qualitative experiences and tacit knowledge that may not be measurable” (Millar and Hall 2012[19]; Bull 2007[23], Paton 2003[28]). Some of its alarms stem from questions such as “can complex social interventions be considered a rational system for evaluating them “objectively”“ (Millar and Hall, 2012[19]; Ridley-Duff et al., 2011[29]) Even with these criticisms, as noted earlier As mentioned earlier, ROI has a significant impact on the economic, environmental, and social aspects of the triple bottom line, and its (ROI) limitations are obvious, making SROI indispensable in the third sector, including social enterprises and non-profit organizations.
3. Research design
3.1. Trial Estimation of Social Value by Utilizing Potential Employed Women—Expansion to the Kyushu Version of the school project
In the 2015 model project, we targeted Fukuoka City, where there are many start-up companies, but potential working women and start-up companies exist throughout Kyushu. Therefore, with a view to further development of this project, we recalculated the effect of holding the Strategic General Affairs Personnel Training School in Kyushu as a whole.
Expand the Fukuoka City version of the calculation method in the FY2015 model project to calculate the Kyushu version of SORI. For the recalculation, we used the four steps in Table 1 to collect and reflect realistic data, such as actual information on re-employed women and employers, as well as the current status of startup support in each prefecture.
3.2. Scope of effects of the Kyushu school project
SROI is the“ratio of profit gained to capital invested”, which is obtained by dividing the “total amount of social value obtained as a result of the project in monetary terms” by the total amount of capital invested. SROI can be estimated by defining the scope affected by the implementation of the school project (Figure 2) and clarifying the monetary value brought to the affected parties (stakeholders) within that scope.
3.3. Results of interviews with re-employed women and hiring companies
As survey steps (1) and (2), we interviewed three women who were re-employed after completing the school in the 2015 model project and the three companies that accepted them. These three were highly conscious of their work duties, and were able to delegate many of the administrative tasks that their supervisors, the managers, had to handle, which enabled the host companies to take on new tasks and businesses.
Table 2 summarizes the interview results for items related to the impact diagram in FIG.2.
3.4. Estimation of the number of potential school students
The number of people eligible to attend the school in Kyushu as a whole was determined from factors such as the percentage of non-working women raising children who could use the reemployment support programs of each prefecture.
As a result of the estimation, there are 3,586 prospective students. Assuming that the number of students in one school is 30, the d number of school sessions required was 119 for the entire Kyushu region (Table 3).
3.5. Input capital school operating expenses
The school project cost, which is the Input capital, was calculated based on the actual results of the FY2015 model project.
The implementation body is the NPO Mama Work Institute; and if we assume that each prefecture is responsible for recruiting and other support, the cost per school session will be 1,09 million yen for the implementation body and 27,992 yen for each prefecture. The total cost for all 119 sessions (times of schools) would be 133,04 million yen.
3.6. Number of start-up (growing)companies accepting women who have completed the course
In the 2015 model project, we planned an exchange meeting between the graduates of the course and companies. When 14 companies were invited to participate in the networking event, 4 companies expressed interest in hiring students from the school. Therefore, in estimating the number of accepting companies, we used 29% (= 4 companies/14 companies) of companies that showed this interest, and 11,245 companies that have newly applied employment insurance as the number of start-up companies in Kyushu as a whole. As a result of the estimation, the number of companies accepting women who completed the course was determined to be 3,213.
4. Results and Discussion
4.1. Results of SROI estimation in Kyushu
Using the above estimates when extended to the entire Kyushu region, we estimated the SROI of a school project similar to the FY2015 model project. Here, the monetary value is obtained based on the assumption that all school students will work for start-up companies. The beneficiaries of the project were assumed to be the school students and their families, whose income would increase as a result of employment; start-up companies ,whose business expansion is expected; national and local governments, whose increased household income would generate tax revenue ; Consumption activities is induced in major commercial facilities due to increased income. In addition, nursery schools, kindergartens, and after-school daycares will increase the number of children in their care.
Table 5 and Table 6 summarize the specific effects that each beneficiary will experience, the calculation formula and its basis, and the social value that will occur in the first year. Based on this amount, it was found that the social value of 41,676,500,000 yen will be generated for the investment amount of 130,410,000 yen in four years after the project. In other words, for every 1 yen invested in women’s employment support, the value is equivalent to 76.1 yen in the first year, and 313.3 yen (times) in four years (See Table 6 and Table 7 for details of estimates). This indicates that X is much greater than 1 as an answer to the research question mentioned earlier. This suggests that the investment in this program generates positive social value.
5. Limitation of the study
The study was limited to Kyushu, Japan. The amount of SROI and the stories (based on interviews) supporting the SROI rate are limited in both number and content. In addition, the scope and stakeholders of the impact of the reemployment support (career development) for women seeking to re-enter society that the authors are implementing are basic, simple, and limited. In addition, the figures used to calculate the SROI are for the year 2016 and do not currently start in the year 2023. This is due to the fact that stable figures could not be obtained amid the global spread of the novel coronavirus. This should be investigated again in the future when stable figures are available.
6. Conclusion
As the working population declines, skilled and motivated human resources are increasingly in demand, but the more educated women tend not to return to the workforce once they retire. Even in the “child-raising period”, it is necessary to foster and produce human resources who can once again play an active role as leaders of the industry. It is expected that the number of start-up managers and companies will increase in various parts of Kyushu, supported by the policy, not only in Fukuoka City, which currently boasts the highest rate of startups. By having startup managers and companies hire strategic general affairs personnel with flexible working styles, the groundwork for expanding management while stabilizing the management foundation will be established. In addition, women who had given up on “rewarding work “ due to time constraints during their child-rearing years will discover new career paths and begin working, which will lead to the revitalization of the local economy, increase in disposable income, and the creation of new careers for the next generation of children.
In the future, we can expect to see women who are active as executives in venture companies emerging from among the re-started workforce. In addition, 70% of the students who attended the “School for Potential Female Workers” (Table 7), which the NPO Mama Work Research Institute is working on as an independent project in 2016, graduated from a four-year university. Many of these potential female workers are those who have been expected by companies to become full-time employees after graduating from university. It is necessary for both the public and private sectors to promote initiatives that will open the door wide for women who have improved their skills and motivation to work in local companies, including startups. From 2021, we have had the opportunity to work on women’s career redevelopment support projects as a dormant deposit utilization project. We are implementing career redevelopment for women in multiple areas (including collaborative businesses), taking into account the IT reskills that are growing faster in the post-corona era. We feel the need to improve our SROI measurement methodology.
1) Regional patterning. There are differences in unit remuneration and working hours at the time of return to work depending on the area. We would like to create a pattern for the reward unit price according to the situation of the area.
2) Costs: Until now, we assumed NPOs as business entities, but in Japan, where the population is declining, the entry of private companies as business promoters is becoming more important, both in terms of business feasibility and the need to secure workers. is desired. We have also implemented a model project as an NPO activity, but in order to implement it with high human resources and quality, it is necessary to secure business feasibility and work on it, so we will launch an operating company and continue to implement it. This is the situation. I would like to derive an SROI after calculating the cost of implementation by a private company.In the future, I would like to devise a method that takes into account these two points of view.
3) Money flow: Through interviews, some of the women who started working take on the role of caregivers for their parents, and by earning a reward for working themselves, it is possible to additionally use external services related to caregiving. I got a comment that it is. As one of the family care responsibilities, nursing care is one of the areas where women have a lot of burdens, and in Japan where the aging of the population is progressing in the future, it will become more and more important.
Acknowledgement
As We would like to express our deepest gratitude to the women re-employed, the host companies, the people in charge of business start-up support and women’s employment support in each prefecture, Mr. Takagi of the Kyushu Bureau of Economy, Trade and Industry who provided data, Mr. Koyanagi of the Kyushu Economic Research Association, Ms. Watanabe and Ms. Hashizume of Japan Research Institute, Inc. and Mr. Shimatani, a career counselor of NPO GEWEL, and the Kyushu Economic Research Association for this rare opportunity to participate in the interviews and surveys related to this paper.
References
- Schmid, G., and B. Gazier. (2002). The Dynamics of Full Employment: Social Integration through Transitional Labour Markets. Cheltenham, UK: Edward Elgar.
- Gallie, D., S. Paugam, and S. Jacobs. (2003). Unemployment, Poverty and Social Isolation: Is There a Vicious Circle of Social Exclusion? European Societies 5 (1): 1–32. [CrossRef]
- Greenhaus, J. H., & G. N. Powell, (2006). When work and family are allies: A theory of work-family enrichment. The Academy of Management Review, 31(1): 72-92. [CrossRef]
- Sieber, S.D.,(1974)Toward a theory of role accumulation. American Sociological Review, 39(4): 567-578. [CrossRef]
- van Steenbergen, E.F., Ellemers, N., and Mooijaart, A. (2007). How work and family can facilitate each other: Distinct types of work-family facilitation and outcomes for women and men. Journal of Occupational Health Psychology, 12 (3): 279-300. [CrossRef]
- Wayne, J.H., Musisca, N., & Fleeson, W. (2004). Considering the role of personality in the work–family experience: Relationships of the big five to work–family conflict and facilitation. Journal of Vocational Behavior, 64 (1): 108-130. [CrossRef]
- Palkovitz, R. (1996). Parenting as a generator of adult development: Conceptual issues and implications. Journal of Social and Personal Relationships, 13 (4): 571-592. [CrossRef]
- Galinsky, E. (1987). Six stages of parenthood. New York: Da Capo Lifelong Books.
- Stern, D. N., Bruschweiler-Stern, N. and Freeland, A. (1998). The Birth of a Mother. How the Motherhood Experiences Changes You Forever. New York: Basic Books.
- Emerson, J., J. Wachowicz, and S. Chun. (2000), Social Return On Investment: Exploring Aspects of Value Creation in the Nonprofit Sector. (REDF, San Francisco).
- Mertens, S., V. Xhauflair, and M. Marée. (2015). Questioning the Social Return on Investment (SROI). SOCENT Publication, Interuniversity Attraction Pole on Social Enterprise. http://iap-socent.be/publications/questioning-social-return-investment-sroi.
- Ryan, P., and I. Lyne. (2008). Social Enterprise and the Measurement of Social Value: Methodological Issues with the Calculation and Application of the Social Return on Investment. Education, Knowledge and Economy 2, (3): 223–37. [CrossRef]
- Rotheroe, N., and A., Richards. (2007). Social return on investment and social enterprise: Transparent accountability for sustainable development. Social Enterprise Journal, 3(1),:31-48. [CrossRef]
- Nicholls, J., E. Lawlor, E. Neitzer, and T. Goodspeed. (2012). A Guide to Social Return on Investment. www.thesroinetwork.org/publications/doc_details/241-a-guide-to-social-return-on-investment-2012.
- Cellini, S. R., and J. E. Kee. (2010). Cost-Effectiveness and Cost-Benefit Analysis. In Handbook of Practical Program Evaluation, 493–530. San Francisco, CA: Jossey-Bass.
- Hopkins, B. (2019). Social Return on Investment: An Important Consideration for State Vocational Rehabilitation Programs. Journal of Rehabilitation Administration 40(1): 11-16.
- Teresa S., Morera, C., Guzmánand Francisco J. Santos. (2022). Measuring the impact of sheltered workshops through the SROI: A case analysis in southern Spain. Annals of Public and Cooperative Economics, 93(2): 381–415. [CrossRef]
- Jackson, A and R., McManus (2019). SROI in the art gallery; valuing social impact, CULTURAL TRENDS 28(2–3), 132–145. [CrossRef]
- Millar, M and K., Hall. (2012). SOCIAL RETURN ON INVESTMENT (SROI) AND PERFORMANCE MEASUREMENT -The opportunities and barriers for social enterprises in health and social care. Public Management Review. 15(6): 923-941.
- Classens, M. (2015). What’s In It for the Volunteers? AN SROI APPROACH TO VOLUNTEERS’ RETURN ON INVESTMENT IN THE GOOD FOOD MARKETS. Nonprofit Management and Leadership, 26(2): 145-56.
- Banke-Thomas, A, O., B, Madaj,. A, Charles., and N, Broek. (2015). Social Return on Investment (SROI) methodology to account for value for money of public health interventions: a systematic review. BMC Public Health. 15 (1): 1-14.
- Arvidson, M., Lyon, F., McKay, S., & Moro, D. (2013). Valuing the social? The nature and controversies of measuring Social Return on Investment (SROI). Voluntary Sector Review, 4(1): 3-18. [CrossRef]
- Krlev, G., Münscher, R., and Mülbert, K. (2013). Social Return on Investment (SROI): State-of the-Art and Perspectives. CSI Report.
- Lawlor, E., Murray, R., Neitzert, E., & Sanfilippo, L. (2008). Investing for Social Value: Measuring social return on investment for the Adventure Capital Fund. New Economics Foundation.
- Pathak P., and Dattani, P. (2014). Social return on investment: three technical challenges. Social Enterprise Journal, 10(2): 91-104. [CrossRef]
- Jönsson, J. (2013). Social Return on Investment: rooms for improvement & research—A background study on SROI to identify research gaps. Forum for social innovation Sweden.
- Bull, M. (2007). Balance: The Development of a Social Enterprise Business Performance Tool. Social Enterprise Journal 3 (1): 49–66.
- Paton, R. (2003). Managing and Measuring Social Enterprises. London: Sage.
- Ridley-Duff, R., P. Seamour, and M. Bull. (2011). Measuring Social Outcomes and Impacts. In Understanding Social Enterprise: Theory and Practice, edited by R. Ridley-Duff and M. Bull, 230–256. London: Sage.
Figure 2.
Diagram of the school project impact map.Source: Created by Japan Research Institute based on materials and interviews from Mama work Institute.
Figure 2.
Diagram of the school project impact map.Source: Created by Japan Research Institute based on materials and interviews from Mama work Institute.
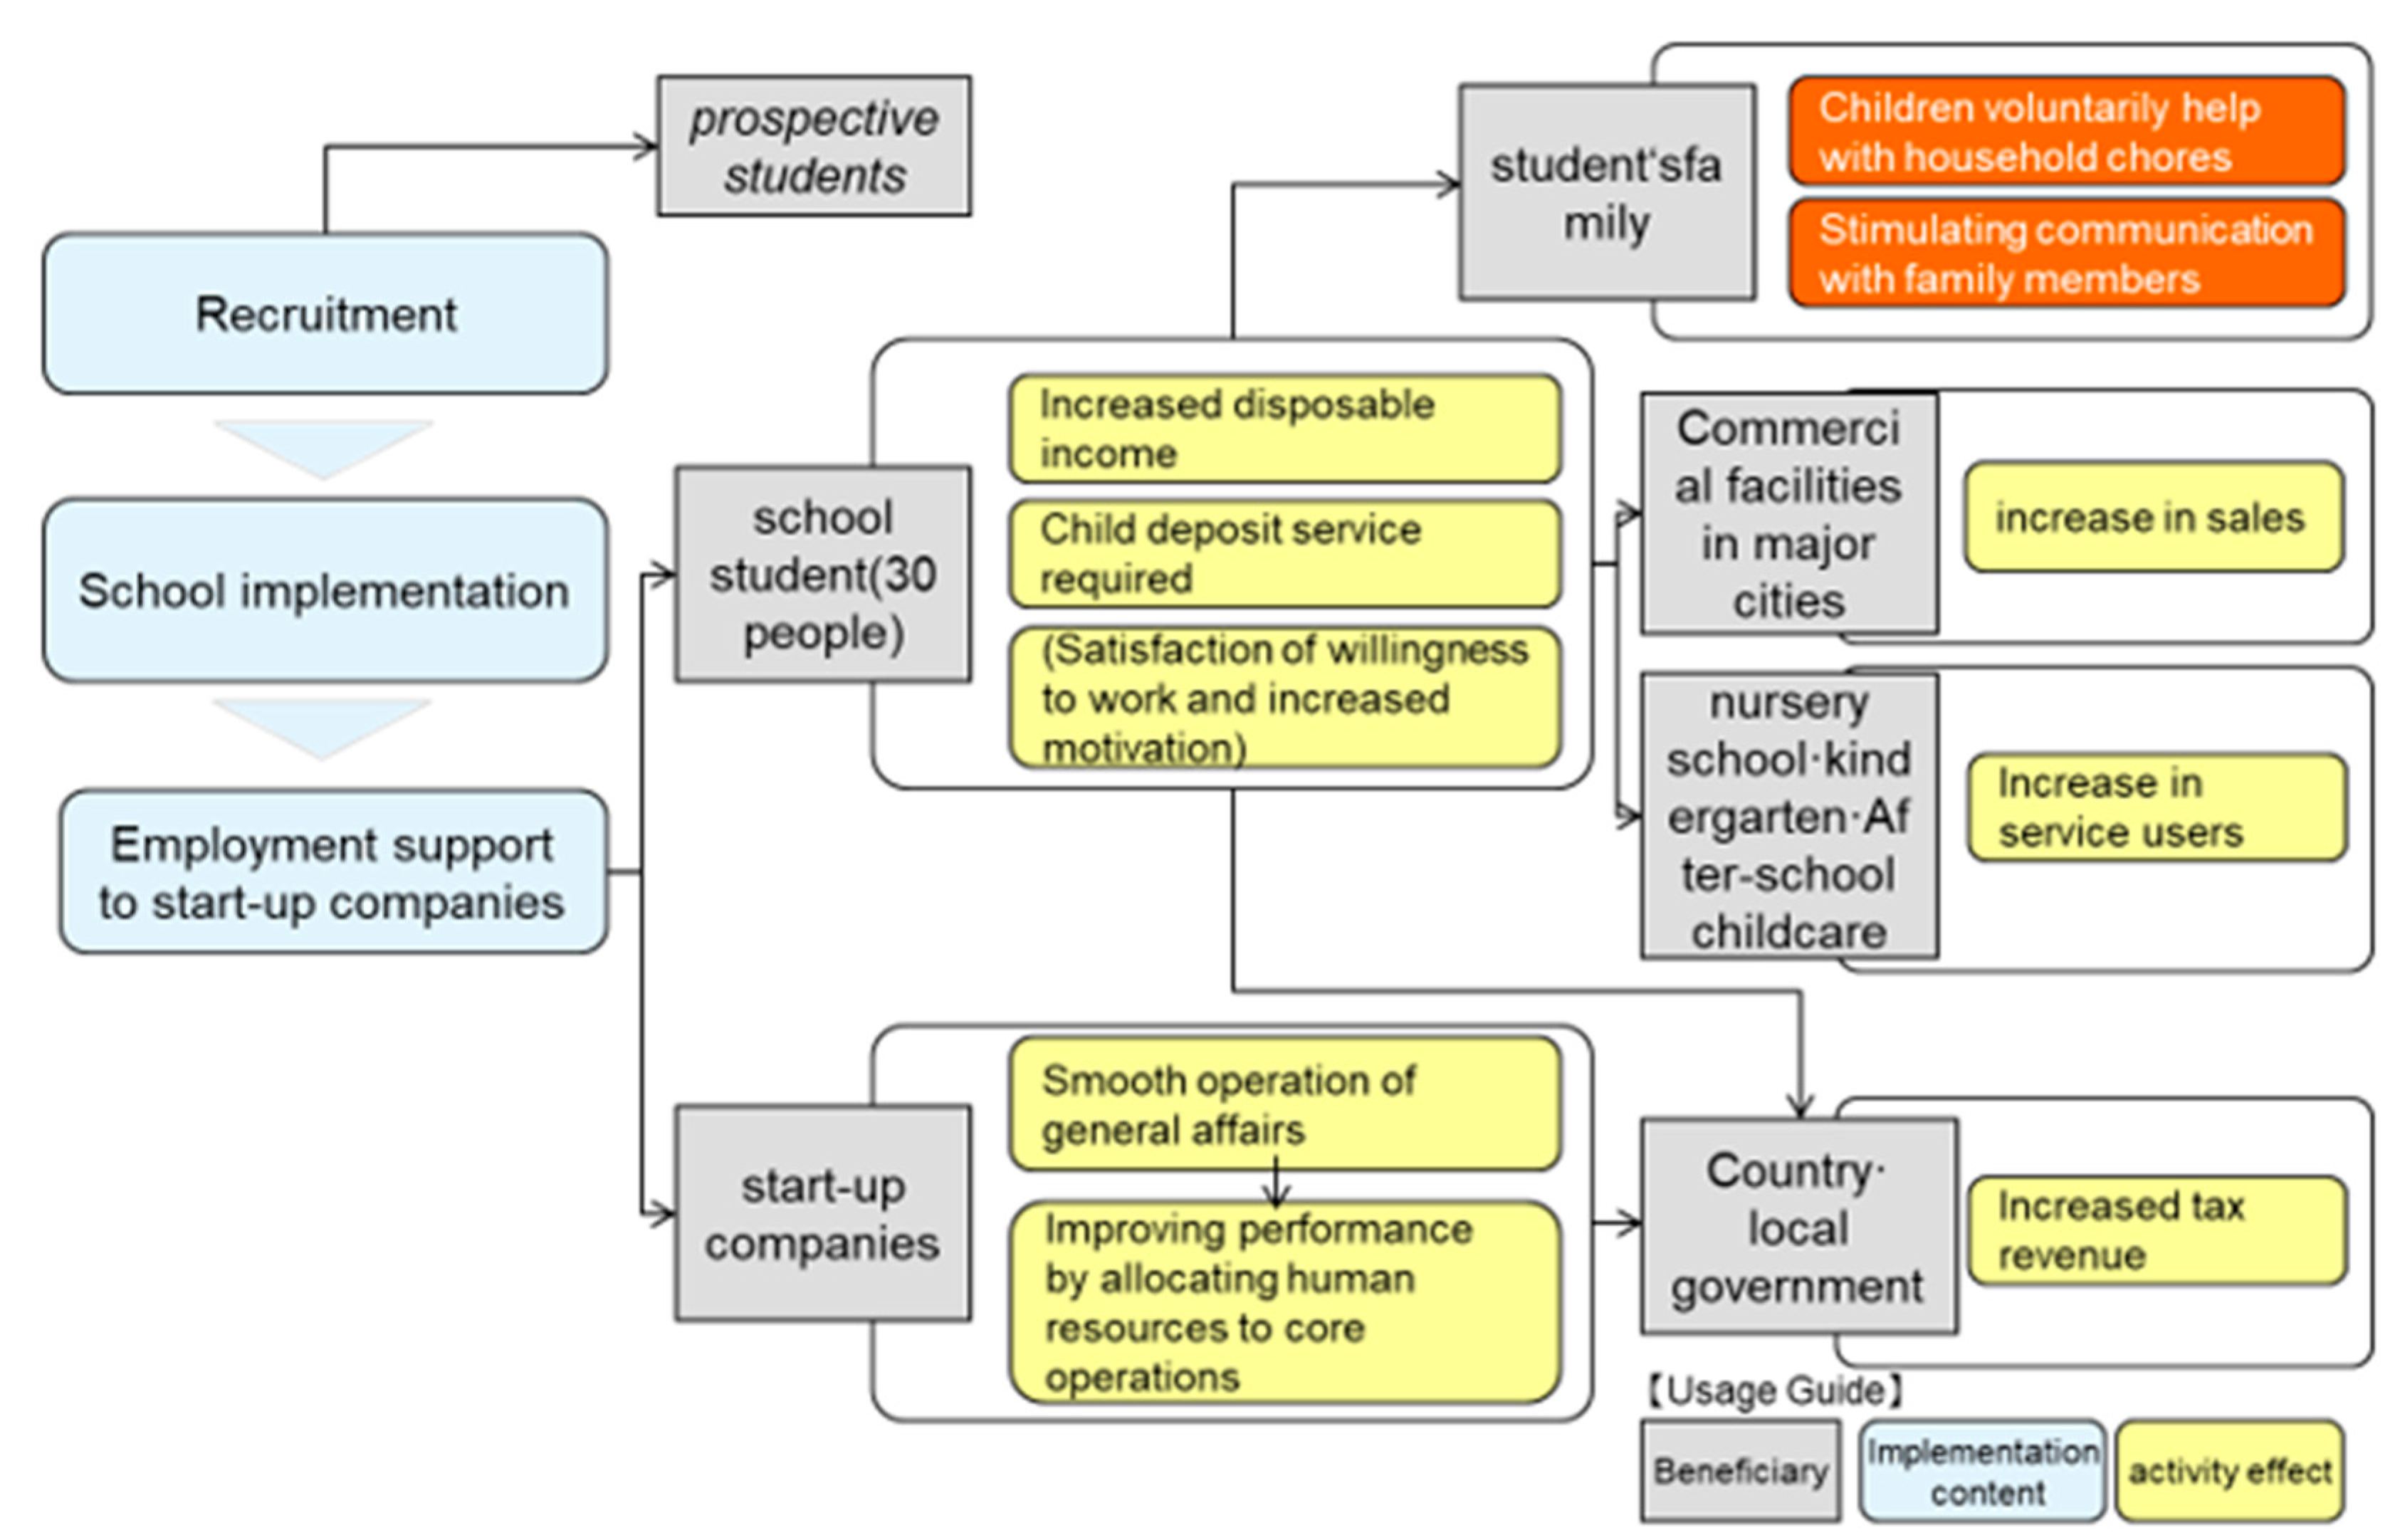

Table 1.
Four survey steps.
| Survey steps | Survey target | Survey item | |
|---|---|---|---|
| (1) | Interviews with women who have re-employed after career training | Women who re-employed after career development (3 people) | Actual working style, amount of remuneration, usage fees for services such as childcare,$Impact on family, use of increased disposable income |
| (2) | Interview with hiring companies | Managers and personnel managers of companies that hired women who re-employed after career development (3 companies) | Work content and remuneration, work that became possible as a result of new hiring$Changes in business performance after being hired to the present, changes in the work environment and culture after being hired$Points to note when using restricted employees, etc. |
| (3) | Questionnaire to grasp the current situation of start-up support, partial hearing [Kyushu 7 prefectures] | Start-up support staff in each prefecture | Details of measures to support startups, rate of startups, human issues and needs of founders ascertained, possibility of expanding startups by potential working women |
| (4) | Questionnaire and interviews to understand the current status of women’s employment support [Kyushu 7 prefectures] | Person in charge of the labor administration section and gender equality section of each prefecture | Details of employment support measures for women, results and trends of employment support$Status of grasping the needs of potential working women who wish to work (actual numbers, overview of needs, issues)$The Possibility of Business Expansion by Potential Working Women |
Source: Created by the author.
Table 2.
Results of interviews with re-employed women and accepting companies.
| School Participants = re-employed | Company (i) | Company (ⅱ) | Company (ⅲ) | Average, etc. | ||
| Monthly disposable income (yen) | 60,000 | 80,000 | 100,000 | 80,000 | A-1 | |
| Increased willingness to work | 80% | 100% | 100% | 93% | A-2 | |
| Family household help | ・Husband has started to cooperate in household by hanging the laundry out to dry.・Children were able to stay at home for short periods after starting work | increase | A-3 | |||
| Family Communications | ・Course participant began to discuss their work with her spouse, enabling them to have conversations as equals.・Course participants started talking to their children about their work. | activation | A-4 | |||
| Amount of shopping and service consumption | ・Increase in eating out (1-2 times ⇒ 4 times/month)・Inviting children to entertainment venues (like Disneyland) for their daughters’ birthdays・Buying more gifts for friends.・Since re-entering the workforce, she spend 70,000-80,000/month on family travel and eating out.・Plans are in place to fund childcare costs in the immediate future. | increase | A-5 | |||
| Childcare (yen) | 0 | 9,500 | 3,000 | 4,167 | A-6 | |
| ・Started to use extended day care.・Use of extended care at kindergartens, and in-house childcare on days when extended care is not available. | increase | A-7 | ||||
| Company (i) | Company (ⅱ) | Company (ⅲ) | Average, etc. | |||
| Hiring companies | Reduced workload for general administration staff | 30% Reduction in workload⇒40% for new initiatives | Amount of workload related to general affairs 100% ⇒ 20%. | Contributed to a reduction in proposal writing work of 100% ⇒ 30% =Contributed to a 70% reduction in workload. | Median value, etc. | B-1 |
| Business reduction rate ⇒⇒ | 30% | 80% | 70% | 70% | B-2 | |
| Initial equipment costs = cost of on-boarding new staff (yen) | 0 | 110,000 | 115,000 | 75,000 | B-3 | |
| Other benefits (e.g., in-house childcare, mobile phone allowance, etc.) (yen) | 0 | 160,000 | 82,000 | 80,667≒80,000 | B-4 | |
Table 3.
prefectures of Kyushu.
| \prefecture | Fukuoka | Saga | Nagasaki | Kuma$moto | Oita | Miyazaki | Kago$shima | Total$Amount |
|---|---|---|---|---|---|---|---|---|
| A Number of non-working women for childcare reasons | 43,300 | 5,500 | 8,100 | 10,700 | 8,700 | 6,000 | 12,000 | 94,300 |
| B Number of outplacement women employment support program providers | 10,066 | 480 | 2,821 | 76 | 100 | 1,263 | 36 | 14,842 |
| C Estimated target (25-44 years old) Note 1 | 176,453.6 | 19,221.5 | 35,880.2 | 44,337.6 | 31,651.4 | 26,525.7 | 44,273.6 | 378,343.6 |
| D Percentage of providers (B/C) | 5.7% | 2.5% | 7.9% | 0.2% | 0.3% | 4.8% | 0.1% | 3.9% |
| Number of non-working women raising children that can be reached (A*D) | 2,470 | 137 | 637 | 18 | 27 | 286 | 10 | 3,586 |
| Number of school sessions required Note 2. | 82 | 4 | 21 | 1 | 1 | 9 | 1 | 119 |
Note 1) The number of providers includes all unemployed women in some local governments, but here we assume that the targets are women aged 25 to 44. Note 2) Of the unemployed female population in each prefecture, the population aged 25 to 44, who are most likely to be child-rearing females, is calculated by multiplying the number of unemployed women by age by prefecture by age group. value estimated by a contractor). Note 3) Capacity is 30 people, less than capacity is also held once. Note 4) Due to rounding to the nearest whole number, the sum of each prefecture may not match the total. Source) Created by the author based on the 2012 Employment Status Basic Survey, Statistics Bureau, Ministry of Internal Affairs and Communications.
Table 4.
School operating expenses.
| Investment(input) | |||||
|---|---|---|---|---|---|
| 1.Mamawork Institute. | |||||
| labour cost | Total operating hours$(in hours) | Unit price$(Yen/hour) | Number of events/year | Subtotal$(Yen) | |
| office staff | 240 | 1,000 | 119 | 28,560,000 | |
| Research Staff | 150 | 2,000 | 119 | 35,700,000 | |
| direct project cost | Number of implementations$(times) | Unit price$(Yen/hour) | Subtotal$(Yen) | ||
| Lecturer fees | 14 | 20,000 | 119 | 33,320,000 | |
| childcare charge | 1 | 115,000 | 119 | 13,685,000 | |
| Flyer production and distribution costs | 1 | 155,000 | 119 | 18,445,000 | |
| Total input costs of the Mamawork Institute | 129,710,000 | ||||
| 2. Prefectures | |||||
| labour cost | Total operating hours$(in hours) | Unit price$(Yen/hour) | Number of events/year | Subtotal$(Yen) | |
| Cooperative implementation of leaflet distribution | 3 | 2,356 | 119 | 841,092 | |
| Cooperation with publication in e-newsletters | 1.0 | 2,356 | 119 | 280,364 | |
| Venue Adjustment Service | 0.5 | 2,356 | 119 | 140,182 | |
| direct project cost | Number of implementations$(times) | Unit price$(Yen/hour) | Subtotal$(Yen) | ||
| venue charge | 1 | 17,390 | 119 | 2,069,410 | |
| Prefecture input costs (total) | 3,331,048 | ||||
| Total input cost | 133,041,048 | ||||
Table 5.
Expected effects of activities (first year, per subject).
| primary beneficiary | resulting effect | Calculation formula/basis | First year social value (yen) |
|---|---|---|---|
| school student | Increase in disposable income (salary income) | Hearing result average value 80,000 yen/month (=Table 2-A-1) x 12 months | 960,000 |
| Increased willingness to work through school attendance | 59,000 yen (alternative index) x 93%* (=Table 2-A-2) for a similar distance learning course | 55,067 | |
| Families of school students | Increased voluntary domestic help time for children and partners | 40,093 yen/month x 12 months using a housekeeping agency once a week x 2 hours. | 481,116 |
| Activation of communication with family members | Family counseling 10,000 yen/session is used once a month ×12 months estimated. | 120,000 | |
| start-up company | Reduction of the burden on general affairs staff in relation to workload | Calculate the acceptance rate of 4 hours of overtime work per day due to general affairs work for personnel earning 200,000/month as 70% of the median interview result (=Table 2-B-1) :$200,000/8 hours x 1.25 × 4 hours x 70% x 12 months | 1,050,000$ |
| Increased revenue due to hiring of school students and streamlining of general affairs operations. | The increas in revenue is assumed to be 1,000,000 yen/year, of which 15% is the effect of streamlining general affairs. | 150,000$ | |
| Increase in equipment costs required when hiring school students | Interview result average 75,000 yen/first year (=Table 2-B-2) | -75,000$ | |
| Increased cost burden of various allowances when hiring school students | Benefits such as cell phone expenses and in-house childcare, etc. $interview results average(=Table 2-B-3) | -80,000 | |
| National/local government | Increase in income tax revenue | Disposable income as a result of hearing is 80,000 yen/month. income rises 1.3% per year. | 0 |
| Increase in resident tax revenue | Disposable income as a result of hearing is 80,000 yen/month. If income increases by 1.3%/year, 5,915 yen will be generated after 3 years.。 | 0 | |
| Increase in corporate tax revenue | Calculated as revenue increase of 1 million yen x tax rate of 22% x contribution of general affairs personnel of 15%, assumed to increase by 0.5% from the second year onwards | 33,000 | |
| Commercial facilities in major cities in the prefecture | Increase in per capita purchases due to higher income of school students | Calculated as consumption increase of 10,000 yen/month x 70% x 12 months. | 84,000 |
| Nursery School/Kindergarten | Increase in childcare hours (childcare) | Calculated as the average usage amount for extended childcare based on interview results of 4,167 yen/month x 12 months (monthly amount = Table 2-A-6) | 50,004 |
| After-school childcare facility | Increase in childcare hours (school-age childcare) | Calculated as usage fee of 7,000 yen/month x 12 months | 84,000 |
Note 1) It is assumed that the project effect will occur “after all the students of the school are employed at the start-up company at about the same time”. Note 2) It is assumed that all school students work for different companies. Note 3) Numbers rounded off to the nearest whole number. Source) Created by the author based on interviews, statistical data, etc.
Table 6.
Total project effect (1st to 4th years).
| (Unit: Yen) | ||||
| 1st year | 2nd year | 3rd year | 4th year | |
| Annual value (yen) | 10,129,563,672 | 10,306,399,151 | 10,560,035,388 | 10,680,510,336 |
| Cumulative value (yen) | 10,129,563,672 | 20,435,962,823 | 30,995,998,211 | 41,676,508,547 |
| Invested capital (yen) | 133,041,048 | - | - | - |
| SROI value (yen) | 76.1 | 153.6 | 233.0 | 313.3 |
Source) Created by the author based on estimation results.
Table 7.
Assumed effects of activities (SROI 1st to 4th years, reference values).
| 1.Effects on the school participant herself (assuming that the child in her care will be of primary school age from the third year of employment) | |||||||||||||||
| indicator | Value of change(Yen) | Discount rate(%) | Rate of increase/reduction per year | Year 1 | Year 2 | Year 3 | Year 4 | ||||||||
| Increase in disposable income (salary income) | 960,000 | 0% | 1.3% | 960,000 | 972,001 | 984,152 | 996,455 | ||||||||
| Increased willingness to work compared to before attending the school | 59,000 | 93% | 0% | 55,067 | 0 | 0 | 0 | ||||||||
| Per school student | 1,015,067 | 972,001 | 984,152 | 996,455 | |||||||||||
| 3,586 $prospective trainees | 3,640,029,067 | 3,485,595,931 | 3,529,169,860 | 3,573,288,514 | |||||||||||
| 2.Effects on households of school students | |||||||||||||||
| indicator | Value of change(Yen) | Discount rate(%) | Rate of increase/reduction per year | Year 1 | Year 2 | Year 3 | Year 4 | ||||||||
| Increased voluntary household help from children and partners | 481,116 | 0% | 0% | 481,116 | 481,116 | 481,116 | 481,116 | ||||||||
| Activating communication with families | 120,000 | 0% | 0% | 120,000 | 120,000 | 120,000 | 120,000 | ||||||||
| Per school student | 601,116 | 601,116 | 601,116 | 601,116 | |||||||||||
| 3,586 prospective trainees | 2,155,601,976 | 2,155,601,976 | 2,155,601,976 | 2,155,601,976 | |||||||||||
| 3. Effects on start-ups | |||||||||||||||
| indicator | Value of change(Yen) | Discount rate(%) | Rate of increase/reduction per year | Year 1 | Year 2 | Year 3 | Year 4 | ||||||||
| Reduced workload for general administration staff | 1,500,000 | 70% | 0% | 1,050,000 | 1,050,000 | 1,050,000 | 1,050,000 | ||||||||
| Increase in corporate profits | 1,000,000 | 15% | 0.5% | 150,000 | 157,500 | 165,375 | 173,644 | ||||||||
| Increased equipment costs | -75,000 | 0% | 0% | -75,000 | 0 | 0 | 0 | ||||||||
| Increased costs of various allowances | as shown on the right | 0% | 0% | -80,000 | -80,000 | -80,000 | -80,000 | ||||||||
| Per school student | 1,045,000 | 1,127,500 | 1,135,375 | 1,143,644 | |||||||||||
| 3,586 prospective trainees | 3,747,370,000 | 4,043,215,000 | 4,071,454,750 | 4,101,106,488 | |||||||||||
| 4. Effect on national and local governments | |||||||||||||||
| indicator | Value of change(Yen) | Discount rate(%) | Rate of increase/reduction per year | Year 1 | Year 2 | Year 3 | Year 4 | ||||||||
| Increased income tax revenue/per capita | as shown on the right | 0% | 0% | 0 | 0 | 0 | 0 | ||||||||
| ResidentsTax revenue increase/per capita | as shown on the right | 0% | 0% | 0 | 0 | 5,915 | 7,146 | ||||||||
| Per school student | 0 | 0 | 5,915 | 7,146 | |||||||||||
| 3,586 prospective trainees | 0 | 0 | 21,211,986 | 25,623,851 | |||||||||||
| 5.Effect on national and local governments | |||||||||||||||
| indicator | Value of change(Yen) | Discount rate(%) | Rate of increase/reduction per year | Year 1 | Year 2 | Year 3 | Year 4 | ||||||||
| Increase in corporate tax revenue per start-up company | 220,000 | 15% | 0.5% | 33,000 | 34,650 | 36,383 | 38,202 | ||||||||
| Annual number of companies established/3213 | 106,024,286 | 111,325,500 | 116,891,775 | 122,736,364 | |||||||||||
| 6. Effects of activities envisaged to be brought to commercial premises and nursery schools, kindergartens and childcare centres in major cities. | |||||||||||||||
| indicator | Value of change(Yen) | Discount rate(%) | Rate of increase/reduction per year | Year 1 | Year 2 | Year 3 | Year 4 | ||||||||
| Increase in shopping per capita | 120,000 | 70% | 10% | 84,000 | 92,400 | 101,640 | 111,804 | ||||||||
| Increased hours of child care (nursery school) | 50,004 | 0% | 0% | 50,004 | 50,004 | 0 | 0 | ||||||||
| Increase in child care hours (school age children) | 84,000 | 0% | 0% | 0 | 0 | 84,000 | 84,000 | ||||||||
| Per school student | 134,004 | 142,404 | 185,640 | 195,804 | |||||||||||
| 3,586 prospective trainees | 480,538,344 | 510,660,744 | 665,705,040 | 702,153,144 | |||||||||||
Source) prepared by the author based on various data.
Disclaimer/Publisher’s Note: The statements, opinions and data contained in all publications are solely those of the individual author(s) and contributor(s) and not of MDPI and/or the editor(s). MDPI and/or the editor(s) disclaim responsibility for any injury to people or property resulting from any ideas, methods, instructions or products referred to in the content. |
© 2023 by the authors. Licensee MDPI, Basel, Switzerland. This article is an open access article distributed under the terms and conditions of the Creative Commons Attribution (CC BY) license (http://creativecommons.org/licenses/by/4.0/).
Copyright: This open access article is published under a Creative Commons CC BY 4.0 license, which permit the free download, distribution, and reuse, provided that the author and preprint are cited in any reuse.


