
Submitted:
14 August 2023
Posted:
15 August 2023
You are already at the latest version
Abstract
The aim of this study was to assess precipitation (P) by analyzing data from in situ stations compared with those from solely remote sensing products CHIRP and CMORPH, with a reference station in the city. The evapotranspiration (ET) was analyzed directly using SSEBop. The region chosen for this study was the Metropolitan Area of Belem (MAB), close to the estuary of the Amazon River and the mouth of the Tocantins River. Belem is the rainiest state capital of Brazil, which causes a myriad of problems for the local population. The monthly best fit is shown here. In this study, we analyzed P and ET from local stations and compared them with those from satellite products. The main metrics RMSE, NRMSE, MBE, R2, Slope, and NS were used. For the reference station, the automatic and conventional CHIRP and CMORPH results, in mm/month, were as follows: automatic CHIRP: RMSE = 93,3, NRMSE = 0.32, MBE = −33,54, R2 = 0.7048, Slope = 0.945, NS = 0.5668; CMORPH: RMSE = 195,93, NRMSE = 0.37, MBE = −52,86, R2 = 0.6731, Slope = 0.93, NS = 0.4344; conventional station CHIRP: RMSE = 94.87, NRMSE = 0.32, MBE = −33.54, R2 = 0.7048, Slope = 0.945, NS = 0.5668; CMORPH: RMSE = 105.58, NRMSE = 0.38, MBE = −59.46 R2 = 0.7728, Slope = 1.007, NS = 0.4308. This was compared with the pixel and in situ station data. The ET ranges, on average, between 83 mm/month in the Amazonian summer and 112 mm/month in the Amazonian winter. This work concludes that, although CMORPH has a coarser resolution of 0.25° compared to CHIP’s 0.05° for MAB at a monthly resolution, the remote sensing products were reliable. SSEBop also showed reliable performance. For analyses of the consistency of precipitation time series, these products could provide more accurate information.
Keywords:
Amazon
; Belem Metropolitan region
; precipitation by remote sensing products
1. Introduction
The Amazon is the ideal and largest natural environment in which to perform geophysical science studies. Studies in the Amazon have helped determine its influence on the continental climatology and different characteristics of the hydrologic cycle. Therefore, the Amazon is of great interest to the scientific community [1,2,3], providing a thorough understanding of water and heat exchanges. Most studies focus on a global perspective, in which the Amazon has a macro-scale influence [4,5], but the Amazon also has an enormous influence on South America’s climate (3): part of the continental precipitation comes from Amazon evapotranspiration, creating a positive feedback loop in the forest (4). The Amazon also plays a key socio-economic role in the region. Moisture from the Amazon is transported from the forest areas to the main economic regions in the southwest and central parts of South America, preventing the desertification process common to these latitudes around the world [5,6,8]. On a micro-scale, urban areas are studied in relative isolation within their country’s context. In Brazil, urban areas are of national interest because of the effects of extreme climatological events on society. Metropolitan areas in the Amazon region are facing more frequent extreme events such as droughts and floods.
This study analyzes the precipitation (P) and evapotranspiration (ET) fluxes in the Metropolitan Area of Belem (MAB) within the regional and continental context of the Amazon. P and ET in situ data are assessed and compared to those from remote sensing products. P is obtained from the Climate Hazards Group InfraRed Precipitation (CHIRP) and Climate Prediction Center Morphing Technique (CMORPH) datasets. ET is obtained from the Operational Simplified Surface Energy Balance (SSEBop) product. The MAB was chosen due to its proximity to the estuary of the Amazon River and the mouth of the Tocantins River. The MAB is uniquely relevant because it is the rainiest region in Brazil. Moreover, in the past 20 years, precipitation in the MAB has increased, resulting in the intensification of extreme events (5). There have been no prior studies on the MAB characterizing ET using solely remote sensing data from SSEBop, a global product that has been influential in studies on other parts of the Amazon.
In the socio-economic context, the MAB is the second-largest metropolitan region in the Amazon. Approximately 2.5 million people live in the area, with an average Human Development Index (HDI) of 0.727, one of the lowest in Brazil (6). Changes in extreme events are additional challenges to the local communities; their characterization could help to identify adaptation mechanisms that can prevent further negative impacts on local communities.
As the rainiest region in Brazil, MAB receives a mean annual precipitation of ~2800 mm (7). Commerce in the Amazon relies mainly on rivers for the transportation of goods and people. This dependence on rivers concerns commerce participants, especially with regard to large cargo boats and transport containers (8). Furthermore, there is the concern of overflow and flooding inside the MAB region. Lastly, intense precipitation, or lack thereof, for long periods compromises all mobility in the MAB region, while also exacerbating disease occurrence in the wet season.
The MAB is located in the eastern part of the Amazon, closer to the Atlantic Ocean, but its climatology is influenced by large-scale atmospheric factors, including those in the Pacific Ocean. The climatology of the MAB is heavily influenced by the surface temperature (SST) of the Atlantic Ocean in its equatorial part, the South Atlantic convergence zone (SACZ), the Intertropical Convergence Zone (ITCZ), the El Nino Southern Oscillation (ENSO) [5,13,14], the winds blowing from the sea, and the micro-climate of the area [15,16]. Two general seasons are identified in the MAB region: the wettest season and the wet season. The wettest season starts around December and finishes in May/June, while precipitation is lower during the other season from June to December, with more convection precipitation. Precipitation decreases in this latter season, but it is not low enough to be considered a dry season. There is still a considerable amount of precipitation, characterized by short, intense periods during the day. Thus, locals consider “winter” December to May/June as the wettest season and “summer” June to December as the wet season.
The position of the MAB near the mouth of the Amazon River makes it an ideal place to study the interaction of P and ET fluxes in an urban area within the context of a large-scale ecosystem. The MAB is a heterogeneous environment with a complex mosaic of land use. There are parts that remain protected forest, transitions from forest to cerrado, and urban areas with tall buildings in between houses and farms. This work examines remote sensing data for an urban area in a region prone to floods, intense precipitation, and the intensification of extreme events, in the tropics near the equator.
2. Materials and Methods
2.1. Site Description
The MAB is part of the state of Pará, Brazil, and is almost on the equator—only 1 degree below it. Belem is the capital of Pará. The total area of the MAB is 3.566.022 km2 (11) and includes the cities of Belem, Ananindeua, Benevides, Castanhal, Marituba, Santa Bárbara do Pará, Santa Izabel do Pará, and Castanhal. The most populous cities in the region are Belem (~1.5 million), Ananindeua (540 410), and Marituba (131.500). The MAB has a dense hydrography with small rivers, channels, and creeks within the city, surrounded by the mouths of the rivers Guama, Moju, Acara, and Tocantins, and part of the mouth of the Amazon (Figure 1).
Although it is 200 km from the Atlantic Ocean, the MAB is considered a coastal area. This transition zone of forests, cerrado, and coastal types is unique in Brazil. There is dense forest bordered by replaced forest. In the Amazon Basin, the flatness of the region and the low slope of such a large area mean that it is almost considered continental, with the river basin alone being the same size as Australia (~6,000,000 km2). The MAB also has a low elevation; in the wet season, combined with tidal forces, spring tides (“marés sizígias”), and intense precipitation, this can be problematic, especially for Belem and Ananindeua.
2.2. Location of precipitation station, pluviometers, and data loggers
The majority of the precipitation stations, the pluviometers, and the data loggers are concentrated in Belem. Figure 1 shows the MAB, its elevation, the sub-basins, and the locations of the pluviometers used in this research. The reference station used is coded 00,148,002 by the National Water Agency (ANA)—hidroweb.ana.gov.br/(accessed on 15th of June of 2020). This station is operated by the National Institute of Meteorology (INMET)—https://portal.inmet.gov.br/(accessed on 17th of June of 2020), with code A201/82191 from the World Meteorological Organization (WMO), and is both conventional and automatic. The conventional station is equipped with a pluviometer; everyday, around 07:00, the precipitation for the day is manually collected. This provides 1-day precipitation data, not 24 h data. In contrast, precipitation data can be collected remotely from the automatic station and sent to satellite, Wi-Fi, mobile, or saved in a data logger. The automatic station uses electronic devices. Usually, these pluviometers are tipping buckets. The set-up of the time between registered measurements depends on the user and the purpose of the data. The automatic pluviometer that was used from INMET records the precipitation every hour, even if it does not rain. The locations of the stations used in this study and the sub-catchments are shown in Figure 2. The drainage of the MAB, surrounding tributaries, and rivers form the Baia do Guajara.
Although it is not shown in Figure 2, in the drainage data obtained from ANA, and from the high density of rivers and creeks, moving further west, the altitude increases sharply and the hydrography is higher. This can be seen in Figure 3.
Station 00,148,002 was considered the reference station. To be considered as a reference station, its records must be long and reliable. These records must include information on interstate and international transfers and sharing, critical hydrological events, water balances and availability, long-term changes and trends (12), water quality, and the regulation of water resources (http://www.cprm.gov.br/publique/Hidrologia/Monitoramento-Hidrologico-e-Hidrogeologico/Rede-Hidrometeorologica-Nacional-de-Referencia---RHNR-6589.html#:~:text=A%20Rede%20Hidrometeorol%C3%B3gica%20Nacional%20de,na%20gest%C3%A3o%20dos%20recursos%20h%C3%ADdricos (accessed on)). Besides being a complete station, there is a proper observer at the location, recording three readings per day at 09:00, 12:00, and 18:00, Brazilian time (- 3 UTC), in addition to the automatic data logger.
The support station readings are recorded by an observer between 07:00 and 08:00 daily. It is recommended that the readings be recorded at 07:00, but there is a time lag due to variability in the coordination and logistics of the local personnel. They register the daily rain in a pluviometer booklet, which is collected every three months by SGB or uploaded to social media as a mobile picture. After an initial quality control and quality assurance process, the records are included in the central database at ANA.
There are also long-term time series from in situ conventional stations (pluviometers) to be compared with data from the automatic and conventional reference station.
Table 1 shows the codes and names of the stations, their latitude and longitude, and the period compared to the satellite products.
2.3. Data analyses
Conventional observations and hourly automatic data from station 00,148,002 for the same period were used. The data from the other stations were obtained and analyzed to evaluate their concordance with the reference station data.
Table 2 provides a summary of the satellite products that were compared with the stations. However, CMORPH has a coarse resolution of ~25 km, and a square root of ~5 km.
Improvements have been made in the performance of the satellite products, which have become better and more reliable since 3B42 and 3B43 [19,20]. Additionally, pluviometers are used for correction, such as for CHIRPS [18,21,22]. Complementary analysis methods can include pluviometers, satellite products (15), and modelling. We opted for the first two options.
For the automatic station 00148002, 11.3% of the daily data were registered as “NaN” values. On the other hand, the conventional station had only one gap in 2017.
Table 3 presents the number of precipitation days and the seasonality of the rainfall in Belem. These data are representative as the reference station is located in this city. As the objective of this work was to check complementary information and assess it, we opted to not fill the gaps in the records.
With this amount and number of days of precipitation, and as there is no correction in the remote sensing products, we opted to use the following statistical metrics to ensure confidence in the analyses. The metrics used to evaluate the models were the root-mean-square error (RMSE) (Equation (1)), the normalized root-mean-square error (NRMSE) (Equation (2)), the mean bias error (MBE) (Equation (3)), the coefficient of determination (r2) (Equation (4)), the slope (Equation (5)), and the Nash–Sutcliffe (NS) coefficient (Equation (6)).
Equation (1) assesses the square root of the errors to avoid the positive and negative deviations from canceling each other out. Equation (2) aids in the comparison of RMSE values by normalizing them to the coefficient of variance. Equation (3) indicates the estimation of the model. Equation (4) calculates the coefficient of determination, which describes the model fitting with a value between 0 and 1; here, 1 indicates perfect relevance, which is rare. Equation (5) gives the steepness of the line, which indicates whether the model is over- or underestimating the values. In Equation (6), the Nash–Sutcliffe coefficient is obtained by dividing the variance into the time series.
In addition, the stations were assessed via traditional methods, such as double mass analysis, to review the data consistency.
3. Results
3.1. Precipitation
This study uses visualization and metrics to compare the support stations to the reference station. Methods, such as double mass, show simple concordance between the precipitation data in the surroundings. In this section, we present plots for each selected in situ station validated against CMORPH and CHIRP. The metrics are shown in each figure and in Table 3. The main type of precipitation is convection rainfall, and as observed in Table 3, rain occurs almost every day in the region.
The models vs. stations are analyzed for each month and year in the scatter plots; a closer inspection, per day, was available for 00148002, but this is not a reasonable increment to consider. It is shown for further improvements.
Using many metrics is important to properly discuss and evaluate ~5 and ~25 km pixels versus a single station in a metropolitan region, with buildings, urban heat, and local temperature differences, where there is mostly convection precipitation. The convection resolution can be captured by the whole area, but not always by the pluviometer.
Figure 4 shows the monthly and yearly plots for the support stations (00147007, 00148001, 00148003, and 00148012). The monthly results are better, while the yearly data are too scattered. The metrics for the monthly remote sensing products show better performance and are quite similar. CHIRP and CMORPH alone, without station correction, show good results for the monthly analyses. Station 00,148,001 from EMBRAPA gave the best fit, even though it had fewer records due to its shorter period of available records. CHIRP presented better results than CMORPH.
The tipping bucket pluviometers performed similarly across the support stations, as shown in Figure 3. The stations 00,148,001 (EMBRAPA) and 00,148,002 (INMET) are alike in their results, forming one of the better-correlating pairs of stations. The results are good, and CHIRP presented better outcomes than CMORPH. The monthly data are acceptable, but the yearly data are inferior.
The conventional pluviometer has a superior outcome and fewer unsatisfactory data records compared to CHIRP and CMORPH. Unlike the daily data from the pluviometer, the remote sensing products did not capture the day-by-day precipitation, as shown in Figure 6.
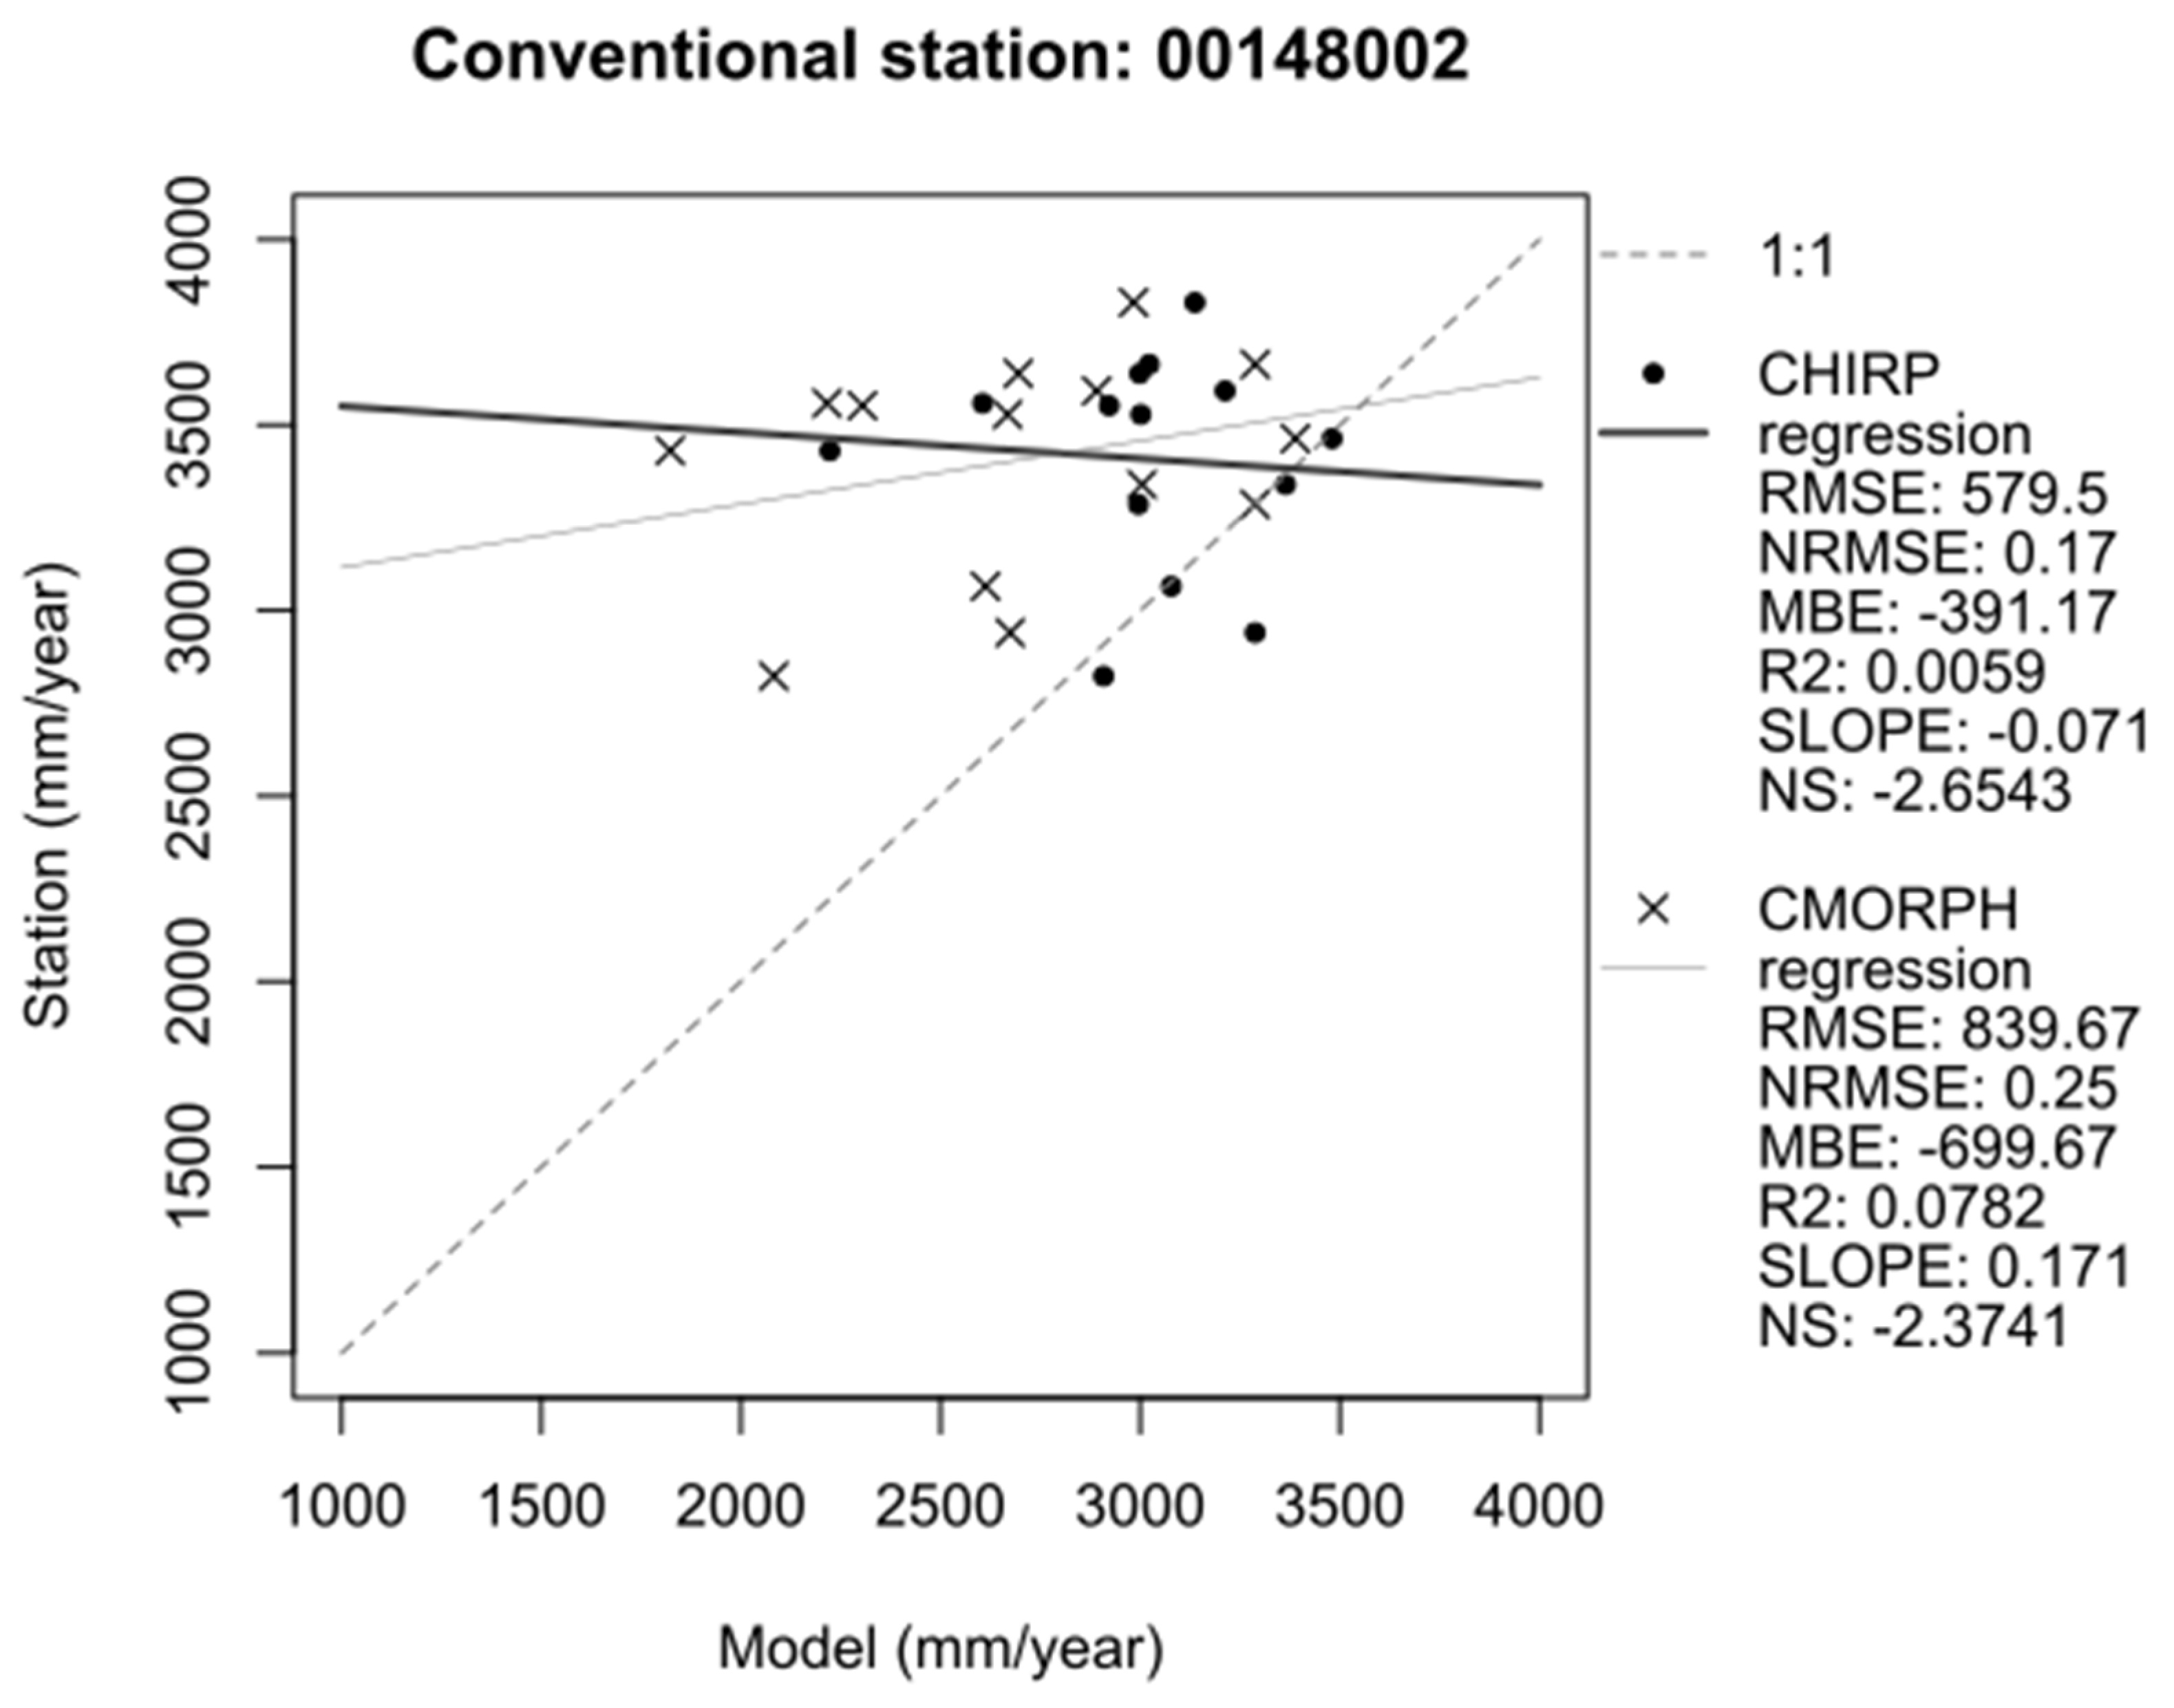
Figure 7 presents the metrics and a comparison with the conventional station for CHIRP and CMORPH, as in Figure 4, Figure 5 and Figure 6. The results are satisfactory and suitable for unique precipitation remote sensing products. The MAB is prone to convective precipitation throughout the year. However, when the daily results shown in Figure 6 are accumulated on a monthly basis, the precipitation is better captured and registered. This is in contrast with the daily and yearly values shown in Figure 8.
Figure 5.
Monthly and yearly automatic pluviometer data for reference station 00147002.
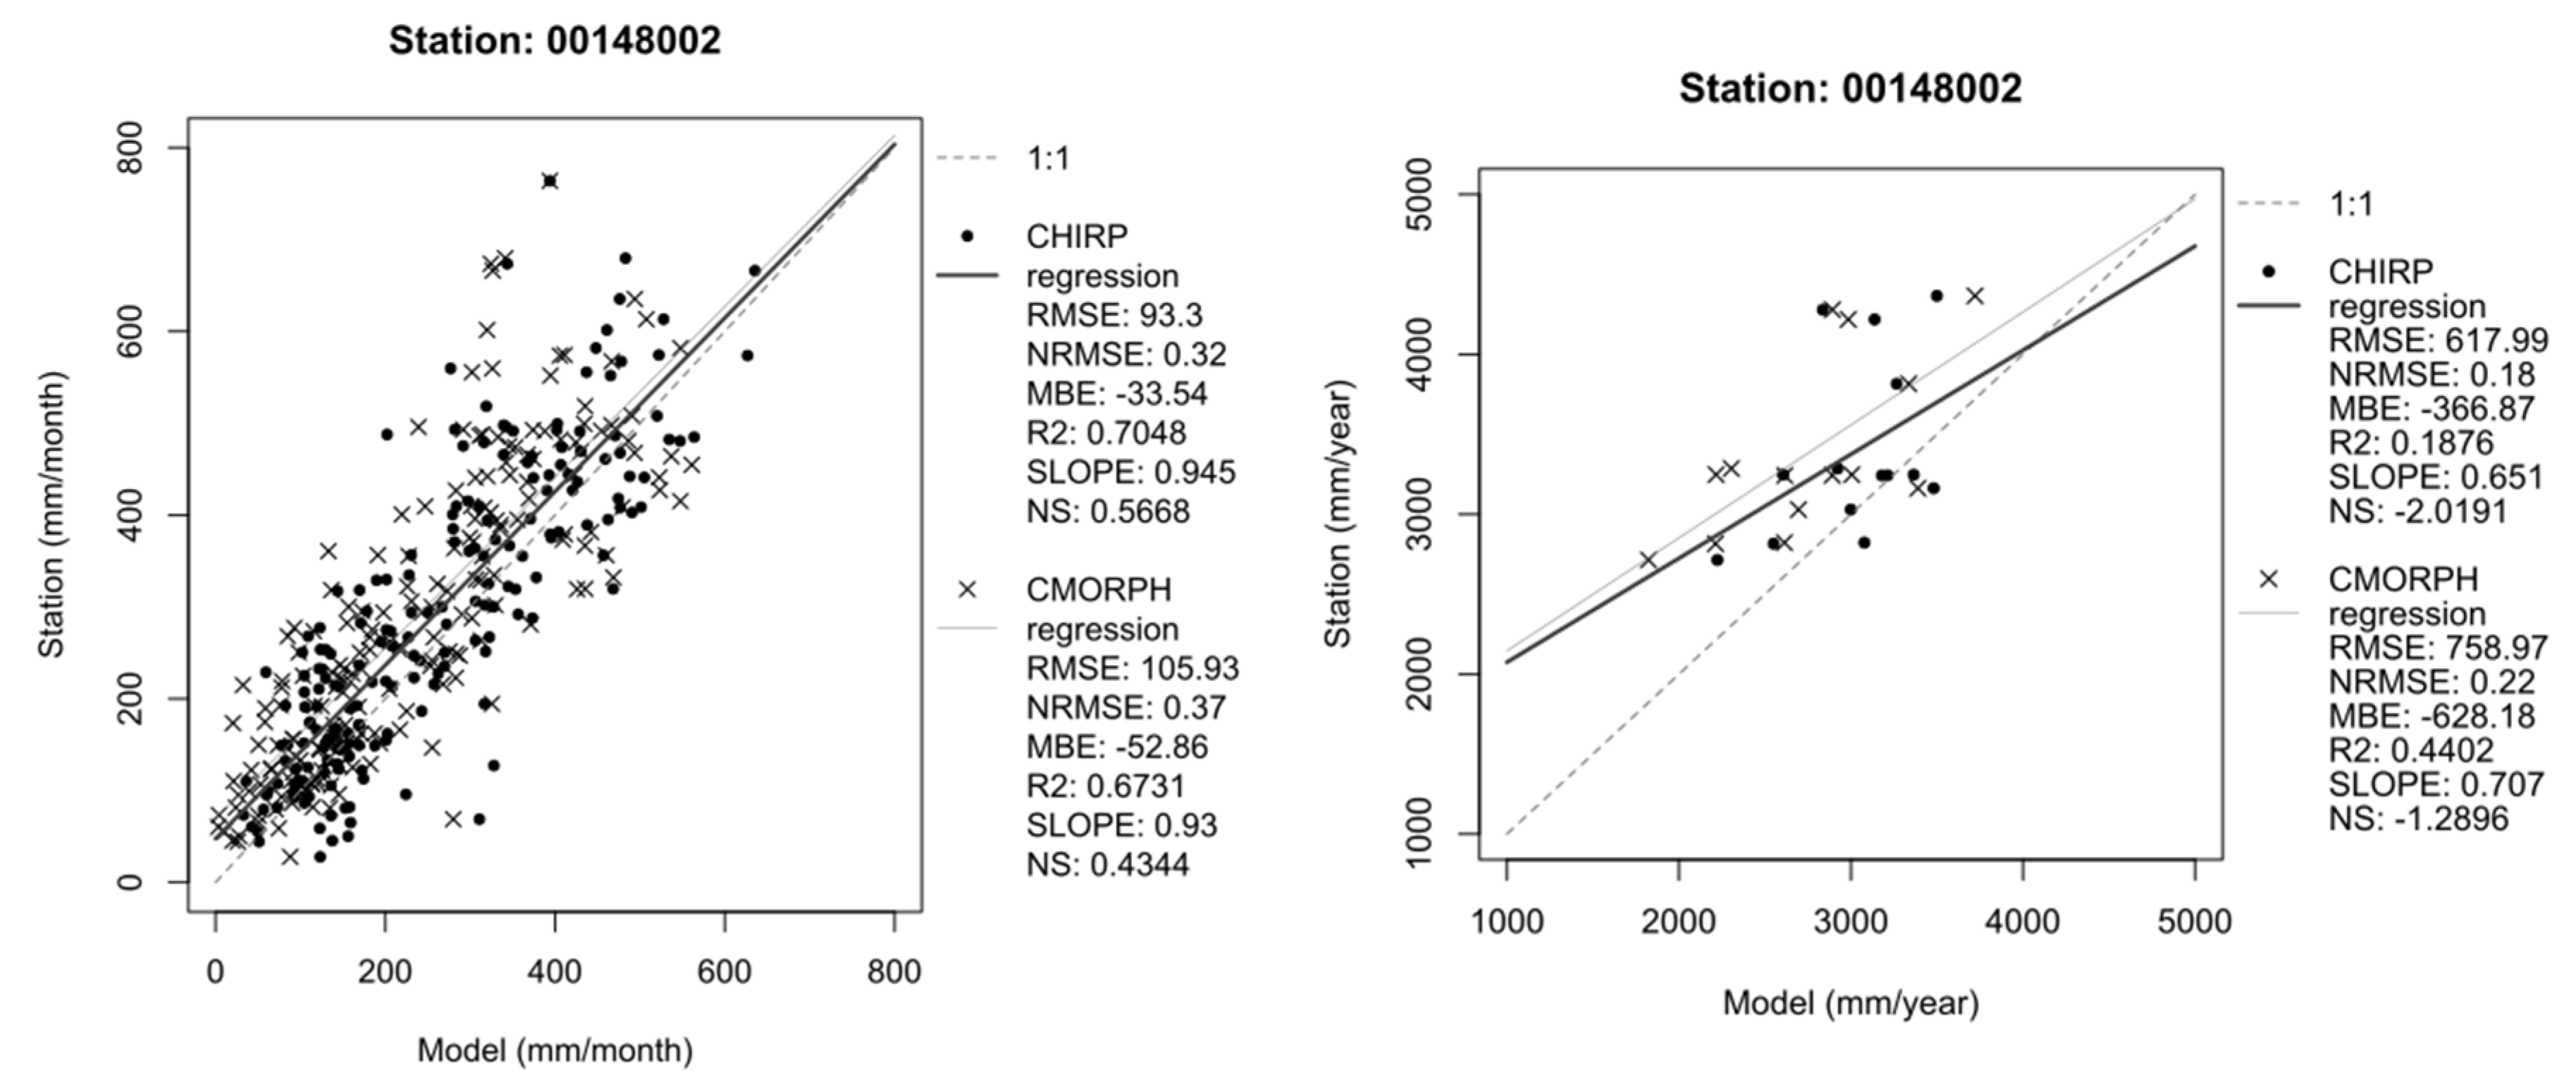
Figure 6.
Daily data from station 00148012.
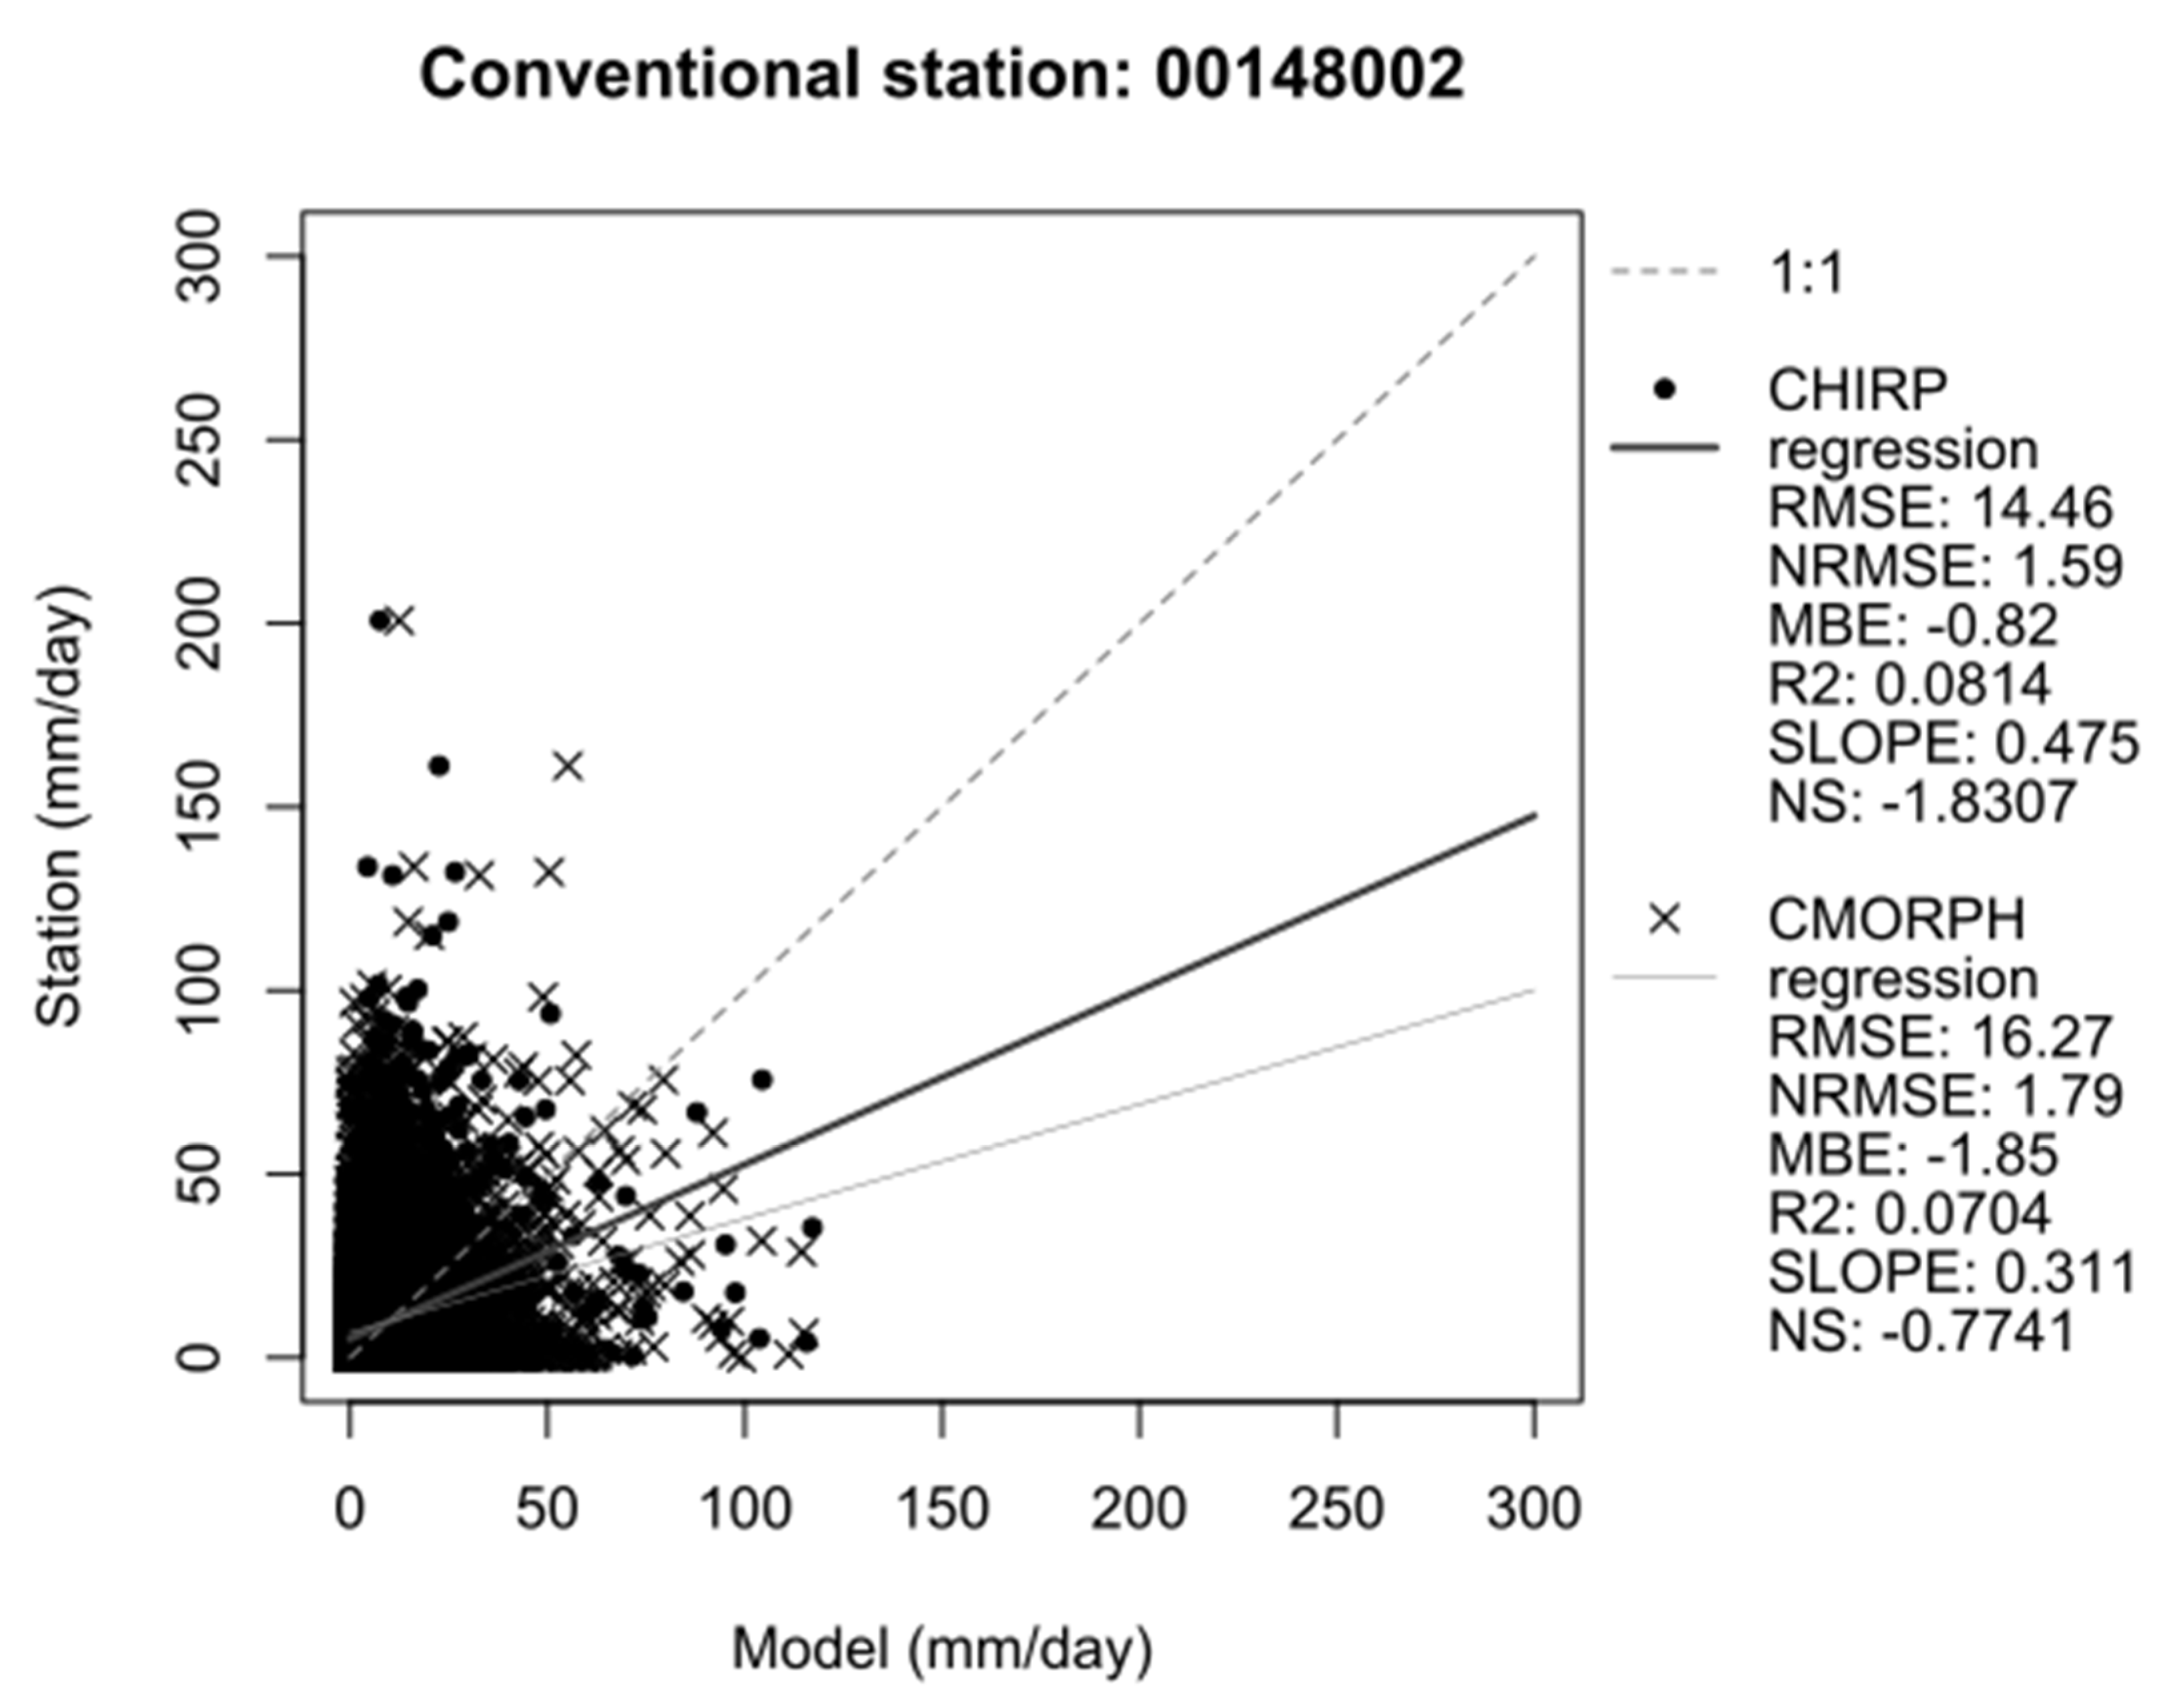
Figure 7.
Monthly data from station 00148012.
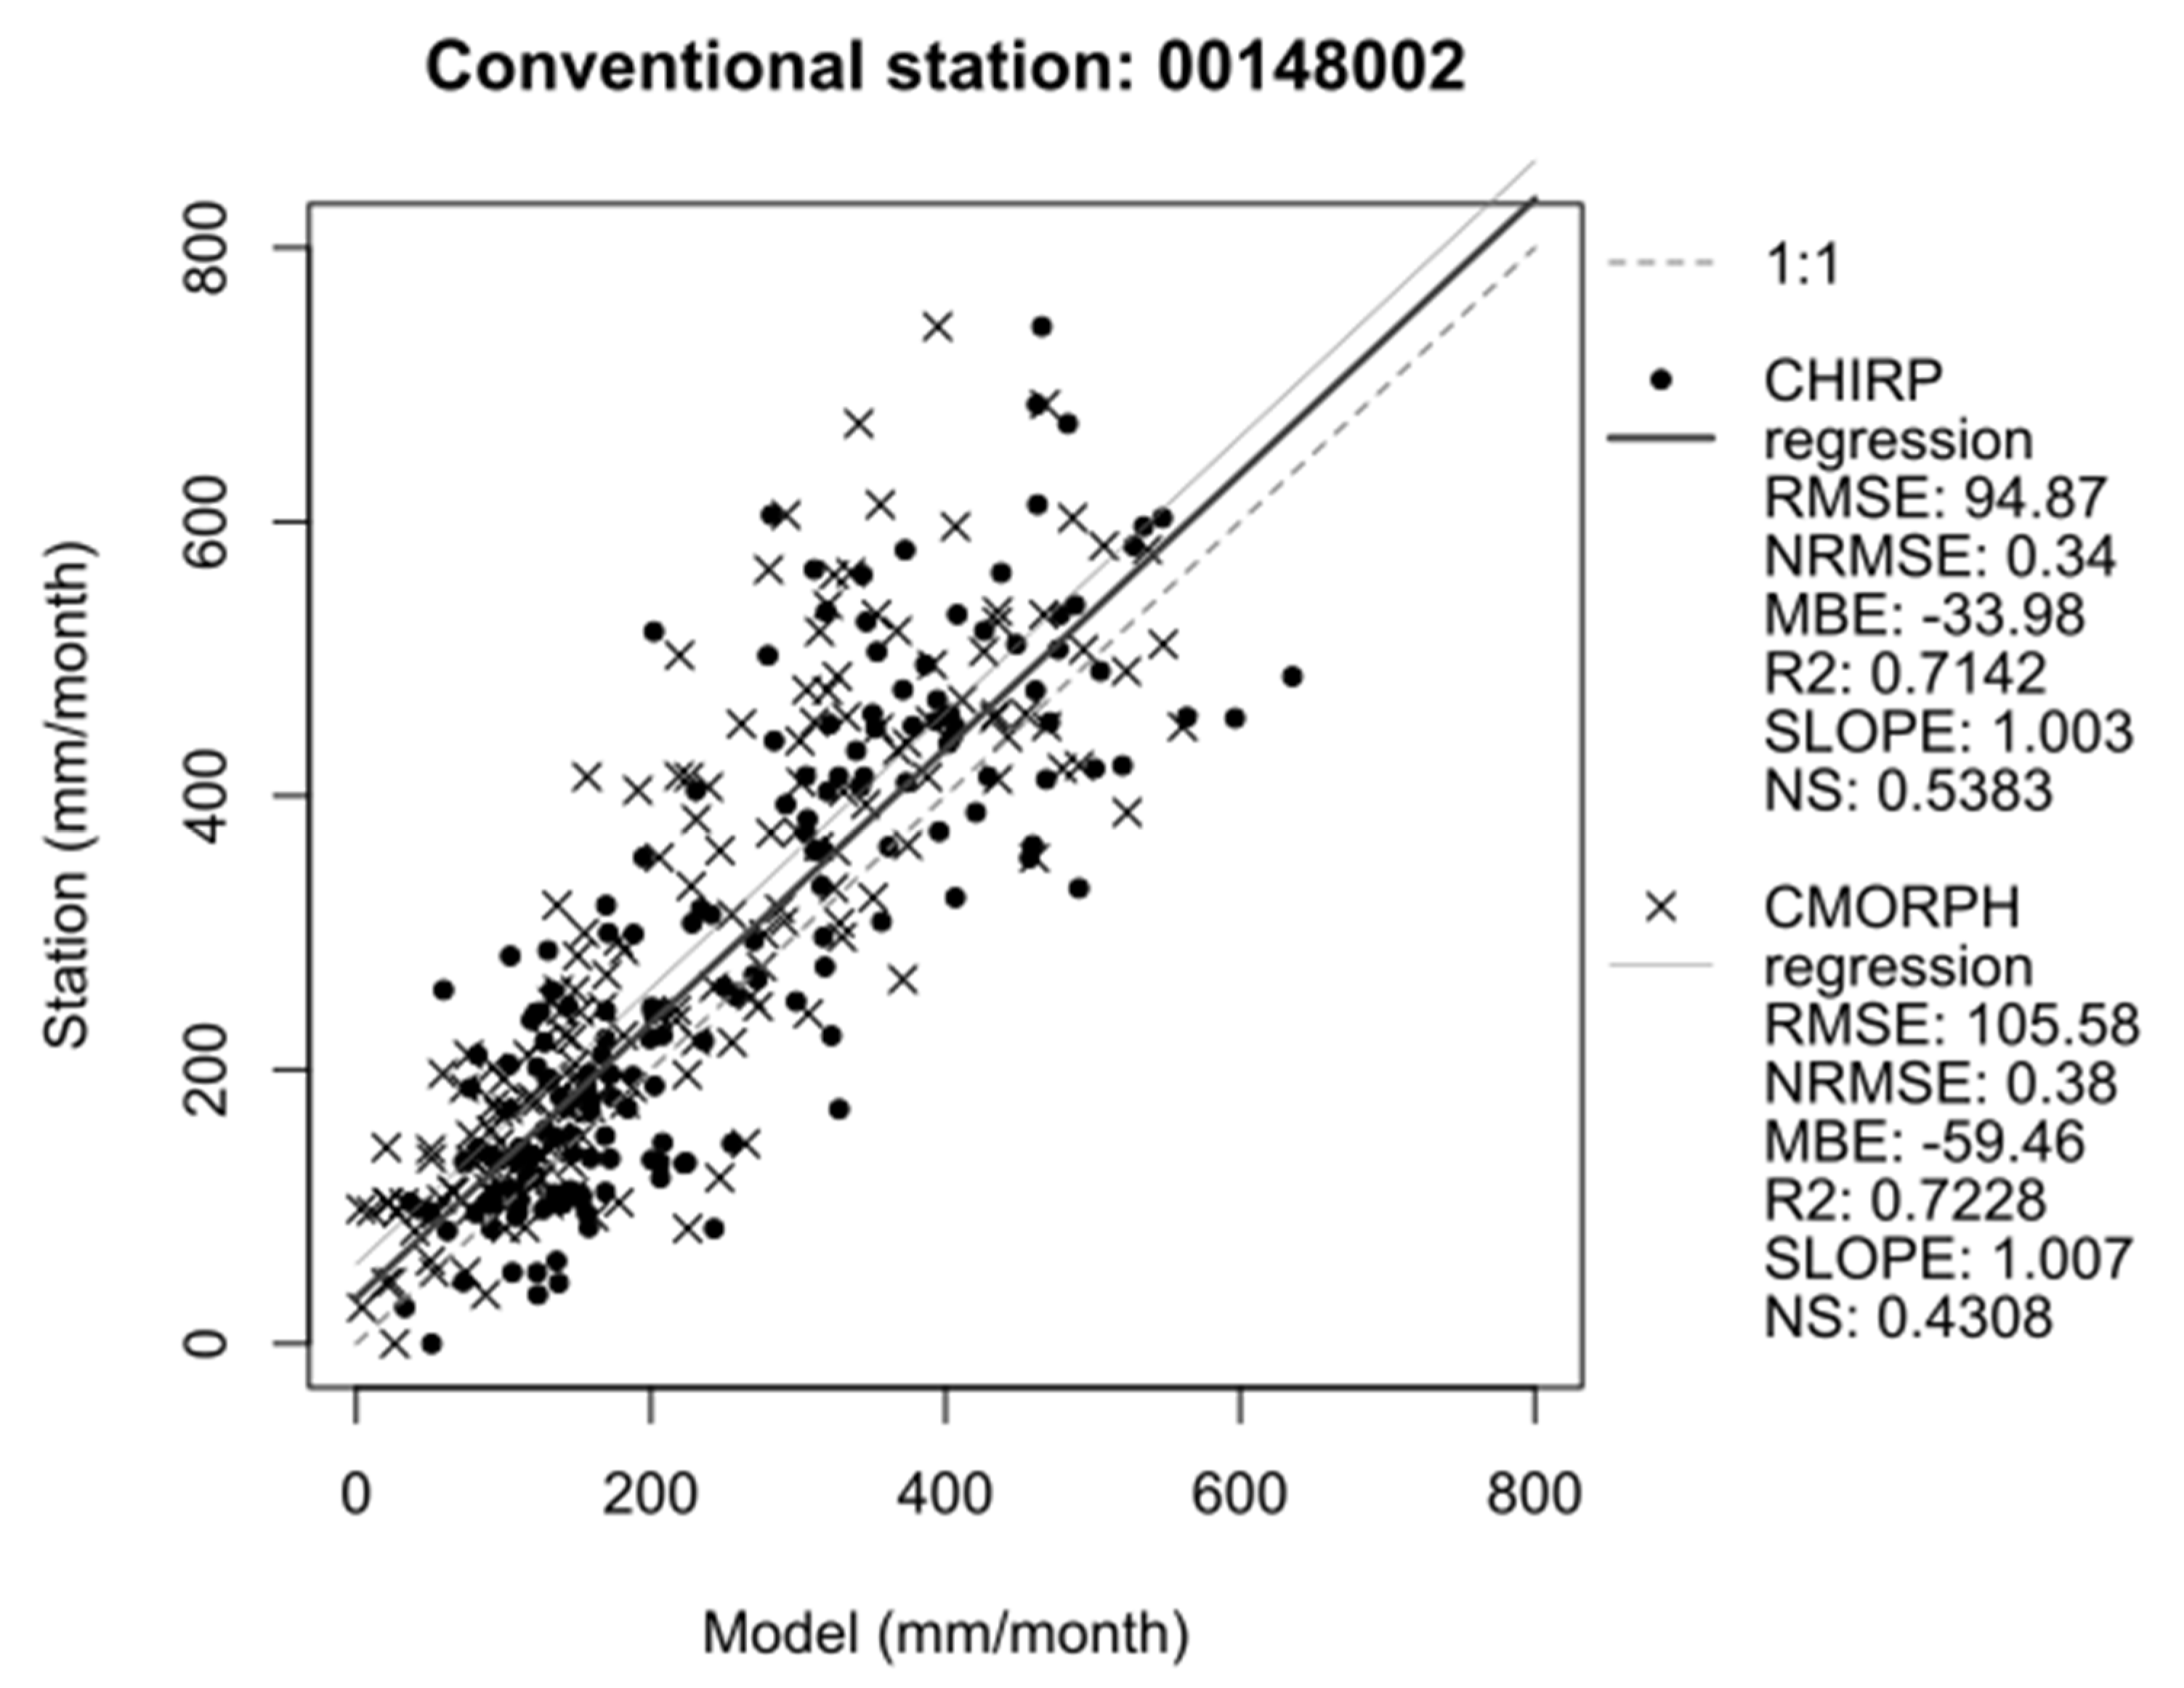
Figure 8.
Yearly data from station 00148012.
The daily time series in Figure 9 seems to have an outlier in 2005, but this precipitation was the highest rainfall ever recorded in Belem. It was between 24 and 25 April 2005, and 200.8 mm was observed (hidroweb.ana.gov.br (accessed on 14th of June of 2020)).
The precipitation in the MAB is convection rainfall, but it is consistent. The precipitation is almost considered continuous, with water pouring down throughout the day.
In the monthly time series, a tiny decrease was observed across the months . The small slope of −0.0006 is in contrast to that in Figure 10, which shows yearly data.
The ENSO system plays a huge role with the SACZ and wind blowing from the sea into the MAB (12). These driving forces influence climatic events for the whole Amazon. However, in Belem, which is closer to the sea, the effect of the winds is captured. The ENSO system depends on events in the Pacific Ocean. El Nino results in less precipitation in the Amazon, while La Niña results in more precipitation. The intensity of the ENSO influences results in greater extremes and intensification. The yearly data show the contrast with Figure 10. In 2017/2018, the total amount of rainfall was 3800 mm/year.
When the precipitation from the automatic station 01,480,002 is divided into hourly values, the rainiest hours are 15:00 and 16:00. The precipitation starts smoothly around 13:00, increases until 16:00, and then decreases around 21:00, in Figure 11.
The averages for 15:00 and 16:00 are almost the same, and the box plot also shows this equivalence. However, at 16:00, the maximum value is higher; the rainiest hour also occurs at 16:00, with more than 60 mm/hour.
3.2. Evapotranspiration (ET) by SSBEop
SSBEop was used to analyze the evapotranspiration (ET) (https://earlywarning.usgs.gov/fews/(accessed on)). SSEBop is provided by USGS, as detailed in Table 4, and was created by Gabriel Senay (16–18). SSEBop is ready to use, and version 5 contains data from 2003 up to 2019. Its use was validated with flux towers in the Amazon by Paca et al. [23,27–29] with suitable results.
Table 4 shows the monthly ET at 0.01°~1 Km spatial resolution, which was considered acceptable for this work to evaluate ET for the MAB.
Figure 12 presents analyses of the maximum ET compared to the mean ET. The maximum values probably occur closer to the shores of the MAB, in the city of Belem, where the landscape is flat. The average values show the same pattern as the maximum values.
The pattern of the average ET values in the MAB is coherent with that of values in the greater Amazon [27,30–33]. There is a low spike in 2010, which can be considered an error after closer analyses; the values otherwise range between 70 and 120 mm/month, as shown in Figure 13.
The overview of all the mean ET values over the MAB shows a pattern similar to that for precipitation in Figure 14, starting in December/January and ending in May/June. When precipitation is occurring, the vegetation releases less ET. During the season with less rain, there is greater ET.
4. Discussion
The Metropolitan Area of Belem has two divisible parts—the west is flatter and the east is higher. However, the remote sensing products CHIRP and CMORPH showed similar precipitation. The lower resolution of CMORPH, at approximately 25 km, could not explain the whole precipitation of the region. CHIRP, with a finer resolution of around 5 km, showed better results. Despite the fact that both showed similar results in the analyses and metrics, CHIRP developed better performance than CMORPH.
The conventional station used as the reference station showed poor results at the daily and yearly scales, as did the support stations. However, at a monthly temporal resolution, CHIRP showed a slight increase in model overestimation, with a slope of 1,003. CMORPH showed slight underestimation. Both coefficients of determination were approximately 0.72, which is very promising for solely remote sensing products. The Nash–Sutcliffe efficiency for CHIRP was equal to 0.53, and that for CMORPH was equal to 0.43. This is reasonable, sitting midway between 0 (low fit) and 1 (best fit), and it is in accordance with the other metrics. The RMSE was scattered, with the upper part more out of line than the lower part, beginning at 400 mm/month.
The station 00,148,002 (INMET) time series showed consistency during the period of study. Even the daily and monthly scales showed standard variation. The slope was −0.0006, showing slight underestimation and a decrease, which indicates an increment or decline in the precipitation. The average precipitation was 75 mm/day and 280 mm/month. Five unusually high periods of precipitation were registered, but none of them are outliers—they really did occur. The period of 24th/25th April 2005 was the rainiest, with 200.7 mm/day recorded.
However, the results from the automatic station (the tipping bucket pluviometer) were the worst compared to those from the station with an observer who manually collects the data four times a day. This could be due to a lack of calibration of the equipment or the high temperature of Belem, which is located just −1 degree in latitude relative to the equator. The results from the automatic station began to scatter at 200/month, with both slopes underestimating the time series at 0.7. The coefficient of determination was middling, at around 0.6. The NSE was equivalent.
It was hypothesized that it would rain more at night, when people do not observe precipitation but the equipment records it. The true precipitation ended up aligning with the common knowledge of the local population, with the precipitation being strongly between 14:00 and 18:00, and the rainiest hour at 16:00, for the whole period of records.
It is worthwhile to mention that the best support station was station 00,148,001 (EMBRAPA). At the monthly scale, the model NSE was around 0.7, showing good fit, with a high slope of approximately 0.8 underestimating the precipitation, and a coefficient of determination of 0.73 for CHIRP and CMORPH. The other stations showed lesser, medium values. Station 00,148,003 (Santa Isabel do Pará) showed the second-best agreement with station 00148002.
Unfortunately, for all stations, CHIRP and CMORPH performed poorly in all annual analyses, and for the reference station in daily analyses. This is a relevant aspect to consider.
The results were smaller than those for 00,148,001 (EMBRAPA), with the advantage of being more distant than 00,148,002 INMET. For consistent data, this is a valuable station due to the separation in between.
The evapotranspiration was more consistent, but there were outliers such as 0 and 287 mm/month in the maximum and minimum. This is why we opted for a closer inspection of the maximum and the mean. The average values were consistent with the area, but the whole MAB area was considered. In 2010, there was an outlier, but other years from 2002 until 2020 were consistent, with a slight increase in evapotranspiration after 2012. The variation in the mean data between 77 mm/month and 120 mm/month was already expected in the analyses. The maximum record was of 180 mm/month. What must be shown in the future is the range of the ET for each part of the MAB.
The boxplot of the average ET shows the buffer effect on vegetation: in the rainy season, less ET is released, while in the drier season, more ET is delivered. The median is also in agreement with the precipitation period. The highest ET occurs in September to November, with the highest in October. This is the same as the precipitation. The lowest median was in the interval of February to May.
Although CHIRP was not analyzed in greater detail, CHIRPS (14) has shown better performance and has been well implemented in many studies by the scientific community. CMORPH is also broadly used and is analyzed for comparison with CHIRP. Both CHIRP and CMORPH can be used as a starting point for research, or even as a complete basis, such as with CMORPH. CHIRP uses solely the remote sensing, and CHIRPS is corrected with the precipitation stations bias. That is why when CHIRPS is compared to the precipitation stations it fit almost the same (20)
This study on the MAB also relates to the environment and sanitation; according to Sistema Nacional de Informações sobre Saneamento (SNIS), 81.2% of the population go without sewage collection (2021), and 35,4% of the population do not have access to water (https://www.painelsaneamento.org.br/localidade/index?id=151 (accessed on 15th of June of 2020)). If sewage is not collected properly, the water flows straight into the drainage system, creating temporary puddles that may be small or huge. Most of the diffuse and point sewage flows into the drainage system. Because the sewage system is inefficient, and because there is only a small percentage of the city with a proper sewer system, pollution from the water after precipitation flows to channels and is dissipated in the Baia do Guajara.
Among the United Nations (UN) 17 Sustainable Development Goals (SDGs), this study embraces, in order, SDGs 6, 3, 11, and 13 (https://sdgs.un.org/goals (accessed on 15th of June of 2020)). The amount of water that enters as precipitation is the major input in the water balance, and assessing the consistency of these data, complimentary to remote sensing products, addresses SDG 6. As the sewage system is inefficient, the drainage system is overloaded and sewage flows into the rivers without any treatment, relating to SDG 13.
Given the impact on the large proportion of poor inhabitants (40,6%), and the GINI index of 0.43, contributing to SDG 3 could help mitigate this disparity (https://cidades.ibge.gov.br/brasil/pa/belem/pesquisa/36/30246?indicador=30246 (accessed on 15th of June of 2020)).
Science integrated with government and NGOs could also improve the welfare of the MAB towards meeting SDG 11. However, communication and a relationship between these are not yet mature.
5. Conclusions
The MAB is prone to rain, even in the dry season, and is divided into just two seasons: winter, from December/January, until summer, from May/June. Even in summer, which is considered the dry season, there is almost daily precipitation around 15:00 to 19:00, as shown in Figure 11. Both remote sensing products captured the pattern of the precipitation, but the results should be considered more as a first glimpse of the precipitation. If the use of a remote sensing product is required, CHIRPS is suggested.
The MAB is also susceptible to flooding due to the elevation of the terrain, the landscape, and the almost constant, high precipitation. Floods should be considered for further study. This work was intended to explore an urban area with stable precipitation, at the highest point in Brazil, in the Amazon, without peaks. The landscape here has only minor variation in altitude, from 0 to 75 m.
The solely remote sensing products showed medium to good results, but given the threshold of good analyses, the monthly basis had better results and was the focus for inspection. CMORPH and SSEBop have been the subject of many works and studies, but CHIRP requires further investigation. SSEBop can still be used with good results, but other products such as SEBAL (21) are recommended.
CHIRP achieved better results than CMORPH at all stations for precipitation at the monthly temporal resolution. SSBop presented similarly satisfactory results.
Further studies should be conducted with CHIRP, such as in CHIRPS, until both products come to a better agreement.
Author Contributions
Conceptualization V.H.d.M.P. and G.E.E.-D.; methodology V.H.d.M.P.; software development G.E.E.-D. and V.H.d.M.P.; formal analysis and investigation V.H.d.M.P., E.B.d.S., J.C.B.Q. and G.E.E.-D.; writing—original draft preparation V.H.d.M.P.; review and editing E.B.d.S., J.C.B.Q. and G.E.E.-D. All authors have read and agreed to the published version of the manuscript.
Funding
V.H.d.M.P. was funded by Companhia de Pesquisa de Recursos Minerais—CPRM/Serviço Geológico do Brasil - SGB.
Informed Consent Statement
Informed consent was obtained from all subjects involved in the study.
Acknowledgments
The authors acknowledge IHE-Delft for the use of facilities; the Climate Hazards Center at UC Santa Barbara for providing the CHIRP product and the time series; NOAA/CPC for providing CMORPH; CPRM, ANA, and INMET for providing the in situ stations’ time series; and IHE-Delft for providing the facilities for part of this study. This research was self-funded by CPRM. Our thanks to UFPA for the opportunity to use their group of study PPGCA.
Conflicts of Interest
The authors declare no conflict of interest.
Appendix A. Metrics from the Stations from CHIRP and CMORPH.
| Station | Time Scale | CHIRP | CMORPH |
| 00147007 | |||
| Metrics in mm/month | RMSE | 130.98 | 116.04 |
| NRMSE | 0.6 | 0.53 | |
| MBE | 49.54 | 19.75 | |
| R2 | 0.5112 | 0.5206 | |
| SLOPE | 0.649 | 0.709 | |
| NS | 0.386 | 0.4362 | |
| Metrics in mm/year | RMSE | 789.83 | 648.61 |
| NRMSE | 0.3 | 0.25 | |
| MBE | 536.82 | 181.87 | |
| R2 | 0.1243 | 0.103 | |
| SLOPE | 0.515 | 0.395 | |
| NS | −2.9045 | −0.8717 | |
| 00148001 | |||
| Metrics in mm/month | RMSE | 75.29 | 78.18 |
| NRMSE | 0.3 | 0.31 | |
| MBE | 9.36 | −22.97 | |
| R2 | 0.7329 | 0.7319 | |
| SLOPE | 0.855 | 0.858 | |
| NS | 0.7079 | 0.6829 | |
| Metrics in mm/year | RMSE | 217.94 | 473.21 |
| NRMSE | 0.07 | 0.16 | |
| MBE | 85.1 | −351.23 | |
| R2 | 0.4716 | 0.1007 | |
| SLOPE | 0.518 | 0.209 | |
| NS | 0.3712 | −1.2611 | |
| 00148003 | |||
| Metrics in mm/month | RMSE | 106.8 | 98.51 |
| NRMSE | 0.45 | 0.42 | |
| MBE | 29.07 | 0.45 | |
| R2 | 0.5983 | 0.5916 | |
| SLOPE | 0.704 | 0.762 | |
| NS | 0.546 | 0.5426 | |
| Metrics in mm/year | RMSE | 657.22 | 675.22 |
| NRMSE | 0.24 | 0.25 | |
| MBE | 453.29 | 94.21 | |
| R2 | 0.2555 | 0.004 | |
| SLOPE | 0.605 | 0.071 | |
| NS | −1.3307 | −1.162 | |
| 00148012—Automatic station | |||
| Metrics in mm/month | RMSE | 93.3 | 105.93 |
| NRMSE | 0.32 | 0.37 | |
| MBE | −33.54 | −52.86 | |
| R2 | 0.7048 | 0.06731 | |
| SLOPE | 0.945 | 0.93 | |
| NS | 0.5668 | 0.4344 | |
| Metrics in mm/year | RMSE | 617.99 | 758.97 |
| NRMSE | 0.18 | 0.22 | |
| MBE | −366.87 | −628.18 | |
| R2 | 0.1876 | 0.4402 | |
| SLOPE | 0.651 | 0.707 | |
| NS | −2.0191 | −1.2896 | |
| 00148012—Conventional station | |||
| Metrics in mm/day | RMSE | 14.46 | 16.27 |
| NRMSE | 1.59 | 1.79 | |
| MBE | −0.82 | −1.85 | |
| R2 | 0.0814 | 0.0704 | |
| SLOPE | 0.475 | 0.311 | |
| NS | −1.8307 | −0.7741 | |
| Metrics in mm/month | RMSE | 94.87 | 105.58 |
| NRMSE | 0.34 | 0.38 | |
| MBE | −33.98 | −59.46 | |
| R2 | 0.7142 | 0.7228 | |
| SLOPE | 1.003 | 1.007 | |
| NS | 0.5383 | 0.4308 | |
| Metrics in mm/year | RMSE | 579.5 | 839,67 |
| NRMSE | 0.17 | 0.25 | |
| MBE | −391.17 | −699.67 | |
| R2 | 0.0059 | 0.0782 | |
| SLOPE | −0.071 | 0.171 | |
| NS | −2.6543 | −2.3741 | |
References
- Nobre, C.; Sampaio, G.; Salazar, L. Mudanças climáticas e Amazônia. Ciência e Cultura 2007, 53, 6. [Google Scholar]
- Malhi, Y.; Roberts, J.T.; Betts, R.A.; Killeen, T.J.; Li, W.; Nobre, C.A. Climate Change, Deforestation, and the Fate of the Amazon. Science 2015, 319, 169–172. [Google Scholar] [CrossRef]
- Nobre, A.D. The Future Climate of Amazonia Scientific Assessment Report; 2014.
- Espinoza, J.C.; Ronchail, J.; Marengo, A.J.; Segura, H. Contrasting North – South changes in Amazon wet-day and dry-day frequency and related atmospheric features ( 1981 – 2017 ). Climate Dynamics 2018, 0, 0. [Google Scholar] [CrossRef]
- Souza, E.B.D.E.; Lopes, M.N.G.; Rocha, E.J.P.D.A.; Ricardo, J.; Souza, S.D.E.; Cunha, A.C.D.A.; et al. PRECIPITAÇÃO SAZONAL SOBRE A AMAZÔNIA ORIENTAL NO PERÍODO CHUVOSO : OBSERVAÇÕES E SIMULAÇÕES REGIONAIS COM O REGCM3 Universidade Federal do Pará ( UFPA ), Faculdade de Meteorologia ( FAMET ) e Programa de Pós-Graduação em Ciências Ambientais ( PPGCA ) Bel. 2009, 111–124.
- IBGE. IBGE. Cidades IBGE. <https://cidades.ibge.gov.br/brasil/pa/belem/panorama> Accessed 22.01.16.
- Cprm. Levantamento da Geodiversidade - Projeto Atlas Pluviométrico do Brasil - Isoetas Anuais Médias Período 1977 a 2006. 2011, 2006.
- Agência Nacional de Transportes Aquaviários - ANTAQ. Hidrovias Brasileiras; 2007. <http://scholar.google.com/scholar?hl=en&btnG=Search&q=intitle:?hidrovias+brasileiras?#1>.
- Paccini, L.; Espinoza, J.C.; Ronchail, J.; Segura, H. Intra-seasonal rainfall variability in the Amazon basin related to large-scale circulation patterns: a focus on western Amazon–Andes transition region. International Journal of Climatology 2018, 38, 2386–2399. [Google Scholar] [CrossRef]
- Silva Junior, J.A.; da Costa, A.C.L.; Pezzuti, J.C.B.; da Costa, R.F. Spatial variability of thermal comfort and social segregation of urban space in the city of Belém, PA. Revista Brasileira de Meteorologia 2013, 28, 419–428. [Google Scholar]
- IBGE. Amazônia Legal. 2020. <https://www.ibge.gov.br/geociencias/organizacao-do-territorio/estrutura-territorial/15819-amazonia-legal.html?=&t=acesso-ao-produto> Accessed 20.06.20.
- Paca, V.H.d.M.; Espinoza-Dávalos, G.E.; Moreira, D.M.; Comair, G. Variability of Trends in Precipitation across the Amazon River Basin Determined from the CHIRPS Precipitation Product and from Station Records. Water 2020. [Google Scholar] [CrossRef]
- Huffman, G.J.; Bolvin, D.T.; Nelkin, E.J.; Wolff, D.B.; Adler, R.F.; Gu, G.; et al. The TRMM Multisatellite Precipitation Analysis (TMPA): Quasi-Global, Multiyear, Combined-Sensor Precipitation Estimates at Fine Scales. Journal of Hydrometeorology 2007, 8, 38–55. [Google Scholar] [CrossRef]
- Funk, C.; Peterson, P.; Landsfeld, M.; Pedreros, D.; Verdin, J.; Shukla, S.; et al. Natuer. The climate hazards infrared precipitation with stations - A new environmental record for monitoring extremes. Scientific Data 2015, 2, 1–21. [Google Scholar] [CrossRef]
- Paca, V.H.d.M.; Espinoza-Dávalos, G.E.; da Silva, R.; Tapajós, R.; Dos Santos Gaspar, A.B. Remote Sensing Products Validated by Flux Tower Data in Amazon Rain Forest. Remote Sensing 2022, 14, 1–20. [Google Scholar] [CrossRef]
- Senay, G.B.; Budde, M.E.; Verdin, J.P. Enhancing the Simplified Surface Energy Balance ( SSEB ) approach for estimating landscape ET : Validation with the METRIC model. Agricultural Water Management 2011, 98, 606–618. [Google Scholar] [CrossRef]
- Senay, G.B.; Bohms, S.; Singh, R.K.; Gowda, P.H.; Velpuri, N.M.; Alemu, H.; et al. Operational Evapotranspiration Mapping Using Remote Sensing and Weather Datasets: A New Parameterization for the SSEB Approach. Journal of the American Water Resources Association 2013, 49, 577–591. [Google Scholar] [CrossRef]
- Senay, G.B.; Velpuri, N.M.; Bohms, S.; Demissie, Y. Understanding the Hydrologic Sources and Sinks in the Nile Basin Using Multi-Source Climate and Remote Sensing Datasets.
- Paca, V.H.d.M.; Espinoza-Dávalos, G.E.; Hessels, T.M.; Moreira, D.M.; Comair, G.F.; Bastiaanssen, W.G.M. The spatial variability of actual evapotranspiration across the Amazon River Basin based on remote sensing products validated with flux towers. Ecological Processes 2019, 8, 6. [Google Scholar] [CrossRef]
- Cavalcante, R.B.L.; Ferreira, D.B. da S.; Pontes, P.R.M.; Tedeschi, R.G.; da Costa, C.P.W.; de Souza, E.B. Evaluation of extreme rainfall indices from CHIRPS precipitation estimates over the Brazilian Amazonia. Atmospheric Research 2020, 238, 104879. [Google Scholar] [CrossRef]
- Bastiaanssen, W.G.M.; M. Meneti; R.A. Feddes; Holtslag, a a M. A remote sensing surface energy balance algorithm for land (SEBAL) 2.Validation. Journal of Hydrology 1998, 212–213, 198–212. [Google Scholar] [CrossRef]
Figure 1.
Metropolitan Area of Belem (MAB), hydrography and hypsometry.

Figure 2.
Map of the localization of the stations, hydrography, and sub-basins.
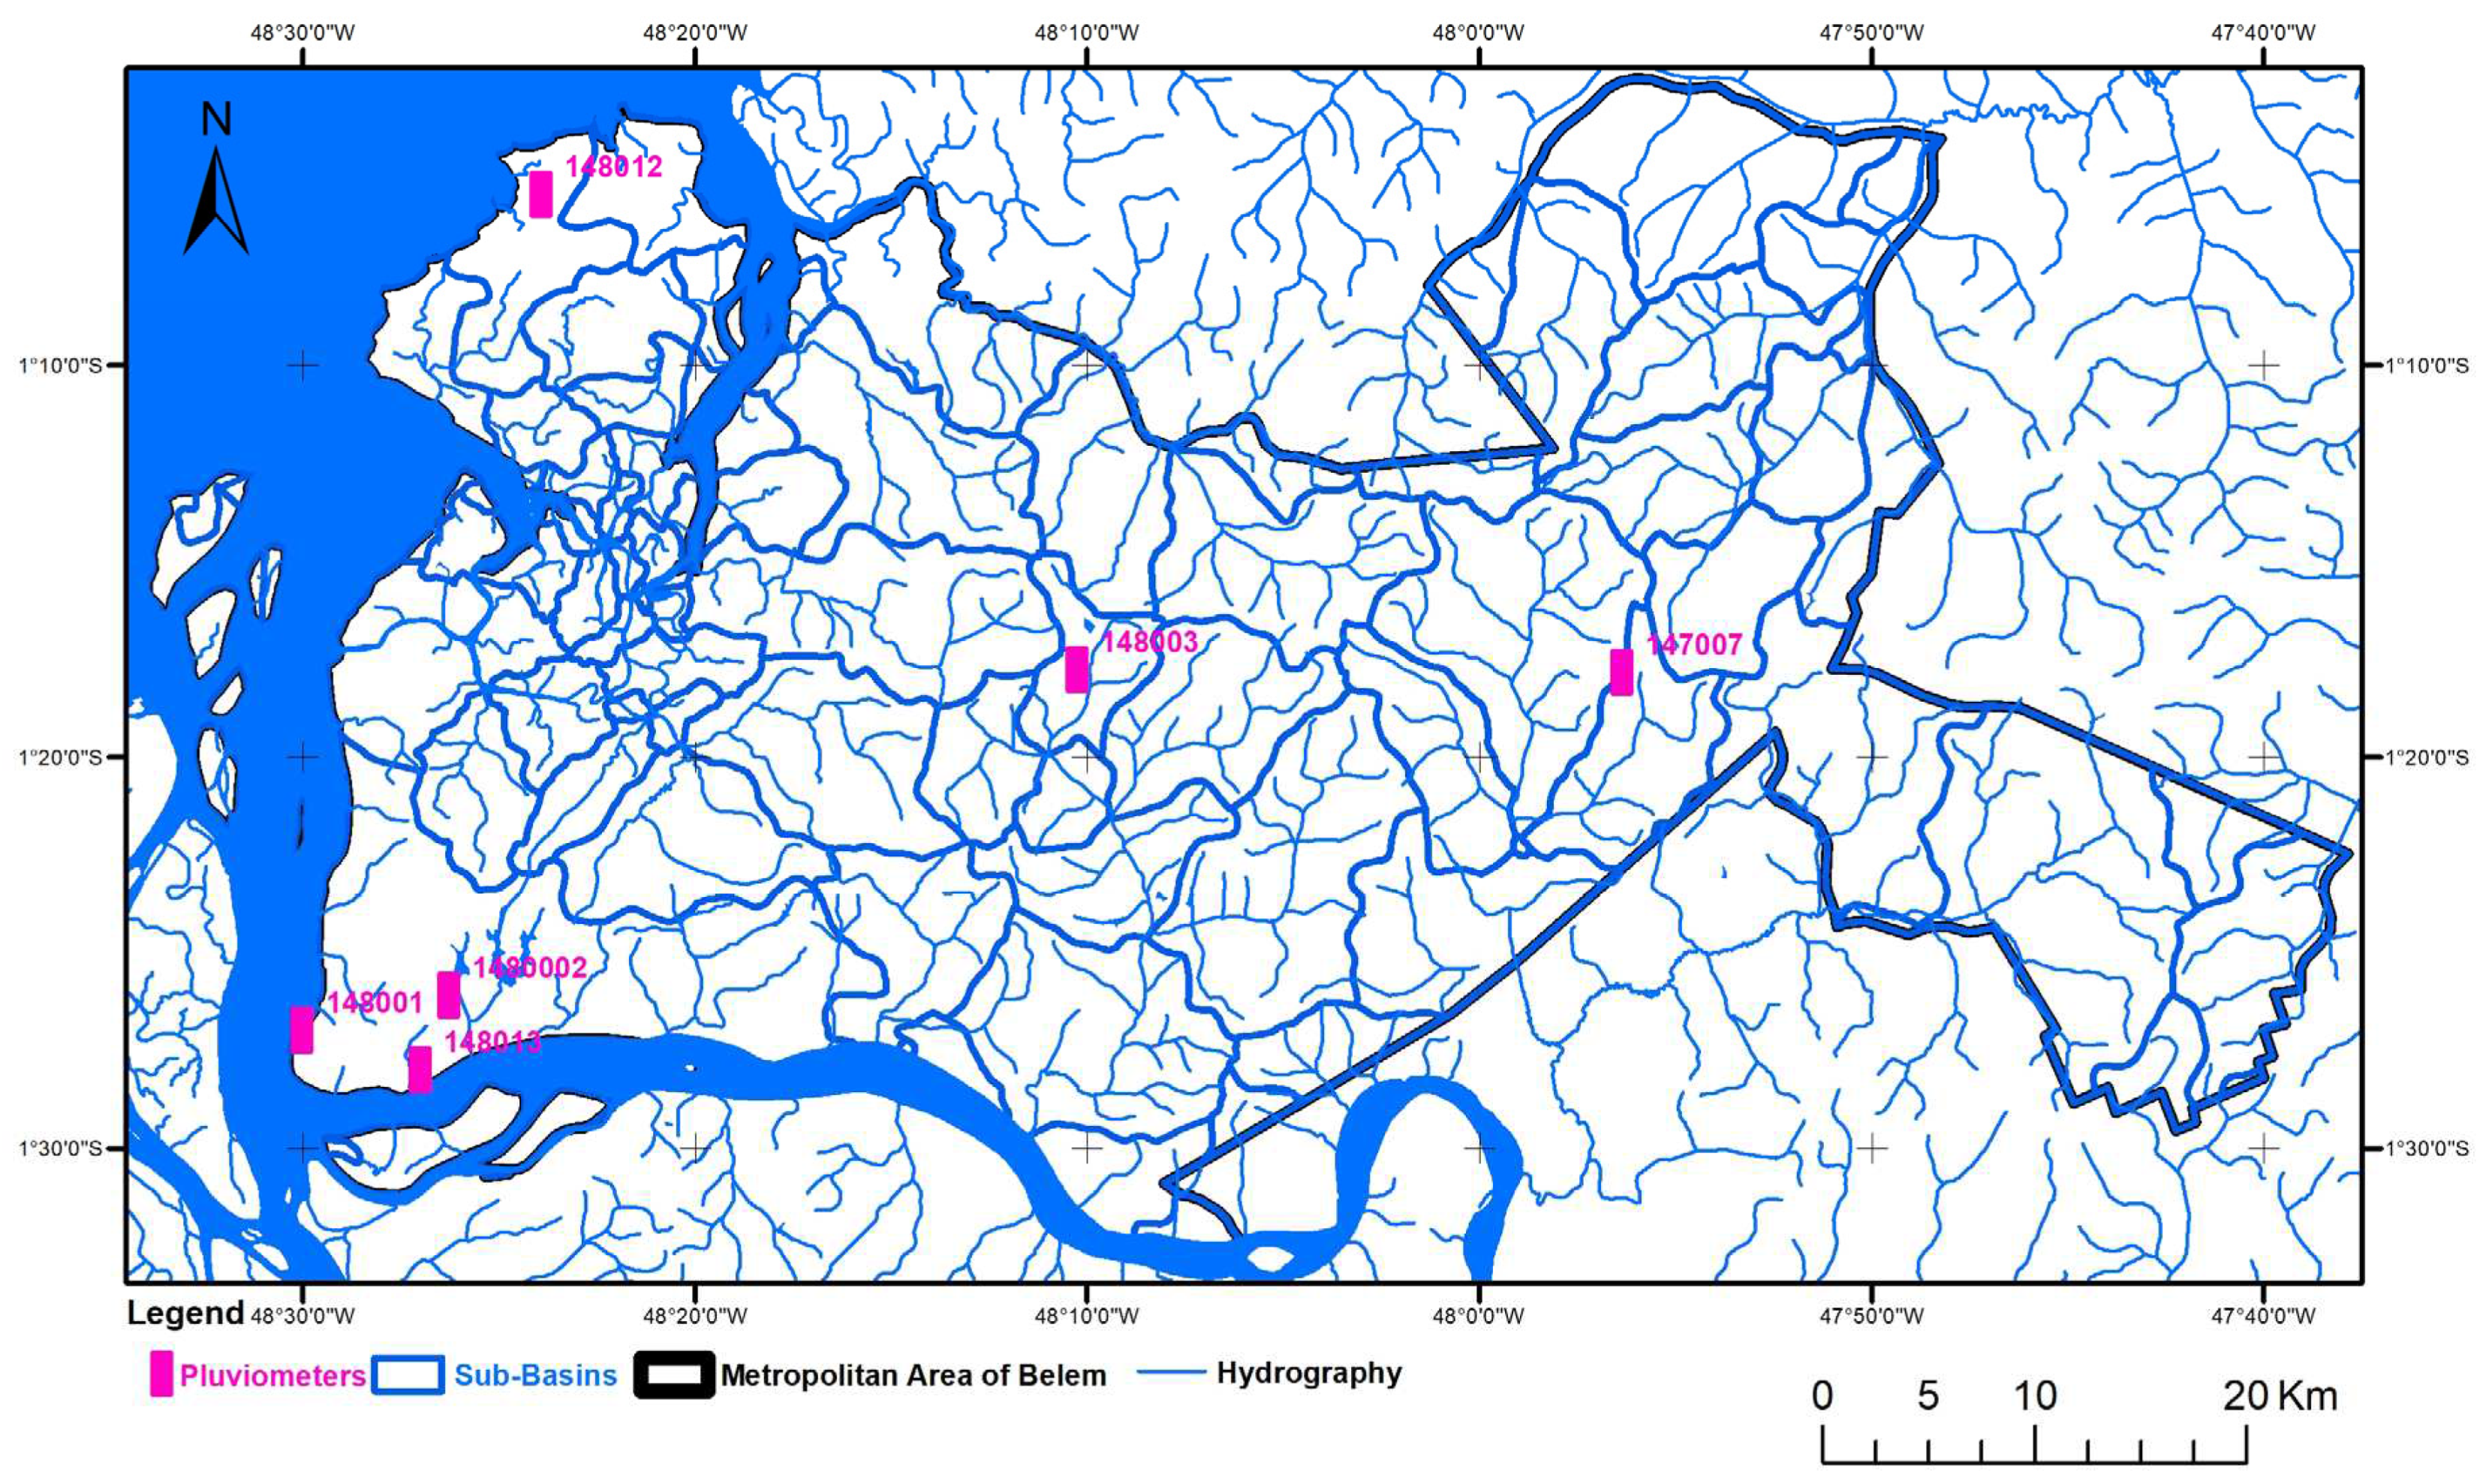
Figure 3.
Map of cities in the MAB, with Belem being the capital.
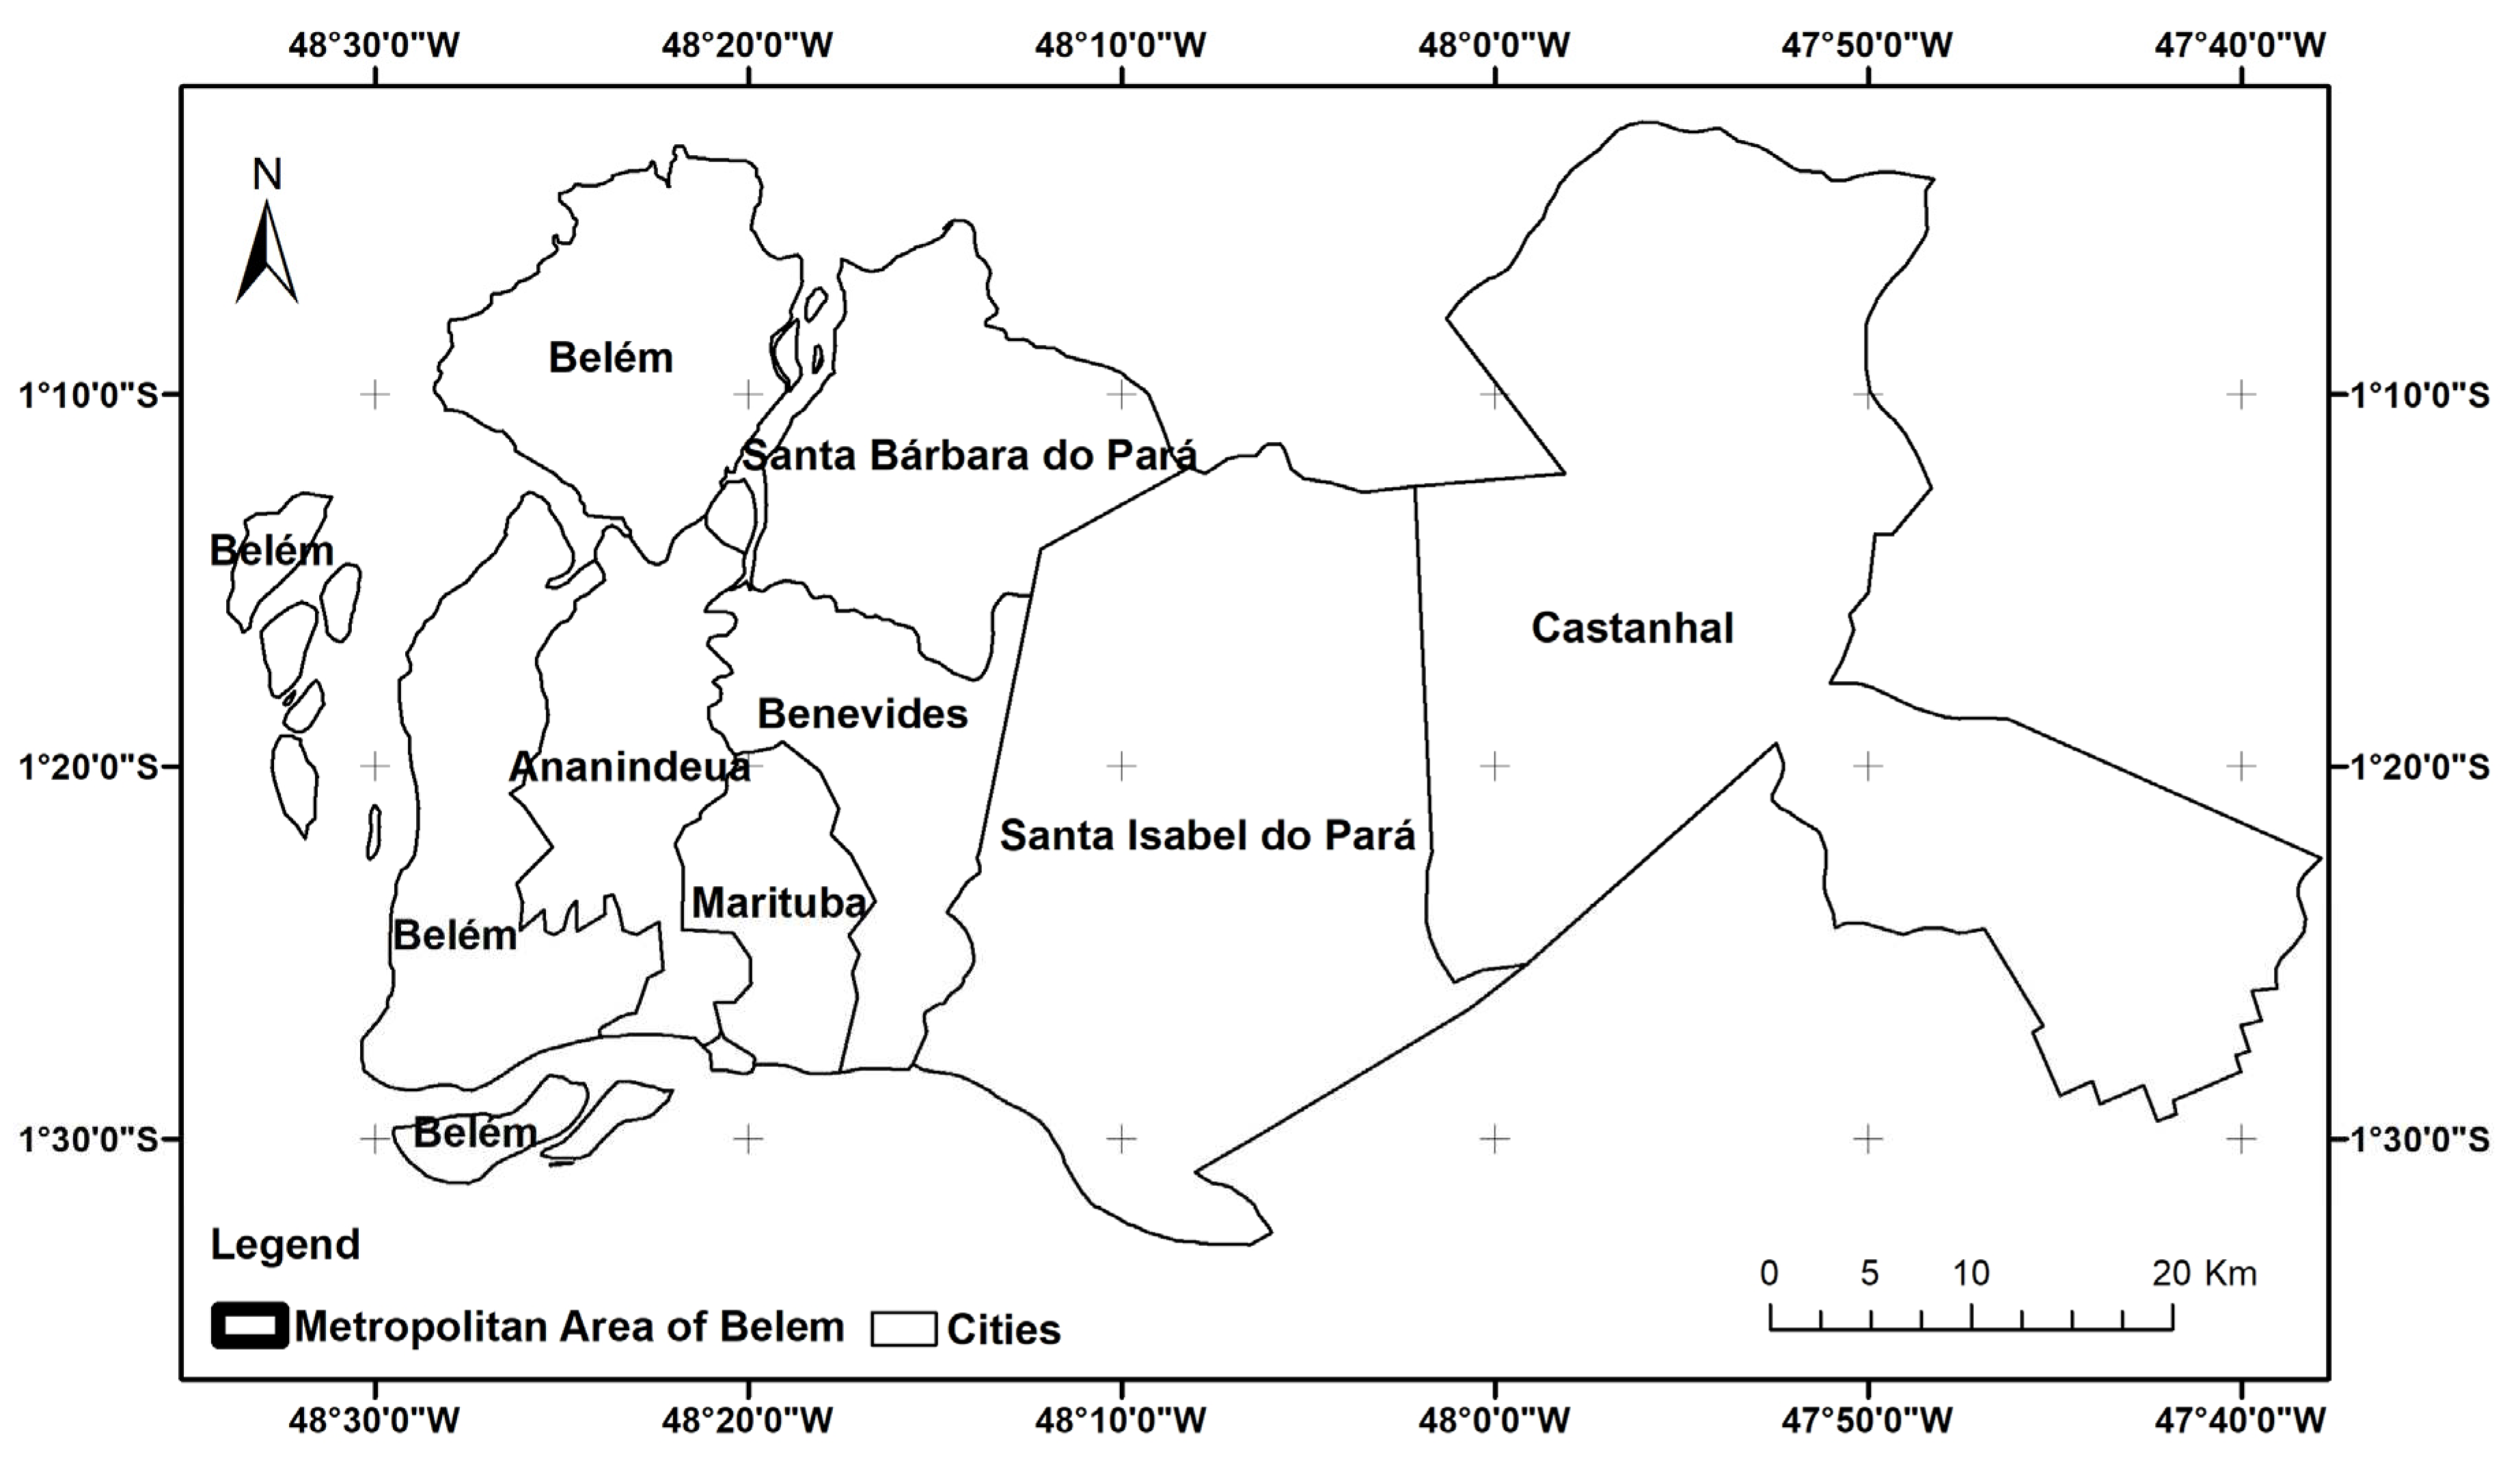
Figure 4.
Monthly and yearly data from all pluviometers at the support stations: 00147007, 00148001, 00148003, and 00148012.
Figure 4.
Monthly and yearly data from all pluviometers at the support stations: 00147007, 00148001, 00148003, and 00148012.
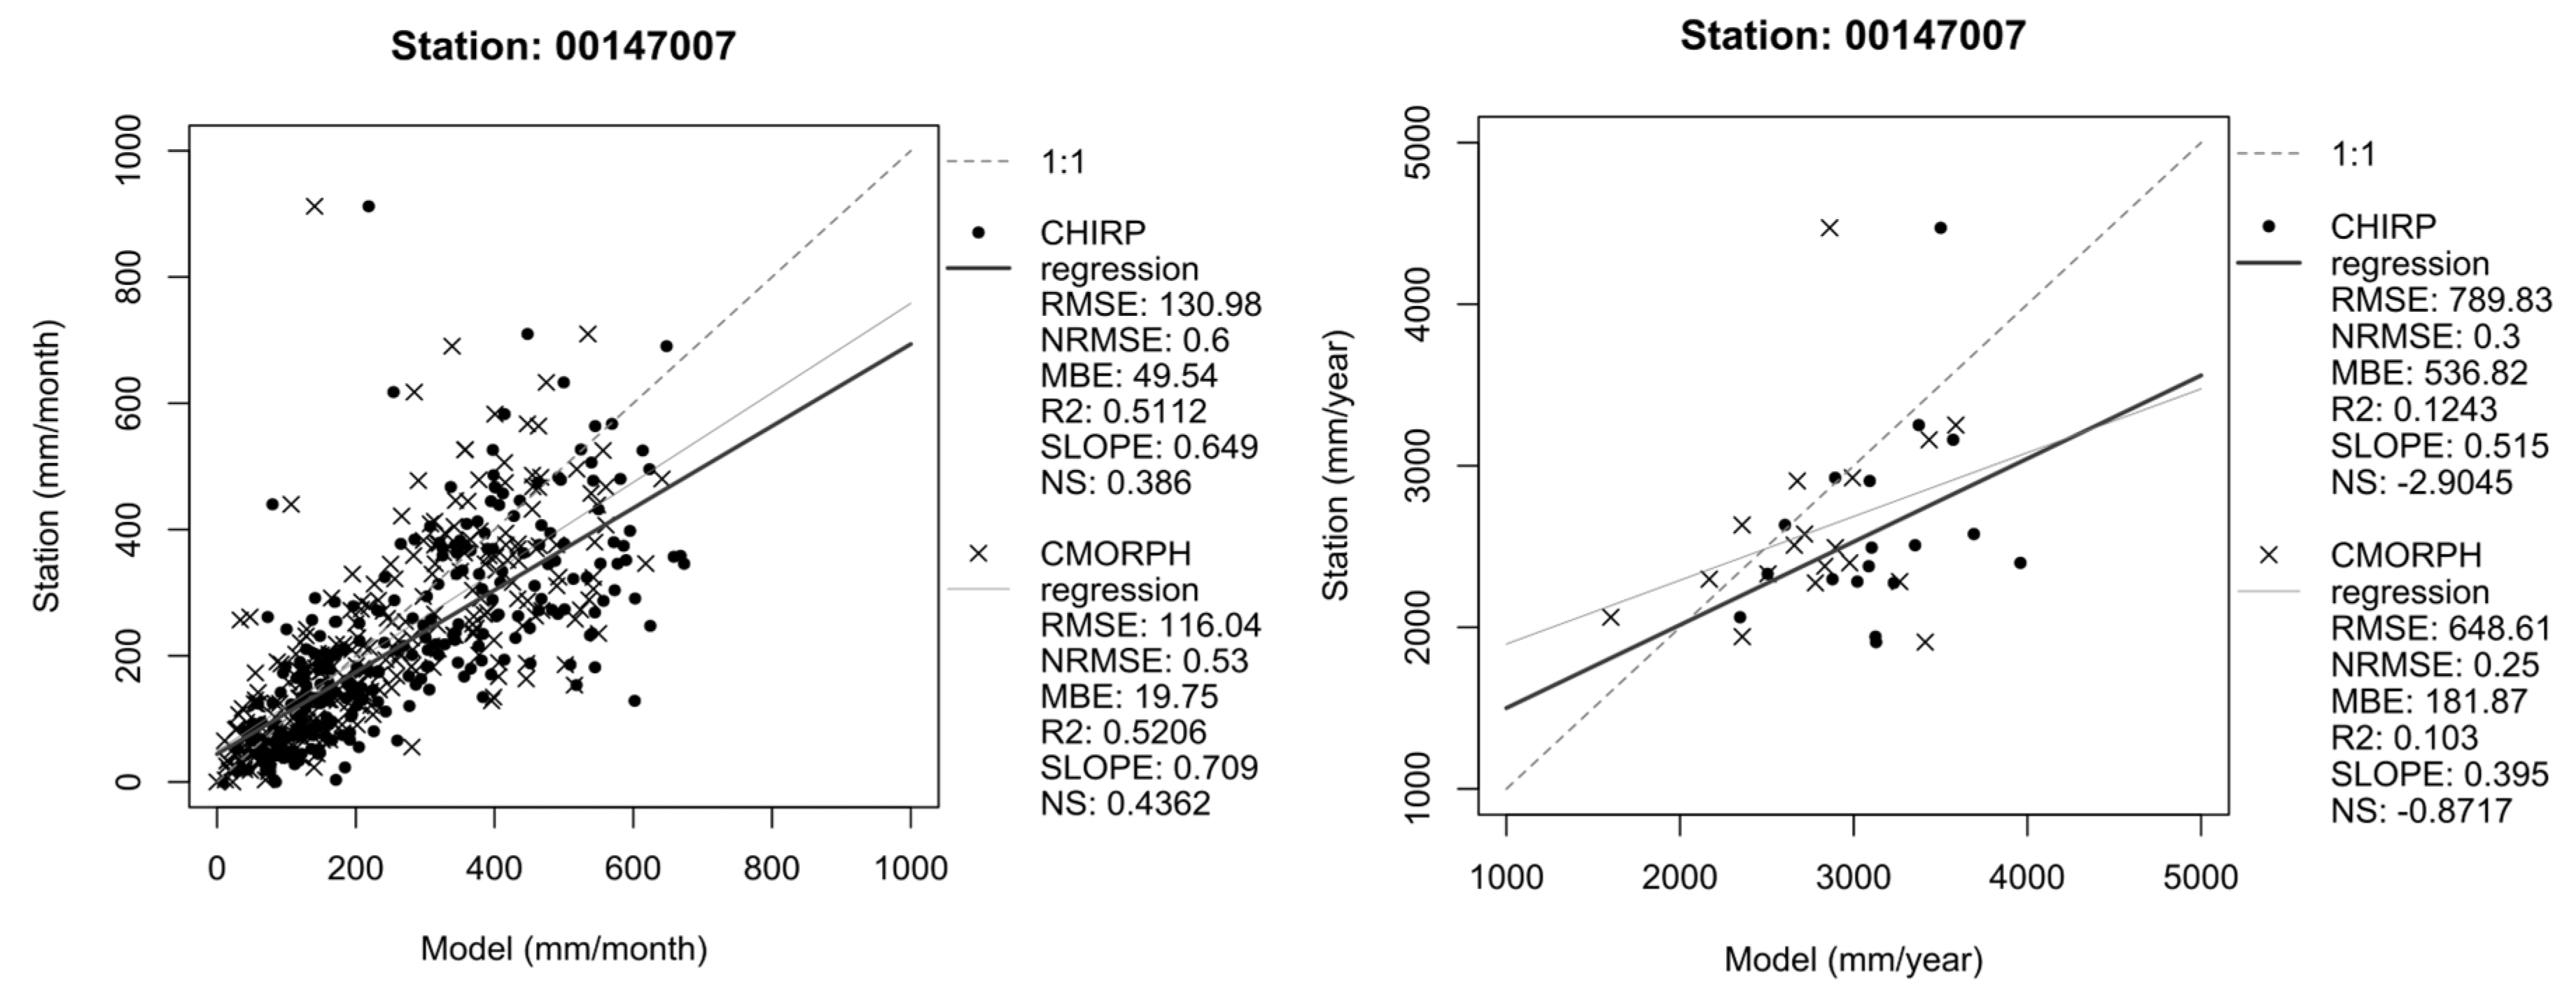
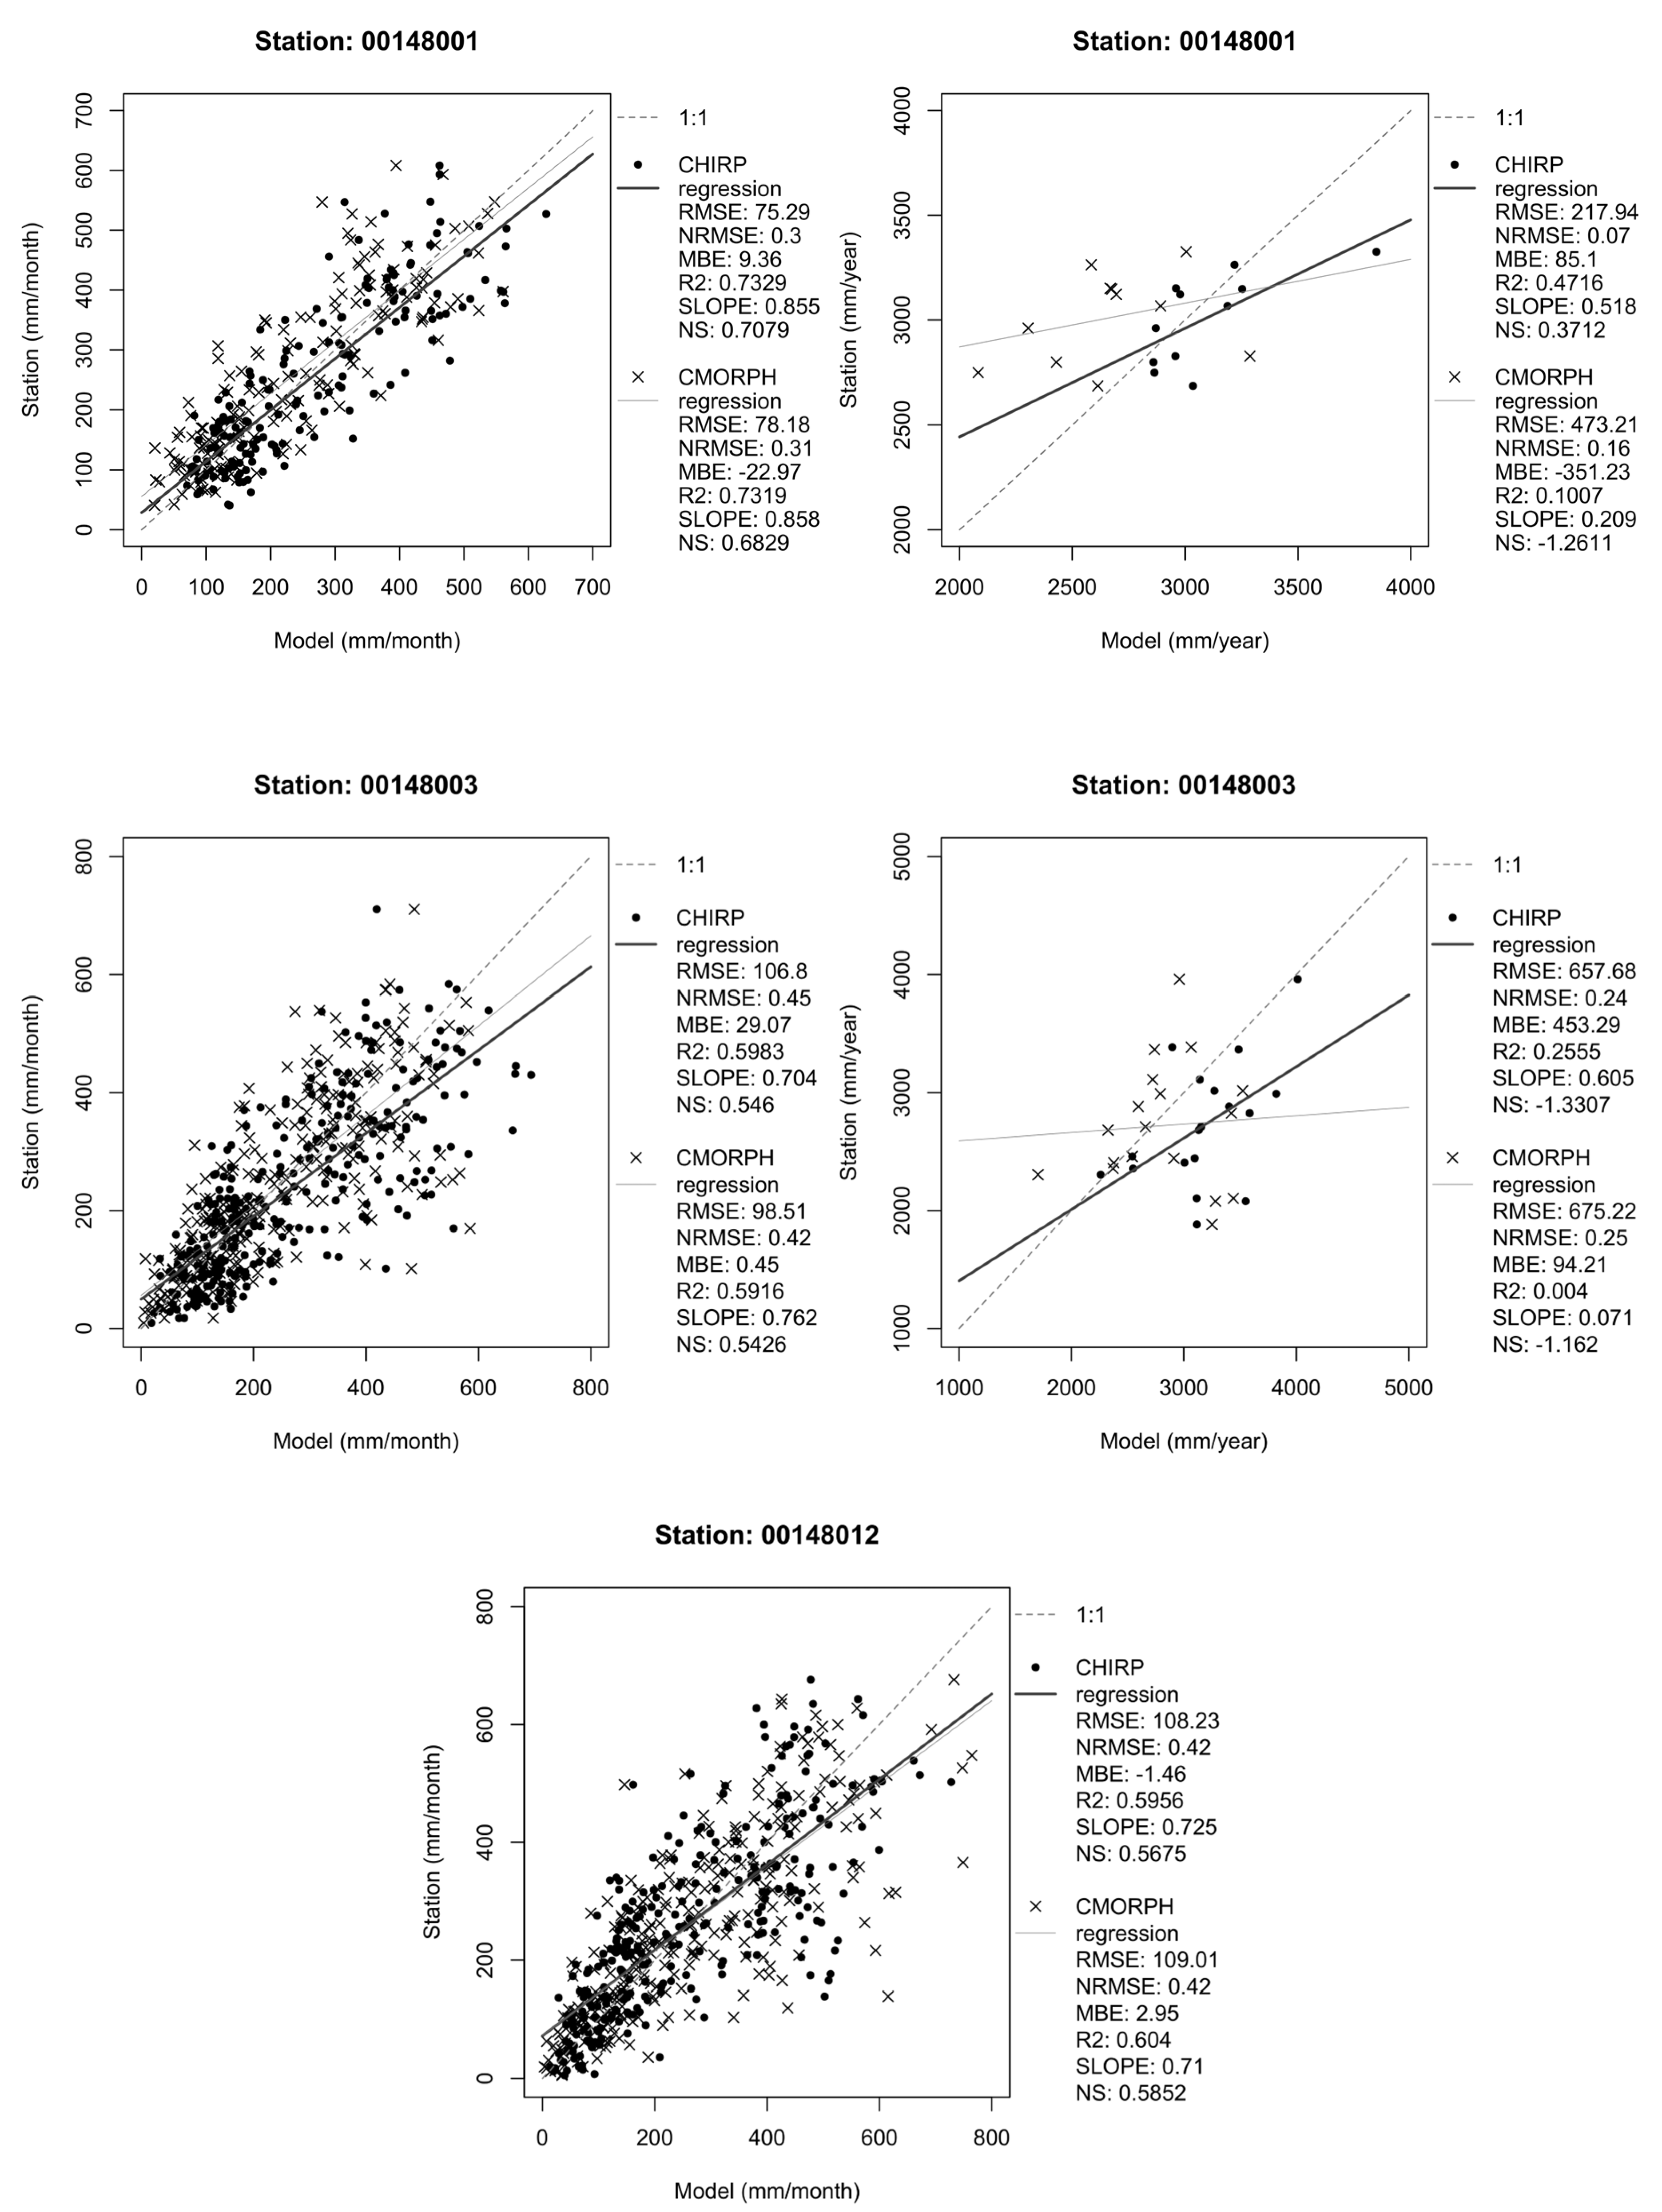
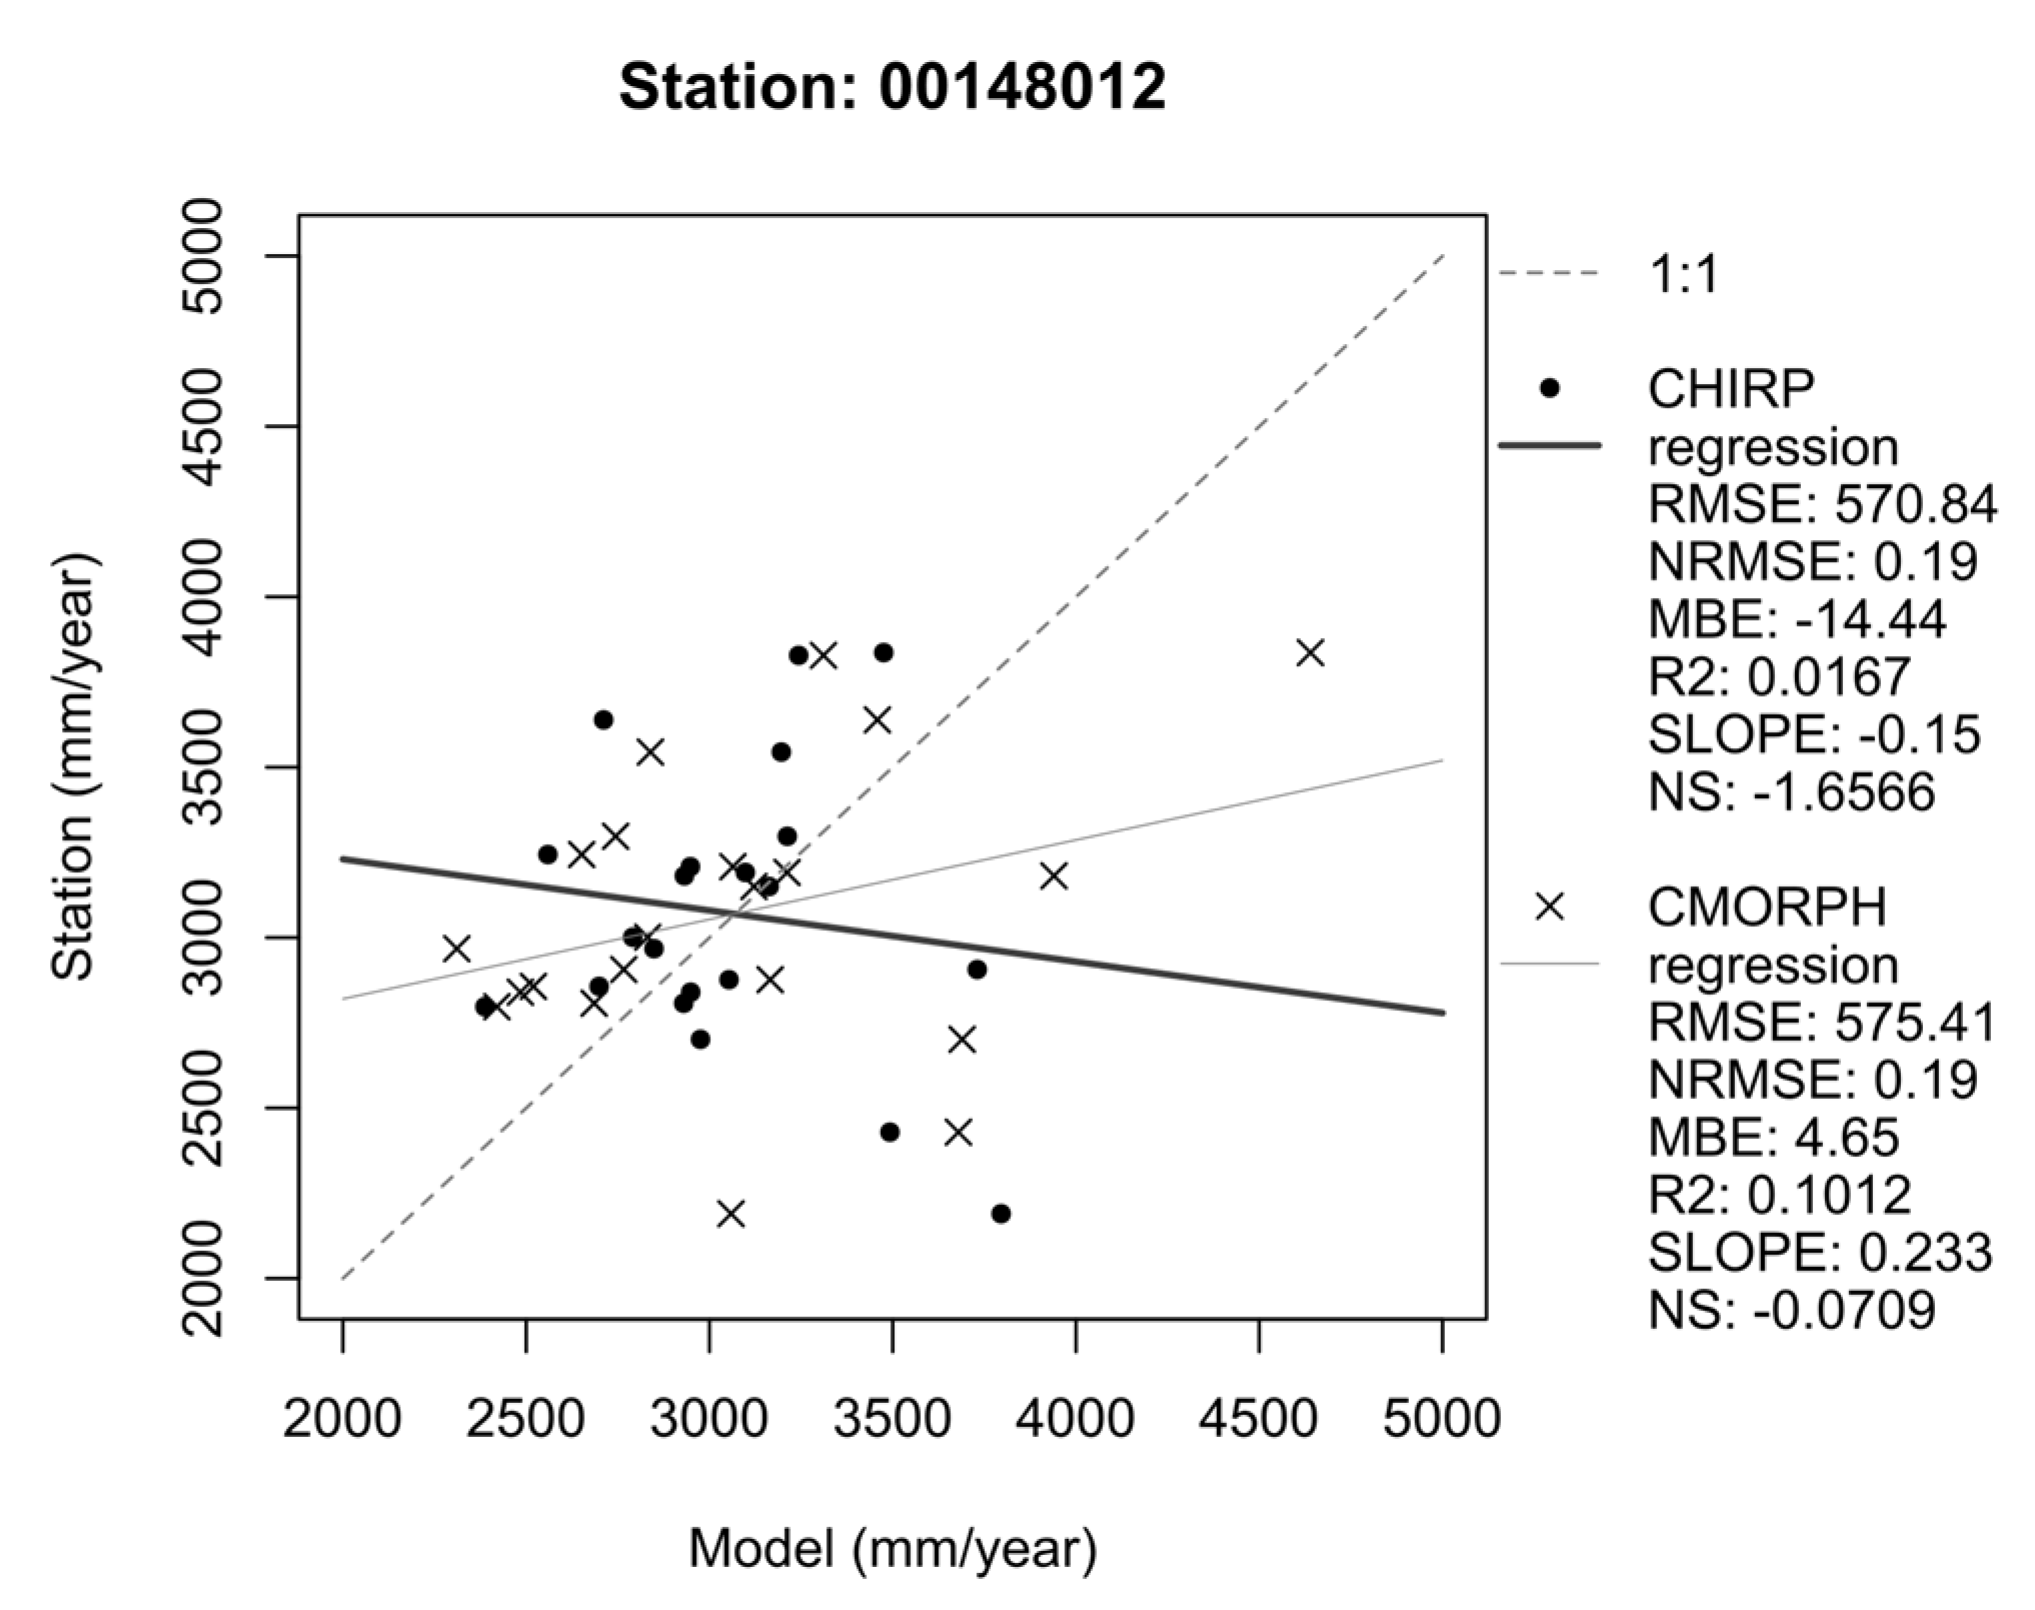
Figure 9.
Daily time series from 00148002/INMET.

Figure 10.
Monthly time series from 00148002/INMET.
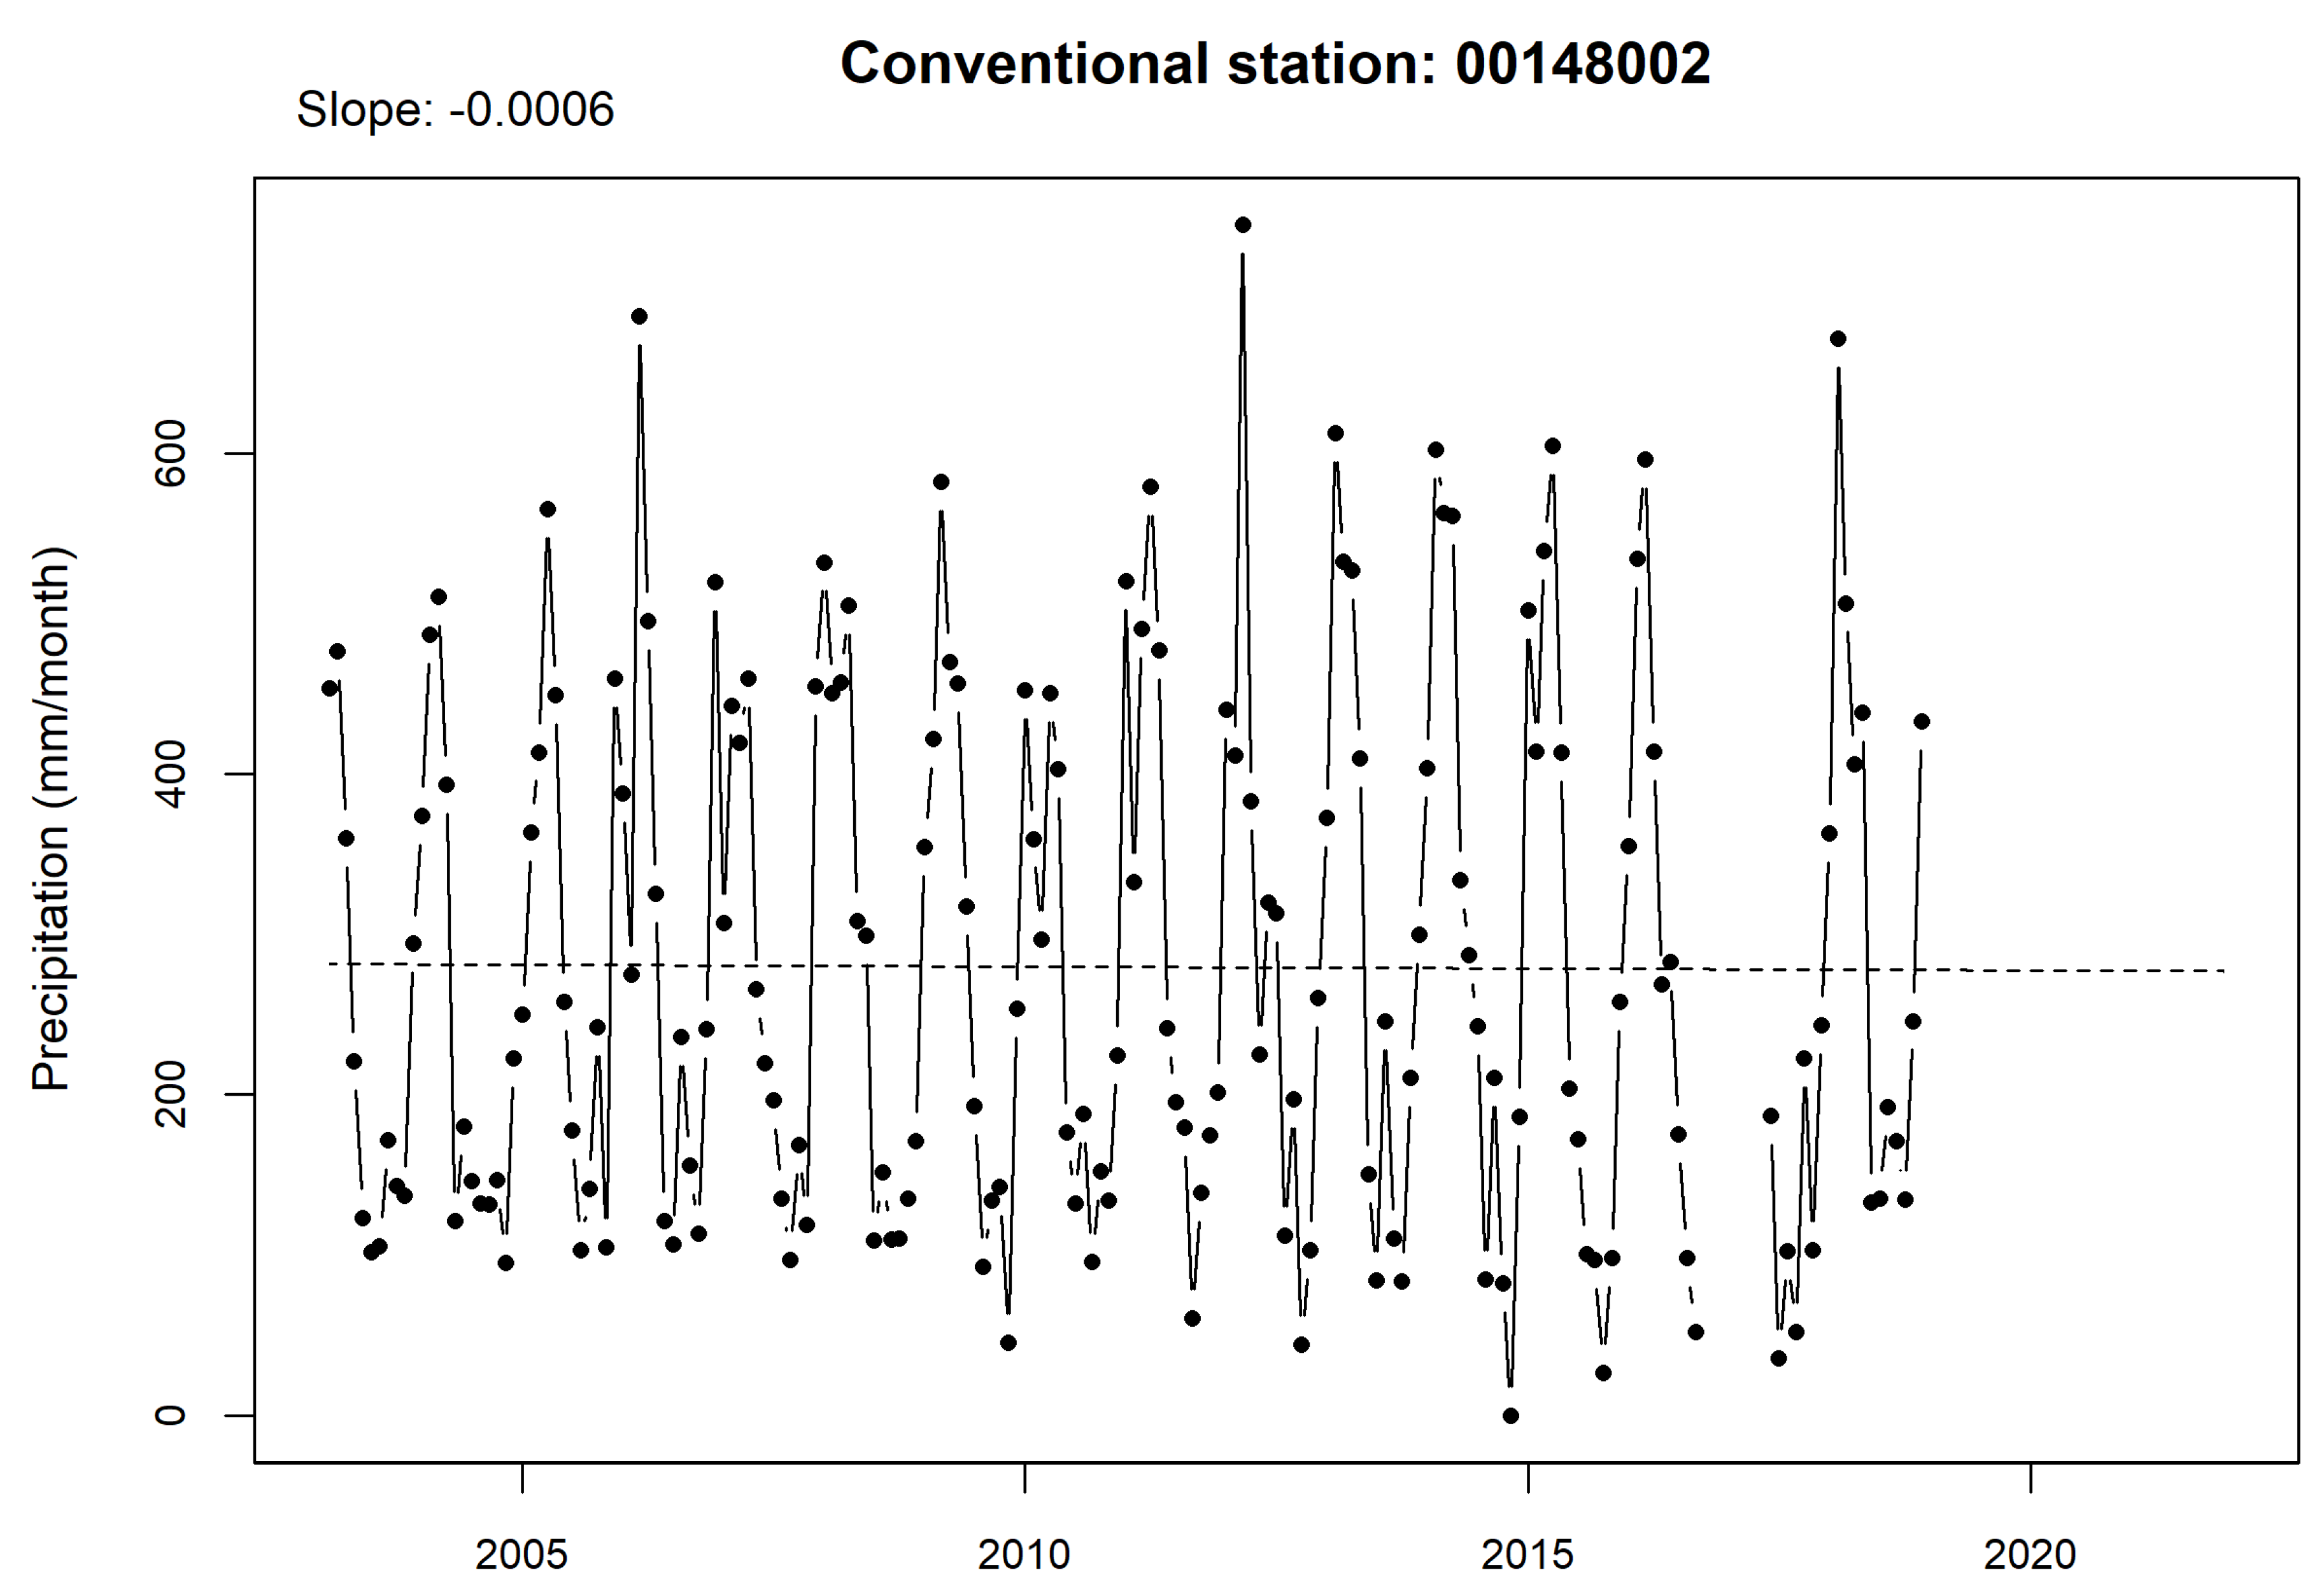
Figure 11.
Box plot of hourly precipitation from 2003 to 2020.
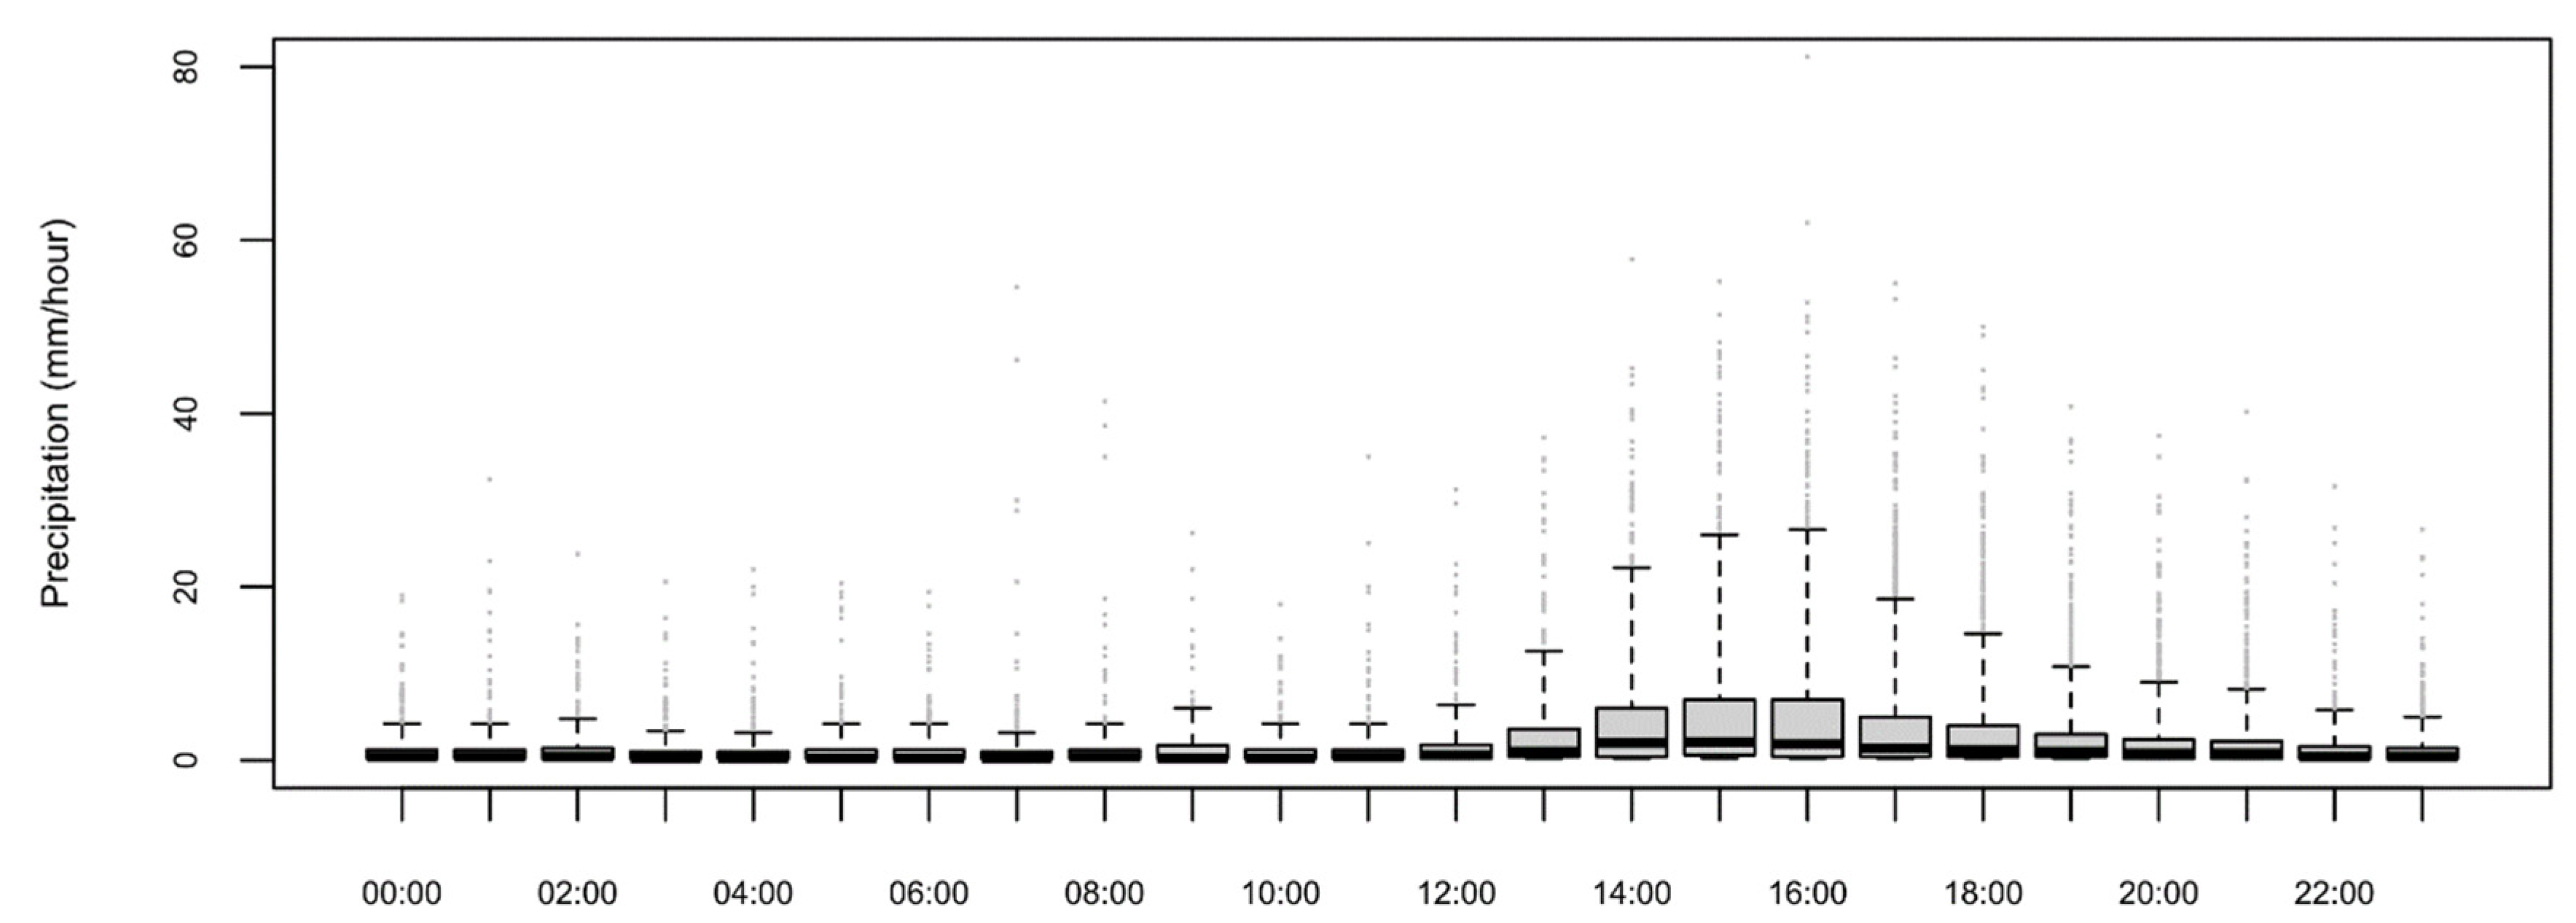
Figure 12.
The maximum and mean ET.
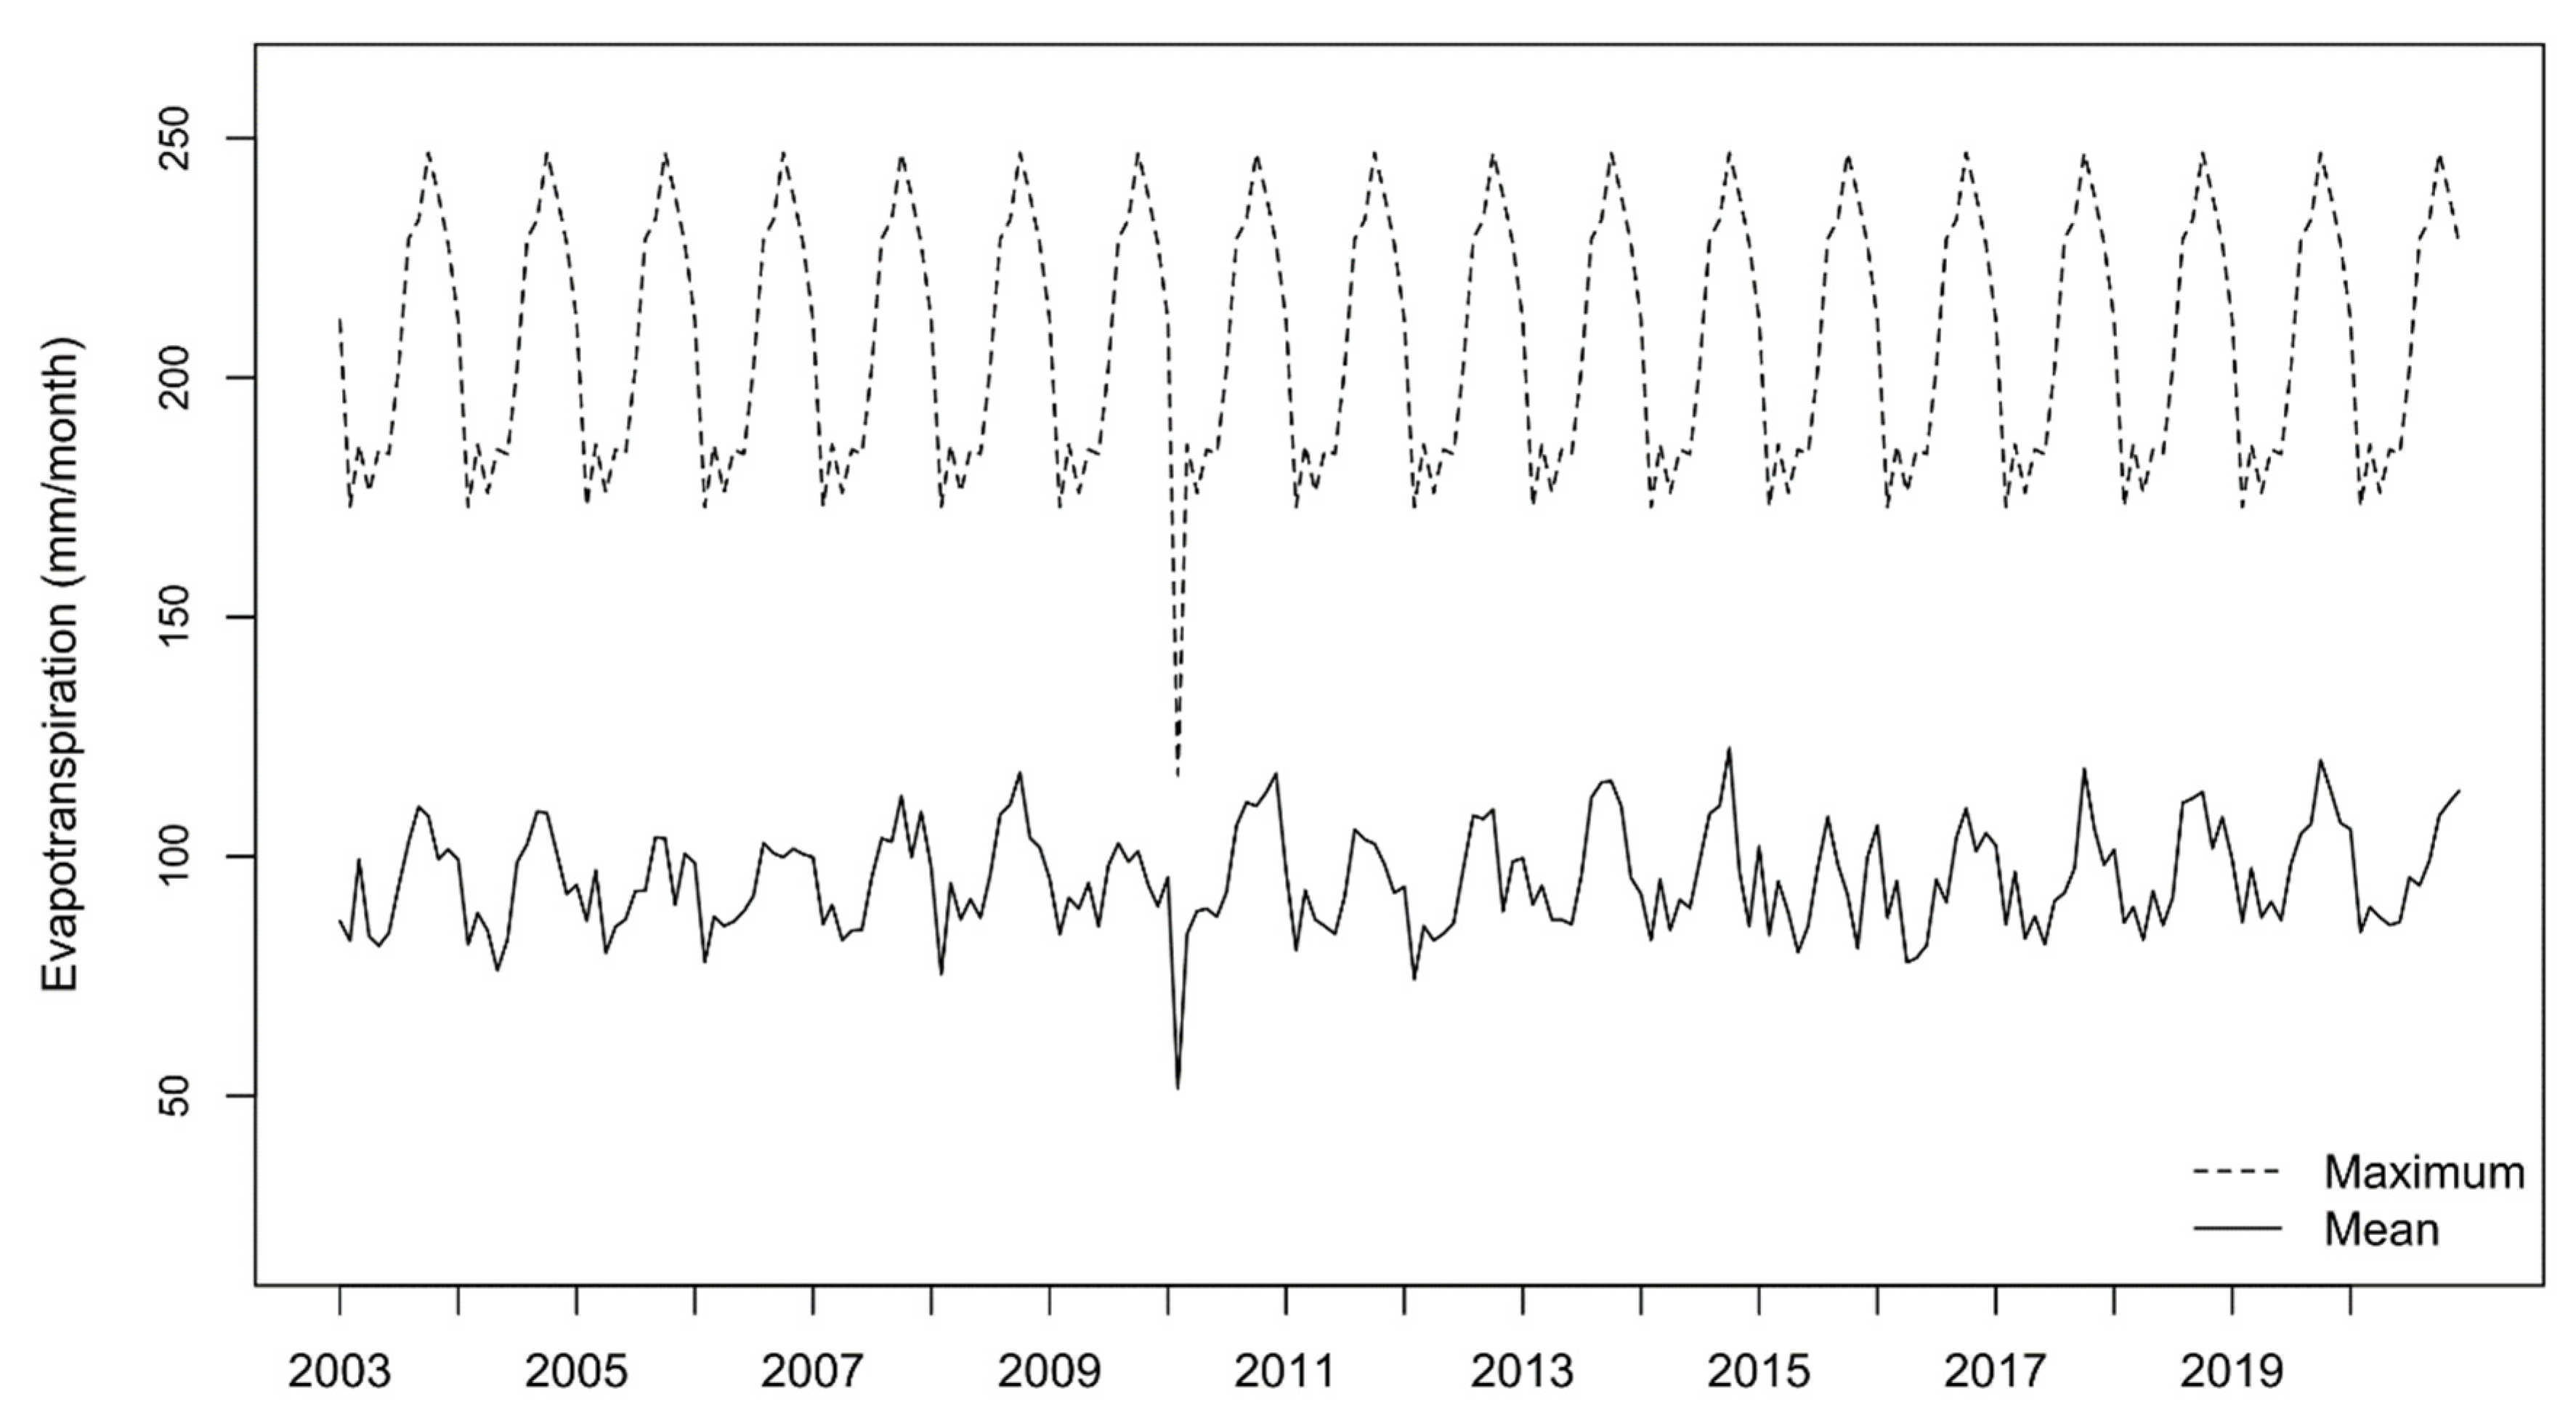
Figure 13.
Mean ET values in the MAB, obtained from SSEBop.
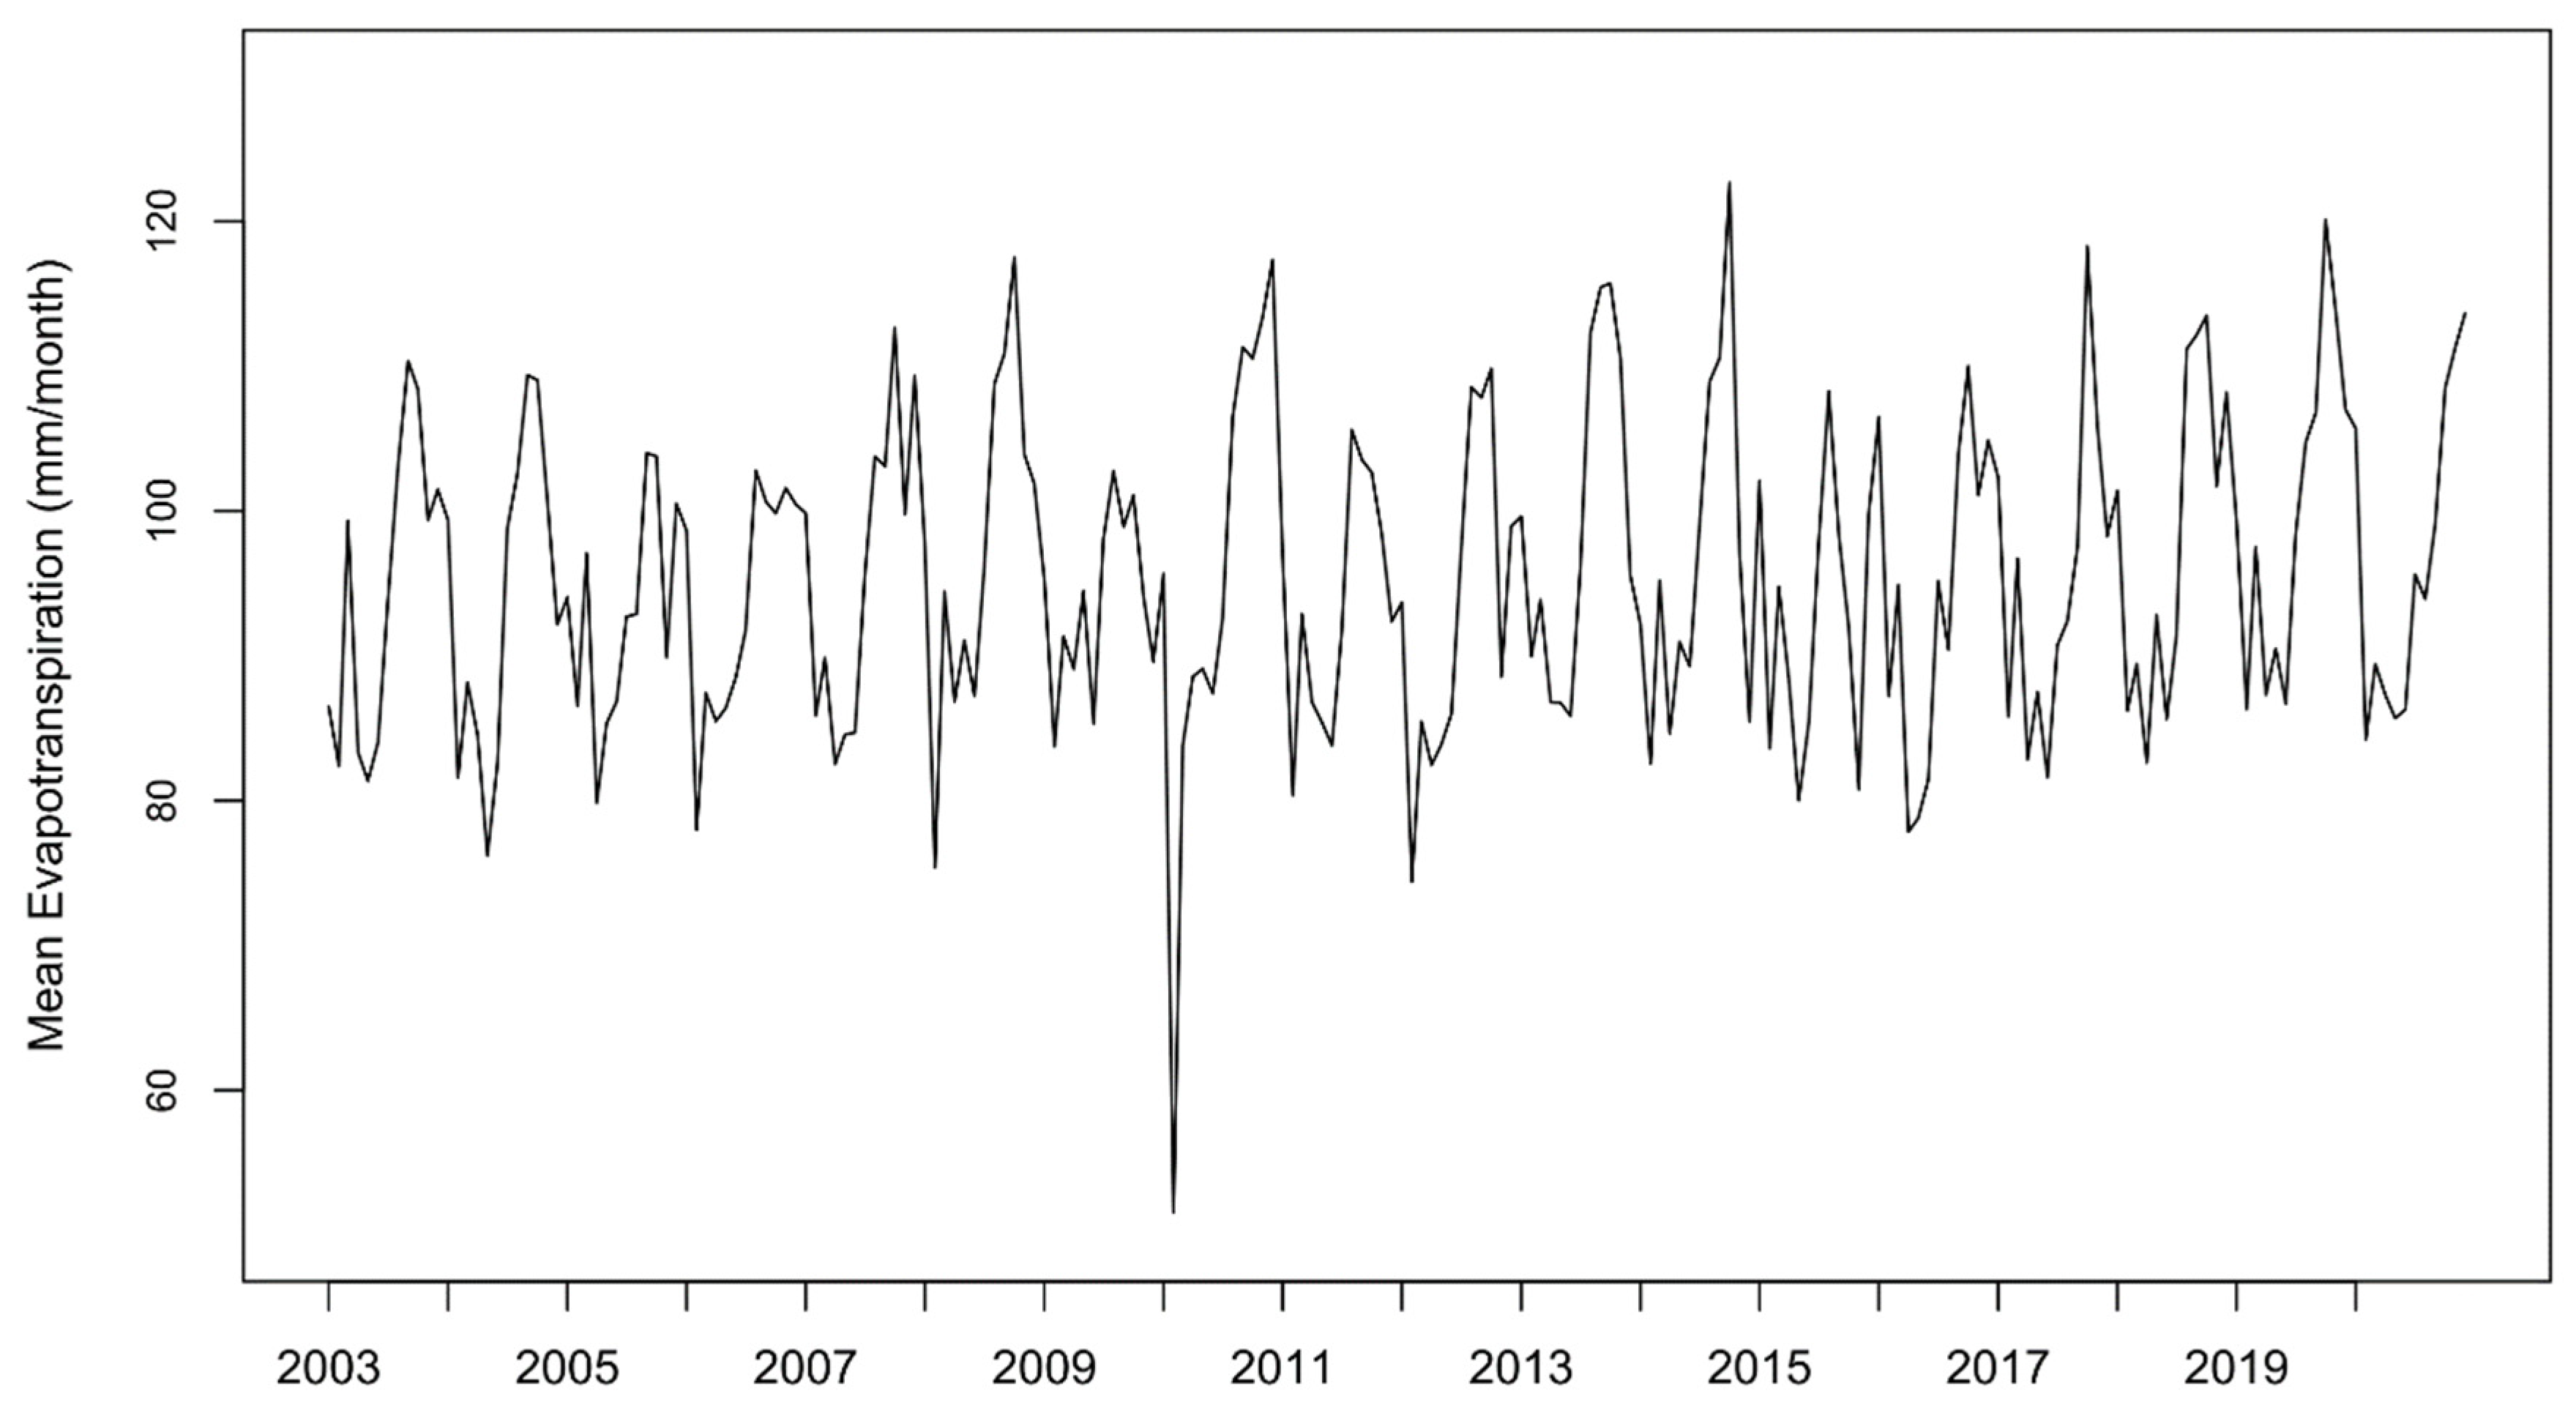
Figure 14.
Box plot showing the ET range in the MAB.
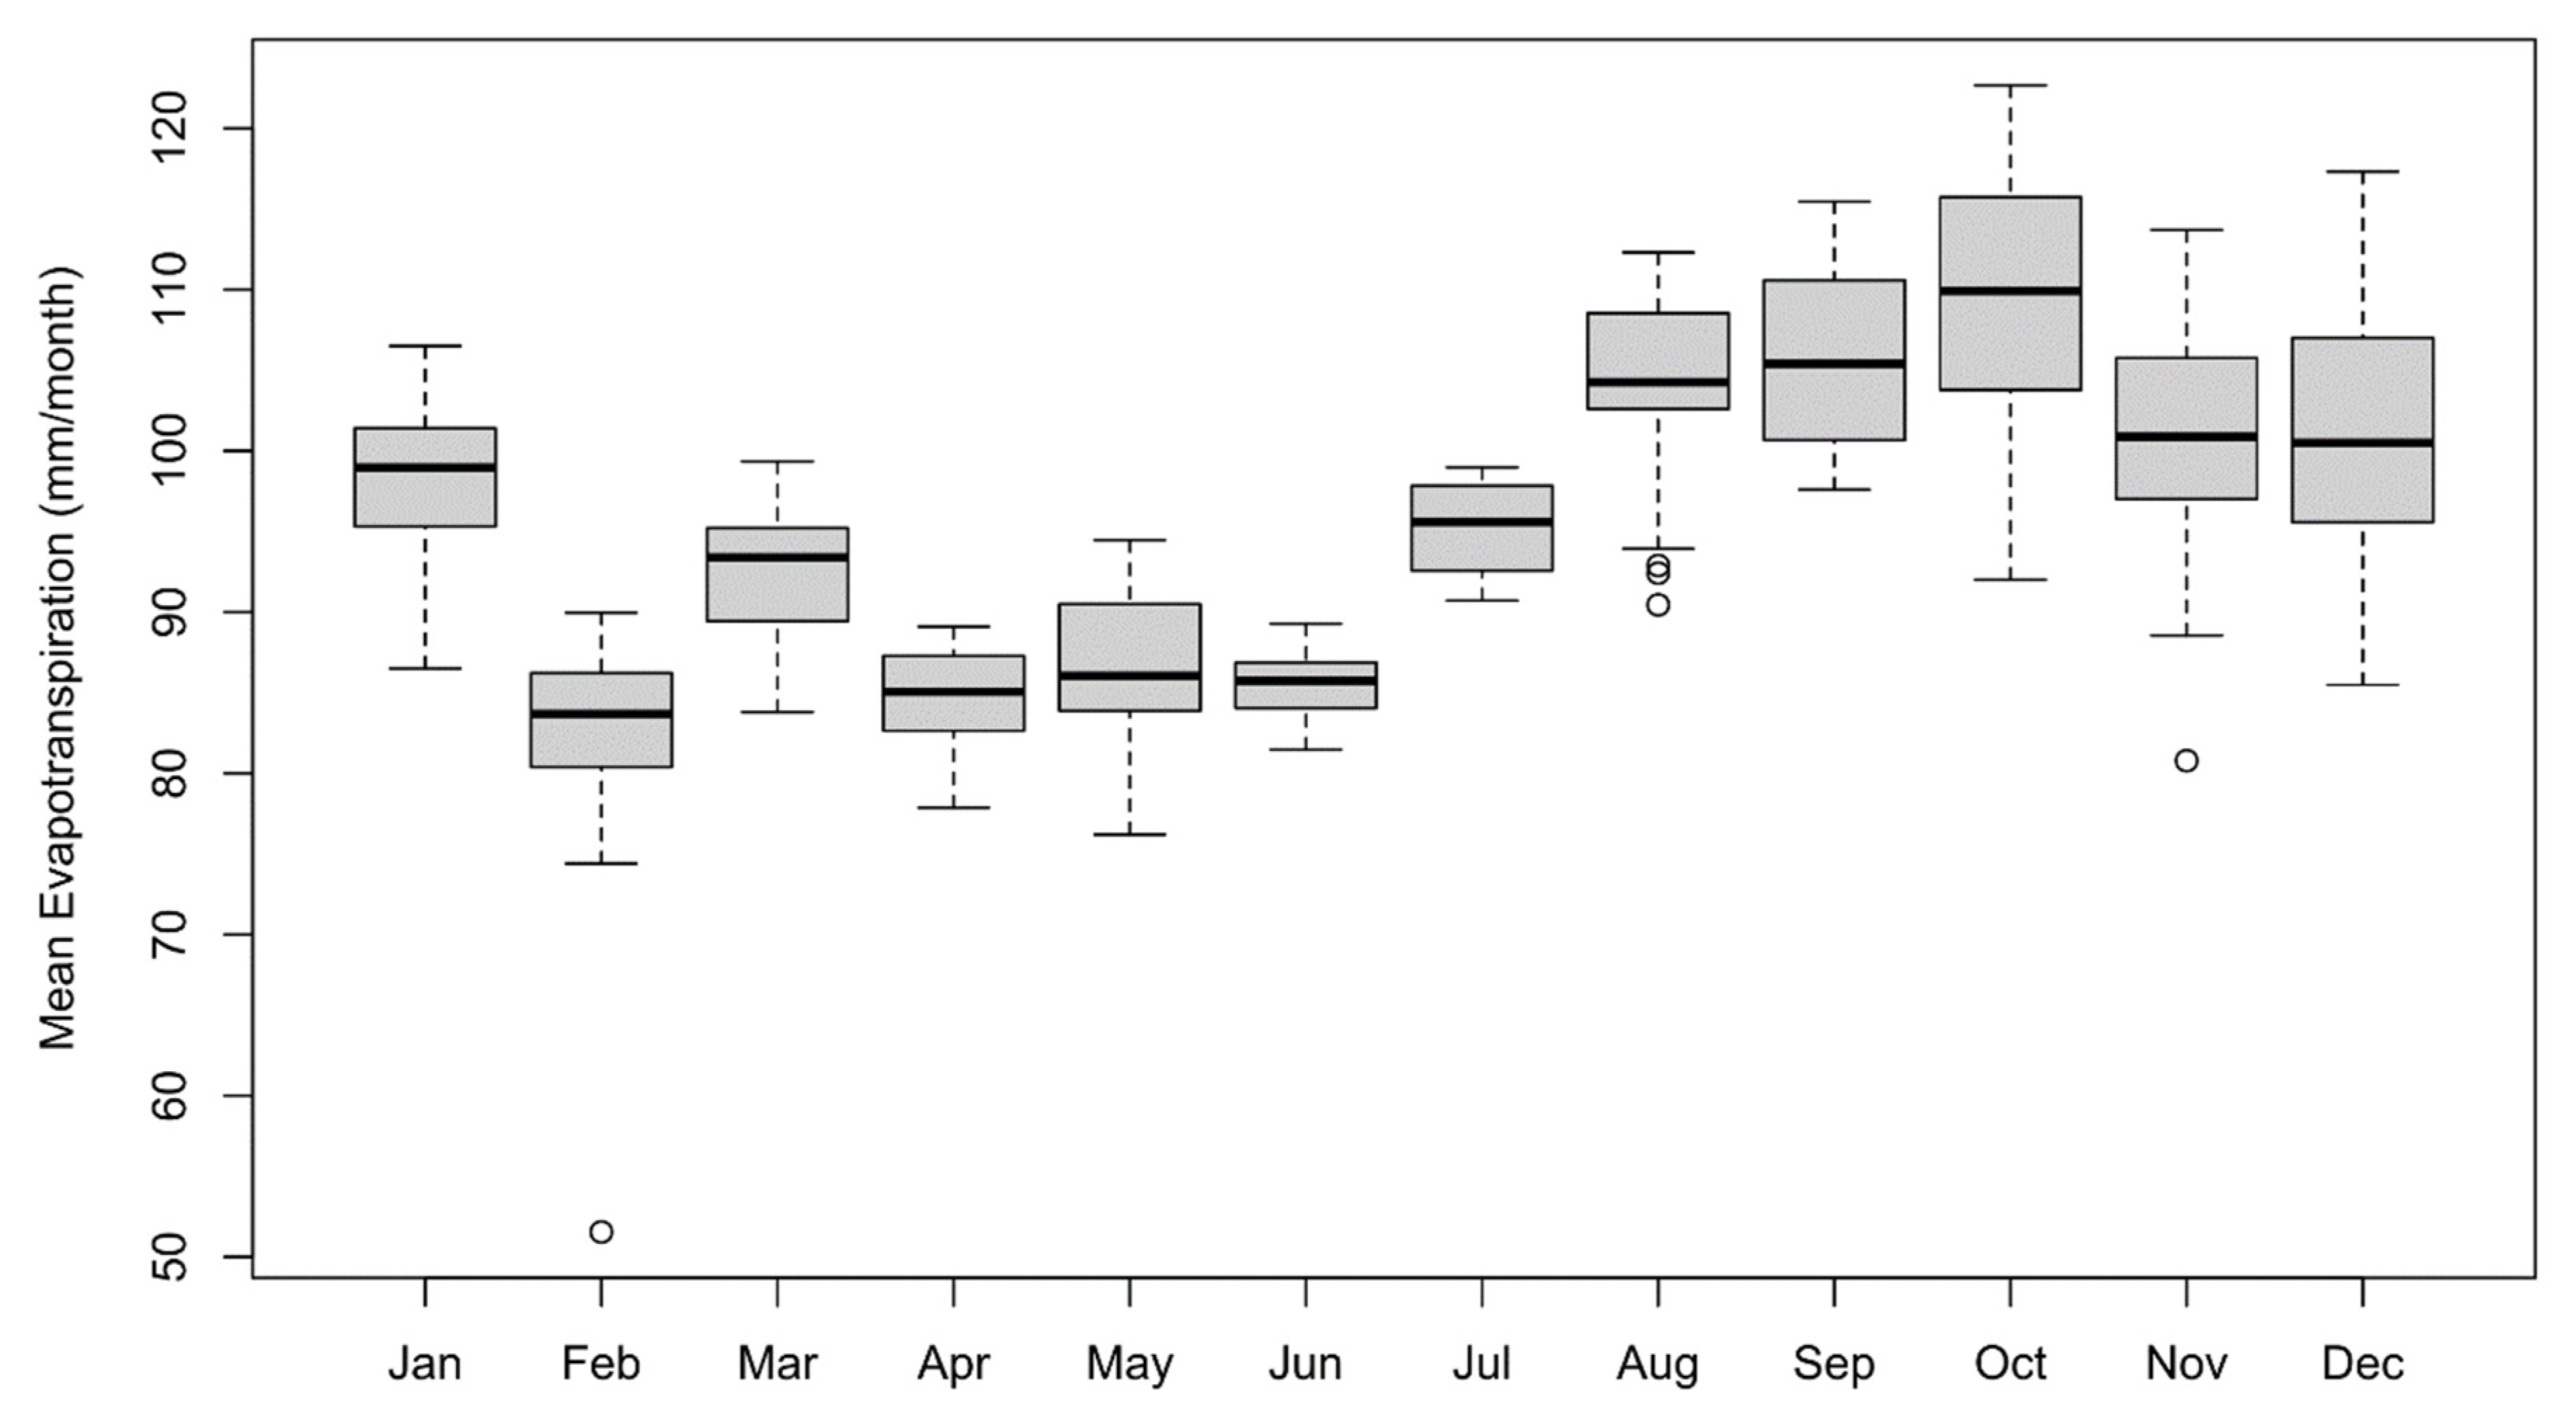

Table 1.
The in situ stations used for analyses with CMORPH and CHIRP.
| Code | Name | Latitude | Longitude | Start | End |
|---|---|---|---|---|---|
| 00147007 | Castanhal | −1.2975 | −47.9394 | January, 1981 | December, 2020 |
| 00148001 | Belem EMBRAPA IPAGRO | −1.4500 | −48.5000 | January, 2000 | December, 2013 |
| 01480002 | BELEM INMET | −1.4350 | −48.4378 | January, 2003 | December, 2018 |
| 00148003 | Santa Isabel do Para | −1.2964 | −48.1708 | January, 1981 | December, 2020 |
| 00148012 | Mosqueiro | −1.0942 | −48.3986 | January, 1984 | December, 2020 |
Table 2.
Overview of global-scale satellite-based products. The column “gauge” indicates whether a product is calibrated against ground data; N indicates no.
Table 2.
Overview of global-scale satellite-based products. The column “gauge” indicates whether a product is calibrated against ground data; N indicates no.
| Product | Main Principle Data | Resolution | Spatial Coverage | Gauge | Minimum Time-Step Interval | Producer |
|---|---|---|---|---|---|---|
| CMORPH | Microwave estimates (DMSP F- 13, 14, and 15 (SSM/I); NOAA-15, 16, 17, and 18 (AMSU-B); AMSR-E; and TRMM (TMI)), IR motion vectors | 0.25˚ | 50˚ N-S | N | 3 h | NOAA/CPC |
| CHIRP | Microwave estimates (TMPA, TRMM, 3B42-RT/3B42/2B31, CHPclim, CMORPH) | 0.05˚ | 50˚ N-S | N | daily | Climate Hazards Group (CHG) |
Table 3.
The number of rainy days and the seasonality of precipitation in Belem from 2000 to 2019.
| Number of Days with Rain (NDR) | |||||||||||||
|---|---|---|---|---|---|---|---|---|---|---|---|---|---|
| Year | Jan | Feb | Mar | Apr | May | Jun | Jul | Aug | Sep | Oct | Nov | Dec | NDR |
| 2000 | 28 | 27 | 29 | 30 | 27 | 21 | 25 | 24 | 22 | 24 | 10 | 23 | 290 |
| 2001 | 29 | 27 | 29 | 29 | 26 | 25 | 21 | 11 | 20 | 20 | 20 | 20 | 277 |
| 2002 | 29 | 26 | 28 | 26 | 27 | 26 | 18 | 15 | 13 | 23 | 20 | 26 | 277 |
| 2003 | 24 | 23 | 27 | 25 | 24 | 23 | 14 | 16 | 18 | 18 | 19 | 25 | 256 |
| 2004 | 22 | 28 | 30 | 27 | 24 | 20 | 22 | 22 | 26 | 18 | 13 | 19 | 271 |
| 2005 | 25 | 28 | 29 | 26 | 29 | 19 | 15 | 13 | 19 | 14 | 18 | 25 | 260 |
| 2006 | 26 | 25 | 31 | 29 | 31 | 20 | 14 | 19 | 15 | 15 | 21 | 26 | 272 |
| 2007 | 28 | 27 | 29 | 27 | 27 | 24 | 21 | 15 | 19 | 22 | 14 | 27 | 280 |
| 2008 | 29 | 27 | 28 | 27 | 23 | 22 | 16 | 8 | 17 | 13 | 12 | 20 | 242 |
| 2009 | 29 | 28 | 29 | 25 | 28 | 23 | 16 | 14 | 18 | 15 | 9 | 25 | 259 |
| 2010 | 26 | 25 | 27 | 28 | 26 | 19 | 17 | 15 | 15 | 14 | 17 | 21 | 250 |
| 2011 | 27 | 25 | 29 | 25 | 26 | 19 | 19 | 21 | 13 | 17 | 16 | 22 | 259 |
| 2012 | 27 | 29 | 31 | 26 | 23 | 27 | 24 | 15 | 17 | 12 | 10 | 25 | 266 |
| 2013 | 28 | 27 | 29 | 28 | 28 | 22 | 3 | 17 | 18 | 20 | 22 | 23 | 265 |
| 2014 | 26 | 27 | 29 | 30 | 27 | 22 | 21 | 14 | 18 | 13 | 0 | 20 | 247 |
| 2015 | 29 | 25 | 27 | 28 | 28 | 24 | 10 | 15 | 13 | 12 | 25 | ||
| 2016 | 26 | 29 | 30 | 25 | 23 | 24 | 21 | 15 | 13 | ||||
| 2017 | 20 | 9 | 16 | 13 | 20 | 15 | 23 | ||||||
| 2018 | 28 | 26 | 28 | 29 | 29 | 12 | 17 | 19 | 13 | 17 | 22 | 29 | 269 |
| 2019 | 29 | 24 | 29 | 26 | 26 | 19 | |||||||
| Mean | 26 | 26 | 28 | 26 | 25 | 20 | 18 | 15 | 17 | 15 | 14 | 21 | 252 |
Table 4.
Overview of the global-scale satellite-based product SSEBop.
| Product | Spatial Resolution | Temporal Resolution | Version | Latitudes | Ongoing Product until Present | Main Data Input |
|---|---|---|---|---|---|---|
| SSEBop | 0.01° | Monthly | 5 | 90° N–90° S | Yes | TIR/VIIRS |
Disclaimer/Publisher’s Note: The statements, opinions and data contained in all publications are solely those of the individual author(s) and contributor(s) and not of MDPI and/or the editor(s). MDPI and/or the editor(s) disclaim responsibility for any injury to people or property resulting from any ideas, methods, instructions or products referred to in the content. |
© 2023 by the authors. Licensee MDPI, Basel, Switzerland. This article is an open access article distributed under the terms and conditions of the Creative Commons Attribution (CC BY) license (http://creativecommons.org/licenses/by/4.0/).
Copyright: This open access article is published under a Creative Commons CC BY 4.0 license, which permit the free download, distribution, and reuse, provided that the author and preprint are cited in any reuse.


