
Submitted:
25 August 2023
Posted:
29 August 2023
You are already at the latest version
Abstract
Background: Mutations in TBCK can generate truncated TBCK protein aggregates that abolish the normal function of the gene. Alterations in TBCK function have been implicated in developmental and neurogenetic disorders, as well as the progression of certain forms of cancer. Despite TBCK's involvement in various human diseases, the underlying mechanism for cancer pathogenesis remains poorly understood.
Methods: To further explore loss of function mutations in TBCK, we introduced a CRISPR-mediated knockout system capable of deleting the human TBCK gene. Transcriptome analysis based on RNA-seq data was utilized to illustrate important roles of TBCK in cancer initiation and progression.
Results: The effectiveness of our targeted CRISPR knockout system (sgTBCK) was validated in multiple human cancer models, including PDAC MIAPaCa-2 and Fibrosarcoma HT1080. Our clear and straightforward workflow, detailed protocol, and schematic diagram for knocking out human TBCK via CRISPR can be applied to any gene of interest, which highlights the versatility, reproducibility, and user-friendliness of this approach. The application of our TBCK knockout system for transcriptome analysis showed TBCK's involvement in multiple hallmark cancer pathways, such as TNF-α signaling, Apoptosis, Hypoxia, P53, and Epithelial Mesenchymal Transition, emphasizing the importance of TBCK mutations in cancer initiation and progression.
Conclusions: We generated a straightforward workflow, detailed protocol, and schematic diagram for knocking out human TBCK via CRISPR and confirmed that the sgRNA against TBCK (GTTCGAGAAAGGAAACCTGTG) was specific for human TBCK. To date, this is the first report that has combined a CRISPR-Cas9 knockout system with transcriptome analysis to uncover potential mechanisms of TBCK in cancer progression.
Keywords:
TBCK
; CRISPR-Cas9
; MIA PaCa-2
; HT1080
; transcriptome analysis
; cancer-related pathways
Introduction
As previously reported, mutations in TBCK can abolish the normal function of TBCK by generating truncated TBCK protein aggregates that can further develop into neurogenetic disorders [1]. Among which, a famous “Boricua mutation” p.R126X is associated with a more severe version of the disorder called TBCK-related encephalopathy [2-5]. TBCK-related encephalopathy is a rare autosomal recessive neurogenetic disorder-around 35 reported cases worldwide-with major clinical symptoms of hypotonia (low muscle tone), epilepsy, and intellectual disability [6].
Additionally, TBCK has also been shown some correlation with cancer progression. The earliest report in 2010 suggested that MGC16169 (TBCK) selectively supports coupling of active EGFR to ERK1/2 regulation in A431 cells. Similarly, elevated pStat3 levels were also observed in A431 cells while MGC16169 (TBCK) was knocked down, suggesting the involvement of MGC16169 (TBCK) in the STAT3 signaling pathway [7]. A report in 2013 showed that TBCK was also involved in the regulation of cell proliferation, cell growth and actin organization by modulating the mTOR pathway in HEK293 cells [8]. Our group also demonstrated that two types of alternatively spliced TBCK were detected in multiple cell lines, including HEK293 and A431, where we showed that the long type of TBCK may have a tumor growth suppressing function [9]. In 2016, Ioannis Panagopoulos et al. presented a case with fusion transcripts (in-frame TBCK-P4HA2 and out-of-frame P4HA2-TBCK) in a soft tissue angiofibroma [10]. Eun-Ae Kim et al. in 2019 also reported that the miR-1208 can target the 3’UTR of TBCK and decrease TBCK’s expression, which led to an enhanced sensitivity to cisplatin and TRAIL treatment in renal cancer cells [11]. In a recent paper published in 2021, frameshift insertion mutations of TBCK were found in 95% of plasma Samples collected from Hepatocellular Carcinoma (HCC) patients, suggesting a suppressive function of TBCK in HCC [12].
Our group, as well as others, have shown that TBCK is an important modulator of cellular growth pathways in human cancer cell lines. However, the detailed mechanisms regarding TBCK’s functions are still underexplored. Even though the first functional study related to TBCK utilized an RNAi technique to knockdown TBCK [7], it failed to look at TBCK protein function under these conditions. Furthermore, the RNAi strategy has limitations, such as incomplete knockout of the gene. To overcome these shortcomings and further explore TBCK’s functions, we introduced a CRISPR-mediated Knockout system to deplete TBCK in multiple human cell models. Moreover, hallmark pathway and gene ontology analysis for RNA-seq data against TBCK knockout uncovered positive roles of TBCK in multiple cancer-related pathways, such as TNF-α signaling, Apoptosis, Hypoxia, P53, and Epithelial Mesenchymal Transition. In addition to the functional studies of TBCK, our study provides a detailed and straightforward protocol for mediating TBCK depletion, which can also be applied to any gene of interest.
Material and Methods
- Oligo design and vector construction
For each sgRNA sequence, the BsmBI digested products will generate appropriate overhang sequences (underlined) for cloning into sgRNA expression vectors (Figure 2). The final oligonucleotide sequence (displayed below) was synthesized at Invitrogen (Thermo Fisher Scientific):
Forward Primer: 5′-CACCG (sgRNA, 20 nt)-3′
Reverse Primer: 3′-C (sgRNA compliment) CAAA-5′
The above BsmBI digested products were diluted (1:200) and cloned into pL-CRISPR.EFS.tRFP (Addgene 57819). The resultant plasmids were then transformed into Stbl3 competent cells. Bacteria liquid PCR (primers listed in Table 1) and sanger sequencing assays were applied to screen and validate positive clones as previous reported [13].
- Cell Culture
Mia PaCa-2 (ATCC, CRL-1420), HT1080 (ATCC, CCL-121) and HEK293FT cells were maintained in DMEM media without added antibiotics and supplemented with 10% FBS and 1% penicillin/streptomycin during screens. Mouse KPC PDAC cell line (Ximbio, 153474) was grown in RPMI media, supplemented with 10% FBS and 1% penicillin/streptomycin. All cell lines were maintained in 37°C with 5% CO2 and tested to be Mycoplasma free.
- Virus Production
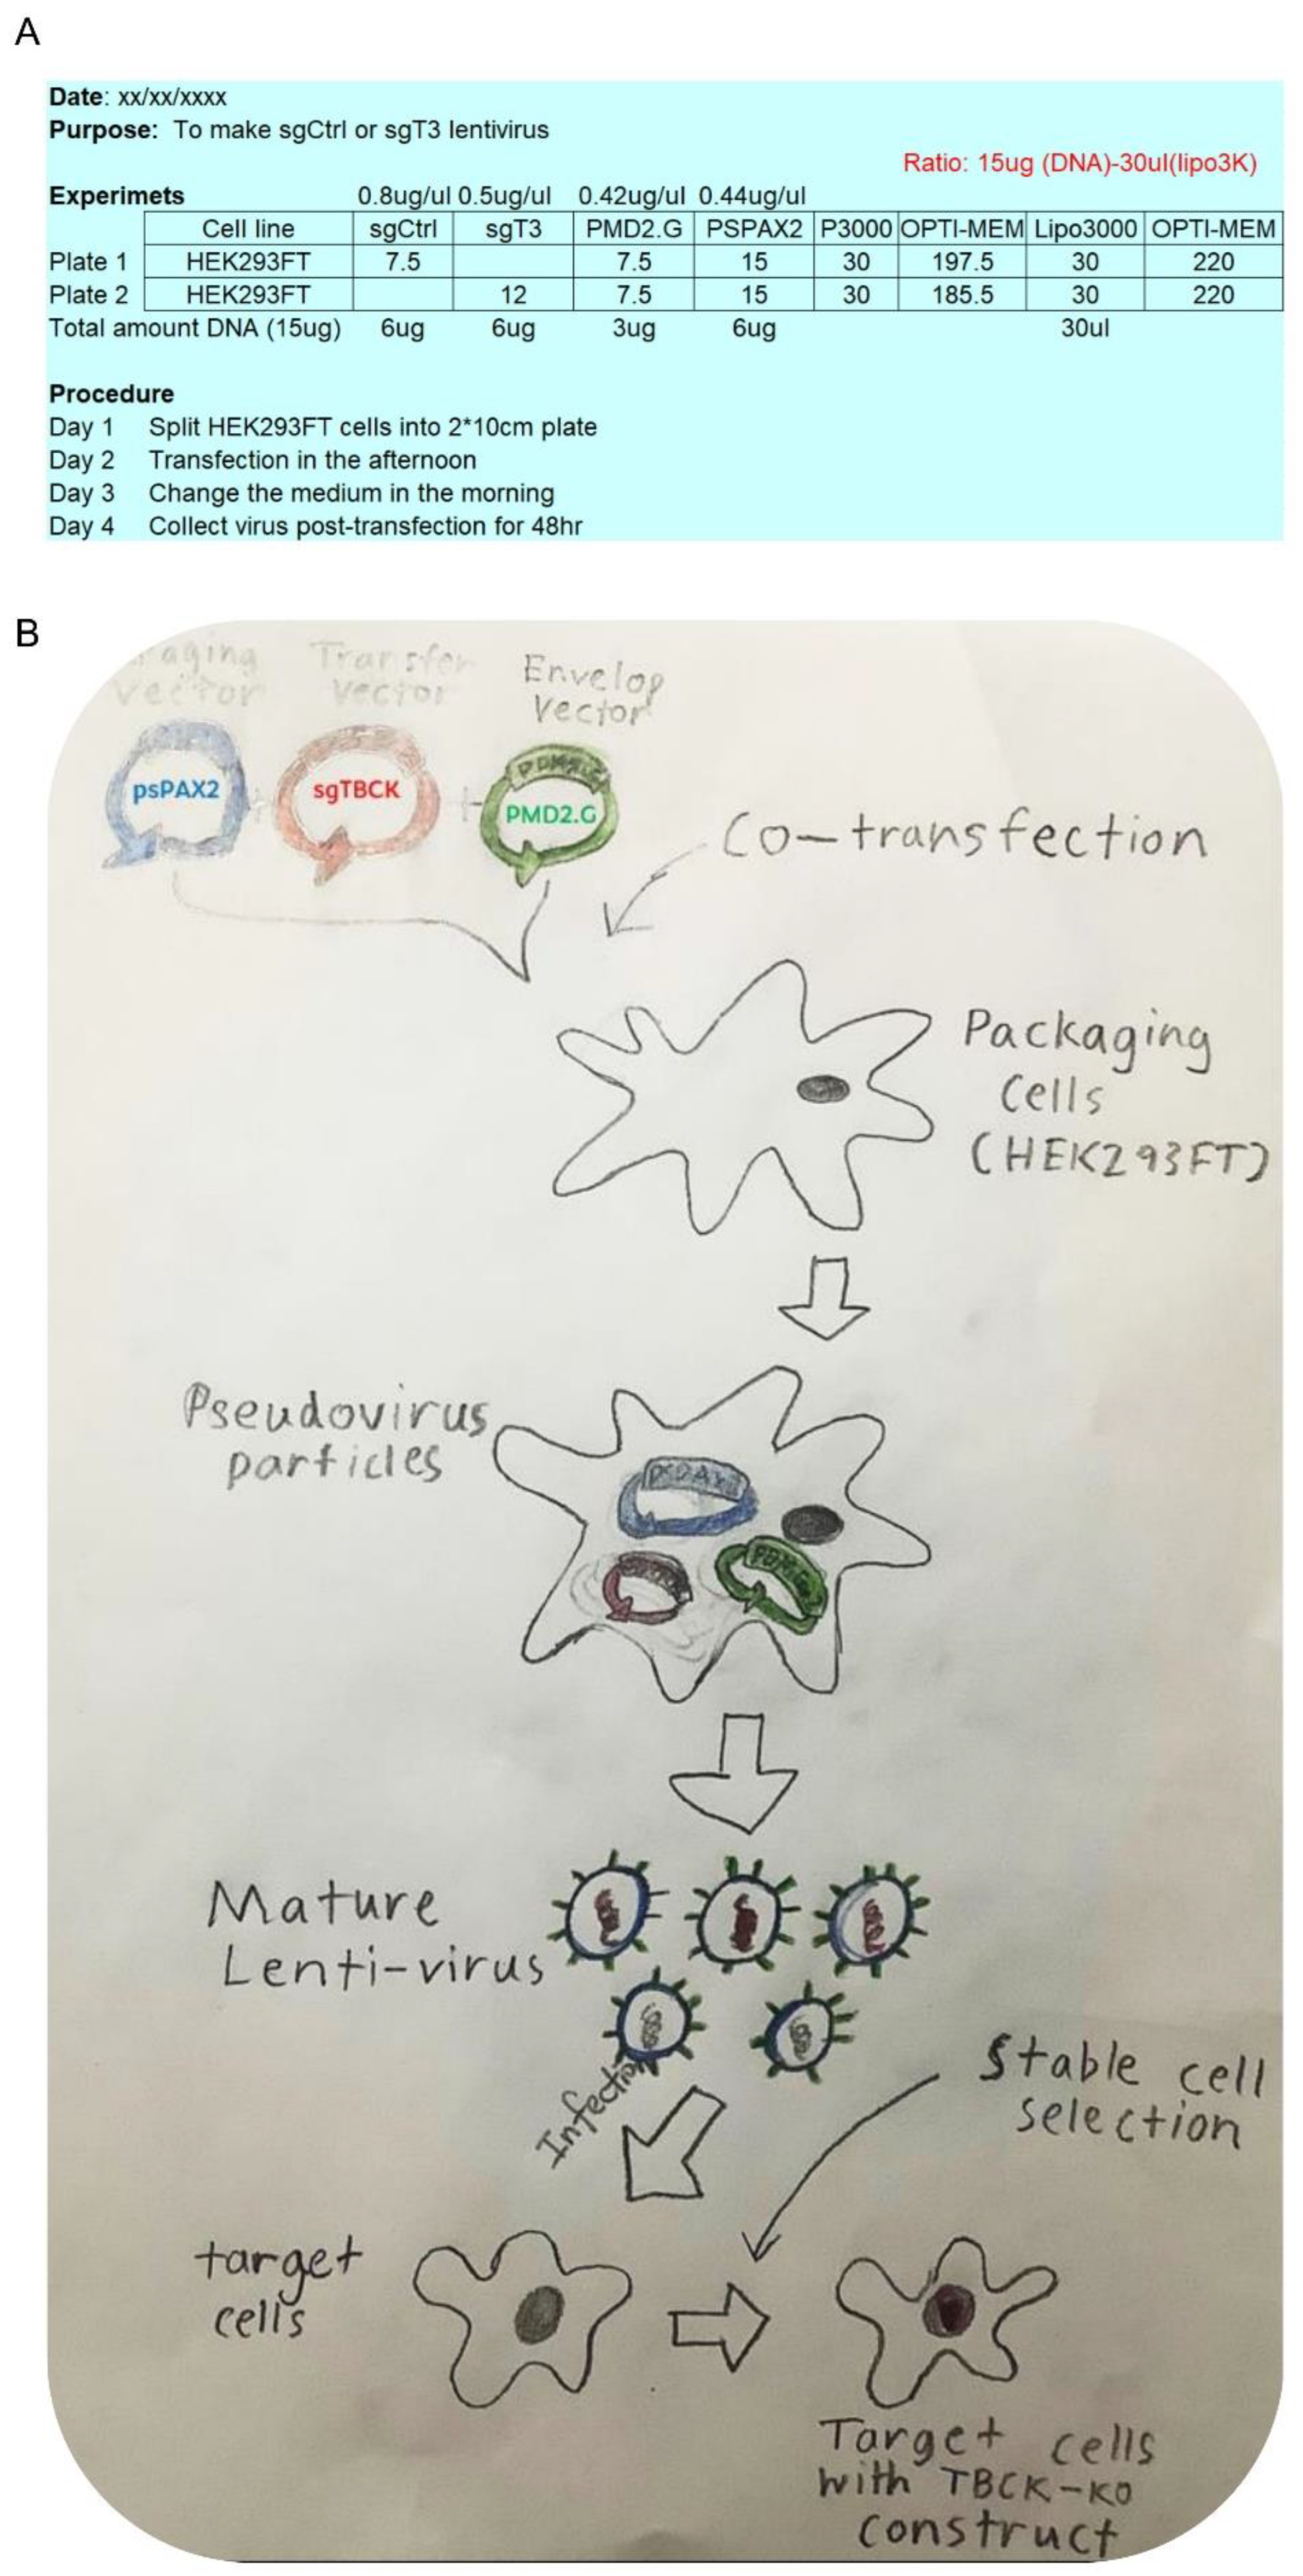
HEK293FT cells were plated at a density of 1.0*E7 cells per plate (10 ml volume) 24h pre-transfection in a 10cm dish. Transfections were performed using Lipofectamine™ 3000 Transfection Reagent (Thermo) according to the manufacturer's protocol. Two solutions were prepared for each plate. One solution contained 30 μl of Lipofectamine™ 3000 diluted in 250 μl of Opti-MEM (Gibco) and incubated at room temperature for 5 min. The second solution contained 3 ug of pMD2.G (Addgene 12259), 6 ug of psPAX2 (Addgene 12260), and 6 ug of transfer vectors (pL-CRISPR-(sgCtrl or sgTBCK).EFS.tRFP) in a final volume of 250 μL with Opti-MEM. Both solutions were then mixed and incubated at room temperature for 15 min. During this incubation period, changed 5 ml of fresh DMEM media for HEK293FT cells. The transfection mixture (500 ul) was added dropwise to the cells. 6–8 h post-transfection the media was removed and replaced with 10 ml viral harvest media (DMEM + 10% FBS + 1% BSA). Virus media was collected 48 h post-transfection (Figure 5A,B).
- Determination of Infection Conditions
Optimal infection conditions were determined for each batch of virus prep in each cell line to achieve 30–50% infection efficiency. Infections were conducted in 6-well plates with 50% confluency of cells per well. Optimal conditions were determined by checking the RFP signals in infected cells with different virus volumes (0, 250, 500 and 1000 μl for pL-CRISPR EFS.tRFP virus) for both sgCtrl and sgTBCK. We determined that 500 ul of lentivirus is optimal for infection for all three target cell models (Mia PaCa-2, HT1080 and KPC3 in Table 2). 1 ml of fresh DMEM, or RMPI1640, media with 3ul polybrene (4ug/ul) and 0.5 ml of lentivirus were added to each well.
- Single Cell Clone Selection, Genomic DNA Preparation and Sequencing
Due to the lack of antibiotic selection markers for the pL-CRISPR.EFS.tRFP vector, we used a limited dilution method to screen single cell clones. Next, we selected candidate single cell clones based on RFP signal intensity and assessed vector efficiency at the protein level via Immunoblot analysis. Positive cell clones were then collected for Genomic DNA preparation and sanger sequencing.
Briefly, approximately 5×10⁶ target cells were digested and collected to isolate Genomic DNA (gDNA) using QIAMP DNA Mini kits according to the manufacturer's protocol (Qiagen). Human or mouse gDNA fragments covering partial introns 2 and 3, and exon 3 were amplified using specific primers (Table 1) under to the following PCR conditions: an initial 5 min at 98 °C; followed by 30 s at 98 °C, 30 s at 55 °C, 45 s at 72 °C, for 32 cycles; and a final 5 min extension at 72 °C. The DNA fragments were then purified for sanger sequencing.
- DNA and Protein Sequence Analysis
TBCK mRNA and gDNA sequences were downloaded from the NCBI database. The resultant sequences from sanger sequencing were analyzed by SnapGene Viewer 5.3.2, plasmid Editor APE (https://jorgensen.biology.utah.edu/wayned/ape/) [14] or NCBI BLAST databases. The Protein Domain Structure Visualization software DOG (Domain Graph, version 1.0) [15] was used to visualize all three domains of TBCK in this study.
- Immunoblot Analysis
Primary antibodies for immunoblot analysis were purchased from Cell Signaling Technology and included: p-RB(S807/S811) (8516S), pS6 (S235/236) (2211), S6 (2217) and PARP (9542S). Actin (SC-47778), GAPDH (SC-47724) and cyclin A (SC-271682) antibodies were purchased from Santa Cruz Biotechnology. The KRAS antibody (12063-1-AP) was purchased from Proteintech and p62 antibody (H00008878-M01J) was purchased from Abnova. The whole-cell extracts were prepared by lysing the cells with RIPA lysis buffer (Santa Cruz Biotechnology, SC-24948A) in the presence of 1X Halt protease inhibitor (Thermo Fisher) and 1 mM PMSF (Sigma). The extracted proteins were quantified using the Bio-Rad DC Protein assay kit (BioRad 5000111). 20 μg of total lysates were resolved by SDS-PAGE and transferred to PVDF membranes, which were then incubated with primary antibodies at RT for 2hr or 4°C overnight. This was followed by incubation with HRP-tagged anti-mouse or anti-rabbit secondary antibodies at room temperature for 30min. An enhanced chemiluminescence kit (Thermo Fisher, 34076) was used to detect the immunoreactive bands and the relative expression of TBCK and related proteins were analyzed by mean gray values using the Image J software.
Transcriptome Analysis
- RNA-seq
Mia PaCa-2 cells infected with sgCtrl or sgTBCK were collected for total RNA isolation using the Qiagen RNeasy plus kit. RNA quantity and quality were measured with a NanoDrop ND-1000 spectrophotometer and RNA integrity was assessed by standard denaturing agarose electrophoresis. Preparation of the RNA library and transcriptome sequencing was conducted by Novogene Co., LTD (Beijing, China).
- DEG (differentially expressed gene) Analysis
The “limma” package of R (version 3.5.1) was applied to obtain DEGs between sgCtrl and sgTBCK cells as previous reported [16, 17]. |Log fold change|>2 and adjusted P-values < 0.01 were the criteria used for defining DEGs. “GdcVolcanoPlot” packages in R were employed to generate volcanoe plots to visualize the DEGs. Genes that were upregulated and downregulated in sgTBCK group were used for gene pathway analysis using ENRICHR (https://maayanlab.cloud/Enrichr/) webserver [18-20] and MSigDB Hallmark 2020 dataset [21].
- Gene set enrichment analyses (GSEA)
Curated sets v7.4 collections were obtained from the Molecular Signatures Database and the target sets then had GSEA performed by using GSEA 4.2.1 software [22, 23]. The whole transcriptome for both sgCtrl and sgTBCK samples were used for the GSEA, and only gene sets with P < .001 and FDR, q < .001 were regarded as statistically significant.
- Gene Ontology (GO) enrichment and STRING analysis
In the present study, R “clusterProfiler”, “org.Hs.eg.db”, “enrichplot” and “ggplot2” packages (R version: 3.5.1) were employed to analyze the GO function of the DEGs between sgCtrl and sgTBCK groups. Furthermore, adjusted P-values < 0.05 were used to filter the functional results. STRING analysis was performed on proteins that were significantly different between groups using the online application on string-db.org [24].
- Statistical analysis
R (version 3.5.1) software and the GraphPad Prism 8 software were used for statistical analysis. A Student’s t-test was used to analyze differential expression in different groups. Statistical significance was defined as p-values less than 0.05.
Results
- Design of sgRNAs Targeted to the TBCK Gene
A well-designed single-guide RNA (sgRNA) determines the overall performance of the CRISPR/Cas system. Around 20 bioinformatic tools have been created for designing efficient and specific sgRNAs for candidate genes [25], such as CRISPR.mit [26] and sgRNA designer [27, 28]. Due to the design specifications, parameters and other aspects, the on-target efficiency and off-target effects for each tool were different [27]. To induce efficient knockout of the human TBCK gene, different TBCK-targeting sgRNAs were designed. The TBCK gene consists of 26 exons that can be alternatively spliced to produce 9 TBCK isoforms [1, 9] that may have distinct functions. Four sgRNA oligos against TBCK, that had an acceptable On-Target Efficacy Score, were selected using the online sgRNA designer tool (now called CRISPick, Table 1) and the Human CRISPR Knockout Pooled Library database [29] to generate two sets of sgRNAs (Table 2). Additionally, a non-targeting control sgRNA (two oligos) was setup as previously reported (Table 1) [30]. All six oligos were sent out for synthesis of the following vector construction and applications (Figure 1).
- TBCK knockout vector construction
The major steps of lentivector construction include: Lentiviral vector digestion, oligo annealing, ligation, transformation, single positive clone screening by PCR, and validation by Sanger sequencing (Figure 2).
Detailed information can be found below:
1. Digest and dephosphorylate 5ug of the lentiviral plasmid pL-CRISPR.EFS.tRFP with BsmBI enzyme for 30 min at 37C:
5 ug pL-CRISPR.EFS.tRFP (Addgene)
3 ul FastDigest BsmBI (Fermentas)
3 ul FastAP (Fermentas)
6 ul 10X FastDigest Buffer
0.6 ul 100 mM DTT (freshly prepared)
X ul ddH2O
60 ul total
2. Gel purify digested plasmid using QIAquick Gel Extraction Kit and elute in EB.
3. Phosphorylate and anneal each pair of oligos:
1 ul Oligo 1 (100 μM)
1 ul Oligo 2 (100 μM)
2 ul 5X T4 Ligation Buffer (Thermo Fisher Scientific)
5.5 ul ddH2O
0.5 ul T4 PNK (NEB)
10 ul total
Put the phosphorylation/annealing reaction in a thermocycler using the following parameters:
37C 30 min
95C 5 min and then ramp down to 25C at 5C/min
4. Dilute annealed oligos from Step 3 at a 1:200 dilution into sterile water or EB.
5. Set up ligation reaction and incubate at room temperature for 10 min:
1 ul BsmBI digested pL-CRISPR.EFS.tRFP from Step 2 (50ng)
1 ul diluted oligo duplex from Step 4
2 ul 5XT4 DNA Ligase Buffer (Thermo Fisher Scientific)
5 ul ddH2O
1 ul T4 DNA Ligase (Thermo Fisher Scientific)
10 ul total
Also perform a negative control ligation (vector-only with water in place of oligos) and transformation.
6. Transformation into Stbl3 bacteria cells.
Lentiviral transfer plasmids contain Long-Terminal Repeats (LTRs) and must be transformed into recombination-deficient bacteria cells (Such as Stbl3).
7. Screening positive bacterial clones for pL-CRISPR.EFS.tRFP with double-stranded oligo inserts:
Run a bacteria liquid PCR for 2-4 colonies per transformed vector (2 colonies should always be enough as this procedure should have 90-100% efficiency). For the current study, 2 clones were used as templates to perform bacteria PCR using hU6-F (5'-GAGGGCCTATTTCCCATGATT-3') and reverse Primers (10 uM of oligo 2 (sgTBCK-1) or oligo 4 (sgTBCK-3). The positive clones should generate a band with a predicted size of 270bp. Indeed, all four clones against sgTBCK-1 or sgTBCK-3 generated the expected PCR products (Figure 3A). Further sanger sequencing using a hU6-F primer proved that all four clones had intact sgRNA, and partial upstream U6 and downstream gRNA scaffold sequences, indicating a 100% transformation rate for the vector construction (Figure 3B). pL-CRISPR.EFS.tRFP-sgTBCK-1-C1 (sgT1) and pL-CRISPR.EFS.tRFP-sgTBCK-3-C1 (sgT3) were selected for the following midipreps and other applications.
- Knockout Efficiency of TBCK in HEK293FT Cells
The above results showed that we were able to successfully generate positive TBCK-Knockout vectors. To assess the knockout efficiency of the sgTBCK vectors that we generated, we next did a transient transfection for either sgCtrl or sgTBCKs (sgT1-C1 and sgT3-C1) plasmids into HEK293FT cells. As shown in Figure 4A, the indicator RFP intensity represents the overall transfection efficiency. Even though sgT1 and sgT3 vectors have similar transfection efficiency, their effects on TBCK knockout efficiency and downstream effectors differ greatly (Figure 4B-C). sgT3 depleted around 50% of TBCK, P62, and Kras, while also inducing a nearly 200% increase in the expression of pRB and cyclin A. However, sgT1 seemed to have no effect on TBCK, or its downstream effectors. Based on these results, sgT3 was selected for the remainder of our experiments.
- Lentivirus Preparation and Target Cell Infection
Next, we prepared packaging vector psPAX2, envelop vector PMD2.G and transfer vector pL-CRISPR.sgT3.tRFP vector to make Lentivirus (Figure 5A). On day 1, HEK293FT cells were split into 10cm plates for sgT3 and sgCtrl, and allowed to grow until an 80% confluency was reached (approximately 24h). On day 2, we transfected the HEK293T cells by adding 5ml of fresh DMEM media with 0.5ml of the transfection reaction mixture that included the packaging vector, transfer vector and Envelop vector. On day 3, we added 10ml of fresh DMEM media and allowed HEK293T cells to produce mature lentivirus for the next 24hr. On day 4, the mature lentiviral vector supernatants were collected and aliquoted into 10 cryogenic vials (1ml/vial) for direct infection (Figure 5B). PEG-it Virus Precipitation Solution can also be used to concentrate lentivirus particles. Finally, the collected lentivirus was used for infection of our target cells. Herein, we utilized sgT3 lentivirus to infect multiple human and mouse cell models (Table 3).
Figure 5.
Lentivirus preparation. A. Detailed protocol to make lentivirus for sgCtrl and sgT3. B. Schematic for lentivector packaging and transduction. The process of producing infectious transgenic lentivirus included co-transfection of 3 plasmids (packaging plasmid psPAX2 + envelope plasmid PMD2.G + transfer plasmid pL-CRISPR.sgCtrl.tRFP or pL-CRISPR.sgT3.tRFP) are transfected into HEK293FT cells. After a media change and a brief incubation period, the supernatant containing the virus is removed and stored or centrifuged to concentrate virus. Crude or concentrated virus can then be used to transduce the cells of interest.
- Single Cell Clone Selection and Validation in MIA PaCa-2 Cell Model
We first utilized our sgCtrl and sgT3 lentivirus to infect PDAC MIA PaCa-2 cells marked with H2B-GFP. To obtain better infection efficiency, we infected target cells twice. Then, we digested and split 100 cells into one 96-well plate for single clone selection. Two weeks later, we transferred 12 single clones from our 96-well plate to a 24-well plate. WB analysis was used to further confirm that sgT3 had a 58.3% TBCK knock-out efficiency (7/12) in our MIA PaCa-2 cell model (Figure 6A). Additionally, by utilizing a fluorescent microscope we saw that our selected clones in both sgCtrl and sgT3 (sgT3-C2/C6/C11) groups had intense RFP signals, indicating a high degree of infection efficiency (Figure 6B). To further uncover the variation patterns caused by CRISPR-mediated gene editing, we designed a primer set located on intron 2 and intron 3 to cover sgT3 in exon 3. PCR results showed that sgCtrl cells only generated one single band (461bp), while sgT3 cells either generated on single band (C2) or two bands (C6/C11) (Figure 6C). Further sanger sequencing analysis demonstrated that no mutations were found in sgCtrl cells, while T insertion was verified in all 3 clones of sgT3 cells (Figure 6D and Figure S1A). All of exon 3 and a portion of intron 2 were also missing in sgT3 cells, but not in sgCtrl cells (Figure 6E and Figure S2A). Sequence alignment based on DNA variations mediated by sgT3 showed that T insertion potentially changed the open reading frame (ORF) of TBCK and generated the following truncated TBCK products: Truncated TBCK-A (98aa) and Truncated TBCK-B (787aa) (Figure 6F and Figure S1B). While exon 3 skipping did not alter the ORF, it also generated a shorter TBCK product: Truncated TBCK-C (869aa) (Figure 6F and Figure S2B-C). Considering the binding sequence for the TBCK antibody (HPA039951) is located at the C terminal domain of TBCK, truncated TBCK-A couldn’t be recognized, while truncated TBCK-B and Truncated TBCK-C could possibly be detected. However, we could only detect one clear single band for full-length TBCK in sgCtrl cells, but not truncated products (Figure 6G). One possible reason is that these abnormal products are not stable and might undergo rapid degradation. Taken together, sgT3 can efficiently edit TBCK gDNA and introduce a T insertion, or Exon 3 skipping, to block normal Full-length TBCK expression.
- The Knockout Vector Can be Applied in Fibrosarcoma HT1080 Cell Model
To further confirm the efficacy of sgT3 for TBCK Knockout in other human cell models, we also used the virus to infect the Fibrosarcoma HT1080 cell model. As depicted in MIA PaCa-2 cell model, the same strategy was performed and 4 single cell clones were picked for immunoblot analysis (Figure 7A). Compared to the knockout efficiency seen in our MIA PaCa-2 model, the knockout efficiency in our HT1080 model was less effective and only had a 25% decrease in TBCK. Despite the poor knockout efficiency in HT1080 cells, we were still able to use PCR amplification to generate a single clear PCR product for both sgCtrl and sgT3 groups that is similar to the sgT3-C2 seen in MIA PaCa-2 cells (Figure 7B). Sanger sequencing further confirmed that CRISPR-mediated gene editing in our HT1080 cell model also introduced a T insertion at the same site as MIA PaCa-2 (Figure 7C), suggesting a similar mechanism for deleting TBCK expression.
- The Human Specific sgRNA against TBCK Showed Little Effects on Mouse Cells
After confirming the substantial effects of sgT3 on human cell models, we wanted to know whether sgT3 could also yield similar results in mouse cells. Firstly, we compared the sequence similarity between human and mouse TBCKs and found a two-base mismatch in the sgRNA region (Figure 8A). Initially, we hypothesized that this two-base mismatch would have little to no effects on editing efficiency. KPC3 mouse cells were infected with either sgCtrl or sgT3 lentivirus and screened for single cell clones as was done in our human cell models. Finally, four clones were selected based off of their intense RFP signals (Figure 8B), indicating a high degree of infection. However, little effects on TBCK expression were observed by immunoblot analysis (Figure 8C). Consistent with this, PCR analysis using a primer set located on intron 2 and intron 3 of mouse Tbck generated a clear single band for 5 clones infected with either sgCtrl, or sgT3 lentivirus (Figure 8D). Further sanger sequencing analysis showed that no mutations were found in the sgRNA region for all five clones (Figure 8E and Figure S3). Although double peaks occurred downstream of the sgRNA region for clones 3, 6, and 9 (Figure 8E), the variations in intron 3 had no effects on protein expression (Figure S3). Taken together, while sgT3 can efficiently infect mouse cells, it has no effects on TBCK expression, which can be attributed to the 2-base mismatch seen in the sgRNA region.
- RNA-Seq Application for TBCK Knockout Single Clone in PDAC Model
Based on the overall workflow for our TBCK knockout system shown in Figure 1, we performed transcriptome analysis for MIA PaCa-2 cells infected with sgCtrl or sgT3 lentivirus. As shown in Figure 9A, triplicated samples in sgT3 had completely depleted TBCK protein levels after stable infection with sgT3-C6 lentivirus, whereas TBCK protein was not affected in sgCtrl cells. Bioinformatic analysis revealed that TBCK knockout elicited both 314 significantly downregulated genes (Table S1), and induced 184 significantly upregulated genes (Figure 9B, Table S2). We used pathway analysis to compare our downregulated genes to hallmark gene sets in the Molecular Signatures Database (MSigDB) and saw a significant enrichment in TNF-α signaling, Apoptosis, Hypoxia, P53, and Epithelial Mesenchymal Transition pathways (Figure 9C), illustrating an essential role of TBCK in cancer progression. Similar analysis for the upregulated genes uncovered a high enrichment in interferon gamma response and other immune related pathways (Figure 9D). This activated immune response signature is consistent with previous reports in both the A431 model, where siRNA mediated knockdown of TBCK was shown to activate the STAT3 signaling pathway [7], as well as our previous data showing that RNAi-mediated knockdown of TBCK in HeLa cells elicited a similar response (Figure S4). Five selected genes from each enriched pathway were selected to show the overall change in their expression which is illustrated by the heatmap shown in Figure 9E. Of important note, GSEA analysis also showed similar enriched pathways for both downregulated and upregulated gene sets (Figure S5A and S5B). To further explore this, we created 3 enriched plots for both downregulated and upregulated gene sets. This identified that the down regulated genes were significantly enriched in ER response, p53, and EMT pathways; while the upregulated genes were significantly enriched in interferon gamma, metabolism, and E2F pathways (Figure 9F-G). Expression of selected genes within each pathway were also seen to be significantly downregulated, or upregulated, in MIA PaCa-2-sgTBCK cells when compared to control cells (Figure 9G).
In addition to hallmark pathway analysis, we also performed Gene Ontology analysis for both downregulated and upregulated gene sets. The downregulated genes were mainly enriched in Negative regulation of phosphorylation (GO: 0042326), Negative regulation of cell growth (GO: 0030308), and Collagen-containing extracellular matrix (GO: 0062023) (Figure 10A-B). The upregulated genes were largely enriched in Antigen processing and presentation (GO: 0002495), and Golgi apparatus subcompartment (GO: 0098791) (Figure 10C-D). Despite our previous reports showing that the TBCK protein included a STYKc kinase domain, TBC domain, and RHOD domain [1, 9], other papers have referred to TBCK as a pseudokinase since it lacks a conserved motif for kinase activity [8, 31, 32]. Given that our transcriptome analysis linked TBCK to the regulation of protein phosphorylation, we wanted to further explore TBCK’s role as a potential kinase. Since TBCK is implicated in various biological processes, we wanted to find what specific functions this protein has in them. Finally, to further analyze the potential relationship between TBCK and the DEGs, we put TBCK and all DEGs into the online STRING database. From this we saw that there was only one connection between them, which was PLXNB2 in the downregulated gene set. To further confirm our results, we added TBCK and the upregulated, or downregulated DEGs, separately and found that no connections were observed between TBCK and the upregulated DEGs (Figure 10E). However, when we added TBCK and the downregulated genes, we saw that the connection between TBCK and PLXNB2 was present, highlighting the relationship between TBCK and the downregulated DEG list (Figure 10F-H). PLXNB2 has been shown to bind Class IV Semaphorins, which are involved in brain development. Additionally, Semaphorins also play a role in actin cytoskeleton organization, and cell migration [33, 34]. We found that several Semaphorin members, such as SEMA3C/3F/4B/4D/6B, were also found in our downregulated gene list (Figure 10F-H), indicating that TBCK may be an indirect regulator of Class IV Semaphorins. The relationship between TBCK and PLXNB2 may serve as a novel regulatory mechanism in neurodevelopment diseases that go beyond only affecting the mTOR signaling pathway [2-4]. Despite there being no connections observed between TBCK and the upregulated DEG list, TBCK may have an inhibitory role in MHCII related pathways given that there is an enrichment of MHCII in the upregulated immune signature (Figure 10E). Although this is consistent with our Gene Ontology analysis, further work needs to be done to identify the exact role TBCK is playing in immune regulatory pathways.
Discussion
It has been 13 years since the first functional study associated with TBCK was reported and encouraging progress has been made regarding the role of TBCK mutation in neurodevelopmental diseases. Homozygous, or compound heterozygous variants, in TBCK lead to an intellectual impairment phenotype that is associated with hypotonia and characteristic facies type 3 (IHPRF3; OMIM: 616900) [2, 3, 35]. Downstream, TBCK-mediated, inhibition of mTOR can alter autophagy of oligosaccharides, demonstrated by significantly reduced lysosomal proteolytic function in TBCK-deficient fibroblasts. Except for the role of TBCK in the development of epidermoid carcinoma [7] and cervical carcinoma [9], the cancer related studies of TBCK have been rather limited and only encompass soft tissue angiofibroma [10], Clear cell Carcinoma [11] and Hepatocellular Carcinoma [12]. However, the detailed mechanism for TBCK’s roles in neurodevelopment and cancer pathogenesis are yet to be elucidated. In our current study, we combined a CRISPR-mediated knockout system, and transcriptome analysis, to dissect the direct roles of TBCK in Pancreatic ductal adenocarcinoma.
CRISPR-Cas9–based genetic screens are a powerful tool for manipulating the genome and many studies have looked at sgRNA sequences and experimental conditions to see how both can influence Cas9 off-target activity [36-44]. Around 20 bioinformatic tools have been created for designing efficient and specific sgRNAs for candidate genes [25]. However, due to the design specifications, parameters and other aspects, the on-target efficiency and off-target effects for each tool are different. To increase the rigor and efficiency of our knockout system, we utilized both a sgRNA designer to design our 100 sgRNAs, and the Human CRISPR Knockout Library to screen the best two sgRNAs based on On-Target Efficacy Score (Table 1). One of the main goals for our group was to create a clear and straightforward workflow (Figure 1) with a detailed schematic diagram (Figure 2), that makes this knockout system easy to follow. This strategy is not limited to TBCK and can be used on any gene of interest. After confirming the correct sequence for both TBCK knockout vectors (Figure 3), we performed transient transfection and immunoblot analysis to confirm that sgT3 showed high knockout efficiency, whereas sgT1 had no effects on TBCK depletion (Figure 4). Given this, sgT3 was selected for further lentivirus preparation and target cell infection (Figure 5). Interestingly, TBCK depletion decreased the expression of P62 and Kras, indicating that TBCK has an activating role in mTOR and Kras signaling pathways. We first validated the knockout efficiency of TBCK in our PDAC MIA PaCa-2 model. Sanger sequencing on selected single-cell clones showed that sgT3 can efficiently edit TBCK gDNA and introduce a T insertion that leads to a truncated product and further blocks normal Full-length TBCK expression (Figure 6). Besides T insertion, we wanted to see if exon 3 skipping might also generate shorter protein products. However, we were unable to detect them due to weak stability of these products. Interestingly, CRISPR-mediated gene editing in HT1080 models also introduced a T insertion in the same site as MIA PaCa-2 (Figure 7), which shows a consistent mechanism for deleting TBCK expression in human cancer cell lines. Considering the sequence similarity between human and mouse TBCK mRNA, we hypothesized that the human sgTBCK would also work in our mouse cells. However, even though plenty of RFP signals were observed for our selected single cell clones, there were little or no effects seen on reducing TBCK protein level in both our immunoblotting and sanger sequencing assays (Figure 8). From our sanger sequencing, we were able to see that the 2bp mismatch between human and mouse TBCK largely blocked the cutting efficiency of our CRISPR-CAS9 system, which highlights the need for mouse specific sgRNAs to be designed for TBCK.
Finally, we performed RNA-seq using MIA PaCa-2 cells stably infected with sgCtrl, or sgTBCK lentivirus as a downstream application. Unexpectedly, hallmark pathway analysis uncovered significant enrichment in several important cancer related pathways; such as TNF-alpha, Apoptosis, Hypoxia, P53, EMT, interferon gamma, metabolism and MTORC1 (Figure 9). Previous research has highlighted the important roles of the mTOR pathway in neurodevelopment diseases and cancer progression. Additionally, GO analysis further showed the involvement of TBCK in the regulation of protein phosphorylation, cell growth and extracellular matrix processes. Based on bioinformatic analysis, TBCK is considered a pseudokinase as its kinase domain lacks several important motifs that regulate kinase activity. For instance, the GXGXXG and VAIK motifs for ATP binding, and the HRD motif for catalytic activity, are both absent in TBCK [8]. Although bioinformatic assays have shown this to be true, there have been no functional assays to confirm this and TBCK may still possess some basal kinase activity. Similarly, depletion of TBCK may affect other protein kinases suggesting a possible regulatory role for this pseudokinase. The enrichment of cell growth for downregulated DEGs suggests a positive role for TBCK in cell growth in MIA PaCa-2 cells, which is consistent with previous reports in other models [8, 11]. Extracellular matrix pathways were significantly downregulated suggesting that depletion of TBCK may affect the tumor microenvironment. Upregulation of cell antigen processing and presentation in the Golgi apparatus sub-compartment that accompanies TBCK depletion may be a novel mechanism for PDAC progression. Our study also found only one connection between TBCK and PLXNB2 in the downregulated DEGs list, as well as multiple PLXNB2 associated proteins; such as Semaphorin family members SEMA3C, SEMA3F, SEMA4B, SEMA4D, SEMA6B, RET and NRP1 (Figure 10F-H). Semaphorins are a large family of transmembrane GPI-anchored, or secreted proteins, that were originally identified as indispensable regulators of neuron-axonal guidance [45], which highlights an important function of TBCK in Brain development. Beyond brain development, Semaphorins also function in a broad spectrum of pathophysiological conditions that include atherosclerosis and vascular inflammatory disease [46]. The essential Receptor tyrosine-protein kinase RET, was found to be closely related to PLXNB2 [47, 48] and was also downregulated in TBCK knockout cells (Figure 10F-H). The cell-surface receptor NRP1 is involved in the development of the cardiovascular system, angiogenesis, formation of certain neuronal circuits, and in organogenesis outside the nervous system [49-51]. TBCK’s important role in developmental pathways, as well as in cancer-related pathways, emphasizes the importance of performing further functional assays to better elucidate its role in disease pathogenesis. While our results are a novel discovery for TBCK's involvement in multiple cancer-related pathways, further work needs to be done to better understand the functional role that TBCK plays within these pathways.
Conclusions
In summary, we drafted a clear and straightforward workflow, detailed protocol, and schematic diagram for knocking out human TBCK via a CRISPR-Cas9 system. We also provided evidence showing the effectiveness of sgTBCK in multiple human cancer models. The application of our CRISPR knockout system for transcriptome analysis is the first high throughput screen that looked at TBCK's roles in cancer development. Specifically, our results show TBCK's involvement in multiple cancer-related pathways, such as, TNF-α signaling, Apoptosis, Hypoxia, P53, and Epithelial Mesenchymal Transition.
Supplementary Materials
Supplemental data include 5 figures and two tables.
Funding
This work was supported by Key Research and Development Project of Deyang City’s Science and Technology Bureau (2021SZ003), Special Fund for Incubation Projects of Deyang People's Hospital (FHG202004), Natural Science Foundation of Sichuan Province (2022NSFSC0714, 2023NSFSC0601) and Xinglin Scholar Project of Chendu University of Traditional Chinese Medicine (YYZX2022058).
Authors Contributions
J.W and G.L conceived the project, wrote, and revised the manuscript. J.Z, J.C and X.Z did bioinformatic analysis and revised the manuscript. J.W performed the functional experiments. A.D and J.J participated in discussion and manuscript revisions. J.W and G.L were corresponding authors. All authors critically revised the article for important intellectual content.
Data Availability Statement
The datasets used and/or analyzed during the current study are available from the corresponding author on reasonable request.
Acknowledgements
The author thanks all members of the laboratory group and colleagues in the discussion and preparation of the manuscript. Especially for Tonny Wu’s assistance in drawing the pictures for lentivirus preparation in Figure 5B.
Conflicts of Interest
There were no competing interests among the authors and fundings.
Consent for Publication
All authors have contributed signifcantly, and all authors agree with the manuscript’s content.
Abbreviations
| CRISPR | Clustered Regularly Interspaced Short Palindromic Repeats |
| Cas9 | CRISPR-associated 9 |
| TBCK | TBC1 domain containing kinase |
| HCC | Hepatocellular carcinoma |
| sgRNA | Single guide RNA |
| siRNA | Small interfering RNA |
| sgCtrl | Single guide control RNA |
| sgT1 | Single guide TBCK RNA (oligo 1) |
| sgT3 | Single guide TBCK RNA (oligo 3) |
| RNA-seq | RNA sequencing |
| DEG | Differentially Expressed Genes |
| GSEA | Gene set enrichment analyses |
| GO | Gene Ontology |
| PCR | Polymerase Chain Reaction |
| RFP | Red Fluorescent Protein |
| GFP | Green Fluorescent Protein |
| pRB | Phosphorylated Rb1 |
| gDNA | Genomic deoxyribonucleic acid |
| KPC3 | C57/BL6 genetic background mouse cell line with Kras and TP53 mutations |
| PDAC | Pancreatic ductal adenocarcinoma |
| Figure S | Supplementary Figure |
| Table S | Supplementary Table |
References
- Wu, J.; Lu, G. Multiple functions of TBCK protein in neurodevelopment disorders and tumors (Review). Oncol. Lett. 2020, 21, 12278. [Google Scholar] [CrossRef] [PubMed]
- Chong, J.X.; Caputo, V.; Phelps, I.G.; Stella, L.; Worgan, L.; Dempsey, J.C.; Nguyen, A.; Leuzzi, V.; Webster, R.; Pizzuti, A.; et al. Recessive Inactivating Mutations in TBCK, Encoding a Rab GTPase-Activating Protein, Cause Severe Infantile Syndromic Encephalopathy. Am. J. Hum. Genet. 2016, 98, 772–781. [Google Scholar] [CrossRef] [PubMed]
- Bhoj, E.J.; Li, D.; Harr, M.; Edvardson, S.; Elpeleg, O.; Chisholm, E.; Juusola, J.; Douglas, G.; Sacoto, M.J.G.; Siquier-Pernet, K.; et al. Mutations in TBCK, Encoding TBC1-Domain-Containing Kinase, Lead to a Recognizable Syndrome of Intellectual Disability and Hypotonia. Am. J. Hum. Genet. 2016, 98, 782–788. [Google Scholar] [CrossRef] [PubMed]
- Ortiz-González, X.R.; Tintos-Hernández, J.A.; Keller, K.; Li, X.; Foley, A.R.; Bharucha-Goebel, D.X.; Kessler, S.K.; Yum, S.W.; Crino, P.B.; He, M.; et al. Homozygous boricua TBCK mutation causes neurodegeneration and aberrant autophagy. Ann. Neurol. 2017, 83, 153–165. [Google Scholar] [CrossRef]
- A Tintos-Hernández, J.; Santana, A.; Keller, K.N.; Ortiz-González, X.R. Lysosomal dysfunction impairs mitochondrial quality control and is associated with neurodegeneration in TBCK encephaloneuronopathy. Brain Commun. 2021, 3, fcab215. [Google Scholar] [CrossRef]
- Nair, D.; Diaz-Rosado, A.; Varella-Branco, E.; Ramos, I.; Black, A.; Angireddy, R.; Park, J.; Murali, S.; Yoon, A.; Ciesielski, B.; et al. Heterozygous variants in TBCK cause a mild neurologic syndrome in humans and mice. Am. J. Med Genet. Part A 2023, 191, 2508–2517. [Google Scholar] [CrossRef]
- Komurov, K.; Padron, D.; Cheng, T.; Roth, M.; Rosenblatt, K.P.; White, M.A. Comprehensive Mapping of the Human Kinome to Epidermal Growth Factor Receptor Signaling. J. Biol. Chem. 2010, 285, 21134–21142. [Google Scholar] [CrossRef]
- Liu, Y.; Yan, X.; Zhou, T. TBCK Influences Cell Proliferation, Cell Size and mTOR Signaling Pathway. PLoS ONE 2013, 8, e71349. [Google Scholar] [CrossRef]
- Wu, J.; Li, Q.; Li, Y.; Lin, J.; Yang, D.; Zhu, G.; Wang, L.; He, D.; Lu, G.; Zeng, C. A Long Type of TBCK Is a Novel Cytoplasmic and Mitotic Apparatus-Associated Protein Likely Suppressing Cell Proliferation. J. Genet. Genom. 2014, 41, 69–72. [Google Scholar] [CrossRef]
- Panagopoulos, I.; Gorunova, L.; Viset, T.; Heim, S. Gene fusions AHRR-NCOA2, NCOA2-ETV4, ETV4-AHRR, P4HA2-TBCK, and TBCK-P4HA2 resulting from the translocations t(5;8;17)(p15;q13;q21) and t(4;5)(q24;q31) in a soft tissue angiofibroma. Oncol. Rep. 2016, 36, 2455–2462. [Google Scholar] [CrossRef]
- Kim, E.-A.; Jang, J.-H.; Sung, E.-G.; Song, I.-H.; Kim, J.-Y.; Lee, T.-J. MiR-1208 Increases the Sensitivity to Cisplatin by Targeting TBCK in Renal Cancer Cells. Int. J. Mol. Sci. 2019, 20, 3540. [Google Scholar] [CrossRef] [PubMed]
- Gao, J.; Xi, L.; Yu, R.; Xu, H.; Wu, M.; Huang, H. Differential mutation detection capability through capture-based targeted sequencing in plasma samples in hepatocellular carcinoma. Front. Oncol. 2021, 11, 596789. [Google Scholar] [CrossRef]
- Wu, J.; Lu, G.; Wu, J.; Yang, H.; Yu, Z.; Mu, S.; Zhang, H. Application of fusion PCR to the amplification of full-length ORF sequences of different splicing variants of from HeLa cells. Acta Biochim. et Biophys. Sin. 2017, 49, 962–965. [Google Scholar] [CrossRef]
- Davis, M.W.; Jorgensen, E.M. ApE, A Plasmid Editor: A Freely Available DNA Manipulation and Visualization Program. Front. Bioinform. 2022, 2. [Google Scholar] [CrossRef] [PubMed]
- Ren, J.; Wen, L.; Gao, X.; Jin, C.; Xue, Y.; Yao, X. DOG 1.0: Illustrator of protein domain structures. Cell Res. 2009, 19, 271–273. [Google Scholar] [CrossRef]
- Chang, J.; Wu, H.; Wu, J.; Liu, M.; Zhang, W.; Hu, Y.; Zhang, X.; Xu, J.; Li, L.; Yu, P.; et al. Constructing a novel mitochondrial-related gene signature for evaluating the tumor immune microenvironment and predicting survival in stomach adenocarcinoma. J. Transl. Med. 2023, 21, 1–24. [Google Scholar] [CrossRef] [PubMed]
- Zhu, J.; Zhang, W.; Chang, J.; Wu, J.; Wu, H.; Zhang, X.; Ou, Z.; Tang, T.; Li, L.; Liu, M.; et al. Identification and Validation of a Mitochondria Calcium Uptake-Related Gene Signature for Predicting Prognosis in COAD. J. Cancer 2023, 14, 741–758. [Google Scholar] [CrossRef] [PubMed]
- Chen, E.Y.; Tan, C.M.; Kou, Y.; Duan, Q.; Wang, Z.; Meirelles, G.V.; Clark, N.R.; Ma’Ayan, A. Enrichr: Interactive and collaborative HTML5 gene list enrichment analysis tool. BMC Bioinform. 2013, 14, 128. [Google Scholar] [CrossRef]
- Kuleshov, M.V.; Jones, M.R.; Rouillard, A.D.; Fernandez, N.F.; Duan, Q.; Wang, Z.; Koplev, S.; Jenkins, S.L.; Jagodnik, K.M.; Lachmann, A.; et al. Enrichr: A comprehensive gene set enrichment analysis web server 2016 update. Nucleic Acids Res. 2016, 44, W90–W97. [Google Scholar] [CrossRef]
- Xie, Z.; Bailey, A.; Kuleshov, M.V.; Clarke, D.J.B.; Evangelista, J.E.; Jenkins, S.L.; Lachmann, A.; Wojciechowicz, M.L.; Kropiwnicki, E.; Jagodnik, K.M.; et al. Gene Set Knowledge Discovery with Enrichr. Curr. Protoc. 2021, 1, e90. [Google Scholar] [CrossRef]
- Liberzon, A.; Birger, C.; Thorvaldsdóttir, H.; Ghandi, M.; Mesirov, J.P.; Tamayo, P. The Molecular Signatures Database Hallmark Gene Set Collection. Cell Syst. 2015, 1, 417–425. [Google Scholar] [CrossRef]
- Subramanian, A.; Tamayo, P.; Mootha, V.K.; Mukherjee, S.; Ebert, B.L.; Gillette, M.A.; Paulovich, A.; Pomeroy, S.L.; Golub, T.R.; Lander, E.S.; et al. Gene set enrichment analysis: A knowledge-based approach for interpreting genome-wide expression profiles. Proc. Natl. Acad. Sci. USA 2005, 102, 15545–15550. [Google Scholar] [CrossRef]
- Mootha, V.K.; Lindgren, C.M.; Eriksson, K.-F.; Subramanian, A.; Sihag, S.; Lehar, J.; Puigserver, P.; Carlsson, E.; Ridderstråle, M.; Laurila, E.; et al. PGC-1α-responsive genes involved in oxidative phosphorylation are coordinately downregulated in human diabetes. Nat. Genet. 2003, 34, 267–273. [Google Scholar] [CrossRef] [PubMed]
- Szklarczyk, D.; Franceschini, A.; Wyder, S.; Forslund, K.; Heller, D.; Huerta-Cepas, J.; Simonovic, M.; Roth, A.; Santos, A.; Tsafou, K.P.; et al. STRING v10: Protein–protein interaction networks, integrated over the tree of life. Nucleic Acids Res. 2015, 43, D447–D452. [Google Scholar] [CrossRef]
- Cui, Y.; Xu, J.; Cheng, M.; Liao, X.; Peng, S. Review of CRISPR/Cas9 sgRNA Design Tools. Interdiscip. Sci. Comput. Life Sci. 2018, 10, 455–465. [Google Scholar] [CrossRef] [PubMed]
- Pattanayak, V.; Lin, S.; Guilinger, J.P.; Ma, E.; Doudna, J.A.; Liu, D.R. High-throughput profiling of off-target DNA cleavage reveals RNA-programmed Cas9 nuclease specificity. Nat. Biotechnol. 2013, 31, 839–843. [Google Scholar] [CrossRef] [PubMed]
- Doench, J.G.; Fusi, N.; Sullender, M.; Hegde, M.; Vaimberg, E.W.; Donovan, K.F.; Smith, I.; Tothova, Z.; Wilen, C.; Orchard, R.; et al. Optimized sgRNA design to maximize activity and minimize off-target effects of CRISPR-Cas9. Nat. Biotechnol. 2016, 34, 184–191. [Google Scholar] [CrossRef] [PubMed]
- Doench, J.G.; Hartenian, E.; Graham, D.B.; Tothova, Z.; Hegde, M.; Smith, I.; Sullender, M.; Ebert, B.L.; Xavier, R.J.; Root, D.E. Rational design of highly active sgRNAs for CRISPR-Cas9-mediated gene inactivation. Nat. Biotechnol. 2014, 32, 1262–1267. [Google Scholar] [CrossRef]
- Sanjana, N.E.; Shalem, O.; Zhang, F. Improved vectors and genome-wide libraries for CRISPR screening. Nat. Methods 2014, 11, 783–784. [Google Scholar] [CrossRef] [PubMed]
- Holmgaard, A.; Askou, A.L.; Benckendorff, J.N.E.; Thomsen, E.A.; Cai, Y.; Bek, T.; Mikkelsen, J.G.; Corydon, T.J. In Vivo Knockout of the Vegfa Gene by Lentiviral Delivery of CRISPR/Cas9 in Mouse Retinal Pigment Epithelium Cells. Mol. Ther. - Nucleic Acids 2017, 9, 89–99. [Google Scholar] [CrossRef]
- O'Boyle, B.; Shrestha, S.; Kochut, K.; Eyers, P.A.; Kannan, N. Computational tools and resources for pseudokinase research. 2022, 667, 403–426. [CrossRef]
- Metz, K.S.; Deoudes, E.M.; Berginski, M.E.; Jimenez-Ruiz, I.; Aksoy, B.A.; Hammerbacher, J.; Gomez, S.M.; Phanstiel, D.H. Coral: Clear and Customizable Visualization of Human Kinome Data. Cell Syst. 2018, 7, 347–350. [Google Scholar] [CrossRef] [PubMed]
- Perrot, V.; Vazquez-Prado, J.; Gutkind, J.S. Plexin B regulates Rho through the guanine nucleotide exchange factors leukemia-associated Rho GEF (LARG) and PDZ-RhoGEF. J. Biol. Chem. 2002, 277, 43115–43120. [Google Scholar] [CrossRef] [PubMed]
- Conrotto, P.; Corso, S.; Gamberini, S.; Comoglio, P.M.; Giordano, S. Interplay between scatter factor receptors and B plexins controls invasive growth. Oncogene 2004, 23, 5131–5137. [Google Scholar] [CrossRef]
- Sumathipala, D.; Strømme, P.; Gilissen, C.; Corominas, J.; Frengen, E.; Misceo, D. TBCK Encephaloneuropathy With Abnormal Lysosomal Storage: Use of a Structural Variant Bioinformatics Pipeline on Whole-Genome Sequencing Data Unravels a 20-Year-Old Clinical Mystery. Pediatr. Neurol. 2019, 96, 74–75. [Google Scholar] [CrossRef]
- Jinek, M.; Chylinski, K.; Fonfara, I.; Hauer, M.; Doudna, J.A.; Charpentier, E. A Programmable dual-RNA-guided DNA endonuclease in adaptive bacterial immunity. Science 2012, 337, 816–821. [Google Scholar] [CrossRef]
- Mali, P.; Yang, L.; Esvelt, K.M.; Aach, J.; Guell, M.; DiCarlo, J.E.; Norville, J.E.; Church, G.M. RNA-Guided Human Genome Engineering via Cas9. Science 2013, 339, 823–826. [Google Scholar] [CrossRef]
- Cong, L.; Ran, F.A.; Cox, D.; Lin, S.; Barretto, R.; Habib, N.; Hsu, P.D.; Wu, X.; Jiang, W.; Marraffini, L.A.; et al. Multiplex Genome Engineering Using CRISPR/Cas Systems. Science 2013, 339, 819–823. [Google Scholar] [CrossRef]
- Jinek, M.; East, A.; Cheng, A.; Lin, S.; Ma, E.; Doudna, J. RNA-programmed genome editing in human cells. eLife 2013, 2, e00471. [Google Scholar] [CrossRef] [PubMed]
- Fu, Y.; A Foden, J.; Khayter, C.; Maeder, M.L.; Reyon, D.; Joung, J.K.; Sander, J.D. High-frequency off-target mutagenesis induced by CRISPR-Cas nucleases in human cells. Nat. Biotechnol. 2013, 31, 822–826. [Google Scholar] [CrossRef]
- Veres, A.; Gosis, B.S.; Ding, Q.; Collins, R.; Ragavendran, A.; Brand, H.; Erdin, S.; Cowan, C.A.; Talkowski, M.E.; Musunuru, K. Low Incidence of Off-Target Mutations in Individual CRISPR-Cas9 and TALEN Targeted Human Stem Cell Clones Detected by Whole-Genome Sequencing. Cell Stem Cell 2014, 15, 27–30. [Google Scholar] [CrossRef]
- Ran, F.A.; Hsu, P.D.; Lin, C.-Y.; Gootenberg, J.S.; Konermann, S.; Trevino, A.E.; Scott, D.A.; Inoue, A.; Matoba, S.; Zhang, Y.; et al. Double Nicking by RNA-Guided CRISPR Cas9 for Enhanced Genome Editing Specificity. Cell 2013, 154, 1380–1389. [Google Scholar] [CrossRef]
- Guilinger, J.P.; Thompson, D.B.; Liu, D.R. Fusion of catalytically inactive Cas9 to FokI nuclease improves the specificity of genome modification. Nat. Biotechnol. 2014, 32, 577–582. [Google Scholar] [CrossRef]
- Hsu, P.D.; Scott, D.A.; Weinstein, J.A.; Ran, F.A.; Konermann, S.; Agarwala, V.; Li, Y.; Fine, E.J.; Wu, X.; Shalem, O.; et al. DNA targeting specificity of RNA-guided Cas9 nucleases. Nat. Biotechnol. 2013, 31, 827–832. [Google Scholar] [CrossRef] [PubMed]
- Kolodkin, A.L.; Matthes, D.J.; Goodman, C.S. The semaphorin genes encode a family of transmembrane and secreted growth cone guidance molecules. Cell 1993, 75, 1389–1399. [Google Scholar] [CrossRef] [PubMed]
- Hu, S.; Zhu, L. Semaphorins and their receptors: From axonal guidance to atherosclerosis. Front. Physiol. 2018, 9, 1236. [Google Scholar] [CrossRef]
- Stella, G.M.; Corino, A.; Berzero, G.; Kolling, S.; Filippi, A.R.; Benvenuti, S. Brain metastases from lung cancer: Is MET an actionable target? Cancers 2019, 11, 271. [Google Scholar] [CrossRef] [PubMed]
- Mu, W.; Wang, Z.; Zöller, M. Ping-Pong—Tumor and Host in Pancreatic Cancer Progression. Front. Oncol. 2019, 9, 1359. [Google Scholar] [CrossRef]
- He, Z.; Tessier-Lavigne, M. Neuropilin is a receptor for the axonal chemorepellent Semaphorin III. Cell 1997, 90, 739–751. [Google Scholar] [CrossRef]
- Soker, S.; Takashima, S.; Miao, H.Q.; Neufeld, G.; Klagsbrun, M. Neuropilin-1 is expressed by endothelial and tumor cells as an isoform-specific receptor for vascular endothelial growth factor. Cell 1998, 92, 735–745. [Google Scholar] [CrossRef]
- Gagnon, M.L.; Bielenberg, D.R.; Gechtman, Z.E.; Miao, H.-Q.; Takashima, S.; Soker, S.; Klagsbrun, M. Identification of a natural soluble neuropilin-1 that binds vascular endothelial growth factor: In vivo expression and antitumor activity. Proc. Natl. Acad. Sci. USA 2000, 97, 2573–2578. [Google Scholar] [CrossRef]
Figure 1.
Workflow for constructing TBCK knockout system.
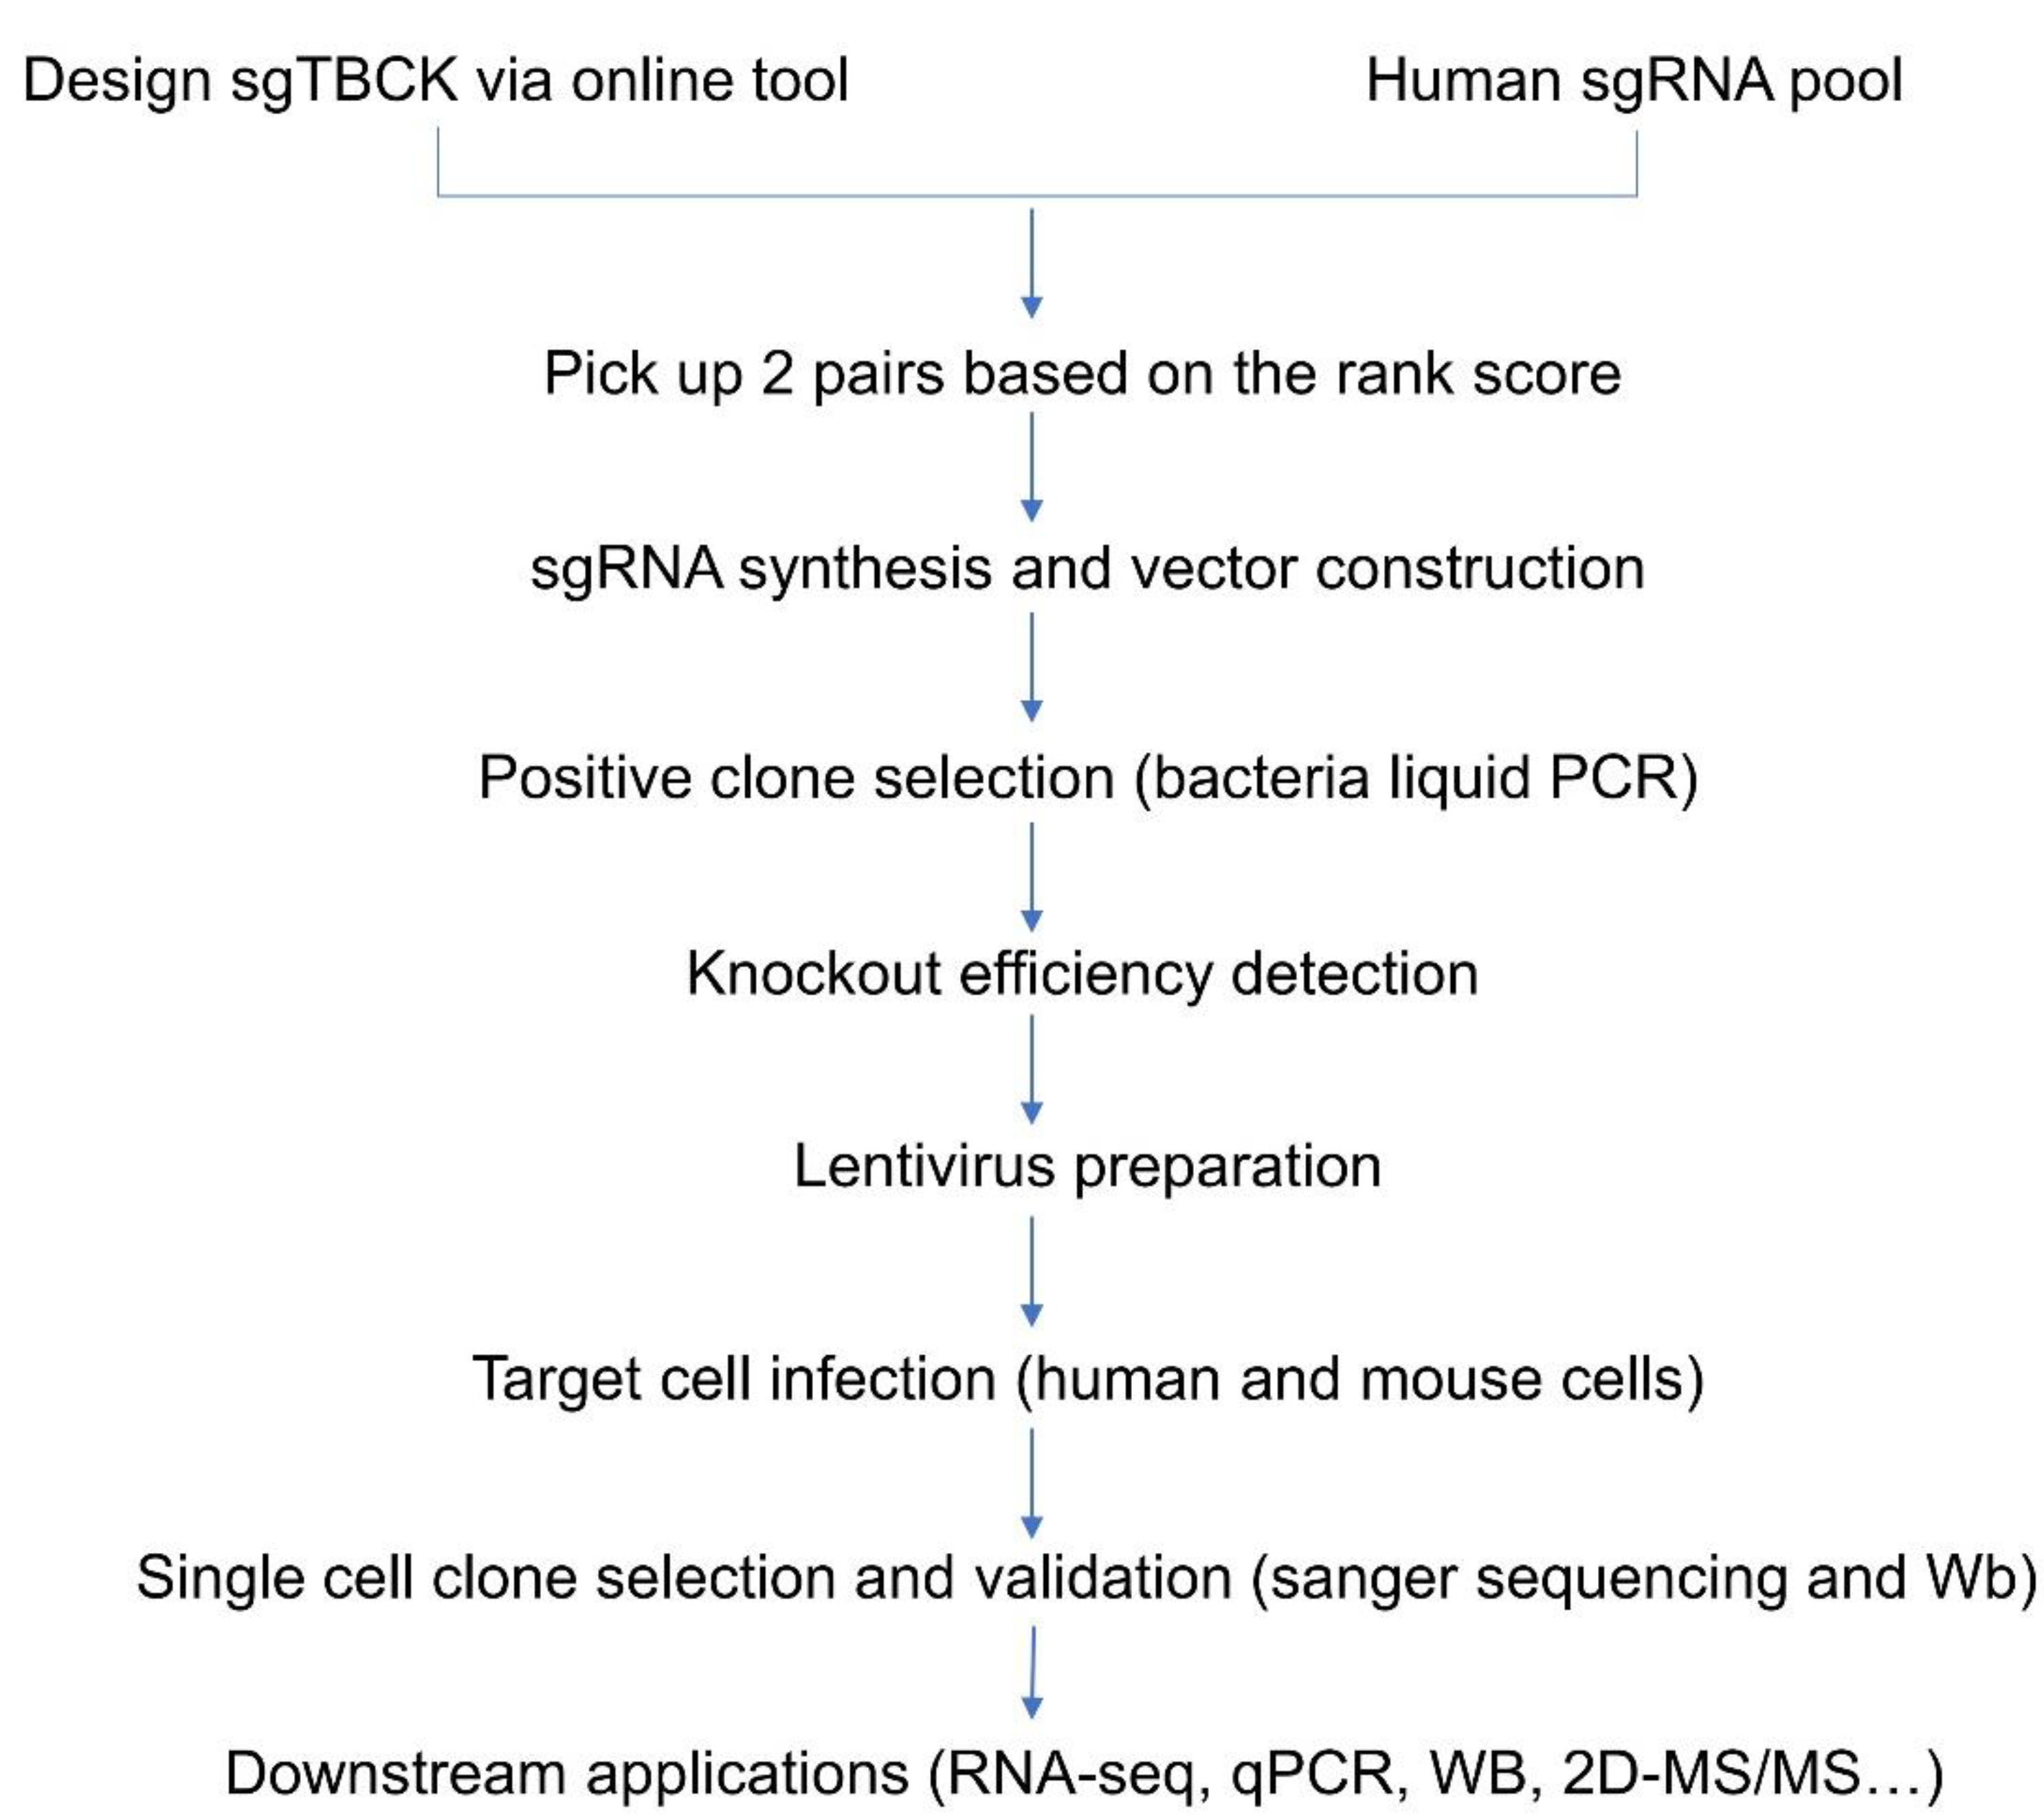
Figure 2.
Schematic diagram for knocking out human TBCK via a CRISPR-Cas9 system. A. A diagram of TBCK including known domains. B. Schematic representation of full-length TBCK (NM_001163435.3); the 5’ UTR and 3’ UTR are shown as green and blue bars respectively. Separated introns are shown by blue lines, exons are indicated by solid yellow rectangles. C. sgTBCK sequence (553-572) mapping to exon 3. D. The annealing output for oligo 3 and 4 (sgT3). E. pL-CRISPR.EFS.tRFP vector including BSMBI recognition sequences (5’-CGCCTCN1 -3’ and 3’-GCAGAGN5 -5’). Blue and red arrows represent the cutting sites. F. BSMBI digested product. G. Ligating sgTBCK into pL-CRISPR.EFS.tRFP vector. H-I. Reconstruction of the vector map for pL-CRISPR.sgTBCK.tRFP.
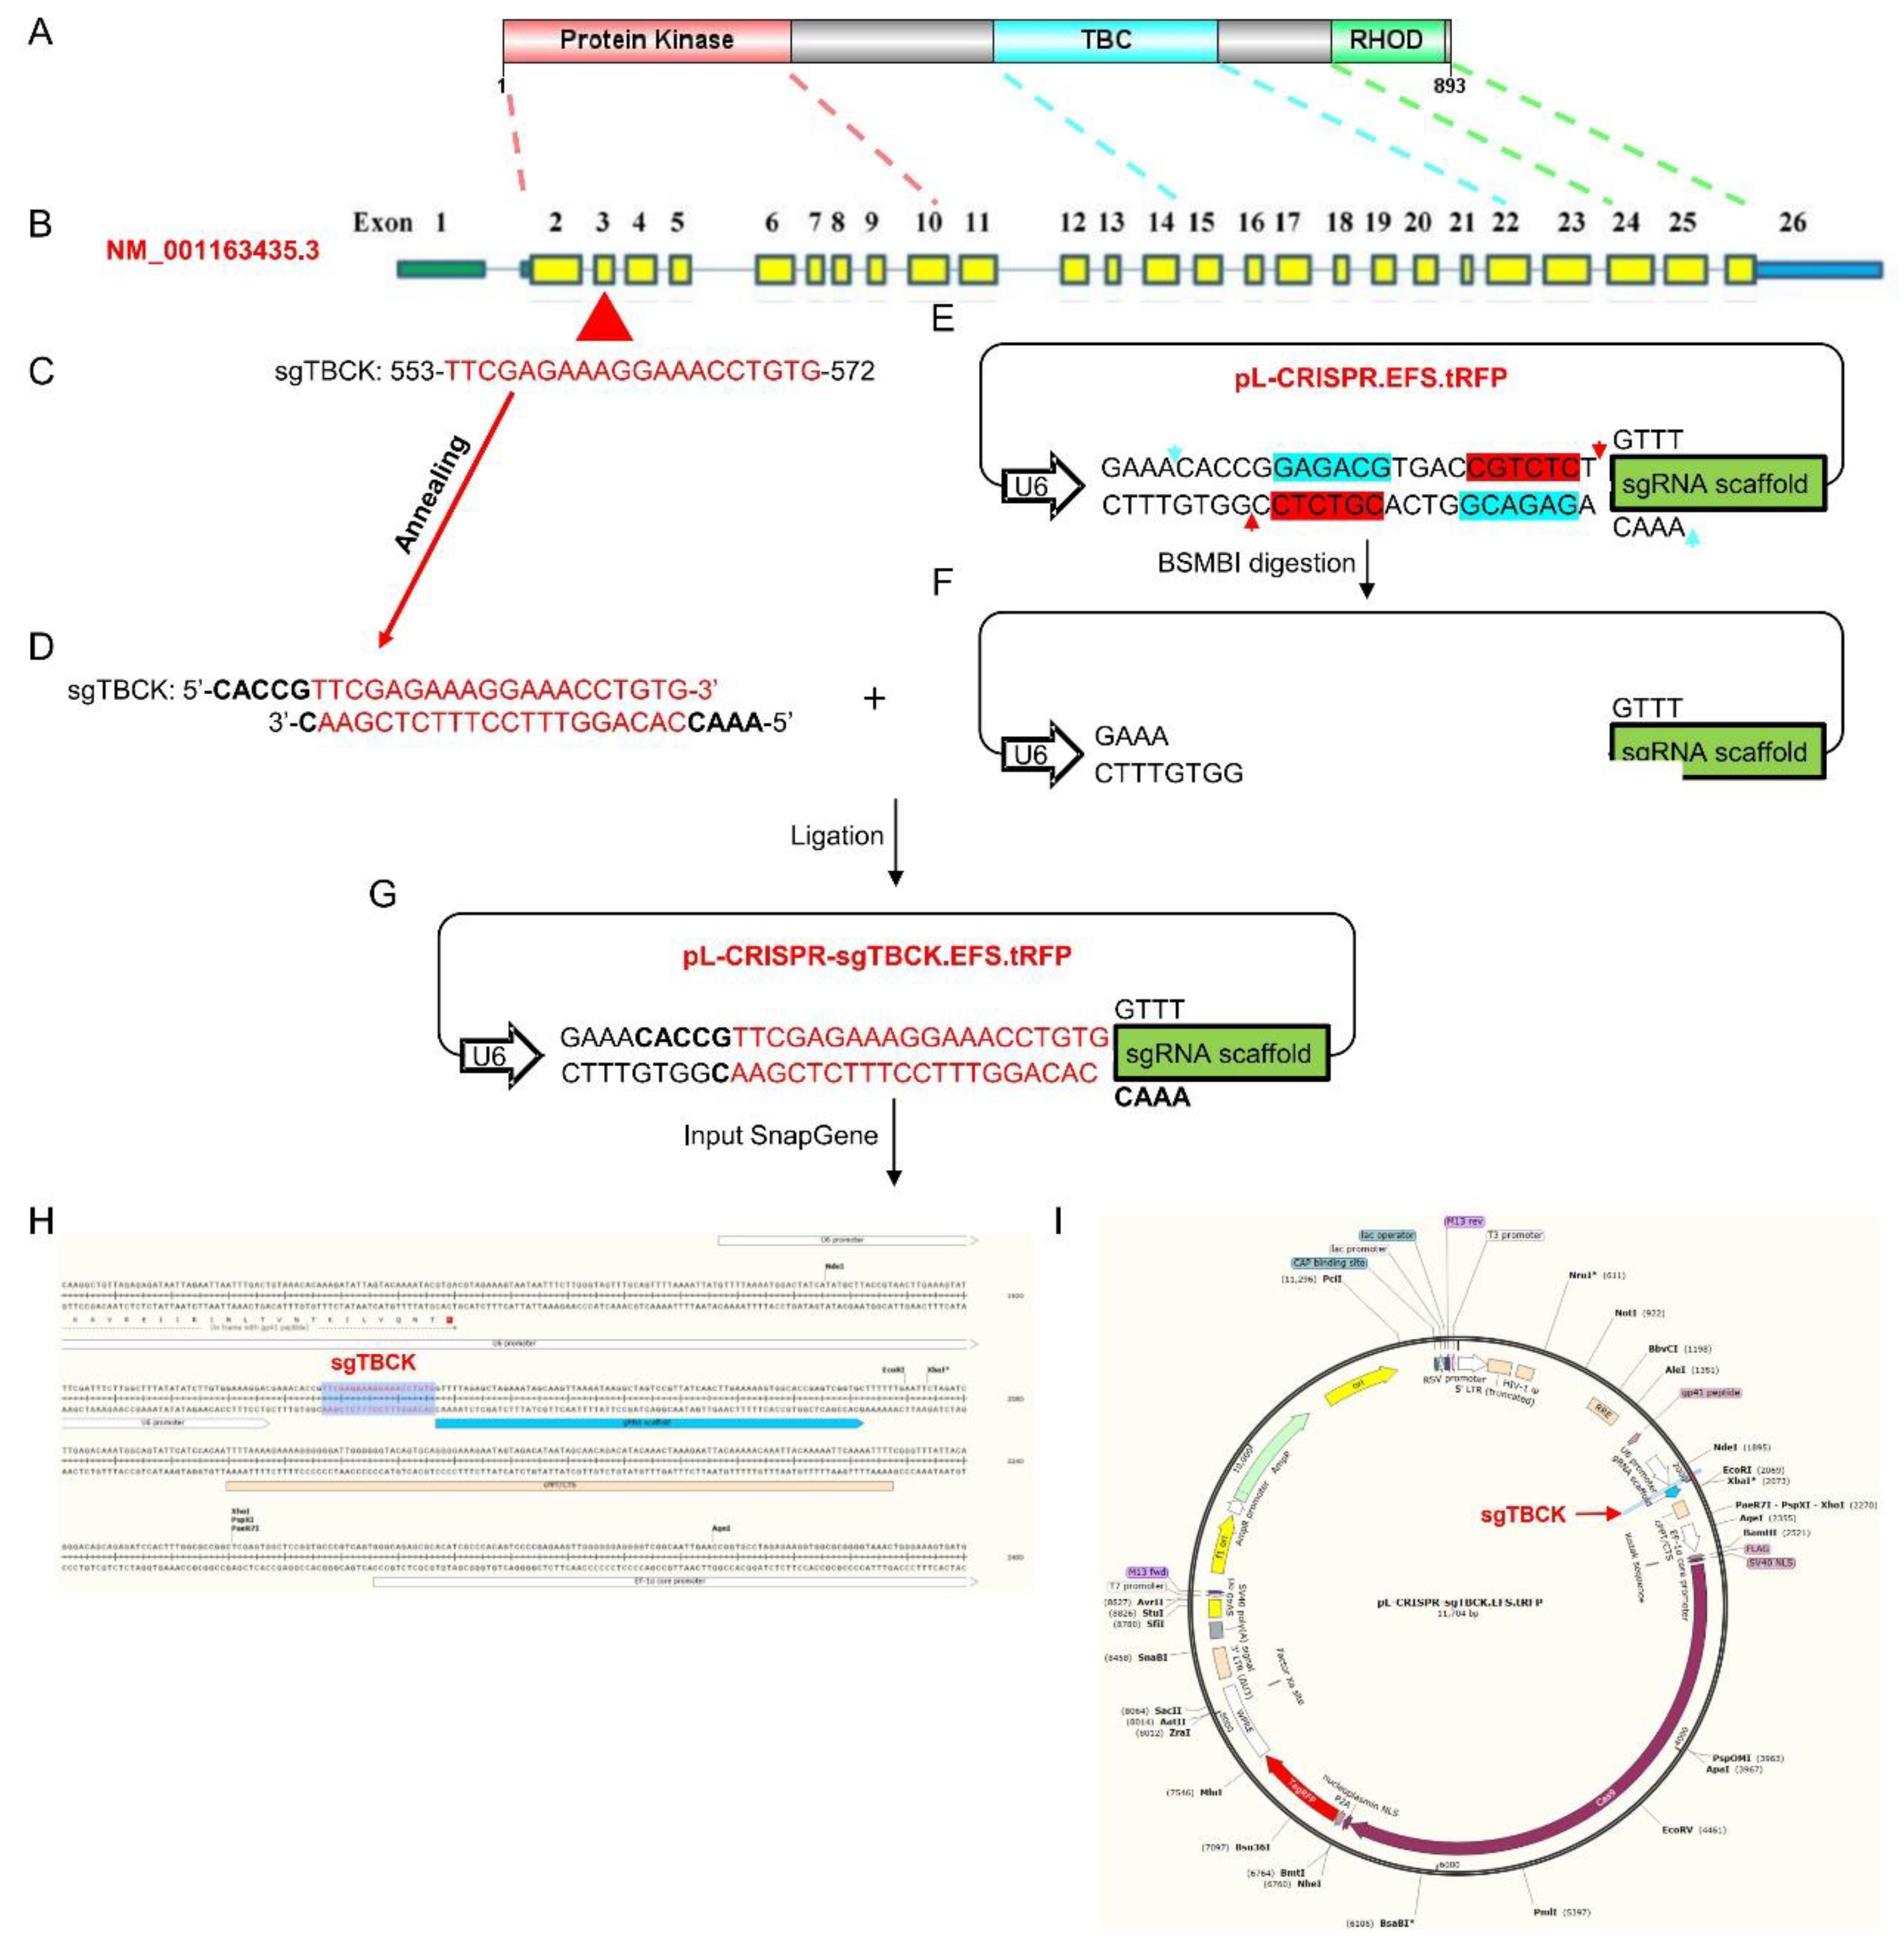
Figure 3.
Validation of sgTBCK lentivirus vectors by bacteria PCR and sanger sequencing. A. Bacteria liquid PCR using hU6 forward primer and sgT1 or sgT3 reverse primer to screen for positive clones for pL-CRISPR.sgT1.tRFP or pL-CRISPR.sgT3.tRFP vector. All four clones generated had the expected PCR products of 270bp. Sanger sequencing using hU6 forward primer for pL-CRISPR.sgT1-C1.tRFP (B) or pL-CRISPR.sgT3-C1.tRFP (C) Confirmed partial U6 promoter sequences (red rectangle), gRNA scaffold sequences (blue rectangle) and sgT1 or sgT3 sequences.
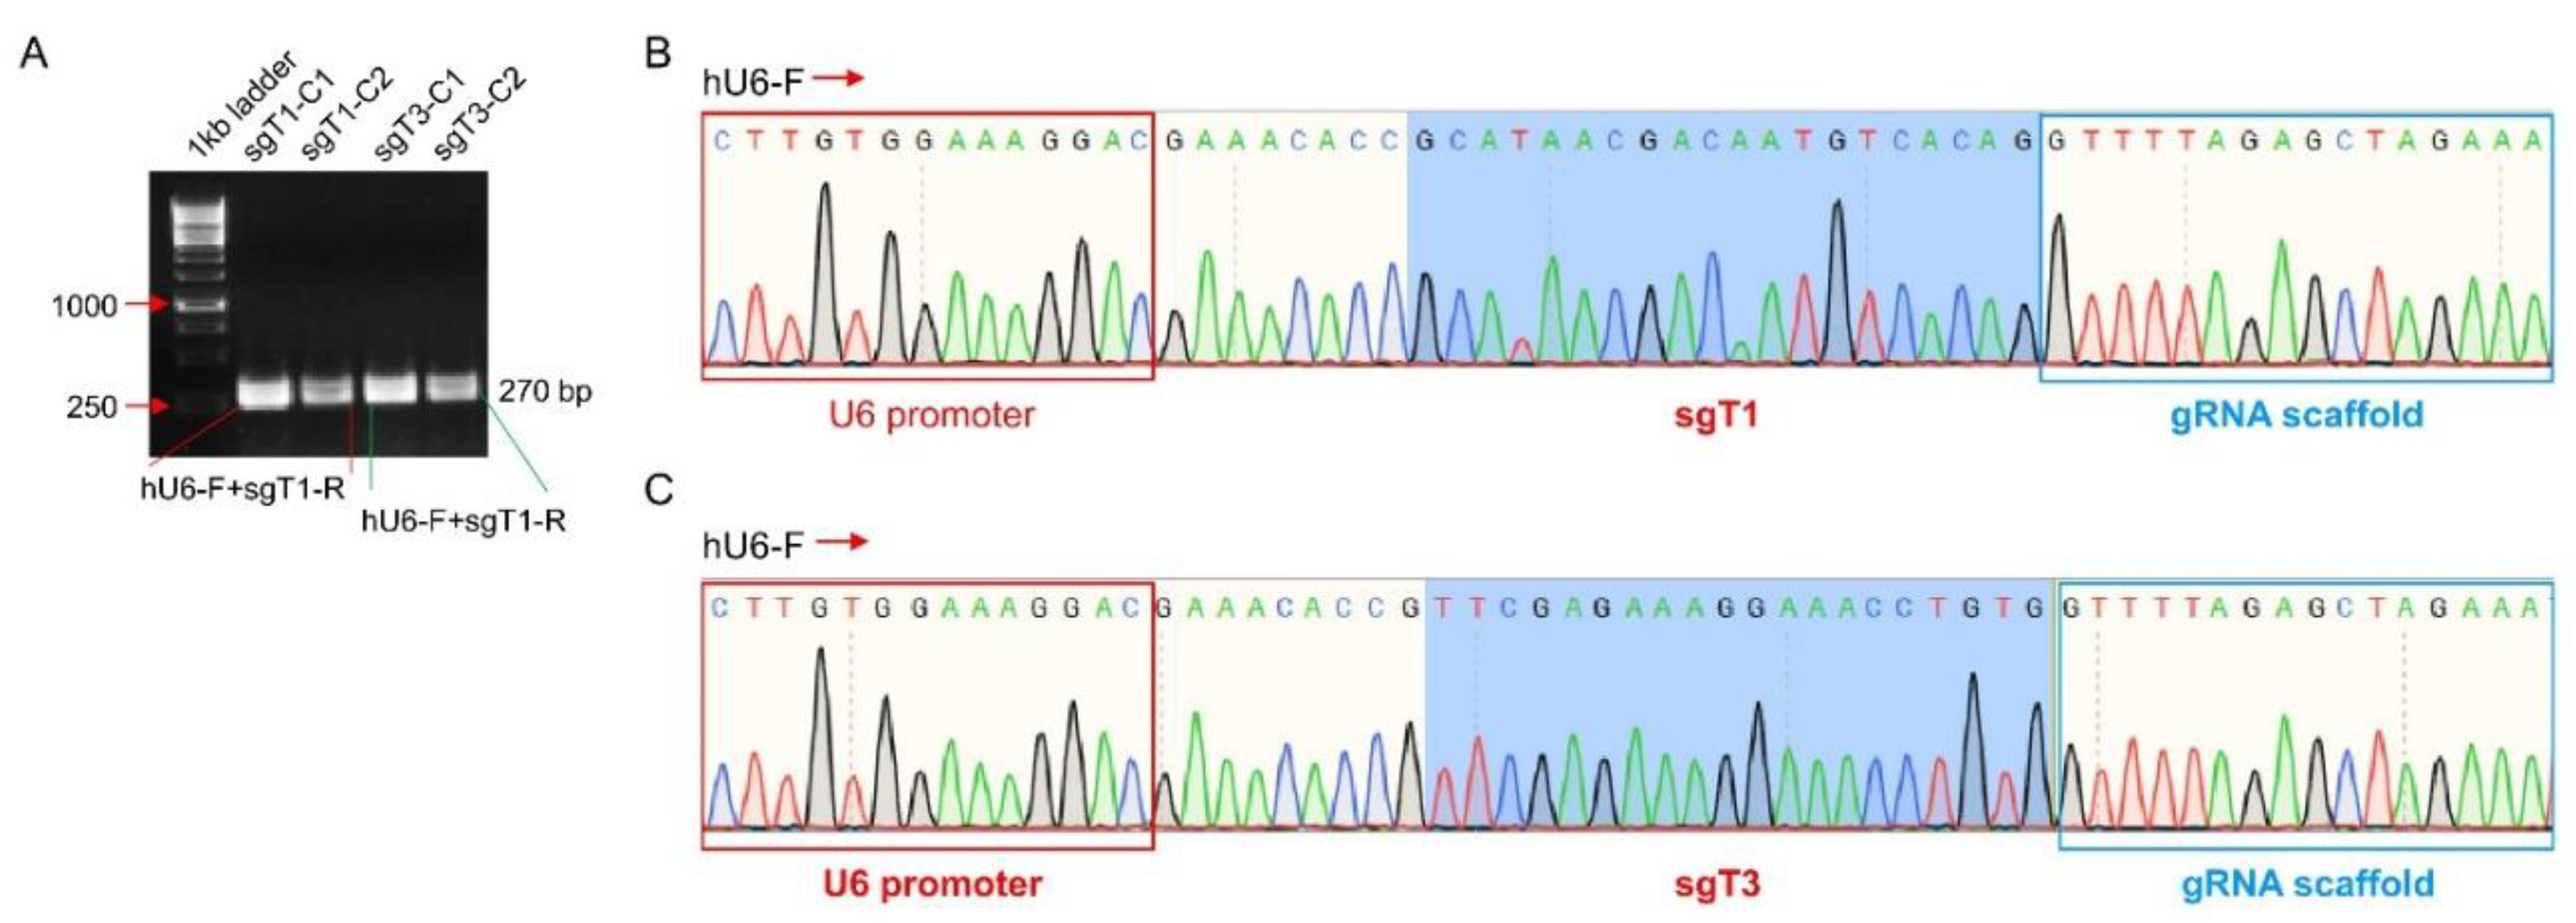
Figure 4.
Knockout efficiency detection in HEK293FT cells. A. pL-CRISPR.sgT1-C1.tRFP or pL-CRISPR.sgT3-C1.tRFP plasmid was transiently transfected into HEK293FT cells to check the knockout efficiency for either sgT1 or sgT3. RFP signals indicated the transfection efficiency. B. WB analysis for TBCK and TBCK related proteins. C. Normalized protein levels of TBCK and related proteins based on the gray value (calculated by Image J) for each target.
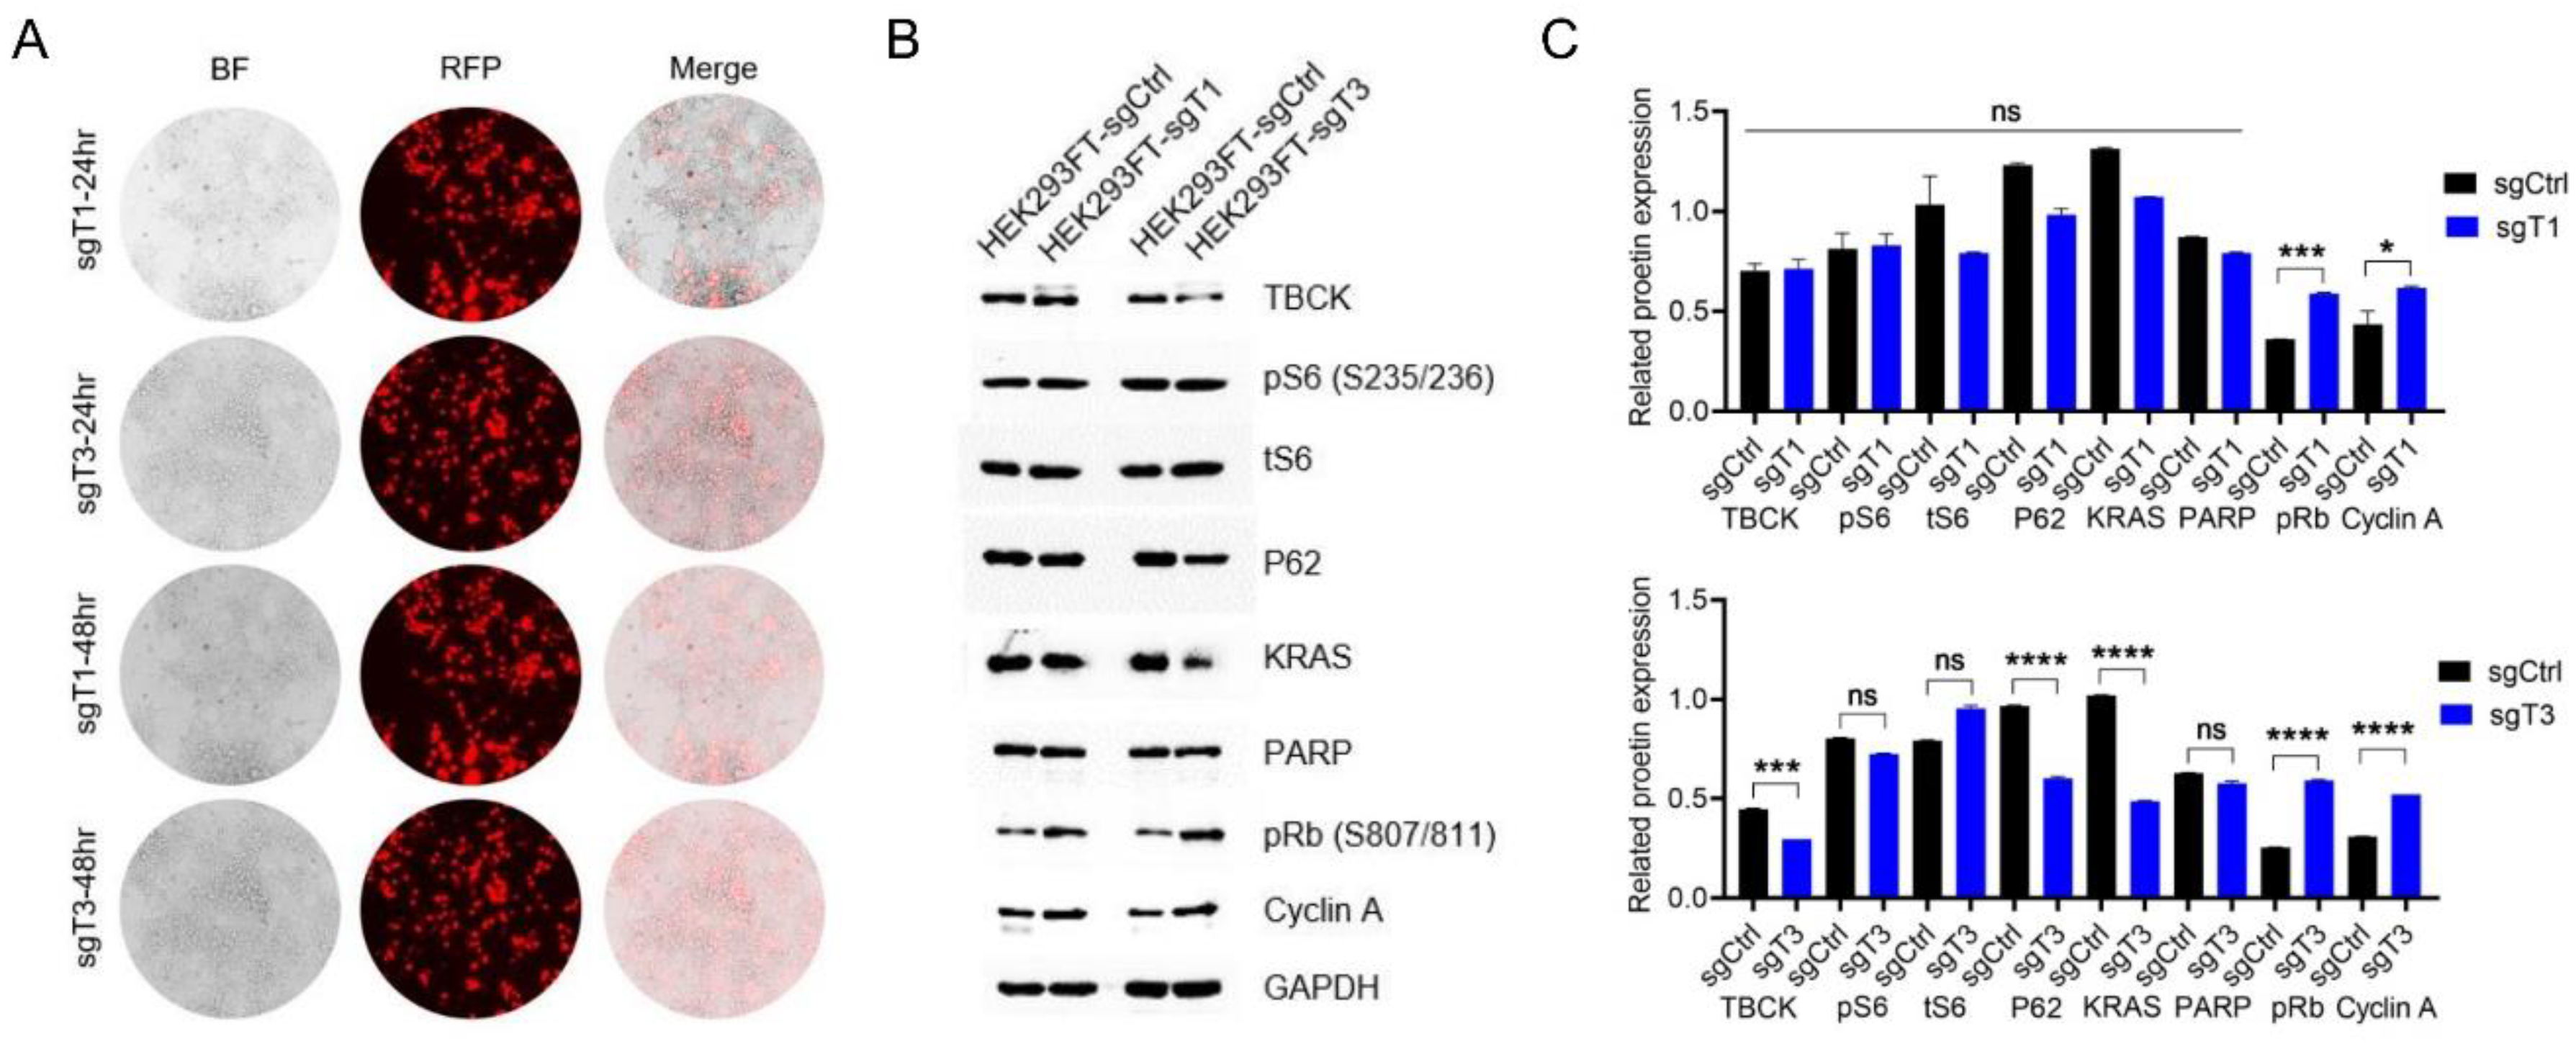
Figure 6.
Single cell clone selection and validation in MIA PaCa-2 cell model. A. Immunoblot analysis to screen positive knockout clones. 3 clones (C2/C6/C11 marked with red arrows) were selected for fluorescence checking (B). C. PCR results showed that sgCtrl cells only generated one single band (461bp), while sgT3 cells either generated one single band (C2) or two bands (C6/C11). D. Sanger sequencing analysis demonstrated that no mutations were found in sgCtrl cells, while T insertion was verified in all 3 clones of sgT3 cells. E. Sanger sequencing analysis demonstrated that the whole exon 3 and portion of intron 2 were missing in clone 6 and clone 11. F. Schematic for potential outcomes due to T insertion or exon3 skipping mediated by CRISPR. G. Immunoblot analysis for TBCK in whole membrane with MIA PaCa-2 protein (sgCtrl and 3 sgT3 clones (C2/C6/C11)) to check whether novel protein products would be generated or not regarding TBCK depletion mediated by CRISPR-Cas9.
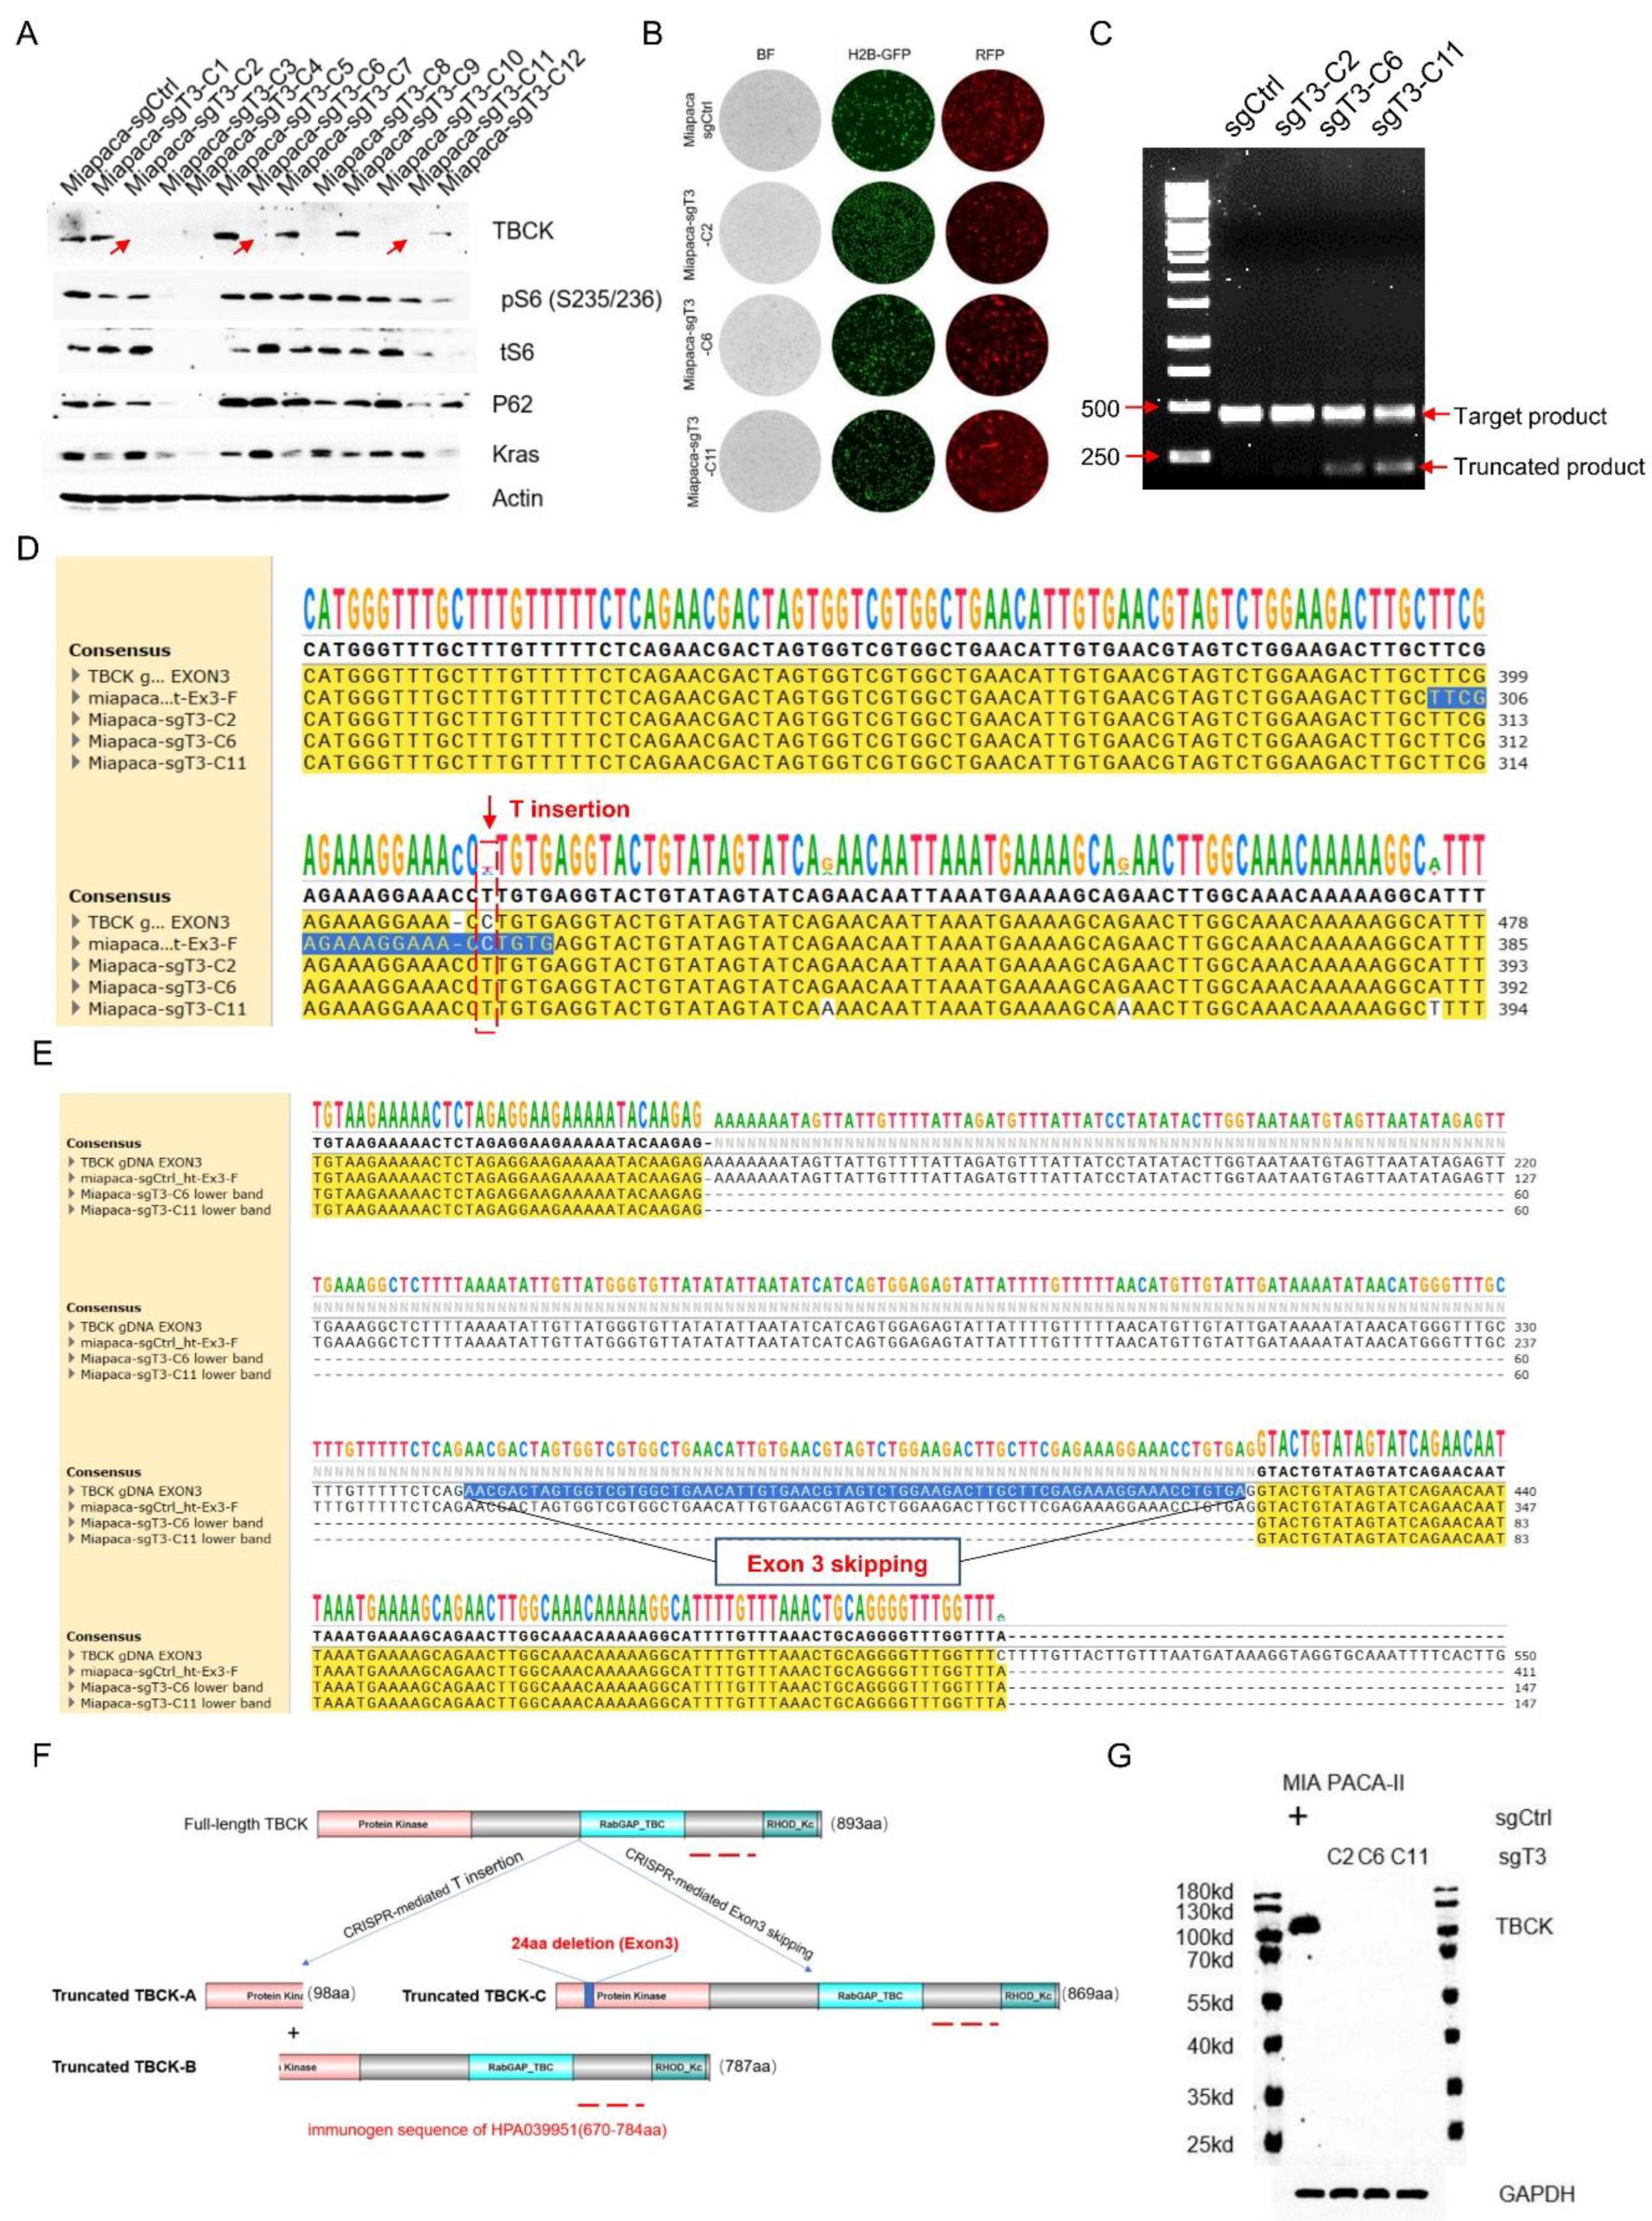
Figure 7.
Single cell clone selection and validation in Fibrosarcoma HT1080 cell model. A. Immunoblot analysis to screen positive knockout clones. B. PCR results showed that both sgCtrl and sgT3-C1 cells generated one single band (461bp). C. Sanger sequencing analysis demonstrated that no mutations were found in sgCtrl cells, while T insertion was verified in sgT3-C1 cells.
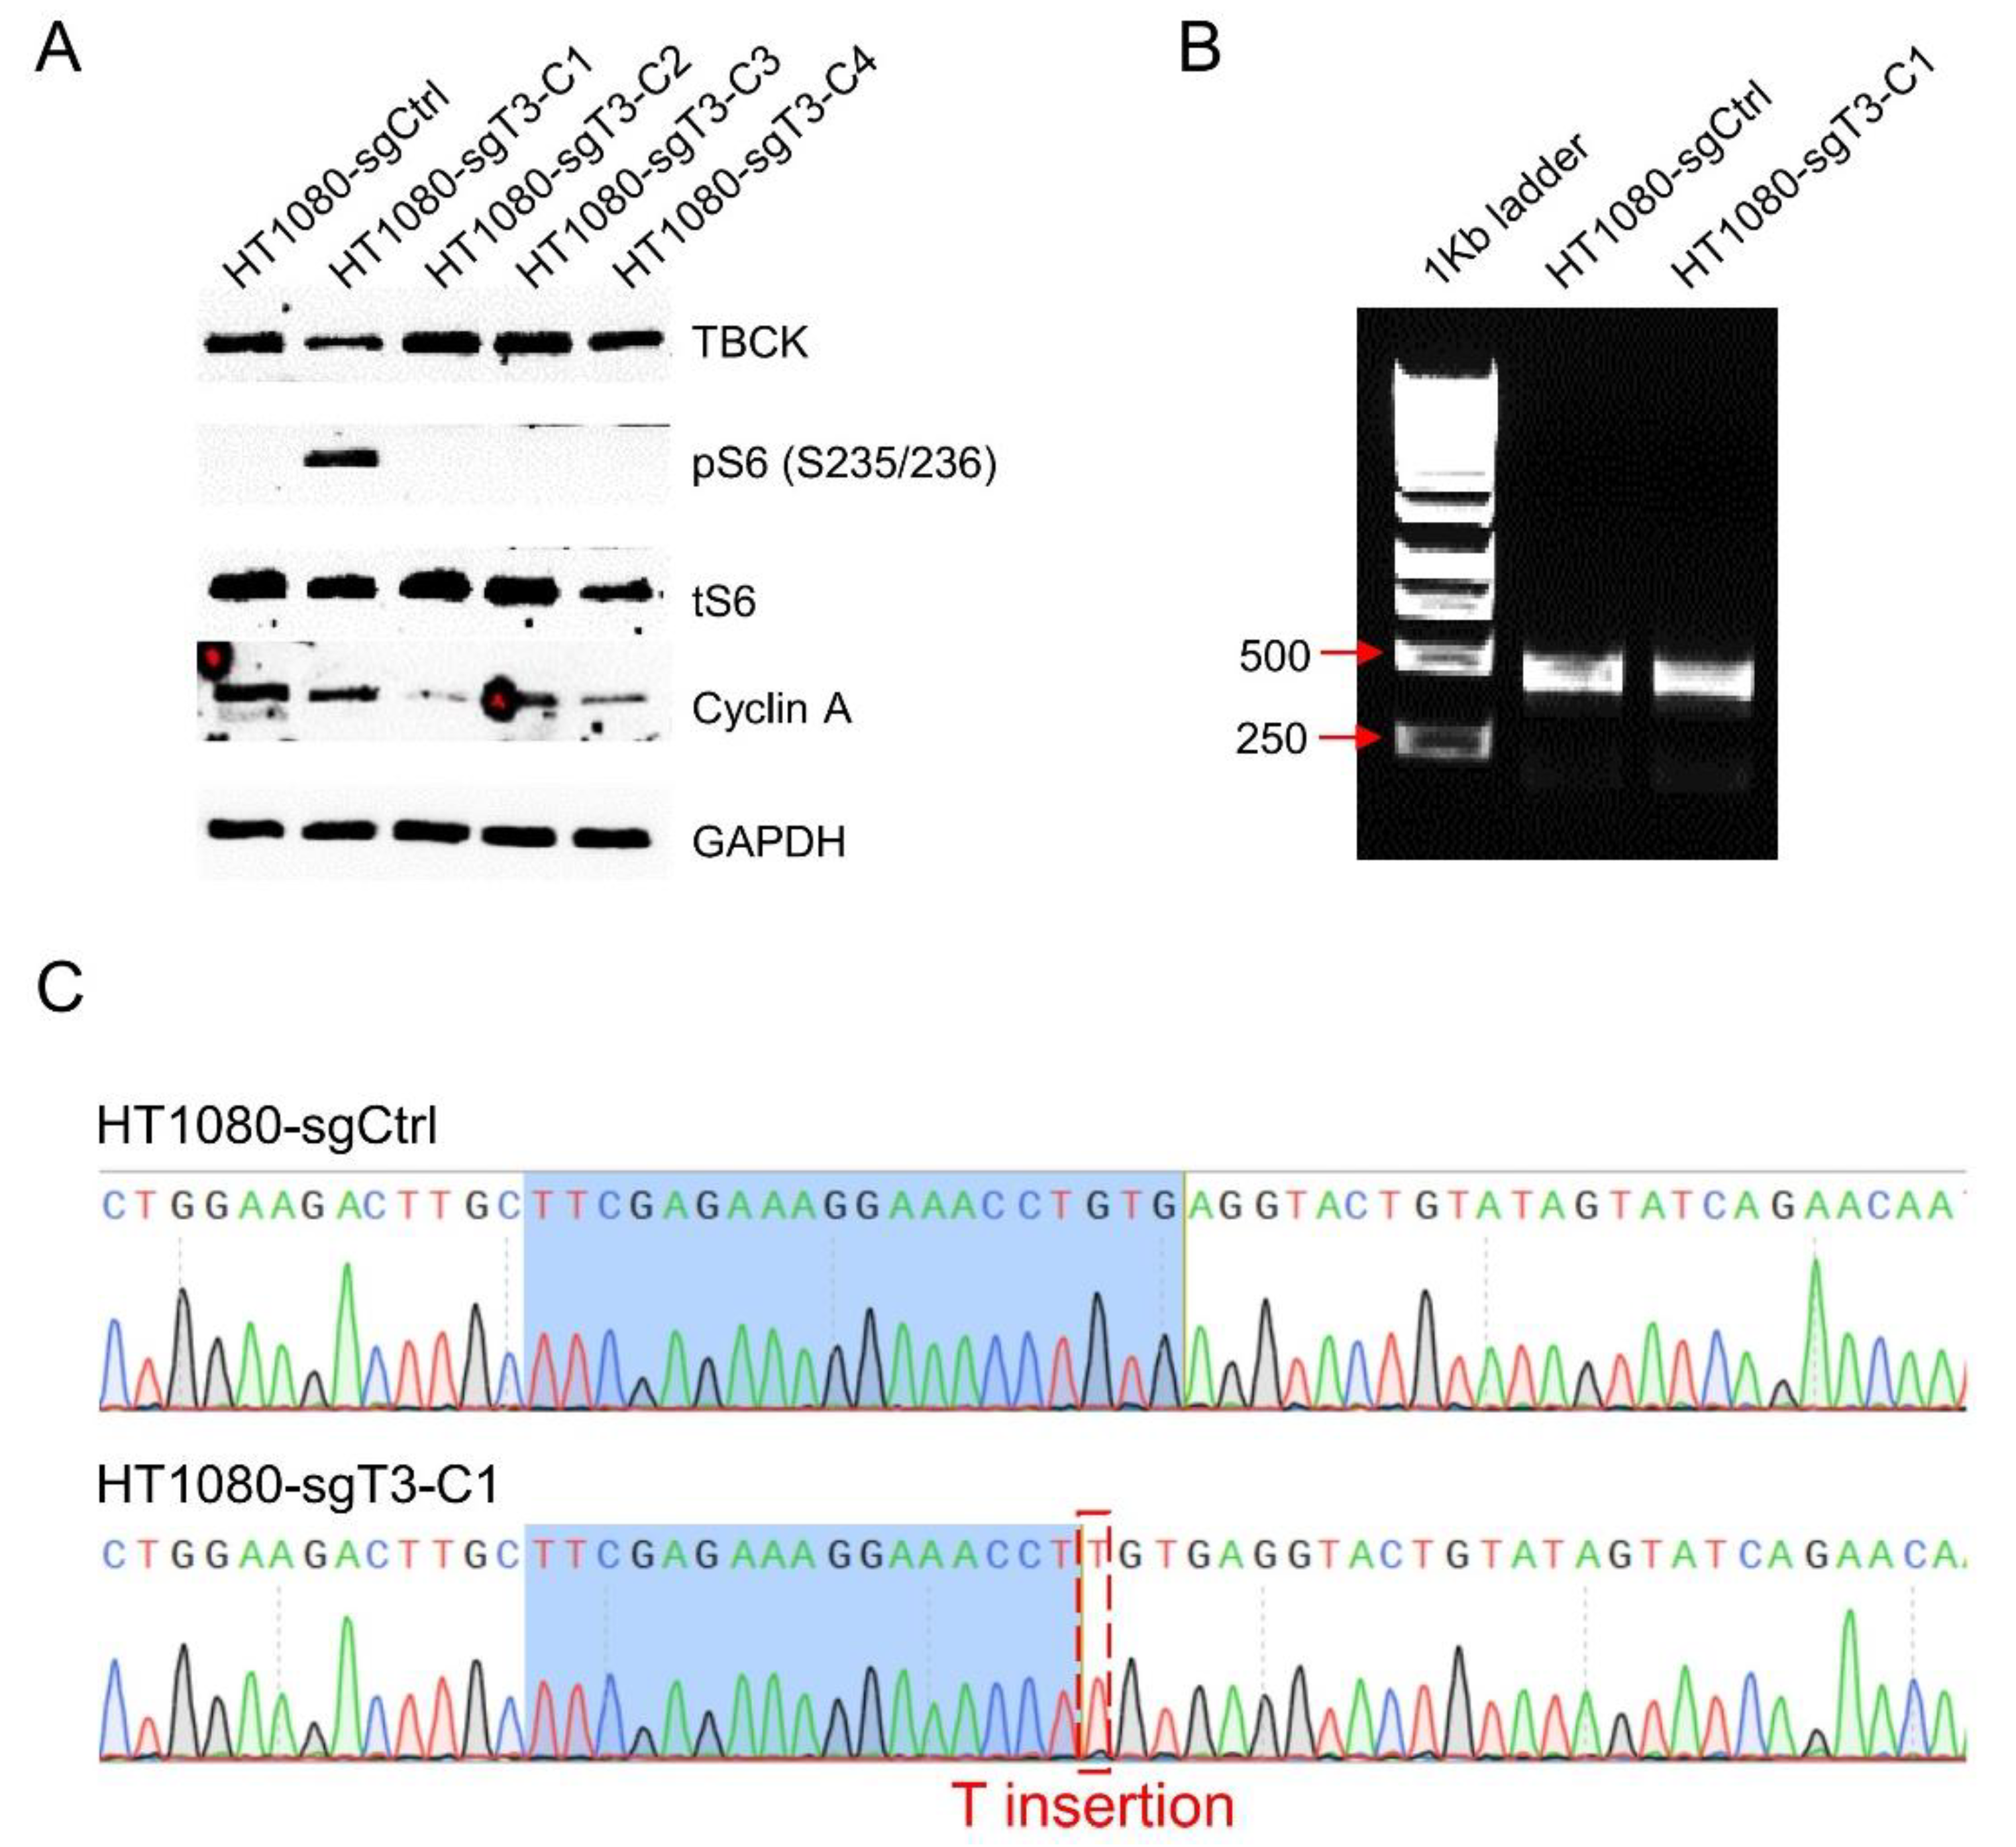
Figure 8.
The human specific sgTBCK has little effects on mouse cells. A. Sequence alignment between human and mouse TBCK mRNA uncovered a two-base mismatch in sgRNA region. B. sgCtrl and 3 sgT3 clones were chosen because of high RFP signals, representing plenty of lentivirus particles in cells. C. Immunoblot analysis to screen positive knockout clones. D. PCR results showed that both sgCtrl and 4 sgT3 clones generated one single band (532bp). E. Sanger sequencing analysis supported that no mutations were found in sgRNA region for all sgCtrl and sgT3 clones. Blue background represents sgRNA region.
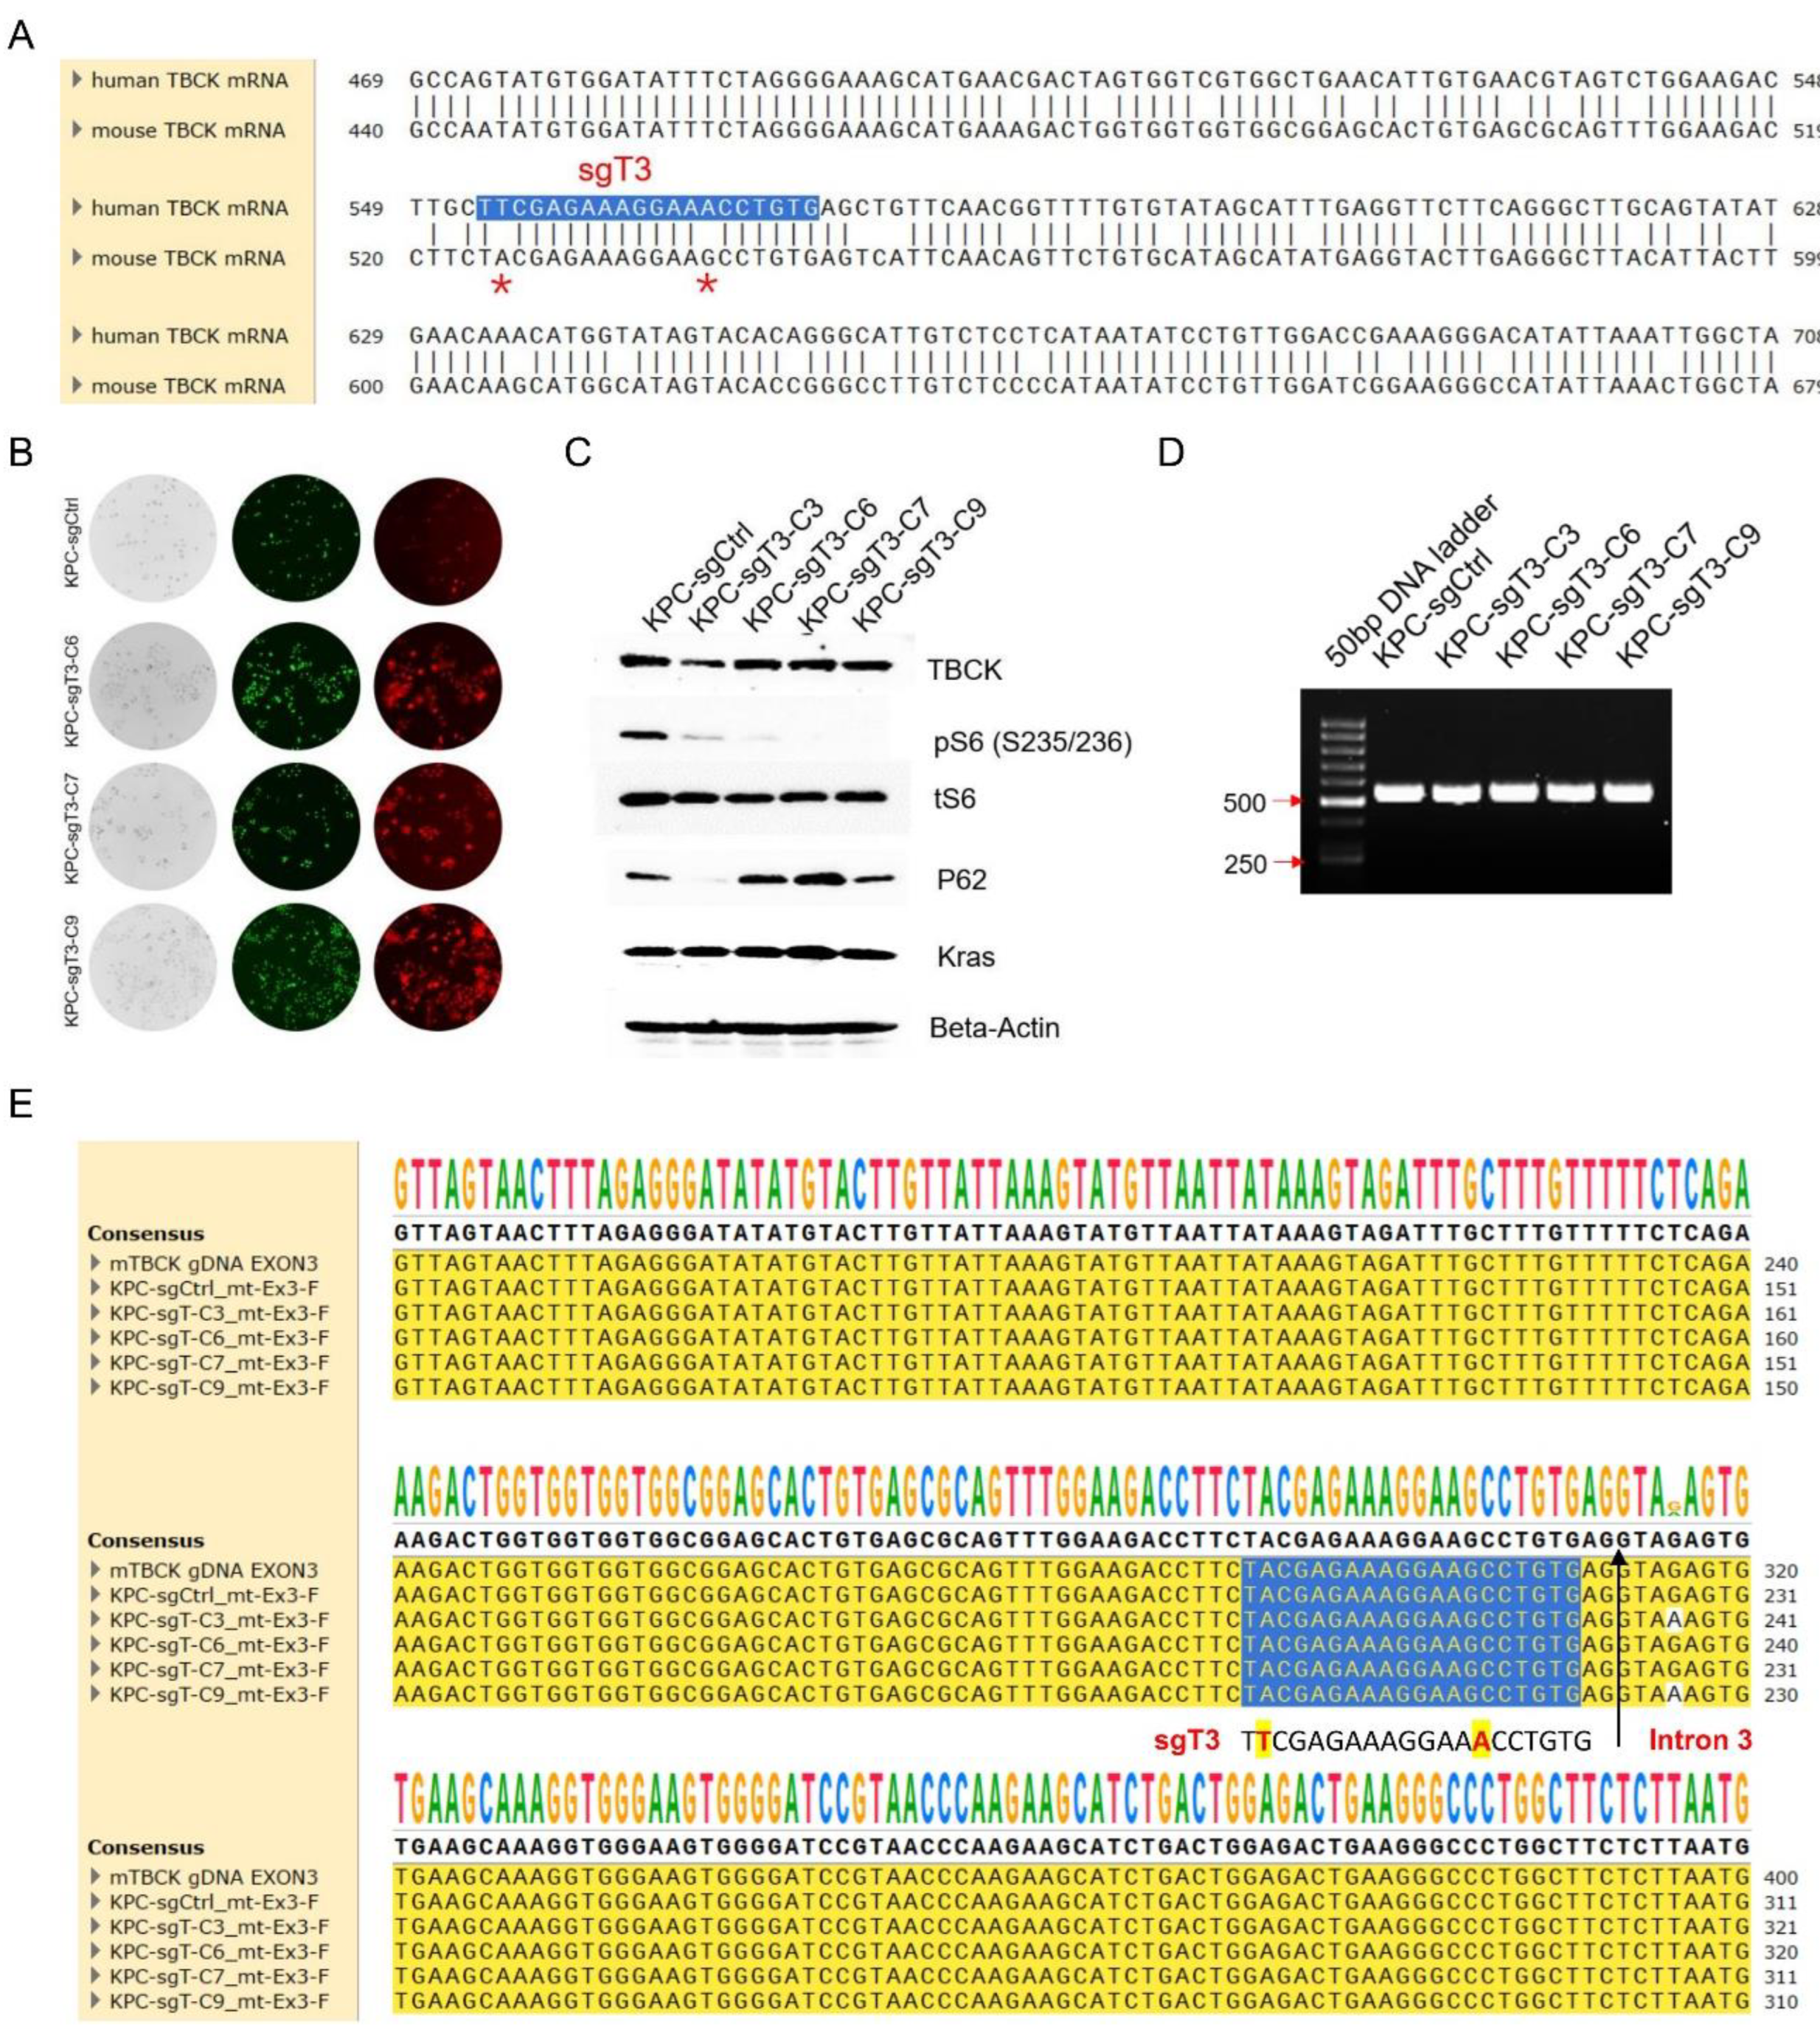
Figure 9.
RNA-seq application for TBCK KO single clone in PDAC model. A. Immunoblot analysis for RNA-seq samples to confirm the depletion of TBCK. B. Genes significantly induced or repressed in MIA PaCa-2-sgT3 cells were determined using an average log 2-fold-change greater than 1 and a false-discovery rate less than 5% were differentially expressed. The blue symbols denote repressed genes, and the red symbols denote induced genes. C. ENRICHR analysis to determine the pathways that are associated with the negatively selected genes from MIA PaCa-2-sgT3 cells. D. ENRICHR analysis to determine the pathways that are associated with the positively selected genes from MIA PaCa-2-sgT3 cells. E. Heatmap depicting the differential expression of selected genes in enriched pathways. F. GSEA analysis identified the downregulated genes in MIA PaCa-2-sgT3 cells were significantly enriched for ER response, p53 and EMT pathways, as well as upregulated genes were significantly enriched for interferon gamma, metabolism and E2F pathways. G. Column graph indicates the relative expression of selected downregulated and upregulated genes based on transcriptome analysis. Error bar represents mean and SD. (**p<0.001 as determine student t-test).
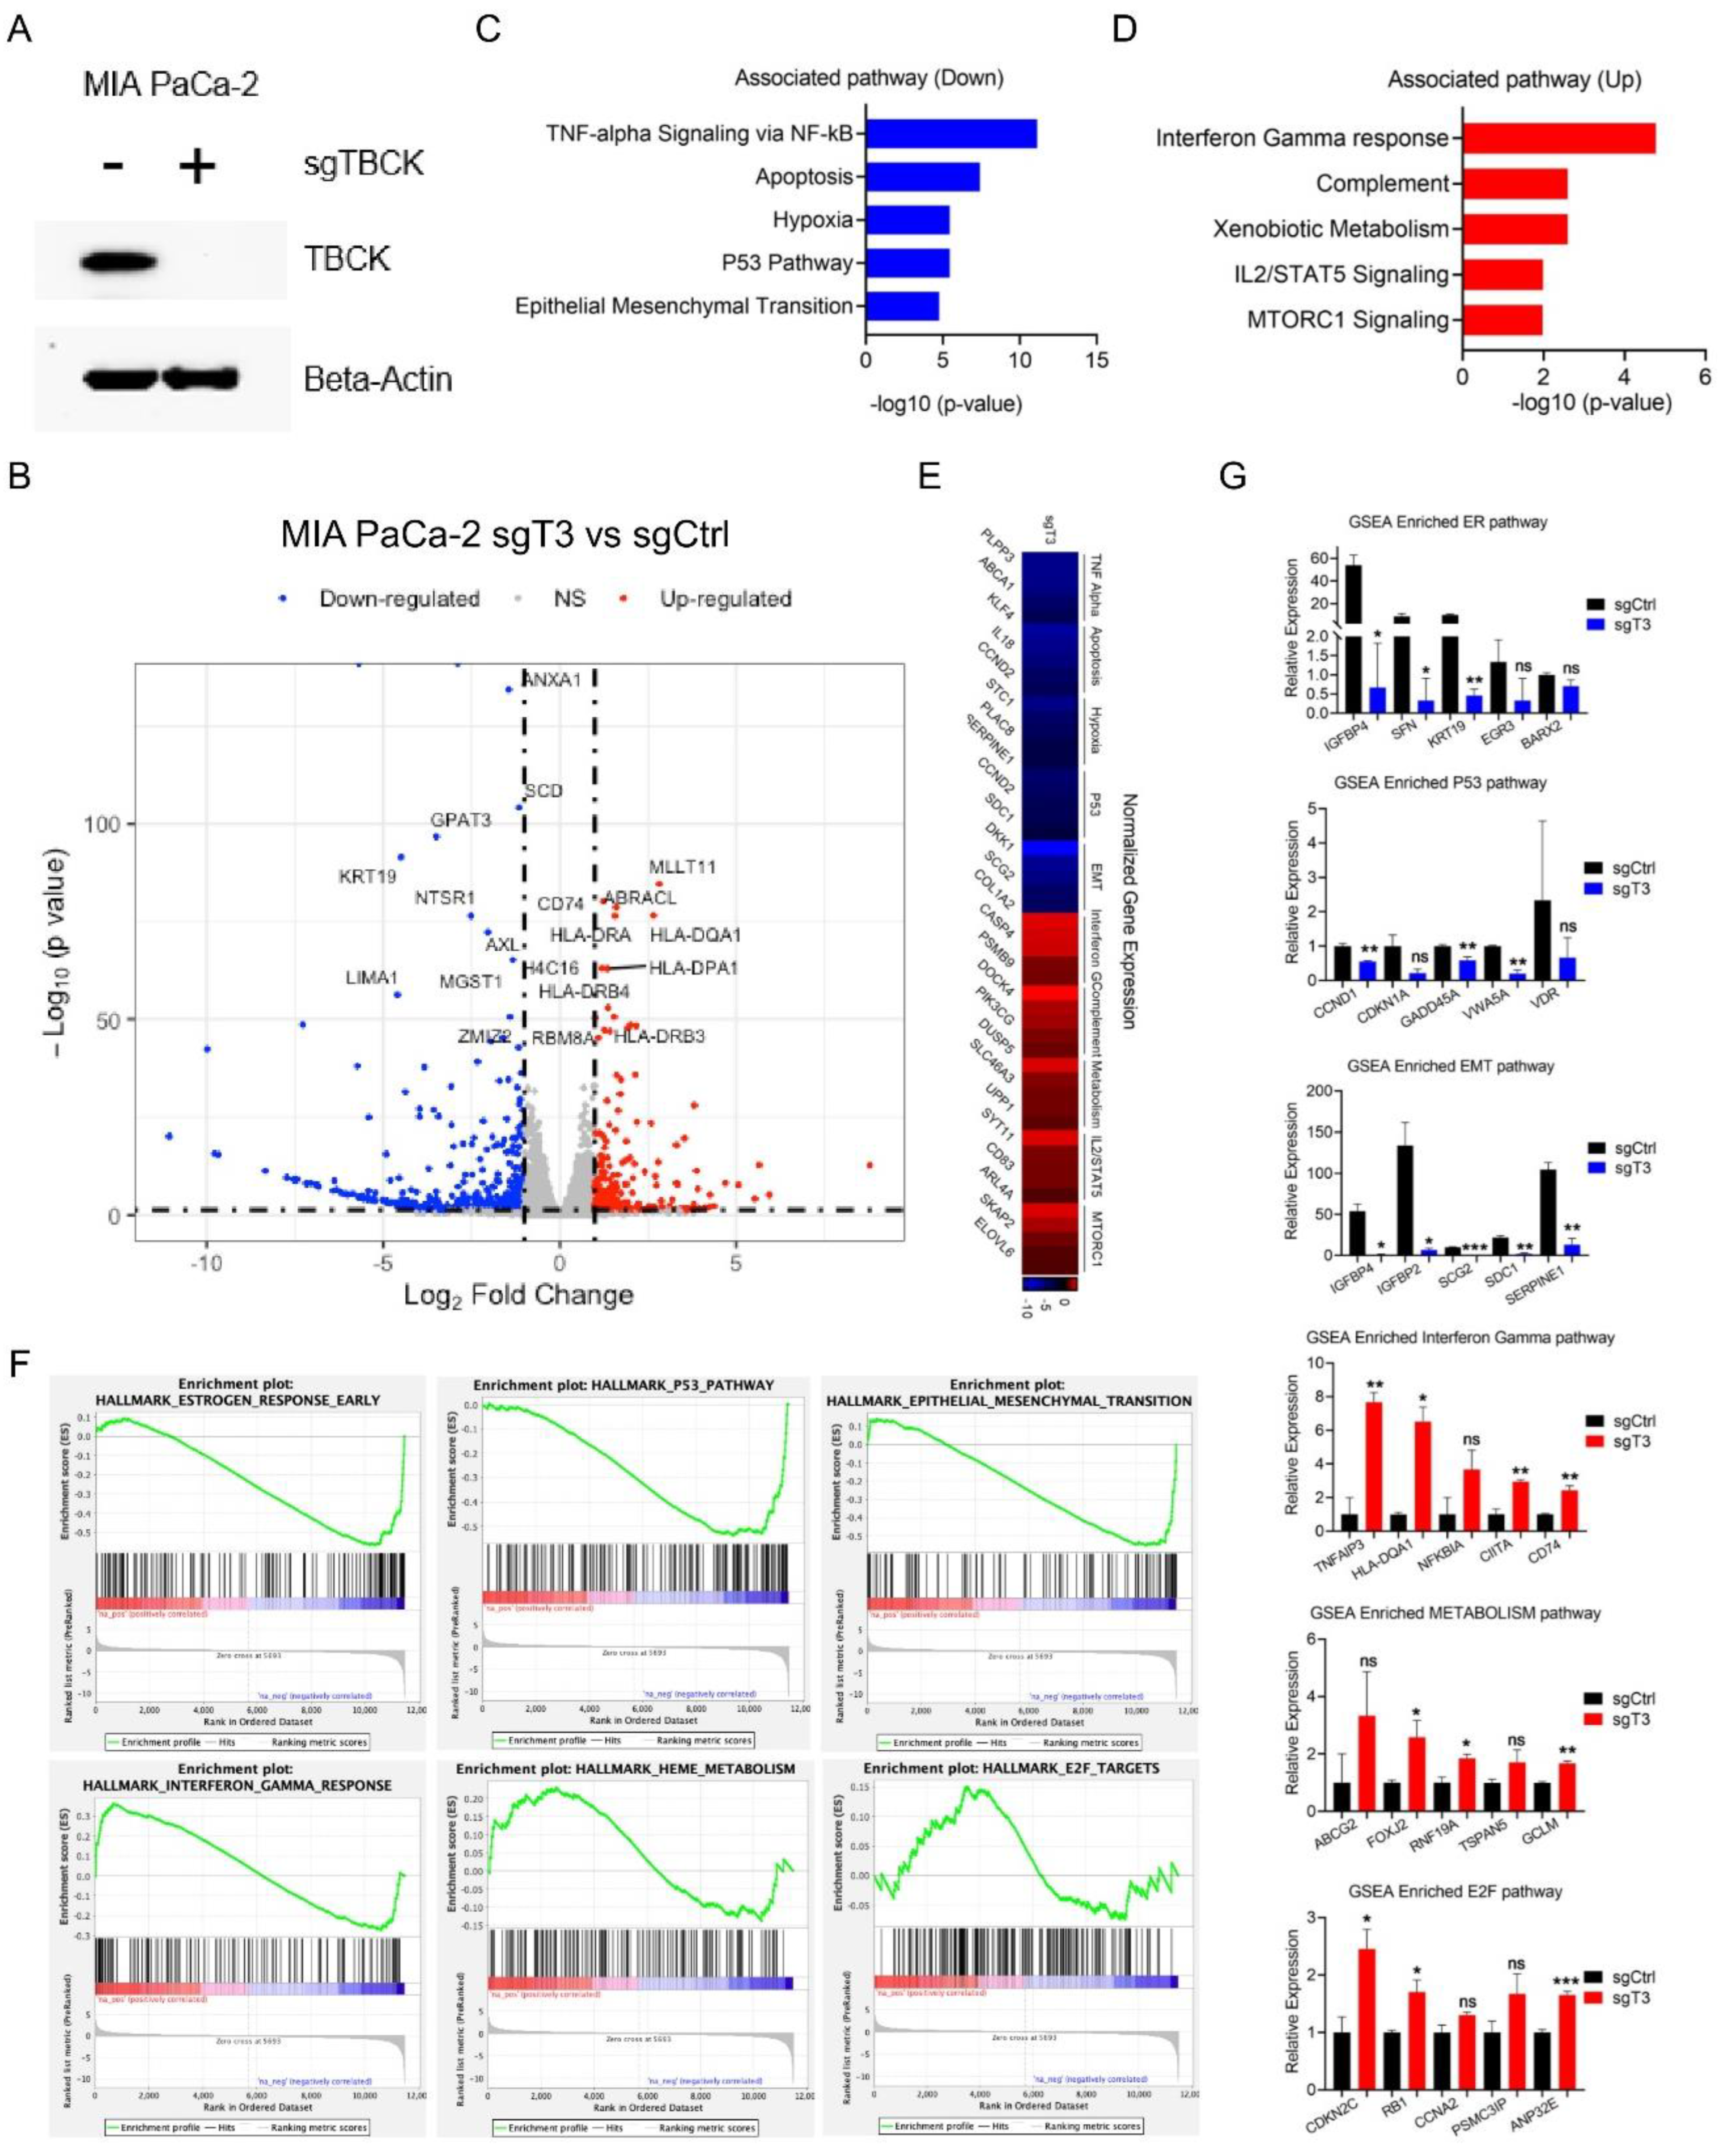
Figure 10.
GO-term enrichment and STRING analysis for TBCK KO single clone in PDAC model. A. The GO analysis of 314 significantly downregulated genes, including biological process (BP), cellular component (CC), and molecular function (MF). B. Heatmap depicting the differential expression of selected genes in three enriched processes (GO: 0042326; GO: 0030308; and GO: 0062023). C. The GO analysis of 184 significantly upregulated genes, including biological process (BP), cellular component (CC), and molecular function (MF). D. Heatmap depicting the differential expression of selected genes in three enriched processes (GO: 0002495 and GO: 0098791). E. STRING analysis for TBCK and upregulated DEGs. Arrow shows isolated TBCK. F. STRING analysis for TBCK and downregulated DEGs discovered a connect between TBCK and PLXNB2. G. 9 candidate proteins were reanalyzed by string webserver. H. Heatmap depicting the differential expression of 8 selected genes in downregulated DEGs.
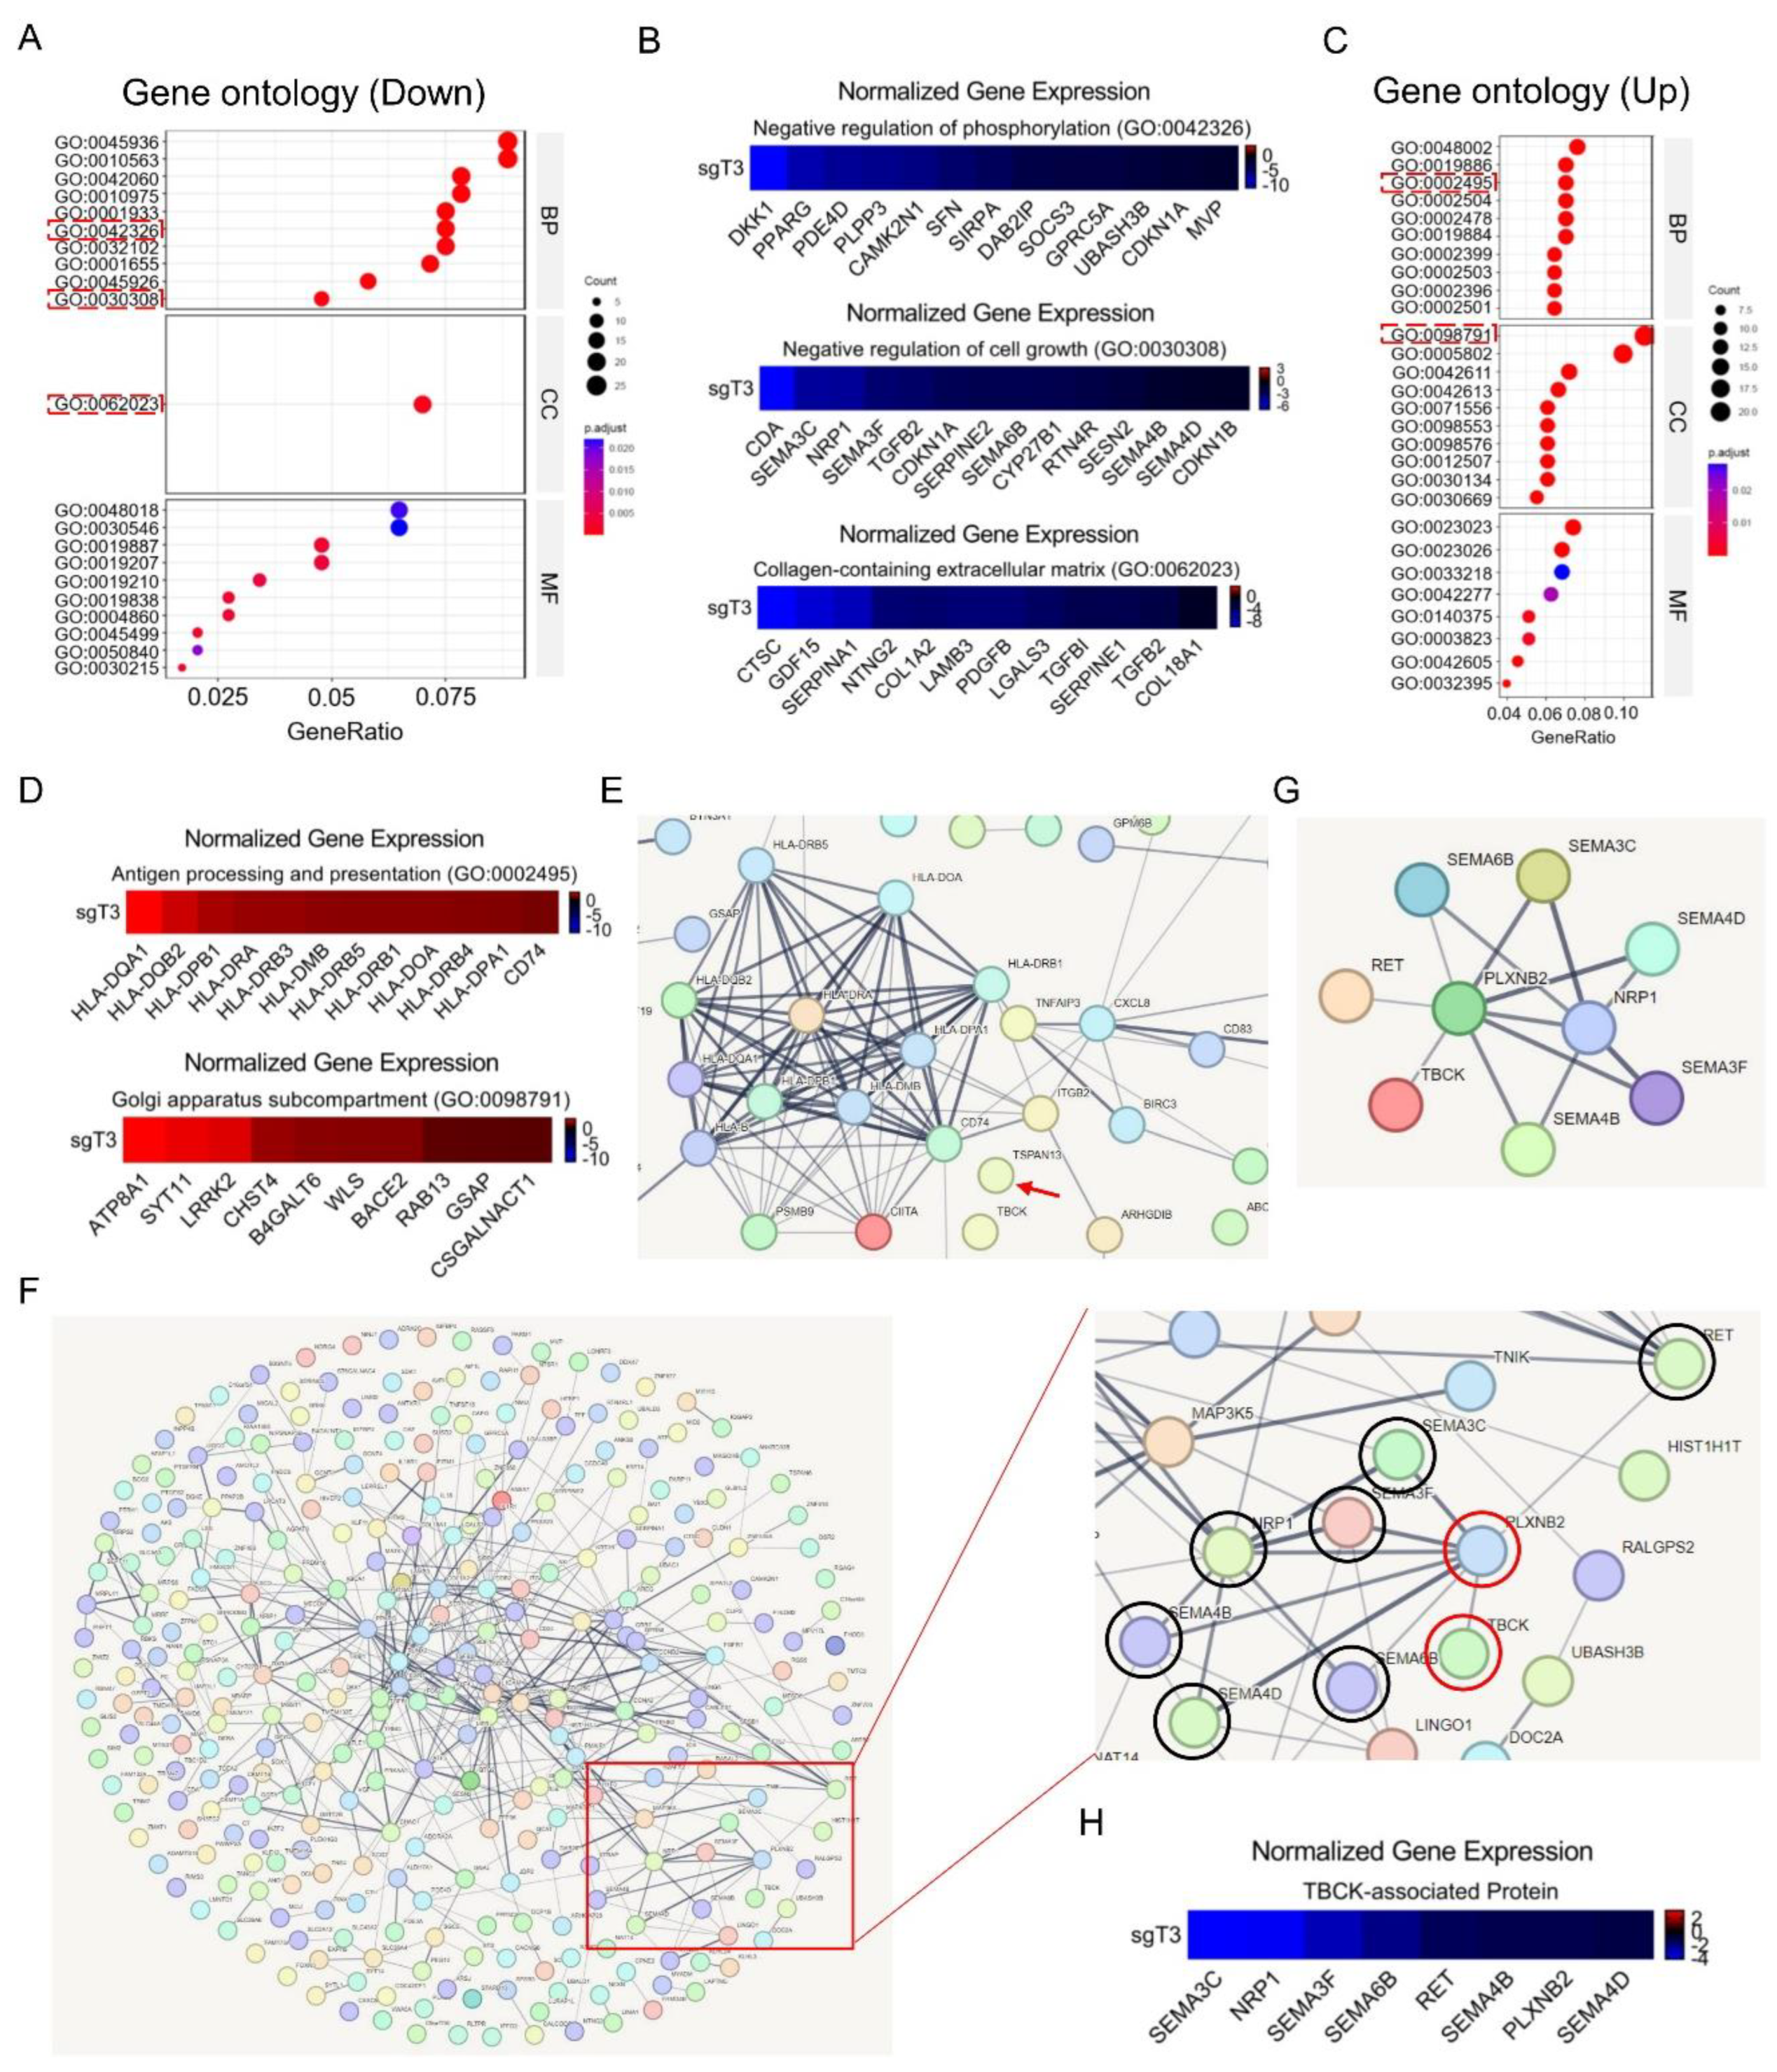

Table 1.
Oligonucleotide primers used for sgRNA cloning, RT-PCR and sequencing analysis.
| Experiment | Gene | Forward primer, 5' → 3′ | Reverse primer, 5' → 3′ | Accession number |
|---|---|---|---|---|
| sgCtrl | Control | CACCGACGGAGGCTAAGCGTCGCAA | AAACTTGCGACGCTTAGCCTCCGTC | NA |
| sgT1 | hTBCK | CACCGCATAACGACAATGTCACAG | AAACCTGTGACATTGTCGTTATGC | NM_001163435.3 |
| sgT3 | hTBCK | CACCGTTCGAGAAAGGAAACCTGTG | AAACCACAGGTTTCCTTTCTCGAAC | NM_001163435.3 |
| RT-PCR | U6 | GAGGGCCTATTTCCCATGATT | NA | |
| hTBCK | GTGTGTCAGAAGAAGGGTGAGT | AAACCAAACCCCTGCAGTTTA | NG_034057.3 | |
| mTBCK | GGTGGATGGGGTGCTTACAT | CTCCGGGCTAGGGGAATAAG | NC_000069.7 |
Table 2.
Design of TBCK sgRNAs using online sgRNA designer tool together with Human CRISPR Knockout Pooled Library.
Table 2.
Design of TBCK sgRNAs using online sgRNA designer tool together with Human CRISPR Knockout Pooled Library.
| Source | gene_id | UID | seq | PAM | Exon Number | On-Target Efficacy Score | Rank for sgTBCK via online tool |
|---|---|---|---|---|---|---|---|
| human_geckov2_library_a | TBCK | HGLibA_48598 | TGAACATTGTGAACGTAGTC | TGG | 3 | 0.4328 | 182 |
| TBCK | HGLibA_48599 | CTCCCATTTCAGCGTCCTTC | GGG | 2 | 0.2272 | 258 | |
| TBCK | HGLibA_48600 | AGCCGAGGCAAAGAAGGTAA | AGG | 2 | 0.5571 | 86 | |
| human_geckov2_library_b | TBCK | HGLibB_48539 | TTCGAGAAAGGAAACCTGTG | AGG | 3 | 0.7099 | 8 |
| TBCK | HGLibB_48540 | AAGAAAATTATTTCAGAGCT | TGG | 7 | 0.3958 | 201 | |
| TBCK | HGLibB_48541 | TTGCTTCCACAAACATCATG | TGG | 2 | 0.6266 | 36 | |
| Online tool sgRNA designer | TBCK | NA | GCATAACGACAATGTCACAG | TGG | 12 | 0.7724 | 3 |
Table 3.
Target cell infection (human and mouse cells).
| Cell line name | Species | Tumor Type | Genetic information | TBCK expression |
|---|---|---|---|---|
| MiaPaca-2 | Homo Sapiens | PDAC | Kras (G12C); c-Myc (WT); TP53(R248W); RB1(WT) | High |
| HT1080 | Homo Sapiens | Fibrosarcoma | Kras (WT); c-Myc (WT); TP53(WT); RB1(WT) | High |
| KPC3 mouse cell line | Mus musculus | Mouse pancreatic neoplasm | Kras (G12D); c-Myc (WT); TP53(R270H); RB1(WT) | High |
Disclaimer/Publisher’s Note: The statements, opinions and data contained in all publications are solely those of the individual author(s) and contributor(s) and not of MDPI and/or the editor(s). MDPI and/or the editor(s) disclaim responsibility for any injury to people or property resulting from any ideas, methods, instructions or products referred to in the content. |
© 2023 by the authors. Licensee MDPI, Basel, Switzerland. This article is an open access article distributed under the terms and conditions of the Creative Commons Attribution (CC BY) license (http://creativecommons.org/licenses/by/4.0/).
Copyright: This open access article is published under a Creative Commons CC BY 4.0 license, which permit the free download, distribution, and reuse, provided that the author and preprint are cited in any reuse.


