Submitted:
09 August 2023
Posted:
11 August 2023
You are already at the latest version
Abstract
Background: The oral health-related quality of life (OHRQoL) assessment evaluated the impact of individual’s oral health on the patient's physical and psychosocial status. We evaluated the association between subjective OHRQoL, measured with the Oral Health Impact Profile-14 (OHIP-14) questionnaire, and unfavorable body mass index (BMI) (i.e., too high or too low) in a large population-based study on older adults from Southern Italy. Moreover, we assessed which of the seven OHIP-14 domains was most strongly associated with an unfavorable BMI. Methods: We used data on a subpopulation of the Salus in Apulia Study, including 216 older adults. BMI <18.4 kg/m2 and >30 kg/m2 were classified as unfavorable, values between 18.5 and 30 kg/m2 were classified as ideal. Results: Higher OHIP-14 total score increased the risk to have an unfavorable BMI [odds ratio (OR):1.08, 95% confidence interval (CI):1.01-1.15]. In the model adjusted for age, sex, education, hypertension, carbohydrate consumption, and alcohol consumption, this finding was confirmed with higher OHIP-14 total score increasing the risk to have an unfavorable BMI (OR:1.10, 95% CI:1.01-1.22), and higher age linked to a decreased risk to have an unfavorable BMI (OR:0.89, 95% CI:0.82-0.97). In a random forest regression model, the most important predictive domains/sub-scales of OHIP-14 in mean decrease Gini for unfavorable BMI were, in order of decreasing importance, physical pain, functional limitation, psychological discomfort, physical disability, social disability, psychological disability, and handicap. Conclusions: In older age, negative OHRQoL, particularly linked to the physical pain domain, increased the risk of underweight or overweight and obesity.
Keywords:
oral health
; body mass index
; obesity
; OHRQoL
; OHIP-14
; aging
; older people
1. Introduction
According to the World Health Organization [1], oral health is a key indicator of overall health, well-being, and quality of life. Several studies have shown that oral and general health are strongly interlinked [2,3,4,5]. In fact, systemic disorders such as cardiovascular diseases [4], cancer [5], chronic respiratory diseases [2], and diabetes mellitus [3] share common modifiable risk factors with most oral diseases and conditions. Tobacco use, alcohol consumption, and diets high in free sugars are among these risk factors, all of which are increasing at the global level [6].
Furthermore, deteriorating oral health, especially in older age, together with a reduction in oral hygiene, may lead to a progression of caries and periodontal disease resulting in tooth loss, which can in turn lead to changes in diet and nutritional health [7]. The reduction in the number of teeth is accompanied by different food choices as partially or fully edentulous patients tend to prefer softer over hard foods, which may have lower nutritional values. Macro- and micronutrient deficiencies resulting from these nutritional imbalances are linked to functional impairment in both underweight and overweight older adults, increasing the risk of falls, fractures, infections, frailty, and dementia [8,9,10,11].
However, an assessment of oral clinical indicators alone is often not adequate to correctly describe health status, especially concerning emotional aspects. On the other hand, it has been reported that individuals with chronic debilitating diseases can consider their quality of life to be higher than healthy people, implying that bad health or sickness does not always reflect a low quality of life [12,13]. In recent years, the assessment of oral health-related quality of life (OHRQoL) has been widely used to evaluate the impact of an individual’s oral health on the patient's physical and psychosocial status, including a self-assessment of emotional well-being, expectations, and therapeutic satisfaction, becoming a relevant component of chronic disease management [13,14]. One of the most widely used tools for assessing OHRQoL is the Oral Health Impact Profile-14 (OHIP-14) questionnaire, including 14 items within seven domains related to functional limitation, physical pain, psychological discomfort, physical, psychological, social disability, and handicap [15]. This is a shorter version of the OHIP-49 [16]. A recent study examined the nutritional characteristics of older adults and their relationship to OHRQoL, measured by the Geriatric Oral Health Assessment Index (GOHAI), showing that individuals with a poor perception of their oral health were more likely to have an unfavorable body mass index (BMI) [17], i.e., BMI ≤18.4 kg/m2 (underweight), BMI between 25.0 and 29.9 kg/m2 (overweight), and BMI ≥30.0 kg/m2 (obese). However, at present, there is a lack of evidence on whether a negative OHRQoL may have an impact on BMI changes. The first aim of the present study was to evaluate the association between subjective OHRQoL, measured with the OHIP-14, and unfavorable BMI in a large population-based study on older adults from Southern Italy. The second aim was to assess which of the seven domains of the OHIP-14 questionnaire (namely functional limitation, physical pain, psychological discomfort, physical disability, psychological disability, social disability, and handicap) was most strongly associated with higher variations in BMI and, therefore, with an increased clinical occurrence of underweight or overweight/obesity in older age.
2. Materials and Methods
2.1. Study Sample and Design
Data used in this cross-sectional study were from the “Salus in Apulia Study,” a public health initiative funded by the Italian Ministry of Health and Apulia Regional Government, and conducted at the Istituto di Ricovero e Cura a Carattere Scientifico (IRCCS) “S. De Bellis, National Institute of Gastroenterology and Research Hospital, Castellana Grotte, Bari, Italy. The sampling framework was the regional office list on December 31, 2014, which included 19,675 individuals, 4021 of whom were 65 years or older. The study design and data collection method are described in detail elsewhere [18,19]. The present study used data on a subpopulation of the Salus in Apulia Study, including 216 older adults who agreed to participate by answering survey questions on their OHRQoL. Before their evaluation, all subjects signed informed consent, and the study was authorized by the institutional review board of the lead institution, namely, the IRCCS "S. de Bellis", National Institute of Gastroenterology and Research Hospital, Castellana Grotte, Bari, Italy. The study was conducted following the Helsinki Declaration of 1975 and followed the STARD (Standards for Reporting Diagnostic Accuracy Studies) and STROBE (Strengthening the Reporting of Observational Studies in Epidemiology) guidelines.
2.2. Assessment of the Oral Health-Related Quality of Life (OHRQoL)
For the evaluation of OHRQoL, the Italian version of the OHIP-14 [16,20] was used, which is a shorter version of the OHIP-49 [15,21], designed to measure self-reported dysfunction, discomfort and disability attributed to oral conditions. The questionnaire is based on a conceptual oral health model outlined by Locker [22]. The original instrument has 49 items, representing 7 domains (functional limitation, physical pain, psychological discomfort, physical disability, psychological disability, social disability, and handicap). The short-form version of the OHIP-49 (i.e., the OHIP-14) consists of 14 items organized in the same seven sub-scales/domains, which address aspects of oral health that may compromise someone’s physical, psychological, and social well-being [16]. Three different scoring methods have been reported in studies using the OHIP-14: a summary OHIP-14 score (the sum of the seven raw sub-scale scores on a scale from 0 to 4, where a high score signifies worse OHRQoL); a weighted and standardized summary score (where weights are attributed to every question within the domain); and the total number of problems reported (i.e. occasionally, often, or very often, with a possible range of 0–14 problems) [16,23].
2.3. Dietary Assessment and Laboratory and Clinical Evaluation
Diet and eating habits were assessed with a validated food frequency questionnaire
(FFQ) used in previous studies [19,24]. FFQ refers only to the frequency of intake and does not consider differences in portion sizes. The questionnaire investigates dietary habits over the previous year and inquires about the consumption of 85 food items, which are further summarized in 28 food groups. The self-administered questionnaire was checked for completeness during an interview conducted by a physician at the study centre. The questionnaire also includes questions about lifestyle aspects, such as educational level, physical activity, and smoking habits. Additionally, at the interview, anthropometric data on waist circumference (cm), weight (kg), and height (cm) were obtained. Weight and height were measured with the mechanical scale SECA 700 and stadiometer SECA 220 (Seca GmBH and Co., Hamburg, Germany), and the BMI was then derived and calculated as the ratio of weight (kg) to height squared (m2). The waist circumference was assessed with respect to the National Cholesterol Education Program: Adult Treatment Panel III (NCEP: ATP III) criteria. The WHO 2000 classification [25] was used to classify BMI into underweight (≤18.4 kg/m2), normal (18.5–24.9 kg/m2), overweight (25.0–29.9 kg/m2), and obese (≥30.0 kg/m2). In the present study, BMI was further classified into two groups, namely ideal and unfavorable, as follows: BMI lower or equal 18.4 kg/m2 and over 30 kg/m2 were classified as unfavorable, while values between 18.5 and 30 kg/m2 were classified as ideal. For each individual, a blood sample was collected in the morning after overnight fasting to measure the levels of fasting blood glucose (FBG), total cholesterol, high-density lipoprotein cholesterol (HDL-C), and low-density lipoprotein cholesterol (LDL-C). The FBG level was measured using the glucose oxidase method (Sclavus), whereas the concentrations of plasma lipids (triglycerides, total cholesterol, and HDL-C) were quantified with an automated colorimetric device (Hitachi, Boehringer Mannheim). The LDL-C levels were measured using the Friedewald equation. Blood cell count was determined by a Coulter Hematology analyzer (Beckman–Coulter, Brea, CA). The clinical evaluation included extemporaneous ambulatory systolic blood pressure (SBP) and diastolic blood pressure (DBP), determined with the patient in a sitting position after at least a 10-minute rest and taken at least 3 different times, using an automatic blood pressure monitor (Omron Healthcare). Diabetes mellitus and hypertension were diagnosed based on the following international diagnostic standards: FBG level higher than 125 g/dL (to convert to millimoles per liter, multiply by 0.0555) and SBP/DBP greater than or equal to 130/80 mm Hg.
2.4. Statistical Analysis
Continuous variables were expressed as mean ± standard deviation (SD), median (min to max) and categorical variables as the proportion (%). The whole sample was subdivided into two groups according to BMI categories (ideal BMI and unfavorable BMI) to describe important differences. The distribution of all variables was tested using the Shapiro distribution test. A p value equal or less 0.05 was chosen to define statistical significance. Logistic regression models were used to estimate the association effect between the unitary increases of the OHIP-14 total score as independent variables and ideal BMI (yes/no) as an outcome. To assess the confounding effect of a number of covariates, we built two hierarchical logistic regression models: the first unadjusted and the second model adjusted for all the covariates. The covariates were selected as confounders on the basis of associations with both the variable of interest (OHRQoL) and the outcome (BMI): age [17] (Swoboda et al, 2006; Ohlsson & Manjer, 2020), sex [26,27], education [27,28], hypertension [29,30], carbohydrate consumption [6,31], and alcohol consumption [6,27]. Furthermore, in order to rank the domains/sub-scales of OHIP-14 that were most predictive for the ideal BMI condition, a random forest regression model was built on ideal BMI condition (yes/no) as the output. The predictors considered were obtained from the OHIP-14 domains/sub-scales as follows: Domain 1(Functional limitation) (Question 1: Difficult pronounce words plus Question 2: Worsened taste), Domain 2 (Physical pain) (Question 3: Pain plus Question 4: Uncomfortable to eat), Domain 3 (Psychological discomfort) (Question 5: Concern for the mouth plus: Question 6: Self-consciousness due to oral problems), Domain 4 (Physical disability) (Question 7: Diet unsatisfactory plus Question 8: Interrupted meals), Domain 5 (Psychological disability) (Question 9: Difficult to relax due to oral problems plus Question 10: Embarrassment due to oral problems), Domain 6 (Social disability) (Question 11: Irritability plus Question 12: Difficult to do jobs due to oral problems), Domain 7 (Handicap) (Question 13: Life less satisfying due to oral problems plus Question 14: Totally unable to function). We used the mean decrease in Gini coefficient as a measure of how each OHIP-14 domain/sub-scale contributed to the homogeneity of the nodes and leaves in the resulting random forest regression model. In particular, Gini importance measures the average gain of purity by splits of a given variable. The higher the value of mean decrease Gini score, the higher the importance of the OHIP-14 domains/subscale in the model. Statistical analysis was performed with RStudio software, Version 1.4.1106, using additional packages: Tidyverse, rstatistix, Epi, kableExtra, gmodels, randomForest, ggplot2.
3. Results
3.1. Descriptive Analysis
Table 1 summarizes the baseline sociodemographic, laboratory, and clinical variables of the whole sample (N=216) according to the BMI status (ideal or unfavorable), including the nutritional assessment and the OHIP-14 assessment, which we have schematically and graphically shown in Figure 1. The ideal BMI group included 152 subjects (mean age= 71.95±5.39 years) and was slightly dominated by females (47.4% males vs. 52.6% females). The unfavorable BMI Group consisted of 64 subjects (mean age= 70.12±4.05 years) with a higher presence of males (56.2%) than females (43.8%). Age was higher in the ideal BMI group (71.95±5.39 years) than in unfavorable BMI group (70.12±4.05 years, p=0.03), while DBP (p<0.01), SBP (p<0.01), FBG (p<0.01), HbA1c (p<0.01), and triglycerides (P=0.05) were higher in the unfavorable BMI group compared to the ideal BMI group (Table 1). For the OHIP-14, the total score (p=0.03), Question 4 (uncomfortable to eat, domain: physical pain) (p=0.01), and Question 11 (irritability, domain: social disability) (p=0.01) were more represented in the unfavorable BMI group if compared with the ideal BMI group (Table 1). Figure 2 shows the jitter box plot of OHIP-14 total score across BMI status (ideal/unfavorable).
3.2. Logistic Regression Analyses
In Table 2, we showed two hierarchical logistic regression models used to estimate the association effect between the unitary increases of the OHIP-14 total score as independent variables and ideal BMI (yes/no) as an outcome. In the unadjusted model, an increase in OHIP-14 total score increased the risk to have an unfavorable BMI [odds ratio (OR): 1.08, 95% confidence interval (CI): 1.01-1.15, p=0.03]. In the model adjusted for age, sex, education, hypertension, carbohydrate consumption, and alcohol consumption, this finding was confirmed with an increase in OHIP-14 total score that increased the risk to have an unfavorable BMI (OR: 1.10, 95% CI: 1.01 -1.22, p=0.04), and higher age linked to a decreased risk to have an unfavorable BMI (OR: 0.89, 95% CI: 0.82 -0.97, p=0.04).
3.3. Random Forest Regression Model
To rank the oral health domains/sub-scales of OHIP-14 that were most predictive for the ideal BMI, we built a random forest regression model on ideal BMI condition as the output. In the present study, the most important predictive domains/sub-scales of OHIP-14 in mean decrease Gini for unfavorable BMI were, in order of decreasing importance, Domain 2 (Physical pain), Domain 1 (Functional limitation), Domain 3 (Psychological discomfort), the Domain 4 (Physical disability), the Domain 6 (Social disability), Domain 5 (Psychological disability), and finally, Domain 7 (Handicap) (Table 3). Figure 3 shows a dot chart of variable importance as measured in mean decrease Gini by the random forest regression model of the domains/sub-scales of the OHIP-14 with ideal BMI status as output.
4. Discussion
In the present large population-based study on older adults from Southern Italy, negative OHRQoL, i.e., discomfort and disability attributed to oral conditions, increased the risk to have an unfavorable BMI in the hierarchical logistic regression models both unadjusted and also when adjusted for age, sex, education, hypertension, carbohydrate consumption, and alcohol consumption. Furthermore, higher age was linked to a decreased risk to have an unfavorable BMI. The most important predictive domains/sub-scales of OHIP-14, measuring OHRQoL, for unfavorable BMI, were, in decreasing order of importance, physical pain, functional limitation, psychological discomfort, physical disability, social disability, psychological disability, and handicap.
The principal finding of the present study was that negative OHRQoL increased the risk to have an unfavorable BMI in a large population of older adults from Southern Italy, also after adjustment for a series of possible confounding factors. In recent years, in other population-based studies, the assessment of clinical oral indicators and OHRQoL has been widely used to evaluate whether oral problems may lead to nutritional dysfunction in older age [17,32,33]. In particular, a parabolic effect was found between OHRQoL and BMI in community-dwelling older adults living in Alabama, USA, with the strongest associations occurring in the underweight and obese categories [32]. These findings were similar to those of the present study in which BMI <18.4 kg/m2 (underweight) and >30 kg/m2 (obese) were classified as unfavorable, and higher OHRQoL increased the risk to have an unfavorable BMI. However, in the present study, we did not distinguish between older individuals underweight and overweight/obese. Another study, using the GOHAI for measuring OHRQoL, found that subjects with a poor perception of their oral health were more likely to have an unfavorable BMI [17], with a classificatory system similar to that of the present study (older individuals underweight, overweight, and obese categorized as having unfavorable BMI). Finally, in a hospital-based study on Thai older individuals, those with obesity had an almost three times higher tendency to have a negative OHRQoL compared with the non-obese [33]. Moreover, after adjusting for all related factors, the chances of predicting a prevalence of participants who scored four on at least one item on the OHIP-14 score based on obesity and oral dryness score were 4.42 (95% CI:1.57–12.47) and 1.11 (95% CI:1.02–1.20), respectively. For every point of BMI or 1 cm increase in waist circumference, the chance of unfavorable OHRQoL also increased by a factor of 1.23 or 1.06, respectively, without the influence of xerostomia [33]. However, in some other cross-sectional studies, there was no association between OHRQoL measurements and nutritional status among older subjects [34,35]. These negative findings may be partly explained by various factors affecting food choices and intakes among older subjects, like general health, socioeconomic components, and taste and control over food preparation [36], with also a lack of knowledge on the nutritive value of foods consumed among older individuals, putting them still at risk of malnutrition regardless of their oral perceptions. Furthermore, the sample sizes in these previous negative studies were very small [34,35], without a comprehensive adjustment for possible confounders, and these factors could be a source of discrepancy with the present study.
Different studies showed an association between the impacts of OHRQoL and nutritional factors [37,38]. Older subjects with poor OHRQoL scores were shown to be at risk of nutritional deficiencies investigated with the Mini-Nutritional Assessment (MNA) [37,38], and not to have an actual unfavorable BMI. On the contrary, older adults with a better perception of oral health were among those at least at risk of malnutrition (lower MNA score) [39]. Both oral health and nutritional status are strongly related to healthy behaviors, and therefore these findings may also suggest that those who have poorer oral health may be less likely to be conscious about their diet. Furthermore, in the present study, higher age was linked to a decreased risk to have an unfavorable BMI. This finding was consistent with the results from a Malaysian population-based study in which the number of older adults with unfavorable BMI significantly decreased with advancing age [17]. This pattern may be explained by the fact that older individuals with unfavorable BMI (i.e., obesity) may die earlier because of chronic diseases related to their condition like metabolic or cardiovascular diseases, thus leaving the non-obese individuals with a higher survival rate in the older age group.
In the present study, the OHRQoL domains more linked to physical manifestations (physical pain, functional limitations, and physical disability, with their items focusing on worsened taste, interrupted meals, and discomfort to eat) appeared to have a greater impact on nutritional factors associated with an unfavorable BMI compared to psychosocial manifestations of the OHRQoL (social disability and psychological disability, with their items focusing on the difficulty to relax or to do jobs due to oral problems). Moreover, the item “uncomfortable to eat“ (domain: physical pain) and the item “irritability“ (domain: social disability) were more represented in the unfavorable BMI group if compared with the ideal BMI group. In a recent hospital-based study, using OHIP-14 to evaluate OHRQoL, the average score was highest for the physical pain domain in all studied groups [33]. Moreover, in the same study, all groups had the highest frequency of responses for the two items (item 3, pain, and item 4, uncomfortable to eat) of the physical pain domain of the OHIP-14 [33], suggesting that a possible underlying mechanism explaining why the higher rate of dental disease in patients with obesity/underweight might be a factor related to OHRQoL. The physical pain domain is determined by pain and discomfort when eating. The present findings are also consistent with a previous study in Norway showing that older individuals most frequently experienced problems with pain in the mouth and discomfort when eating [40]. Therefore, oral pain may lead to a negative OHRQoL in older adults who may experience difficulty chewing and swallowing due to dry mouth, missing teeth, and dental and periodontal problems resulting in discomfort while eating and drinking [41,42].
The strengths of the present study were the population-based setting and the large number of older subjects included, notwithstanding a relatively small number of those investigated with the OHIP-14. However, given the cross-sectional nature of the study, we cannot make any inference on the direction of the association because of reverse causality; we can estimate the association only in terms of prevalence. Other studies showed no statistically significant differences in BMI between individuals with at least one tooth and persons with no teeth [32,43]. Therefore, dentate status was not included in the present analysis. Furthermore, the OHIP-14 items were self-reported and consequently, subjective. However, they provide important information on the perceptions of OHRQoL in older adults, and self-reported measures may be more meaningful than clinical measures in this context [32]. Finally, the present findings may not be generalizable; therefore, these results should be cautiously interpreted.
5. Conclusions
In the present large population-based study on older adults from Southern Italy, negative OHRQoL, i.e., discomfort and disability attributed to oral conditions, particularly to the physical pain domain, increased the risk of being underweight or overweight and obesity also after adjustment for possible confounders. Furthermore, higher age was linked to a decreased risk to have an unfavorable BMI. Therefore, the present study suggested that older adults with poor perception of oral health were more likely to have an unfavorable BMI. The application of OHRQoL tools together with objective clinical oral indicators needs to be emphasized as it could be utilized as oral health predictors that might lead to impaired nutrition in the older population. Future studies should be performed with a larger sample size to collect additional data about OHRQoL and nutrition. Effective oral pain management and prevention of oral problems in older people may improve OHRQoL, and regular dental visits and treatment of oral disease can prevent weight gain or loss and poor self-perception of oral health [9].
Author Contributions
Conceptualization, V.D. and F.P.; methodology, F.P. and R.S.; software, F.C.; validation, V.D., F.P., F.L. and M.L.; formal analysis, F.C.; investigation, V.D., R.Z. and A.D; data curation, V.D., F.P and M.L; writing—original draft preparation, V.D., F.P and F.L; writing—review and editing, F.P., A.P. and D.M.; supervision, F.P, V.S. and F.L.; project administration, V.S and A.P.; funding acquisition, R.S. All authors contributed to drafting, revising and approving of the submitted manuscript. All authors have read and agreed to the published version of the manuscript.
Funding
This manuscript is the result of the research work on frailty undertaken by the “Research Network on Aging” team, supported by the resources of the Italian Ministry of Health—Research Networks of National Health Institutes.
Institutional Review Board Statement
This study was approved by the Institutional Review Board of the National Institute of Gastroenterology “S. De Bellis”, Castellana Grotte, Bari, Italy”. The informed written consent forms were obtained from all participants. Approval Code: 68/CE De Bellis. Approval Date: April 9, 2019.
Informed Consent Statement
Informed consent was obtained from all subjects involved in the study.
Data Availability Statement
The data presented in this study are available on request to the corresponding Authors Francesco Panza (email: f_panza@hotmail.com) and Vittorio Dibello (email: vittoriodibello1@gmail.com)
Acknowledgments
We thank the MICOL Study group and the “Salus in Apulia” Research Team.
Conflicts of Interest
The authors declare no conflict of interest.
References
- World Health Organization (2020) https://www.who.int/news-room/fact-sheets/detail/oral-health.
- Azarpazhooh A, Leake JL (2006) Systematic review of the association between respiratory diseases and oral health. J Periodontol 77: 1465-1482. [CrossRef]
- Kudiyirickal MG, Pappachan JM (2015) Diabetes mellitus and oral health. Endocrine 49: 27-34. [CrossRef]
- Holmlund A, Lampa E, Lind L (2017) Oral health and cardiovascular disease risk in a cohort of periodontitis patients. Atherosclerosis 262: 101-106. [CrossRef]
- Michaud DS, Fu Z, Shi J, Chung M (2017) Periodontal Disease, Tooth Loss, and Cancer Risk. Epidemiol Rev 39: 49-58. [CrossRef]
- Kossioni AE, Hajto-Bryk J, Janssens B et al (2018) Practical Guidelines for Physicians in Promoting Oral Health in Frail Older Adults. J Am Med Dir Assoc 19: 1039-1046. [CrossRef]
- Sheiham A, Steele LG, Marcenes W, Finch AW, Walls AWG (1999) The impact of oral health on stated ability to eat certain foods; findings from the National Diet and Nutrition Survey of Older People in Great Britain. Gerodontology16: 11-20. [CrossRef]
- Flood KL, Carr DB (2004). Nutrition in the elderly. Curr Opin Gastroenterol 20: 125-129. [CrossRef]
- Tôrres LHDN, De Marchi RJ, Hilgert JB et al (2020) Oral health and Obesity in Brazilian elders: A longitudinal study. Community Dent Oral Epidemiol 48: 540-548. [CrossRef]
- Dibello V, Zupo R, Sardone R et al (2021) Oral frailty and its determinants in older age: a systematic review. Lancet Healthy Longev 2: e507-e520. [CrossRef]
- Dibello V, Lozupone M, Manfredini D et al (2021) Oral frailty and neurodegeneration in Alzheimer's disease. Neural Regen Res 16: 2149-2153. [CrossRef]
- Gerritsen AE, Allen PF, Witter DJ, Bronkhorst EM, Creugers NH (2010) Tooth loss and oral health-related quality of life: a systematic review and meta-analysis. Health Qual Life Outcomes 8: 126. [CrossRef]
- Slade GD (2012) Oral health-related quality of life is important for patients, but what about populations? Community Dent Oral Epidemiol 40: 39-43. [CrossRef]
- Adamo D, Pecoraro G, Fortuna G et al (2020) Assessment of oral health-related quality of life, measured by OHIP-14 and GOHAI, and psychological profiling in burning mouth syndrome: A case-control clinical study. J Oral Rehabil 47: 42-52. [CrossRef]
- Slade GD, Spencer AJ (1994) Development and evaluation of the Oral Health Impact Profile. Community Dent Health 11: 3-11.
- Slade GD (1997) Derivation and validation of a short-form oral health impact profile. Community Dent Health 25: 284-290. [CrossRef]
- Rosli TI, Chan YM, Kadir RA, Hamid TAA (2019) Association between oral health-related quality of life and nutritional status among older adults in district of Kuala Pilah, Malaysia. BMC Public Health 19: 547. [CrossRef]
- Lozupone M, Panza F, Piccininni M et al (2018) Social dysfunction in older age and relationships with cognition, depression, and apathy: the GreatAGE Study. J Alzheimers Dis 65: 989-1000. [CrossRef]
- Sardone R, Lampignano L, Guerra V et al (2020) Relationship between inflammatory food consumption and age-related hearing loss in a prospective observational cohort: results from the Salus in Apulia Study. Nutrients 12: 426. [CrossRef]
- Corridore D, Campus G, Guerra F, Ripari F, Sale S, Ottolenghi L (2013) Validation of the Italian version of the Oral Health Impact Profile-14 (IOHIP-14). Ann Stomatol (Roma) 4: 239–243.
- Locker D, Slade G (1993) Oral Health and quality of life among older adults: The Oral Health Impact Profile. J Can Dent Assoc 59: 830–3, 837–8, 844.
- Locker D (1988) Measuring oral health: a conceptual framework. Community Dent Health 5: 3–18.
- Allen PF, Locker D (1997) Do weights really matter? An assessment using the oral health impact profile? Community Dent Health 14: 133–138.
- Lampignano L, Sardone R, D'Urso F et al (2022) Processed meat consumption and the risk of incident late-onset depression: a 12-year follow-up of the Salus in Apulia Study. Age Ageing 51: afab257. [CrossRef]
- World Health Organization (2020) WHO technical report series 894. Geneva: World Health Organization; 2000. Obesity: preventing and managing the global epidemic. Report of a WHO consultation.
- Swoboda J, Kiyak HA, Persson RE et al (2006) Predictors of oral health quality of life in older adults. Spec Care Dentist 26: 137-144. [CrossRef]
- Ohlsson B, Manjer J (2020) Sociodemographic and Lifestyle Factors in relation to Overweight Defined by BMI and "Normal-Weight Obesity". J Obes 2020: 2070297. [CrossRef]
- Baniasadi K, Armoon B, Higgs P et al (2021) The Association of Oral Health Status and socio-economic determinants with Oral Health-Related Quality of Life among the elderly: A systematic review and meta-analysis. Int J Dent Hyg 19: 153-165. [CrossRef]
- Kumar P, Mastan K, Chowdhary R, Shanmugam K (2012) Oral manifestations in hypertensive patients: A clinical study. J Oral Maxillofac Pathol 16: 215-221. [CrossRef]
- Soltani S, Shirani F, Chitsazi MJ, Salehi-Abargouei A (2016) The effect of dietary approaches to stop hypertension (DASH) diet on weight and body composition in adults: a systematic review and meta-analysis of randomized controlled clinical trials. Obes Rev 17: 442-454. [CrossRef]
- Hession M, Rolland C, Kulkarni U, Wise A, Broom J (2009) Systematic review of randomized controlled trials of low-carbohydrate vs. low-fat/low-calorie diets in the management of obesity and its comorbidities. Obes Rev 10: 36-50. [CrossRef]
- Makhija SK, Gilbert GH, Litaker MS et al (2007) Association between aspects of oral health-related quality of life and body mass index in community-dwelling older adults. J Am Geriatr Soc 55: 1808-1816. [CrossRef]
- Khongsirisombat N, Kiattavorncharoen S, Thanakun S (2022) Increased Oral Dryness and Negative Oral Health-Related Quality of Life in Older People with Overweight or Obesity. Dent J (Basel) 10: 231. [CrossRef]
- Daly RM, Elsner RJF, Allen PF, Burke FM (2003) Associations between self-reported dental status and diet. J Oral Rehabil 30: 964–970. [CrossRef]
- Allen PF (2005) Association between diet, social resources and oral health related quality of life in edentulous patients. J Oral Rehabil 32: 623-628. [CrossRef]
- Kamphuis CB, de Bekker-Grob EW, van Lenthe FJ (2015) Factors affecting food choices of older adults from high and low socioeconomic groups: a discrete choice experiment. Am J Clin Nutr 101: 768-774. [CrossRef]
- El Osta N, Hennequin M, Tubert-Jeannin S, Abboud Naaman NB, El Osta L, Geahchan N (2014) The pertinence of oral health indicators in nutritional studies in the elderly. Clin Nutr 33: 316-321. [CrossRef]
- Pillai RS, Mathur VP, Jain V et al (2015) Association between dental prosthesis need, nutritional status and quality of life of elderly subjects. Qual Life Res 24: 2863-2871. [CrossRef]
- Hugo C, Cockburn N, Ford P, March S, Isenring E (2016) Poor nutritional status is associated with worse oral health and poorer quality of life in aged care residents. J Nurs Home Res 2: 118-122. [CrossRef]
- Dahl KE, Wang NJ, Holst D, Ohrn K (2011) Oral health-related quality of life among adults 68-77 years old in Nord-Trøndelag, Norway. Int J Dent Hyg 9: 87–92. 87-92. [CrossRef]
- Choi JH, Kim MJ, Kho HS (2021) Oral health-related quality of life and associated factors in patients with xerostomia. Int J Dent Hyg 19: 313–322. [CrossRef]
- Henni SH, Skudutyte-Rysstad R, Ansteinsson V, Hellesø R, Hovden EAS (2022) Oral health and oral health-related quality of life among older adults receiving home health care services: A scoping review. Gerodontology [Online ahead of print] 1–11. [CrossRef]
- Elwood PC, Bates JF (1972) Dentition and nutrition. Dent Pract Dent Rec 22: 427–429.
Figure 1.
Schematic representation of the relationship between oral health-related quality of life measured with the Oral Health Impact Profile-14 (OHIP-14) questionnaire, and body mass index (BMI) in a population of older people.
Figure 1.
Schematic representation of the relationship between oral health-related quality of life measured with the Oral Health Impact Profile-14 (OHIP-14) questionnaire, and body mass index (BMI) in a population of older people.
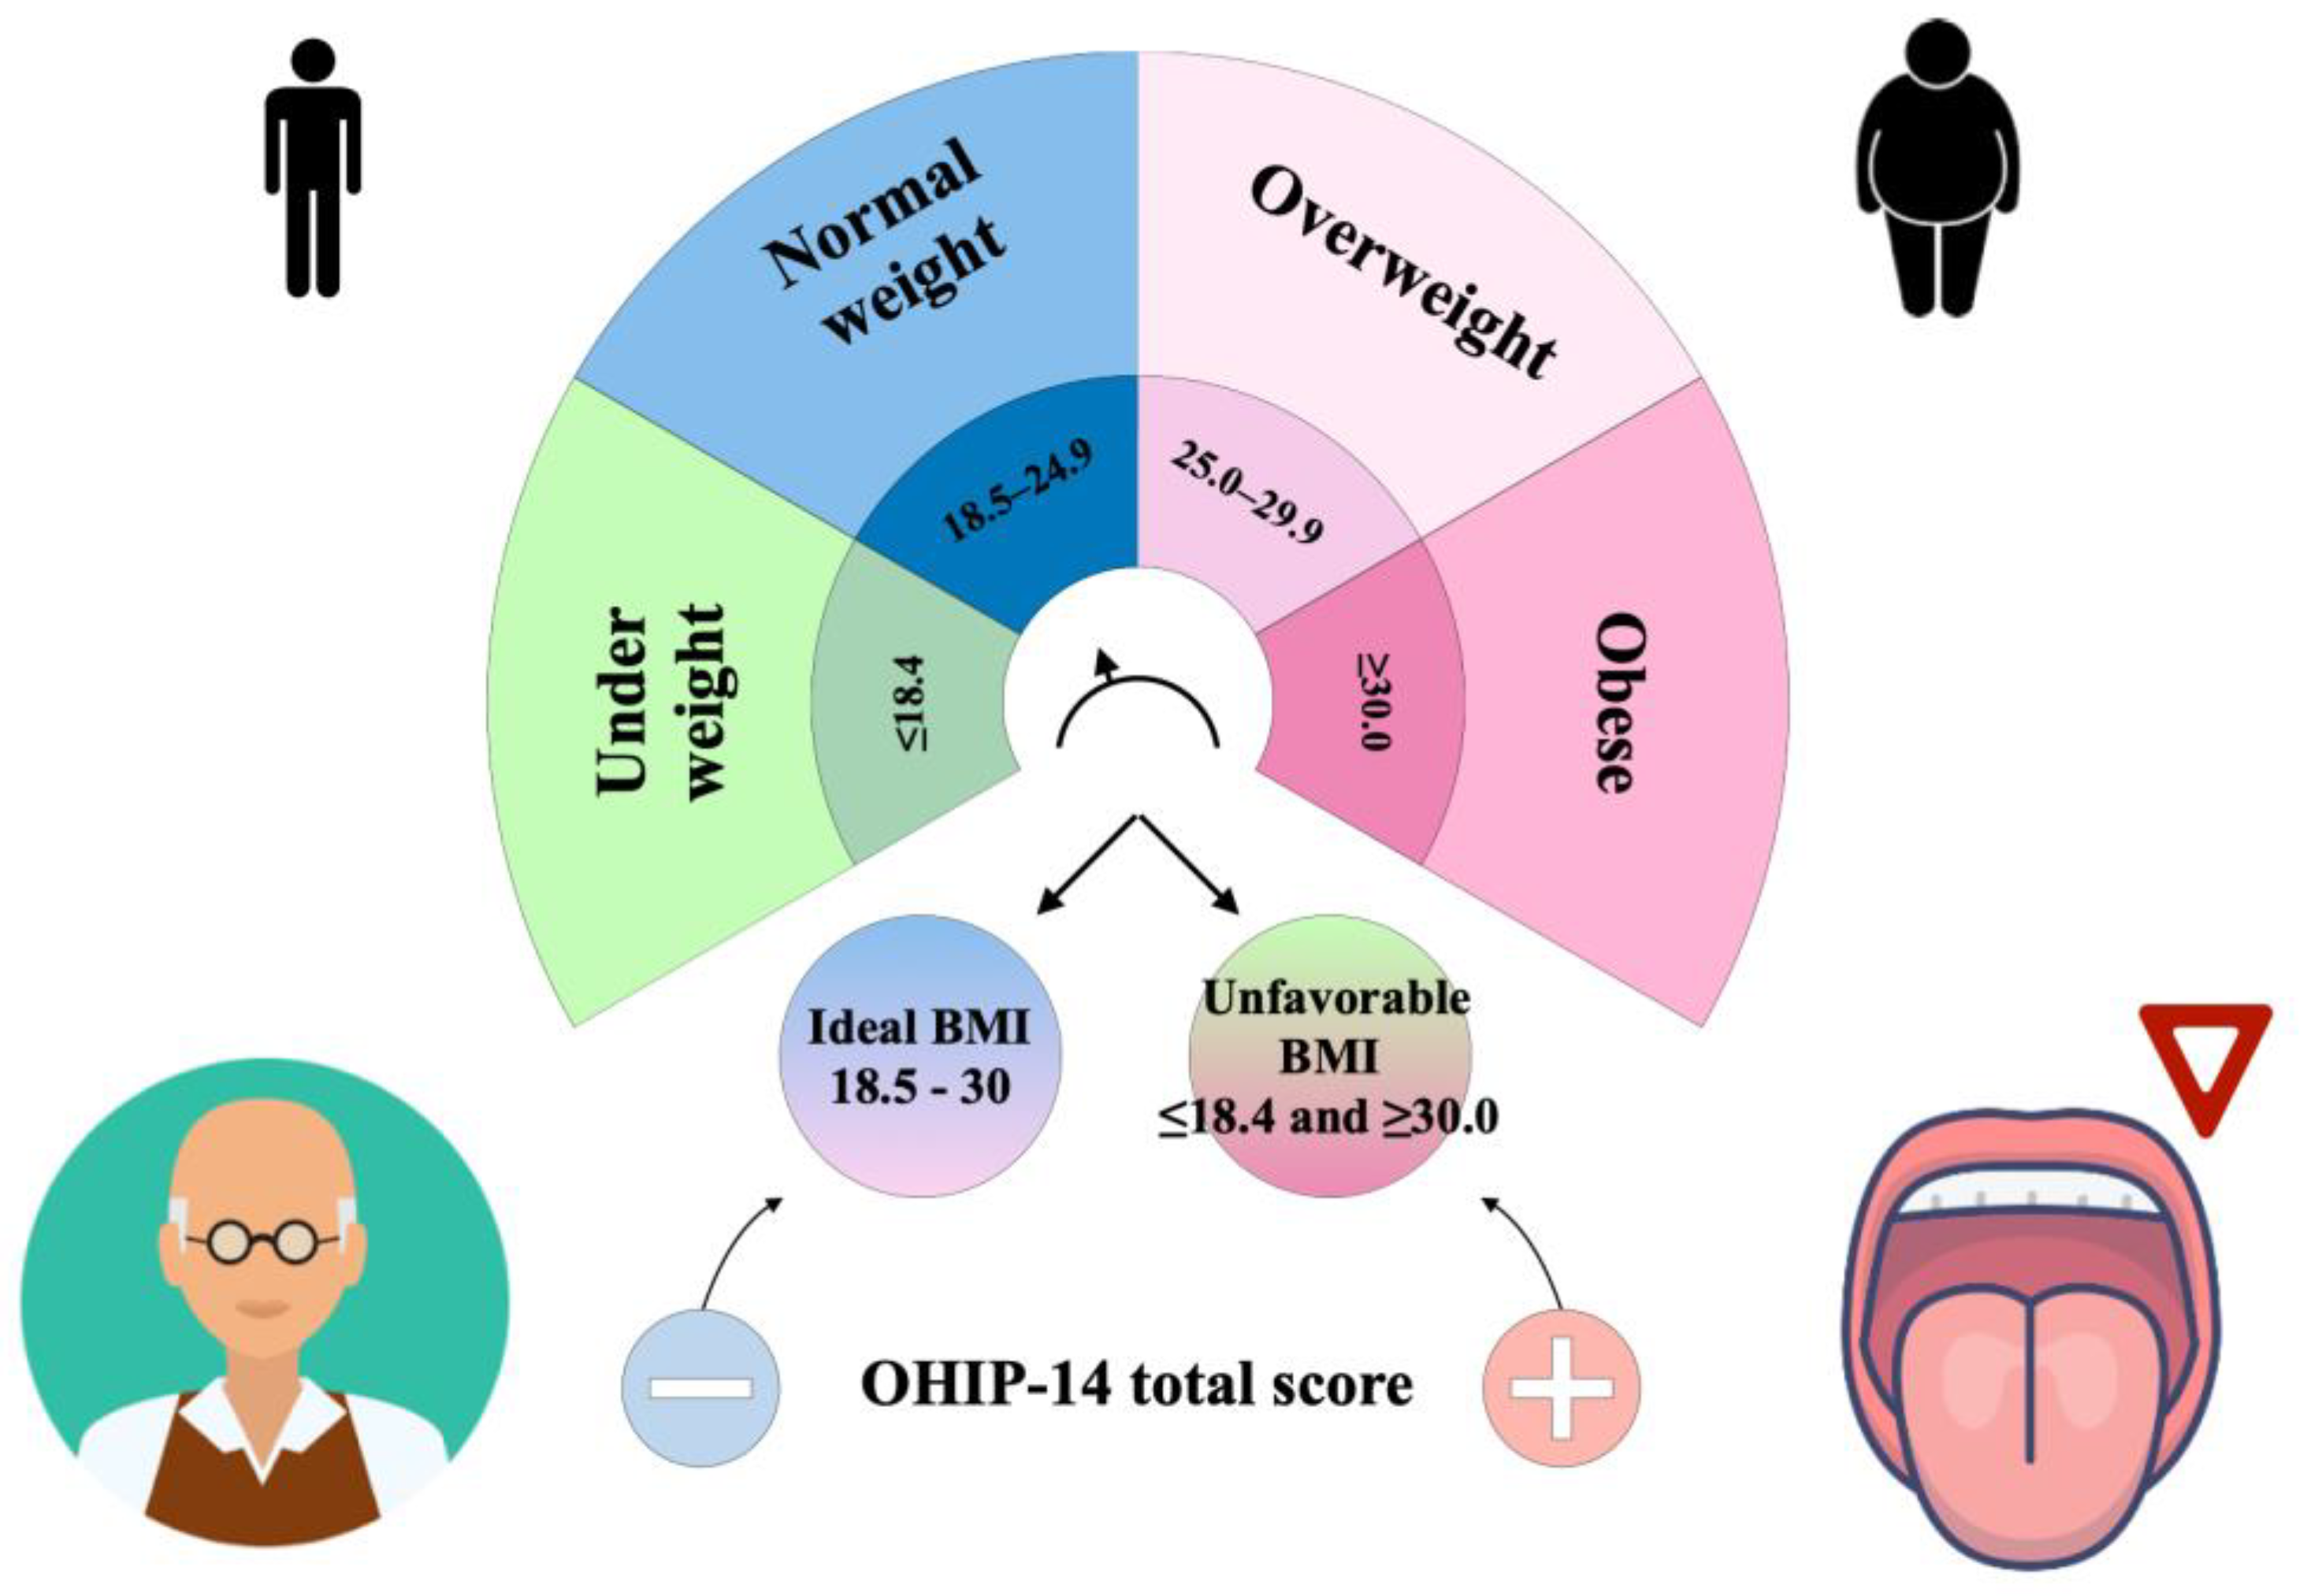
Figure 2.
Jitter box plot of Oral Health Impact Profile-14 (OHIP-14) total score across body mass index (BMI) status (ideal/unfavorable). The Salus in Apulia Study (N=216).
Figure 2.
Jitter box plot of Oral Health Impact Profile-14 (OHIP-14) total score across body mass index (BMI) status (ideal/unfavorable). The Salus in Apulia Study (N=216).
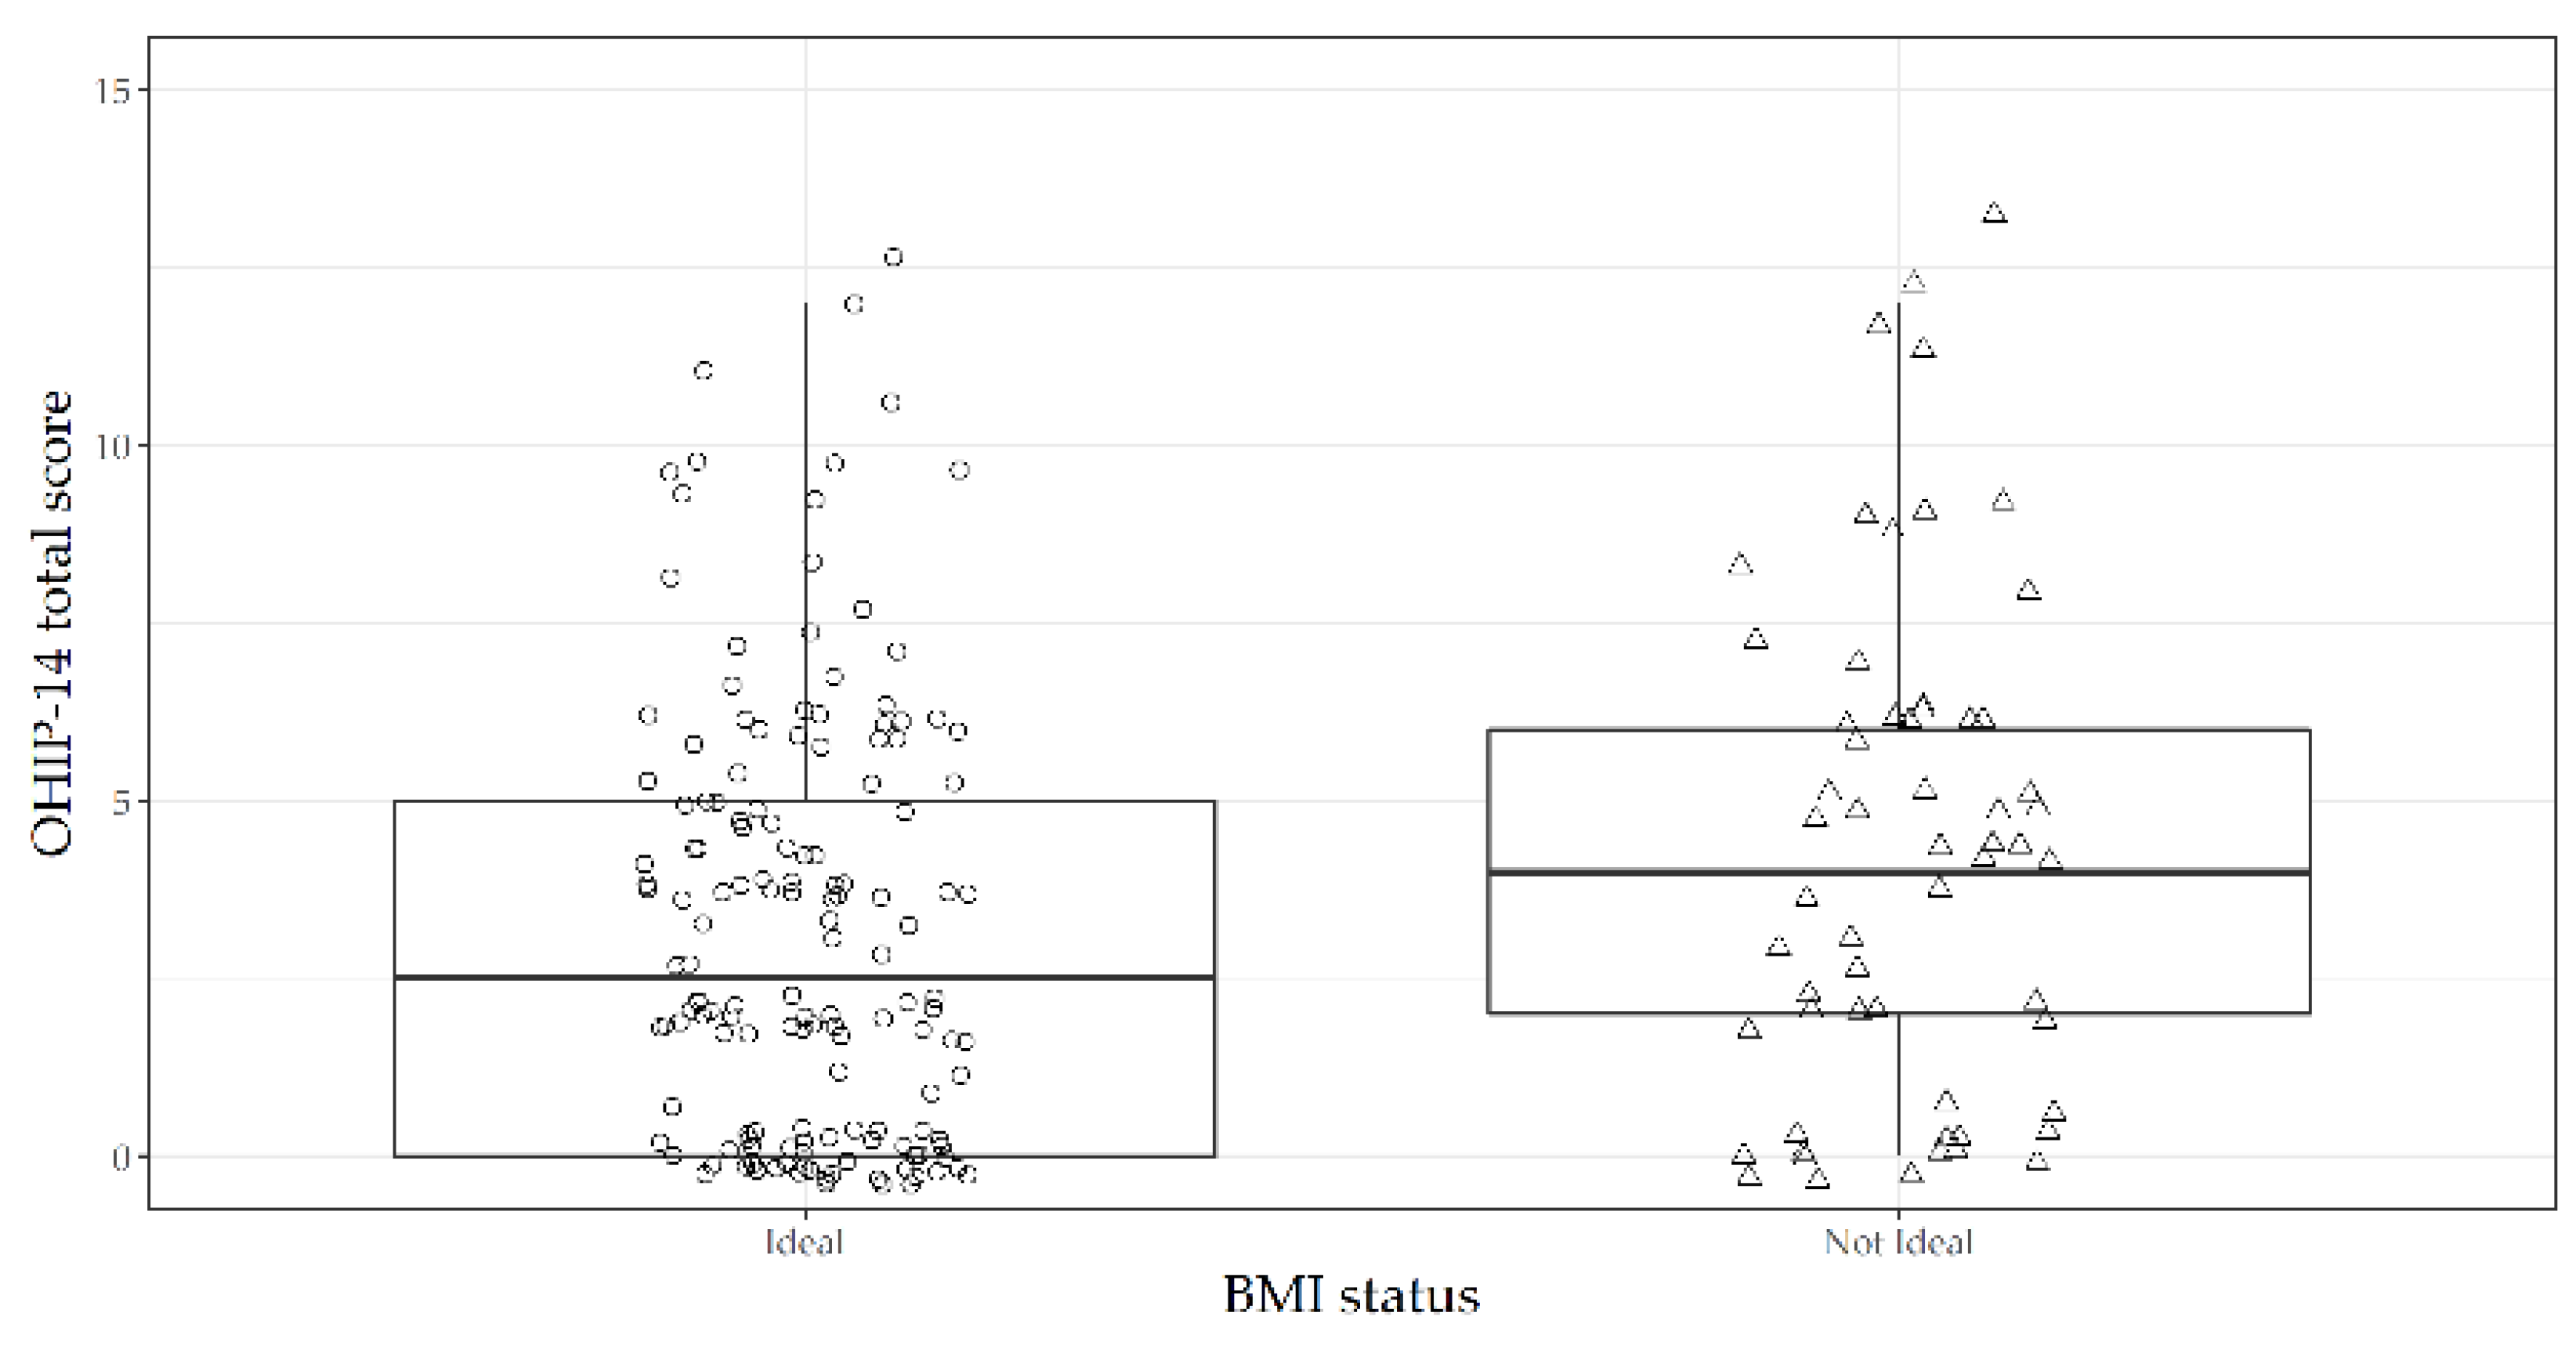
Figure 3.
Dot chart of variable importance as measured by a random forest regression model of the domains/sub-scales of the Oral Health Impact Profile-14 (OHIP-14), with ideal body mass index (BMI) status as output. The Salus in Apulia Study (N=216). Domain 1 (Functional limitation): Q1(Difficult pronounce words) plus (Q2: Worsened taste); Domain 2 (Physical pain): Q3 (Pain) plus Q4 (Uncomfortable to eat); Domain 3 (Psychological discomfort): Q5 (Concern for the mouth) plus Q6 (Self-consciousness due to oral problems); Domain 4 (Physical disability): Q7 (Diet unsatisfactory) plus Q8 (Interrupted meals); Domain 5 (Psychological disability): Q9 (Difficult to relax due to oral problems) plus Q10 (Embarrassment due to oral problems); Domain 6 (Social disability): Q11 (Irritability) plus Q12 (Difficult to do jobs due to oral problems); Domain 7 (Handicap): Q13 (Life less satisfying due to oral problems) to Q14 (Totally unable to function)
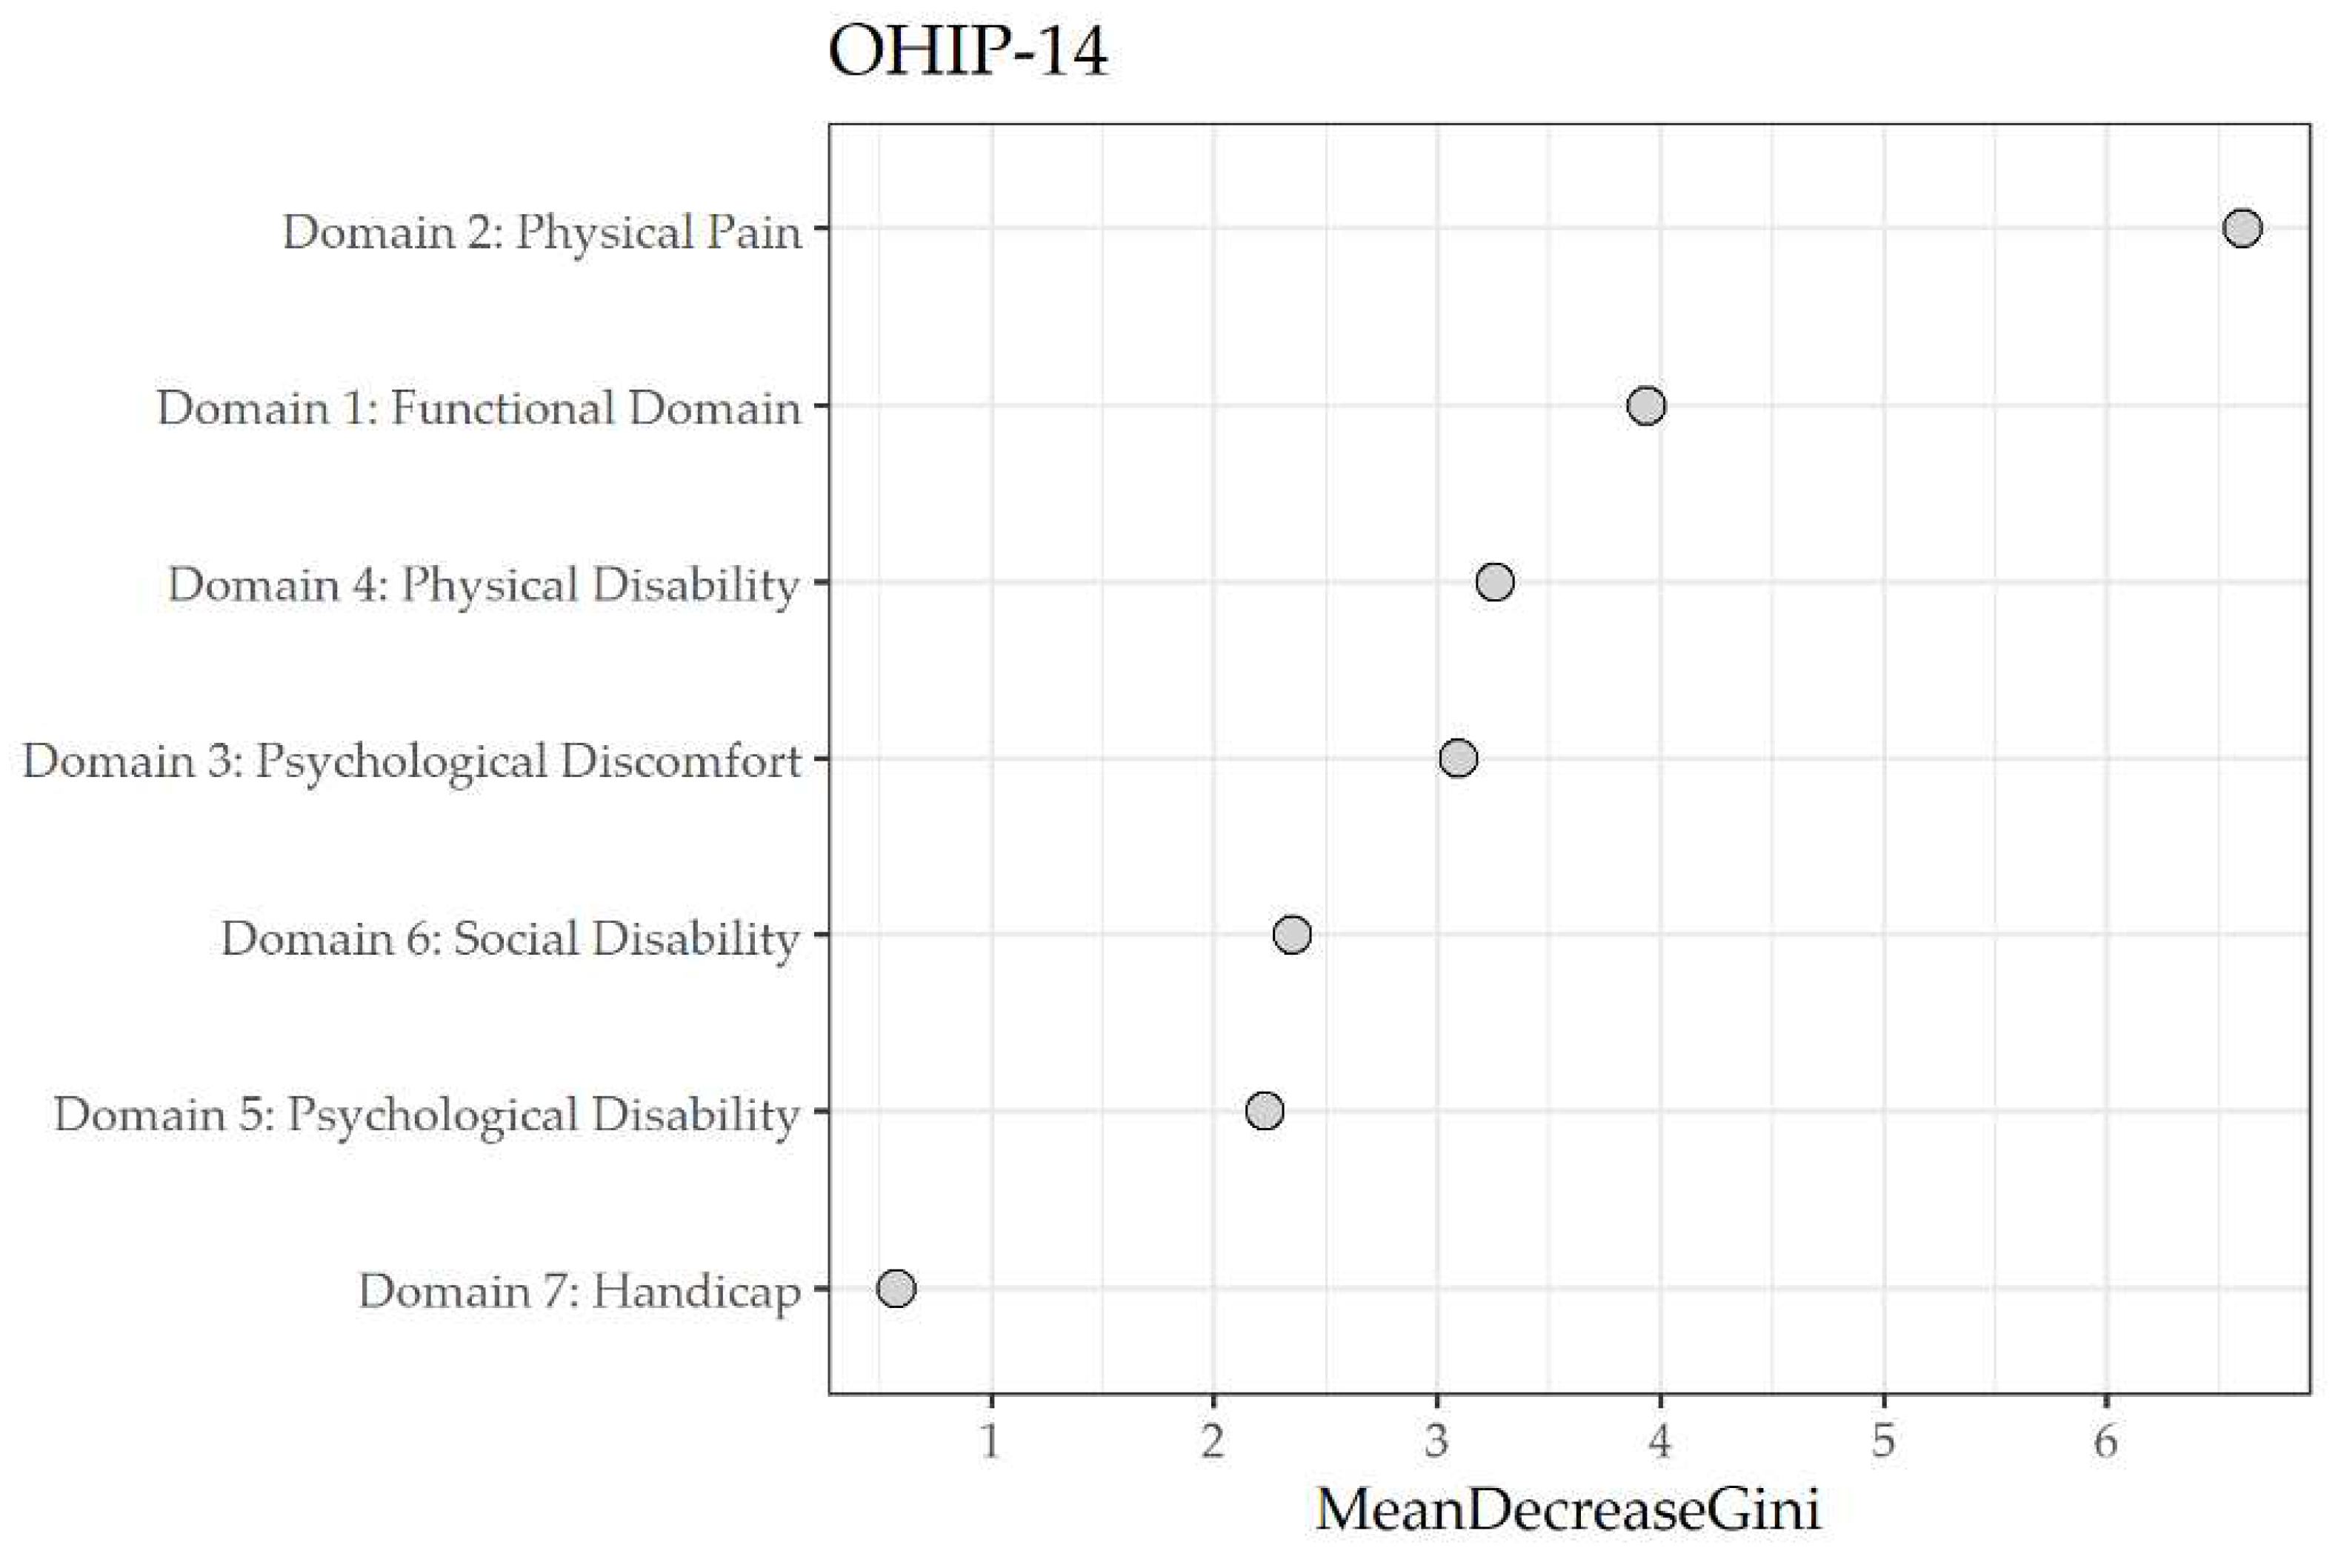

Table 1.
Sociodemographic, laboratory, and clinical variables of the whole sample according to the body mass index (BMI) status (ideal or unfavorable). The Salus in Apulia Study (N=216).
Table 1.
Sociodemographic, laboratory, and clinical variables of the whole sample according to the body mass index (BMI) status (ideal or unfavorable). The Salus in Apulia Study (N=216).
| Ideal BMI | Unfavorable BMI | ||||
|---|---|---|---|---|---|
| Mean ± SD |
median (min to max) |
Mean ± SD |
Median (min to max) |
p§ | |
| Sociodemographic Assessment | |||||
| Proportion (%) | 152 (70.40) | 64 (29.60) | |||
| Age (years) | 71.95 ± 5.39 | 70 (65 to 87) | 70.12 ± 4.05 | 70 (65 to 82) | 0.03 |
| Sex | |||||
| Male | 72 (47.40) | 36 (56.20) | 0.23 c2 | ||
| Female | 80 (52.60) | 28 (43.80) | |||
| BMI (Kg/m2) | 25.96 ± 2.84 | 26.42 (18.96 to 29.9) | 33.7 ± 4.23 | 32.77 (17.38 to 47.69) | <0.01 |
| Education (years) | 7.39 ± 3.47 | 7 (0 to 18) | 6.84 ± 3.38 | 5 (2 to 16) | 0.21 |
| Nutritional Assessment | |||||
| Lipids Consumption (g/die) | 86.80 ± 52.00 | 78.60 (28.40 to 531) | 85.40 ± 65.10 | 74.00 (33.20 to 501) | 0.32 |
| Carbohydrates consumption (g/week) | 471.00 ± 227.00 | 449 (21.90 to 1382) | 467.0 ± 342 | 402 (52.70 to 2344) | 0.33 |
| Protein Consumption (g/die) | 62.10 ± 24.10 | 59.50 (4.63 to 138) | 86.10 ± 118.00 | 70.50 (33.20 to 887) | 0.11 |
| Alcohol consumption (g/die) | 13.70 ± 18.70 | 10.40 (0 to 105) | 16.30 ± 23.10 | 10.40 (0 to 81.10) | 0.91 |
| Metabolic Biomarkers | |||||
| DBP (mmHg) | 77.60 ± 6.54 | 80 (60 to 90) | 81.40 ± 7.42 | 80 (60 to 100) | <0.01 |
| SBP (mmHg) | 130.00 ± 12.4 | 130.00 (100 to 160) | 136.00 ± 15.4 | 140 (100 to 170) | <0.01 |
| FBG (mg/dl) | 98.41 ± 15.46 | 96 (70 to 166) | 114.77 ± 33.96 | 105.5 (73 to 260) | <0.01 |
| HbA1c (mmol/mol) | 37.95 ± 7.38 | 37 (23 to 79) | 42.62 ± 12.33 | 40.5 (28 to 101) | <0.01 |
| Total Cholesterol (mg/dl) | 183.33 ± 36.59 | 180.5 (96 to 287) | 182.22 ± 35.26 | 185 (76 to 248) | 0.83* |
| HDL Cholesterol (mg/dl) | 49.34 ± 13.16 | 46.5 (28 to 91) | 45.61 ± 10.71 | 45 (27 to 74) | 0.10 |
| LDL Cholesterol (mg/dl) | 113.01 ± 30.45 | 111 (36 to 217) | 113.7 ± 26.81 | 113.5 (55 to 182) | 0.87* |
| Triglycerides (mg/dl) | 99.03 ± 44.7 | 92 (28 to 344) | 113.78 ± 50.55 | 108 (39 to 261) | 0.05 |
| Hemoglobin (g/dl) | 13.88 ± 1.3 | 13.9 (10.3 to 16.9) | 13.94 ± 1.25 | 13.7 (11.4 to 16.5) | 0.87 |
| RBC (106 cells/mm3) | 5.01 ± 2.96 | 4.75 (3.58 to 40.8) | 4.79 ± 0.47 | 4.76 (3.95 to 6.01) | 0.88 |
| WBC (103 cells/mm3) | 6.1 ± 1.75 | 5.9 (2.6 to 10.7) | 5.97 ± 1.5 | 5.9 (3.06 to 9.4) | 0.77 |
| Platelets (103 cells/mm3) | 224.74 ± 54.74 | 219.5 (114 to 459) | 231.78 ± 60.75 | 234.5 (110 to 452) | 0.24 |
| OHIP-14 questionnaire | |||||
| Q1 Difficult pronounce words | 0.10 ± 0.44 | 0 (0 to 3) | 0.13 ± 0.50 | 0 (0 to 2) | 0.72 |
| Q2 Worsened taste | 0.24 ± 0.70 | 0 (0 to 4) | 0.31 ± 0.82 | 0 (0 to 3) | 0.75 |
| Q3 Pain | 1.14 ± 1.12 | 2 (0 to 4) | 1.34 ± 1.13 | 2 (0 to 3) | 0.20 |
| Q4 Uncomfortable to eat | 1.02 ± 1.30 | 0 (0 to 4) | 1.50 ± 1.35 | 2 (0 to 4) | 0.01 |
| Q5 Concern for the mouth | 0.16 ± 0.60 | 0 (0 to 3) | 0.31 ± 0.88 | 0 (0 to 4) | 0.18 |
| Q6 Self-consciousness due to oral problems | 0.26 ± 0.69 | 0 (0 to 3) | 0.31 ± 0.84 | 0 (0 to 4) | 0.96 |
| Q7 Diet unsatisfactory | 0.12 ± 0.56 | 0 (0 to 4) | 0.21 ± 0.68 | 0 (0 to 3) | 0.24 |
| Q8 Interrupted meals | 0.11 ± 0.43 | 0 (0 to 2) | 0.21 ± 0.68 | 0 (0 to 3) | 0.30 |
| Q9 Difficult to relax due to oral problems | 0.17 ± 0.55 | 0 (0 to 3) | 0.11 ± 0.48 | 0 (0 to 3) | 0.42 |
| Q10 Embarrassment due to oral problems | 0.11 ± 0.52 | 0 (0 to 3) | 0.20 ± 0.70 | 0 (0 to 4) | 0.31 |
| Q11 Irritability | 0.01 ± 0.16 | 0 (0 to 2) | 0.13 ± 0.53 | 0 (0 to 3) | 0.01 |
| Q12 Difficult to do jobs due to oral problems | 0.01 ± 0.16 | 0 (0 to 2) | 0.08 ± 0.45 | 0 (0 to 3) | 0.14 |
| Q13 Life less satisfying due to oral problems | 0.01 ± 0.08 | 0 (0 to 1) | 0.06 ± 0.08 | 0 (0 to 3) | 0.14 |
| Q14 Totally unable to function | 0.00 ± 0.00 | 0 (0 to 0) | 0.03 ± 0.25 | 0 (0 to 2) | 0.11 |
| OHIP-14 Total score | 3.46 ± 3.75 | 2.5 (0 to 25) | 5 ± 5.67 | 4 (0 to 37) | 0.03 |
All data are shown as mean ± standard deviation (SD), median (min to max) for continuous variables and n (%) for proportions. §Mann Whitney U test where not otherwise specified, *Independent samples t test, χ2 Chi squared test. DBP: diastolic blood pressure; SBP: systolic blood pressure; FBG: fasting blood glucose; HbA1c: glycated hemoglobin; HDL: high-density lipoprotein; LDL: low-density lipoprotein; RBC: red blood cells, WBC: white blood cells, OHIP-14: Oral Health Impact Profile-14
Table 2.
Hierarchical logistic regression models on the body mass index (BMI) status (ideal/ unfavorable) as dependent variables and the Oral Health Impact Profile-14 (OHIP-14) total score as regressor. The Salus in Apulia Study (N=216).
Table 2.
Hierarchical logistic regression models on the body mass index (BMI) status (ideal/ unfavorable) as dependent variables and the Oral Health Impact Profile-14 (OHIP-14) total score as regressor. The Salus in Apulia Study (N=216).
| OR | 95% CI | p value | |
|---|---|---|---|
| Model 1 | |||
| OHIP-14 total score | 1.08 | 1.01 to 1.15 | 0.03 |
| Model 2 | |||
| OHIP-14 total score | 1.10 | 1.01 to 1.22 | 0.04 |
| Age (years) | 0.89 | 0.82 to 0.97 | <0.01 |
| Sex (Female) | 0.48 | 0.21 to 1.11 | 0.08 |
| Education (years) | 0.91 | 0.81 to 1.02 | 0.11 |
| Carbohydrates consumption (g/week) | 1.10 | 0.95 to 1.10 | 0.39 |
| Alcohol consumption (g/day) | 1.00 | 0.98 to 1.02 | 0.80 |
OR: odds ratio; CI: confidence interval.
Table 3.
Random forest regression model of importance of the domains/sub-scales of the Oral Health Impact Profile-14 (OHIP-14) with ideal body mass index (BMI) status as output. The Salus in Apulia Study (N=216).
Table 3.
Random forest regression model of importance of the domains/sub-scales of the Oral Health Impact Profile-14 (OHIP-14) with ideal body mass index (BMI) status as output. The Salus in Apulia Study (N=216).
| Domain | Mean decrease Gini |
|---|---|
| 2 Physical pain | 6.63 |
| 1 Functional limitation | 3.54 |
| 3 Psychological discomfort | 3.15 |
| 4 Physical disability | 3.04 |
| 6 Social disability | 2.54 |
| 5 Psychological disability | 2.28 |
| 7 Handicap | 0.5 |
Domain 1 (Functional limitation): Q1(Difficult pronounce words) plus (Q2: Worsened taste);Domain 2 (Physical pain): Q3 (Pain) plus Q4 (Uncomfortable to eat);Domain 3 (Psychological discomfort): Q5 (Concern for the mouth) plus Q6 (Self-consciousness due to oral problems);Domain 4 (Physical disability): Q7 (Diet unsatisfactory) plus Q8 (Interrupted meals);Domain 5 (Psychological disability): Q9 (Difficult to relax due to oral problems) plus Q10 (Embarrassment due to oral problems);Domain 6 (Social disability): Q11 (Irritability) plus Q12 (Difficult to do jobs due to oral problems);Domain 7 (Handicap): Q13 (Life less satisfying due to oral problems) to Q14 (Totally unable to function).
Disclaimer/Publisher’s Note: The statements, opinions and data contained in all publications are solely those of the individual author(s) and contributor(s) and not of MDPI and/or the editor(s). MDPI and/or the editor(s) disclaim responsibility for any injury to people or property resulting from any ideas, methods, instructions or products referred to in the content. |
© 2023 by the authors. Licensee MDPI, Basel, Switzerland. This article is an open access article distributed under the terms and conditions of the Creative Commons Attribution (CC BY) license (https://creativecommons.org/licenses/by/4.0/).
Copyright: This open access article is published under a Creative Commons CC BY 4.0 license, which permit the free download, distribution, and reuse, provided that the author and preprint are cited in any reuse.


