Submitted:
10 August 2023
Posted:
11 August 2023
Read the latest preprint version here
Abstract
The marine lysozyme fermentation process is a highly nonlinear, multi-stage, strongly time-varying system, making it hard to ensure model stability and prediction accuracy in the global scope by a conventional single global soft sensor model. To effectively solve the above problem, this study innovatively proposed a soft sensor modeling method based on an improved seagull optimization algorithm (ISOA) combined with Gaussian process regression (GPR) weighted ensemble learning. First, the sample data set is divided into multiple local sample subsets by the improved density peak clustering algorithm (ADPC). Second, the Gaussian process regression model is optimally altered with an improved seagull optimization algorithm for the purpose of establishing the corresponding sub-prediction model. Finally, the prediction model's fusion strategy is ultimately determined depending on the degree of connection between the test samples and a subset of local pieces. Simulation results show that the proposed soft sensor model can predict the key biochemical parameters of the marine lysozyme fermentation process well with less prediction error through fewer training data, which can be extended to soft sensor modeling of general nonlinear systems.
Keywords:
marine lysozyme
; seagull optimization algorithm
; Gaussian process regression
; soft sensor
; gray correlation analysis
Introduction
Marine lysozyme (ML) has the characteristics of a low action temperature, a wide pH range, vigorous activity at room temperature, and a moderate reduction in activity as temperature decreases [1,2]. It gives new energy and chances to cleaning, medicine, environmental protection, and food processing sectors [3,4]. To take full advantage of the unique enzymatic properties of marine lysozyme and maximize production efficiency and product quality, it is necessary to have dynamic regulation and real-time optimization of the marine lysozyme fermentation process. However, the fermentation of marine lysozyme is a multivariate, time-varying, and complex nonlinear process. Key biochemical parameters that directly reflect the quality of the fermentation process, such as cell concentration, substrate concentration, and relative enzyme activity, can only be roughly estimated through offline sampling and analysis due to practical process technology and cost considerations. This procedure not only delays the collection of information, affecting the operator's ability to make accurate decisions about the real-time response status, but it also limits the implementation of the best control methods. Therefore, it is urgently to find a method to achieve real-time and accurate prediction of key biochemical parameters in marine lysozyme fermentation process.
Soft sensor technology is an effective way to solve the above problems [5,6,7,8,9]. Among them, Gaussian process regression is an innovative methodology that has emerged in recent years. It shows excellent adaptability and generalization ability in solving small sample, serious dimensional, complex nonlinear regression problems [10,11,12,13].Currently, most of the soft sensor models constructed by Gaussian process regression method are single global soft sensor models. Although they can fulfill the basic requirements of online prediction of key biochemical parameters, they do not take into account the nonlinear, multivariate, time-varying, and multi-stage characteristics of the biological fermentation process, making the global soft sensor model challenging to describe the multi-stage characteristics of the fermentation process and cannot guarantee prediction accuracy in the global scope.
Based on this analysis, this paper proposes a soft sensor method based on the improved seagull optimization algorithm combined with Gaussian process regression (ISOA-GPR) weighted integration to demonstrate individual differences between local models. First, a subset of local samples is divided and trained using an improved density peak clustering algorithm (ADPC) to generate the ISOA-GPR local prediction submodel. Then, we extract the center of mass of each local sample subset using the enhanced grey correlation algorithm and weight the information entropy to derive a weighted "center of mass" that more accurately represents the subset's characteristics. Ultimately, the integration strategy for enhancing the weighting of the grey correlation algorithm is proposed by selecting the local submodels with a higher degree of association with the test samples. The simulation results show that the proposed method has less prediction error and reduced volatility compared to the single global soft sensor model based on ISOA-GPR.
Theoretical Analysis
2.1. Data subsets Construction Strategy
Using the distribution of marine lysozyme fermentation process data, we propose an improved density peak clustering algorithm (ADPC) that evaluates the similarity between data in terms of the proximity between data samples. Density peak clustering (DPC) is a typical methodology founded on density clustering [14]. The cluster center is assumed to have a more significant local density and a greater relative distance from other cluster centers than other data points. The algorithm also requires that each data point relied on for classification has two feature values, local density and relative distance .
For the sample set , the local density of data is
Where is the distance between data and , and is the truncation distance.
This research employs a declining trend inscription adaptive cluster center acquisition approach to increase cluster center selection accuracy. Because the DPC algorithm's clustering center has a higher local density and relative distance than other data points, the logarithmic function was picked to accentuate the disparity between the clustering center and other data points. After arranging the acquired choice parameters in descending order, the declining trend of values is determined as .
Define a decision parameter that combines local density and relative distance:
Where represents the current value and represent the values at the preceding and subsequent times, respectively.
2.2. Sub-Model Construction
The real marine lysozyme fermentation process exhibits apparent non-linear properties, a tiny data sample size, and challenging offline extraction. The Gaussian process regression method was chosen to establish a sub-prediction model for marine lysozyme fermentation in this paper [15]. For Gaussian process regression models, the choice of hyperparameters substantially affects the prediction model's precision. Traditional parameter selection methods rely heavily on experience and trial and error; regression accuracy and calculation speed are not guaranteed. In order to generate a sub-model with a better prediction effect, this paper uses the Improved Seagull Optimization Algorithm (ISOA) for online optimization and adjustment of hyperparameters.
2.3. Improved Seagull Optimization Algorithm
The seagull optimization algorithm (SOA) is an intelligent algorithm that simulates individual seagull flocks in nature and seeks to perform iterative optimization search in the solution space by employing the long-distance migration and spiral attack behavior of individual seagulls with the change of seasons [16].
In the conventional seagull optimization algorithm, the inertia weight decreases linearly as the number of iterations increases. Even though the repetition speed is faster, it is easy to cause the population variety to fall with each iteration. There is also a problem with weak global search ability in the early stage and poor local mining ability in the later stage. So this paper proposes a non-linear change in the inertia weight updating strategy. The specific expression is as follows:
Where is the current number of iterations, is the maximum number of iterations, and is a constant whose initial value is set to 2.
In the early iterations of the improved seagull optimization algorithm, the inertia weight decreases abruptly to maintain population diversity while enhancing its global search capability; in the later stages of execution, the inertia weight decreases gradually to increase the local search capability while ensuring that the algorithm is not easily trapped in a local optimum. Therefore, the optimal adjustment for the hyperparameters with the improved seagull optimization algorithm will undoubtedly result in a more accurate soft sensor model.
2.4. Submodel Selection and Fusion Strategy
This paper finds the weighted "center of mass" that best represents the whole data subset and describes the relationship between the sub-model and the test sample by the degree of association between and the test sample so that the right sub-model can be selected for integration weighting. The correlation coefficient between the test sequences and the weighted "center of mass" of the local subset was analyzed using an improved gray correlation algorithm that more accurately reflects the fluctuation between the marine lysozyme fermentation data sequences to determine their degree of correlation. Given a sample subset of marine lysozyme fermentation process data , where is the number of samples in each subgroup and is the feature variable's dimensionality. Let the reference sequence be and calculate the gray correlation coefficient:
Where indicates the resolution coefficient, which is taken as 0.5.
The correlation between the reference and comparison sequences is calculated as follows:
So that each sample of the local sample subset is used as a reference sequence and the remaining samples are comparison sequences, the correlation matrix of the generated samples is calculated as follows:
The sample with the strongest correlation with all subsets is picked as the data set's initial center of mass, and its correlation coefficients with other samples in that subset are reported to generate the correlation coefficient matrix:
In this paper, we present information entropy weighting to characterize the degree of variation for each feature variable under the correlation coefficient matrix, assign objective weights to the feature variables, and derive an objective subset of the "center of mass." In general, the lower a feature variable's information entropy, the larger its degree of variation and the higher its given weight. Conversely, when information entropy increases, the relevance of feature variables decreases, and weights decrease. The characteristic weight of the nd characteristic variable of the th sample is calculated as:
Entropy value of the characteristic variable:
Then, the weights of each characteristic variable are in the correlation system matrix.
The previous computation produces the weighted center-of-mass of the m sample subsets of the fermentation process, assuming that the enhanced density peak clustering approach correctly collects m local sample subsets. We obtained the correlation set using the fermentation test sample as the reference sequence and the m subsets of "center of mass" as the comparison sequence. We kept the ISOA-GPR sub-model corresponding to a correlation degree greater than or equal ω*. Its corresponding fermentation process sub-model prediction result is , so the final prediction result of gray correlation weighted integration is:
Modeling Process
Figure 3 depicts the specific flow of soft sensor modeling for marine lysozyme fermentation process. The procedure of modeling is described as follows:
Step1: Obtain data on marine lysozyme fermentation process through experiments, including major environmental parameters and key biochemical parameters(bacteriophage concentration, substrate concentration, relative enzyme activity). The upgraded density peak clustering technique is utilized to define local sample subsets ()as well as to calculate the weighted center of mass () for each local sample subset.
Step 2: Calculate the consistent correlations degree between various enviornmental parameters and key biochemical parameters,and select environmental parameters with correlations greater than 0.7 as auxiliary variables. Building a GPR sub-model for ISOA optimization.
Step 3: Send the measured data () to be bested, caluculate its gray correlation () with each weighted "center of mass", and select the ISOA-GPR model () as a submodel. Determine the output weights of each sub-model and output predictions according to equation (12).
Example Simulation
In this study, simulations are done utilizing marine lysozyme fermentation process data to demonstrate the efficiency of the proposed online soft sensor modeling method. The culture strain was S-12-86, and the fermenter model was A103-500L. The Yellow Sea Fisheries Research Institute of the Chinese Academy of Fisheries Sciences gave the marine lysozyme fermentation method, and the Jiangsu University fermentation control system platform provided the navigational lysozyme fermentation data.
With bacterium concentration (X), substrate concentration (S), and relative enzyme activity (P) as the most critical variables for marine lysozyme fermentation, we used the consistent correlation method to filter the auxiliary variables and took data from a total of 15 fermentation batches. The first 12 batches, which included 720 total data points, served as training samples, while the final three batches, which had 180 total data points, served as test samples. These measurements were utilized for training simulations based on a single global ISOA-GPR model and an ISOA-GPR-weighted ensemble soft sensor model. The simulation results are depicted in Figure 4, Figure 5, Figure 6, Figure 7, Figure 8 and Figure 9. To show that the ISOA-GPR weighted ensemble soft sensor model performs better, root mean square and maximum absolute errors compare how well the two models can predict. Table 1 displays the results.
Where represents the values of all actual key biological parameters (bacterial concentration, substrate concentration, and relative enzyme activity) for the tested samples and represents the values of all predicted key biological parameters (bacterial concentration, substrate concentration, and relative enzyme activity) for the tested samples.
The above results make it clear that the Gaussian process regression model can predict the key biochemical parameters of marine lysozyme with fewer sample data. The suggested technique in this research has a narrower range of overall error volatility in prediction results than a single global ISOA-GPR-based soft sensor modeling approach, which can better monitor the actual values of key biochemical parameters. Using bacteriophage concentration as an example, the maximum absolute error of a single global ISOA-GPR soft sensor modeling is 1.2. In contrast, the maximum absolute error of ISOA-GPR weighted ensemble soft sensor modeling is only 0.5333. The root means square error of both is 0.8153 and 0.2561, respectively, implying that soft sensor modeling based on ISOA-GPR weighted integration has better prediction and approximation accuracy.
Conclusions
The fundamental biological characteristics of marine lysozyme fermentation process are challenging to assess online and in real-time. To handle the problem that a single global model method is less reliable and does not guarantee global forecast accuracy. We present an ISOA-GPR-weighted ensemble soft sensor modeling approach in this research. First, the fermentation process data are adaptively partitioned on the improved density peak clustering algorithm. Then, a soft sensor sub-model of the fermentation process was created with an enhanced seagull optimization algorithm and the Gaussian process regression (ISOA-GPR) methodology. Finally, an improved grey correlation algorithm is employed to extract the subset's entropy-weighted "centre of mass" and filter the sub-model integration output. We use the developed soft sensor modeling approach to predict key parameters of marine lysozyme. The simulation data show that the root means square errors of the proposed method in marine lysozyme fermentation process are 0.5333, 0.8103, and 0.8439, respectively, which can achieve the prediction of bacteriophage concentration based on less training data, and the prediction errors are small enough to meet the demand for online measurement of key parameters of marine lysozyme.
References
- Lesnierowski, G., Yang, TY.(2021)Lysozyme and its modified forms: A critical appraisal of selected properties and potential. Trends in Food Science & Technology,107:333-342. [CrossRef]
- Li, LS., Cardoso, JCR., Felix, RC., Mateus, AP., Canario, AVM., Power, DM.(2021) Fish lysozyme gene family evolution and divergent function in early development. Developmental & Comparative Immunology,114:69-75. [CrossRef]
- Wu, TT., Jiang, QQ., Wu, D., Hu, YQ. Chen, SG., Ding, T., Ye, XQ., Liu, DH., Chen, JC. (2019) What is new in lysozyme research and its application in food industry? A review. Food Chemistry, 274:698-709. [CrossRef]
- Xiao, WH., Gu, N., Zhang, B., Liu, Y., Zhang, YH., Zhang, ZX., Qin, G., Liu, Q.(2023) Characterization and expression patterns of lysozymes reveal potential immune functions during male pregnancy of seahorse. Developmental & Comparative Immunology, 142,104654. [CrossRef]
- Sheng, XC., Xiong, WL.(2020) Soft sensor design based on phase partition ensemble of LSSVR models for nonlinear batch processes. Mathematical Biosciences and Engineering, 17: 1901-1921. [CrossRef]
- Wang, B., Yu, MF., Zhu, XL., Zhu, L.(2020) Soft - sensing modeling based on ABC - MLSSVM inversion for marine low - temperature alkaline protease MP fermentation process. BMC Biotechnology, 20:1-13. [CrossRef]
- Wang, P., Sun, QY., Qiao, YX., Liu, LL., Han, X., Chen, XG. (2022) Online prediction of total sugar content and optimal control of glucose feed rate during chlortetracycline fermentation based on soft sensor modeling. Mathematical Biosciences And Engineering,19:10687-10709. [CrossRef]
- Wang, JL., Qiu, KP., Guo, YQ., Wang, RT., Zhou, XJ. (2021) Soft sensor development based on improved just-in-time learning and relevant vector machine for batch processes. Canadian Journal of Chemical Engineering, 99:334-344. [CrossRef]
- Medl, M., Rajamanickam, V., Striedner, G., Newton, J. (2023) Development and Validation of an Artificial Neural-Network-Based Optical Density Soft Sensor for a High-Throughput Fermentation System. Processes, 11. [CrossRef]
- Pearce, R., Ireland, P., Romero, E. (2020) Thermal matching using Gaussian process regression. Proceedings of the Institution of Mechanical Engineers Part G-Journal of Aerospace Engineering, 234:1172-1180. [CrossRef]
- Mahmoodzadeh, A., Mohammadi, M., Abdulhamid, SN., Ali, HFH., Ibrahim, HH., Rashidi, S. (2022) Forecasting tunnel path geology using Gaussian process regression. Genmechanics and Engineering, 28:359-374. [CrossRef]
- Shi, XD., Kang, Q., Zhou, MC., Abusorrah, A., An, J. (2020) Soft Sensing of Nonlinear and Multimode Processes Based on Semi-Supervised Weighted Gaussian Regression.IEEE Sensors Journal,20:12950-12960. [CrossRef]
- Zadkarami, M., Ghanavati, AK., Safavi, AA. (2019) Soft Sensor Design for Distillation Columns Using Wavelets and Gaussian Process Regression. In: 6th International Conference on Control, Instrumentation and Automation (ICCIA). Univ Kurdistan, Sanandaj, IRAN.pp.254-259. http://www.scopus.com/inward/record.url?eid=2-s2.0-85083085562&partnerID=MN8TOARS.
- Zhao, J., Wang, G., Pan, JS., Fan, TH., Lee, IV. (2023) Density peaks clustering algorithm based on fuzzy and weighted shared neighbor for uneven density datasets. Pattern Recognition,139,109406. [CrossRef]
- Sun, N., Zhang, N., Zhang, S., Peng, T., Zhou, JZ., Zhang, HR. (2023) Monthly Runoff Prediction Model and Its Application Based on GPR with Physically Composite Kernel.Water Resources and Power,41:39-43. [CrossRef]
- Yang, S., Ye, P., Liu, LL., Wang, H., Sun, F. (2022) Research on Opimal Planning of Integrated Energy System Based on Seagull Algorithm. Journal of Shenyang Institute of Engineering(Natural Science), 18:62-69. [CrossRef]
Figure 1.
Distribution of decision parameter .
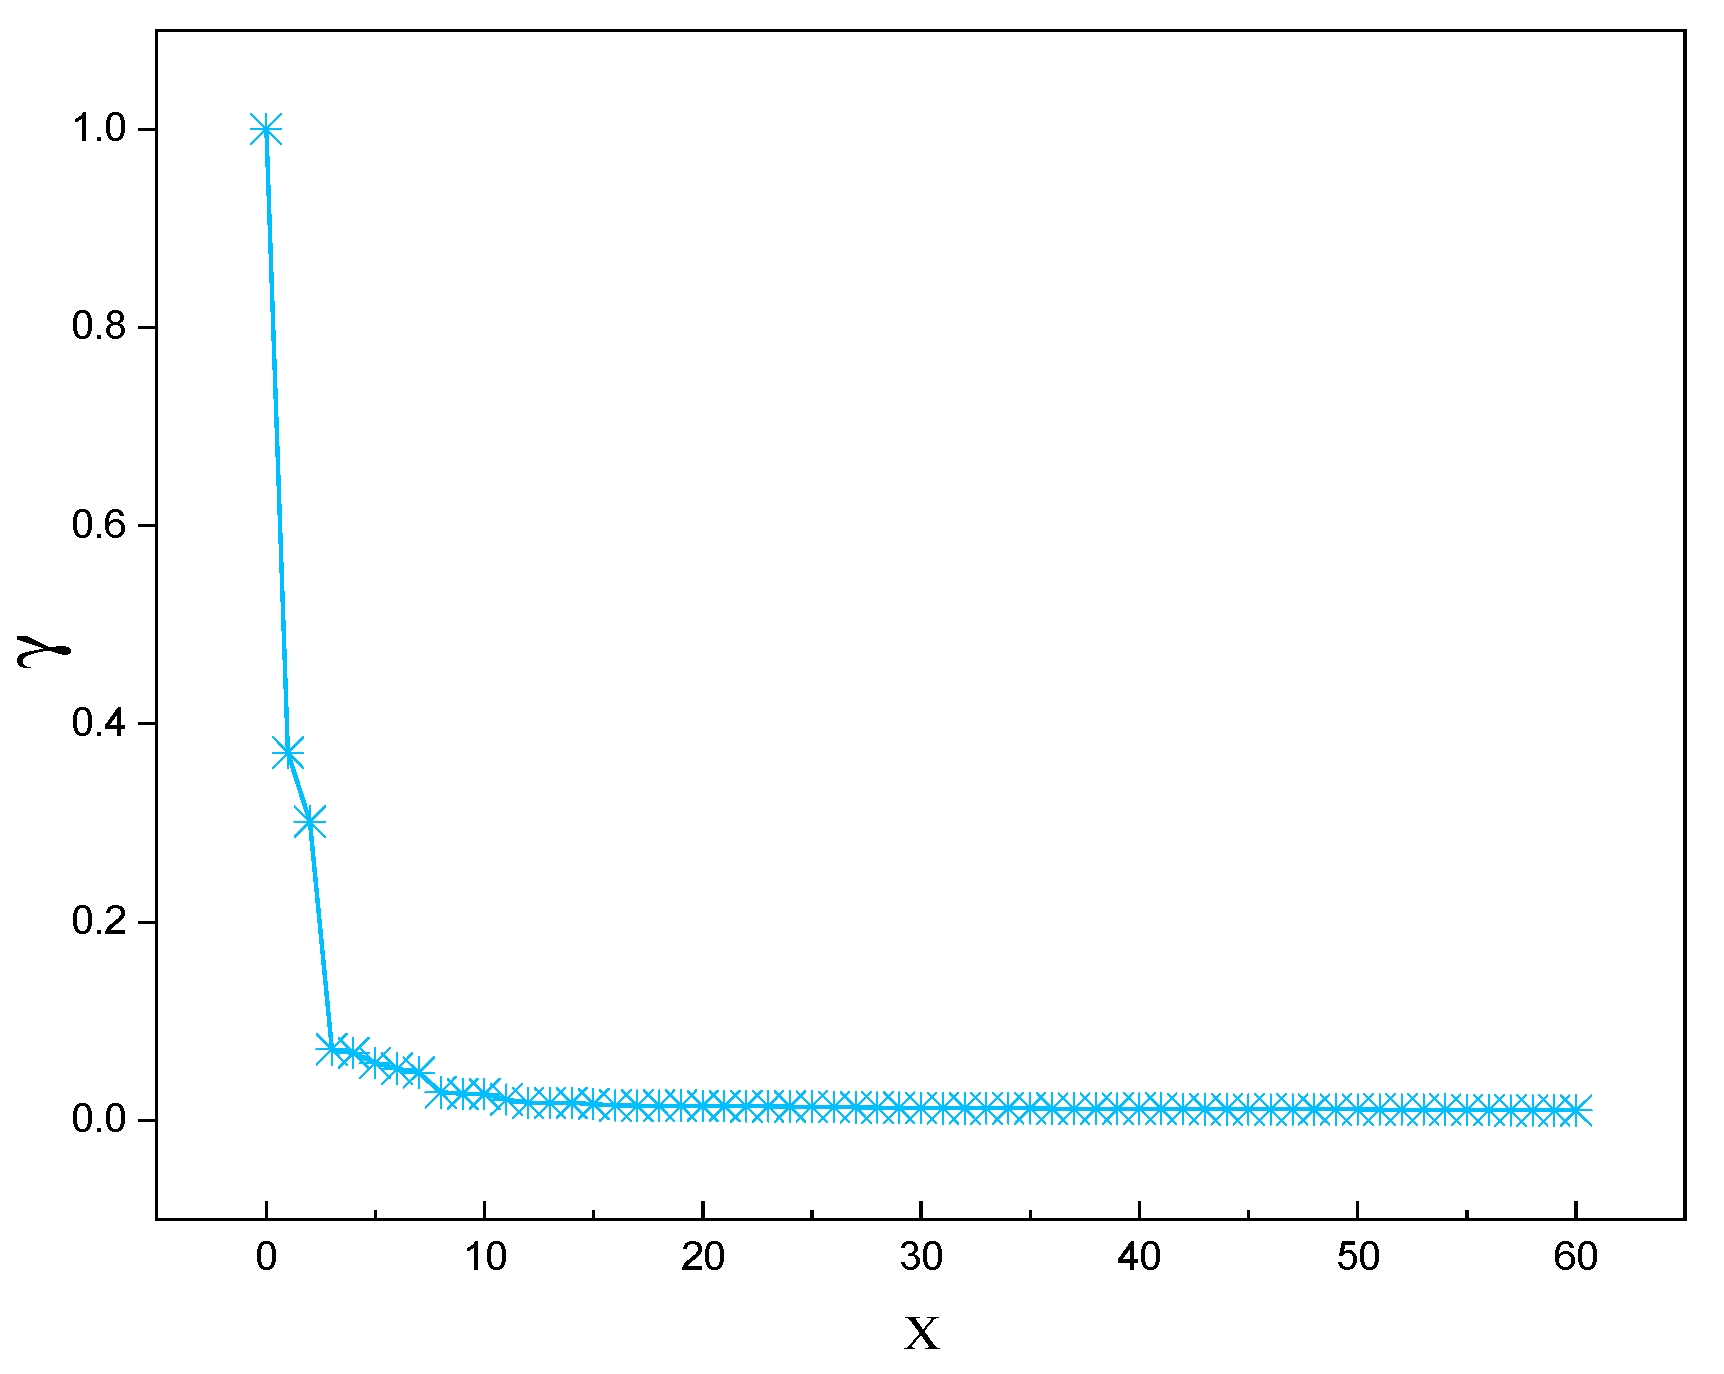
Figure 2.
Decision parameters Trend of drop.
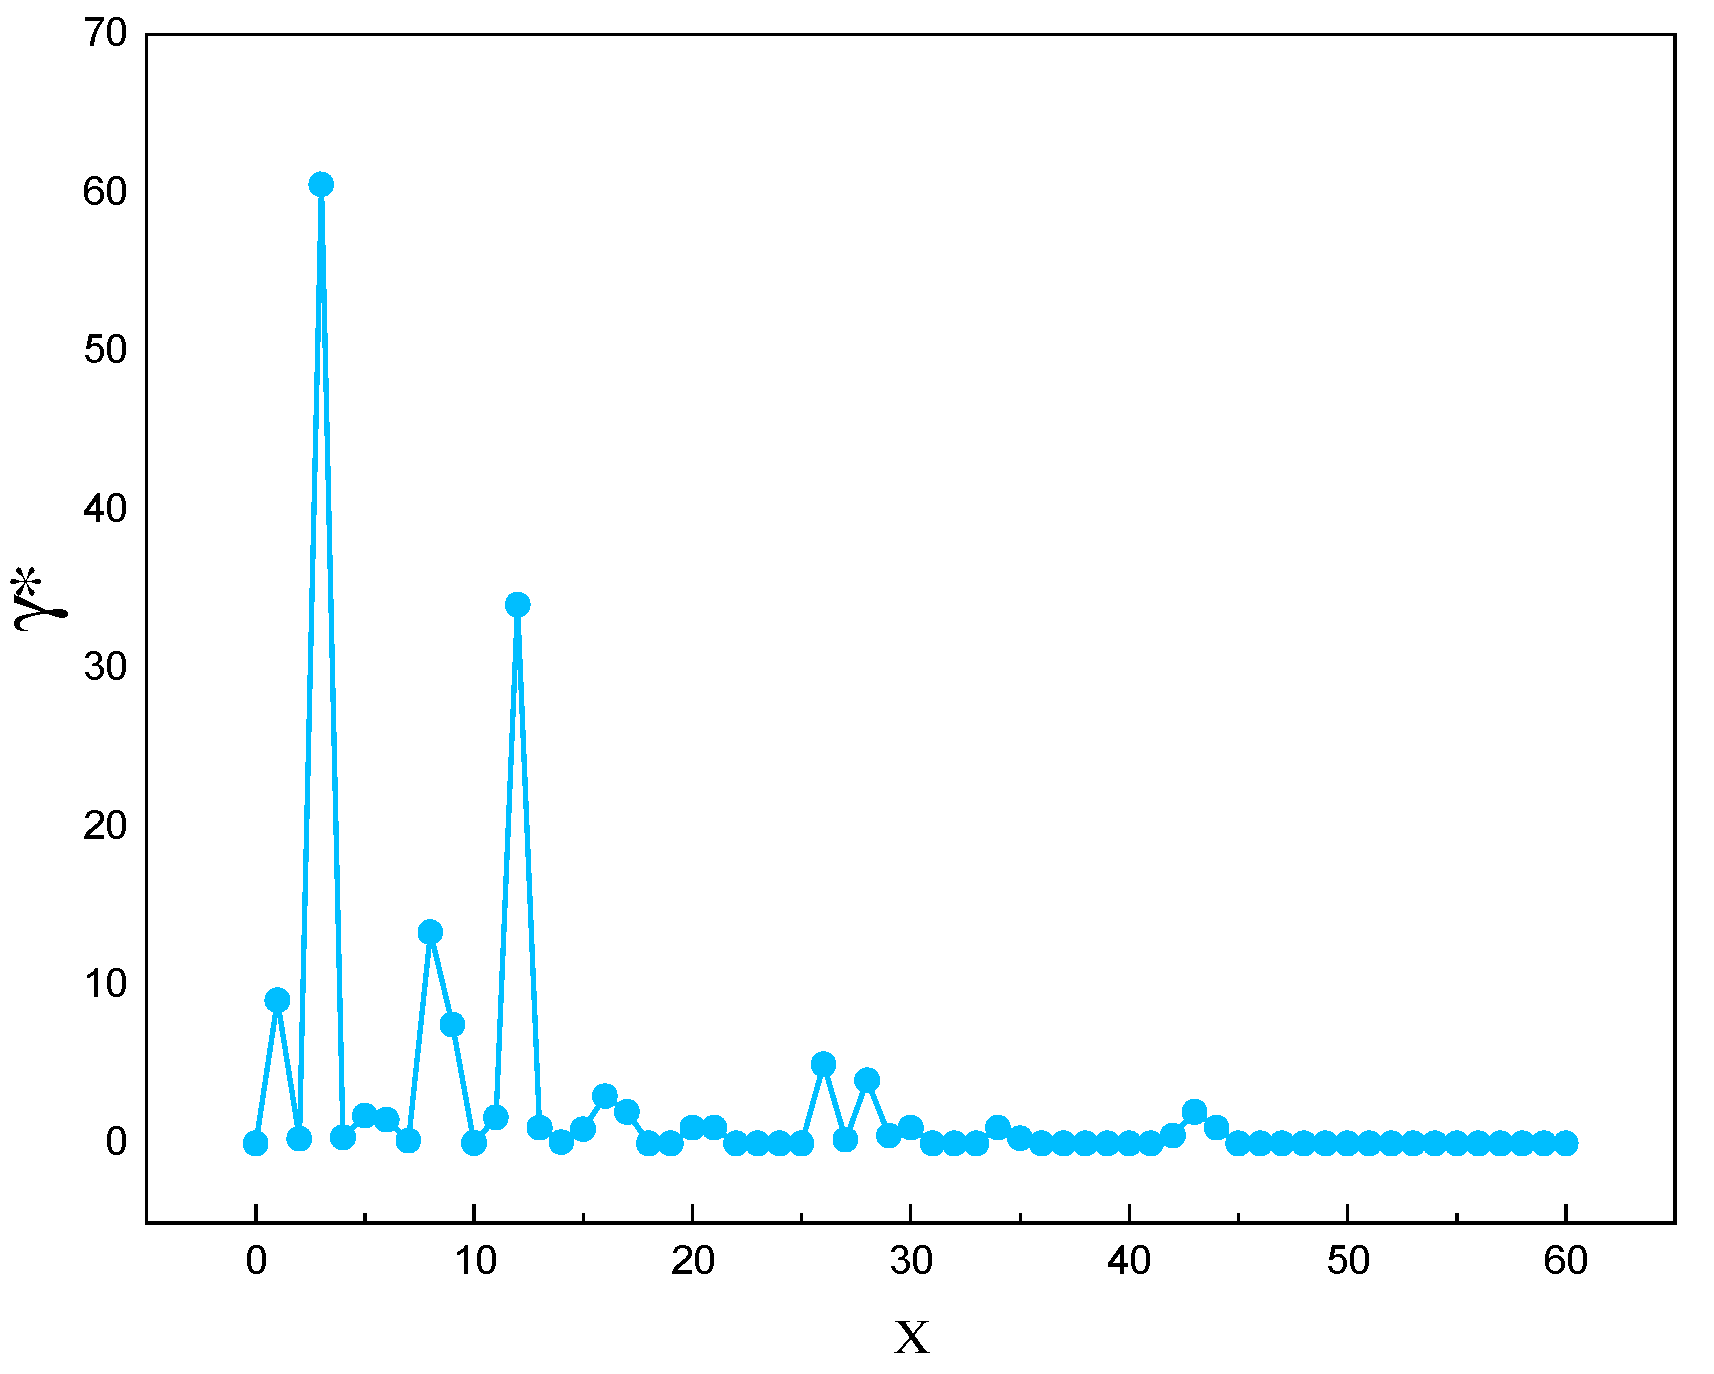
Figure 3.
Soft sensor modeling specific flow chart.
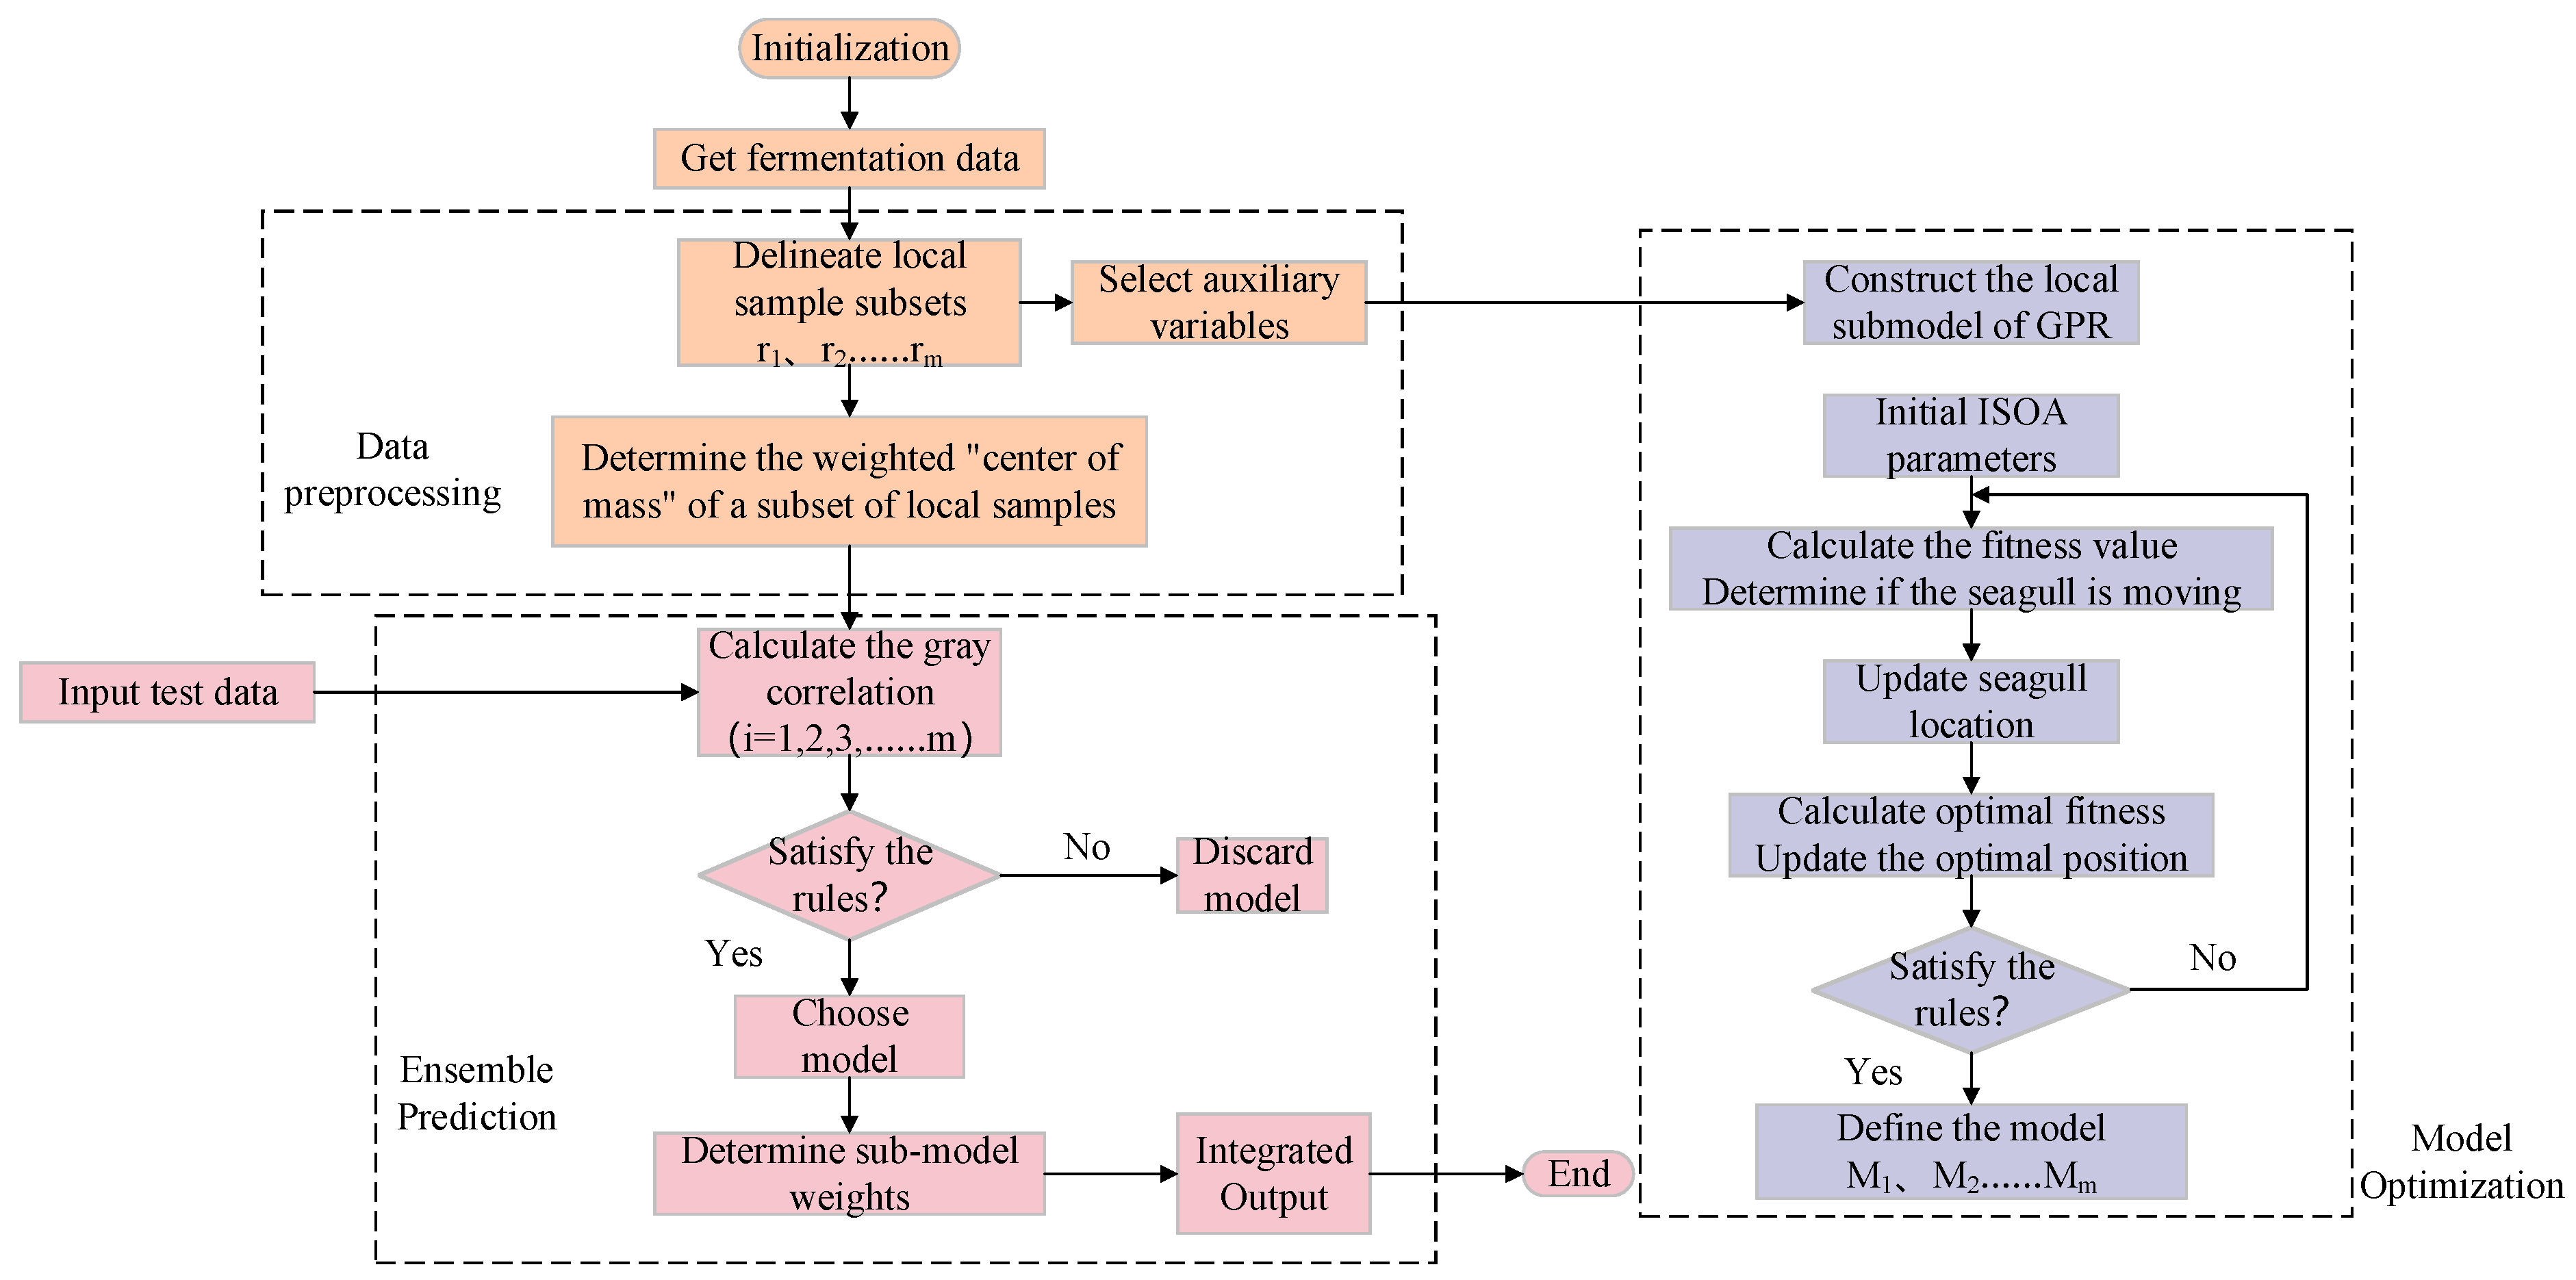
Figure 4.
Predicted curve of bacterium concentration.
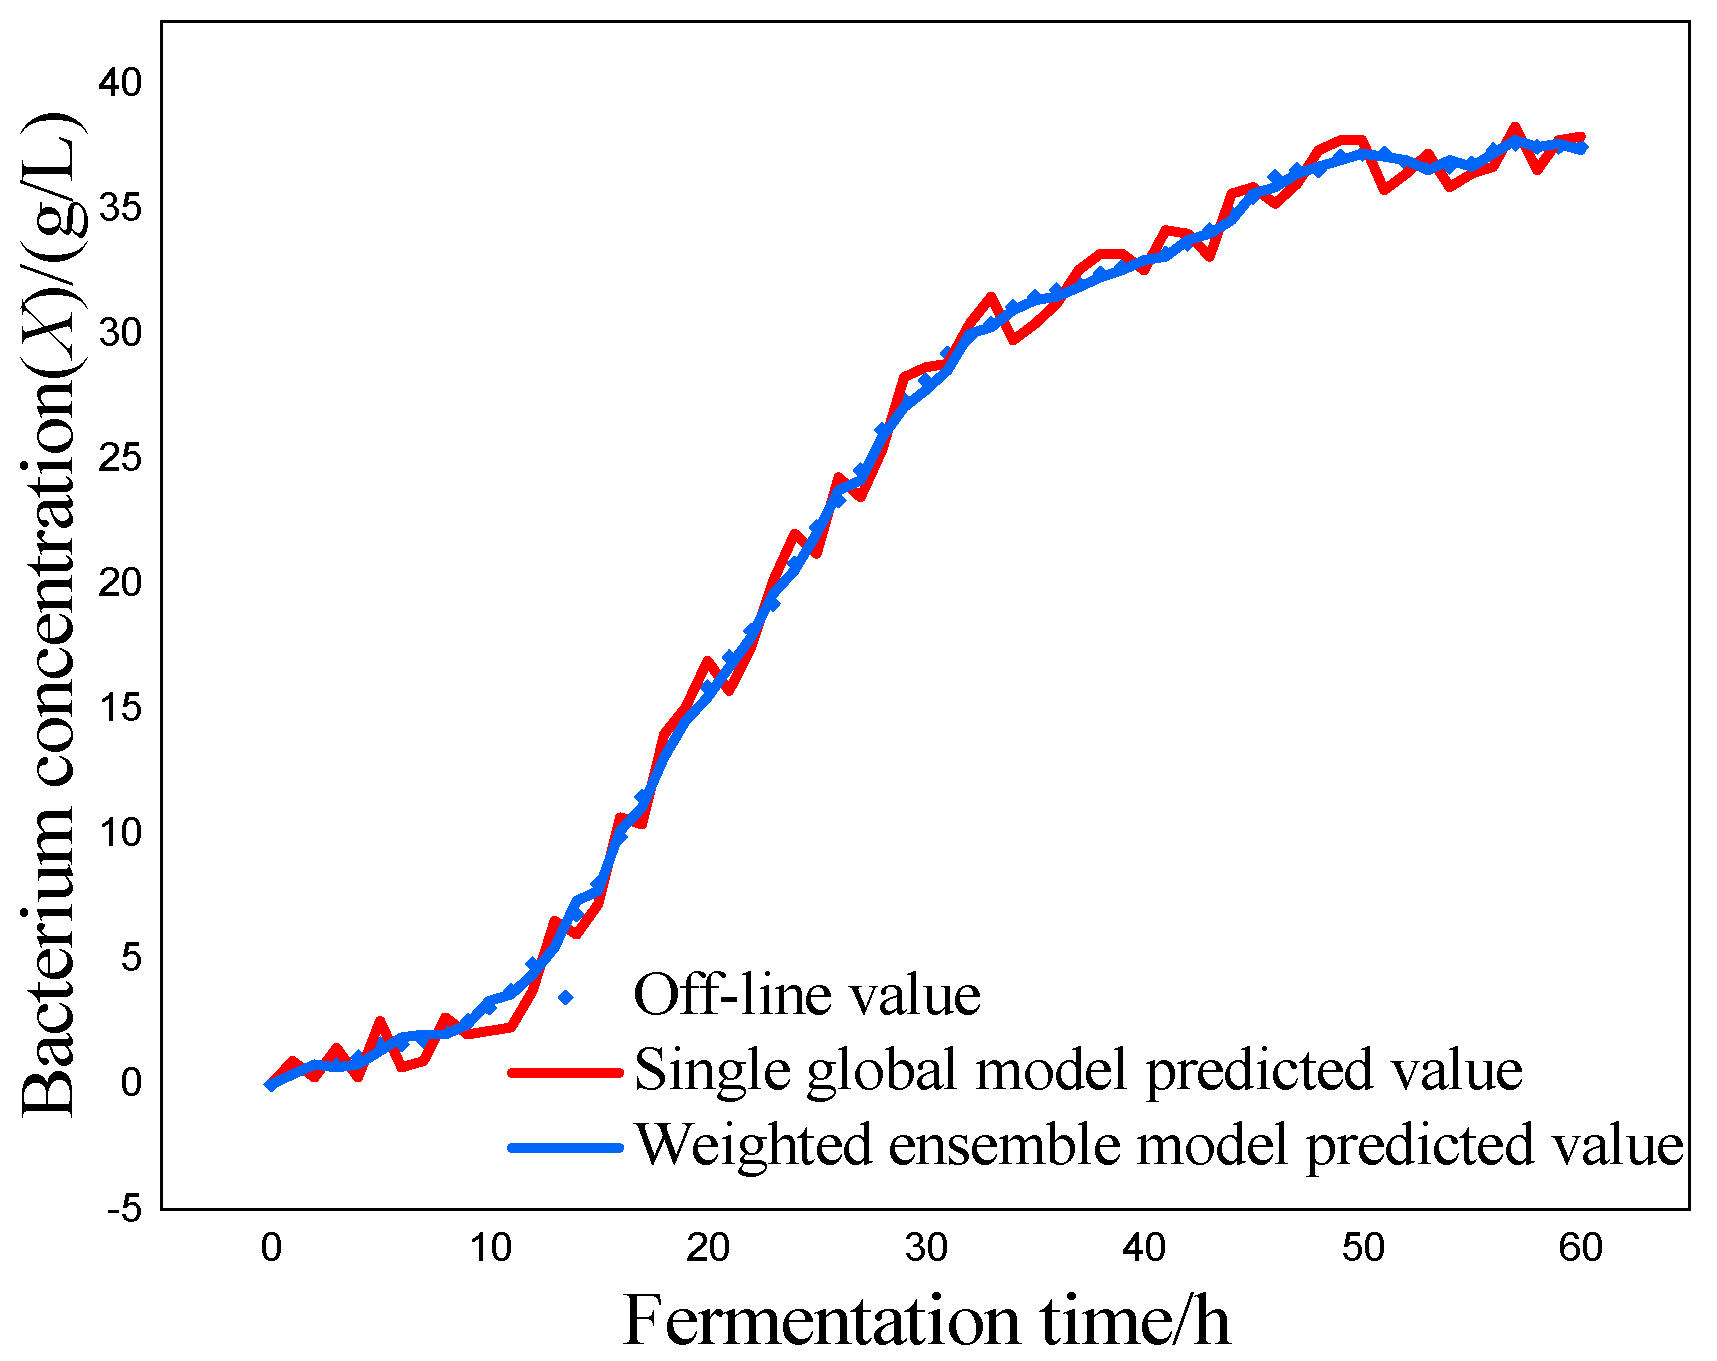
Figure 5.
Error variation curve of bacterium concentration.
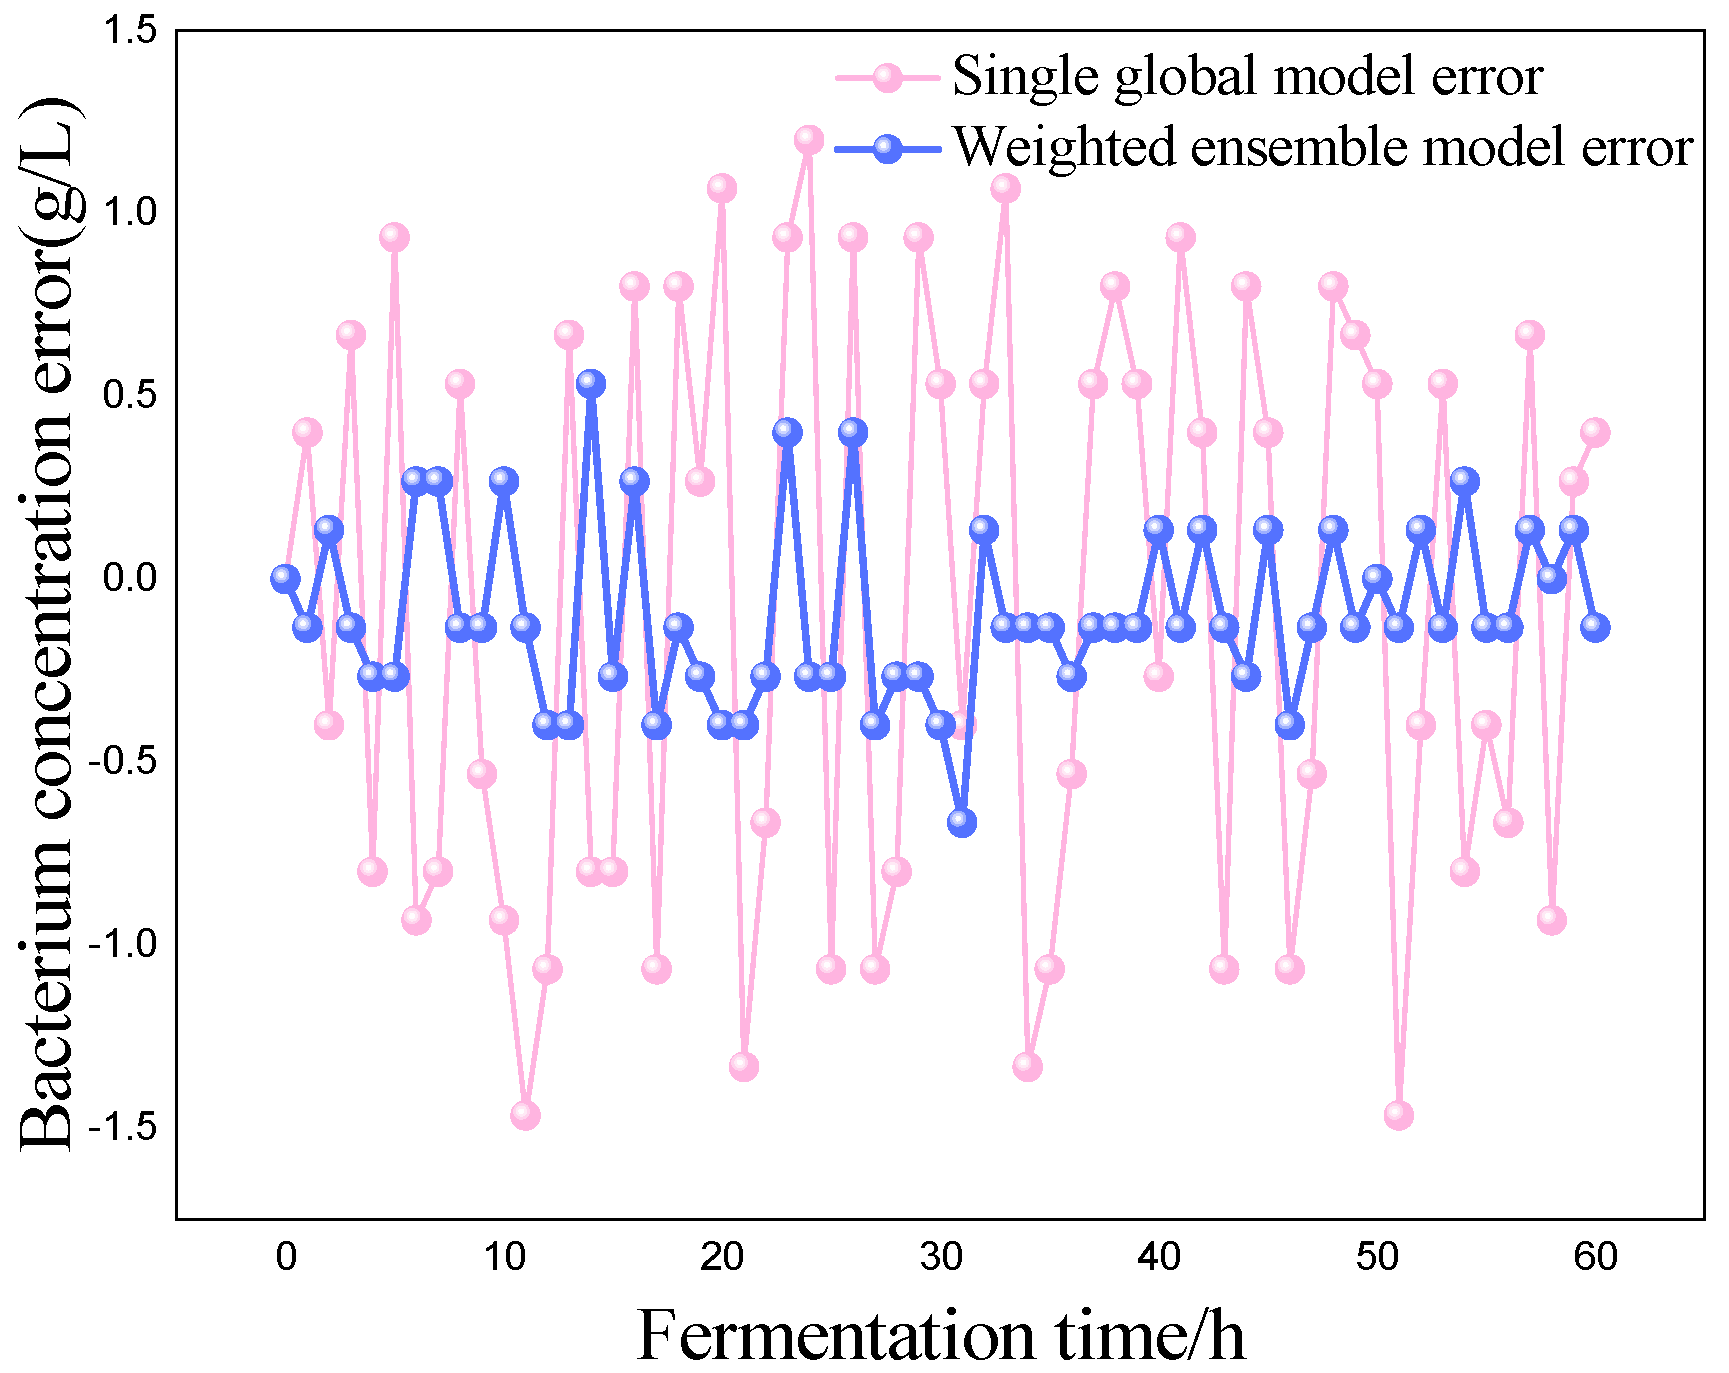
Figure 6.
Predicted curve of substrate concentration.
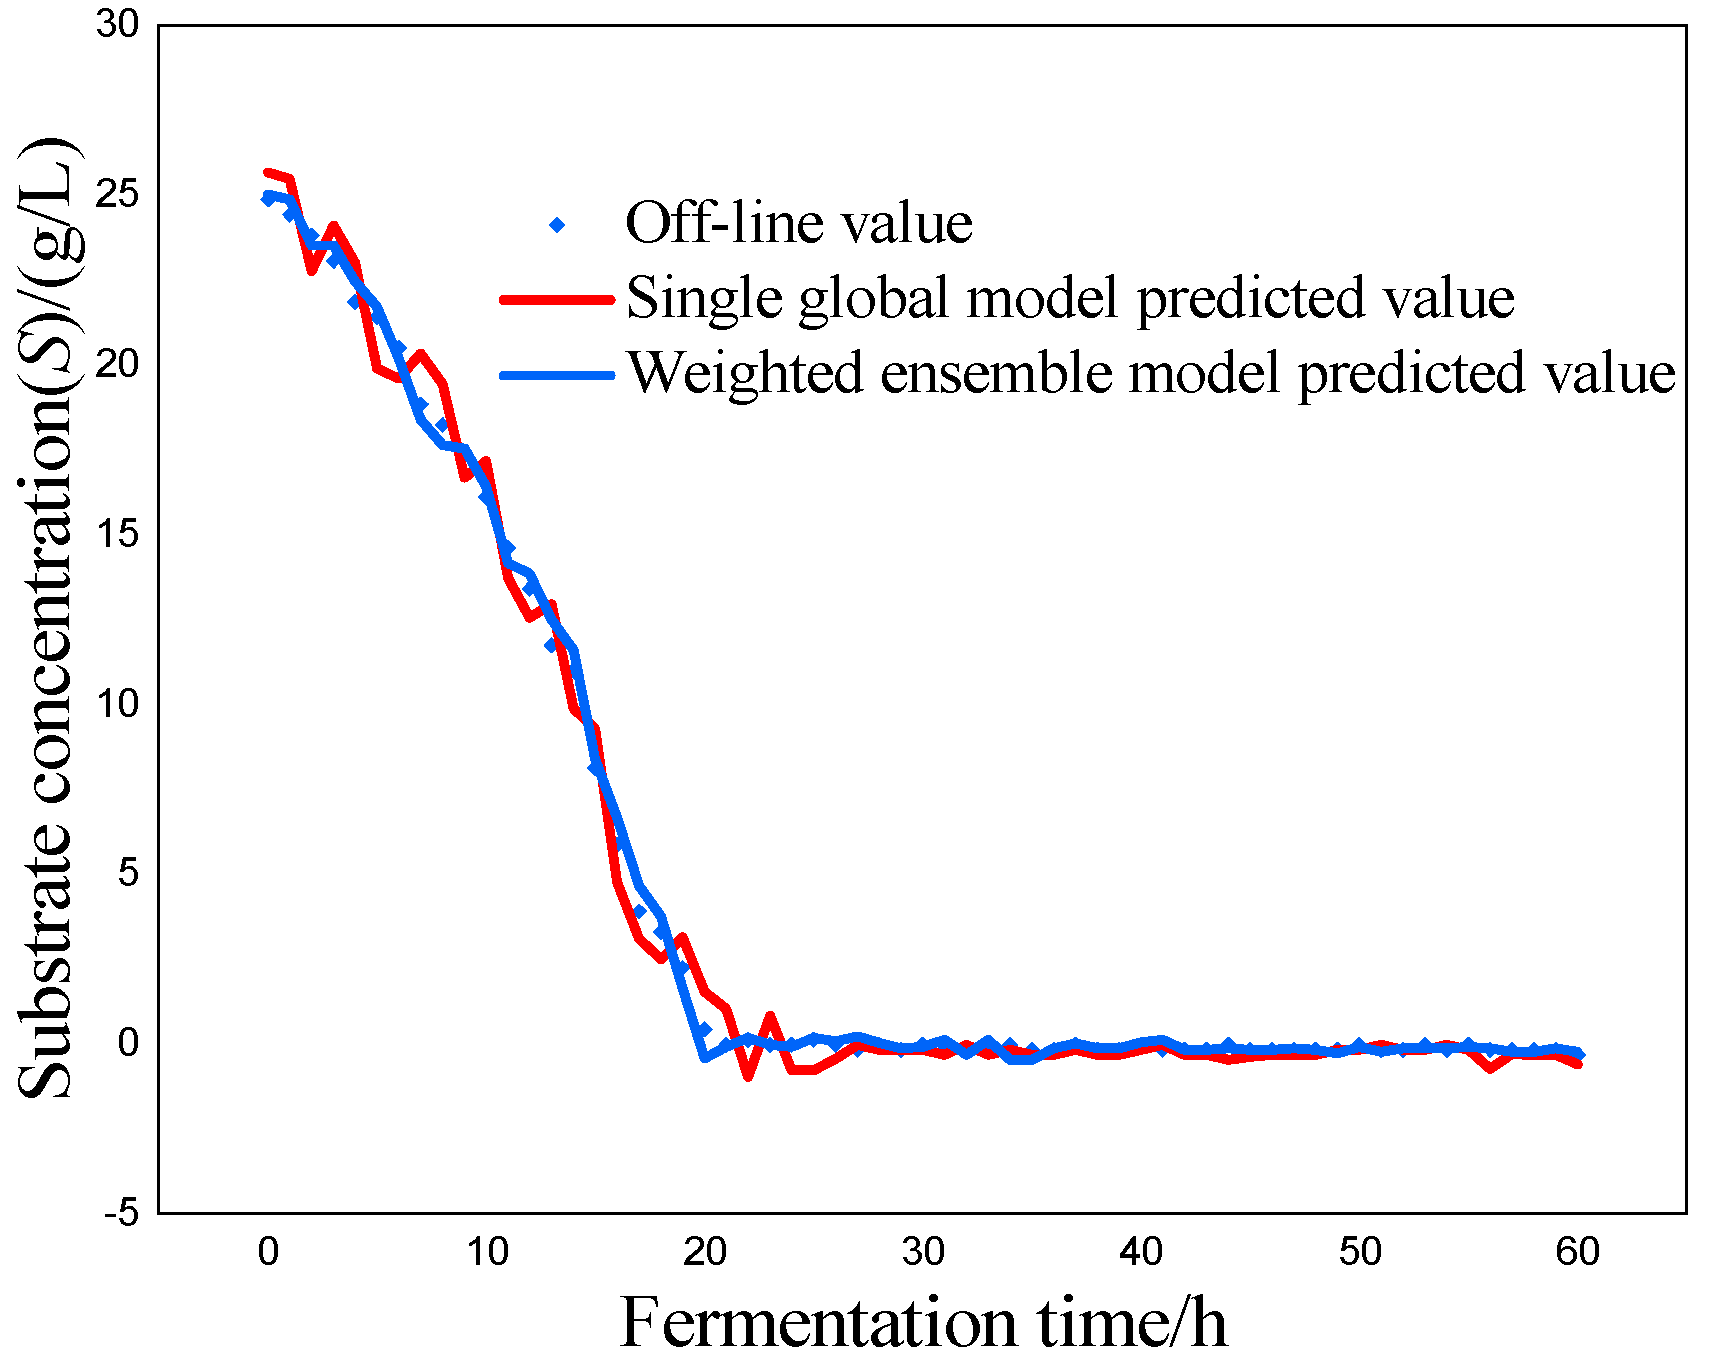
Figure 7.
Error variation curve of substrate concentration.
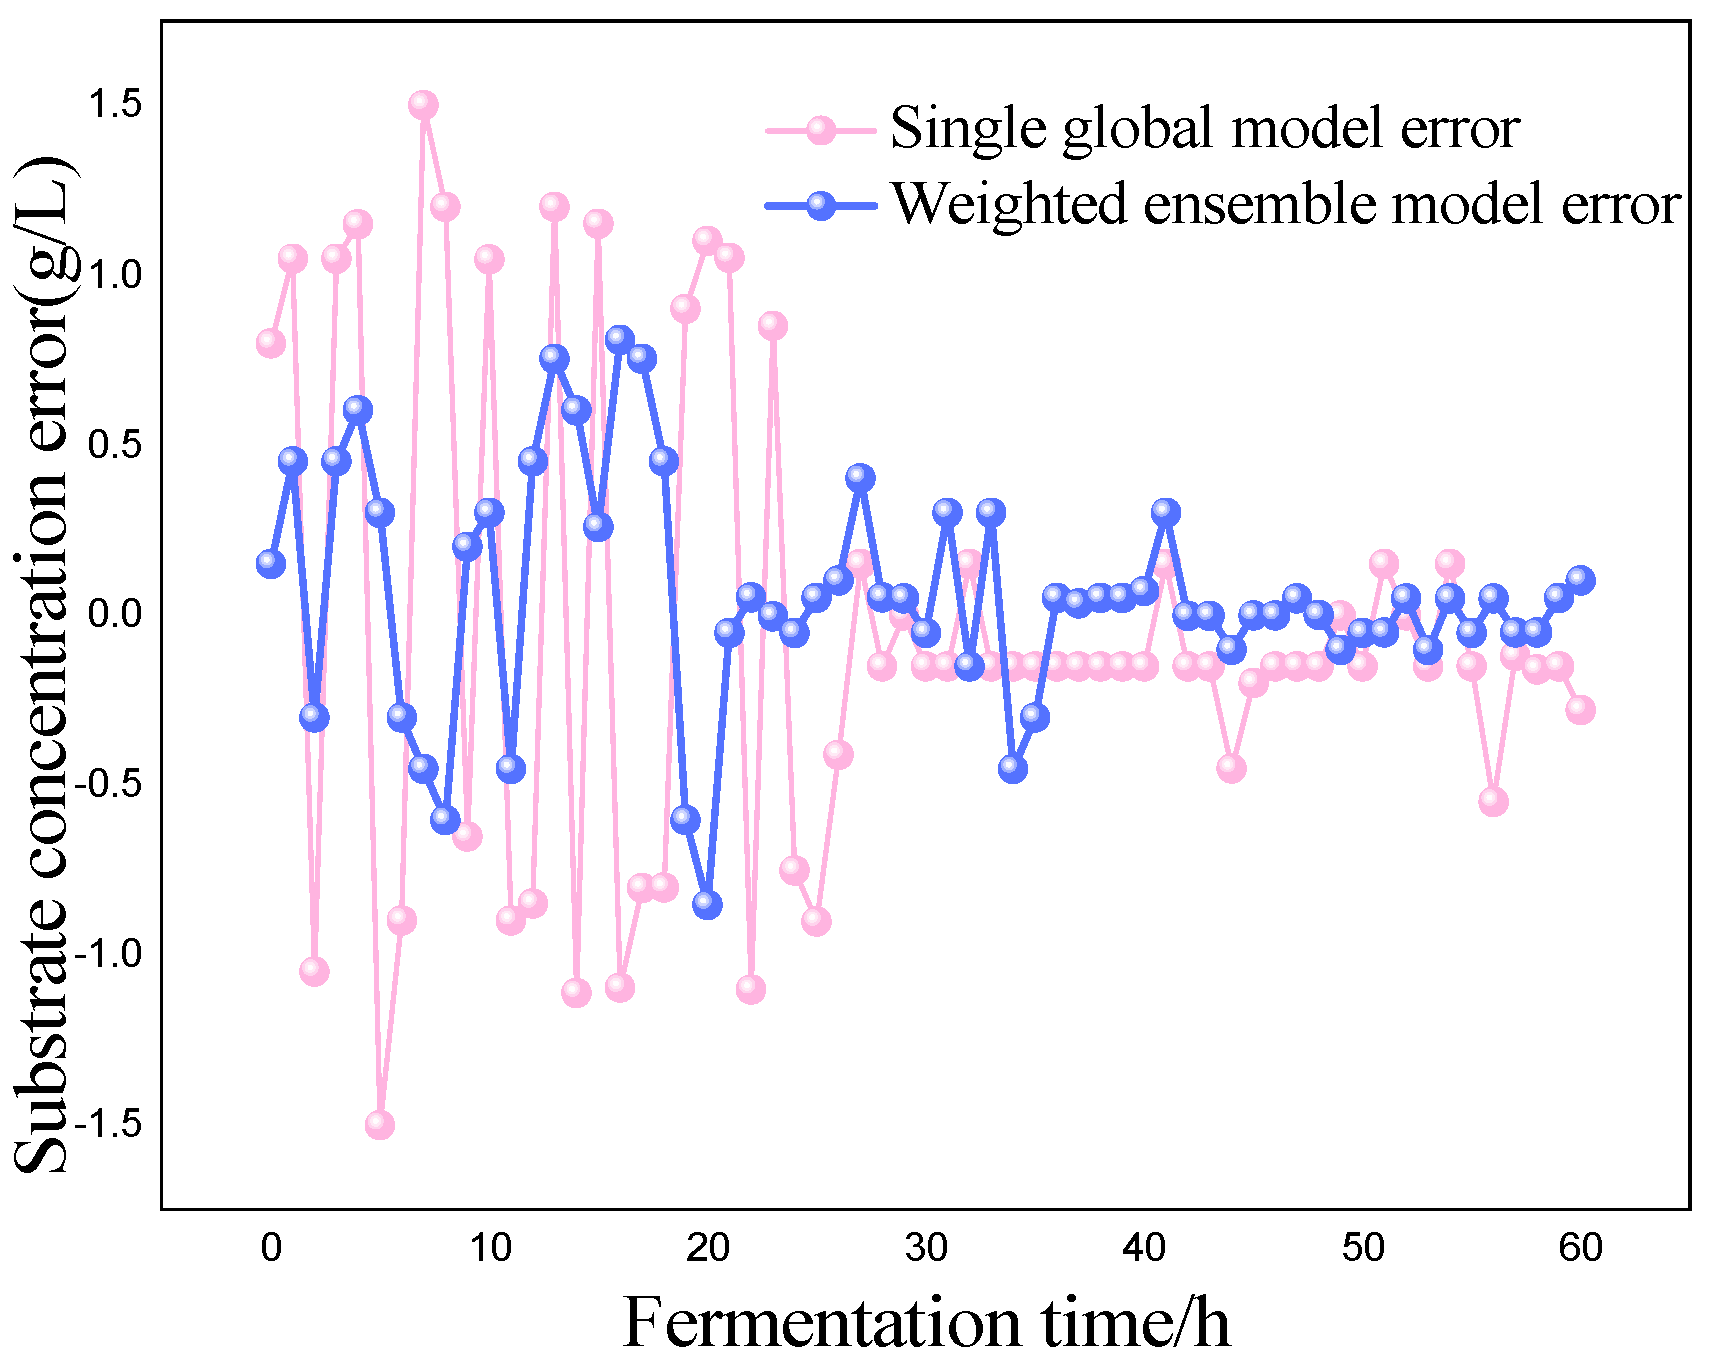
Figure 8.
Predicted curve of relative enzyme activity.
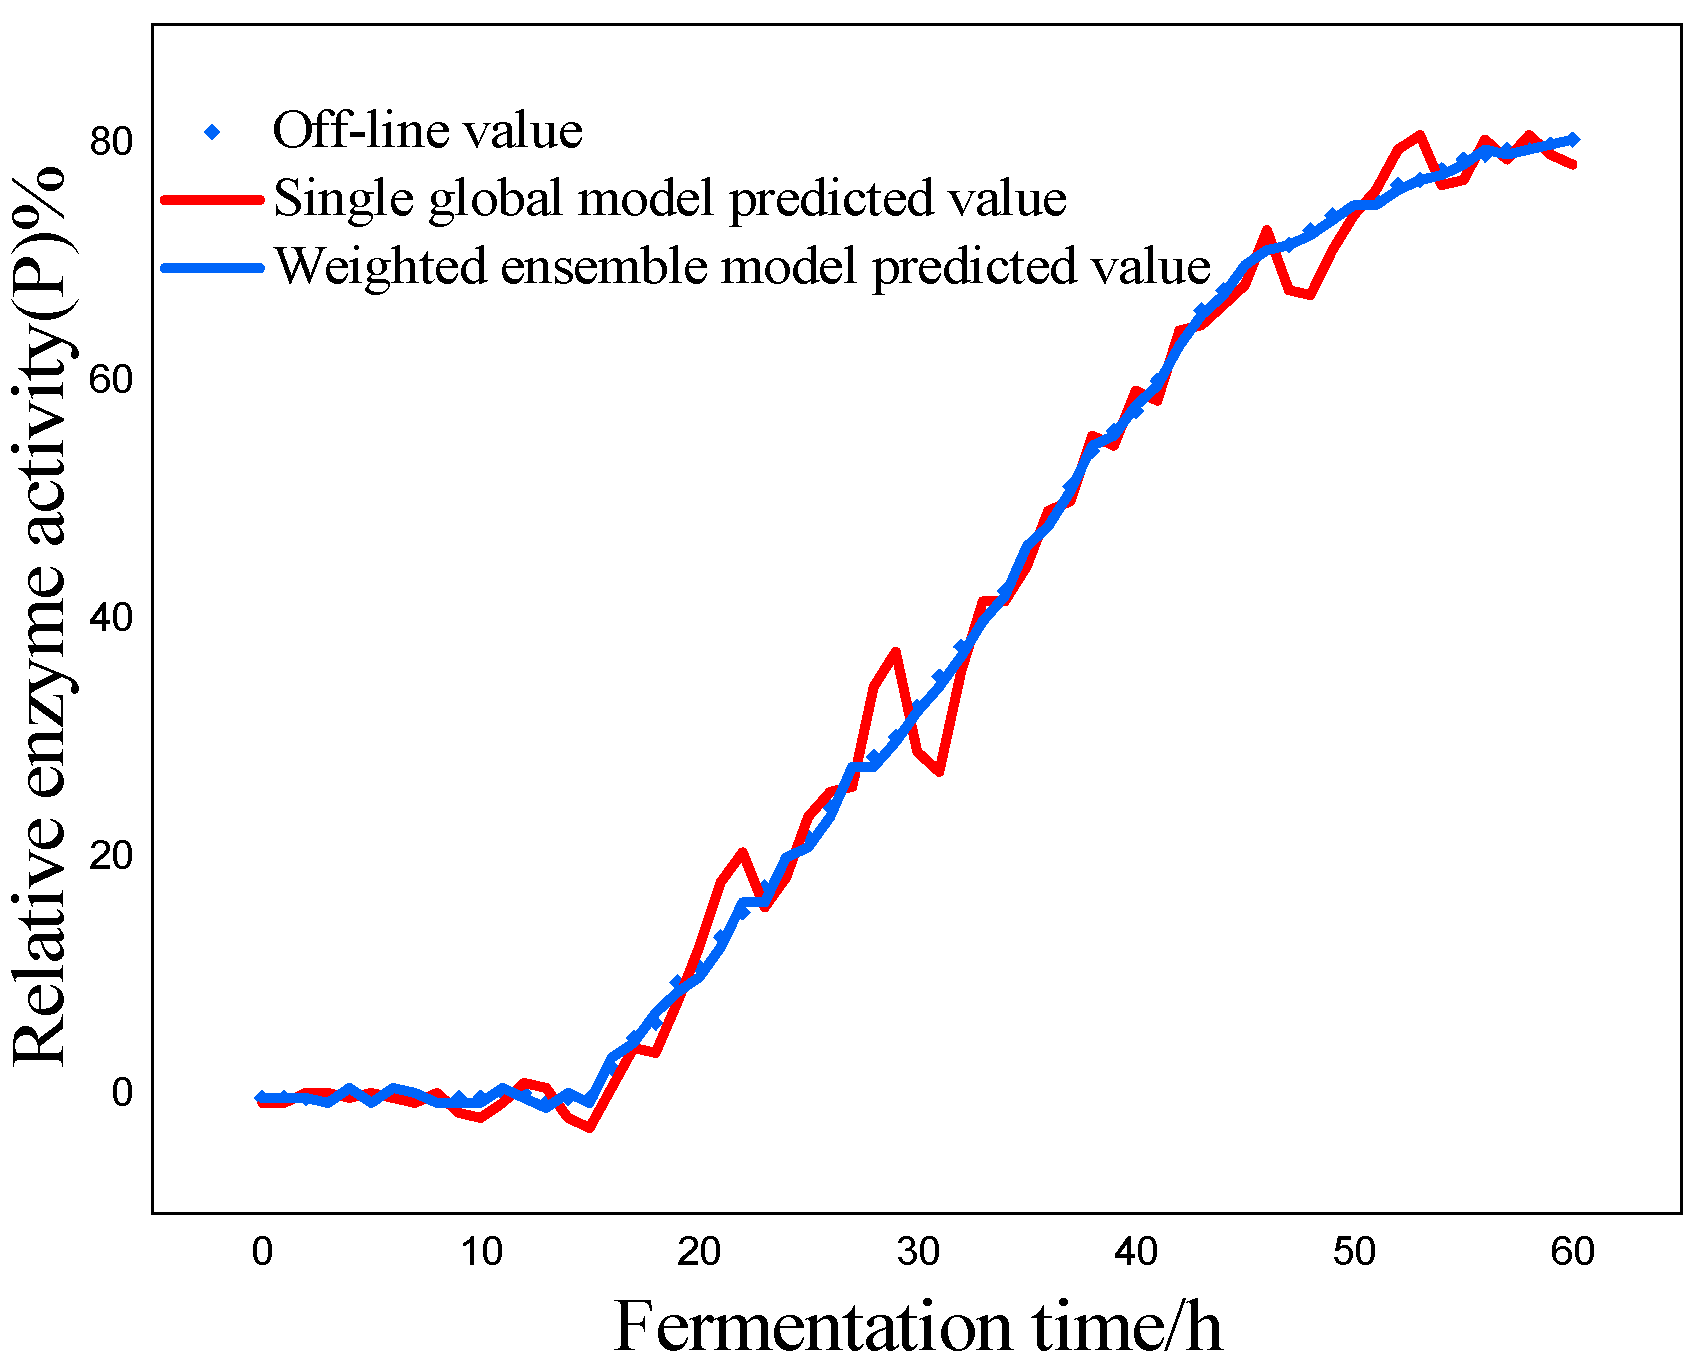
Figure 9.
Error variation curve of relative enzyme activity.
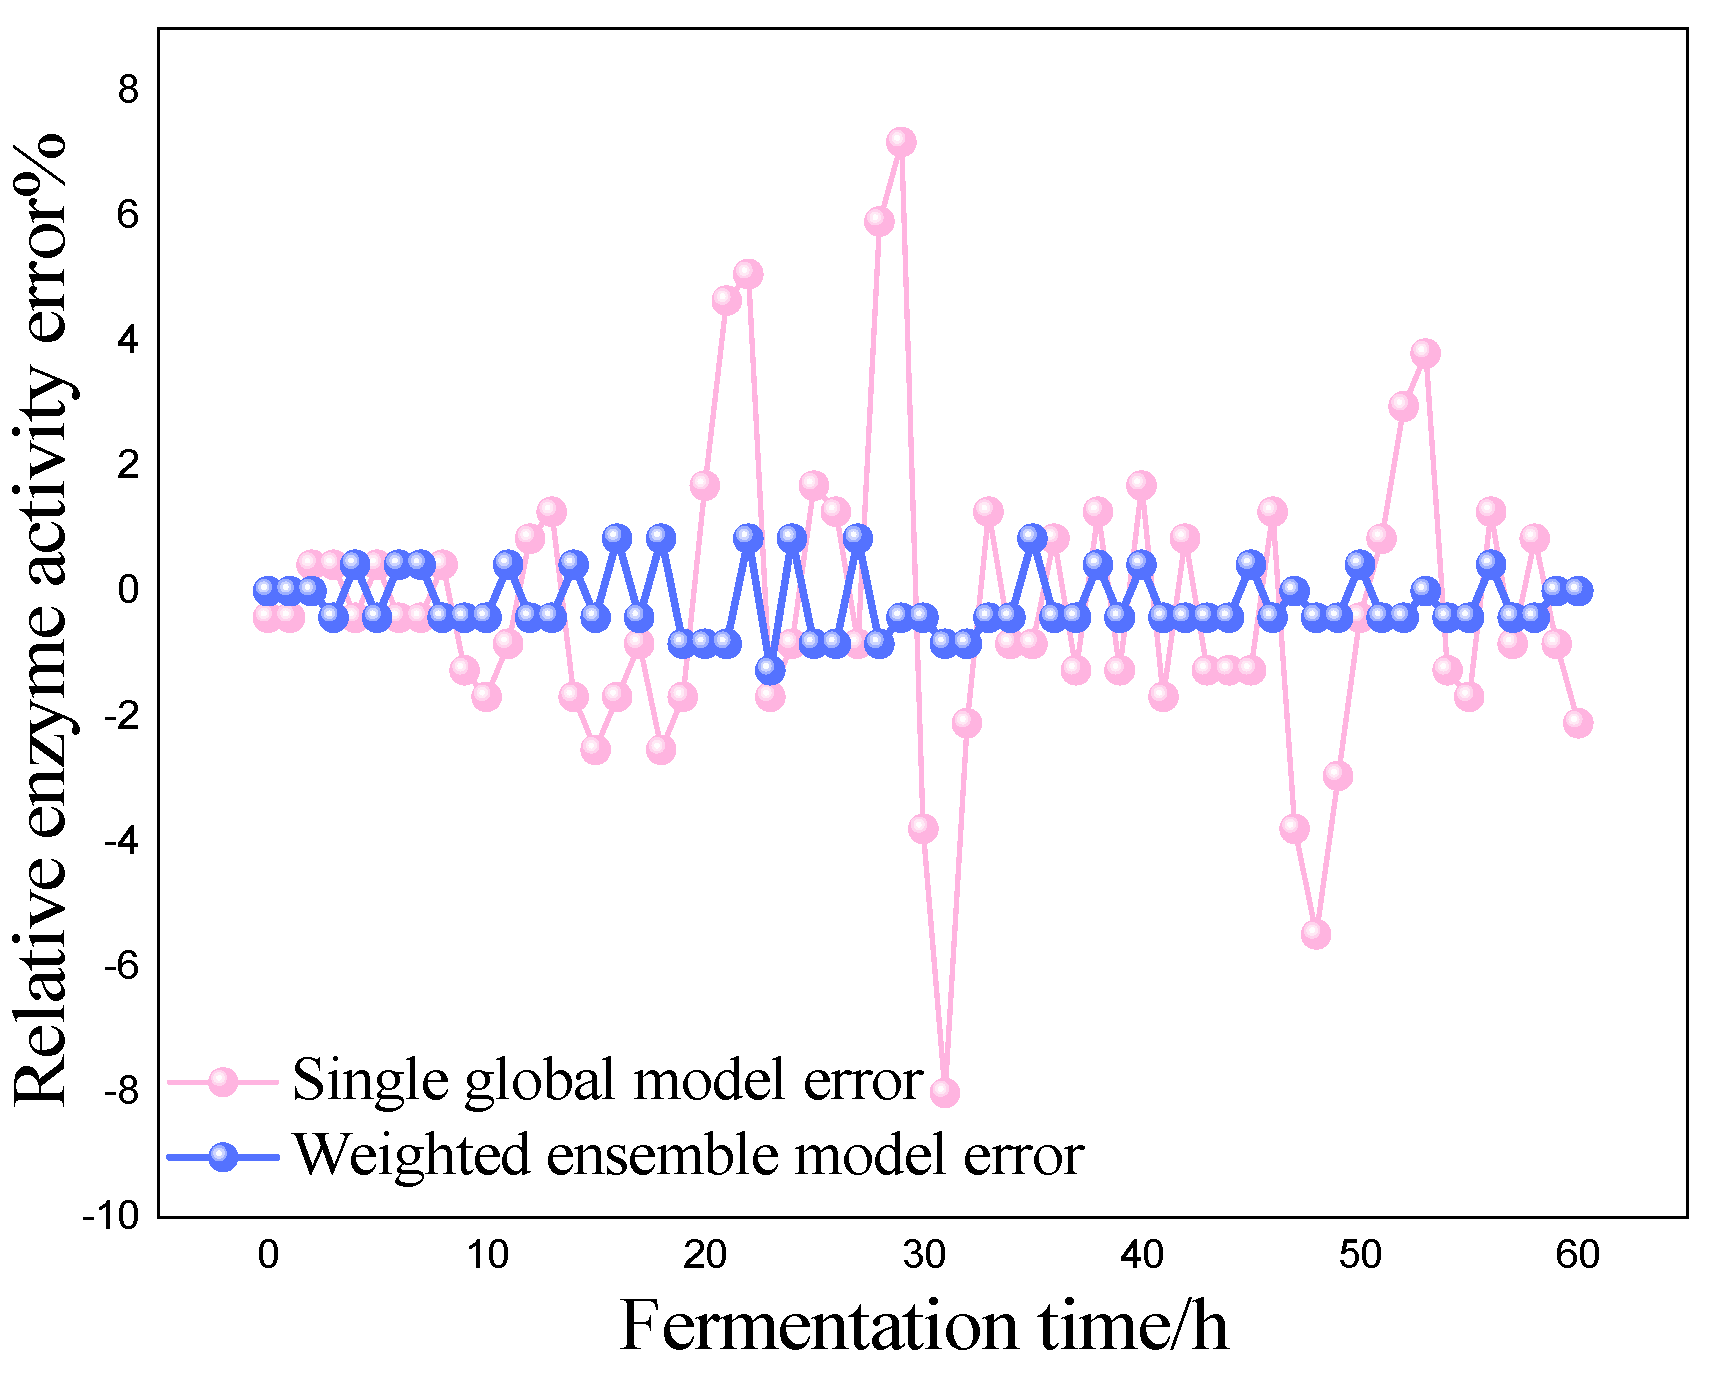

Table 1.
Comparison of the errors of the two modeling methods.
| Modeling Method | eMAE | eRMSE | ||||
| X | S | P | X | S | P | |
| Single global ISOA-GPR model | 1.2 | 1.5017 | 7.1730 | 0.8153 | 0.6946 | 2.4651 |
| Weighted ensemble ISOA-GPR model | 0.5333 | 0.8103 | 0.8439 | 0.2561 | 0.3281 | 0.5509 |
Disclaimer/Publisher’s Note: The statements, opinions and data contained in all publications are solely those of the individual author(s) and contributor(s) and not of MDPI and/or the editor(s). MDPI and/or the editor(s) disclaim responsibility for any injury to people or property resulting from any ideas, methods, instructions or products referred to in the content. |
© 2023 by the authors. Licensee MDPI, Basel, Switzerland. This article is an open access article distributed under the terms and conditions of the Creative Commons Attribution (CC BY) license (http://creativecommons.org/licenses/by/4.0/).
Copyright: This open access article is published under a Creative Commons CC BY 4.0 license, which permit the free download, distribution, and reuse, provided that the author and preprint are cited in any reuse.


