1. Introduction
Obesity is a multifactorial chronic disease that increases the risk of long-term morbidity, reduces life span, and increases health care costs. More than 650 million people worldwide were identified as obese in 2016 representing a three-fold increase since 1975 [
1]. Four million deaths in 2015 were attributed to obesity, and two-thirds ascribed to cardiovascular disease [
2]. The global economic burden of obesity is expected to be USD 1.2 trillion in 2025 [
3]. Thus, the availability of reliable and practical methods to identify individuals with excess body fat is a public health need.
Clinicians and health professionals use ranges of body weight relative to height, body mass index (BMI; Wt/Ht2), to stratify adiposity-related health risks in a population. The convenience of BMI in clinical and research settings is offset by its unreliability to estimate body fat and predict the risk of obesity-related diseases for an individual [
3,
4,
5,
6,
7,
8,
9,
10]. Because BMI is an insensitive indicator of body composition, it poorly predicts the adiposity of individuals with increased fat-free mass (FFM) [
11,
12]. Other methods to estimate body composition improve the specificity and precision of estimation of fat and lean body components but are limited by technical complexity, exposure to ionizing radiation, invasiveness, lack of mobility, and cost that prevent their widespread use for routine assessment of body composition [
13,
14]. Recent reports describe the limitations of BMI and emphasize the need for practical and valid methods to identify overweight and obesity and thus improve the care of patients with excess body fat [
15,
16,
17].
Two methods are amenable to meet this clinical need. Bioelectrical impedance analysis (BIA) relies on the conduction of a safe, administered alternating current to estimate total body water (TBW) [
18]. Most BIA methods use 50 kHz phase-sensitive devices and rely on the assumption of constant hydration to estimate FFM and calculate body fat. Alternatively, smartphone two-dimensional standing digital image analysis (2DI) coupled with computational machine learning has recently been used to estimate total body adiposity [
19,
20,
21,
22]. Studies reported differences in body fat estimates using smartphone 2DI and BIA compared to DXA but have not provided explanations for the observations [
20,
21]. Whereas BIA is a valid method to assess TBW [
18] and excess body fat increases ECW [
23], reliance on the assumption of constant hydration of the FFM may overestimate FFM and, thus, underestimate body fat in adults who are overweight or obese [
24,
25]. We hypothesize that fluid imbalance is a factor explaining differences in fat estimation with BIA compared to digital imaging.
The aim of the present study was to compare body fat mass (FM) estimates derived using BIA relative to dual x-ray absorptiometry (DXA) in healthy adults and to determine whether fluid imbalance contributes to any observed differences in FM estimates.
2. Materials and Methods
2.1. Participants
We recruited healthy adult Caucasian women and men aged 19 to 64 y using advertisements and word of mouth to participate in this study, which was conducted at the Eubion Medical Center and Tor Vergata University, in Rome, Italy. Prospective participants underwent a clinical examination and completed a health questionnaire to establish the absence of an unhealthy condition prior to participation. Exclusion criteria include metal implants, current treatment for metastatic disease, diabetes, diuretic therapy, or limb loss. This study was conducted in accordance with the Declaration of Helsinki and approved by the Institutional Review Board of the University of Tor Vergata. Each participant provided written informed consent prior to participation in any testing.
2.2. Body composition assessment
Volunteers, wearing form-fitting clothing without jewelry, came to the laboratory after consuming a light meal and emptying their bladders. Standing height and body weight were determined using standard medical equipment (SECA Stadiometer and SECA 762 scale; Hamburg, Germany).
Body composition estimation included BIA,and DXA administered in random order. Volunteers underwent whole-body BIA testing using a 50 kHz phase-sensitive impedance analyzer that introduced a sinusoidal, constant current (250 µA RMS) (BIVA, EFG 3 Monitor; Akern, Florence, Italy) using a tetrapolar surface electrode placement with paired current-injecting and voltage drop-measuring electrodes (BIAtrodes; Akern, Florence, Italy) separated a minimum of 5 cm and placed on the right wrist and ankle. Volunteers rested supine on a bed without contact with metal for 10 min. This BIA instrument provided direct measurements of resistance (R), reactance (Xc), and phase angle (PhA). The technical accuracy and precision of the BIA instrument were determined with a calibrated precision parallel circuit formed by a 384 Ω (±1%) resistor in parallel with a 780 pF (±2%) capacitor yielding 47 Ω of Xc at 50 kHz.
Body composition was estimated by using the following BI prediction models. Kyle et al. [
26] (BIA1):
FFM = 4.104 + 0.518 Ht2/R + 0.231 Wt + 0.130 Xc + 4.229 Sex* [1 for men and 0 for women] Sun et al. [
27] (BIA2):
Males: FFM = -9.88 + 0.65 Ht2/R + 0.26 Wt + 0.02 R
Females: FFM = -11.03 + 0.70 Ht2/R + 0.07 Wt + 0.02 R
Units are FFM (kg), height (Ht)2/R (cm2/Ω), weight (Wt, kg), and Xc (Ω).
We also estimated body composition using the proprietary equations of the BIA instrument manufacturer (Bodygram PLUS; Akern, Florence, Italy) (BIA3). This approach estimates the actual hydration (water content) of the FFM of an individual and uses the measured hydration in lieu of the customary 0.732 steady-state hydration ratio to estimate FFM (Akern BodyGram PRO; Florence, Italy). Fat mass is calculated as the difference between body weight and FFM.
Reference whole-body composition was determined using DXA, a GE Lunar iDXAncore sn 200278 using software version 14.10.022 (Madison, WI). All participants were positioned supine and scanned within the dimensions of the DXA table. Precision estimates were 1.3% for FM and 0.5% for FFM.
Fluid distribution was evaluated using BIA measurements and bioelectrical impedance vector analysis (BIVA) [
28]. This method uses tetrapolar BIA and a 50 kHz phase-sensitive impedance device and provides whole-body, direct serial measurements of resistance (R), reactance (Xc), and phase angle (PhA). One measure was the ratio of ECW to total body water (TBW), ECW%, which was estimated with a proprietary model (Akern BodyGram PLUS; Florence, Italy). We also assessed fluid distribution (ECW/ICW) using PhA, which is inversely related to ECW/ICW [
29].
2.3. Statistical Methods
Statistical analyses were performed using SYSTAT version 13 (Systat Corporation; San Jose, CA, USA) and version 19.0.3 (MedCalc Software Bvba, Ostend, Belgium). Descriptive data are expressed as mean ± SD. Statistical significance was set at p < 0.05.
Estimates of FM for each BIA prediction model were compared with the reference DXA values. Measurement agreement was evaluated with concordance correlation coefficient (CCC) [
29], standard error of the estimate (SEE) between DXA and each method. Reference and estimates of body fat values in each sex group were compared separately with a paired t-test. Bland–Altman plot [
30,
31] was used to determine bias and limits of agreement (LOA) for BIA methods compared to DXA determinations.
Effects of fluid distribution were evaluated in a sub-group of males with BMI greater than 25 kg/m2, the population indicator for overweight and obesity to contrast the effects of differences in adipose tissue with an unpaired t-test. Differences between group vector distributions were determined using Hotelling’s T2 test.
3. Results
Table 1 describes the physical characteristics of the participants and shows the wide ranges of BMI and FM in the groups.
Levels of agreement differed between the reference and candidate methods (
Table 2). All BIA equations underestimated (p<0.0001) FM (1.1 ± 2.4, 3.2 ± 2.4, and 3.6 ± 2.3 kg) in females. One BIA model underestimated FM (2.4 ± 3.7 kg) and two BIA equations overestimated (p<0.0001) FM (1.44 ± 3.9 and 2.9 ± 3.7 kg) in males.
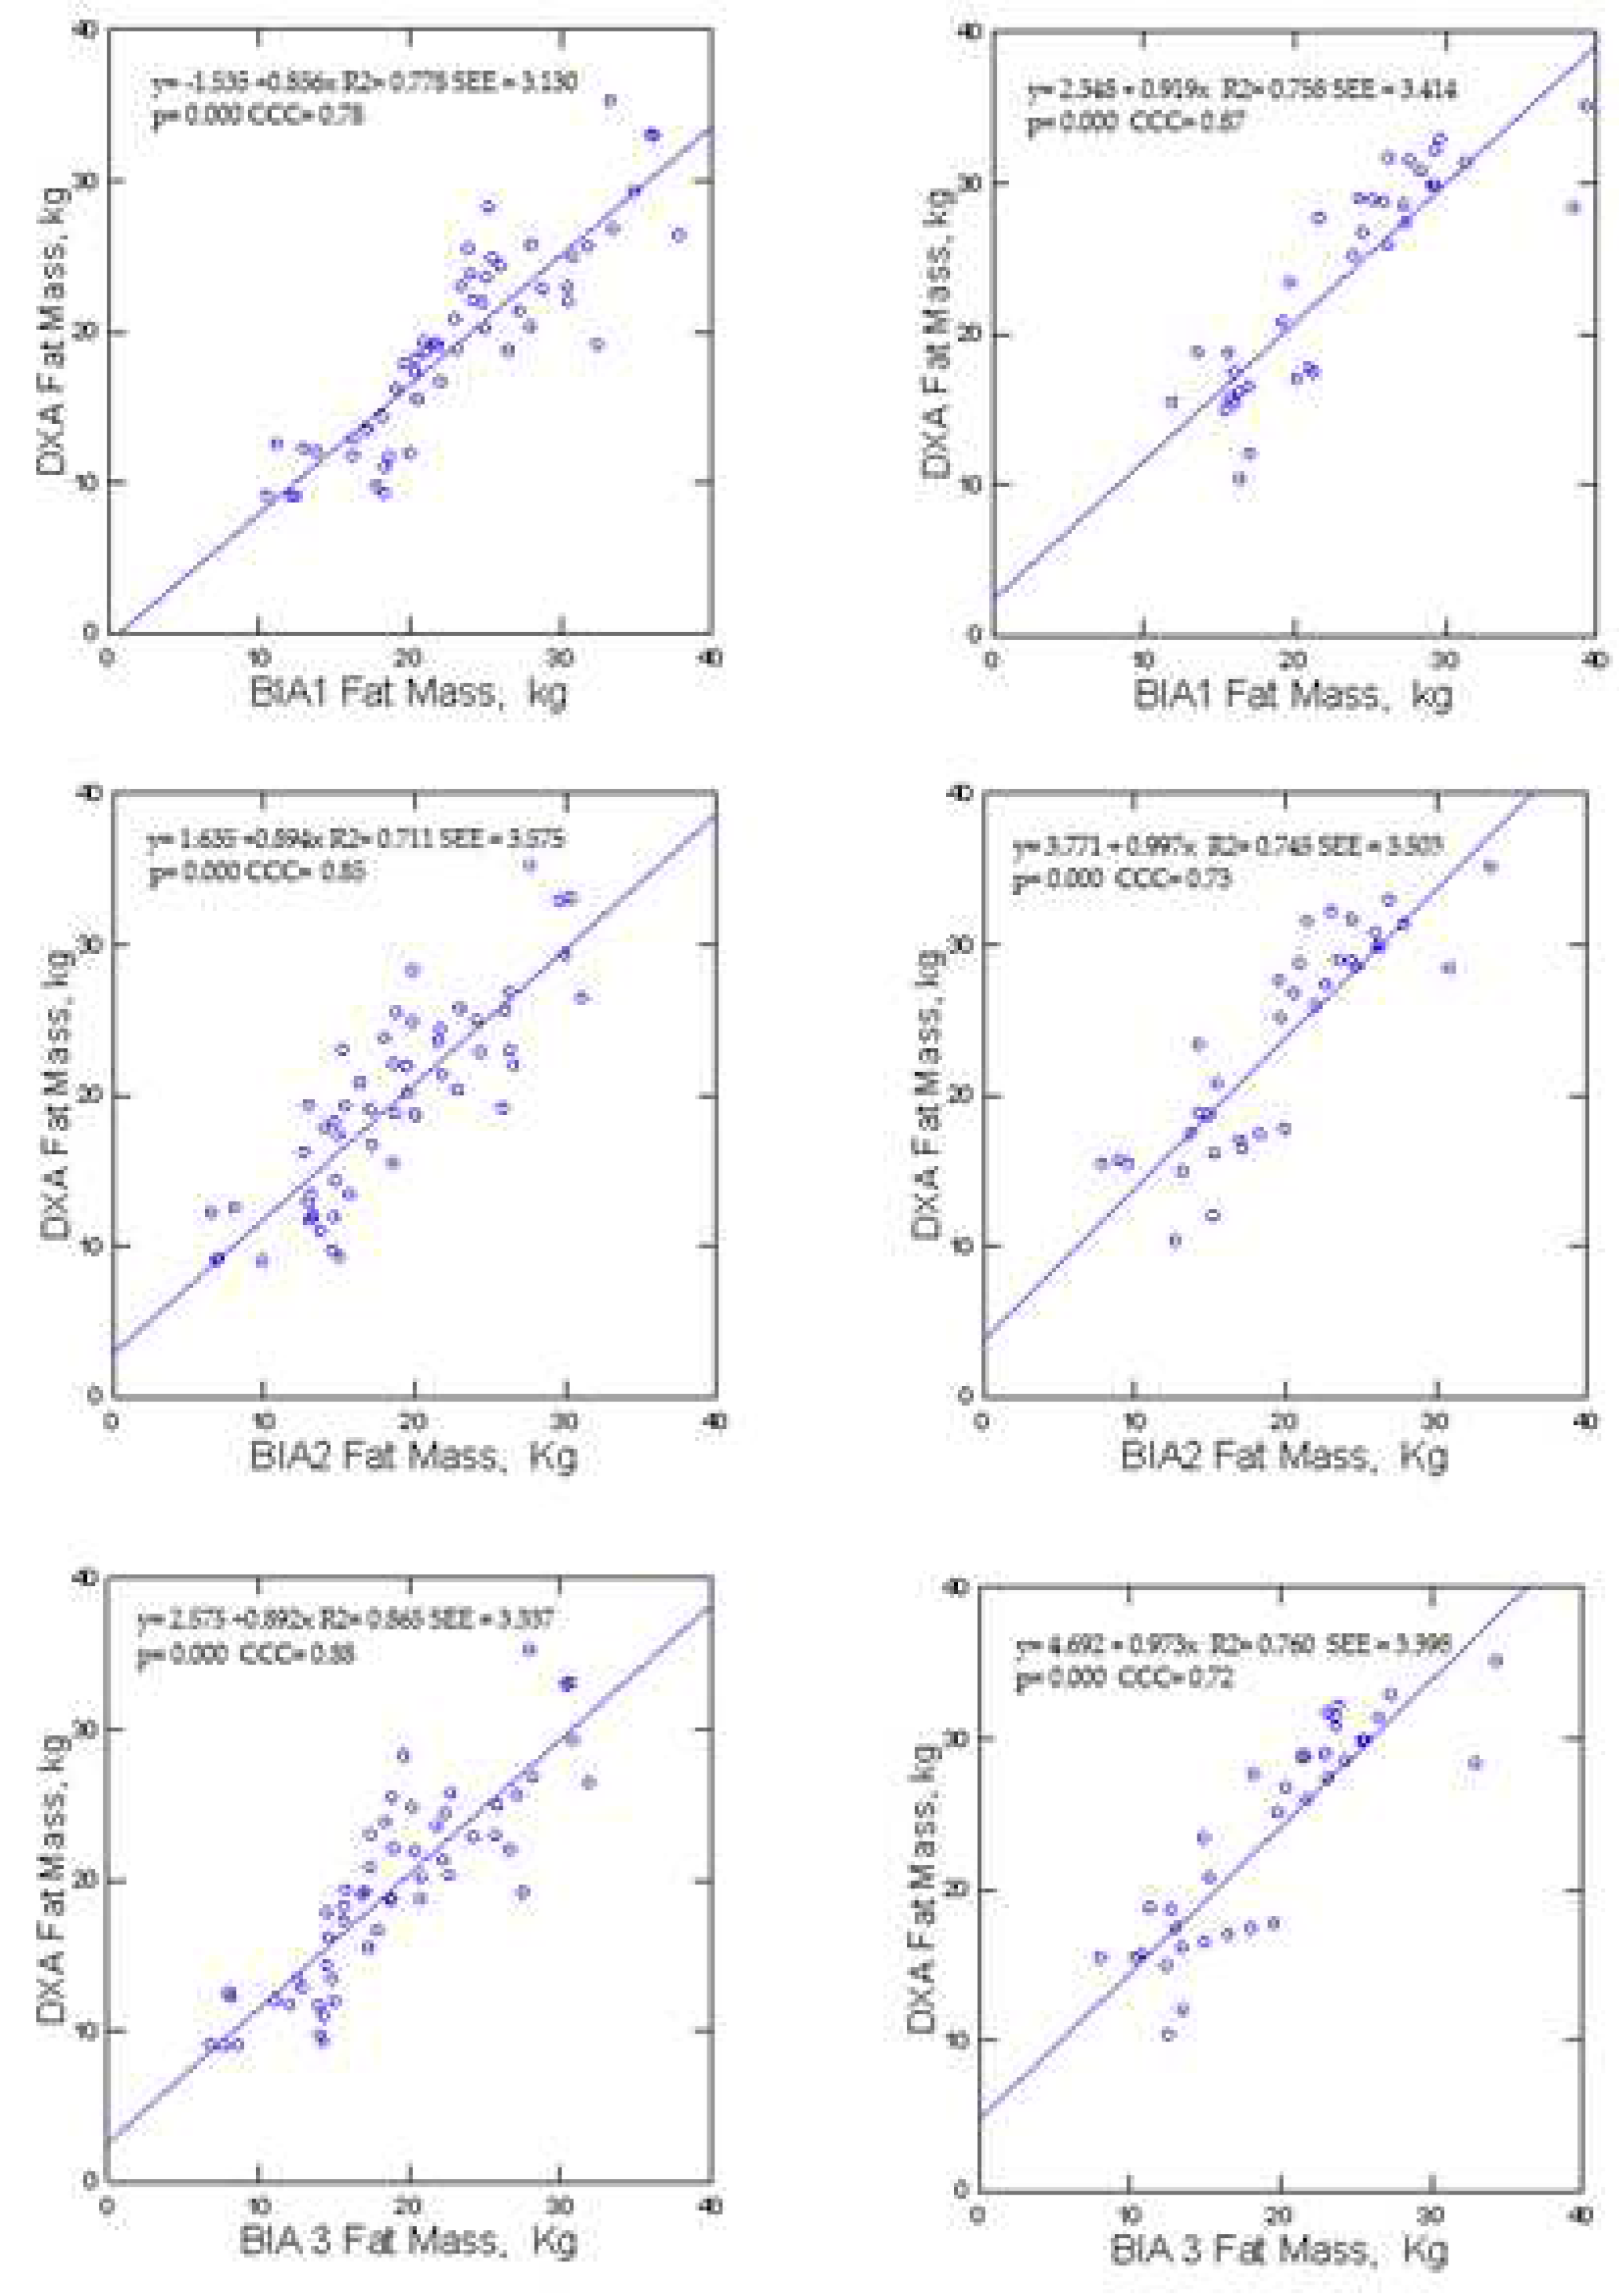
Figure 2 reveals differences. According to McBride [
29], Among females, BIA1 showed substantial concordance (0.98) while BIA2 and BIA3 showed moderate concordance (0.94 to 0.93) with DXA. In contrast, all male samples showed poor CCC (< 0.90) between the BIA prediction models and DXA.
For females, BIA, had greater MAE in males (3.3 to 3.6 vs 2.3 kg). Mean absolute percent error (MAPE) BIA for females and males (8.6 vs 8.9 to 15% and 11.5 vs 16.9 to 19%, respectively).
The intercepts for the BIA2 and BIA3 (2.3 and 3.4 kg; p<0.0001) prediction models in females and BIA1, BIA2, and BIA3 (2.16, 3.50 and 4.11 kg; p<0.0001) in males were different from 0. The slopes for these lines were variable from 1.0 to 1.08 in females and from 0.82 to 0.99 for males, but not different than 1. The SEE in females (2.3 kg) was less than SEE in males (3.7 kg)
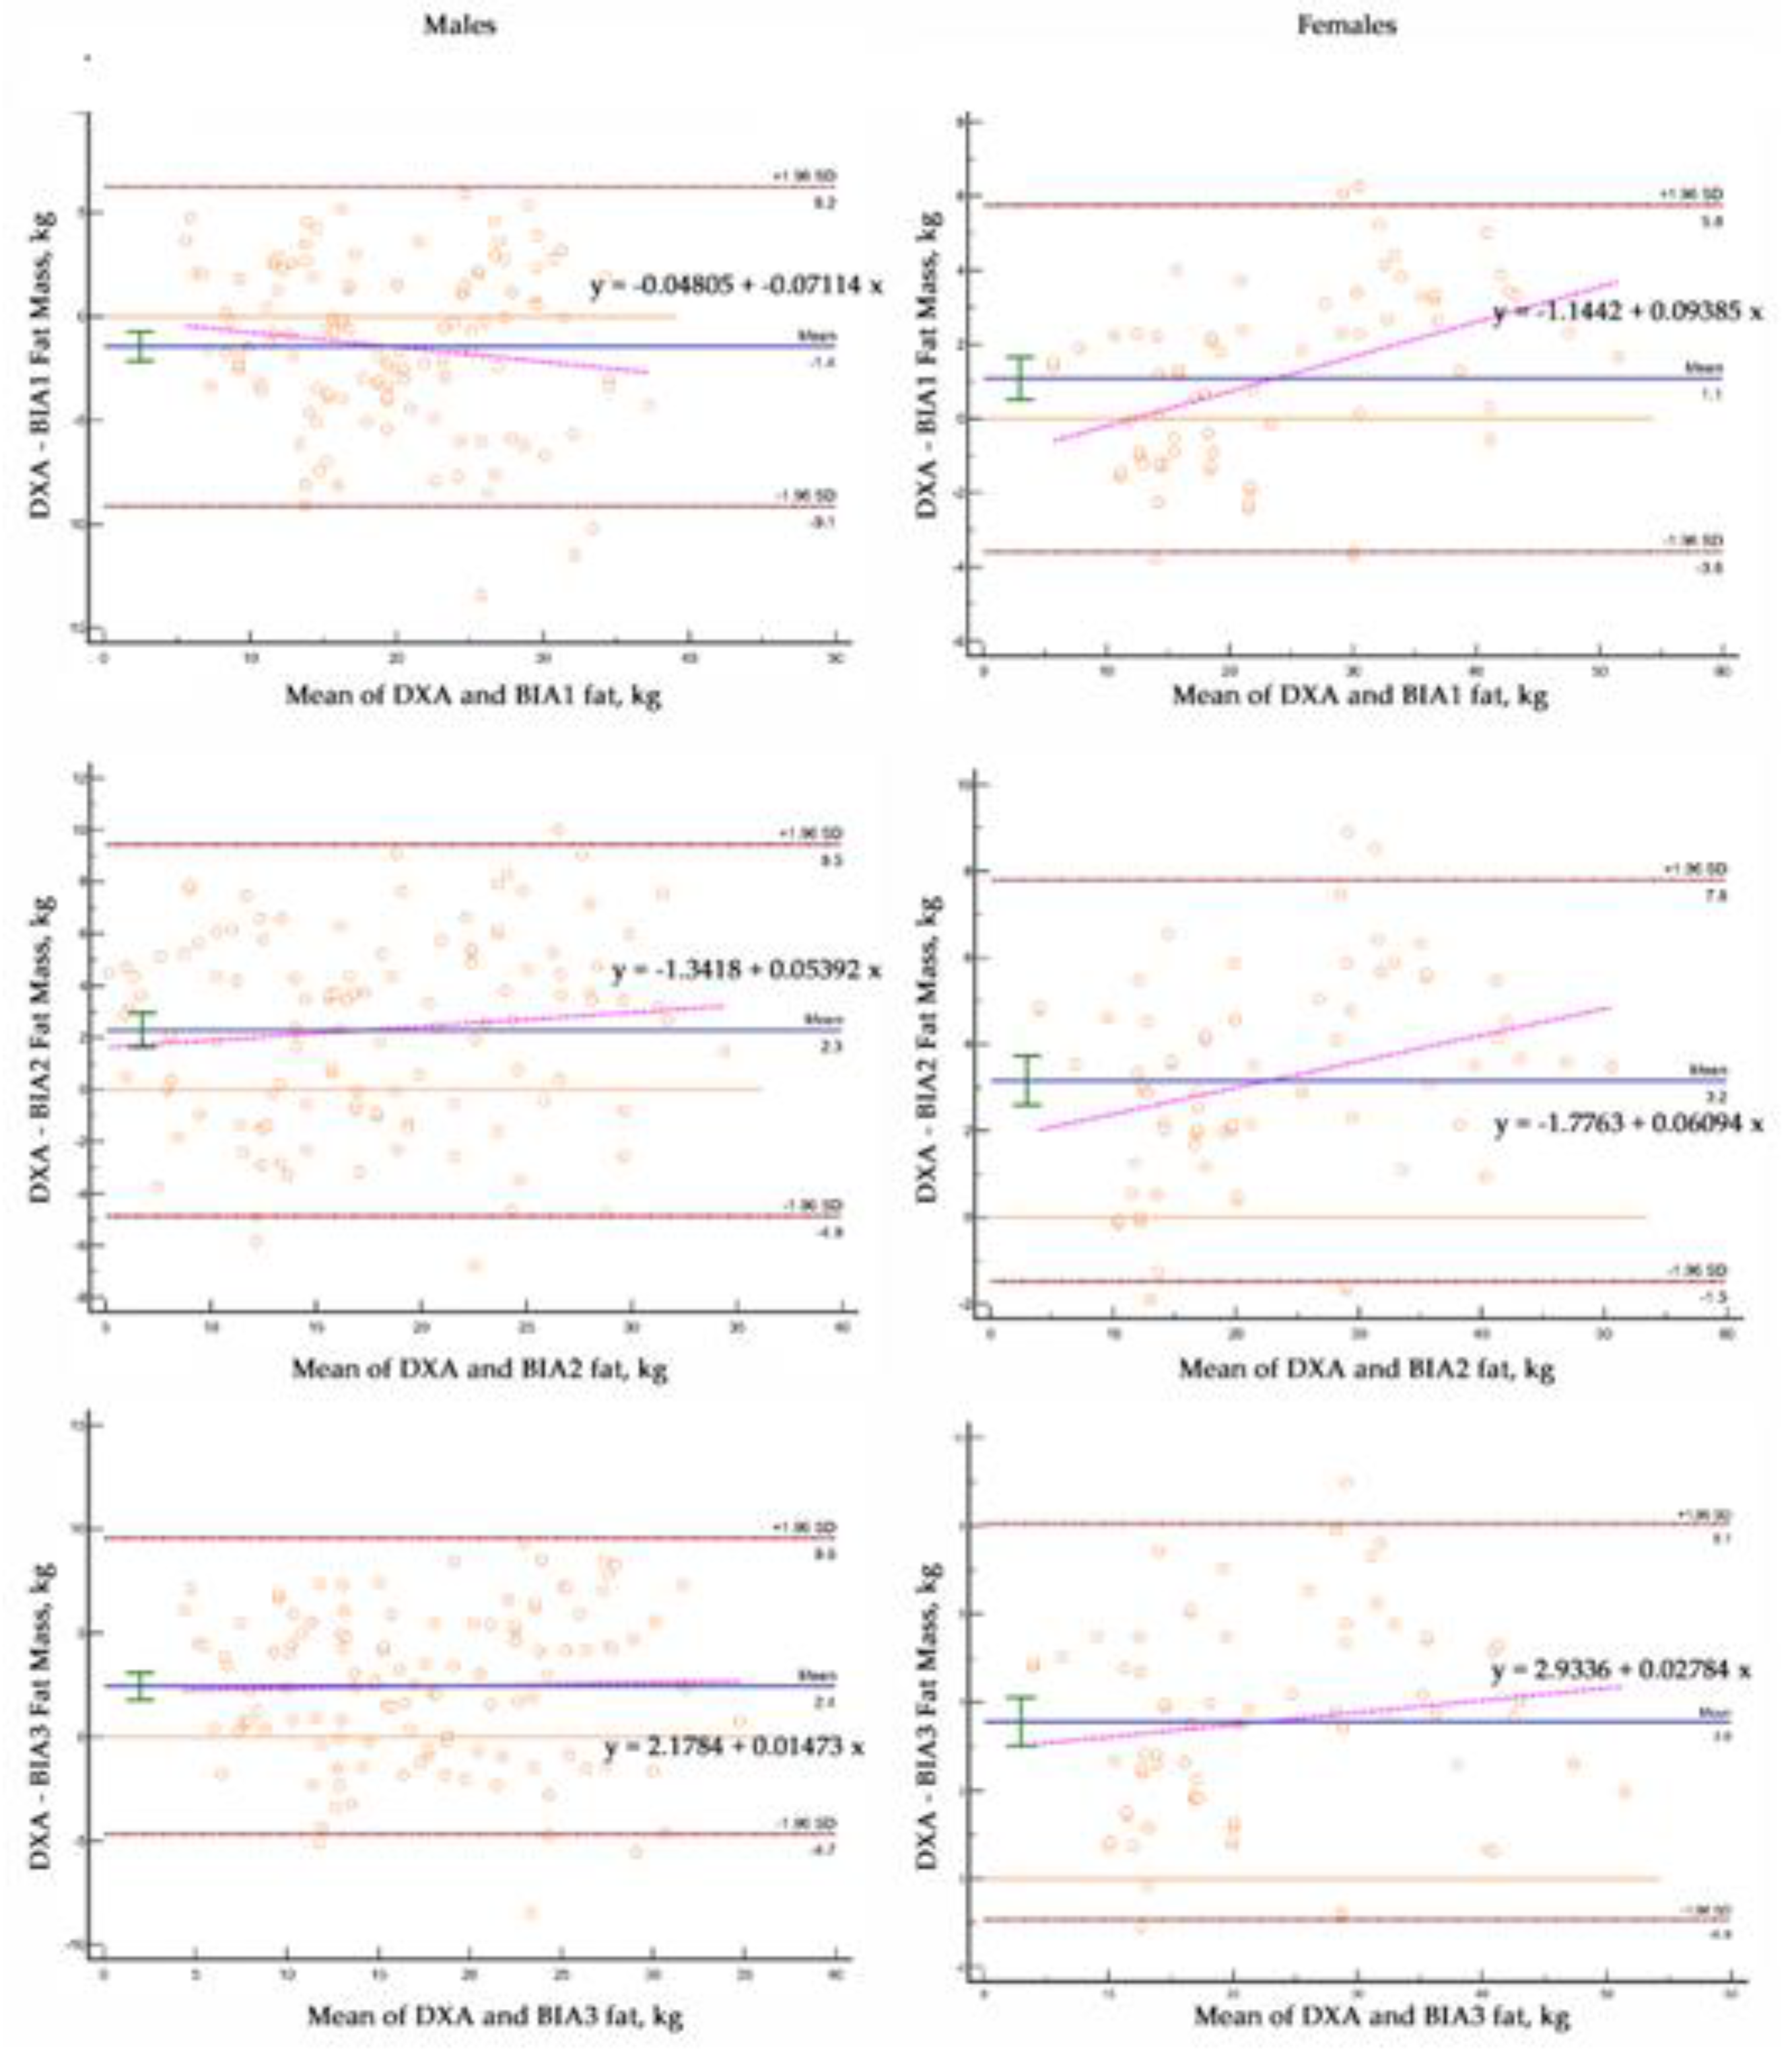
Compared to DXA, the BIA predictions of FM had significant bias in females (1.1 to 3.6 kg; p<0.0001) and males (2.3 and 2.4 kg; p<0.0001) with one BIA equation overestimating FM (-1.4 kg; p<0.0001). The slopes of the lines relating the differences between DXA and individual methods were different (p<0.0001) than 0 for two of the BIA equations in the females.
Figure 3.
Bland-Altman plots Males and Females.
Figure 3.
Bland-Altman plots Males and Females.
We tested the hypothesis that excess fat affected fluid balance in men with BMI>25 kg/m2 by comparing male elite male rugby players with men who were non-rugby players (
Table 2). Compared to non-rugby men, male rugby players had greater BMI (30.04 ± 3.3 vs 28.7 ± 3.0 kg/m2; p < 0.05) and FFM (84.7 ± 6.6 vs 68.1 ± 10.1 kg; p < 0.0001) with less FM (19.3 ± 6.6 vs 23.3 ± 6.8 kg; p < 0.01), %fat (18.2 ± 4.7 vs 25.4 ± 6.2%; p < 0.0001) and ECW% (36.2 ±2.4 vs 39.54 ± 3.5%; p < 0.001).
Compared to DXA, one BIA equation overestimated FM (4.1 ± 3.3 kg; p<0.0001) in rugby players and two BIA models underestimated FM (3.7 ± 3.5 and 4.2 ± 3.6 kg; p<0.0001) in non-rugby males. Concordance was poor for all BIA equations. For both groups, BIA, had a MAE (2.6 to 4.8 vs 2.6 kg and 2.7 to 34.3 vs 2.1 kg, respectively) and MAPE (11.3 to 21.4 vs 7.9% and 8.3 to 20.9 vs 10.8%, respectively).
Compared to DXA FM values, BIA predictions differed significantly from the line of identity (
Figure 4).
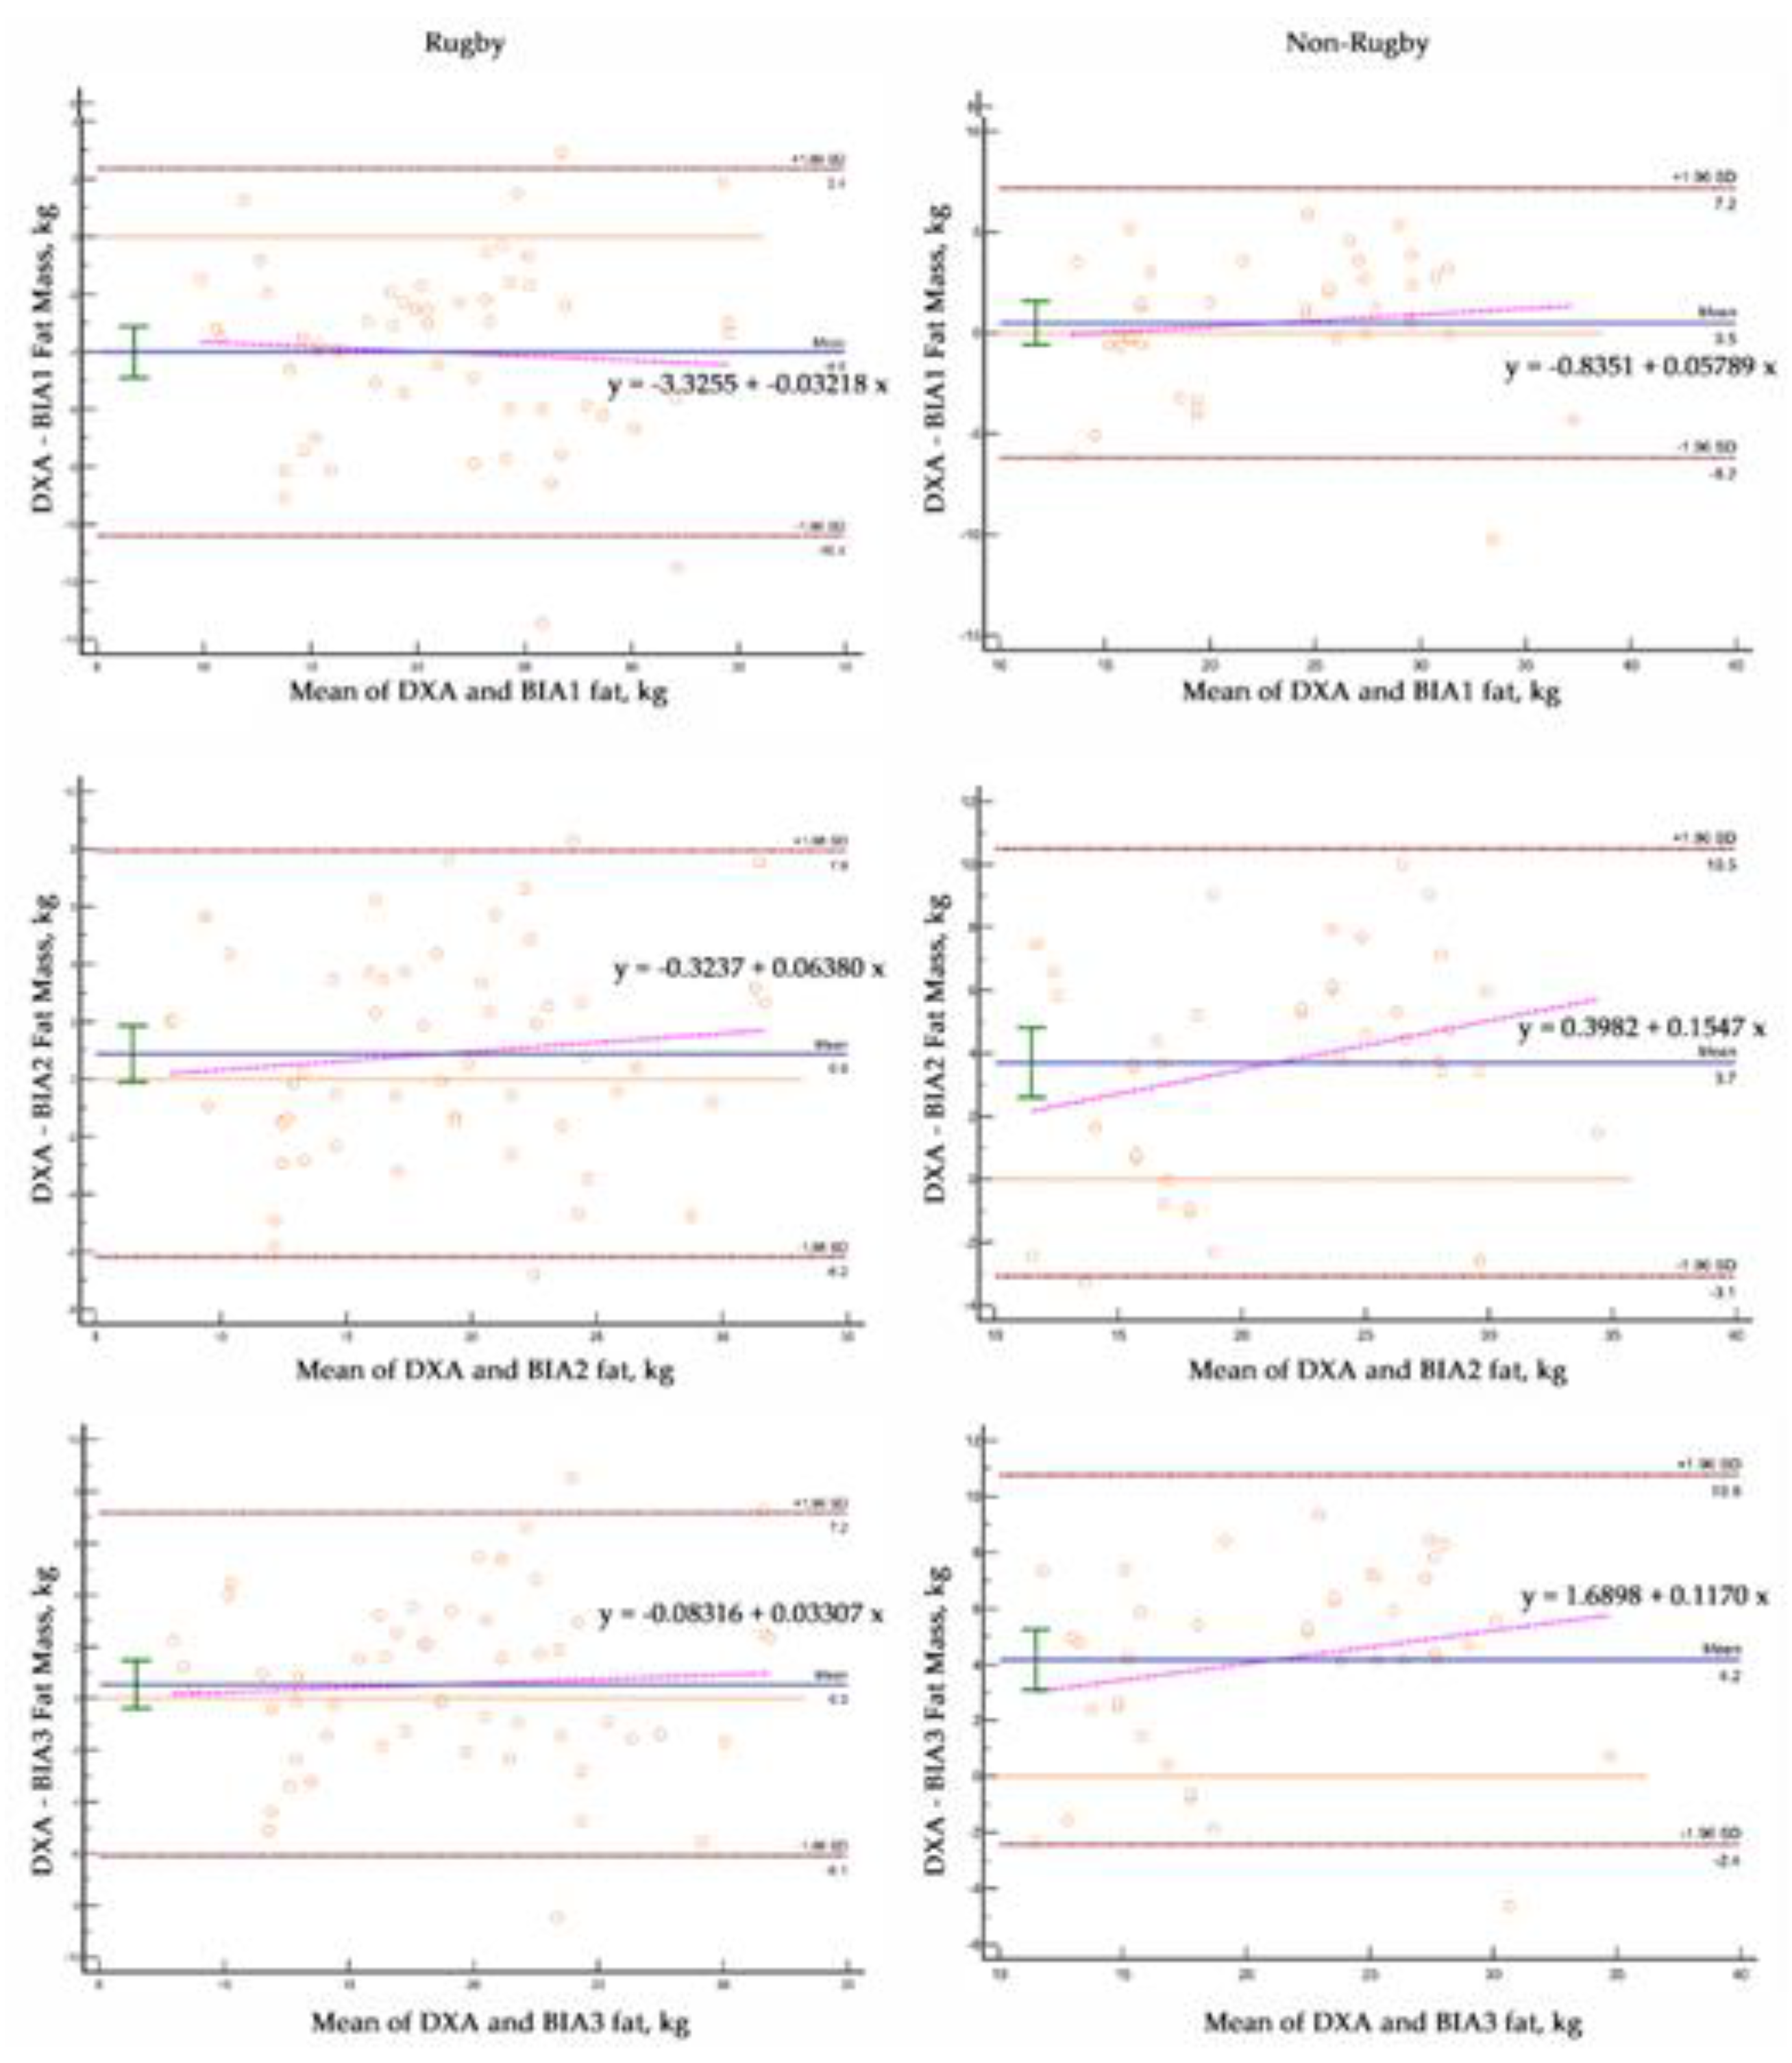
Bland-Altman analysis revealed significant bias and greater variability of data with BIA equations
Figure 5 and
Table 3). Fat mass was significantly overestimated (4.0 ± 3.3 kg) with one BIA equation in rugby players. One BIA equation underestimated FM (-0.9 ± 3.6 kg) in the rugby males and all BIA equations significantly underestimated FM in the non-rugby players (-3.7 ± 3.5 and -4.2 ± 3.6 kg). The slopes of the lines relating the differences between DXA and individual methods were different (p<0.0001) than 0 for the BIA equations in all male groups.
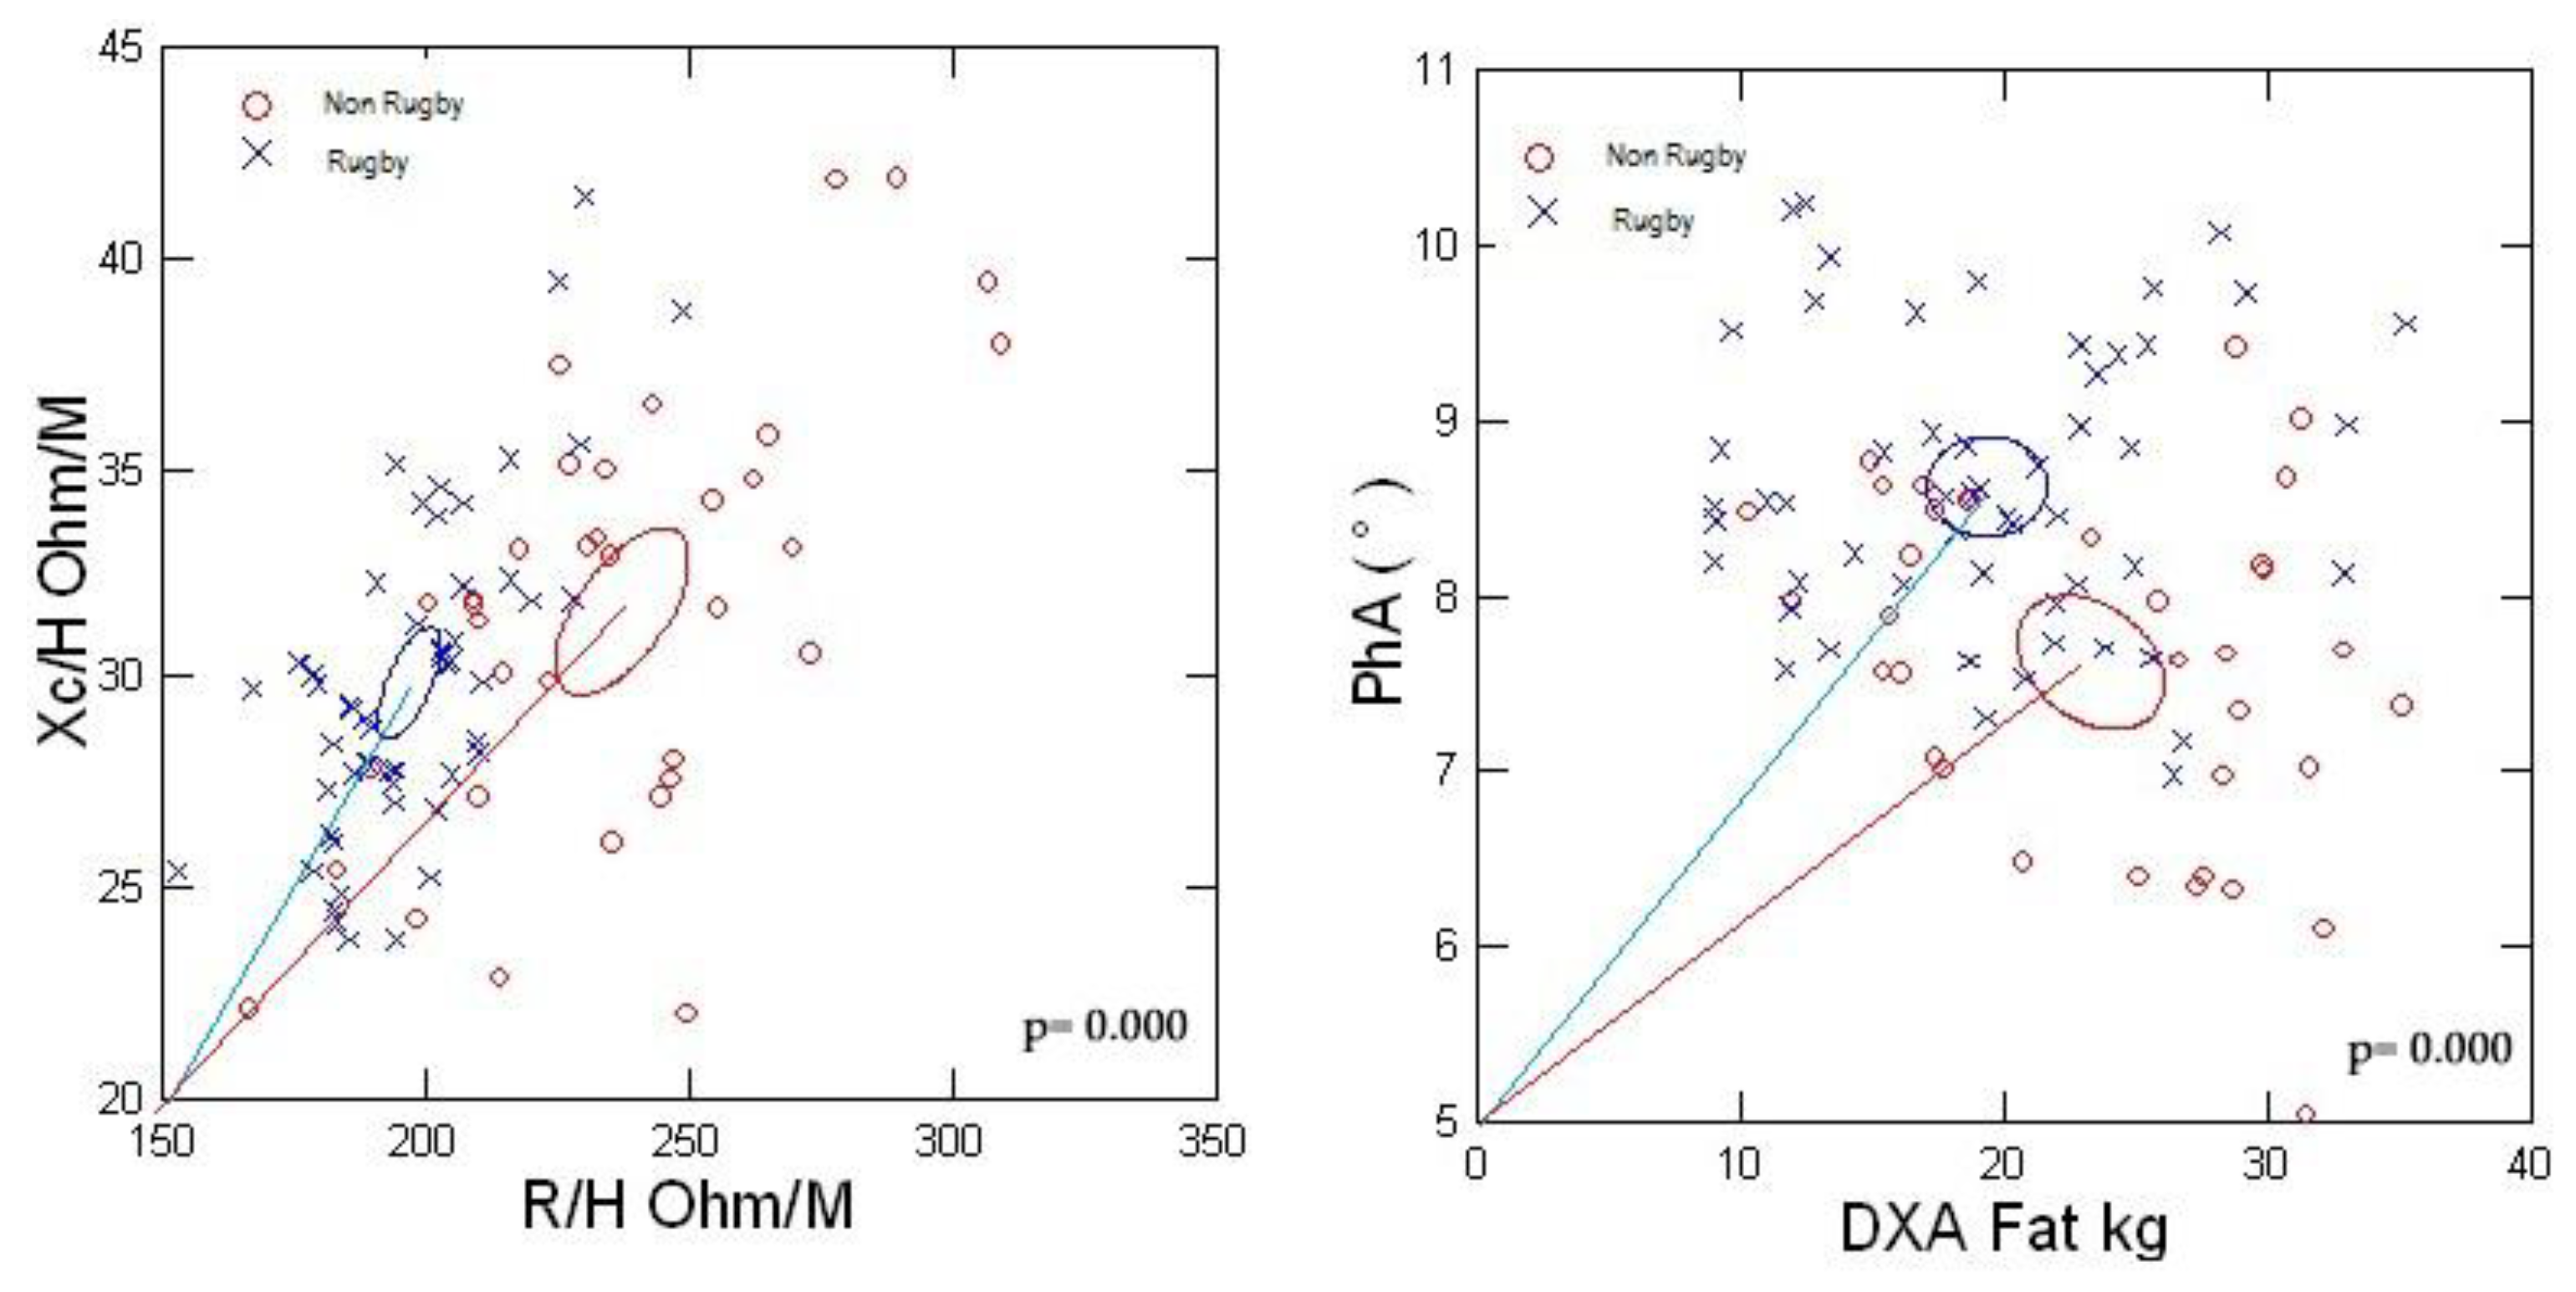
Figure 6 shows the significant group differences (p<0.0001) between the 95% confidence ellipses of men with BMI>25 kg/m2. The rugby players had a shorter impedance vector displaced to the left indicating greater conductive mass and structure than the non-rugby males. The larger PhA of the rugby players designates less relative ECW or ECW/ICW compared to the non-athletic men associated with the lesser FM.
4. Discussion
Awareness of the limitations of BMI coupled with interest by clinicians and public health researchers for point-of-contact methods to estimate body adiposity is growing [
15,
16,
17]. Characteristics such as validity, high reproducibility, mobility, cost-effectiveness, and simplicity for operators focused research on BIA to meet this need. The findings of the present study demonstrate significant underestimation of FM with BIA. These results are consistent with other comparative studies of 2DI and BIA relative to reference DXA determinations of body fat [
20,
21]. However, they provide the first evidence that fluid imbalance contributes to the errors of BIA in estimating body fat.
A few reports speculated that increased body fat could adversely impact the validity of BIA predictions of FFM [
24,
25]. The researchers proposed that an expansion of ECW would contribute to an overestimation of FFM but provided no evidence. We evaluated this hypothesis in a subgroup of men with BMI>25 kg/m2 with different body composition profiles. Male rugby players, compared to non-rugby playing men, had decreased specific resistivity (R/Ht; 196.98±17.21 vs 237.22±30.97 ohm/m; p<0.0001) and increased FFM (84.7 vs 68.1 kg; p<0.001) with decreased FM (19.3 vs 23.3 kg; p<0.001) and ECW% (36.23±2.4 vs 39.54±3.5%; p<0.001). The decreased specific resistivity, or increased conductivity, reflects greater TBW and FFM in the rugby players. The increased ECW% among the non-rugby men indicates altered fluid distribution in association with the increased body fat and reduced ICW due to less FFM. Increased body fat is associated with an expanded adipose tissue volume that is directly related to an expanded ECW, absolute and relative, previously reported among adults classified as obese using BMI criteria [
23,
33]. Chemical analyses demonstrated the appreciable water content of adipose tissue as 15% [
34], which contributes to its conductivity but to a lesser degree than muscle. Thus, inter-individual differences in body fat contribute to the variability of ECW in adults.
Raw BIA measurements provide additional support for the finding of increased ECW. The significantly decreased PhA values in the non-rugby men indicate an expansion of ECW based on tracer dilution determinations of fluid volumes and demonstrate an inverse relationship between PhA and ECW/ICW [
32]. Also, a decreased PhA has been associated with an expansion of ECW in novice runners with increased risk of acute kidney injury after a marathon [
35]. The findings of imbalanced fluid distribution, ECW/ICW, contribute to the concerns regarding the assumption of constant hydration inherent in the application of BIA to estimate FFM and predict body fat [36–38].
The independent variables in the BIA prediction models offer potential sources of error in the prediction of FFM. The common predictors of Ht2/R and R are significantly related to TBW. Thus, an increase of ECW in individuals with excess body fat increases TBW and decreases R, which assuming constant hydration of FFM, can overestimate FFM and thus underestimate FM. The BIA models also include body weight, which is highly correlated with body fat, and can vary depending on environmental, dietary, and physical activity conditions and hence affect hydration. Additionally, the application of BIA prediction equations in groups in whom the original model was not developed can lead to errors. It is well established that body geometry (e.g., limb length, cross-sectional area, and volume) and fluid content (total and distribution) directly affect resistivity and contribute to inter-individual differences in whole body and regional BIA measurements [
36,39]. Additionally, regional BIA measurements using different electrode placements, such as foot-to-foot and hand-to-hand, yield discordant estimates of body composition compared to whole-body measurements [40]. These factors contribute to the errors in BIA predictions of body fat using various BIA methods and models and DXA in the present study and other reports [
20,
21].
This study has some limitations. The inference of expansion of ECW relies on qualitative assessments using BIA. Future studies should incorporate tracer dilution determinations of ECW and TBW and obtain threshold values at which altered fluid distribution affect errors in estimating body fat using BIA. Additionally, investigators should determine the effect of graded body fat levels on errors relative to criteria reference methods particularly in adults with sarcopenic obesity.
5. Conclusions
BIA Fat mass appears to be hindered by abnormal hydration distribution when adipose tissue plays the ECW expansion role. Probably inclusion of PhA might mitigate such hurdle.
Supplementary Materials
The following supporting information can be downloaded at:
www.mdpi.com/xxx/s1, Figure S1: title; Table S1: title; Video S1: title.
Author Contributions
Conceptualization, G.L.F., H.L.; methodology, G.L.F., C.O.; formal analysis, G.L.F., H.L; statistical analysis, H.L., L.N; resources, C.O., N.G.; writing-original draft preparation, G.L.F., H.L.; writing-review and editing, G.L.F., H.L.; supervision, C.O.; project administration, C.O., N.G. All authors have read and agreed to the published version of the manuscript.
Funding
This research received no external funding.
Institutional Review Board Statement
This study was conducted in accordance with the Declaration of Helsinki and approved by the Institutional Review Board of the University of Tor Vergata.
Informed Consent Statement
Informed consent was obtained from all subjects in this study.
Data Availability Statement
The data supporting this study’s findings are available from the corresponding author upon reasonable request.
Acknowledgments
The authors thank the women and men and rugby players who generously participated in this study.
Conflicts of Interest
authors declare no conflict of interest.
References
- World Health Organization. Obesity and Overweight–Fact Sheet. 2021. Available online: https://www.who.int/news-room/fact-sheets/detail/obesity-and-overweight. (accessed on 16 July 2021).
- GBD 2015 Obesity Collaborators; Afshin, A.; Forouzanfar, M.H.; Reitsma, M.B.; et al. Health effects of overweight and obesity in 195 countries over 25 years. N. Engl. J. Med. 2017, 377, 13–27. [Google Scholar] [PubMed]
- Okunogbe, A.; Nugent, R.; Spencer, G.; Ralston, J.; Wilding, J. Economic impacts of overweight and obesity: current and future estimates for eight countries. BMJ Glob. Heal. 2021, 6, e006351. [Google Scholar] [CrossRef]
- Wellens, R.I.; Roche, A.F.; Khamis, H.J.; Jackson, A.S.; Pollock, M.L.; Siervogel, R.M. Relationships Between the Body Mass Index and Body Composition. Obes. Res. 1996, 4, 35–44. [Google Scholar] [CrossRef] [PubMed]
- Frankenfield, D.C.; A Rowe, W.; Cooney, R.N.; Smith, J.; Becker, D. Limits of body mass index to detect obesity and predict body composition. Nutrition 2001, 17, 26–30. [Google Scholar] [CrossRef] [PubMed]
- Okorodudu, D.O.; Jumean, M.F.; Montori, V.M.; Romero-Corral, A.; Somers, V.K.; Erwin, P.J.; Lopez-Jimenez, F. Diagnostic performance of body mass index to identify obesity as defined by body adiposity: a systematic review and meta-analysis. Int. J. Obes. 2010, 34, 791–799. [Google Scholar] [CrossRef]
- Tomiyama, A.J.; Hunger, J.M.; Nguyen-Cuu, J.; Wells, C. Misclassification of cardiometabolic health when using body mass index categories in NHANES 2005–2012. Int. J. Obes. 2017, 40, 883–886. [Google Scholar] [CrossRef]
- Gonzalez, M.C.; Correia, M.I.T.; Heymsfield, S.B. A requiem for BMI in the clinical setting. Curr. Opin. Clin. Nutr. Metab. Care 2017, 20, 314–321. [Google Scholar] [CrossRef]
- Frühbeck, G.; Kiortsis, D.N.; Catalán, V. Precision medicine: diagnosis and management of obesity. Lancet Diabetes Endocrinol. 2017, 6, 164–166. [Google Scholar] [CrossRef]
- Salmón-Gómez, L.; Catalán, V.; Frühbeck, G.; Gómez-Ambrosi, J. Relevance of body composition in phenotyping the obesities. Rev. Endocr. Metab. Disord. 2023, 24, 809–823. [Google Scholar] [CrossRef]
- Romero-Corral, A.; Somers, V.K.; Sierra-Johnson, J.; Thomas, R.J.; Collazo-Clavell, M.L.; Korinek, J.; Allison, T.G.; A Batsis, J.; Sert-Kuniyoshi, F.H.; Lopez-Jimenez, F. Accuracy of body mass index in diagnosing obesity in the adult general population. Int. J. Obes. 2008, 32, 959–966. [Google Scholar] [CrossRef]
- Holmes, C.J.; Racette, S.B. The Utility of Body Composition Assessment in Nutrition and Clinical Practice: An Overview of Current Methodology. Nutrients 2021, 13, 2493. [Google Scholar] [CrossRef] [PubMed]
- Borga, M.; West, J.; Bell, J.D.; Harvey, N.C.; Romu, T.; Heymsfield, S.B.; Leinhard, O.D. Advanced body composition assessment: from body mass index to body composition profiling. J. Investig. Med. 2018, 66, 1–9. [Google Scholar] [CrossRef] [PubMed]
- Sommer, I.; Teufer, B.; Szelag, M.; Nussbaumer-Streit, B.; Titscher, V.; Klerings, I.; Gartlehner, G. The performance of anthropometric tools to determine obesity: a systematic review and meta-analysis. Sci. Rep. 2020, 10, 12699. [Google Scholar] [CrossRef]
- Laine, C.; Wee, C.C. Overweight and Obesity: Current Clinical Challenges. Ann. Intern. Med. 2023, 176, 699–700. [Google Scholar] [CrossRef] [PubMed]
- Report of the Council on Science and Public Health. American Medical Association. Is obesity a disease? CSAPH Report 3-A-13. Available online: https://www.ama-assn.org/sites/ama-assn.org/files/corp/media-browser/public/about-ama/councils/Council%20Reports/council-on-science-public-health/a13csaph3.pdf.
- Mestre, L.M.; Lartey, S.T.; Ejima, K.; Mehta, T.; Keith, S.; Maki, K.; Allison, D.B. Body mass index, obesity, and mortality–Part I. Associations and limitations. Nutr. Today. 2023, 58, 92–99. [Google Scholar] [CrossRef]
- Lukaski, H.C.; Diaz, N.V.; Talluri, A.; Nescolarde, L. Classification of Hydration in Clinical Conditions: Indirect and Direct Approaches Using Bioimpedance. Nutrients 2019, 11, 809. [Google Scholar] [CrossRef]
- Waki, M.; Kral, J.G.; Mazariegos, M.; Wang, J.; Pierson, R.N., Jr.; Heymsfield, S.B. Relative expansion of extracellular fluid in obese vs. nonobese women. Am. J. Physiol. 1991, 261 Pt 1, E199–E203. [Google Scholar]
- Segal, K.R.; Gutin, B.; Presta, E.; Wang, J.; Van Itallie, T.B.; Di Gregorio, G.B.; Westergren, R.; Enerback, S.; Lu, T.; Kern, P.A.; et al. Estimation of human body composition by electrical impedance methods: a comparative study. J. Appl. Physiol. 1985, 58, 1565–1571. [Google Scholar] [CrossRef]
- Hodgdon, J.A.; Fitzgerald, P.I. Validity of impedance predictions at various levels of fatness. Hum. Biol. 1987, 59, 281–298. [Google Scholar]
- Kyle, U.G.; Genton, L.; Karsegard, L.; O Slosman, D.; Pichard, C. Single prediction equation for bioelectrical impedance analysis in adults aged 20–94 years. Nutrition 2001, 17, 248–253. [Google Scholar] [CrossRef]
- Sun, S.S.; Chumlea, W.C.; Heymsfield, S.B.; Lukaski, H.C.; Schoeller, D.; Friedl, K.; Kuczmarski, R.J.; Flegal, K.M.; Johnson, C.L.; Hubbard, V.S. Development of bioelectrical impedance analysis prediction equations for body composition with the use of a multicomponent model for use in epidemiologic surveys. Am. J. Clin. Nutr. 2003, 77, 331–340. [Google Scholar] [CrossRef]
- Lukaski, H.C.; Piccoli, A. Bioelectrical Impedance Vector Analysis for Assessment of Hydration in Physiological States and Clinical Conditions. In Handbook of Anthropometry: Physical Measures of Human Form in Health and Disease; Preedy, V., Ed.; Springer: London, UK, 2012; pp. 287–305. [Google Scholar] [CrossRef]
- McBride, G.B. A proposal for strength-of-agreement criteria for Lin’s Concordance Correlation Coefficient. 2005 NIWA Client Report: HAM2005-062.
- Bland, J.M.; Altman, D.G. Measuring agreement in method comparison studies. Stat. Methods Med. Res. 1999, 8, 135–160. [Google Scholar] [CrossRef]
- Giavarina, D. Understanding Bland Altman analysis. Biochem. Med. (Zagreb) 2015, 25, 141–151. [Google Scholar] [CrossRef]
- Marini, E.; Campa, F.; Buffa, R.; Stagi, S.; Matias, C.N.; Toselli, S.; Sardinha, L.B.; Silva, A.M. Phase angle and bioelectrical impedance vector analysis in the evaluation of body composition in athletes. Clin. Nutr. 2020, 39, 447–454. [Google Scholar] [CrossRef] [PubMed]
- Lichtenbelt, W.D.V.M.; Fogelholm, M. Increased extracellular water compartment, relative to intracellular water compartment, after weight reduction. J. Appl. Physiol. 1999, 87, 294–298. [Google Scholar] [CrossRef] [PubMed]
- Woodard, H.Q.; White, D.R. The composition of body tissues. Br. J. Radiol. 1986, 59, 1209–1218. [Google Scholar] [CrossRef]
- Nescolarde, L.; Roca, E.; Bogónez-Franco, P.; Hernández-Hermoso, J.; Bayes-Genis, A.; Ara, J. Relationship Between Bioimpedance Vector Displacement and Renal Function After a Marathon in Non-elite Runners. Front. Physiol. 2020, 11, 352. [Google Scholar] [CrossRef] [PubMed]
- Kyle, U.G.; Bosaeus, I.; De Lorenzo, A.D.; Deurenberg, P.; Elia, M.; Gómez, J.M.; Heitmann, B.L.; Kent-Smith, L.; Melchior, J.C.; Pirlich, M.; Scharfetter, H.; Schols, A.M.; Pichard, C. Bioelectrical impedance analysis--part I: review of principles and methods. Clin. Nutr. 2004, 23, 1226–1243. [Google Scholar] [CrossRef] [PubMed]
- Kyle, U.G.; Bosaeus, I.; De Lorenzo, A.D.; Deurenberg, P.; Elia, M.; Gómez, J.M.; Heitmann, B.L.; Kent-Smith, L.; Melchior, J.-C.; Pirlich, M.; et al. Bioelectrical impedance analysis—part II: utilization in clinical practice. Clin. Nutr. 2004, 23, 1430–1453. [Google Scholar] [CrossRef]
- Scharfetter, H.; Brunner, P.; Mayer, M.; Brandstatter, B.; Hinghofer-Szalkay, H. Fat and Hydration Monitoring by Abdominal Bioimpedance Analysis: Data Interpretation by Hierarchical Electrical Modeling. IEEE Trans. Biomed. Eng. 2005, 52, 975–982. [Google Scholar] [CrossRef]
- Organ, L.W.; Bradham, G.B.; Gore, D.T.; Lozier, S.L.; Abbas, S.R.; Zhu, F.; Kaysen, G.A.; Kotanko, P.; Levin, N.W.; Tanaka, N.I.; et al. Segmental bioelectrical impedance analysis: theory and application of a new technique. J. Appl. Physiol. 1994, 77, 98–112. [Google Scholar] [CrossRef] [PubMed]
- Lukaski, H.C.; Siders, W.A. Validity and accuracy of regional bioelectrical impedance devices to determine whole-body fatness. Nutrition 2003, 19, 851–857. [Google Scholar] [CrossRef] [PubMed]
|
Disclaimer/Publisher’s Note: The statements, opinions and data contained in all publications are solely those of the individual author(s) and contributor(s) and not of MDPI and/or the editor(s). MDPI and/or the editor(s) disclaim responsibility for any injury to people or property resulting from any ideas, methods, instructions or products referred to in the content. |
© 2023 by the authors. Licensee MDPI, Basel, Switzerland. This article is an open access article distributed under the terms and conditions of the Creative Commons Attribution (CC BY) license (http://creativecommons.org/licenses/by/4.0/).


