

Submitted:
09 August 2023
Posted:
09 August 2023
You are already at the latest version
Abstract
Distributions with bounded support show considerable sparsity over those with unbounded support, despite the fact that there are a number of real-world contexts where observations take values from a bounded range (proportions, percentages, and fractions are typical examples). For proportion modelling, a flexible family of two-parameter distribution functions associated with the exponential distribution is proposed here. Mathematical and statistical properties of the novel distribution are examined, including quantiles, mode, moments, hazard rate function, and its characterization. The parameter estimation procedure using the maximum likelihood method was carried out, and applications to environmental and engineering data were also considered. To this end, various statistical tests are used, along with some other information criterion indicators to determine how well the model fits the data. The proposed model is found to be the most efficient plan in most cases for the datasets considered.
Keywords:
Unit distribution
; statistical modelling
; hazard function
; characterizations
; estimation
; numerical results
; application.
MSC: 60E05; 62E15; 62F10
1. Introduction
Proportional variables are often encountered in data science, where they are used as stochastic models that describe, for instance, the number of successes divided by the number of attempts, party votes, the proportion of money spent on a cause, or the attendance rate of public events. Therefore, proportion analysis is necessary in various fields such as healthcare, economics, and engineering, among many others. Usually, to model the behaviour of such random variables (RVs), distributions defined on a unit interval are used, which are very valuable in modelling proportions and percentages. It is conceivable to model and forecast such variables, but one must look outside the traditional model because the data is limited to the range . For further study, readers are referred to [1,2,3].
In this context, the beta model is proposed by Bayes [4], which in many fields of statistics is a convenient and helpful model widely used for modelling percentages and proportions. However, there are a number of scenarios where it seems not to be suitable one. Therefore, alternatively, several distributions are developed for modelling bounded variables like proportions, indices and rates, for instance unit distribution studied in [5], the unit Johnson distribution proposed in [6], the four-parameter distribution introduced in [7], the distribution proposed in [8], Topp-Leone distribution studied in [9], and unit gamma distribution introduced in [10]. More recently, many other unit interval distribution functions have been introduced, for instance the cumulative distribution function (CDF) quantile distribution [11], new unit interval distribution [12], the unit-inverse Gaussian distribution [13], the log-xgamma distribution [14], unit Gompertz, unit Lindley and unit Weibull distributions [15,16,17], the log-weighted exponential distribution [18], the unit Johnson SU distribution [19], the unit log–log distribution [20], and the new unit distribution [21]. Notice that all of these distributions are potential candidates for describing proportions. It is worth noting that the approaches mentioned above are mainly based on conventional strategies, namely:
i) log transformation approaches,
ii) CDF and quantile methodology,
iii) reciprocal transformation, and
iv) T-X family approach.
However, all of earlier models and others seem to be casual ways of generating unit interval distributions. In the current study, our motivational strategies begins with recalling the epsilon function examined in [22], which is defined as
where and . The function is the solution of epsilon differential equation of the first order:
and it satisfies the following property of the exponential limit:
Further, it is also related to the CDF class proposed in [7], which is based on the exponential function. However, the unit interval variants thus proposed differ from the design of our CDF. As will be seen, the distribution proposed here is much more flexible, and exhibits both positive and negative skewness. Moreover, as will be seen below, the hazard rate function (HRF) of proposed model purely yields an increasing failure rate (IFR) behaviour, or all values of thus belongs to decreasing mean residual life (DMRL) class.
The rest of the manuscript is organized as follows. In the next section, the basic stochastic properties of the proposed distribution are presented. The mode, quantiles, HRF, and characterization of the new distribution, among other properties, are examined. Section 3 shows the procedure for estimating the parameters of the proposed distribution using the maximum likelihood (ML) method. Applications to a number of real-world data sets is given in Section 4, while the last section provides some concluding remarks.
2. The Proposed Unit Exponential Distribution (UED)
Let X be a bounded RV and, without loss of generality, it is convenient that values of X belongs to the unit interval . Also, suppose that the CDF of RV X is defined by the following equality:
where . The CDF given by Equation (2) is called the unit-exponential distribution (with the parameters and ), and referred to as . Note that the UED is related to the epsilon function defined in Equation (1). Indeed, when taking and , Equation (2) becomes:
when . By differentiating the CDF given by Equation (2), the probability density function (PDF) of the UED, when , can be easily obtained as:
Here, is the tail of the CDF . Notice that the UED has two parameters , the one is like a dispersion and the other like a shape parameter. Also, this PDF structure is similar to one of the simpler forms of the so-called proper dispersion models introduced in [7], but it does not belong to that class.
2.1. Properties of the Model
In practice, it is required that the proposed UED, whose PDF is defined by Equation (3), presents flexibility to describe the data adequately. In this regard, it exhibits negatively and positively skewed for all values of and . The flexibility property of the UED can be visualized as in Figure 1, where are shown the various cases of the appropriate PDF, in dependence of the parameters values and . These plots show the different skewness possibilities and the existence of modes of the UED that can be used to fit some real-world datasets.
2.1.1. Quantile
As a first property, the quantile function of the UED is quite manageable. By inverting the CDF , given by Equation (2), the quantile function is determined as:
Thanks to this function, the median of the UED is given by
2.1.2. Mode
Note that Figure 1 shows that the PDF of the proposed model can have (at most one) mode. To identify this property, we should prove the following result, which collects these findings and their implications.
Proposition 1.
The PDF , given by Equation (3), has a unique mode if and only if . Otherwise, the UED does not have any mods.
Proof.
Mode of the PDF is a solution of the equation , which after certain calculations and simplification becomes:
If denote by the left-hand side of Equation (4), it is easily obtained:
Obviously, inequalities and gives . Then, Equation (4) has real solutions, which guarantee that has at least one mode. Next, the function defined above has derivative:
Note that is strictly decreasing because:
This fact then implies that the previously detected mode is unique. □
2.1.3. Behaviour of the PDF at and
Behaviour of the PDF at the ends of unit interval, that is when and , indicate how converges or not in these limits. In terms of data modelling, these facts would reflect empirical limits on the extremes that data show. At the limit , according to Equations (2) and (3), it is easily obtained:
On the other hand, to analyzing the limit of at , we observe the function , which can be written as
Hence, we get:
which implies that in a data representation, data would decay at exponential rates when .
2.1.4. Moments
Let X be a RV with the CDF given by Equation (2). Then, the moment of X, using partial integration, can be expressed as follows:
This integral can be determined numerically with the use of any software. The following result proposes a series expansion of that can be used for numerical approximation.
Proposition 2.
The moment of X can be expanded as:
where denotes the upper incomplete gamma function, i.e., .
Proof.
By applying the change of variable , we have:
Then, using the `generalized version’ of the binomial formula two times in a row, since , we get:
Also, by the change of variable , it is obtained:
2.1.5. Failure (Hazard) Rate Function
The HRF of the UED is given by:
When , the limit of is , and when , the limit is . Thus, this function is strictly increasing, as it can be seen in Figure 2, meaning that when x increases the frequency with which an engineered system or component fails also increases.
2.2. Characterizations
To interpret the HRF realistically we shall try to characterize Equation (3) by hazard and mean residual life functions. Characterization in general terms implies that under certain conditions a family of distributions is the only one possessing a designated property. Researchers can identify the actual probability distribution with the help of characterization, for detailed study readers are referred to Ahsanullah et al. [24,25] and Hamedani [26]. In this regard, we characterize the proposed model by the HRF and truncated moments, and characterizing conditions are defined as follows.
Proposition 3.
The RV has continuous PDF if and only if the HRF satisfies the following equation:
Proof.
According to definition of the HRF, given by the first equality in Equation (8), it follows:
Thus, the statement of proposition immediately follows. □
Proposition 4.
The RV has UED if and only if the HRF , defined by Equation (8), satisfies the following equation:
Proof.
Necessity: Assume that , with the PDF , defined by Equation (3). Then, logarithm of this PDF, at the same way as in SubSection 2.1.3, can be expressed as:
Differentiating both sides of this equality with respect to we get:
Thus, according to Equations (8) and (9), it follows:
which after certain simplification yields Equation (10).
Sufficiency: Suppose that Equation (10) holds. After integration, it can be rewritten as follows:
that is
From the above equation, we obtain the HRF as in Equation (8). Further, replacing this function in Equation (9) and after integration, we obtain:
that is
Another integration implies that:
whereby from the conditions and , the constants and are obtained. Thus, the function is indeed the CDF from , which completes the proof. □
The following theorem was used in [27], as well as [24,25], in order to characterize different univariate continuous distributions.
Theorem 1.
Let be a given probability space and let be an interval for some , where and might as well be allowed. Also, let be a continuous RV with CDF , and , be two real functions defined on and such that:
is defined with some real function . Assume that and is a twice continuously differentiable and strictly monotone function on the set . Finally, assume that equation has no real solution in the interior of . Then, is uniquely determined by the functions and , as follows:
where the function is a solution of the differential equation:
and C is a constant such that
Now, we discuss the characterization of the UED based on Theorem 1 and some simple relationship between two functions and the RV .
Proposition 5.
Let be a continuous RV and
The RV X has a PDF defined by Equation (3) if and only if there exists the function , defined as in Theorem 1, that satisfies the differential equation:
Proof.
Necessity: For the RV , with the CDF and PDF given by Equations (2) and (3), respectively, after certain computation, we obtain:
where and . This implies:
that is:
Hence, the differential Equation (13) clearly holds.
Sufficiency: If the function satisfies the differential Equation (13), then it follows:
so one can take:
According to the previous proposition, one immediately obtains:
3. Estimation Procedure
Let us assume that , …, are observed values of the sample of size n, taken from the . We propose the maximum likelihood method for estimating the couple of parameters . This means that the estimates of those parameters as the ones that maximize the likelihood function:
As is known, this solution also corresponds to the one that maximizes the log-likelihood function, i.e.,
By differentiating function l with respect to each parameter, the estimators of and can be obtained by solving the coupled equations:
From the first equation, we obtain:
and by replacing this output in the second coupled equation, we get:
Obviously, the last equation has only as an unknown parameter. Now, by denoting , i = 1, …, n, and
by applying the L’Hopital’s rule, one obtains:
On the other hand, assuming that , it follows:
Hence, equation has at least one solution, and it can be solved numerically, for instance, by using Newton-Raphson algorithm. This task may be performed using the function ’uniroot’ available in statistical programming software "R". Once is estimated, this output can be used for estimating .
For computing interval estimators for and testing hypotheses on these parameters, we get the observed matrix information:
where
Note that is a consistent estimator of the expected Fisher information matrix (see, e.g., [28]). Under some suitable conditions, the approximation to a normal distribution holds, and more general
for any vector . Choosing , we get the confidence interval:
where and is the quantile of the standard normal distribution.
4. Model Compatibility and Its Application to the Real-World Data
Here, the possibility of applying the UED model in terms of modelling empirical distributions of some real-world processes is discussed in more detail. To that end, by using several typical statistical indicators, the quality of fitting with the UED was additionally checked. The obtained results were also compared with the results of fitting using some of the previously known unit interval probability distributions, which additionally checked the possibility of applying the UED.
4.1. Measures of Goodness-of-Fit
In order to test the null hypothesis , where is the empirical CDF and is the CDF of some specified (theoretical) distribution, usually some well-known statistical tests are used. In order to test the hypothesis that some real-world data are taken from the UED, that is from some other stochastic distribution, the following statistical tests are used here:
- Kolmogorov Smirnov (KS) test, whose test-statistics is defined as:where k denotes the number of classes and are the values of the theoretical CDF.
- Anderson–Darling (AD)-test usually attaches more mass to the distributions tails, and its test-statistics is:
- Cramér–von Mises (CVM)-test is derived version of the KS test, with test-statistics: defined as
Additionally, in order to check the quality of fitting certain real-world data using the UED, that is, some other distribution, the following indicators were used:
- Akaike information criterion (AIC), defined aswhere m denote the number of parameters.
- Corrected Akaike information criterion (AICc), expressed as
- Bayesian information criterion (BIC), which is defined as
- Hannan-Quinn information criterion (HQIC) expressed as
- Consistent Akaike information criterion (CAIC) given as
- Vuong test is also used for model selection purposes.
4.2. Comparative Models
We also compare the proposed UED model with well known unit interval models, defined by the following PDFs:
In order to compare the fitting results, we consider four different real-world datasets, classified into two sections: i) environmental and ii) engineering. The results obtained from the statistical analysis of these datasets are discussed below.
4.3. Environmental Datasets
Datasets I and II. The first two datasets are reported by Maiti [33], and they represent the following measured values:
- - Soil moisture (Dataset I): 0.0179, 0.0798, 0.0959, 0.0444, 0.0938, 0.0443, 0.0917, 0.0882, 0.0439, 0.049, 0.0774, 0.0171, 0.0305, 0.0757, 0.0468,
- - Permanent wilting points-PWP (Dataset II): 0.0821, 0.0561, 0.0202, 0.051, 0.0041, 0.0226, 0.0556, 0.0829, 0.0062, 0.0695, 0.0557, 0.0243, 0.0083, 0.0532, 0.0118.
In this regard, we have compiled both descriptive and theoretical (UED) statistics, listed in Tables-1 and -2, respectively. Note that descriptive statistics of all data sets includes sample size (SS), mean, median, standard deviations (SD), skewness (SK) and kurtosis (KU).
In addition, the total test time (TTT) plot, introduced in [34], is portrayed in Figure 3 for both datasets. Notice that, in particular, the TTT plot indicates the empirical HRF, portraying an IFR. Tables 1 and 2 also reveal that the theoretical UED statistics as well as the observed descriptive statistics show remarkable closeness to each other and it appears that both sets of data can be simulated by the proposed model. Furthermore, it is evident from Figure 4 that both data sets do not contain any outliers.

Table 1.
Descriptive statistics for Datasets I and II.
| Dataset | SS | Mean | Median | SD | SK | KU |
|---|---|---|---|---|---|---|
| I | 15 | 0.0598 | 0.0490 | 0.0277 | -0.1083 | 1.6247 |
| II | 15 | 0.0402 | 0.0510 | 0.0277 | 0.1083 | 1.6247 |
Table 2.
Theoretical statistics from the UED.
| Dataset | SS | Mean | Median | SD | SK | KU |
|---|---|---|---|---|---|---|
| I | 15 | 0.0606 | 0.0621 | 0.0254 | -0.2107 | 2.3825 |
| II | 15 | 0.0406 | 0.0384 | 0.0247 | 0.2942 | 2.3050 |
Table 3(a) portrays that the model proposed by the UED is the best strategy for analyzing the observed Dataset I, in relation to all other distributions of unit intervals. Namely, although the p-value of the KS statistics for KwD is the highest, the other non-parametric tests, CVM and AD, indicate that for the UED is obtained a minimum tested values. Also, based on the estimated values of Vuong statistics, given in Table 5, the KwD and UED has an indecisive status. Thus, the UED is the best strategy, which is also confirmed by Figure 5. Similarly, Table 3(b) portrays that the proposed UED model is also one of the best strategy for the analysis Dataset II, from all aspects.Namely, the test statistics, including KS, CVM and AD, have the lowest values compared to all the selected, previously known interval models. In addition, the Vuong statistic, which compares models based on the likelihood ratio phenomenon, openly supports the UED. Finally, Figure 5 also confirms our claim that the UED is the best strategy. Moreover, Tables-4(a) and -4(b) yield least values of information criterion values for the UED comparing to the competing models.
Table 3.
(a): ML estimates and goodness-of-fit statistics for Dataset I, (b): MLEs and goodness-of-fit statistics for Dataset II.
Table 3.
(a): ML estimates and goodness-of-fit statistics for Dataset I, (b): MLEs and goodness-of-fit statistics for Dataset II.
| (a) | ||||||
|---|---|---|---|---|---|---|
| Distribution | CVM | AD | KS | p-value | ||
| UED | 18.4218 | 0.0773 | 0.6239 | 0.1026 | 0.2079 | 0.5361 |
| BD | 3.8233 | 60.2492 | 0.6858 | 0.1041 | 0.2099 | 0.5232 |
| KwD | 719.3842 | 2.4408 | 0.6887 | 0.1109 | 0.2003 | 0.5844 |
| JSBD | 4.9859 | 1.7279 | 0.7751 | 0.1117 | 0.2128 | 0.5056 |
| UGoMD | 1.6525 | 0.0048 | 1.0587 | 0.1613 | 0.2353 | 0.3769 |
| (b) | ||||||
| Distribution | CVM | AD | KS | p-value | ||
| UED | 11.8676 | 0.4607 | 0.6239 | 0.1096 | 0.1960 | 0.6118 |
| BD | 1.5370 | 36.8071 | 0.6869 | 0.1199 | 0.2481 | 0.3142 |
| KwD | 78.9162 | 1.4011 | 0.7074 | 0.1224 | 0.2409 | 0.3487 |
| JSBD | 3.5837 | 1.0177 | 0.8112 | 0.1364 | 0.2619 | 0.2549 |
| UGoMD | 0.9497 | 0.0219 | 0.9011 | 0.1499 | 0.2386 | 0.3603 |
Table 4.
(a): Estimates of the maximum log-likelihood and information criteria for Dataset I, (b): Estimates of the maximum log-likelihood and information criteria for Dataset II.
Table 4.
(a): Estimates of the maximum log-likelihood and information criteria for Dataset I, (b): Estimates of the maximum log-likelihood and information criteria for Dataset II.
| (a) | ||||||
|---|---|---|---|---|---|---|
| Distribution | AIC | AICC | BIC | HQIC | CAIC | |
| UED | 33.8617 | -63.7233 | -62.7233 | -62.3072 | -63.7384 | -60.3072 |
| BD | 32.8026 | -61.6052 | -60.6052 | -60.1891 | -61.6203 | -58.1891 |
| KwD | 33.3796 | -62.7592 | -61.7592 | -61.3431 | -62.7743 | -59.3431 |
| JSBD | 32.0631 | -60.1262 | -59.1262 | -58.7101 | -60.1413 | -56.7101 |
| UGoMD | 29.6463 | -55.2925 | -54.2925 | -53.8764 | -55.3076 | -51.8764 |
| (b) | ||||||
| Distribution | AIC | AICC | BIC | HQIC | CAIC | |
| UED | 35.2604 | -66.5208 | -65.5208 | -65.1047 | -66.5359 | -63.1047 |
| BD | 34.1097 | -64.2194 | -63.2194 | -62.8033 | -64.2345 | -60.8033 |
| KwD | 34.3392 | -64.6784 | -63.6784 | -63.2623 | -64.6935 | -61.2623 |
| JSBD | 33.0448 | -62.0896 | -61.0896 | -60.6735 | -62.1047 | -58.6735 |
| UGoMD | 31.1648 | -58.3296 | -57.3296 | -56.9135 | -58.3447 | -54.9135 |
Table 5.
Vuong test statistics for Datasets I and II.
| Models | Dataset I | Suitability | Dataset II | Suitability |
|---|---|---|---|---|
| UED-BD | 1.4601 | UED | 2.5935 | UED |
| UED-KwD | 0.9738 | Indecisive | 3.4585 | UED |
| UED-JSBD | 1.5427 | UED | 1.6793 | UED |
| UED-UGoMD | 2.2142 | UED | 1.5955 | UED |
4.4. Engineering Datasets
Datasets III and IV. The third and fourth datasets have been firstly introduced and studied in [35] for Burr measurements on the iron sheets. For the third dataset of 50 observations on Burr (in the unit of millimetres), the hole diameter is 12 mm and the sheet thickness is 3.15 mm. For the fourth dataset of 50 observations, hole diameter and sheet thickness are 9 mm and 2 mm, respectively. Hole diameter readings are taken on jobs with respect to one hole, selected and fixed as per a predetermined orientation. These two datasets refer to two different machines being compared, and one can see [35] on the technical details of measuring the data sets. Note that both data sets were also analyzed in [36,37,38], and [19]. The descriptive statistics of these datasets, as well as the corresponding theoretical statistics for the UED, are presented in the following Tables 6 and 7, respectively. The TTT plot and box-plots of the observed data are given in Figure 6 and Figure 7, respectively. It can be observed that Dataset-III & -IV are positively skewed and platykurtic in nature, which is confirmed by Tables 6 and 7. In addition, from Figure 7 is evident that the empirical and theoretical aspects of these datasets, in terms of the absence of outliers, are in close agreement and indicate that the proposed model can be used effectively. Such findings are also consolidated within Table 8(a) and 8(b), which show that the UED exhibits minimal values in the almost all cases of goodness-of-fit statistics, which ensure that the UED is one of the best strategy.
Table 6.
Descriptive statistics for Datasets III and IV.
| Dataset | SS | Mean | Median | SD | SK | KU |
|---|---|---|---|---|---|---|
| III | 50 | 0.1632 | 0.1600 | 0.0810 | 0.0723 | 2.2166 |
| IV | 50 | 0.1520 | 0.1600 | 0.0785 | 0.0061 | 2.3012 |
Table 7.
Theoretical statistics from the UED.
| dataset | SS | Mean | Median | SD | SK. | KU. |
|---|---|---|---|---|---|---|
| III | 50 | 0.1633 | 0.1641 | 0.0809 | 0.0259 | 2.2511 |
| IV | 50 | 0.1519 | 0.1521 | 0.0777 | 0.0262 | 2.2521 |
Table 8.
(a): MLEs and goodness-of-fit statistics for Dataset III, (b): MLEs and goodness-of-fit statistics for Dataset IV
Table 8.
(a): MLEs and goodness-of-fit statistics for Dataset III, (b): MLEs and goodness-of-fit statistics for Dataset IV
| (a) | ||||||
|---|---|---|---|---|---|---|
| Distribution | CVM | AD | KS | p-value | ||
| UED | 4.7879 | 0.1756 | 0.3274 | 0.0419 | 0.1242 | 0.9881 |
| BD | 2.6824 | 13.8640 | 0.1538 | 0.9120 | 0.1414 | 0.5555 |
| KwD | 1.0746 | 0.0925 | 12.2879 | 2.3943 | 0.7222 | 0.0000 |
| JSBD | 2.3767 | 1.3175 | 0.2495 | 1.4647 | 0.1740 | 0.0968 |
| UGoMD | 0.0924 | 1.0747 | 0.5213 | 3.0810 | 0.2046 | 0.0304 |
| (b) | ||||||
| Distribution | CVM | AD | KS | p-value | ||
| UED | 4.8518 | 0.1996 | 0.3224 | 0.0339 | 0.1239 | 0.9928 |
| BD | 2.4003 | 13.5218 | 0.2871 | 1.5649 | 0.1981 | 0.7340 |
| KwD | 1.9606 | 31.3769 | 0.2093 | 1.2683 | 0.1691 | 0.8825 |
| JSBD | 2.3682 | 1.2374 | 0.4145 | 2.2458 | 0.2285 | 0.5579 |
| UGoMD | 0.0916 | 1.0250 | 0.6091 | 3.4278 | 0.2312 | 0.5426 |
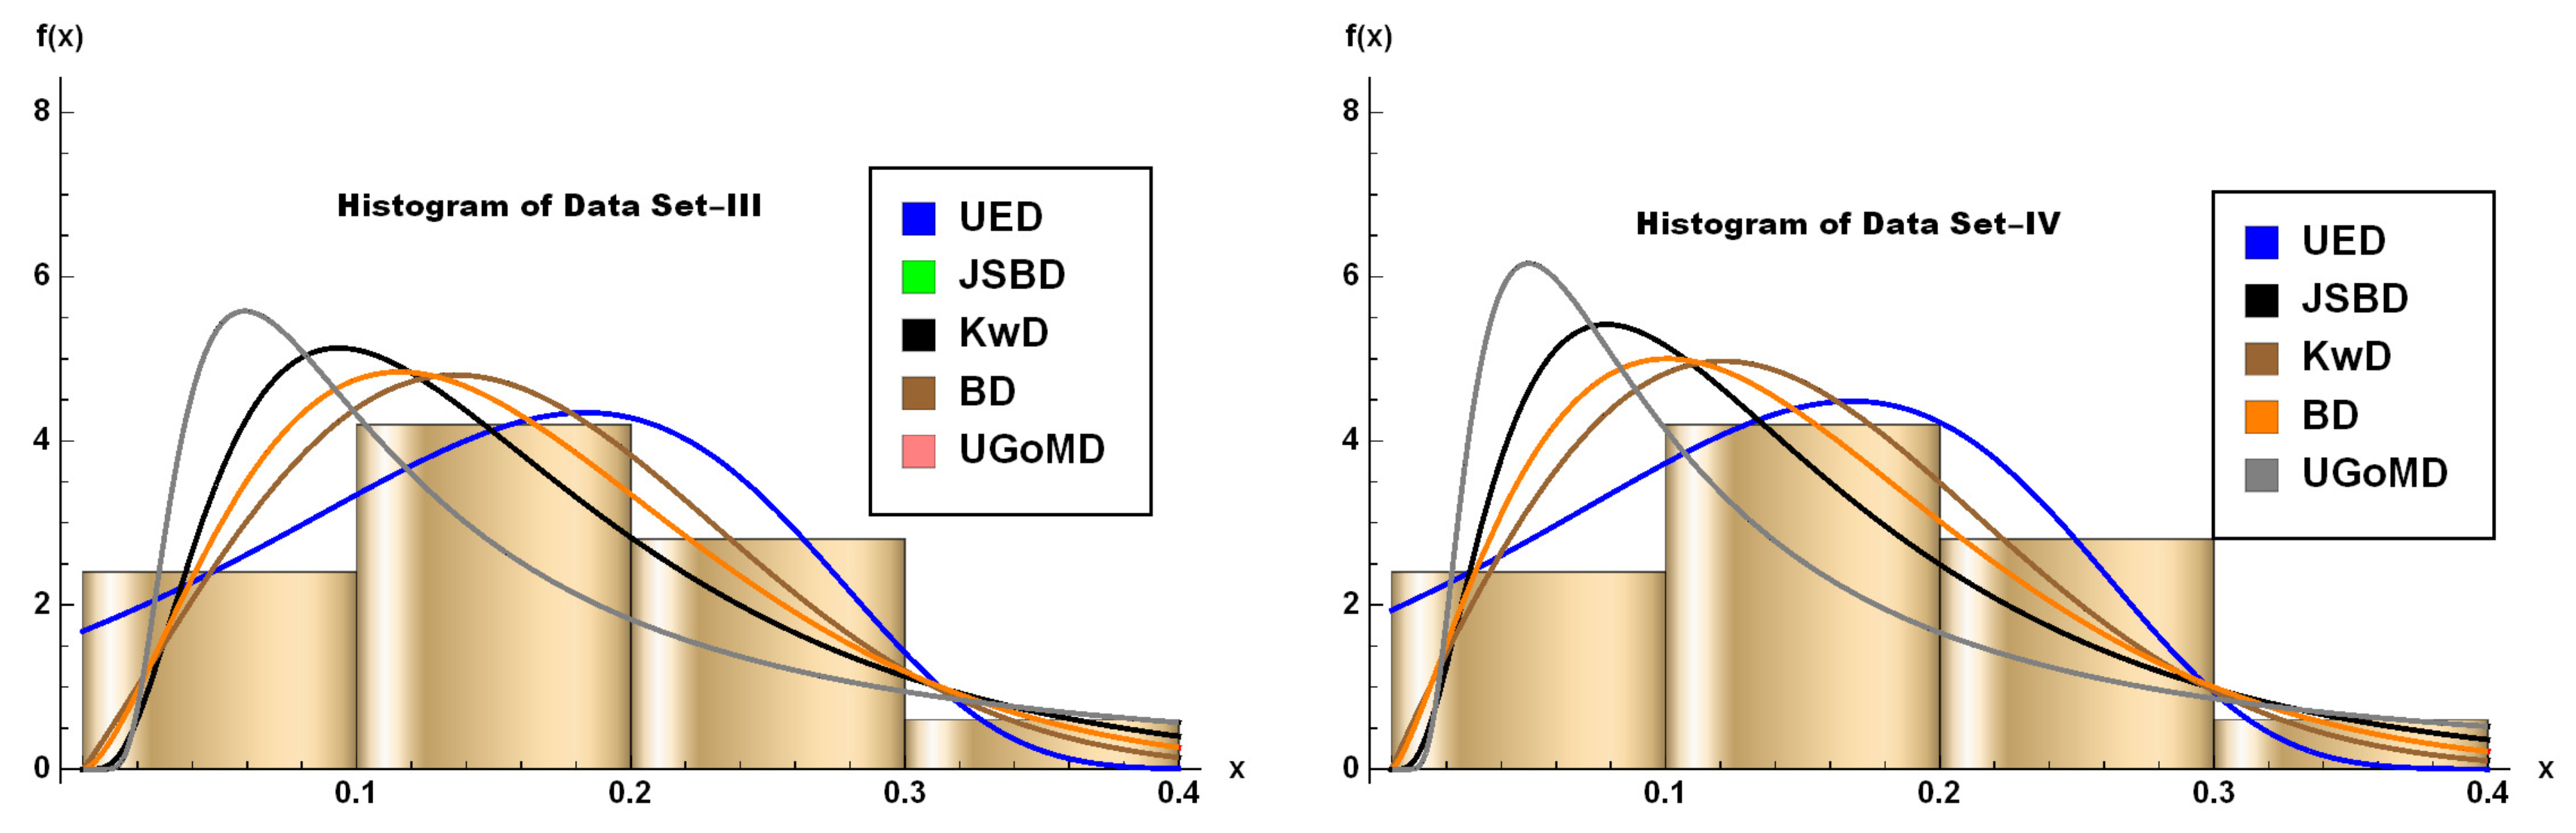
However, likelihood aspects and information criterion values also favour the proposed UED model, which can be visualized in Tables 9(a) and 9(b), respectively. Furthermore, the shape of our proposed model, as shown in Figure 8, matches the data in a better way compared to the other competing models. Finally, Vuong statistics as depicted in Table-10 also show the capability of the proposed model.
Table 9.
(a): Estimates of the maximum log-likelihood and information criteria for Dataset III, (b): Estimates of the maximum log-likelihood and information criteria for Dataset IV.
Table 9.
(a): Estimates of the maximum log-likelihood and information criteria for Dataset III, (b): Estimates of the maximum log-likelihood and information criteria for Dataset IV.
| (a) | ||||||
|---|---|---|---|---|---|---|
| Distribution | AIC | AICC | BIC | HQIC | CAIC | |
| UED | -57.0712 | -110.142 | -109.887 | -106.318 | -108.686 | -104.318 |
| BD | -54.6066 | -105.213 | -104.958 | -101.389 | -103.757 | -99.3892 |
| KwD | -56.0686 | -108.137 | -107.882 | -104.313 | -106.681 | -102.313 |
| JSBD | - 51.3231 | -98.6462 | -98.3909 | -94.8222 | -97.19 | -92.8222 |
| UGoMD | -40.672 | -77.344 | -77.0887 | -73.52 | -75.8878 | -71.52 |
| (b) | ||||||
| Distribution | AIC | AICC | BIC | HQIC | CAIC | |
| UED | -59.3536 | -114.707 | -114.452 | -110.883 | -113.251 | -108.883 |
| BD | -55.9312 | -107.862 | -107.607 | -104.038 | -106.406 | -102.038 |
| KwD | -57.5214 | -111.043 | -110.788 | -107.219 | -109.587 | -105.219 |
| JSBD | - 52.305 | -100.61 | -100.355 | -96.786 | -99.1538 | -94.786 |
| UGoMD | -42.6099 | -81.2198 | -80.9645 | -77.3957 | -79.7636 | -75.3957 |
Table 10.
Vuong test statistics for Datasets III and IV.
| Models | Dataset III | Suitability | Dataset IV | Suitability |
|---|---|---|---|---|
| UED-BD | 0.4137 | Indecisive | 3.5339 | UED |
| UED-KwD | -2.3203 | KwD | 3.9633 | UED |
| UED-JSBD | 2.1336 | UED | 3.4202 | UED |
| UED-UGoMD | 4.9679 | UED | 4.0306 | UED |
5. Concluding Remarks
We introduced a two-parameter bounded model, which is called as the unit exponential distribution (UED), which is appropriate for modeling skewed and IFR data. Some of its mathematical properties are studied, including moments, quantiles, and other distributional behaviour. A characterization of the UED via HRF is made, which provided the identification requirements of the distribution and thus provided a reliable prediction compared to the well-known unit domain models. The model parameters are estimated by the MLE method. We also provide a guide line to choose the best model by using various goodness-of-fit statistics. Applications of the newly defined distribution exhibits that the proposed models have better modeling abilities than competitive models. For this purpose we have used four datasets in two different disciplines, namely environmental and engineering, and it is found that the proposed strategy, is the best one on unit interval domain.
Author Contributions
Conceptualization, H.B. and T.H.; methodology, H.B., M.T. and N.Q.; software, H.B. and T.H; validation, H.B., M.T. and V.S.; formal analysis, H.B., T.H. and V.S.; data curation, H.B. and T.H.; writing—original draft preparation, H.B, T.H. and V.S.; writing—review and editing, M.T., V.S. and N.Q.; visualization, T.H. and M.T.; supervision, H.B and V.S.; project administration, M.T. and N.Q. All authors have read and agreed to the published version of the manuscript.
Acknowledgments
The authors gratefully acknowledge Princess Nourah bint Abdulrahman University Researchers Supporting Project number (PNURSP2023R376), Princess Nourah bint Abdulrahman University, Riyadh, Saudi Arabia for the financial support for this project.
Conflicts of Interest
The authors declare no conflict of interest.
References
- Fleiss, J.L.; Levin, B.; Paik, M.C. Statistical methods for rates and proportions. 3rd edition, John Wiley & Sons Inc., 1993.
- Gilchrist, W. Statistical Modelling with Quantile Functions. CRC Press, Abingdon, 2000.
- Seber, G. A. F. Statistical Models for Proportions and Probabilities, Springer, 2013.
- Bayes, T. An Essay Towards Solving a Problem in the Doctrine of Chances. By the late Rev. Mr. Bayes, F. R. S. communicated by Mr. Price, in a letter to John Canton, A. M. F. R. SPhil. Trans. R. Soc., 1763, 53, 370–418. [Google Scholar] [CrossRef]
- Leipnik, R. B. Distribution of the Serial Correlation Coefficient in a Circularly Correlated Universe. Ann. Math. Stat. 1947, 18(1), 80–87. [Google Scholar] [CrossRef]
- Johnson, N. Systems of Frequency Curves Derived From the First Law of Laplace. Trabajos de Estadistica 1955, 5, 283–291. [Google Scholar] [CrossRef]
- Jørgensen, B. Proper Dispersion Models. Braz. J. Probab. & Stat. 1997, 11, 89–128. [Google Scholar]
- Kumaraswamy, P. A Generalized Probability Density Function for Double-Bounded Random Processes. J. Hydrol. 1980, 46, 79–88. [Google Scholar] [CrossRef]
- Topp, C. W.; Leone, F. C. A Family of J-Shaped Frequency Functions. J. Amer. Statistical Assoc. 1955, 50(269), 209–219. [Google Scholar] [CrossRef]
- Consul, P. C.; Jain, G. C. On the Log-Gamma Distribution and Its Properties. Statistische Hefte 1971, 12, 100–106. [Google Scholar] [CrossRef]
- Smithson, M.; Shou, Y. CDF-Quantile Distributions for Modelling RVs on the Unit Interval. British J. Math. Stat. Psych. 2017, 70(3), 412–438. [Google Scholar] [CrossRef]
- Nakamura, L. R.; Cerqueira, P. H. R.; Ramires, T. G.; Pescim, R. R.; Rigby, R. A.; Stasinopoulos, D. M. A New Continuous Distribution on the Unit Interval Applied to Modelling the Points Ratio of Football Teams. J. Appl. Stat. 2019, 46, 416–431. [Google Scholar] [CrossRef]
- Ghitany, M. E.; Mazucheli, J.; Menezes, A. F. B.; Alqallaf, F. The Unit-Inverse Gaussian Distribution: A New Alternative to Two-Parameter Distributions on the Unit Interval. Commun. Stat. - Theory Methods, 2019, 48, 3423–3438. [Google Scholar] [CrossRef]
- Altun, E.; Hamedani, G. The Log-Xgamma Distribution With Inference and Application. Journal de la Société Française de Statistique 2018, 159, 40–55. [Google Scholar]
- Mazucheli, J.; Menezes, A. F.; Dey, S. Unit-Gompertz Distribution with Applications. Statistica 2019, 79, 25–43. [Google Scholar] [CrossRef]
- Mazucheli, J.; Menezes, A. F. B.; Chakraborty, S. On the One Parameter Unit-Lindley Distribution and Its Associated Regression Model for Proportion Data. J. Appl. Stat. 46(4), 700–714. [CrossRef]
- Mazucheli, J.; Menezes, A. F. B.; Fernandes, L. B.; de Oliveira, R. P.; Ghitany, M. E. The Unit-Weibull Distribution as an Alternative to the Kumaraswamy Distribution for the Modeling of Quantiles Conditional on Covariates. J. Appl. Stat. 47(6), 954–974. [CrossRef] [PubMed]
- Altun, E. The Log-Weighted Exponential Regression Model: Alternative to the Beta Regression Model. Commun. Stat. - Theory and Methods 2020, 50, 2306–2321. [Google Scholar] [CrossRef]
- Gündüz, S.; Mustafa, Ç.; Korkmaz, M.C. A New Unit Distribution Based on the Unbounded Johnson Distribution Rule: The Unit Johnson SU Distribution. Pak. J. Stat. Oper. Res. 2020, 16(3), 471–490. [Google Scholar] [CrossRef]
- Korkmaz, M. Ç.; Korkmaz, Z. S. The Unit Log–log Distribution: A New Unit Distribution With Alternative Quantile Regression Modeling and Educational Measurements Applications. J. Appl. Stat. 2023, 50(4), 889–908. [Google Scholar] [CrossRef]
- Afify, A.Z.; Nassar, M.; Kumar, D.; Cordeiro, G.M. A new unit distribution: Properties and applications. Electron. J. Appl. Stat., 2022, 15, 460–484. [Google Scholar]
- Dombi, J.; Jónás, T.; Tóth Z., E. The Epsilon Probability Distribution and its Application in Reliability Theory. Acta Polytech. Hung. 2018, 15, 197–216. [Google Scholar]
- Artzner, P.; Delbaen, F.; Eber, J.-M.; Heath, D. Coherent Measures of Risk. Math. Finan. 1999, 9, 203–228. [Google Scholar] [CrossRef]
- Ahsanullah, M.; Shakil, M.; Kibria, B.M.G. Characterizations of Continuous Distributions by Truncated Moment. J. Modern Appl. Statist. Methods 2016, 15, 316–331. [Google Scholar] [CrossRef]
- Ahsanullah, M.; Ghitany, M. E.; Al-Mutairi, D. K. Characterization of Lindley Distribution by Truncated Moments. Commun. Stat. - Theory and Methods 2017, 46, 6222–6227. [Google Scholar] [CrossRef]
- Hamedani, G.G. Characterizations of Univariate Continuous Distributions Based on Truncated Moments of Functions of Order Statistics. Studia Scientiarum Mathematicarum Hungarica, 2010, 47, 462–468. [Google Scholar] [CrossRef]
- lánzel, W. A Characterization Theorem Based on Truncated Moments and Its Application to Some Distribution Families. In: P. Bauer, F. Konecny, W. Wertz (Eds.), Mathematical Statistics and Probability Vol. B, D. Reidel Publishing Company Dordrecht-Holland, 75-–84, 1987.
- Lindsay, B.G.; Li, B. On Second-Order Optimality of the Observed Fisher Information. Ann. Stat. 1997, 25, 2172–2199. [Google Scholar] [CrossRef]
- Akaike, H. A New Look at the Statistical Model Identification. IEEE Transactions on Automatic Control 1974, 9, 716–723. [Google Scholar] [CrossRef]
- Hussain, T.; Bakouch, H.S.; Chesneau, C. A New Probability Model With Application to Heavy-Tailed Hydrological Data. Environ. Ecol. Stat. 2019, 26, 127–151. [Google Scholar] [CrossRef]
- Mustafa, Ç.; Korkmaz, Z.; Korkmaz, S. The Unit Log–log Distribution: A New Unit Distribution With Alternative Quantile Regression Modeling and Educational Measurements Applications. J. Appl. Stat. 2023, 50, 889–908. [Google Scholar] [CrossRef]
- Vuong, Q. H. Likelihood Ratio Tests for Model Selection and Non-Nested Hypotheses. Econometrica 1989, 57, 307–333. [Google Scholar] [CrossRef]
- Maity, R. Statistical Methods in Hydrology and Hydroclimatology. Springer Nature Singapore Pte Ltd., Singapore, 2018.
- Aarset M., V. How to Identify a Bathtub Hazard Rate. IEEE Transactions on Reliability 1987, 36, 106–108. [Google Scholar] [CrossRef]
- Dasgupta, R. On the Distribution of Burr With Applications. Sankhya B 2011, 73, 1–19. [Google Scholar] [CrossRef]
- Dey, S.; Mazucheli, J.; and Anis, M. Estimation of Reliability of Multicomponent Stress–strength for a Kumaraswamy Distribution. Commun. Stat. - Theory and Methods 2017, 46, 1560–1572. [Google Scholar] [CrossRef]
- Dey, S.; Mazucheli, J.; Nadarajah, S. Kumaraswamy Distribution: Different Methods of Estimation. Comput. Appl. Math. 2018, 37(2), 2094–2111. [Google Scholar] [CrossRef]
- ZeinEldin, R. A.; Chesneau, C.; Jamal, F.; Elgarhy, M. Different Estimation Methods for Type I Half-Logistic Topp–Leone Distribution. Mathematics 2019, 7, 985. [Google Scholar] [CrossRef]
Figure 1.
Plots of the PDFs of the UED by varying parameters.
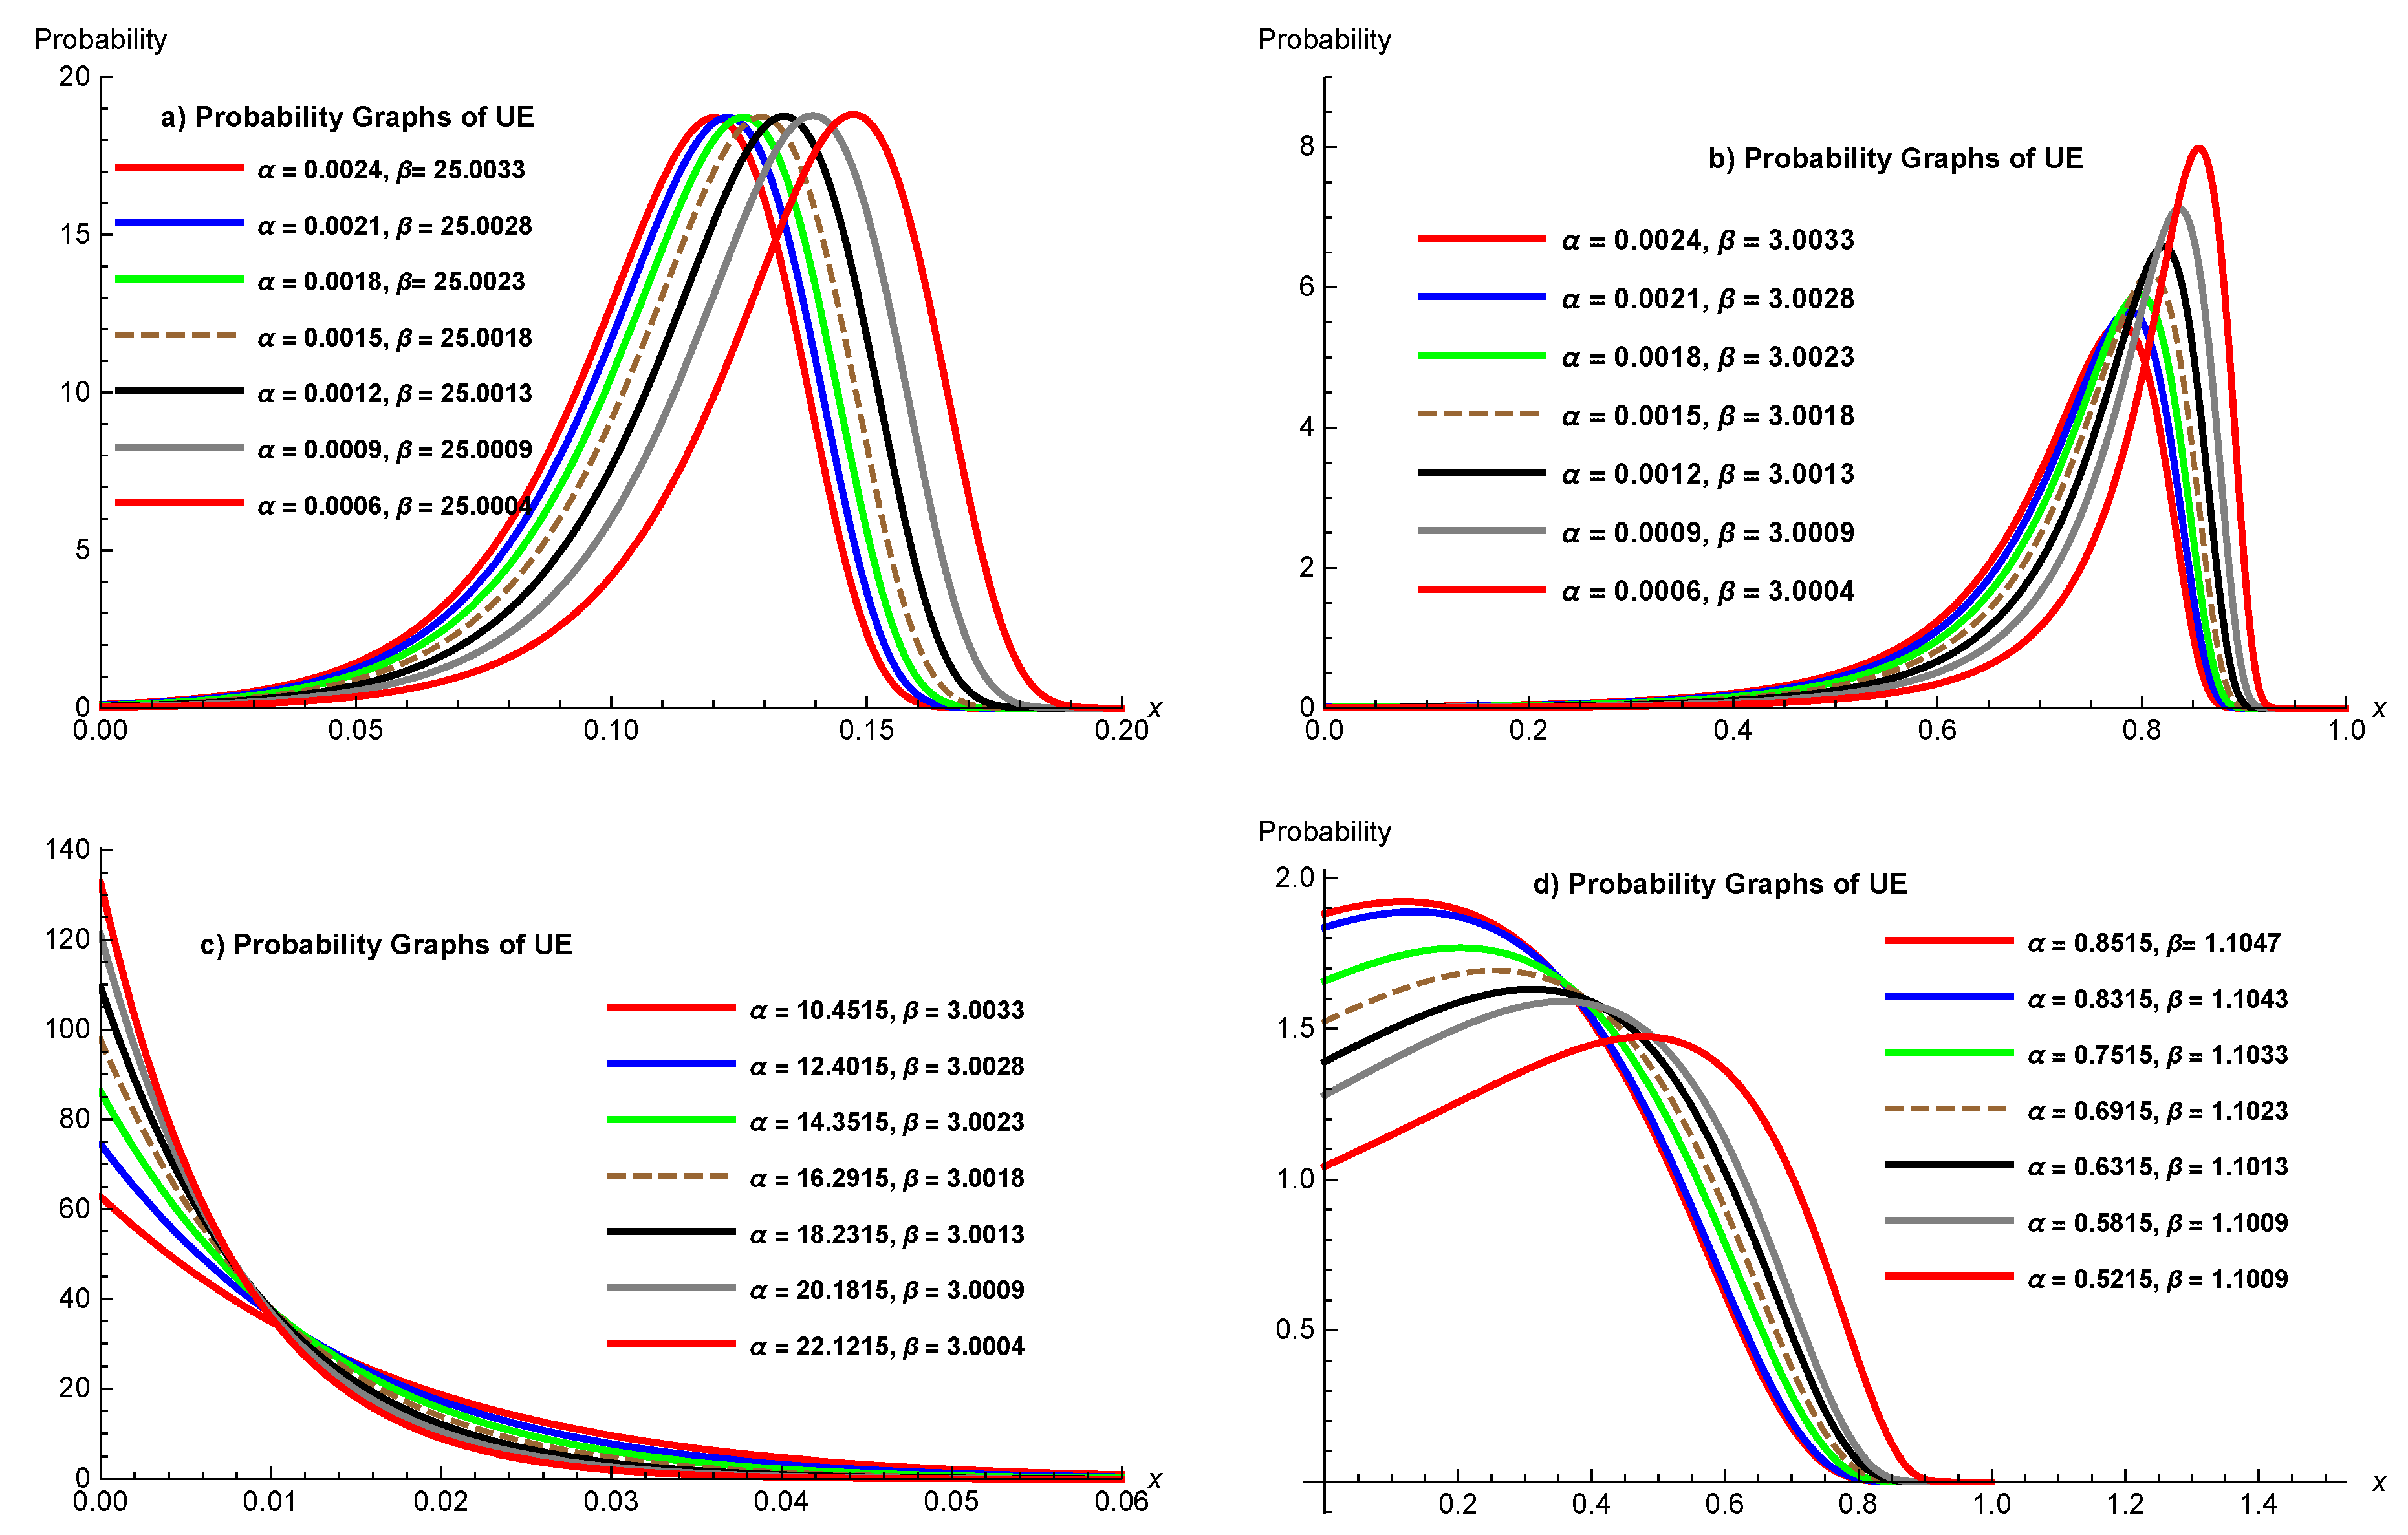
Figure 2.
Plots of the HRFs of the UED by varying parameters.
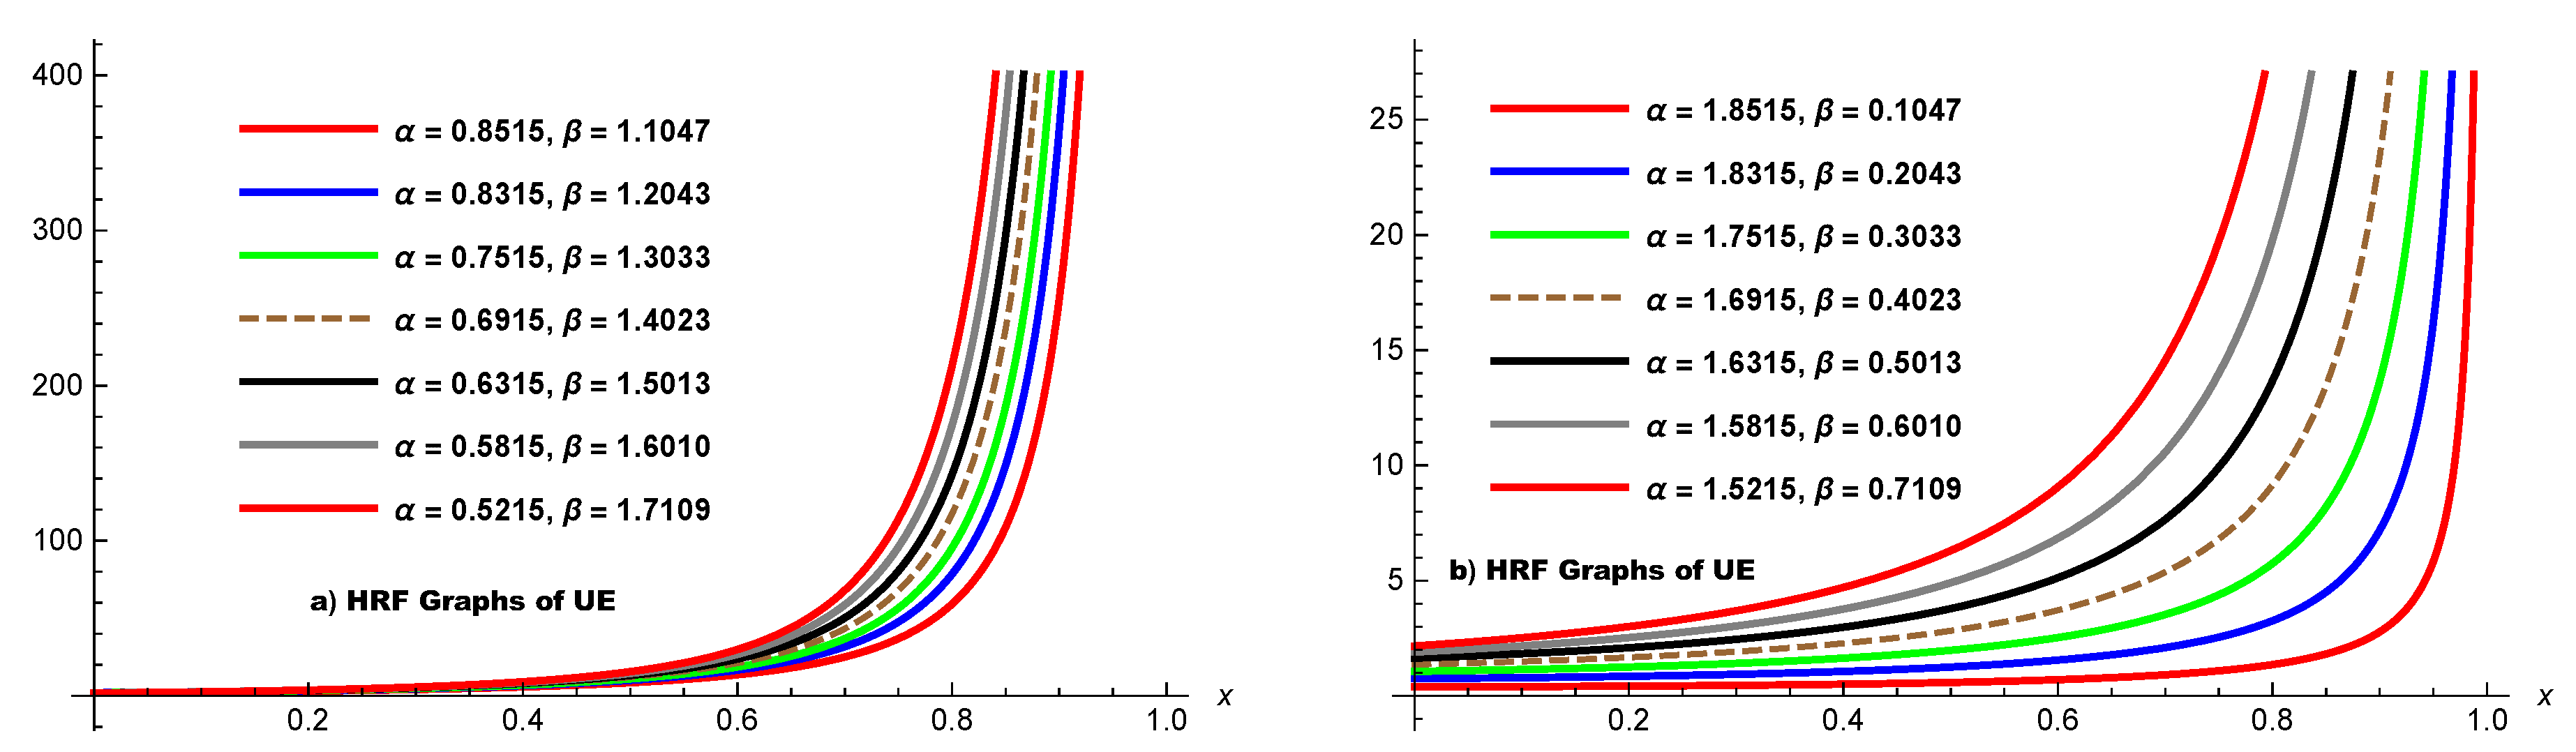
Figure 3.
TTT plots of Datasets I and II.
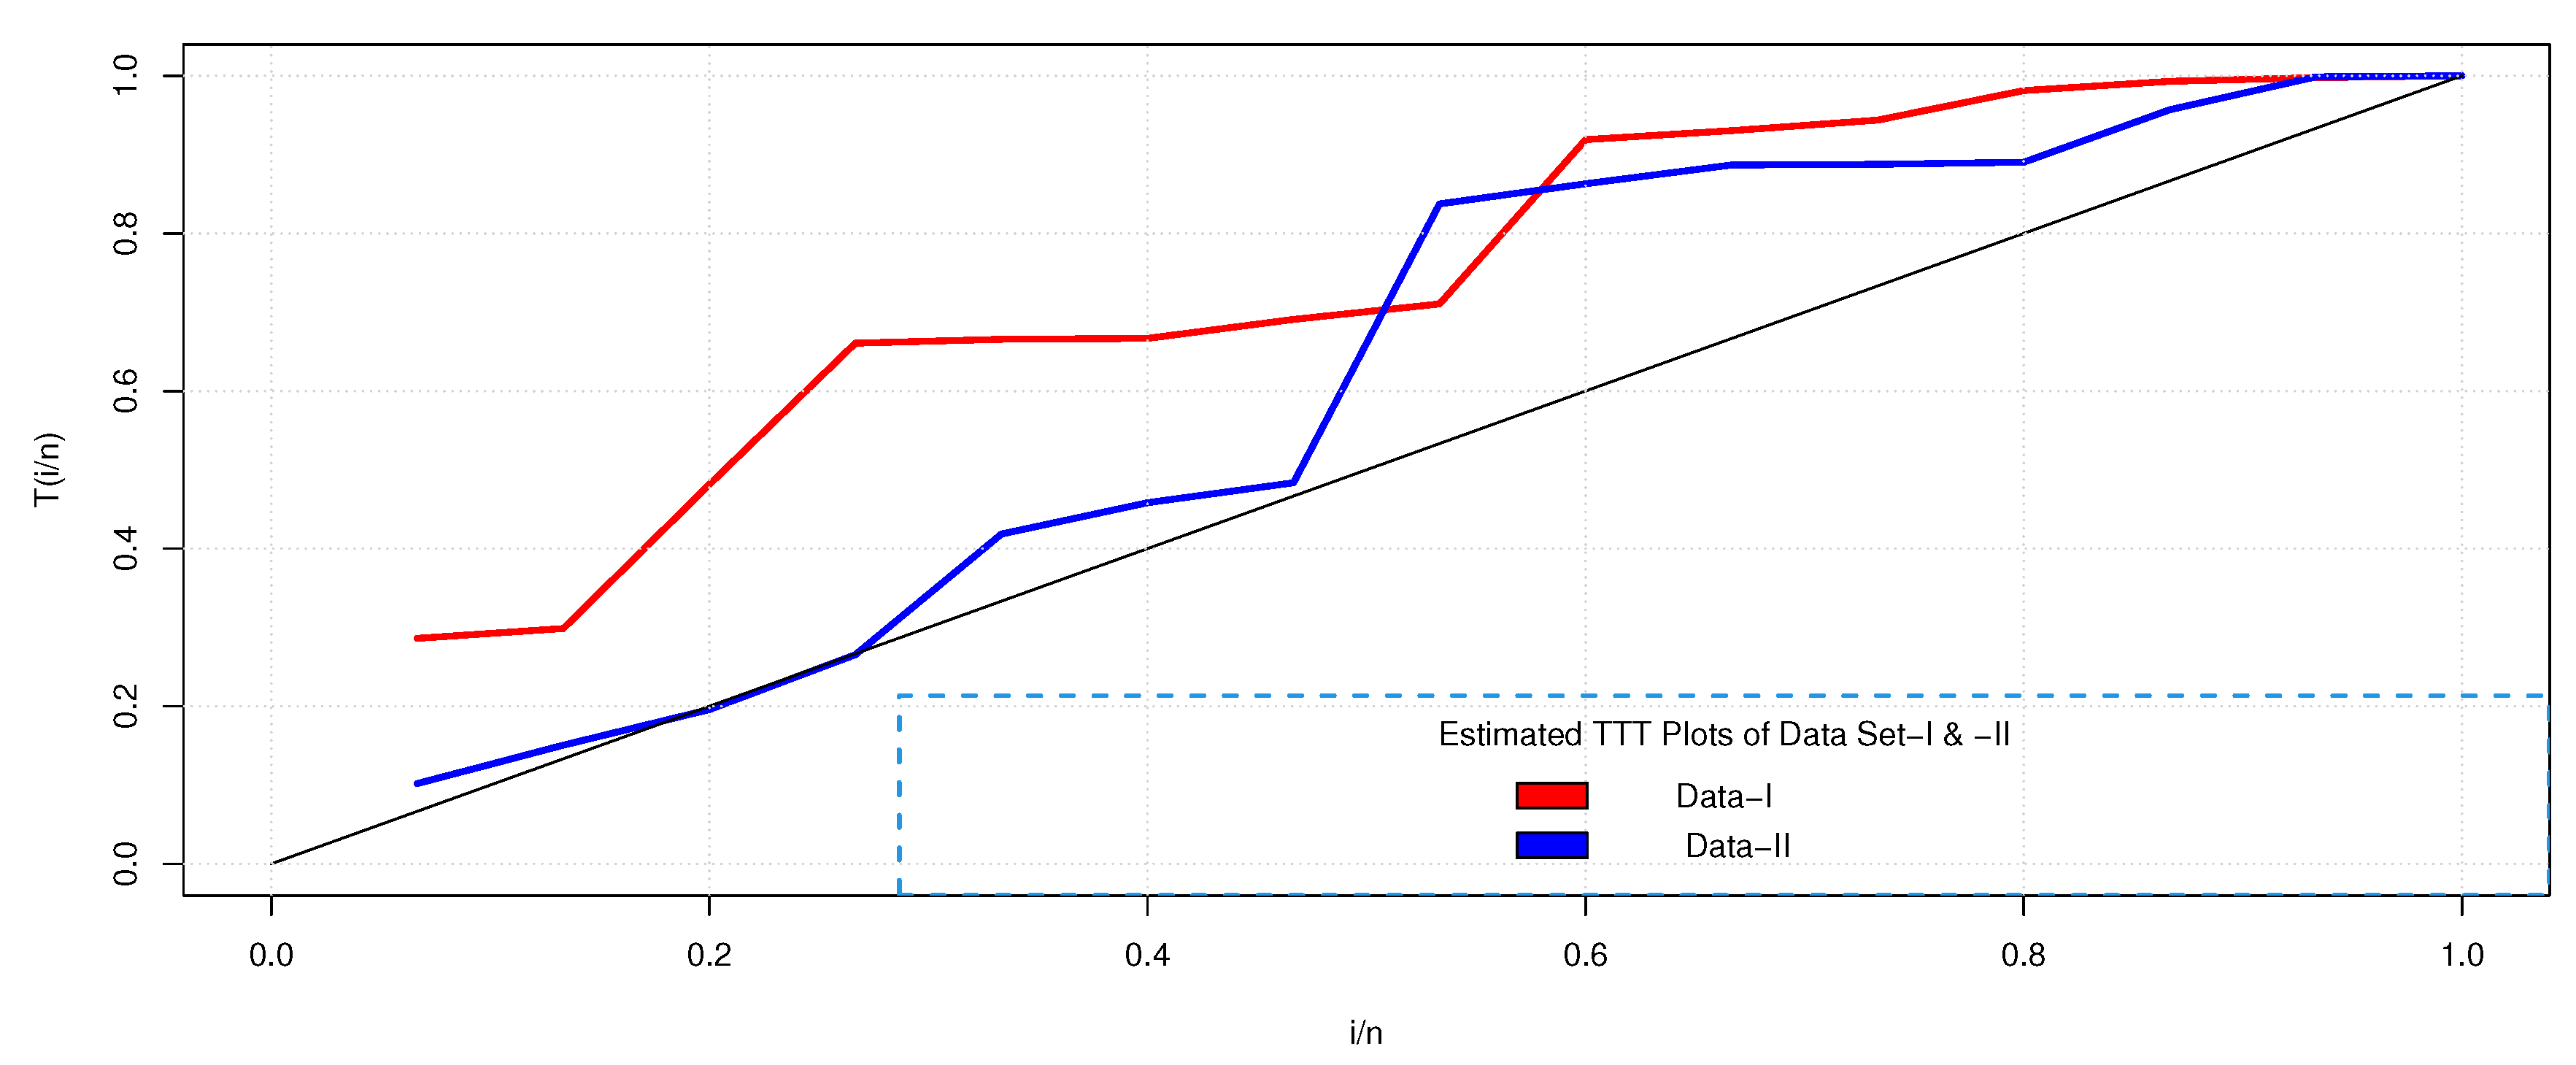
Figure 4.
Box-plots for datasets I and II.
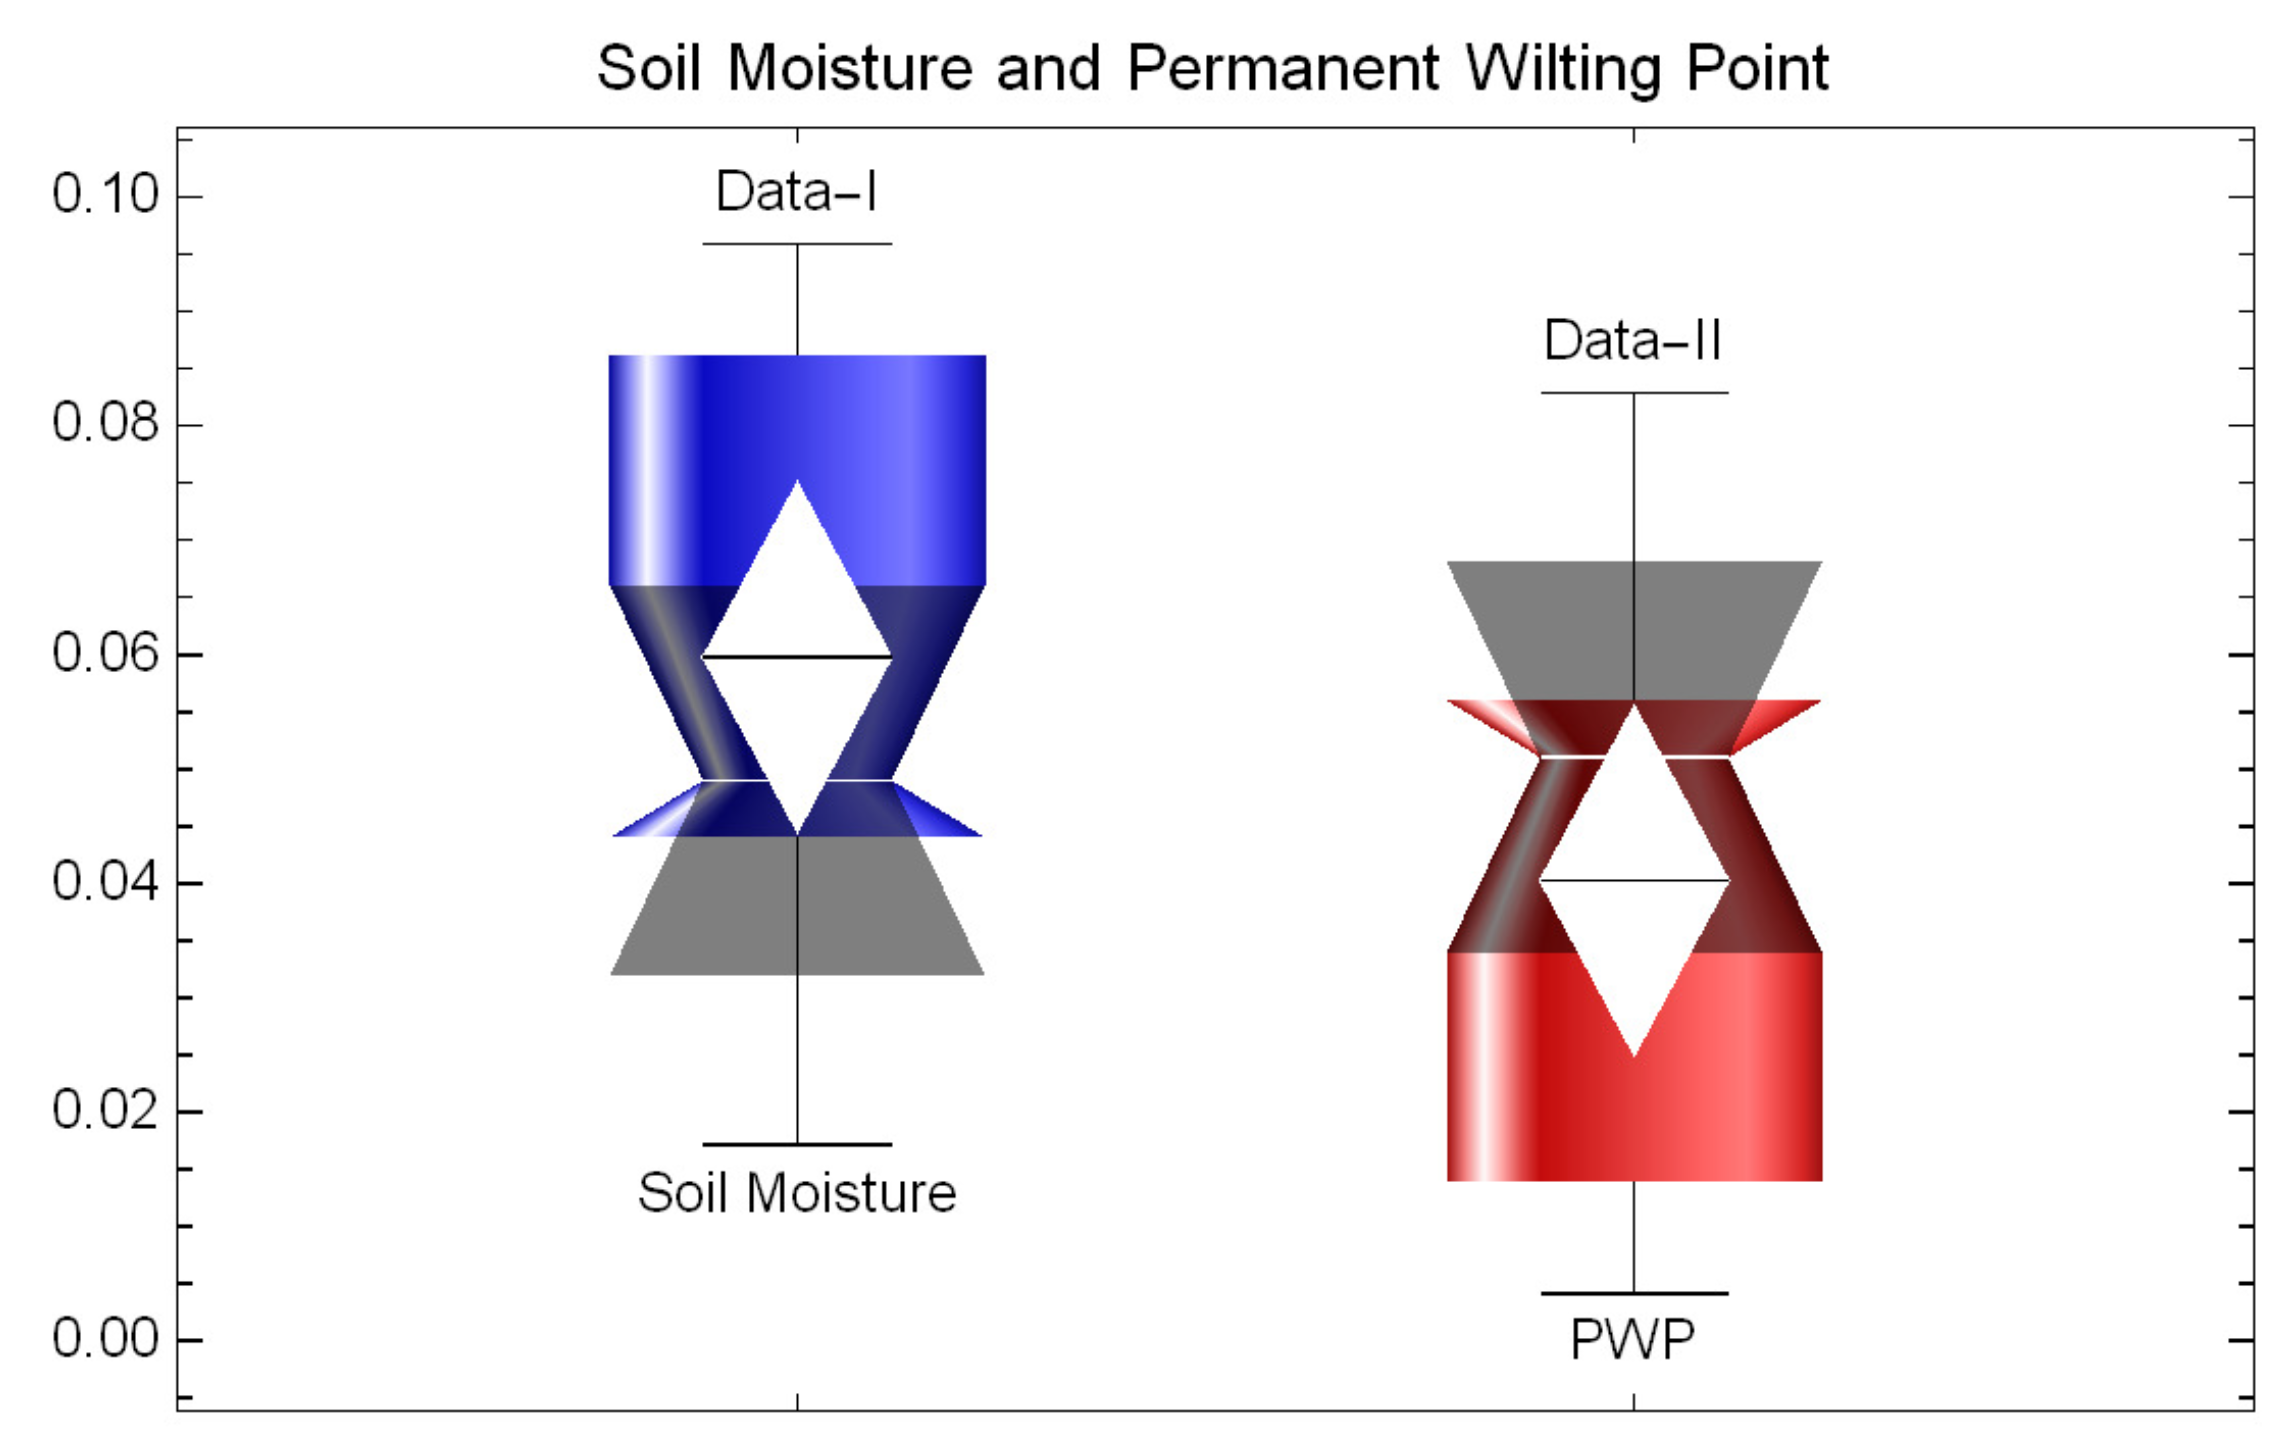
Figure 5.
Datasets I and II (given by histograms) fitted via unit interval distributions (given by lines).
Figure 5.
Datasets I and II (given by histograms) fitted via unit interval distributions (given by lines).
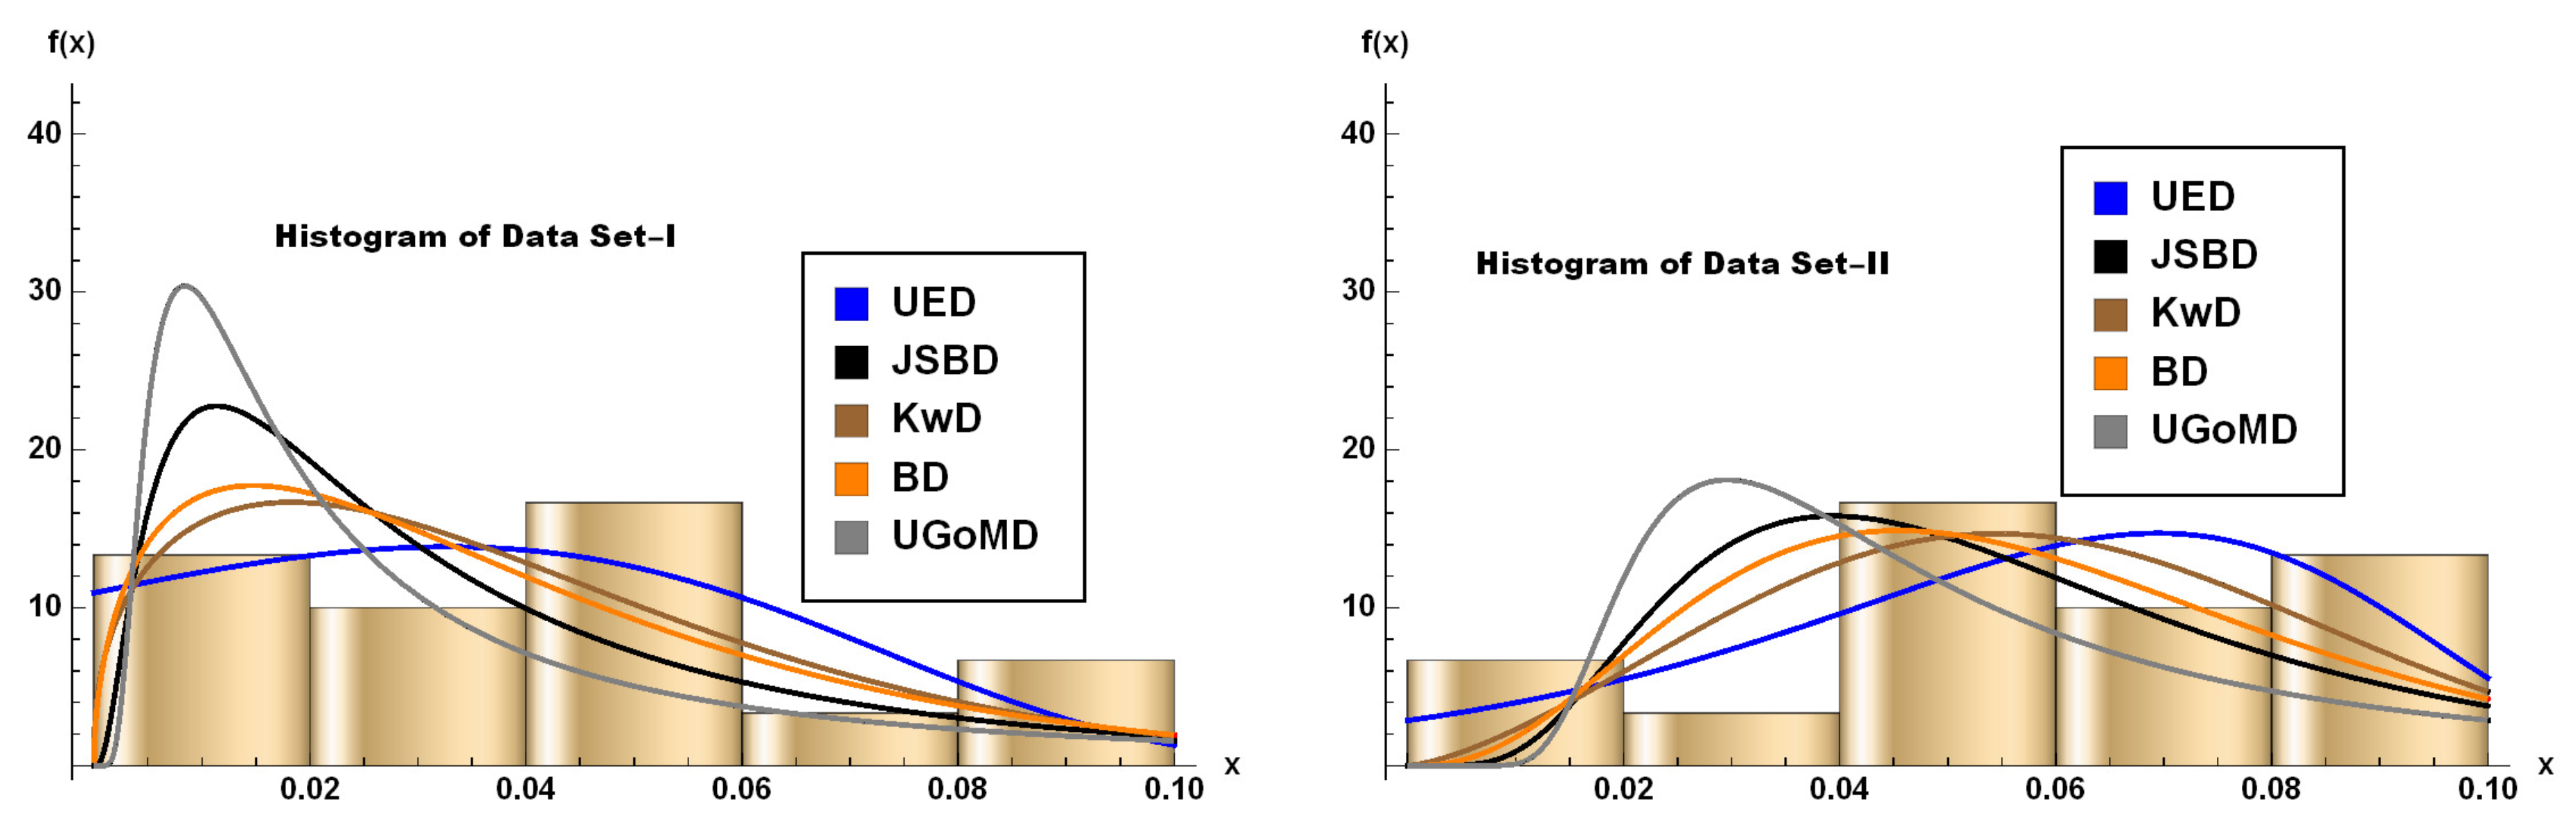
Figure 6.
TTT plots of Datasets III and IV.
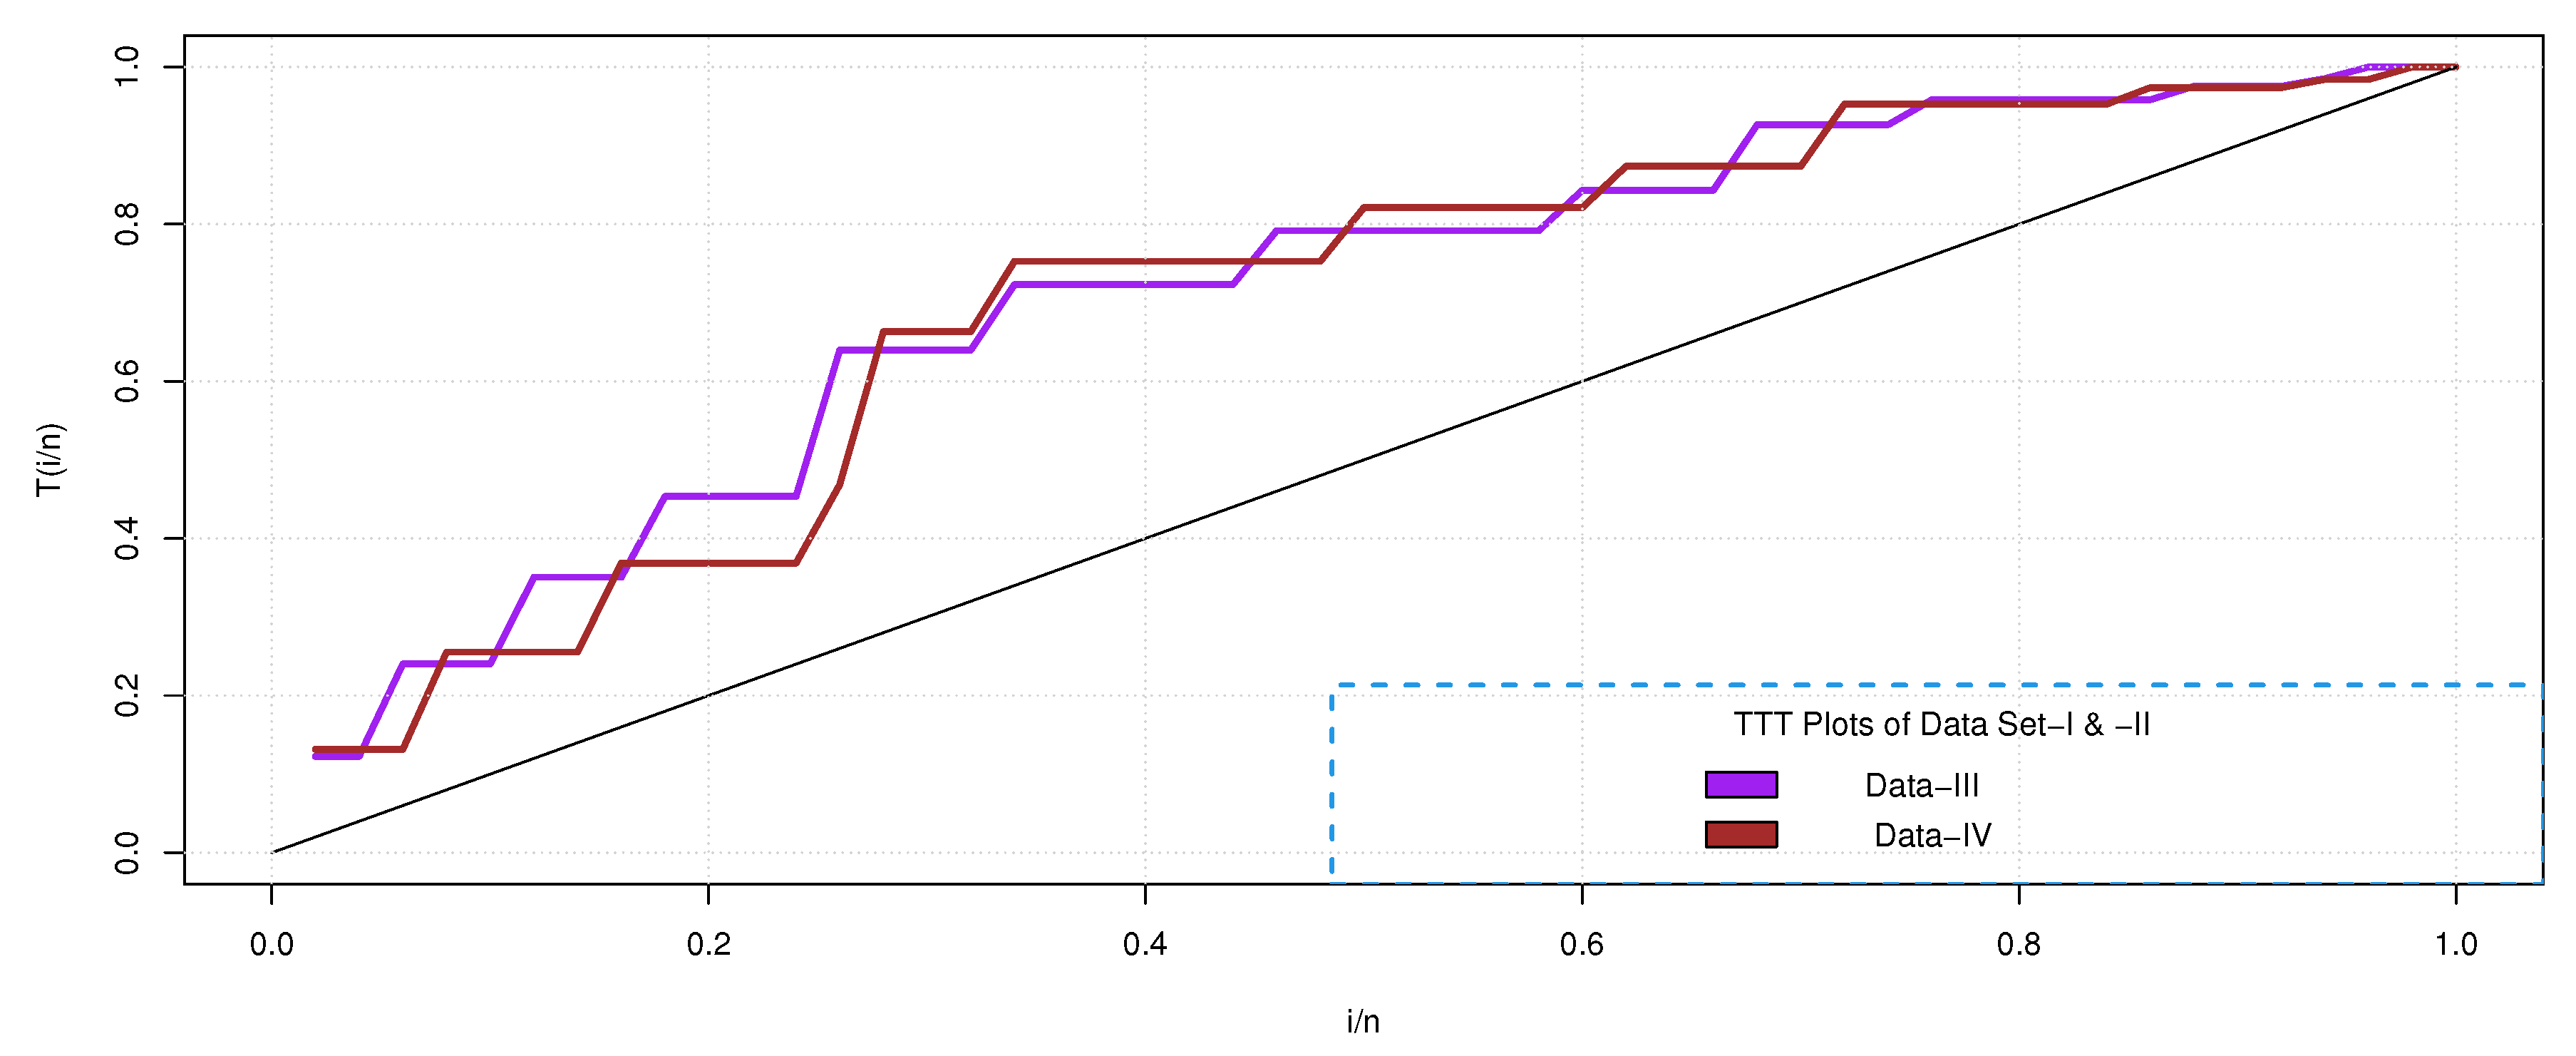
Figure 7.
Box-plots for Datasets III and IV.
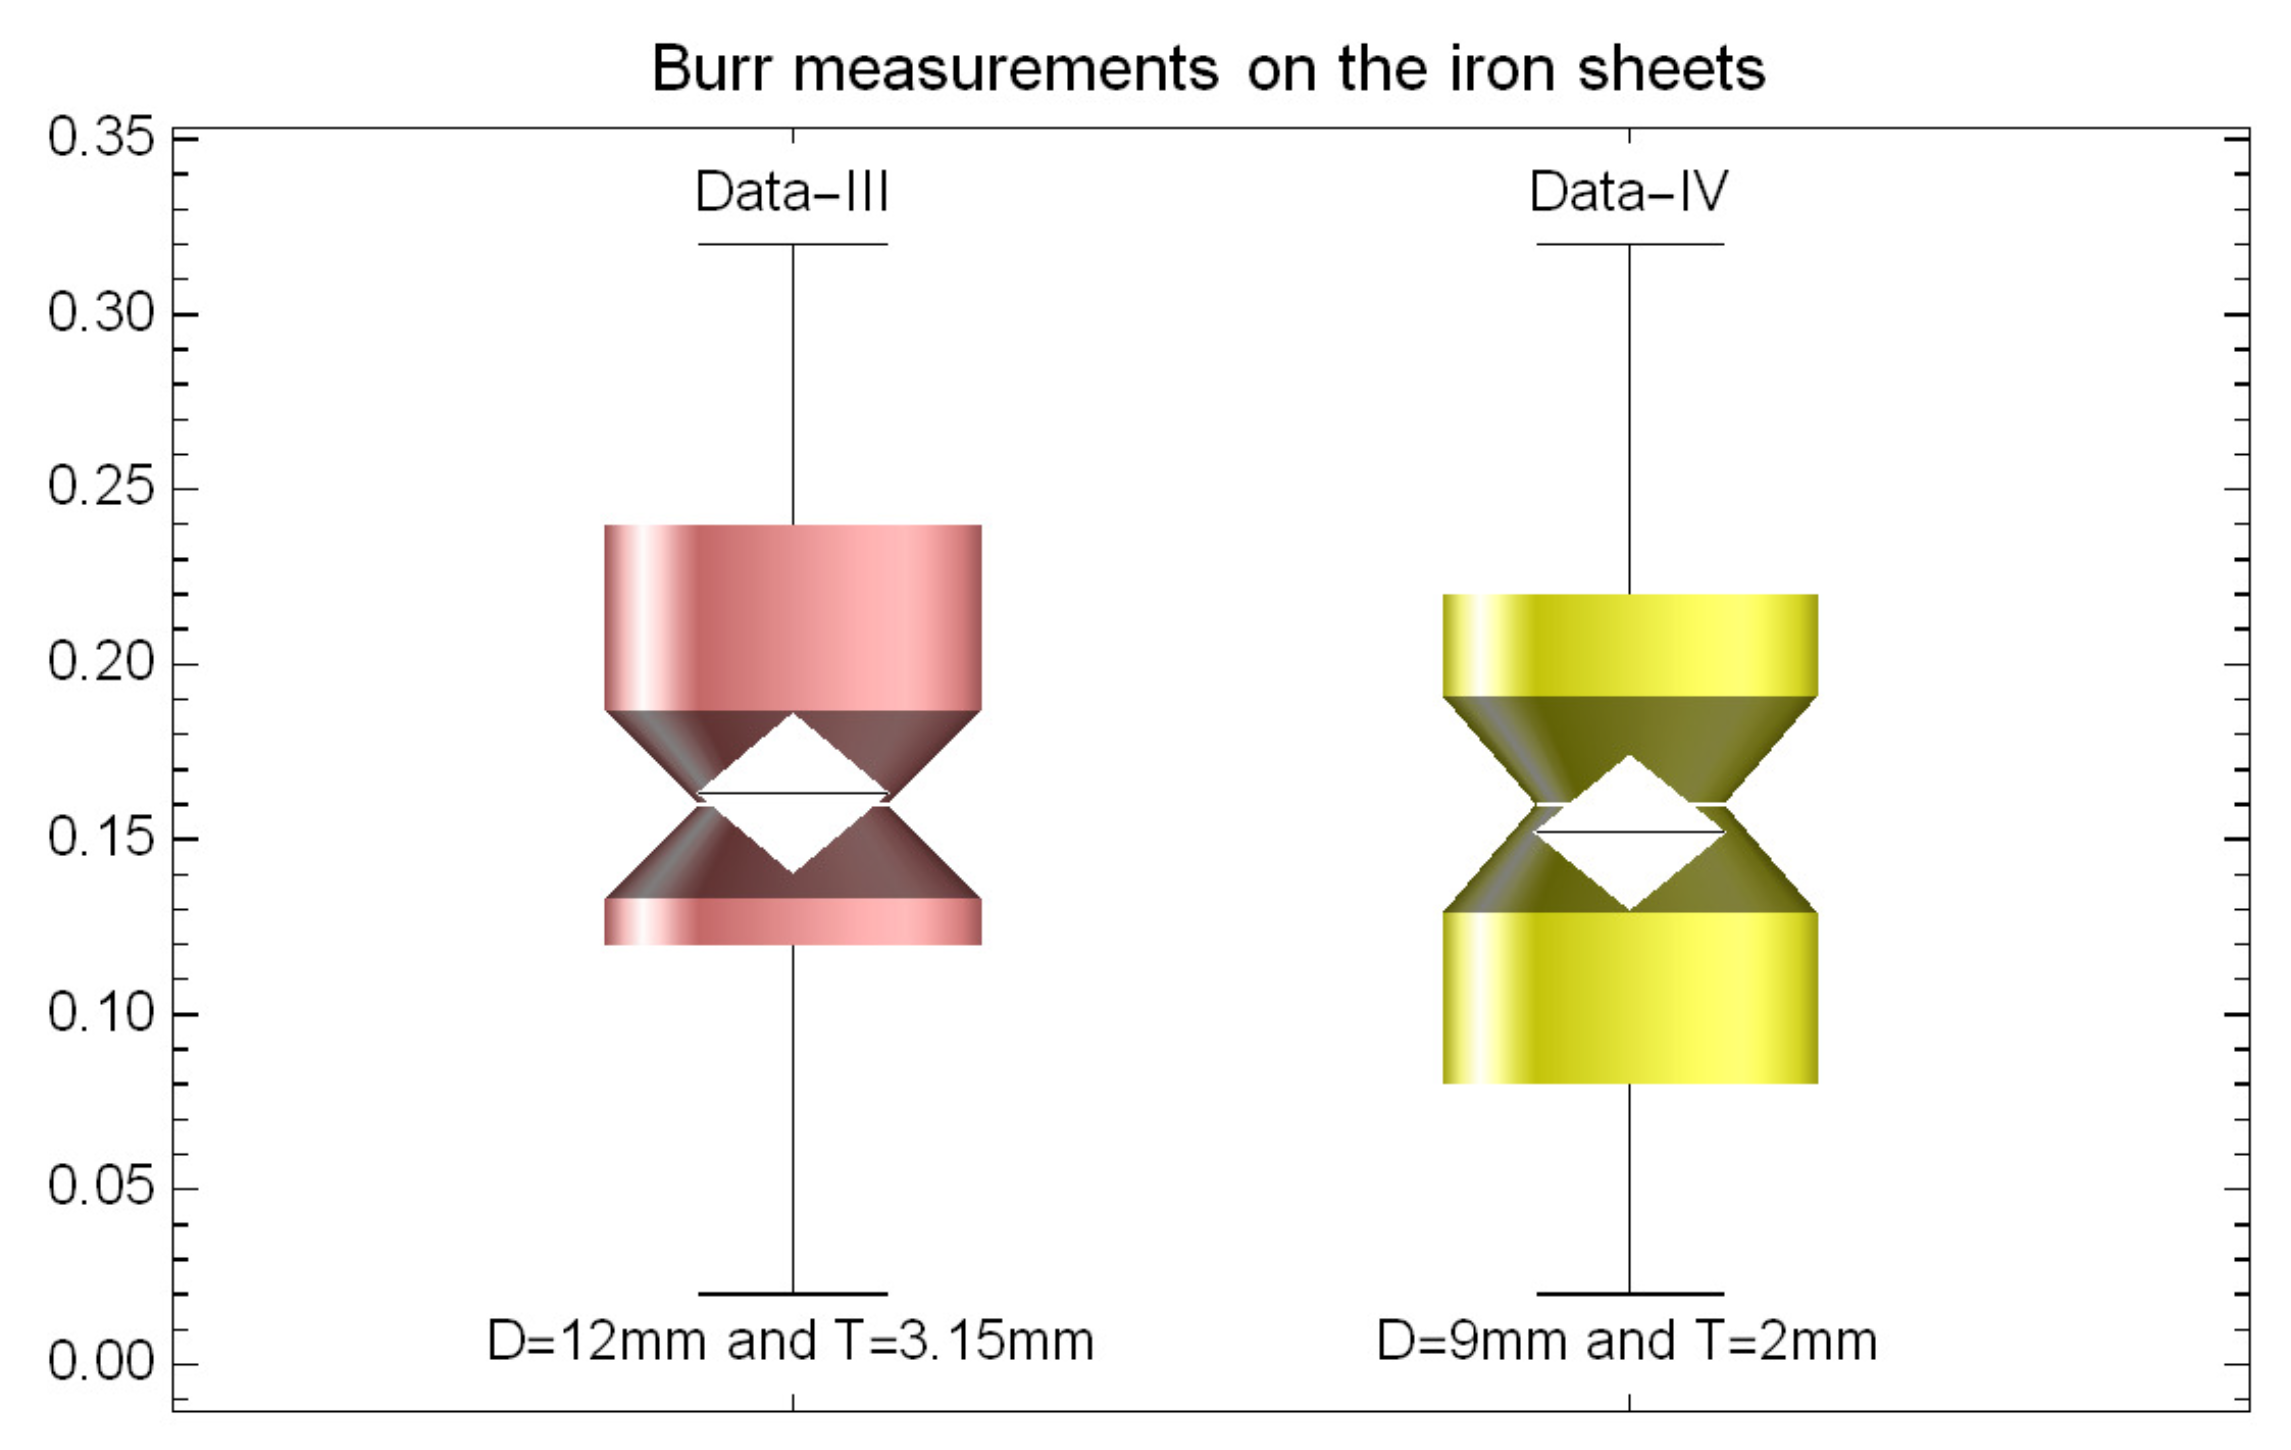
Figure 8.
Datasets III and IV (given by histograms) fitted via unit interval distributions (given by lines).
Figure 8.
Datasets III and IV (given by histograms) fitted via unit interval distributions (given by lines).
Disclaimer/Publisher’s Note: The statements, opinions and data contained in all publications are solely those of the individual author(s) and contributor(s) and not of MDPI and/or the editor(s). MDPI and/or the editor(s) disclaim responsibility for any injury to people or property resulting from any ideas, methods, instructions or products referred to in the content. |
© 2023 by the authors. Licensee MDPI, Basel, Switzerland. This article is an open access article distributed under the terms and conditions of the Creative Commons Attribution (CC BY) license (http://creativecommons.org/licenses/by/4.0/).
Copyright: This open access article is published under a Creative Commons CC BY 4.0 license, which permit the free download, distribution, and reuse, provided that the author and preprint are cited in any reuse.


