
Submitted:
09 August 2023
Posted:
09 August 2023
You are already at the latest version
Abstract
Inflammatory bowel diseases (IBD) includes Crohn's disease and ulcerative colitis, are idiopathic chronic relapsing inflammatory disorders of the intestinal tract. Different studies indicate that phytocanna-binoids, could play a possible role in the treatment of IBD by relieving the symptoms involved in the dis-ease. Phytocannabinoids act through the endocannabinoid system, which is distributed throughout the mammalian body in the cells of the immune system and in the intestinal cells. Our in vitro study analyzed the putative-anti-inflammatory effect of nine-selected pure cannabinoids in J774A1 macrophages cells and enteric glial cells (EGC’s) triggered to undergo inflammation with lipopolysaccharide (LPS). The an-ti-inflammatory effect of several phytocannabinoids was measured by their ability to reduce TNF tran-scription and translation in J774A1 macrophages and to diminish S100B and GFAP secretion and tran-scription in EGC’s. Our results demonstrate that THC at the lower concentrations tested exerted the most effective anti- inflammatory effect in both J774A1 macrophages and EGC’s compared to the other phy-tocannabinoids tested herein. We then performed RNA-seq analysis of EGC’s exposed to LPS in the presence or absence of THC or THC-COOH. Transcriptomic analysis of these EGC’s revealed 23 differ-entially expressed genes (DEG) compared to treatment with only LPS. Pretreatment with THC resulted in 26 DEG and pretreatment with THC-COOH resulted in 25 DEG. To evaluate which biological pathways were affected by the different phytocannabinoid treatments we used the Ingenuity platform. We show that THC treatment affected the mTOR and RAR signaling pathway while THC-COOH affected mainly the IL6 signaling pathway.
Keywords:
Phytocannabinoids
; J774A1 M1 macrophages
; Enteric Glial Cells
1. Introduction
Inflammatory bowel disease (IBD) is a relapsing chronic inflammatory disorder of the gastrointestinal tract with 2 predominant forms: Crohn`s disease (CD) and ulcerative colitis (UC) [1]. These two diseases are distinguished by their location and the nature of the inflammation [2]. CD affects any part of the gastrointestinal tract in a non-continuous type and is characterized by complications such as fistulas, abscesses, and strictures. In contrast, UC is characterized by mucosal inflammation limited to the colon and can be worsened into severe bleeding, rupture of the bowel and finally can progress into colon cancer [3,4]. The causes for the development of IBD are not entirely clear and range from genetic susceptibility, external environment, intestinal microbial flora and abnormal immune responses [1,5]. Alterations in epithelial barrier function, caused by combination of IBD risk factors, leads to translocation of luminal antigens (for example, bacterial antigens from the commensal microbiota) into the bowel wall [3,6]. As a result there is an aberrant and excessive cytokine response that cause subclinical or acute mucosal inflammation in a genetically susceptible host [6]. In fact, cytokines do not only drive intestinal inflammation, they are also associated with clinical symptoms of IBD [3,6,7].
IBD is one of the top five most expensive gastrointestinal-related diseases, despite having much lower prevalence than other common maladies (e.g. gastroesophageal reflux disease, irritable bowel syndrome and colorectal cancer) [8]. Macrophages are key players of the innate immune system involving in phagocytosis, antigen presentation and secretion of various cytokines, chemokines, and growth factors that protect the body from inflammatory or infection [9]. In the integral part of the normal intestinal tissues, macrophages are well established in lamina propria and in Peyer`s patches where they function as immune effector cells against any pathogenic attack [10]. In the presence of inflammatory stimuli, macrophages polarize toward pro-inflammatory M1 phenotype that produce high levels of inflammatory cytokines and chemokines in order to eliminate pathogens [10]. In contrast, wound healing environment promotes macrophage polarization to anti- inflammatory M2 state with increased production of anti-inflammatory cytokines, leading to alleviating inflammation, tissue repair and remodeling [11,12]. Emerging evidence has shown that recruitment of a large number of M1 inflammatory macrophages to inflamed tissues associated with high production of pro-inflammatory cytokines, contribute to inflammation and tissue damage in inflammatory diseases [13]. Macrophages exhibit a particularly vigorous response to lipopolysaccharide (LPS), a surface component of germ-negative bacteria, and TNF-α in response to inflammation or injury. The exposure of macrophages to LPS or TNF-α induced their differentiation to M1 phenotype [14]. Typically, M1 macrophages secrete toxic cytokines such as TNF-α, IL-1β, IL-6, IL-12, IL-18, IL-23, nitric oxide and reactive oxygen species (ROS). In addition, M1 macrophages decrease the stimulation of the anti-inflammatory cytokine IL-10 [15,16]. The dysfunction of the mucosal immune response in IBD is characterized by abnormalities in both the innate and adaptive immune systems [17]. The final common pathway of this dysregulated immune activation is abundant infiltration of immune cells, such as macrophages and monocytes, in the intestinal mucosa [18,19,20].
The gastrointestinal tract includes an extensive intrinsic nervous system termed the enteric nervous system (ENS), differing from all other peripheral organs. The ENS is characterized by the presence of neurons and enteric glial cells (EGCs), which are arranged into interconnected ganglia distributed between the plexuses. Enteric neurons directly produce and regulate critical cytokines involved in IBD [21,22], and there is evidence indicating that inflammatory diseases of the gut are characterized by changes affecting enteric glial cells [23,24]. EGCs are activated by exogenous stimuli that lead to over release of neurotrophins, growth factors and cytokines that in turn recruit infiltrating immune cells such as macrophages, neutrophils and mast cells into the colonic mucosa [25,26,27]. In fact, EGCs exert a key role in the maintenance of gut homeostasis cooperating with surrounding cells. Specifically, EGCs assure the correct trophism of neurons in the ENS [28], protect neurons from oxidative stress [29], control epithelial barrier functions by reducing epithelial permeability and actively participate in the course of intestinal inflammation acting as the first defensive line of the ENS [26,30]. Enteric glial cells have also gained a particular interest for IBD pathogenic processes since they resemble morphologically and functionality to astrocytes, which maintain homeostasis in the central nervous system [31]. The response to different insults such as inflammation and infection [32,33] is manifested by expressing glial fibrillary acidic protein (GFAP) and S100B protein [34,35]. In disease state, inflammation can convert EGCs to a "reactive EGC phenotype" characterized by over release of neurotrophins, growth factors and cytokines that in turn recruit infiltrating immune cells such as macrophages, neutrophils and mast cells in the colonic mucosa [26,27]. In this pathological condition, increased GFAP and S100B protein expression from EGCs are also been observed. These two proteins provide reliable biomarkers of glial activation in the intestinal tissue [36,37].
The endocannabinoid system (ECS) comprises endogenous cannabinoids (endocannabinoids [eCBs]), cannabinoids receptors and proteins that transport, synthesize and degrade eCBs. Most components of the ECS are multifunctional. Thus, rather than being a discrete system, the ECS influences, and is influenced by many other signaling pathways. This is especially important to consider when assessing the effects of ECS-targeting drugs [38]. The actions of most phytocannabinoids is mediated via receptors that are part of the ECS, through agonistic and antagonistic actions at specific receptors sites [39,40] and in varying degree of affinity [40]. The best-known receptors of the ECS are cannabinoid receptor 1 (CB1R), and cannabinoid receptor 2 (CB2R). Both receptors are G-protein coupled receptors (GPCR) that activate intracellular signaling [41]. For example, the mitogen-activated protein kinase (MAPK) pathway results from G-protein-coupled receptors activation [42], such as the resulting CB1 stimulation [39,43]. CB1Rs are found mainly on neurons, in the brain, in spinal cord and are expressed by some astrocytes [39,44]. In addition, CB1Rs are expressed in many peripheral organs and tissues including in the gastrointestinal tract [45,46], in the enteric nervous system [47], in the healthy colonic epithelium, in the gut smooth muscles and the submucosal myenteric plexus [48].
CB2 receptors are primarily expressed in cells of immune origin [49], including microglia [50], though they may also be expressed in neurons [50], particularly in pathological statuses [51]. Indeed, there is markedly more mRNA for CB2R than CB1R in the immune system [49]. CB2R are also present in epithelial and immune cells from the gastrointestinal tract [48] and in contrast to CB1 receptors, CB2 receptors are highly expressed in macrophages and in colonic epithelium tissue taken from IBD patients [48]. In fact, increased epithelial CB2 receptor expression in human inflammatory bowel disease tissue implies an immunomodulatory role that may affect mucosal immunity. The endocannabinoid system has been demonstrated to be activated in several conditions including inflamed intestine in mice and thus expressing increased amount of endocannabinoid receptors [52].
Our aim in this study was to analyze the putative-anti-inflammatory effect of nine-selected pure cannabinoids in vitro in J774A1 macrophages cells and enteric glial cells (EGC’s) triggered to undergo inflammation with lipopolysaccharide (LPS). The anti-inflammatory effect of the phytocannabinoids was measured by their ability to reduce TNFα transcription and translation in J774A1 macrophages and to diminish S100B and GFAP secretion and transcription in EGC’s.
2. Results
2.1. Effects of Phytocanabinoids on Inflamation in Murine Macrophages and EGC
The detection of TNFα levels provided us an acceptable criterion to evaluate the extent of inflammation. The maximal response to LPS elicitation of J77A1 cells was detected by the level of secretion of TNFα and measured after treatment with LPS (0.05µg/mL) for 4h Figure S1 A.). Treatment with dexamethasone at a concentration of 5µM (Figure S1 B) provided us the most suitable control indicator of reduction of inflammatory response in J77A1 cells. All further analyses were done with 0.05µg/mL of LPS for 4h for secretion of TNFɑ and 0.05µg/mL of LPS for 1h for gene expression (Figure S1).
EGC cells play a fundamental role in gut maintenance and inflammation. During intestinal inflammation EGC enter reactive gliosis and overexpress S100B protein, a molecule that plays a pivotal role in the downstream signaling process of EGC inflammation [25]. Furthermore, it has been shown that EGC express CB2 receptor [53]. Quantification of cellular S100B protein was performed by ELISA. Treatment with Ssnb at a concentration of 10 µg/L provided us the most suitable control indicator of reduction of inflammatory response in EGC cells. Ssnb is a polyphenol which inhibits TLR4 activation by blocking the binding of TLR4 to MyD88 (an important mediator of almost all the TLR downstream singling), thereby suppressing NF-κB [54,55]. Afterwards EGC cells were incubated with 1μg/mL LPS for 24h. EGC express not only S100B, but also express high levels GFAP [56] upon inflammatory stimulation. Several studies have shown that S100B immunoreactivity mostly colocalizes with the GFAP-positive enteroglial mucosal network in tissue specimens from patients with intestinal inflammation [25,57].
All cannabinoids were assayed for cytotoxicity using the MTT method on J774A1 and concentrations that did not reduce cell viability were selected for further analysis (Figure S2). For CBGA and CBDA all concentration tested reduced cell viability by at least 50% and hence were not evaluated further (Figure S1F, Figure S1G).
2.1.1. THC
The putative cytotoxic effect of THC was evaluated by MTT assay. We demonstrate that THC was not toxic to the cells at concentrations up to 10µg/mL (Figure S2A). THC induced the greatest effect reducing TNFα secretion at either 0.1 and 0.05µg/mL (Figure 1A). This reduction was comparable to the effect of dexamethasone. Above these concentrations, THC increased TNFɑ secretion to levels equal to (0.1-1µg/mL) or above (5-10µg/mL) treatment with LPS (Figure 1A). The extent of reduction of secretion did not mirrored the effects measured on gene expression (Figure S4A).
2.1.2. CBD
Cannabidiol (CBD) is the second most abundant phytocannabinoid with non-psychoactive effects, which makes it well tolerated by consumers compared to THC [58]. CBD is known for its anti-inflammatory and anti-oxidative effects [59], along with a long list of other therapeutic properties [60,61]. CBD was not toxic to the cells up to 3µg/mL (Figure S1B). Treatment J77A1 macrophages with CBD concentrations under the cytotoxicity level induced increased secretion of TNFα (Figure 3a). Furthermore, the combination of THC and CBD abolished THC’s anti-inflammatory effect (Figure 3b).
2.1.3. THC-COOH
Metabolism of THC occurs mainly in the liver by microsomal hydroxylation and oxidation catalyzed by enzymes of the cytochrome P450 (CYP) complex [62]. The first product is 11-Hydroxy-tetrahydrocannabinol (11-OH-THC) while 11-Nor-9-carboxy--tetrahydrocannabinol (11-THC-COOH or THC-COOH) is the final product. THC-COOH is not psychoactive. It possesses anti-inflammatory and analgesic properties by mechanisms similar to those of nonsteroidal anti-inflammatory drugs [63]. Concentrations of THC-COOH above 10µM were toxic to J774A1 cells (Figure S1E) and above 100µM to EGC (Figure S3B). Most of the concentrations of THC-COOH (1nM, 10nM, 100nM, 1μM, 2μM, 5μM and 10μM) that we tested did not exerted a significant effect on TNF-α secretion. However, 500nM did increased TNF-α in those cells (Figure 1 F). Concentrations from 1nm-10µM significantly reduced S100B secretion and expression (Figure 1G and Figure S4D) and GFAP expression (Figure 1H).
2.1.4. THCA
In the plant trichrome THC is stored in its acidic form ∆9- tetrahydrocannabinol acid (THCA) [64]. THCA is devoid of psychotropic effects [65]. THCA needs to undergo decarboxylation to THC to produce psychotic effects, this decarboxylation is spontaneous and requires heat [39]. A recent study suggests that the anti-inflammatory activity of cannabis extract in colon epithelial cells is associated with THCA, and should be used in the treatment of IBD rather than CBD [66]. We show in cell viability experiments that THCA is not cytotoxic nor to J774A1 and nor to EGC up to 10µM (Figure S2C, and S3A). In concentrations below 10µM THCA increased secretion of TNFɑ in J774A1 cells compared to 0.05µg/mL LPS without pretreatment (Figure 2A). In concentrations of 0.1-10µM THCA reduced S100B secretion and expression (Figure 2b and S4C) and GFAP expression (Figure 2C). THCA alone did not elevated S100B secretion and GFAP expression (Figure 2B and C).
2.1.5. CBC and CBG
Pretreatment with CBC and CBG did not exerted any cytotoxic effect on J77A1 cells below 10µM and 20µM respectively (Figure S1H, S1I). CBC treatment of J774A1 macrophages showed a U shape curve where 1nM, 10µM and 20µM significantly elevated TNFα secretion compared to LPS control and concentrations between 10nM and 1µM were insignificant related to control (Figure 2D). Pretreatment with 10nM-1µM CBC significantly reduced S100B secretion and expression to the same levels as Ssnb (Figure 2E S4F). Concentrations of 10nM, 100nM, 500nM and 1µM CBC did not exerted any effect on GFAP expression (Figure 2F).
CBG did not exerted any significant effect on TNF-α secretion in comparison to the positive control (0.05μg/mL LPS) all over the range of CBG concentrations tested (0.05μM- 20μM CBG) (Figure 2G).
CBG treatment induced an anti-inflammatory effect in EGC cells at 1-10µM for S100B secretion (Figure 2H). However, the effect on secretion differs from the effect on relative expression of S100B (Figure 2H and Figure S4E). Interestingly, there is a discrepancy between S100B expression and translation in EGC cells after treatment with 20μM CBG (Figure 2H and Figure S4E) where it increased S100B secretion yet showed decreased transcription. Only 1µM of CBG significantly reduced GFAP expression, whereas a dose dependent increase in GFAP expression is seen with and without LPS (Figure 2I).
2.1.5. THCV
THCV is described as a phytocannaboid belonging to one of the minor phytocannabinoids. The name “minor phytocannabinoids” has been used to define phytocannabinoids different from Δ9-THC, CBD, CBG and CBC. THCV only recently has been subjected to significant investigation following new discoveries about its novel medicinal properties [67,68,69,70]. Importantly, THCV decrease signs of inflammation and pain in acute inflammation model on mice partly via CB1 and/or CB2 receptor activation [71]. We show for J77A1 macrophages that THCV is not cytotoxic below 15nM (Figure S2D) THCV treatment of J774A1 cells showed significant increase in TNFα secretion from cells at concentrations of 0.2nM, 0.5nM, 1nM, and 3nM compared to 0.05μg/mL LPS group (Figure 3). Although it is not significant, 5nM, 7nM, 10nM and 15nM, showed an increase in TNF-α secretion compared to J774A1 cells treated with 0.05μg/mL LPS (Figure 3).
2.2. RNA Sequencing Analysis
EGC cells were treated for 1h with 0.1µg/mL of THC or 10nM of THC-COOH after which 1µg/mL of LPS was added for 4h. Additionally positive control 1µg/mL LPS and negative control cells were used. Transcriptomic analysis revealed 23 Differentially Expressed Genes (DEG) (fold change >1.6, Pv<0.05) in control vs LPS (10 up regulated and 13 down regulated), 26 DEG THC+LPS vs LPS (10 up regulated and 16 downregulated) and 25 DEGs when comparing THC-COOH+LPS vs LPS (16 upregulated and 9 down regulated) (Figure 4). Pretreatment of THC before LPS resulted in down-regulation of the apoptosis related genes mob1a (Pv<0.05,-1.7FC) [72], ptma (Pv<0.05,-2FC). THC down regulated adm (Pv<0.05, Fc -1.6), a gene that is upregulated in inflamed neurons, antagonists to adm inhibit the release of nNOS and macrophage recruitment [73]. Ap1S3 was upregulated by pretreatment of THC (Pv<0.05, FC 3.5). Knockout of ap1s3 in keratinocytes results in upregulation of IL1 and TNFɑ [74]. IL1 is a strong activator of IBD [75,76]. Oxidative stress genes were also affected by THC with downregulation of gpx8 (Pv<0.05, -2FC) and upregulation of oplah (Pv<0.05, 3FC).
THC-COOH is the final metabolite of THC metabolism in the liver. Pretreatment of THC-COOH resulted in upregulated genes relating to cellular metabolism including Cox6c, Cox7b and Gbe1 (Figure 4). THC-COOH upregulated Psma2 a component of the 20S subunit. Knockdown of this gene results in reduced immune response in human lung cells [77].A.
To evaluate the biological pathways affected by the different pretreatments we used the IPA platform (Pv<0.05). Addition of LPS affected 34 canonical pathways (-log(p-value >1) (Figure 5, Suplemmentary File 1), the 4 major patways (-log(p-value) 2.88-3.78) were related to: Oxidative phosphorylation (-log(p-value) 3.78), Mitochondrial dysfunction (-log(p-value) 3.51), ElF2 signaling (-log(p-value) 2.88) and HER-2 signaling (-log(p-value) 2.88). Down regulation of Cox6c (log2FoldChange -2.46), Cox7b (log2FoldChange -2.63) and upregulation of MT-CO1 (log2FoldChange 1.97) results in changes of Oxidative Phosphorylation, Mitochondrial dysfunction, and HER-2 signaling. Pretreatment with THC for 1h also affected the Elf2 signaling pathway through downregulation of Gm15489, MT-RNR1, RPL21 yet RPL7a was upregulated. The most affected pathway by pretreatment with THC was the mTOR phathway (-logPv 3.96) Figure 5). This is manifested through down regulation of 4 genes (DDIT4, Gm15483, MT-RNR1, RPS6KC1). The only pathway to show mild downregulation was the retinoic acid receptor (RAR) (zScore -2). Interestingly the final metabolite of THC, THC-COOH, affected different pathways when compared to THC. The carboxylated metabolite elicited changes in IL-6 signaling (Tab1 -logFC-2.2, Tnfaip6 -logFC2.4) and iNos signaling (Tab1 -logFC-2.2), both are canonical pathways related to inflammation. In general carboxylated THC affected fewer pathways compared to THC above the threshold of 1.3 (Figure 5 b and Figure c). IPA analysis identifies genetic networks that are affected by the DEG regardles of the direction of the expression change. 0.1µg/mL LPS affectd the cell cycle and cell death network by 11 DEGs (Figure 5D). Pretreatment of THC effected the proteosome network (Figure 5E) 17 DEGs. The main network to be affected by pre treatment of THC-COOH was related to cell death and survival (Figure 5F).
3. Discussion
In this study we aimed to perform and in-depth assessment of the putative anti-inflammatory effects of both, major and minor phytocannabinoids on macrophages and enteric glial cells. These two kind of cells have been shown to play a key role during onset and progression of IBD [9,32]. Current treatments of IBD include immunosuppressive and biological drugs [78,79]. Immunosuppressive drugs can cause adverse reactions including vomiting, dyspepsia, and anorexia and other systemic symptoms such as headache, dizziness, and rash [80]. Biological drugs consist mainly of antibodies targeting either cytokines or other immune targets, these include TNFα (infliximab and adalimumab) or α4β7 integrin (vedolizumab) [80]. Though biological drugs show efficacy at treatment of IBD there are adverse effect including cases of arthritis, sacroiliitis [81,82]. These treatments also incur great financial burden on patients and health providers driving the need for alternative pharmacological approaches.
Macrophages are resident cells of almost every tissue in the body and provide key orchestrators of chronic inflammatory disorders. Macrophages have been reported to play a role in the pathological progression of UC disease in comparison with other leukocytes [83]. The glial cells in the gut represent morphological and functional equivalent of astrocytes and microglia in the central nervous system, and play essential role as regulators of intestinal homeostasis [84,85]. Although no CBr have been detected in EGC there is mounting evidence on the effects of modulation of EGC by the ECS [86]. During intestinal inflammatory reaction, EGC cells release glial markers such as S100B and GFAP. Altered expression of S100B and GFAP has been reported in several intestinal inflammatory disorders in humans such as inflammatory bowel disease [25,56], celiac disease [26], postoperative colitis [87].
In order to assess the anti-inflammatory effects of the different cannabinoids we first evaluated their toxicity on both J774A1 murine macrophages and rat EGC by MTT assay [88] (Figure S2 and Figure S3). For J774A1 macrophages THC was not toxic in the range of 0.5-10µg/mL, CBD 10-50µM, THCA 1-20µM, THC-COOH 0.1-50µM, CBC 1-10µM, CBG 2.5-20µM, THCV 1-15nM, CBD 1-10µg/mL, CBDA, CBGA solution significantly decreased J774A1 cell viability more than 50% at all the concentrations that were tested (Figure S2),. Cell viability was not decreased in EGC at the following concentrations; THCA 0.5-10 µM, THC-COOH 0.5-100µM, CBG 5-30µM, CBC 0.5-2µM.
Our results show that THC significantly reduced TNFα secretion preferentially at low concentrations 0.05-0.5µg/mL whereas above 0.55µg/mL TNFα secretion was increased. At 5-105µg/mL secretion was above the effect of 0.5µg/mL LPS, showing an additive effect of THC on TNFα secretion. This is in accordance to the known biphasic effect of THC [89,90]. This data points to the advantage of using low or even ultralow doses of THC, this in accordance with the reversal of cognitive impairment in old mice, and spatial memory test in old female mice [91,92]. Transcription of TNFα was not affected by pretreatment of THC this was evident from RTqPCR (Figure S4A,) and transcriptomics. This is inline with other reports showing the instability of TNFα mRNA vs protein [93,94]. Pretreatment of EGC with low concentrations of THC markedly reduced S100B secretion and expression as well as GFAP expression (Figure 1B,C). Taken together these results show significant immunosuppressive effect exerted by low doses of THC in our in-vitro model.
We demonstrate herein that CBD augmented the secretion of TNFα in all concentrations tested except for 3µg/mL where it was the same as 0.5µg/mL LPS control (Figure 1D). CBD has been used for treatment of inflammation and other comorbidities [95,96]. Our results may be due to the low concentrations used as it has been shown for T cells [97], yet it is notable that the concentrations we used were optimized to be non-cytotoxic. Furthermore, CBD abolished THC reduction of TNFα secretion (Figure 1E). Some data suggests that CBD can indirectly modulate THC via CB receptors [98] or by being and allosteric modulator that alters the efficacy of orthostatic ligands [99,100].
Upon consumption THC is metabolised in the liver to 11-OH-THC and then to the inactive metabolite THC-COOH [101]. THC-COOH did not reduced inflamatory markers in murine macrophages (Figure 1F), yet reduced and all reactive glycosis markers in EGC (Figure 1G, 1H, S4D). In the plant trichomes THC is stored in its acidic form THCA [102], THCA is not psychoactive and upon heating (smoking or baking) it undergoes a decarboxylation reaction and is transformed to THC [39]. At 1-70nM THCA significantly increased TNFα secretion from J774A1 macrophages, at higher concentrations, 100nm-1µM no significant inflammatory effect was observed when compared to positive LPS control yet no reduction of TNFɑ secretion was measured at all concentrations tested (Figure 2A). In EGC cells, THCA reduced both S100B secretion and expression as well as GFAP expression at all concentrations tested (Figure 2B, S4C, 2C, repectivelly). This indicates that THCA can prevent the transfer of EGC to reactive gliosis, this is in line with evidence showing reduced IL-8 secretion from HCT116 colonocytes with C. sativa extract rich in THCA [66].
THCV is a minor cannabinoid from C. sativa with evidence of medicinal properties in metabolism [103], nausia [68], obesity and insulin sensitivity [46], pain [71] and inflammation [104]. Low concentrations, 0.2-3nM of THCV elevated murine macrophage TNFɑ secretion whereas higher concentrations were not different to LPS treated cells (Figure 4B). Overall,the results show that THCV did not improve inflammation markers in our system, this is in accordance with results of Rao et al. [104] that showed that THCV did not reduce LPS induced NO production in RAW264.7 and similarly to the observed for keratinocytes [105].
CBC is considered one of the main four cannabinoids in the Cannabis sativa plant. It has been shown to have therapeutic properties through activation of TRPA1 and inhibition of degradation of cannabinoids [106,107,108]. An increase in TNFα secretion was generaly observed in J774A1 macrophages. The lowest and the highest concentrations of CBC generaly increased TNFα secretion being the most significant effect with 1nM and 10-20µM compared to LPS control (Figure 2D). Concentrations of 10nM to 1µM significantly reduced S100B secretion and expression in EGC (Figure 2E and Figure S4F respectivelly). However GFAP mRNA expression was not changed by pretreatment of CBC. Cumulatively, these results exemplify that CBC does not reduce inflammation on the tested primed cells according to the results of all markers we measured (Figure 2F).
CBG may exert thrapeutic effect through modulation of transient receptor potential (TRP) channels, cyclooxygenase (COX-1 and COX-2) enzymes and cannabinoid 5-HT1A and α2 adrenergic receptors [106,109,110,111]. Non-cytotoxic concentrations of CBG (0.05-20µM) did not reduce TNFɑ secretion (Figure 2G). At 1-10µM CBG reduced S100B secretion by EGC whereas at 20µM S100B secretion was elevated with and without LPS (Figure 2H). Expression levels of S100B were reduced in all tested concentrations (Figure S4E). Expression of GFAP was only reduced at 1µM CBG and significantly increased at 20µM with or without LPS (Figure 2I). Collectively it can be stated that CBG is effective on EGC at concentrations of 1-10µM.
To evaluate a more systematic cellular response transcriptomic analysis was conducted on control untreated EGC, and compared to EGC cells treated with LPS 1µg/L for 24h, and pretreated for 1h with 0.1µg/mL THC or 10nM THC-COOH and then with 1µg/L LPS (see Materials and Methods). Incubation with LPS induced 23 DEGs (fold change >1.6, Pv<0.05) (Figure 4A), pathway analysis revealed that the main pathways effected by LPS were; oxidative phosphorylation, Mitochondrial dysfunction and EIF2 signaling (Figure 5A). Oxidative phosphorylation and mitochondrial dysfunction were effected by downregulation of Cox6c, Cox7b and MT-CO-1, all part of the mitochondrial respiratory complex. It has been shown that the mitochondria in active in infection and inflammation through release of cytokines and activation of the inflammasomes [112]. Both Cox6c and cox7b are part Cytochrome c Oxidase, the terminal enzyme of the mitochondrial respiratory chain. The reduction in oxidative phosphorylation agrees with previous reports showing a shift from oxidative phosphorylation to glycolysis in LPS induced glial cells [113,114]. Elf2 was shown to be activated via phosphorylation in RAW 264.7 cells by Yersinia pseudotubercu infection [115] causing a reduction of protein synthesis by negatively affecting the exchange of GDP to GTP in the β-subunit of eLF2. In BV-2 microglial cells LPS can cause excessive mitochondrial fission and ROS generation [116]. LPS has been shown to elevate oxidative stress in BV-2 microglial cells and in the brain as well as other organs [117,118]. EIF2 phosphorylation is increased in murine macrophages that are exposed to bacterial infection causing reduction in protein synthesis [115]. IPA analysis identifies genetic networks that are affected by the DEG regardles of the direction of the expression change. Treatment with LPS affected Developmental Disorder, Hereditary Disorder, Metabolic Disease networks (12 DEG) and Cell Cycle, Cell Death and Survival, Organismal Injury and Abnormalities (11 DEG) (Figure 5d) this is in accordance with Juknat et al. [119].
Pretreatment of 1h with 0.1µg/mL THC before incubation with LPS resulted in 26 DEGs (10 up regulated and 16 downregulated) compared to no pre-incubation. The main pathways affected were mTOR signaling, EIF2 and retinoic acid receptor (RAR) activation that was down regulated (-2 z Score). mTOR was affected by down regulation of DDIT4, Gm15483, MT-RNR1, RPS6KC1. mTOR signaling has been implicated in inflammation processes. Mammalian target of rapamycin (mTor) is a conserved serine/threonine protein kinase belonging to the phosphoinositide 3-kinase (PI3K) family. It has been shown in CNS microglial cells that LPS activates mTor activity resulting in Nitric Oxide (NO) and prostaglandin E2 and D2 [120]. Inhibition or mTor using rapamycin inhibited these effects by reduction of COX2 and NOS2 [121]. RAR is essential for Enteric Nervous System (ENS) development, knockout of RAR led to reduction of submucosal neurons yet did not reduce enteric glia cells primed by SOX10 [122]. Retinoic acid ameliorates IBD through NFƙB signaling in colitis model and RAW264.7 macrophages [123]. Most studies indicate activation of RAR in inflammation [122,123] yet our data indicates a reduction of the RAR pathway in glial cells pretreated with THC. Network analysis reveald that THC influenced the proteosome network (17 DEGs). It has been previously shown that mTOR reguletes protein synthsis and degradation [124], this is done through control of the proteosome in nerve cells [125]. IPA analysis shows influence on both mTOR signaling pathway and proteosom network by pretreatment of THC.
The final metabolite of THC metabolism is THC-COOH, pretreatment with this drug reduced S100B secretion and expression as well as GFAP expression (Figure 1 F-G). The pathway that was most affected by THC-COOH was IL6 signaling. IL6 is known to be elevated in activated EGCs [126]. Our data shows downregulaton of TGF-beta activated kinase 1 (MAP3K7) binding protein 1 (TAB1) and upregulation of TNF alpha induced protein 6 (TNFAIP6) (-logFC -2.2 and 2 respectivly). TAB1 is involved in IL6 activation through activation of IL-1 and NFƙB signaling [127], activation of TNFAIP6 inhibits IL-6 secretion in lung cells [128]. Together our results indicate that preincubation with THC-COOH could reduce IL-6 secretion by EGC cells.
4. Materials and Methods
4.1. Cell Culture
4.1.1. J774A1 Murine Macrophages
J774A1 macrophages were purchased from the American type culture collection (ATCC, Manassas, VA, USA). Cells were cultured in 75 mm2 flasks with Dulbecco`s modified Eagle`s medium (DMEM) (Sigma Aldrich, Burlington, USA) supplemented with 10% fetal bovine serum (Biological industries, Kibbutz Beit-Haemek, Israel), 1% penicillin-streptomycin (Biological industries), and 2.5ml sodium pyruvate (Biological industries) until they reached 70% confluency at 37°C under 5% CO2.
4.1.2. Enteric Glial Cells
Enteric glial cell lines (EGC/PK060399egfr) were purchased from the American type culture collection (ATCC). Cells were thawed and grown in 75 mm2 flasks to 70% confluence in DMEM medium containing 10% (Sigma Aldrich, USA) fetal bovine serum (FBS) (Biological industries), 0.5% penicillin-streptomycin (Biological industries), at 37°C under 5% CO2. Cells were trypsinized (using 0.25%) (Invitrogen, Carlsbad CA, USA) and transferred every 2-3 days.
4.2 Chemicals
Pure THC was purchased from BOL pharma (Revadim, Israel). Purified CBD was obtained from Tikun Olam Ltd. (Tel Aviv-Yafo, Israel). Sparstolonin B (Ssnb) was purchased from Sigma (Sigma, USA). LPS THCA, THCV CBC, CBG, CBA, THC-COOH were purchased at HPLC standard grade (Restek, Bellefonte, PA, USA). All purified or synthetic phytocannabinoids were dissolved in ethanol and later diluted with DMEM before addition to cells.
4.3. MTT 3-(4,5-dimethylthiazol-2-yl)-2,5-diphenyltetrazolium bromide
Cells were plated on 96 well plates at a concentration of 5x10⁴/0.2mL/well and left to adhere for 2h. Medium (DMEM D5796 Sigma Aldrich) was replaced with medium supplemented with different concentrations of test treatment. Cells were left in incubator for 24h (37ºC 5%CO2). Medium was replaced with 180µL of clear medium (DMEM 01-053-1A Biological industries) supplemented with 20µL solubilized MTT final concentration 0.5mg/mL (Sigma Aldrich, USA) for 2h. After removal of MTT 100µL of dimethyl-sulfoxide (DMSO) was added and left on an orbital shaker for 20min. Absorbance was measured in a spectrophotometer (Synergy H1, Agilent CA, USA) at 550nm.
4.4. In Vitro Treatments
The cells were plated at a concentration of ~1×10⁶ cells/mL and were pretreated with different concentrations of single phytocannabinoids and/or a mixture of phytocannabinoids for 1 hour based on previous studies [129] after which LPS (E. coli 0111:B4, Sigma USA) was added for additional 24h. After treatment, the medium was removed for ELISA analysis (see below) and RNA/proteins were extracted from the respective cells.
4.5. Enzyme-Linked Immunosorbent Assay (ELISA)
The cell’s growth medium was assayed for TNFα using ELISA according to manufacturer instructions (Peprotech, NJ, USA), or S100B using Simple-Step ELISA kit according to the manufacturer instructions (Abcam, Waltham, USA).
4.6. RNA Extraction and cDNA Synthesis
RNA was extracted using TRI reagent (Sigma GmBH, Mannheim, Germany) in combination with PureLink column-based kit (Thermo Fisher, Waltham USA). RNA was quantified using Nanodrop 2000 (Thermo Fisher, Waltham, USA). 1.5µg of RNA was used for synthesis cDNA, using qScript cDNA Synthesis Kit (Quanta Bio, Beverly, USA).
4.7. Quantitative Reverse Transcription PCR (RT-qPCR)
Real time qPCR was preformed using fast SYBR green master mix (Applied Biosystems, Foster City, CA, USA) on Quant studio 1 machine (Applied Biosystems). For normalization of gene expression in all reactions, we used the PPIA gene for TNFα gene normalization, and GAPDH gene for S100B and GFAP genes normalization. Expression was quantified using in run standard curve method. Primers for relative gene expression are depicted in supplemental table S1.
4.8. RNA Sequencing Protocol and Computational Pipeline
Library construction and sequencing. Total RNA was extracted as described above. RNA-seq analysis was executed by the Crown Genomics institute of the Nancy and Stephen Grand Israel National Center for Personalized Medicine, Weizmann Institute of Science. A bulk adaptation of the MARS-Seq protocol [130,131] was used to generate RNA-Seq libraries for expression profiling of THP-1 treated cells (Supplementary Method S_). Sequence data analysis. Assembly and annotation were performed as described previously [132,133]. Differential analysis was performed using DESeq2 package (1.26.0) [134] with the betaPrior, cooks Cutoff and independent Filtering parameters set to False. Raw P values were adjusted for multiple testing using the procedure of Benjamini and Hochberg. Pipeline was run using snakemake [135]. DEGs were determined by a p-adj of < 0.05 and absolute fold changes > 1.6 and max raw counts > 10. Bioinformatics analysis. PCA, Hierarchical clustering and K-Means clustering were performed (Supplementary Method S1). Standardized, log 2 normalized counts were used for the clustering analysis. Clustering analysis was performed with Rstudio v3.6.1 [136]. DEGs, heatmaps, canonical pathways and graphical networks were analyzed using Ingenuity Pathways Analysis (Ingenuity® Systems version 90348151, www.ingenuity.com).
4.9. Statistics
All statistics were performed on JMP pro 14 (SAS institute Inc., Cary, Nc, 1989-2019) or GraphPad prism (version 8 GraphPad Software, San Diego, California USA, www.graphpad.com). Unless otherwise stated data is expressed as mean SE. Comparison between means of more than two groups were analyzed using means ANOVA and Tukey HSD.
5. Conclusions
Our results show that between all nine selected pure phytocannabinoids tested, essentially THC at low concentrations demonstrated to significantly reduce TNFα secretion in J774A1 murine macrophages. This is in accordance to the known biphasic effect of THC, and points to the advantage of using low doses of THC. Additionally, pretreatment of EGC cells also with low concentrations of THC markedly reduced S100B secretion and expression as well as GFAP expression. Taken together these results show significant immunosuppressive effect exerted by low doses of THC in our in-vitro model. RNA-seq analyses and Ingenuity Pathways Analysis show that THC treatment affected the mTOR and RAR signaling pathway while THC-COOH affected mainly the IL6 signaling pathway.
Supplementary Materials
The following supporting information can be downloaded at the website of this paper posted on Preprints.org, Supplementary Figures: Figure S1-up to-Figure S4; Supplementary Table: Table S1.
Author Contributions
For research articles with several authors, a short paragraph specifying their individual contributions must be provided. The following statements should be used “Conceptualization, B.S. and O.G.; methodology, G.C. and O.G.; software, O.G.; validation, G.C., O.G. and B.S.; formal analysis, G.C., O.G. and B.S.; investigation, G.C., O.G. and B.S.; resources, B.S.; data curation, G.C. and O.G.; writing—original draft preparation, G.C. and O.G.; writing—review and editing, B.S.; supervision, B.S.; project administration, B.S. and O.G.; funding acquisition, B.S. All authors have read and agreed to the published version of the manuscript.
Funding
Please add: “This research was funded by Funded by the Israeli Ministry of Agriculture grant number 12-05-0035.
Data Availability Statement
We encourage all authors of articles published in MDPI journals to share their research data. In this section, please provide details regarding where data supporting reported results can be found, including links to publicly archived datasets analyzed or generated during the study. Where no new data were created, or where data is unavailable due to privacy or ethical restrictions, a statement is still required. Suggested Data Availability Statements are available in section “MDPI Research Data Policies” at https://www.mdpi.com/ethics.
Conflicts of Interest
“The authors declare no conflict of interest.”
References
- Uhlig, H.H. Monogenic diseases associated with intestinal inflammation: implications for the understanding of inflammatory bowel disease. Gut 2013, 62, 1795–1805. [Google Scholar] [CrossRef] [PubMed]
- Domenech, E.; Manosa, M.; Cabre, E. An overview of the natural history of inflammatory bowel diseases. Dig Dis 2014, 32, 320–327. [Google Scholar] [CrossRef] [PubMed]
- Neurath, M.F. Cytokines in inflammatory bowel disease. Nat Rev Immunol 2014, 14, 329–342. [Google Scholar] [CrossRef]
- Kugathasan, S.; Fiocchi, C. Progress in basic inflammatory bowel disease research. Semin Pediatr Surg 2007, 16, 146–153. [Google Scholar] [CrossRef] [PubMed]
- Guindi, M.; Riddell, R.H. Indeterminate colitis. J Clin Pathol 2004, 57, 1233–1244. [Google Scholar] [CrossRef] [PubMed]
- Strober, W.; Fuss, I.J.; Blumberg, R.S. The immunology of mucosal models of inflammation. Annu Rev Immunol 2002, 20, 495–549. [Google Scholar] [CrossRef]
- Ruffolo, C.; Scarpa, M.; Faggian, D.; Basso, D.; D'Inca, R.; Plebani, M.; Sturniolo, G.C.; Bassi, N.; Angriman, I. Subclinical intestinal inflammation in patients with Crohn's disease following bowel resection: a smoldering fire. J Gastrointest Surg 2010, 14, 24–31. [Google Scholar] [CrossRef]
- Stone, C.D. The economic burden of inflammatory bowel disease: clear problem, unclear solution. Dig Dis Sci 2012, 57, 3042–3044. [Google Scholar] [CrossRef]
- Heinsbroek, S.E.; Gordon, S. The role of macrophages in inflammatory bowel diseases. Expert Rev Mol Med 2009, 11, e14. [Google Scholar] [CrossRef]
- Mahida, Y.R.; Patel, S.; Gionchetti, P.; Vaux, D.; Jewell, D.P. Macrophage subpopulations in lamina propria of normal and inflamed colon and terminal ileum. Gut 1989, 30, 826–834. [Google Scholar] [CrossRef]
- Mantovani, A.; Sica, A.; Sozzani, S.; Allavena, P.; Vecchi, A.; Locati, M. The chemokine system in diverse forms of macrophage activation and polarization. Trends Immunol 2004, 25, 677–686. [Google Scholar] [CrossRef]
- Brown, B.N.; Valentin, J.E.; Stewart-Akers, A.M.; McCabe, G.P.; Badylak, S.F. Macrophage phenotype and remodeling outcomes in response to biologic scaffolds with and without a cellular component. Biomaterials 2009, 30, 1482–1491. [Google Scholar] [CrossRef]
- Shi, C.; Pamer, E.G. Monocyte recruitment during infection and inflammation. Nat Rev Immunol 2011, 11, 762–774. [Google Scholar] [CrossRef] [PubMed]
- Gordon, S.; Martinez, F.O. Alternative activation of macrophages: mechanism and functions. Immunity 2010, 32, 593–604. [Google Scholar] [CrossRef]
- Tran, T.H.; Rastogi, R.; Shelke, J.; Amiji, M.M. Modulation of Macrophage Functional Polarity towards Anti-Inflammatory Phenotype with Plasmid DNA Delivery in CD44 Targeting Hyaluronic Acid Nanoparticles. Sci Rep 2015, 5, 16632. [Google Scholar] [CrossRef]
- Qiao, K.; Le Page, L.M.; Chaumeil, M.M. Non-Invasive Differentiation of M1 and M2 Activation in Macrophages Using Hyperpolarized (13)C MRS of Pyruvate and DHA at 1.47 Tesla. Metabolites 2021, 11. [Google Scholar] [CrossRef]
- Michetti, F.; Di Sante, G.; Clementi, M.E.; Sampaolese, B.; Casalbore, P.; Volonte, C.; Romano Spica, V.; Parnigotto, P.P.; Di Liddo, R.; Amadio, S.; et al. Growing role of S100B protein as a putative therapeutic target for neurological- and nonneurological-disorders. Neurosci Biobehav Rev 2021, 127, 446–458. [Google Scholar] [CrossRef] [PubMed]
- Fuss, I.J.; Neurath, M.; Boirivant, M.; Klein, J.S.; de la Motte, C.; Strong, S.A.; Fiocchi, C.; Strober, W. Disparate CD4+ lamina propria (LP) lymphokine secretion profiles in inflammatory bowel disease. Crohn's disease LP cells manifest increased secretion of IFN-gamma, whereas ulcerative colitis LP cells manifest increased secretion of IL-5. J Immunol 1996, 157, 1261–1270. [Google Scholar] [CrossRef] [PubMed]
- Xu, X.R.; Liu, C.Q.; Feng, B.S.; Liu, Z.J. Dysregulation of mucosal immune response in pathogenesis of inflammatory bowel disease. World journal of gastroenterology 2014, 20, 3255–3264. [Google Scholar] [CrossRef]
- Yen, D.; Cheung, J.; Scheerens, H.; Poulet, F.; McClanahan, T.; McKenzie, B.; Kleinschek, M.A.; Owyang, A.; Mattson, J.; Blumenschein, W.; et al. IL-23 is essential for T cell–mediated colitis and promotes inflammation via IL-17 and IL-6. The Journal of clinical investigation 2006, 116, 1310–1316. [Google Scholar] [CrossRef]
- Sharkey, K.A.; Savidge, T.C. Reprint of: Role of enteric neurotransmission in host defense and protection of the gastrointestinal tract. Auton Neurosci 2014, 182, 70–82. [Google Scholar] [CrossRef]
- Coquenlorge, S.; Duchalais, E.; Chevalier, J.; Cossais, F.; Rolli-Derkinderen, M.; Neunlist, M. Modulation of lipopolysaccharide-induced neuronal response by activation of the enteric nervous system. Journal of neuroinflammation 2014, 11, 202. [Google Scholar] [CrossRef] [PubMed]
- Dvorak, A.M.; Onderdonk, A.B.; McLeod, R.S.; Monahan-Earley, R.A.; Cullen, J.; Antonioli, D.A.; Blair, J.E.; Morgan, E.S.; Cisneros, R.L.; Estrella, P.; et al. Axonal necrosis of enteric autonomic nerves in continent ileal pouches. Possible implications for pathogenesis of Crohn's disease. Annals of surgery 1993, 217, 260–271. [Google Scholar] [CrossRef] [PubMed]
- Geboes, K.; Collins, S. Structural abnormalities of the nervous system in Crohn's disease and ulcerative colitis. Neurogastroenterology and motility : the official journal of the European Gastrointestinal Motility Society 1998, 10, 189–202. [Google Scholar] [CrossRef] [PubMed]
- Cirillo, C.; Sarnelli, G.; Esposito, G.; Grosso, M.; Petruzzelli, R.; Izzo, P.; Calì, G.; D'Armiento, F.P.; Rocco, A.; Nardone, G.; et al. Increased mucosal nitric oxide production in ulcerative colitis is mediated in part by the enteroglial-derived S100B protein. Neurogastroenterology and motility : the official journal of the European Gastrointestinal Motility Society 2009, 21, 1209–e1112. [Google Scholar] [CrossRef] [PubMed]
- Esposito, G.; Cirillo, C.; Sarnelli, G.; De Filippis, D.; D'Armiento, F.P.; Rocco, A.; Nardone, G.; Petruzzelli, R.; Grosso, M.; Izzo, P.; et al. Enteric glial-derived S100B protein stimulates nitric oxide production in celiac disease. Gastroenterology 2007, 133, 918–925. [Google Scholar] [CrossRef]
- Barbara, G.; Wang, B.; Stanghellini, V.; de Giorgio, R.; Cremon, C.; Di Nardo, G.; Trevisani, M.; Campi, B.; Geppetti, P.; Tonini, M.; et al. Mast cell-dependent excitation of visceral-nociceptive sensory neurons in irritable bowel syndrome. Gastroenterology 2007, 132, 26–37. [Google Scholar] [CrossRef]
- Ben-Horin, S.; Chowers, Y. Neuroimmunology of the gut: physiology, pathology, and pharmacology. Current opinion in pharmacology 2008, 8, 490–495. [Google Scholar] [CrossRef]
- Abdo, H.; Derkinderen, P.; Gomes, P.; Chevalier, J.; Aubert, P.; Masson, D.; Galmiche, J.P.; Vanden Berghe, P.; Neunlist, M.; Lardeux, B. Enteric glial cells protect neurons from oxidative stress in part via reduced glutathione. FASEB journal : official publication of the Federation of American Societies for Experimental Biology 2010, 24, 1082–1094. [Google Scholar] [CrossRef]
- Savidge, T.C.; Newman, P.; Pothoulakis, C.; Ruhl, A.; Neunlist, M.; Bourreille, A.; Hurst, R.; Sofroniew, M.V. Enteric glia regulate intestinal barrier function and inflammation via release of S-nitrosoglutathione. Gastroenterology 2007, 132, 1344–1358. [Google Scholar] [CrossRef]
- Jessen, K.R.; Mirsky, R. Astrocyte-like glia in the peripheral nervous system: an immunohistochemical study of enteric glia. The Journal of neuroscience : the official journal of the Society for Neuroscience 1983, 3, 2206–2218. [Google Scholar] [CrossRef]
- Cabarrocas, J.; Savidge, T.C.; Liblau, R.S. Role of enteric glial cells in inflammatory bowel disease. Glia 2003, 41, 81–93. [Google Scholar] [CrossRef] [PubMed]
- Capoccia, E.; Cirillo, C.; Gigli, S.; Pesce, M.; D'Alessandro, A.; Cuomo, R.; Sarnelli, G.; Steardo, L.; Esposito, G. Enteric glia: A new player in inflammatory bowel diseases. International journal of immunopathology and pharmacology 2015, 28, 443–451. [Google Scholar] [CrossRef] [PubMed]
- Cirillo, C.; Sarnelli, G.; Esposito, G.; Turco, F.; Steardo, L.; Cuomo, R. S100B protein in the gut: the evidence for enteroglial-sustained intestinal inflammation. World journal of gastroenterology 2011, 17, 1261–1266. [Google Scholar] [CrossRef] [PubMed]
- Anderson, M.A.; Ao, Y.; Sofroniew, M.V. Heterogeneity of reactive astrocytes. Neuroscience letters 2014, 565, 23–29. [Google Scholar] [CrossRef]
- da Cunha Franceschi, R.; Nardin, P.; Machado, C.V.; Tortorelli, L.S.; Martinez-Pereira, M.A.; Zanotto, C.; Gonçalves, C.A.; Zancan, D.M. Enteric glial reactivity to systemic LPS administration: Changes in GFAP and S100B protein. Neuroscience research 2017, 119, 15–23. [Google Scholar] [CrossRef]
- von Boyen, G.B.; Steinkamp, M.; Geerling, I.; Reinshagen, M.; Schäfer, K.H.; Adler, G.; Kirsch, J. Proinflammatory cytokines induce neurotrophic factor expression in enteric glia: a key to the regulation of epithelial apoptosis in Crohn's disease. Inflammatory bowel diseases 2006, 12, 346–354. [Google Scholar] [CrossRef]
- Lu, H.C.; Mackie, K. Review of the Endocannabinoid System. Biol Psychiatry Cogn Neurosci Neuroimaging 2021, 6, 607–615. [Google Scholar] [CrossRef]
- Grotenhermen, F. Pharmacokinetics and pharmacodynamics of cannabinoids. Clin Pharmacokinet 2003, 42, 327–360. [Google Scholar] [CrossRef]
- Morales, P.; Hurst, D.P.; Reggio, P.H. Molecular Targets of the Phytocannabinoids: A Complex Picture. Progress in the chemistry of organic natural products 2017, 103, 103–131. [Google Scholar] [CrossRef] [PubMed]
- Sharkey, K.A.; Wiley, J.W. The Role of the Endocannabinoid System in the Brain-Gut Axis. Gastroenterology 2016, 151, 252–266. [Google Scholar] [CrossRef] [PubMed]
- Bhat, N.R.; Zhang, P.; Hogan, E.L. Thrombin activates mitogen-activated protein kinase in primary astrocyte cultures. J Cell Physiol 1995, 165, 417–424. [Google Scholar] [CrossRef] [PubMed]
- Bouaboula, M.; Poinot-Chazel, C.; Bourrie, B.; Canat, X.; Calandra, B.; Rinaldi-Carmona, M.; Le Fur, G.; Casellas, P. Activation of mitogen-activated protein kinases by stimulation of the central cannabinoid receptor CB1. Biochem J 1995, 312 Pt 2, 637–641. [Google Scholar] [CrossRef]
- Navarrete, M.; Araque, A. Endocannabinoids mediate neuron-astrocyte communication. Neuron 2008, 57, 883–893. [Google Scholar] [CrossRef]
- Pertwee, R.G. Pharmacology of cannabinoid CB1 and CB2 receptors. Pharmacol Ther 1997, 74, 129–180. [Google Scholar] [CrossRef] [PubMed]
- McPartland, J.M.; Duncan, M.; Di Marzo, V.; Pertwee, R.G. Are cannabidiol and Δ9-tetrahydrocannabivarin negative modulators of the endocannabinoid system? A systematic review. British journal of pharmacology 2015, 172, 737–753. [Google Scholar] [CrossRef] [PubMed]
- Trautmann, S.M.; Sharkey, K.A. The Endocannabinoid System and Its Role in Regulating the Intrinsic Neural Circuitry of the Gastrointestinal Tract. Int Rev Neurobiol 2015, 125, 85–126. [Google Scholar] [CrossRef]
- Wright, K.; Rooney, N.; Feeney, M.; Tate, J.; Robertson, D.; Welham, M.; Ward, S. Differential expression of cannabinoid receptors in the human colon: cannabinoids promote epithelial wound healing. Gastroenterology 2005, 129, 437–453. [Google Scholar] [CrossRef]
- Galiegue, S.; Mary, S.; Marchand, J.; Dussossoy, D.; Carriere, D.; Carayon, P.; Bouaboula, M.; Shire, D.; Le Fur, G.; Casellas, P. Expression of central and peripheral cannabinoid receptors in human immune tissues and leukocyte subpopulations. Eur J Biochem 1995, 232, 54–61. [Google Scholar] [CrossRef]
- Spiller, K.J.; Bi, G.H.; He, Y.; Galaj, E.; Gardner, E.L.; Xi, Z.X. Cannabinoid CB(1) and CB(2) receptor mechanisms underlie cannabis reward and aversion in rats. British journal of pharmacology 2019, 176, 1268–1281. [Google Scholar] [CrossRef]
- Alhouayek, M.; Muccioli, G.G. The endocannabinoid system in inflammatory bowel diseases: from pathophysiology to therapeutic opportunity. Trends in molecular medicine 2012, 18, 615–625. [Google Scholar] [CrossRef]
- Izzo, A.A.; Fezza, F.; Capasso, R.; Bisogno, T.; Pinto, L.; Iuvone, T.; Esposito, G.; Mascolo, N.; Di Marzo, V.; Capasso, F. Cannabinoid CB1-receptor mediated regulation of gastrointestinal motility in mice in a model of intestinal inflammation. British journal of pharmacology 2001, 134, 563–570. [Google Scholar] [CrossRef]
- Duncan, M.; Mouihate, A.; Mackie, K.; Keenan, C.M.; Buckley, N.E.; Davison, J.S.; Patel, K.D.; Pittman, Q.J.; Sharkey, K.A. Cannabinoid CB2 receptors in the enteric nervous system modulate gastrointestinal contractility in lipopolysaccharide-treated rats. American journal of physiology. Gastrointestinal and liver physiology 2008, 295, G78–G87. [Google Scholar] [CrossRef] [PubMed]
- Liang, Q.; Dong, S.; Lei, L.; Liu, J.; Zhang, J.; Li, J.; Duan, J.; Fan, D. Protective effects of Sparstolonin B, a selective TLR2 and TLR4 antagonist, on mouse endotoxin shock. Cytokine 2015, 75, 302–309. [Google Scholar] [CrossRef]
- Dattaroy, D.; Seth, R.K.; Das, S.; Alhasson, F.; Chandrashekaran, V.; Michelotti, G.; Fan, D.; Nagarkatti, M.; Nagarkatti, P.; Diehl, A.M.; et al. Sparstolonin B attenuates early liver inflammation in experimental NASH by modulating TLR4 trafficking in lipid rafts via NADPH oxidase activation. Am J Physiol Gastrointest Liver Physiol 2016, 310, G510–525. [Google Scholar] [CrossRef] [PubMed]
- Cornet, A.; Savidge, T.C.; Cabarrocas, J.; Deng, W.L.; Colombel, J.F.; Lassmann, H.; Desreumaux, P.; Liblau, R.S. Enterocolitis induced by autoimmune targeting of enteric glial cells: a possible mechanism in Crohn's disease? Proceedings of the National Academy of Sciences of the United States of America 2001, 98, 13306–13311. [Google Scholar] [CrossRef] [PubMed]
- Cirillo, C.; Sarnelli, G.; Turco, F.; Mango, A.; Grosso, M.; Aprea, G.; Masone, S.; Cuomo, R. Proinflammatory stimuli activates human-derived enteroglial cells and induces autocrine nitric oxide production. Neurogastroenterology and motility : the official journal of the European Gastrointestinal Motility Society 2011, 23, e372–382. [Google Scholar] [CrossRef]
- Dos Santos, R.G.; Guimaraes, F.S.; Crippa, J.A.S.; Hallak, J.E.C.; Rossi, G.N.; Rocha, J.M.; Zuardi, A.W. Serious adverse effects of cannabidiol (CBD): a review of randomized controlled trials. Expert Opin Drug Metab Toxicol 2020, 16, 517–526. [Google Scholar] [CrossRef] [PubMed]
- Atalay, S.; Jarocka-Karpowicz, I.; Skrzydlewska, E. Antioxidative and Anti-Inflammatory Properties of Cannabidiol. Antioxidants (Basel) 2019, 9. [Google Scholar] [CrossRef] [PubMed]
- Consroe, P.; Sandyk, R.; Snider, S.R. Open label evaluation of cannabidiol in dystonic movement disorders. Int J Neurosci 1986, 30, 277–282. [Google Scholar] [CrossRef]
- Parker, L.A.; Mechoulam, R.; Schlievert, C. Cannabidiol, a non-psychoactive component of cannabis and its synthetic dimethylheptyl homolog suppress nausea in an experimental model with rats. Neuroreport 2002, 13, 567–570. [Google Scholar] [CrossRef] [PubMed]
- Matsunaga, T.; Iwawaki, Y.; Watanabe, K.; Yamamoto, I.; Kageyama, T.; Yoshimura, H. Metabolism of delta 9-tetrahydrocannabinol by cytochrome P450 isozymes purified from hepatic microsomes of monkeys. Life Sci 1995, 56, 2089–2095. [Google Scholar] [CrossRef] [PubMed]
- Burstein, S.H. The cannabinoid acids: nonpsychoactive derivatives with therapeutic potential. Pharmacology & therapeutics 1999, 82, 87–96. [Google Scholar] [CrossRef]
- Happyana, N.; Agnolet, S.; Muntendam, R.; Van Dam, A.; Schneider, B.; Kayser, O. Analysis of cannabinoids in laser-microdissected trichomes of medicinal Cannabis sativa using LCMS and cryogenic NMR. Phytochemistry 2013, 87, 51–59. [Google Scholar] [CrossRef]
- Dewey, W.L. Cannabinoid pharmacology. Pharmacol Rev 1986, 38, 151–178. [Google Scholar] [CrossRef] [PubMed]
- Rameshprabu, N.; Moran, M.; Aurel, I.; Gopinath, S.; Smadar, W.; Marcelo, F.; Ahmad, N.; Oded, S.; Puja, K.; Diana, N.; et al. Anti-Inflammatory Activity in Colon Models Is Derived from Δ9-Tetrahydrocannabinolic Acid That Interacts with Additional Compounds in Cannabis Extracts. Cannabis and Cannabinoid Research 2017, 2, 167–182. [Google Scholar] [CrossRef]
- Wargent, E.T.; Zaibi, M.S.; Silvestri, C.; Hislop, D.C.; Stocker, C.J.; Stott, C.G.; Guy, G.W.; Duncan, M.; Di Marzo, V.; Cawthorne, M.A. The cannabinoid Delta(9)-tetrahydrocannabivarin (THCV) ameliorates insulin sensitivity in two mouse models of obesity. Nutr Diabetes 2013, 3, e68. [Google Scholar] [CrossRef] [PubMed]
- Rock, E.M.; Sticht, M.A.; Duncan, M.; Stott, C.; Parker, L.A. Evaluation of the potential of the phytocannabinoids, cannabidivarin (CBDV) and Delta(9) -tetrahydrocannabivarin (THCV), to produce CB1 receptor inverse agonism symptoms of nausea in rats. Br J Pharmacol 2013, 170, 671–678. [Google Scholar] [CrossRef]
- Riedel, G.; Fadda, P.; McKillop-Smith, S.; Pertwee, R.G.; Platt, B.; Robinson, L. Synthetic and plant-derived cannabinoid receptor antagonists show hypophagic properties in fasted and non-fasted mice. British journal of pharmacology 2009, 156, 1154–1166. [Google Scholar] [CrossRef]
- Hill, A.J.; Weston, S.E.; Jones, N.A.; Smith, I.; Bevan, S.A.; Williamson, E.M.; Stephens, G.J.; Williams, C.M.; Whalley, B.J. Delta(9)-Tetrahydrocannabivarin suppresses in vitro epileptiform and in vivo seizure activity in adult rats. Epilepsia 2010, 51, 1522–1532. [Google Scholar] [CrossRef] [PubMed]
- Bolognini, D.; Costa, B.; Maione, S.; Comelli, F.; Marini, P.; Di Marzo, V.; Parolaro, D.; Ross, R.A.; Gauson, L.A.; Cascio, M.G.; et al. The plant cannabinoid Delta9-tetrahydrocannabivarin can decrease signs of inflammation and inflammatory pain in mice. British journal of pharmacology 2010, 160, 677–687. [Google Scholar] [CrossRef] [PubMed]
- Bae, J.S.; Jeon, Y.; Kim, S.M.; Jang, J.Y.; Park, M.K.; Kim, I.-H.; Hwang, D.S.; Lim, D.-S.; Lee, H. Depletion of MOB1A/B causes intestinal epithelial degeneration by suppressing Wnt activity and activating BMP/TGF-β signaling. Cell Death & Disease 2018, 9, 1083. [Google Scholar] [CrossRef]
- Li, F.J.; Zheng, S.R.; Wang, D.M. Adrenomedullin: an important participant in neurological diseases. Neural Regen Res 2020, 15, 1199–1207. [Google Scholar] [CrossRef] [PubMed]
- Mahil, S.K.; Twelves, S.; Farkas, K.; Setta-Kaffetzi, N.; Burden, A.D.; Gach, J.E.; Irvine, A.D.; Képíró, L.; Mockenhaupt, M.; Oon, H.H.; et al. AP1S3 Mutations Cause Skin Autoinflammation by Disrupting Keratinocyte Autophagy and Up-Regulating IL-36 Production. Journal of Investigative Dermatology 2016, 136, 2251–2259. [Google Scholar] [CrossRef] [PubMed]
- Chwee, J.Y.; Khatoo, M.; Tan, N.Y.; Gasser, S. Apoptotic Cells Release IL1 Receptor Antagonist in Response to Genotoxic Stress. Cancer immunology research 2016, 4, 294–302. [Google Scholar] [CrossRef] [PubMed]
- Leon, G.; Hussey, S.; Walsh, P.T. The Diverse Roles of the IL-36 Family in Gastrointestinal Inflammation and Resolution. Inflammatory bowel diseases 2021, 27, 440–450. [Google Scholar] [CrossRef] [PubMed]
- Rashid, M.-u.; Lorzadeh, S.; Gao, A.; Ghavami, S.; Coombs, K.M. PSMA2 knockdown impacts expression of proteins involved in immune and cellular stress responses in human lung cells. Biochimica et Biophysica Acta (BBA) - Molecular Basis of Disease 2023, 1869, 166617. [Google Scholar] [CrossRef] [PubMed]
- Gade, A.K.; Douthit, N.T.; Townsley, E. Medical Management of Crohn's Disease. Cureus 2020, 12, e8351. [Google Scholar] [CrossRef]
- Tam, V.; Schwartz, M.; Holder-Murray, J.; Salgado Pogacnik, J. Change in paradigm: impact of an IBD medical home on the outpatient management of acute severe ulcerative colitis. BMJ Case Rep 2019, 12. [Google Scholar] [CrossRef] [PubMed]
- Cai, Z.; Wang, S.; Li, J. Treatment of Inflammatory Bowel Disease: A Comprehensive Review. Front Med (Lausanne) 2021, 8, 765474. [Google Scholar] [CrossRef]
- Varkas, G.; Thevissen, K.; De Brabanter, G.; Van Praet, L.; Czul-Gurdian, F.; Cypers, H.; De Kock, J.; Carron, P.; De Vos, M.; Hindryckx, P.; et al. An induction or flare of arthritis and/or sacroiliitis by vedolizumab in inflammatory bowel disease: a case series. Ann Rheum Dis 2017, 76, 878–881. [Google Scholar] [CrossRef]
- Fok, K.C.; Ng, W.W.; Henderson, C.J.; Connor, S.J. Cutaneous sarcoidosis in a patient with ulcerative colitis on infliximab. J Crohns Colitis 2012, 6, 708–712. [Google Scholar] [CrossRef]
- Zhang, J.; Zhao, Y.; Hou, T.; Zeng, H.; Kalambhe, D.; Wang, B.; Shen, X.; Huang, Y. Macrophage-based nanotherapeutic strategies in ulcerative colitis. J Control Release 2020, 320, 363–380. [Google Scholar] [CrossRef]
- Sharkey, K.A. Emerging roles for enteric glia in gastrointestinal disorders. The Journal of clinical investigation 2015, 125, 918–925. [Google Scholar] [CrossRef]
- Neunlist, M.; Rolli-Derkinderen, M.; Latorre, R.; Van Landeghem, L.; Coron, E.; Derkinderen, P.; De Giorgio, R. Enteric glial cells: recent developments and future directions. Gastroenterology 2014, 147, 1230–1237. [Google Scholar] [CrossRef]
- López-Gómez, L.; Szymaszkiewicz, A.; Zielińska, M.; Abalo, R. The Enteric Glia and Its Modulation by the Endocannabinoid System, a New Target for Cannabinoid-Based Nutraceuticals? Molecules 2022, 27, 6773. [Google Scholar] [CrossRef] [PubMed]
- Galiazzo, G.; Giancola, F.; Stanzani, A.; Fracassi, F.; Bernardini, C.; Forni, M.; Pietra, M.; Chiocchetti, R. Localization of cannabinoid receptors CB1, CB2, GPR55, and PPARalpha in the canine gastrointestinal tract. Histochem Cell Biol 2018, 150, 187–205. [Google Scholar] [CrossRef] [PubMed]
- Kumar, P.; Nagarajan, A.; Uchil, P.D. Analysis of Cell Viability by the MTT Assay. Cold Spring Harb Protoc 2018, 2018. [Google Scholar] [CrossRef]
- Pertwee, R.G. The diverse CB1 and CB2 receptor pharmacology of three plant cannabinoids: delta9-tetrahydrocannabinol, cannabidiol and delta9-tetrahydrocannabivarin. British journal of pharmacology 2008, 153, 199–215. [Google Scholar] [CrossRef] [PubMed]
- Margulies, J.E.; Hammer, R.P. Δ9-Tetrahydrocannabinol alters cerebral metabolism in a biphasic, dose-dependent mannier in rat brain. European journal of pharmacology 1991, 202, 373–378. [Google Scholar] [CrossRef] [PubMed]
- Sarne, Y.; Toledano, R.; Rachmany, L.; Sasson, E.; Doron, R. Reversal of age-related cognitive impairments in mice by an extremely low dose of tetrahydrocannabinol. Neurobiol Aging 2018, 61, 177–186. [Google Scholar] [CrossRef]
- Bilkei-Gorzo, A.; Albayram, O.; Draffehn, A.; Michel, K.; Piyanova, A.; Oppenheimer, H.; Dvir-Ginzberg, M.; Racz, I.; Ulas, T.; Imbeault, S.; et al. A chronic low dose of Delta(9)-tetrahydrocannabinol (THC) restores cognitive function in old mice. Nat Med 2017, 23, 782–787. [Google Scholar] [CrossRef] [PubMed]
- MacKenzie, S.; Fernandez-Troy, N.; Espel, E. Post-transcriptional regulation of TNF-alpha during in vitro differentiation of human monocytes/macrophages in primary culture. J Leukoc Biol 2002, 71, 1026–1032. [Google Scholar] [CrossRef] [PubMed]
- MacKenzie, S.; Planas, J.V.; Goetz, F.W. LPS-stimulated expression of a tumor necrosis factor-alpha mRNA in primary trout monocytes and in vitro differentiated macrophages. Dev Comp Immunol 2003, 27, 393–400. [Google Scholar] [CrossRef]
- De Filippis, D.; Esposito, G.; Cirillo, C.; Cipriano, M.; De Winter, B.Y.; Scuderi, C.; Sarnelli, G.; Cuomo, R.; Steardo, L.; De Man, J.G.; et al. Cannabidiol reduces intestinal inflammation through the control of neuroimmune axis. PloS one 2011, 6, e28159. [Google Scholar] [CrossRef] [PubMed]
- Di Marzo, V. New approaches and challenges to targeting the endocannabinoid system. Nat Rev Drug Discov 2018, 17, 623–639. [Google Scholar] [CrossRef]
- Chen, W.; Kaplan, B.L.; Pike, S.T.; Topper, L.A.; Lichorobiec, N.R.; Simmons, S.O.; Ramabhadran, R.; Kaminski, N.E. Magnitude of stimulation dictates the cannabinoid-mediated differential T cell response to HIVgp120. J Leukoc Biol 2012, 92, 1093–1102. [Google Scholar] [CrossRef]
- Zuardi, A.W.; Shirakawa, I.; Finkelfarb, E.; Karniol, I.G. Action of cannabidiol on the anxiety and other effects produced by delta 9-THC in normal subjects. Psychopharmacology (Berl) 1982, 76, 245–250. [Google Scholar] [CrossRef] [PubMed]
- Hayakawa, K.; Mishima, K.; Hazekawa, M.; Sano, K.; Irie, K.; Orito, K.; Egawa, T.; Kitamura, Y.; Uchida, N.; Nishimura, R.; et al. Cannabidiol potentiates pharmacological effects of Delta(9)-tetrahydrocannabinol via CB(1) receptor-dependent mechanism. Brain Res 2008, 1188, 157–164. [Google Scholar] [CrossRef] [PubMed]
- Laprairie, R.B.; Bagher, A.M.; Kelly, M.E.; Denovan-Wright, E.M. Cannabidiol is a negative allosteric modulator of the cannabinoid CB1 receptor. Br J Pharmacol 2015, 172, 4790–4805. [Google Scholar] [CrossRef] [PubMed]
- Watanabe, K.; Yamaori, S.; Funahashi, T.; Kimura, T.; Yamamoto, I. Cytochrome P450 enzymes involved in the metabolism of tetrahydrocannabinols and cannabinol by human hepatic microsomes. Life Sci 2007, 80, 1415–1419. [Google Scholar] [CrossRef] [PubMed]
- Verhoeckx, K.C.; Korthout, H.A.; van Meeteren-Kreikamp, A.P.; Ehlert, K.A.; Wang, M.; van der Greef, J.; Rodenburg, R.J.; Witkamp, R.F. Unheated Cannabis sativa extracts and its major compound THC-acid have potential immuno-modulating properties not mediated by CB1 and CB2 receptor coupled pathways. Int Immunopharmacol 2006, 6, 656–665. [Google Scholar] [CrossRef]
- Silvestri, C.; Paris, D.; Martella, A.; Melck, D.; Guadagnino, I.; Cawthorne, M.; Motta, A.; Di Marzo, V. Two non-psychoactive cannabinoids reduce intracellular lipid levels and inhibit hepatosteatosis. J Hepatol 2015, 62, 1382–1390. [Google Scholar] [CrossRef]
- Romano, B.; Pagano, E.; Orlando, P.; Capasso, R.; Cascio, M.G.; Pertwee, R.; Marzo, V.D.; Izzo, A.A.; Borrelli, F. Pure Δ(9)-tetrahydrocannabivarin and a Cannabis sativa extract with high content in Δ(9)-tetrahydrocannabivarin inhibit nitrite production in murine peritoneal macrophages. Pharmacological research 2016, 113, 199–208. [Google Scholar] [CrossRef] [PubMed]
- Tortolani, D.; Di Meo, C.; Standoli, S.; Ciaramellano, F.; Kadhim, S.; Hsu, E.; Rapino, C.; Maccarrone, M. Rare Phytocannabinoids Exert Anti-Inflammatory Effects on Human Keratinocytes via the Endocannabinoid System and MAPK Signaling Pathway. Int J Mol Sci 2023, 24. [Google Scholar] [CrossRef]
- De Petrocellis, L.; Ligresti, A.; Moriello, A.S.; Allara, M.; Bisogno, T.; Petrosino, S.; Stott, C.G.; Di Marzo, V. Effects of cannabinoids and cannabinoid-enriched Cannabis extracts on TRP channels and endocannabinoid metabolic enzymes. British journal of pharmacology 2011, 163, 1479–1494. [Google Scholar] [CrossRef]
- Romano, B.; Borrelli, F.; Fasolino, I.; Capasso, R.; Piscitelli, F.; Cascio, M.; Pertwee, R.; Coppola, D.; Vassallo, L.; Orlando, P.; et al. The cannabinoid TRPA1 agonist cannabichromene inhibits nitric oxide production in macrophages and ameliorates murine colitis. British journal of pharmacology 2013, 169, 213–229. [Google Scholar] [CrossRef] [PubMed]
- Izzo, A.A.; Capasso, R.; Aviello, G.; Borrelli, F.; Romano, B.; Piscitelli, F.; Gallo, L.; Capasso, F.; Orlando, P.; Di Marzo, V. Inhibitory effect of cannabichromene, a major non-psychotropic cannabinoid extracted from Cannabis sativa, on inflammation-induced hypermotility in mice. British journal of pharmacology 2012, 166, 1444–1460. [Google Scholar] [CrossRef] [PubMed]
- Ligresti, A.; Moriello, A.S.; Starowicz, K.; Matias, I.; Pisanti, S.; De Petrocellis, L.; Laezza, C.; Portella, G.; Bifulco, M.; Di Marzo, V. Antitumor activity of plant cannabinoids with emphasis on the effect of cannabidiol on human breast carcinoma. The Journal of pharmacology and experimental therapeutics 2006, 318, 1375–1387. [Google Scholar] [CrossRef] [PubMed]
- Ruhaak, L.R.; Felth, J.; Karlsson, P.C.; Rafter, J.J.; Verpoorte, R.; Bohlin, L. Evaluation of the cyclooxygenase inhibiting effects of six major cannabinoids isolated from Cannabis sativa. Biological & pharmaceutical bulletin 2011, 34, 774–778. [Google Scholar] [CrossRef]
- Deininger, M.H.; Meyermann, R.; Trautmann, K.; Morgalla, M.; Duffner, F.; Grote, E.H.; Wickboldt, J.; Schluesener, H.J. Cyclooxygenase (COX)-1 expressing macrophages/microglial cells and COX-2 expressing astrocytes accumulate during oligodendroglioma progression. Brain research 2000, 885, 111–116. [Google Scholar] [CrossRef] [PubMed]
- Andrieux, P.; Chevillard, C.; Cunha-Neto, E.; Nunes, J.P.S. Mitochondria as a Cellular Hub in Infection and Inflammation. Int J Mol Sci 2021, 22. [Google Scholar] [CrossRef] [PubMed]
- Cheng, J.; Zhang, R.; Xu, Z.; Ke, Y.; Sun, R.; Yang, H.; Zhang, X.; Zhen, X.; Zheng, L.-T. Early glycolytic reprogramming controls microglial inflammatory activation. Journal of neuroinflammation 2021, 18, 129. [Google Scholar] [CrossRef] [PubMed]
- Orihuela, R.; McPherson, C.A.; Harry, G.J. Microglial M1/M2 polarization and metabolic states. British journal of pharmacology 2016, 173, 649–665. [Google Scholar] [CrossRef]
- Shrestha, N.; Bahnan, W.; Wiley, D.J.; Barber, G.; Fields, K.A.; Schesser, K. Eukaryotic Initiation Factor 2 (eIF2) Signaling Regulates Proinflammatory Cytokine Expression and Bacterial Invasion*. Journal of Biological Chemistry 2012, 287, 28738–28744. [Google Scholar] [CrossRef]
- Lee, D.G.; Nam, B.R.; Huh, J.-W.; Lee, D.-S. Isoliquiritigenin Reduces LPS-Induced Inflammation by Preventing Mitochondrial Fission in BV-2 Microglial Cells. Inflammation 2021, 44, 714–724. [Google Scholar] [CrossRef] [PubMed]
- Seemann, S.; Zohles, F.; Lupp, A. Comprehensive comparison of three different animal models for systemic inflammation. J Biomed Sci 2017, 24, 60. [Google Scholar] [CrossRef]
- Liu, J.; Zong, Z.; Zhang, W.; Chen, Y.; Wang, X.; Shen, J.; Yang, C.; Liu, X.; Deng, H. Nicotinamide Mononucleotide Alleviates LPS-Induced Inflammation and Oxidative Stress via Decreasing COX-2 Expression in Macrophages. Front Mol Biosci 2021, 8, 702107. [Google Scholar] [CrossRef] [PubMed]
- Juknat, A.; Pietr, M.; Kozela, E.; Rimmerman, N.; Levy, R.; Gao, F.; Coppola, G.; Geschwind, D.; Vogel, Z. Microarray and Pathway Analysis Reveal Distinct Mechanisms Underlying Cannabinoid-Mediated Modulation of LPS-Induced Activation of BV-2 Microglial Cells. PloS one 2013, 8, e61462. [Google Scholar] [CrossRef] [PubMed]
- Dello Russo, C.; Lisi, L.; Feinstein, D.L.; Navarra, P. mTOR kinase, a key player in the regulation of glial functions: Relevance for the therapy of multiple sclerosis. Glia 2013, 61, 301–311. [Google Scholar] [CrossRef] [PubMed]
- Dello Russo, C.; Lisi, L.; Tringali, G.; Navarra, P. Involvement of mTOR kinase in cytokine-dependent microglial activation and cell proliferation. Biochemical pharmacology 2009, 78, 1242–1251. [Google Scholar] [CrossRef] [PubMed]
- Gao, T.; Wright-Jin, E.C.; Sengupta, R.; Anderson, J.B.; Heuckeroth, R.O. Cell-autonomous retinoic acid receptor signaling has stage-specific effects on mouse enteric nervous system. JCI Insight 2021, 6. [Google Scholar] [CrossRef] [PubMed]
- Hong, K.; Zhang, Y.; Guo, Y.; Xie, J.; Wang, J.; He, X.; Lu, N.; Bai, A. All-trans retinoic acid attenuates experimental colitis through inhibition of NF-κB signaling. Immunology Letters 2014, 162, 34–40. [Google Scholar] [CrossRef] [PubMed]
- Zhang, Y.; Nicholatos, J.; Dreier, J.R.; Ricoult, S.J.; Widenmaier, S.B.; Hotamisligil, G.S.; Kwiatkowski, D.J.; Manning, B.D. Coordinated regulation of protein synthesis and degradation by mTORC1. Nature 2014, 513, 440–443. [Google Scholar] [CrossRef]
- Kouloulia, S.; Hallin, E.I.; Simbriger, K.; Amorim, I.S.; Lach, G.; Amvrosiadis, T.; Chalkiadaki, K.; Kampaite, A.; Truong, V.T.; Hooshmandi, M.; et al. Raptor-Mediated Proteasomal Degradation of Deamidated 4E-BP2 Regulates Postnatal Neuronal Translation and NF-kappaB Activity. Cell Rep 2019, 29, 3620–3635. [Google Scholar] [CrossRef]
- Rühl, A.; Franzke, S.; Collins, S.M.; Stremmel, W. Interleukin-6 expression and regulation in rat enteric glial cells. American Journal of Physiology-Gastrointestinal and Liver Physiology 2001, 280, G1163–G1171. [Google Scholar] [CrossRef]
- Yu, Y.; Ge, N.; Xie, M.; Sun, W.; Burlingame, S.; Pass, A.K.; Nuchtern, J.G.; Zhang, D.; Fu, S.; Schneider, M.D.; et al. Phosphorylation of Thr-178 and Thr-184 in the TAK1 T-loop Is Required for Interleukin (IL)-1-mediated Optimal NFκB and AP-1 Activation as Well as IL-6 Gene Expression*. Journal of Biological Chemistry 2008, 283, 24497–24505. [Google Scholar] [CrossRef]
- Li, R.; Ji, C.; Dai, M.; Huang, J.; Xu, W.; Zhang, H.; Ma, Y. An update on the role of tumor necrosis factor alpha stimulating gene-6 in inflammatory diseases. Molecular Immunology 2022, 152, 224–231. [Google Scholar] [CrossRef]
- Singh, U.; Tabibian, J.; Venugopal, S.K.; Devaraj, S.; Jialal, I. Development of an in vitro screening assay to test the antiinflammatory properties of dietary supplements and pharmacologic agents. Clin Chem 2005, 51, 2252–2256. [Google Scholar] [CrossRef] [PubMed]
- Keren-Shaul, H.; Kenigsberg, E.; Jaitin, D.A.; David, E.; Paul, F.; Tanay, A.; Amit, I. MARS-seq2.0: an experimental and analytical pipeline for indexed sorting combined with single-cell RNA sequencing. Nature protocols 2019, 14, 1841–1862. [Google Scholar] [CrossRef] [PubMed]
- Jaitin, D.A.; Kenigsberg, E.; Keren-Shaul, H.; Elefant, N.; Paul, F.; Zaretsky, I.; Mildner, A.; Cohen, N.; Jung, S.; Tanay, A.; et al. Massively parallel single-cell RNA-seq for marker-free decomposition of tissues into cell types. Science 2014, 343, 776–779. [Google Scholar] [CrossRef] [PubMed]
- Martin, M. Cutadapt removes adapter sequences from high-throughput sequencing reads. 2011 2011, 17, 3. [Google Scholar] [CrossRef]
- Anders, S.; Pyl, P.T.; Huber, W. HTSeq--a Python framework to work with high-throughput sequencing data. Bioinformatics 2015, 31, 166–169. [Google Scholar] [CrossRef] [PubMed]
- Love, M.I.; Huber, W.; Anders, S. Moderated estimation of fold change and dispersion for RNA-seq data with DESeq2. Genome Biol 2014, 15, 550. [Google Scholar] [CrossRef] [PubMed]
- Köster, J.; Rahmann, S. Snakemake-a scalable bioinformatics workflow engine. Bioinformatics 2018, 34, 3600. [Google Scholar] [CrossRef]
- RStudio, Team. P. RStudio: Integrated Development for R. RStudio; 2020. [Google Scholar]
Figure 1.
Pretreatment of J774A1 and EGC with THC (A-C), CBD (D,E) and THC-COOH (F-H) for 1h and then incubation with LPS 0.05µg/mL and 1µg/mL for J774A1 and EGC respectively for additional 24h. Control represent J774A1/EGCs without treatment, 0.05/1μg/mL LPS represent the positive control for J774A1/EGCs (respectively) and 5μg/mL Dexamethasone and 10µg/mL Ssnb treatment represents the negative control for J774A1 or EGC respectively. A. Secretion of TNFɑ by J774A1 cells treated with 0.05-10µg/mL THC and 0.05µg/mL LPS, B. secretion of S100B from EGCs pretreated with 0.05 and 0.1µg/mL THC with and w/o 1µg/mL LPS. C. expression GFAP from EGCs pretreated with 0.05 and 0.1µg/mL THC with and w/o 1µg/mL LPS, D. TNFɑ secretion from J774A1 pretreated with 0.01-3µg/mL CBD with 0.05µg/mL LPS, E. TNFɑ secretion from J774A1 pretreated with a combination of THC+CBD and 0.05µg/mL LPS, F. TNFɑ secretion from J774A1 pretreated with 1nM-10µM THC-COOH with 0.05µg/mL LPS, G. secretion of S100B from EGCs pretreated with 1nM-10µM THC-COOH with 0.05µg/mL LPS, H. expression GFAP from EGCs pretreated with 1nM-10µM THC-COOH with 0.05µg/mL LPS. N=3 for all J774A1 TNFɑ secretion, N=4 for ECG S100B secretion, N=6 for GFAP expression. All samples were compared to positive LPS control using Dunnett's multiple comparison test.
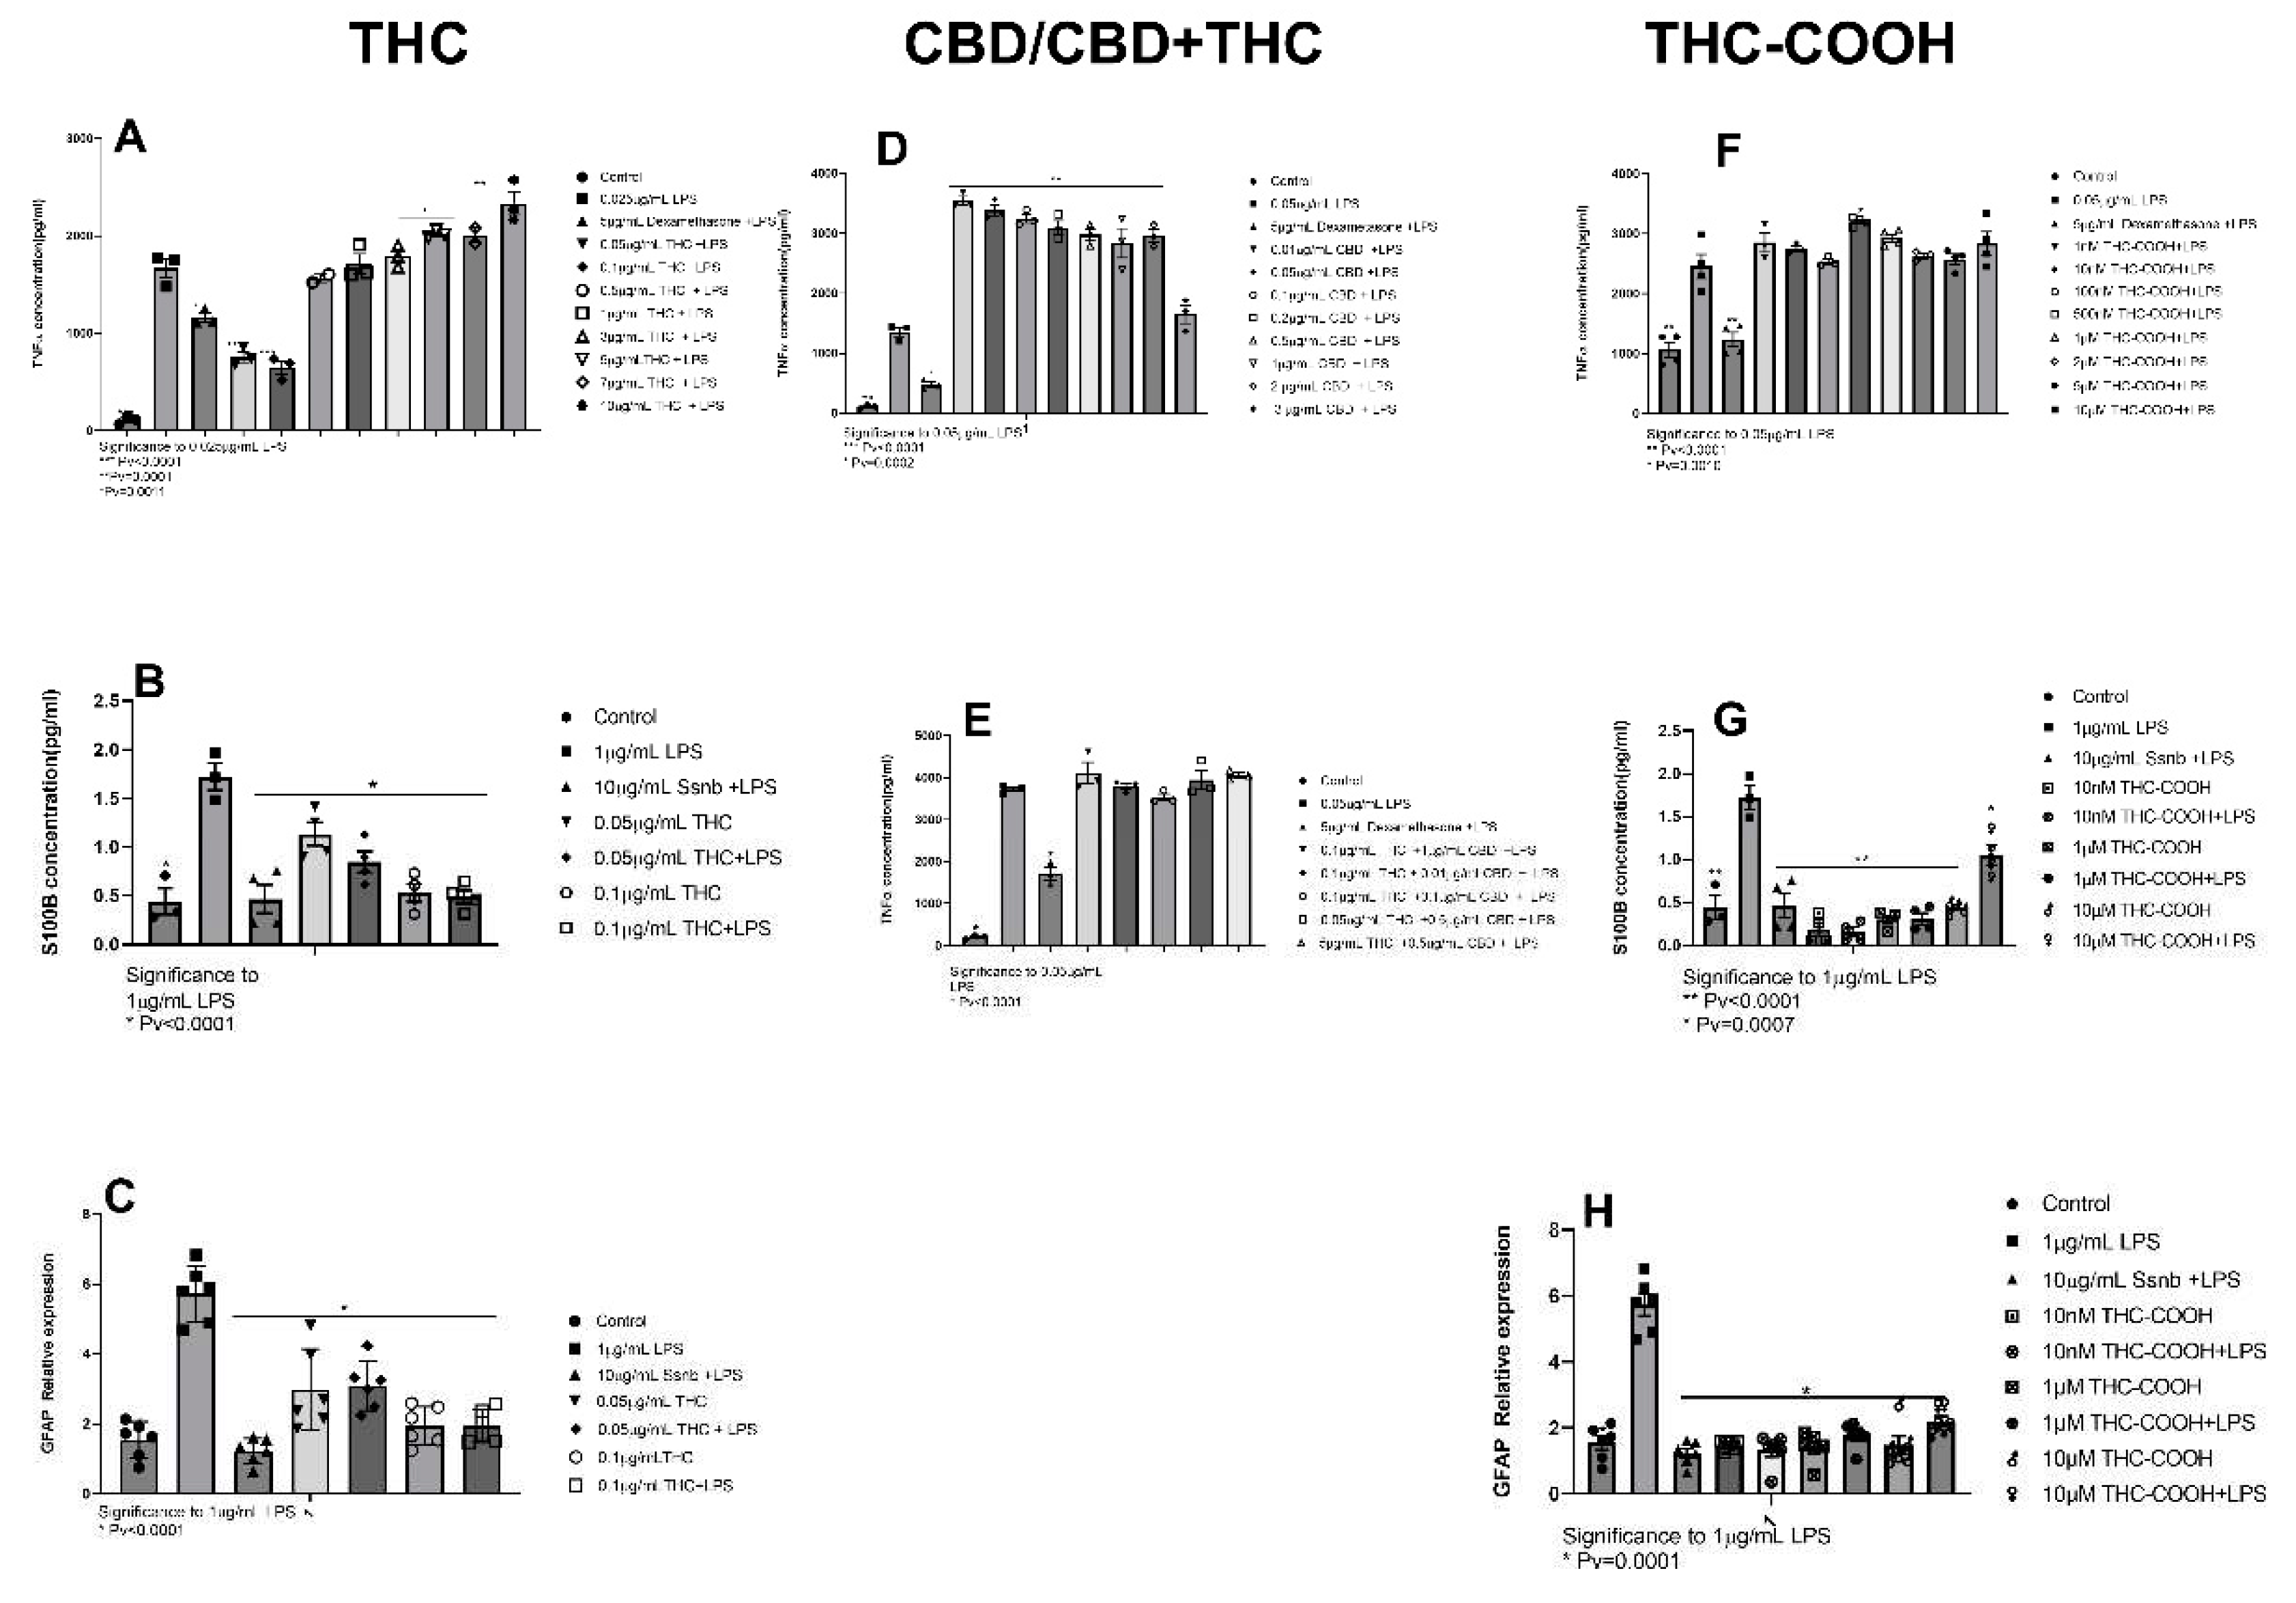
Figure 2.
Pretreatment of J774A1 and EGC with THCA (A-C), CBC (D-F) and CBG (F-H) for 1h and then incubation with LPS 0.05µg/mL and 1µg/mL for J774A1 and EGC, respectfully, for 4h. Control represent J774A1/EGCs without treatment, 0.05/1μg/mL LPS represent the positive control for J774A1/EGCs (respectively) and 5μg/mL Dexamethasone and 10µg/mL Ssnb treatment represents the negative control for J774A1 or EGC respectively. A. Secretion of TNFɑ by J774A1 cells treated with 1nM-10µM THCA and 0.05µg/mL LPS, B. secretion of S100B from EGCs pretreated with 1nM-10µM THCA with and w/o 1µg/mL LPS. C. Expression GFAP from EGCs pretreated 1nM-10µM THCA and 0.05µg/mL with and w/o 1µg/mL LPS, D. TNFɑ secretion from J774A1 pretreated with 1nM-20µM CBC with 0.05µg/mL LPS, E. secretion of S100B from EGCs pretreated with a 1nM-20µM CBC with 1µg/mL LPS, F. expression GFAP from EGCs pretreated with 1nM-20µM CBC with 1µg/mL LPS, G. TNFɑ secretion from J774A1 pretreated with 0.05-20 µM CBG with 0.05µg/mL LPS, H. secretion of S100B from EGCs pretreated with a 1-20 µM CBG with 1µg/mL LPS, I. expression GFAP from EGCs pretreated with 1-20µM CBG with or w/o 1µg/mL LPS, N=3 for all. J774A1 TNFɑ secretion, N=4 for ECG S100B secretion, N=6 for GFAP expression. All samples were compared to positive LPS control using Dunnett's multiple comparison test.
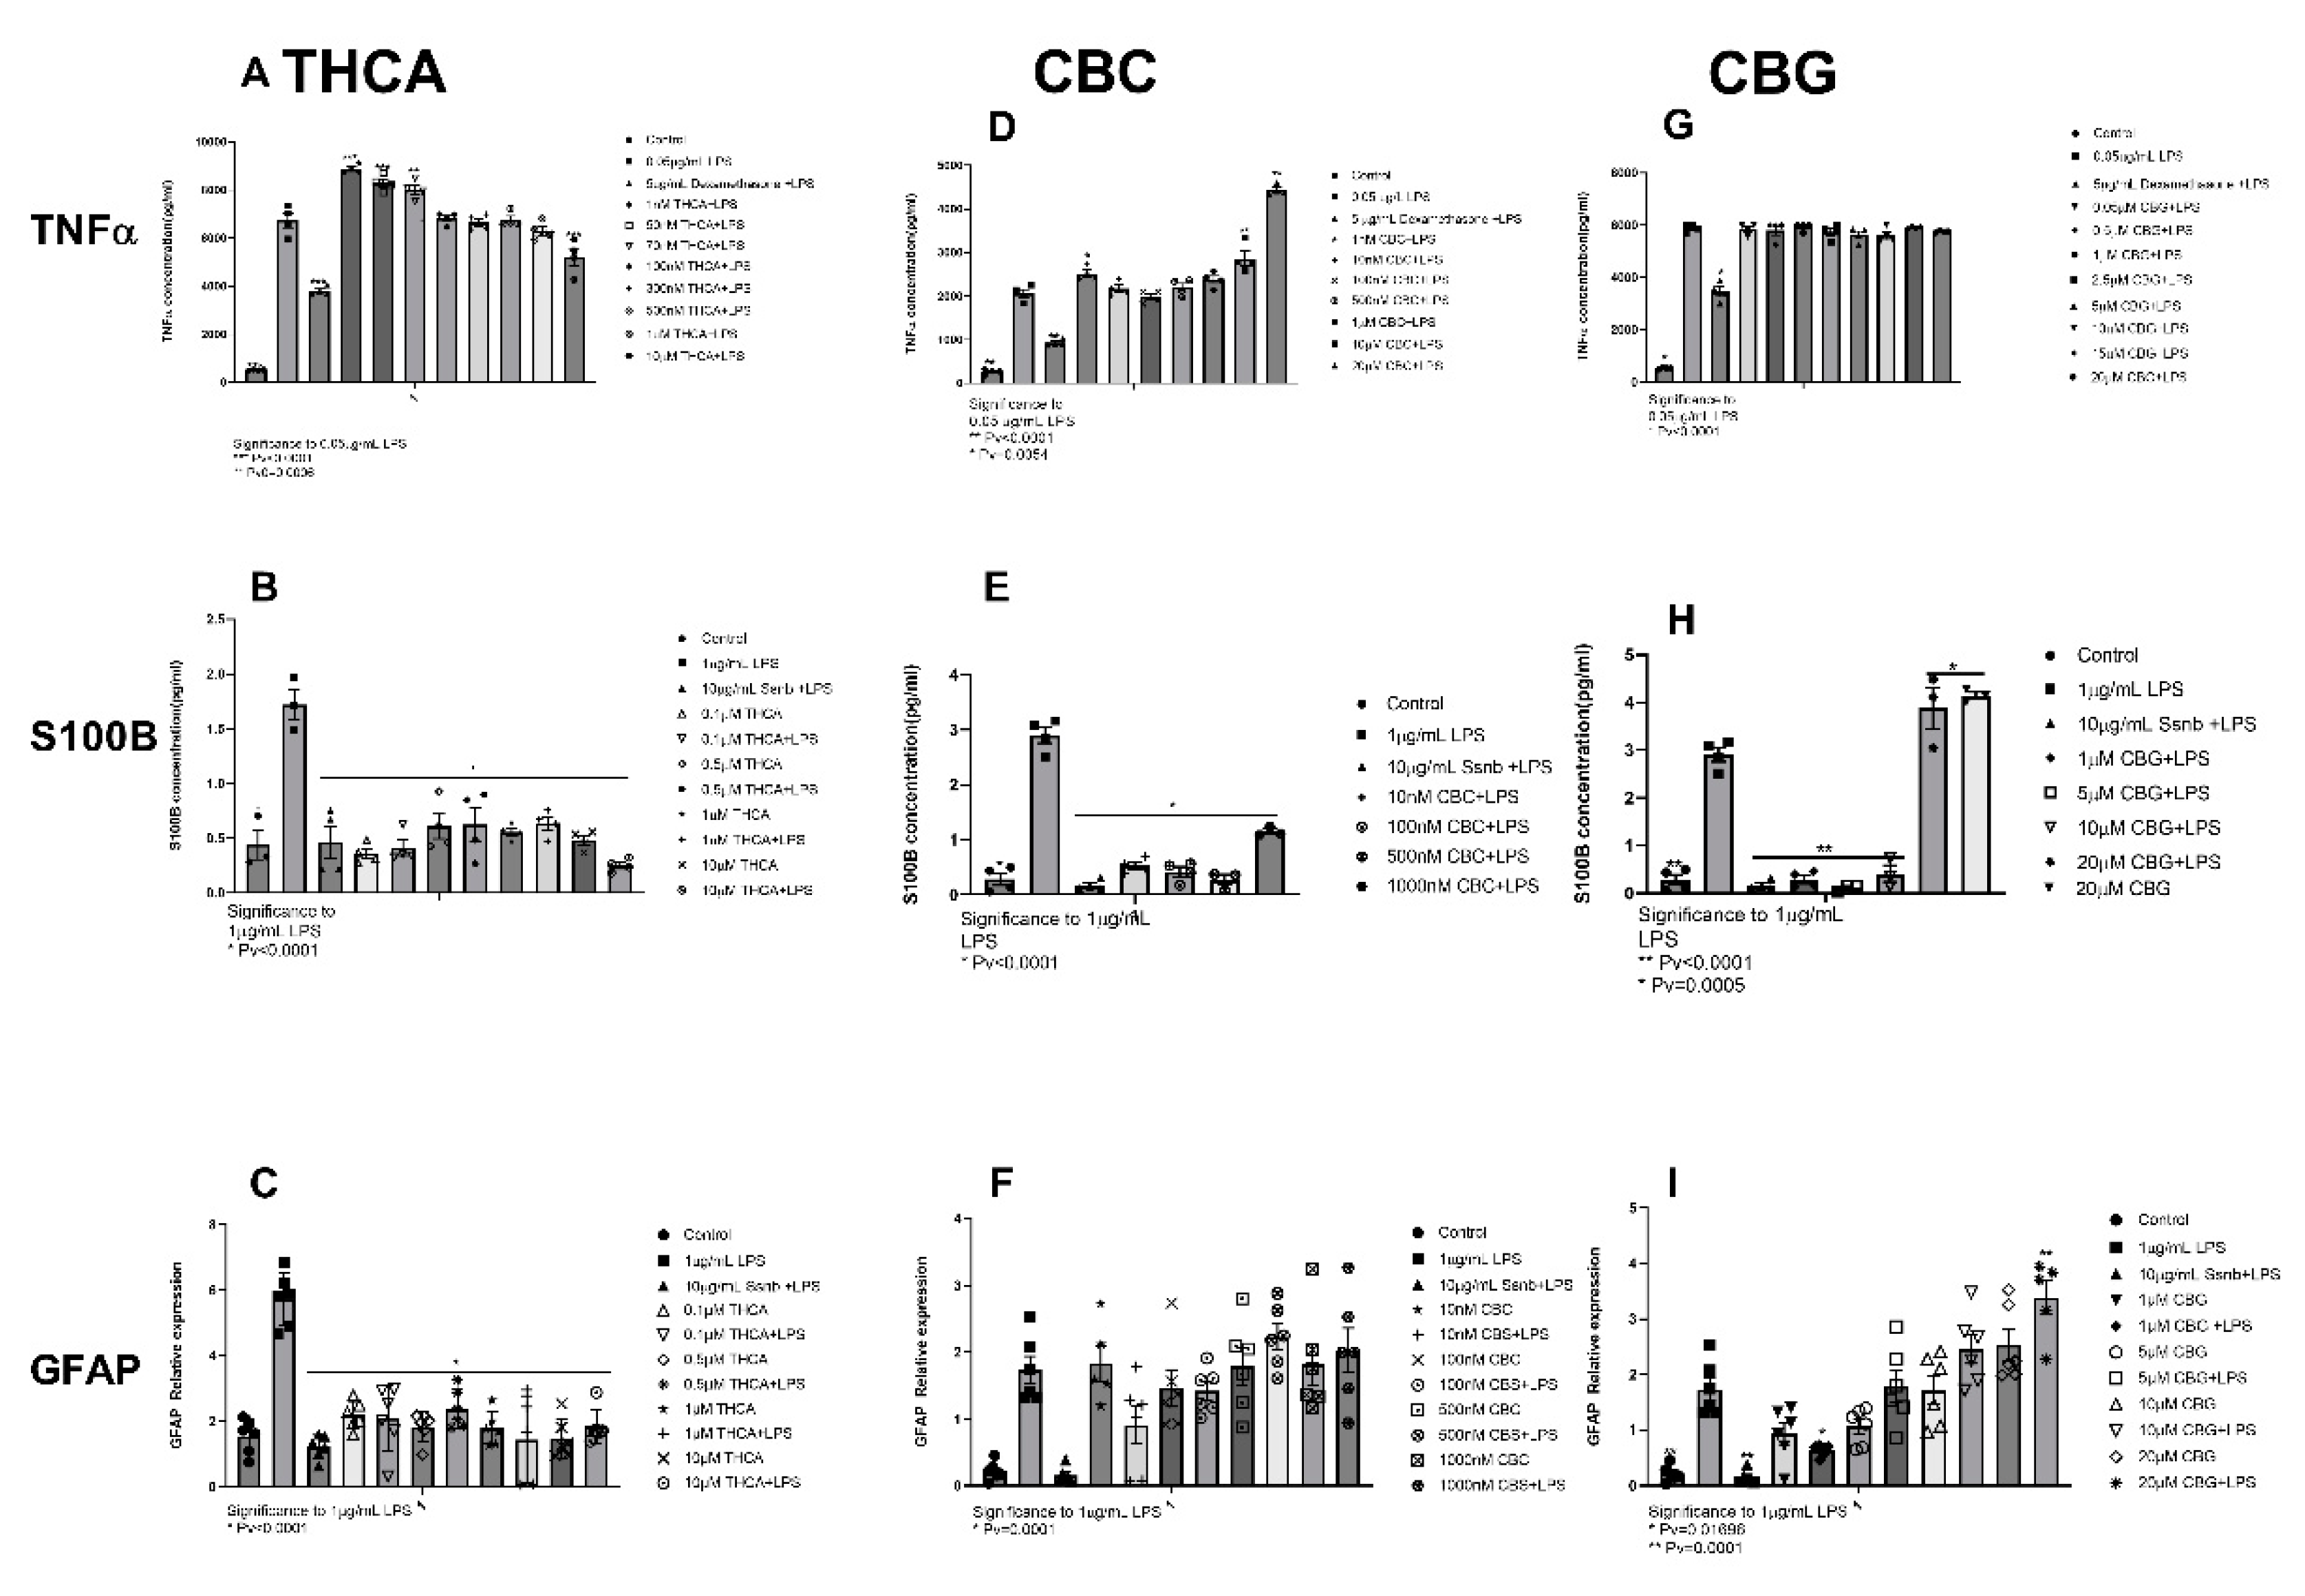
Figure 3.
Pretreatment of J77A1 macrophages with increasing concentrations of. J77A1 cells were pretreated with 0.2nM-15nM THCV for 1h and then incubated with 0.05µg/L of LPS for 4h. Control represent J774A1 cells without treatment, 0.05μg/mL LPS represent the positive control and, 5μg/mL Dexamethasone treatment represents the negative control. N=4. All samples were compared to positive LPS control using Dunnett's multiple comparison test. .
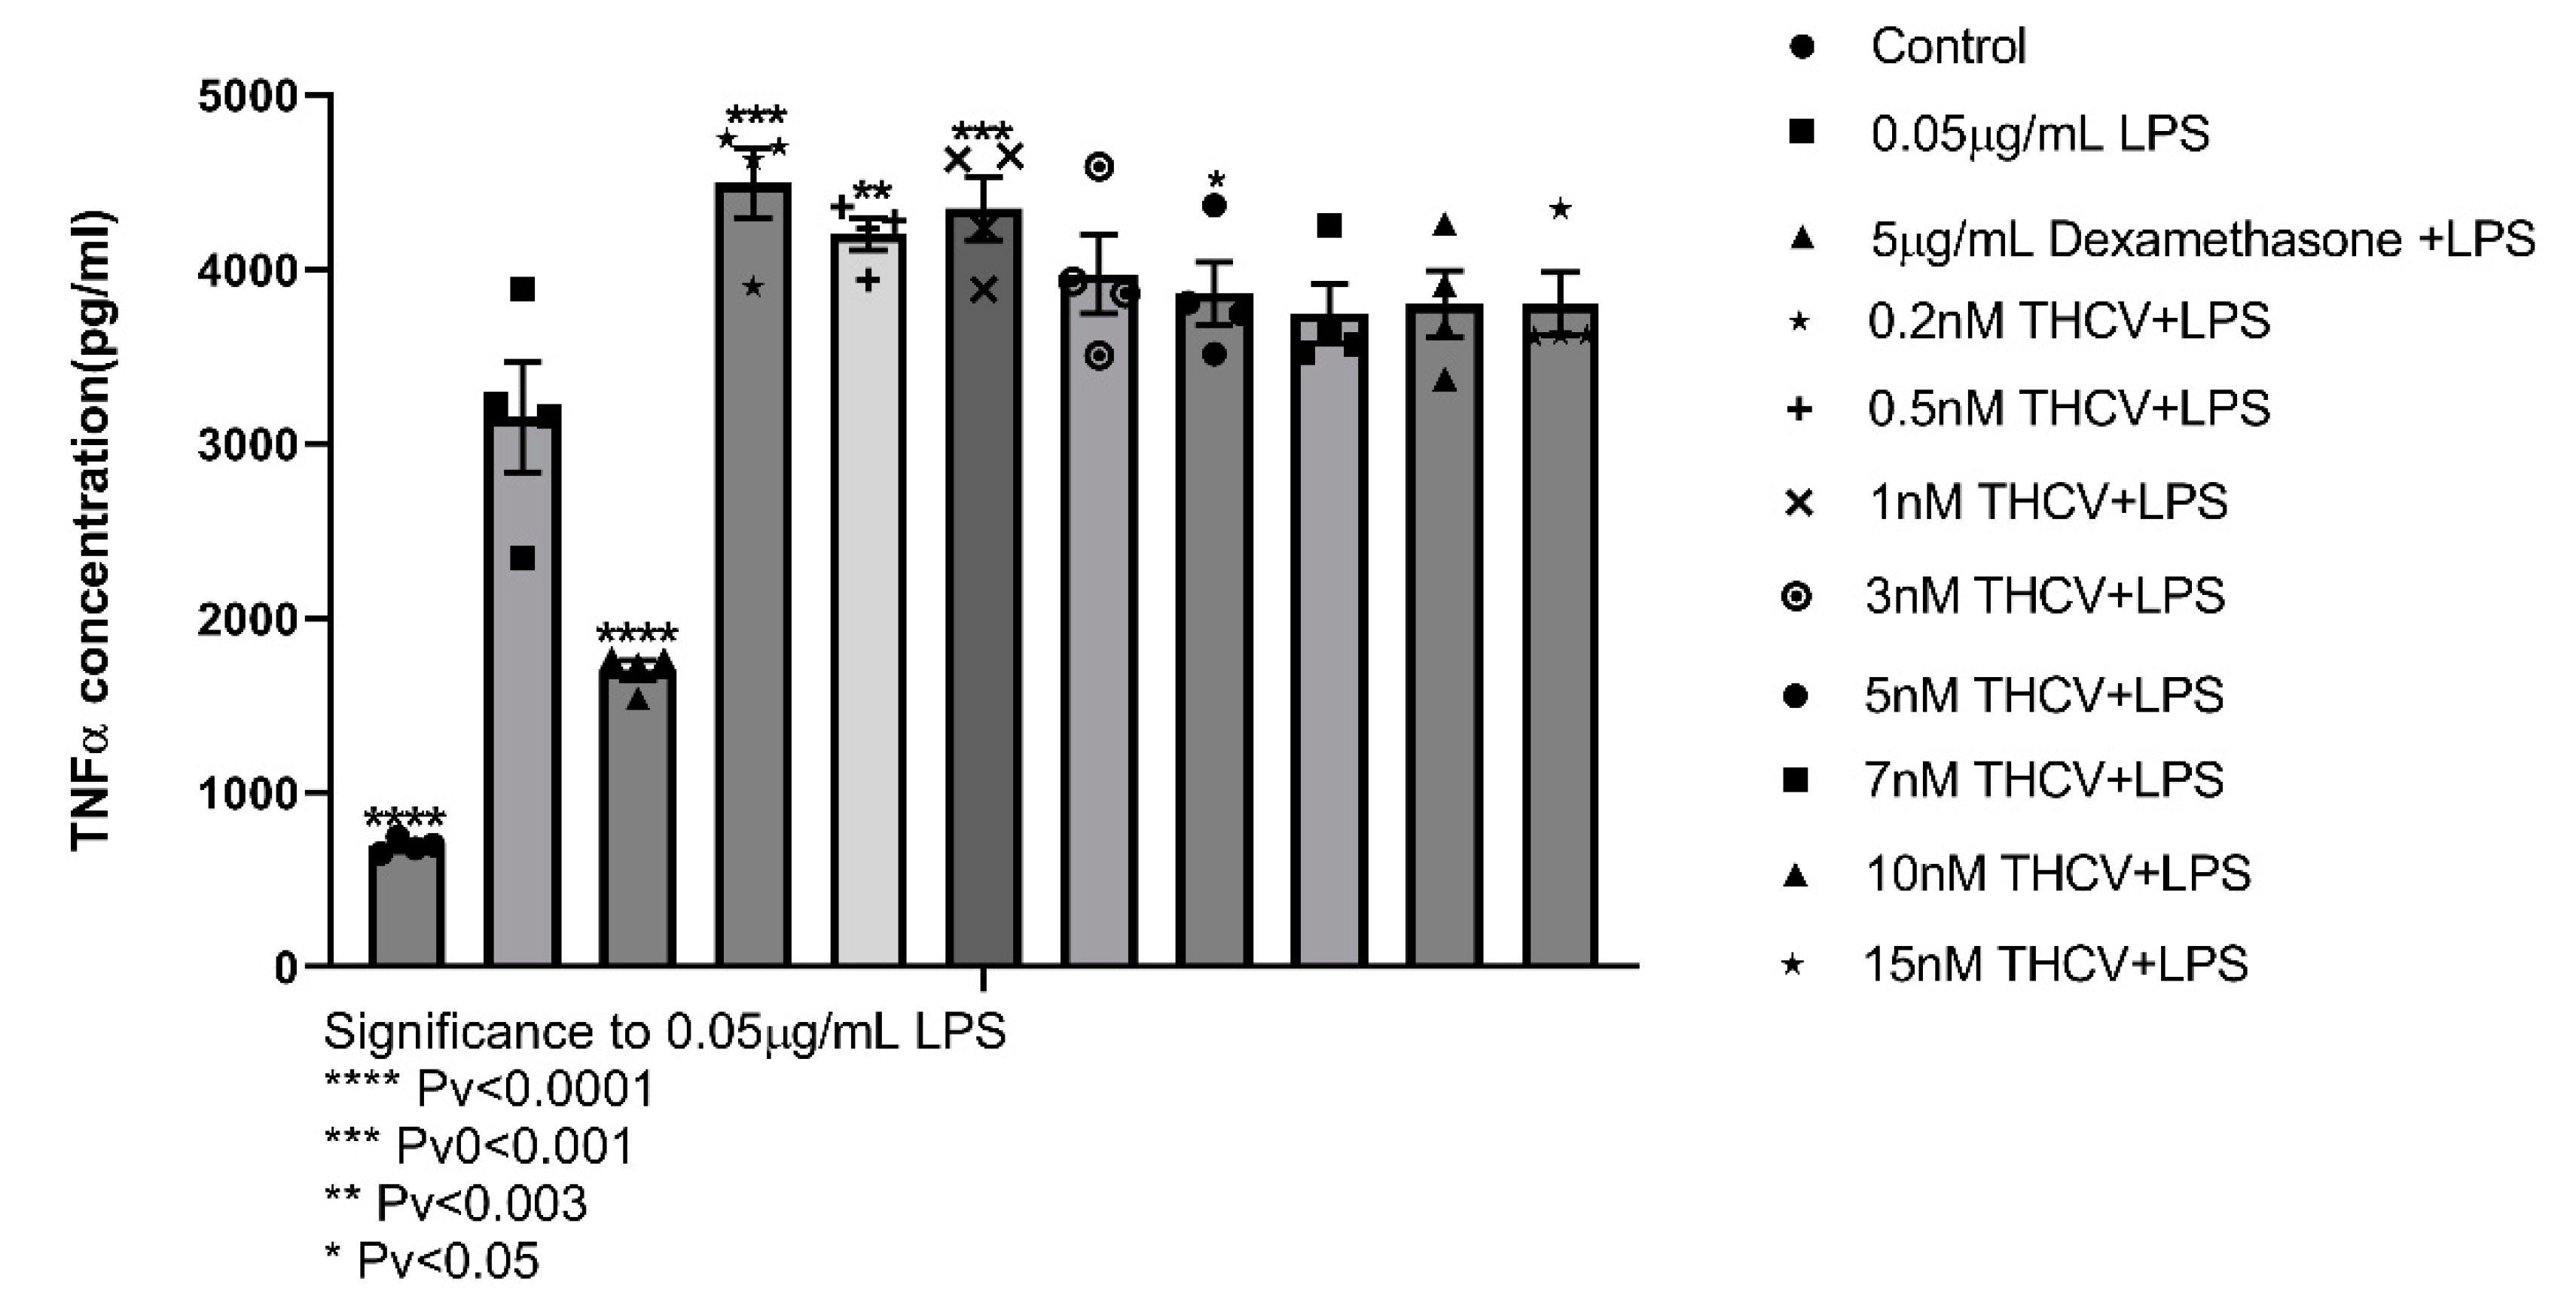
Figure 4.
Differentially Expressed Genes (DEG) in Entro Glial Cells (EGC): A: Differential expression of All groups. B. non-treated cell compared to cells treated with LPS 1µg/mL for 24h C: 1h pretreatment with 0.1µg/mL THC before 24h of LPS compared to only LPS 1µg/mL. D: 1h pretreatment of 10nM of THC-COOH before 24h of LP compared to only LPS 1µg/mL.2.2.1. Pathway enrichment analysis.
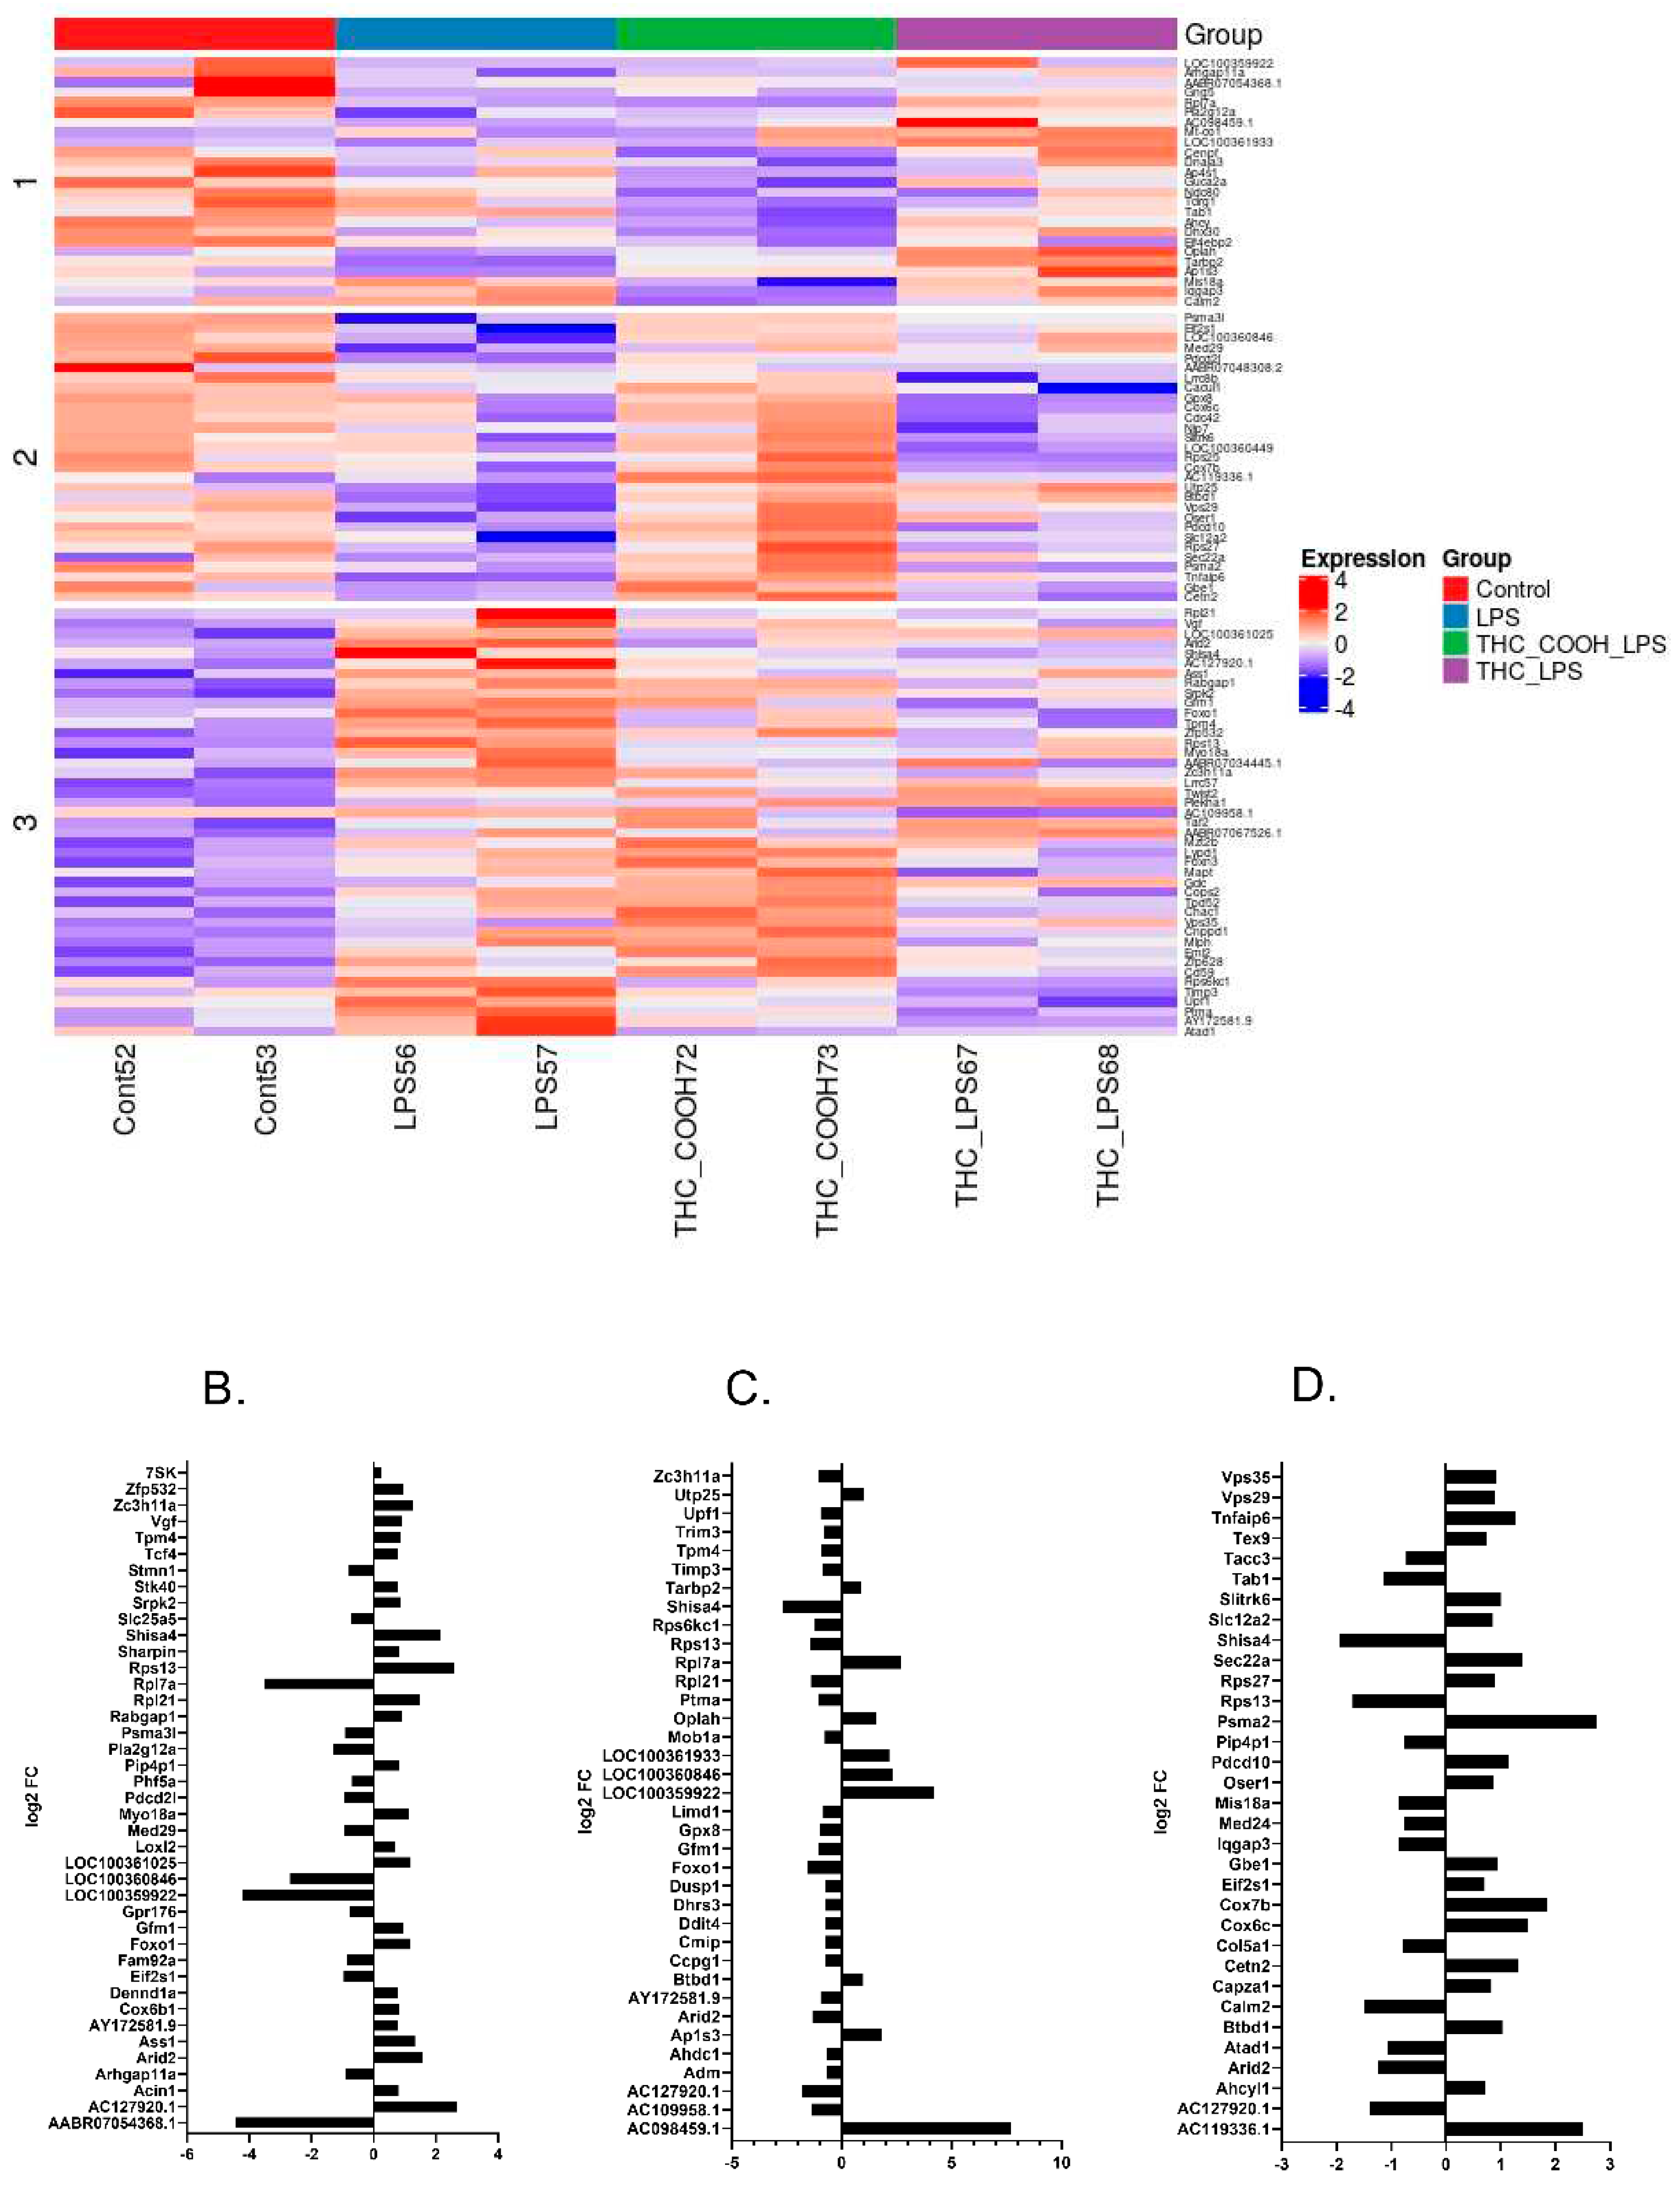
Figure 5.
EGC were either untreated or incubated with 1µg/mL of LPS (A and D). In treatment groups cells were pretreated for 1h with 0.1µg/mL of THC (B and E) or 10nM of THC-COOH (C and F). IPA was conducted on three experimental groups. Pathway enrichment (A-C), networks showing most hits (D-F). Pathway analysis of A. LPS vs untreated cells, B. Cells pretreated for 1h with 0.1µg/mL of THC, C. Cells pretreated for 1h with 10nM of THC-COOH. Threshold 1.3 –logPv. D. cell cycle and cell death network affected by addition of LPS to untreated cells. E. Proteosome network effected by pretreatment of THC. F. Cell cycle and cell death network affected by pretreatment of cells with THC-COOH. G. Legend for network. N=2.
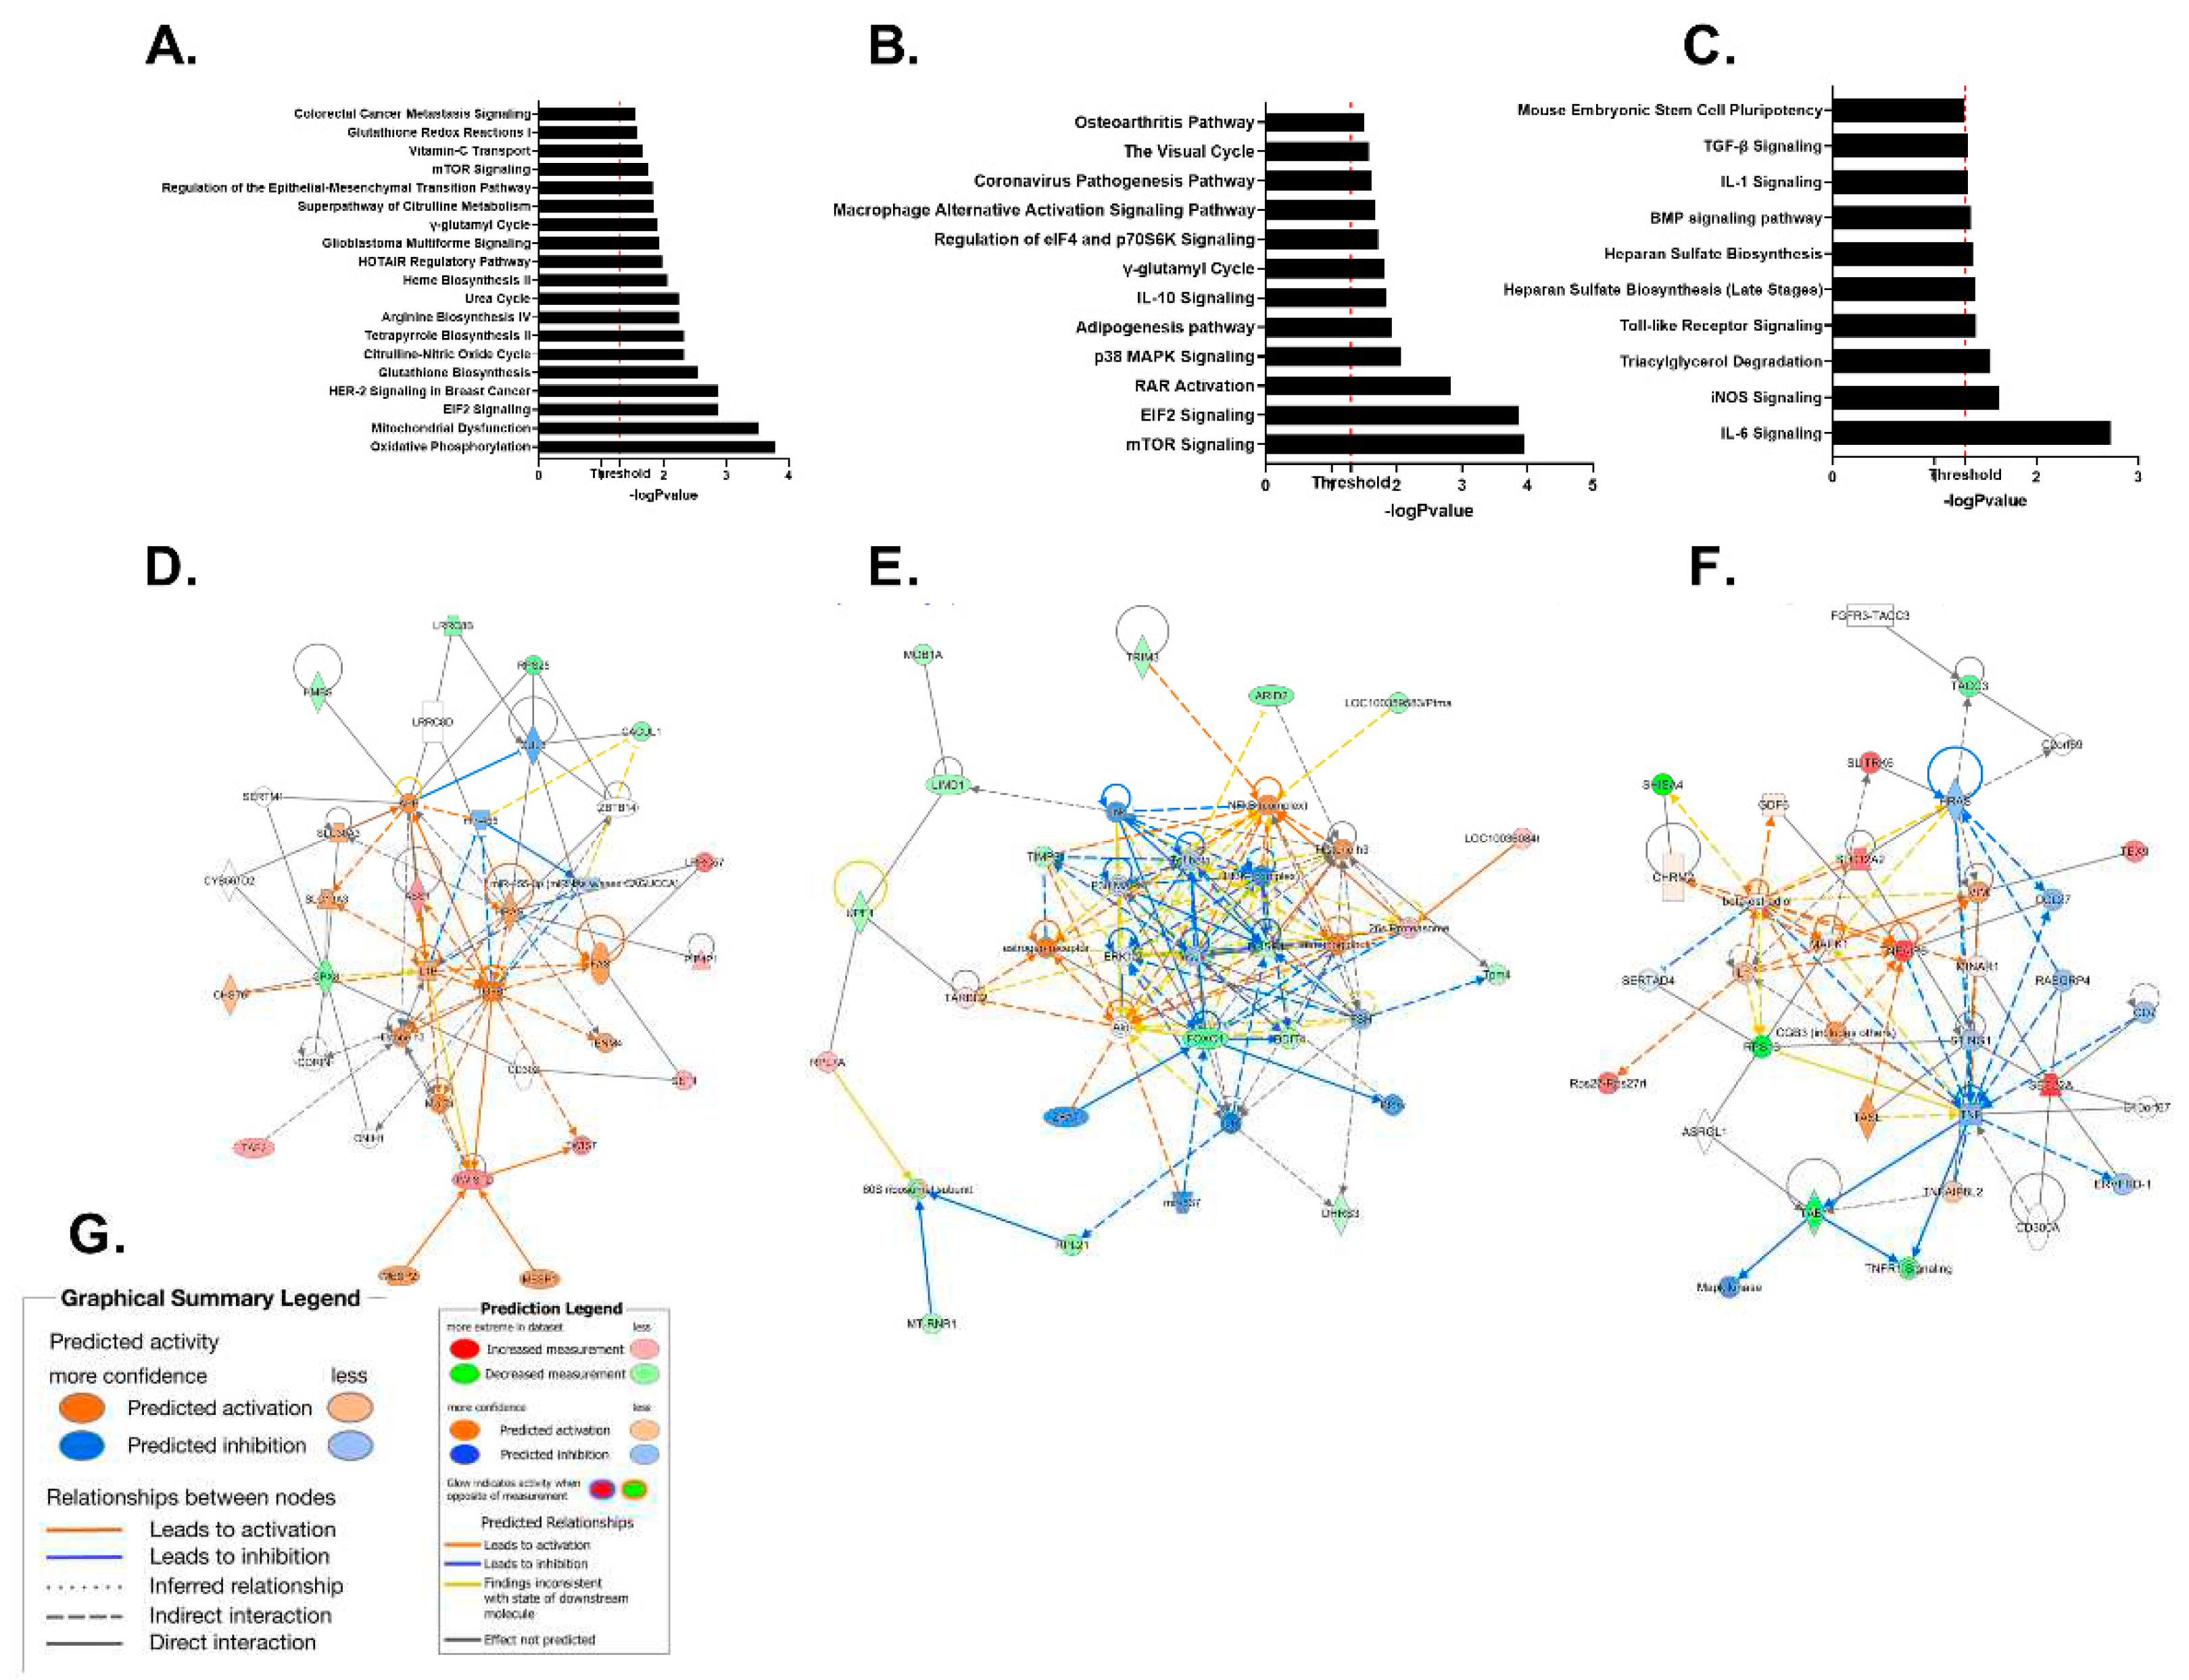
Disclaimer/Publisher’s Note: The statements, opinions and data contained in all publications are solely those of the individual author(s) and contributor(s) and not of MDPI and/or the editor(s). MDPI and/or the editor(s) disclaim responsibility for any injury to people or property resulting from any ideas, methods, instructions or products referred to in the content. |
© 2023 by the authors. Licensee MDPI, Basel, Switzerland. This article is an open access article distributed under the terms and conditions of the Creative Commons Attribution (CC BY) license (https://creativecommons.org/licenses/by/4.0/).
Copyright: This open access article is published under a Creative Commons CC BY 4.0 license, which permit the free download, distribution, and reuse, provided that the author and preprint are cited in any reuse.


