
Submitted:
07 August 2023
Posted:
09 August 2023
You are already at the latest version
Abstract
Bisphenol A analogs (BPA analogs) are emerging contaminants with a rising production caused by the replacement of BPA with these compounds. The increased production of BPA analogs is leading to an increased release into various ecosystems, including sea. The aim of this study was to evaluate the biological effects of BPA analogs on a primary producer, the diatom Phaeodactylum tricornutum Bohlin. Three different BPA analogs (BPAF, BPF, and BPS) and their mixture were tested at the environmental relevant concentration of 300 ng/L. Growth curve, cell size and several biomarkers of oxidative stress and oxidative damage were measured. Our results indicated that the tested compounds caused alteration of the growth and induced oxidative stress altering many antioxidant enzymes. However, no oxidative damages were observed.
Keywords:
bisphenol analogs
; BPA
; microalgae
; biomarkers
; Phaeodactylum tricornutum
1. Introduction
Among emerging contaminants, bisphenols have received many interests by researchers. The main bisphenol is bisphenol A (BPA) that is used as plasticizer in the polycarbonate plastic production. BPA has many other uses such as in thermal paper as color developer, epoxy resins, medical equipment, and consumer electronics [1]. Recently, BPA has been restricted in some industrial activities. Indeed, it is known that it can cause oxidative stress and toxic effects on reproductive system in both humans and animals. The main restrictions regard the ban of BPA in the manufacture of baby bottles in USA, Canada, and EU. In addition, the BPA usage was settled to less than 0.02% in thermal paper in EU [2]. These restrictions have led to the replace of BPA with other bisphenols called bisphenol A analogs (BPA analogs). The main BPA analogs that are currently used are bisphenol F (BPF), bisphenol S (BPS), and bisphenol AF (BPAF). These compounds have many uses such as in food packaging, water pipes, industrial floors, plastics, adhesives, epoxy glues, thermal receipt papers and in common polymer applications [3]. Besides their increasing use, data on BPA analogs production are scarce, even if many studies showed that it is increasing [3,4]. Indeed, BPS production has increased twice between 2016 and 2017, with a reported annual production of 1000–10,000 tons [5,6]. Similarly, the BPAF annual production highly increased between 1986 and 2002 in USA and its manufacture/import in the EU is 100–1000 tons per year [7,8].
Bisphenols reach the aquatic environment from discharges from urban and industrial areas, and by the plastic degradation. Indeed, due to their use as plasticizers, they are released by microplastics that can also transfer these compounds in other environments. Bisphenols are mainly biodegraded, even if their half-life in water is highly variable due to the environmental conditions. However, some bisphenols can be rapidly degraded in river water such as BPF, which was completely biodegraded in 37 days while others (BPAF, BPE, and BPB) are more persistent [9]. The EU settled guidelines to classify the toxicity of a compound according to the EC50 value: very toxic (<1mg/L), toxic to aquatic organisms (1-10 mg/L), harmful to aquatic organisms (10-100 mg/L); compounds with an associated EC50 value above 100 mg/L are not classified [10]. In many studies BPS has been classified as harmful for the different microalgal species tested [11,12], while BPAF was considered as toxic [12,13]. However, some studies on other algae, reported that BPS was more toxic whereas BPAF showed a lower toxicity [14,15]. Regarding the BPF, its toxic classification varied from toxic to harmful for aquatic organisms [16,17]. The environmental concentrations of BPA analogs are often in the range of a few ng/L [18]. However, recent studies indicated higher concentrations, with levels of hundreds and thousands of ng/L in both fresh and marine environments [18]. These values, exceed the predicted no-effect concentration (PNEC) for BPA settled by EU at 1500 ng/L for freshwater and 150 ng/L in marine water [19]. For instance, BPAF was recorded at the mean concentration of 140 ng/L in surface water in China [20], while BPF reached 2850 ng/L and BPS reached 65,600 ng/L in surface water of Japan and China, respectively [21, 22]. In the marine environment, bisphenol analogs have a common concentration from very few ng/L up to tens of ng/L, even if their concentrations can reach higher concentrations, as in the case of BPF that had a maximum concentration of 282 ng/L and 1470 ng/L in seawater in South China and in the Tokyo Bay, respectively [22, 23]. The high interest and concern about BPA analogs, consequence of their rising production/release, collides with the limited data available on their toxicity on microalgae and primary producers in general. In this study we evaluated for the first time the effects of single BPAF, BPF BPS and their mixture at environmentally realistic concentrations on both growth, cell size and biochemical parameters of the microalga Phaeodactylum tricornutum Bohlin 1897, a diatom taxon commonly present in seawaters as primary producer.
2. Materials and Methods
2.1. Microalga Exposure
Phaeodactylum tricornutum was purchased from Culture Collection of Algae at Goettingen University (SAG) and it was incubated in the F/2 medium [24]. Stock culture was acclimated to the experimental conditions in a culture chamber at 16°C, light intensity of 40.5 µmol photons m−2s−1 and a photoperiod of 12:12 light/dark. The stock solutions (1 mg/L) of BPAF and BPF were made in methanol, while the BPS was dissolved in distilled water. Stocks of microalgal cultures were inoculated in Erlenmeyer flasks containing 200 mL of F/2 medium and exposed in triplicate to the bisphenols: BPAF, BPF, BPS and to their mixture. A concentration of 300 ng/L of each bisphenol or 100 ng/L of each of them in the mixture treatment was adopted. In addition, a control plus methanol was tested. Cells from stock culture (inoculum) were added to obtain an initial concentration of 5*105 cells/mL. The cell concentration was measured through a Scepter™ 2.0 Automated Cell Counter (Millipore, FL, USA) and the data were previously validated using a Neubauer hemocytometer through a light microscope (Leica). All the biochemical analyses were carried out in two different growth phases: exponential and at the beginning of the stationary phase corresponding to 5 and 9 days of exposure, respectively.
2.2. Growth Curve
Microalgal growth, diameter and volume were measured using a Scepter™ 2.0 Automated Cell Counter (Millipore, FL, USA) every day of exposure. Briefly, 20 µL of cell culture were added to 2 mL of Coulter Isoton II diluent. The diatom concentration was expressed as the number of cells (105)/mL of medium, while diameter and volume were expressed in µm and picolitres (pL), respectively.
2.3. Biochemical Assays
Culture cells were centrifuged at 6000 g and the pellets were frozen in liquid nitrogen and stored at -80°C. Analyses were performed in triplicate. Before the biochemical assays, the pellets were sonicated in four volumes of 10 mM Tris-HCl buffer, pH 7.5, containing 0.15 M KCl, 0.5 M sucrose, 1 mM EDTA and protease inhibitor cocktail (1:10 v/v) (Sigma-Aldrich). The protein concentration was quantified according to Bradford et al. [25].
The total antioxidant capacity was measured according to the CUPRAC method [26]. Briefly, the reaction produced cupric ions that reacted with a specific indicator and the complex was measured at 450 nm using a microplate reader. Results are expressed as mM of Trolox equivalents.
Total SOD activity was measured according to the method proposed by Crapo et al. [27] using the xanthine oxidase/cytochrome c reaction. Enzyme activity was expressed as U/mg protein and one unit of SOD was defined as the amount of sample causing 50% inhibition under the assay conditions.
CAT activity was measured following the method proposed by Aebi [28]. The enzyme activity in a volume of 30 µL of tissue SN was measured at 240 nm and expressed as U/mg protein; one unit of CAT was defined as the amount of enzyme that catalysed the detoxification of 1 μmol of H2O2/min.
Glutathione reductase (GR) activity was evaluated according to Smith et al. [29], by measuring the (5-thio (2-nitrobenzoic acid)) TNB production at 412 nm. The enzyme activity was expressed as U/mg protein.
Glutathione S-transferase (GST) activity was measured according to the method described in Habig et al. [30] using 1-chloro-2,4-dinitrobenzene (CDNB) and reduced glutathione (GSH) as substrate. GST activity was expressed as nmol/min/mg protein.
Selenium dependent glutathione peroxidase (GPX) activity was measured following the method of Lawrence and Burk [31], by measuring the decreased absorbance at 340 nm caused by the NADPH oxidation. GPX Se-dependent activity was expressed as mmoli/min/mg protein.
Ascorbate peroxidase (APX) activity was evaluated according to Nakano and Asada [32] and modified by Janknegt et al. [33] using the ascorbate and hydrogen peroxide as reactive. APX activity was expressed as U/mg protein.
Oxidative damage was measured in both protein with the protein carbonyl content assay (PCC) and in lipid with the level of peroxidation (LPO). Briefly, PCC was measured using the method of Mecocci et al. [34] following the reaction with 2,4-dinitrophenylhydrazide (DNPH). Results were expressed as nmol carbonyl group/mg protein. The LPO was quantified using the malondialdehyde (MDA) assay, according to the method of Buege and Aust [35]. Absorbance was read spectrophotometrically at 532 nm and the results were expressed as nmoles of thiobarbituric reactive substances (TBARS)/mg protein. TBARS, considered as ‘‘MDA-like peroxide products’’, were quantified by reference to MDA absorbance (ε = 156 × 103 M−1 cm−1) [36].
2.4. Statistical Analysis
The effects of the independent factors “treatment”, “growth phase” and their interaction (treatment*growth phase) were evaluated by means of a two-way ANOVA analysis for each biomarker using the software OriginPro 2022. The post hoc test (Fisher test) was performed for pairwise comparisons. All results were expressed as the mean ± standard deviation (SD).
3. Results
During the exposure to different bisphenols, the growth curve was altered by the factors growth phase, treatment, and their interaction (p<0.001) (Table S1). The bisphenols caused a general reduction of growth during the exponential phase (4-6 days); however, the post-hoc test revealed that only BPAF caused a significant decrease of microalgal growth after 7, and 8 days of exposure. Moreover, at the stationary phase (9 day), both BPAF and BPS caused a significant decrease of the growth (Figure 1) (Table S2). Interestingly the mixture did not cause any effect on the growth.
During the exposure the mean cell diameter and mean cell volume were measured daily. Both these two cellular parameters were altered by growth phase (p<0.001) and its interaction with treatment (p<0.05 and p<0.01, respectively) (Table S1). However, the post-hoc test did not show any significant alteration respect to the controls (Figure SM1, Figure SM2).
The total antioxidant capacity measured using the CUPRAC assay was significantly altered by growth phase, treatment, and their interaction (p<0.001) (Table S3). In addition, the post-hoc test revealed a significant reduction in both BPS and MIX treatment during the exponential phase (Figure 2A). Similarly, a significant reduction of total antioxidant capacity was observed in all the bisphenol treatments during the stationary phase respect to the controls (Figure 2A).
As for SOD and CAT activity, the independent factors (growth phase and treatment and their interaction) exerted effects on enzyme activities. In detail, the two-way ANOVA demonstrated that the factors growth phase and treatment affected significantly (p<0.001) SOD activity, as well as their interaction (p<0.01) (Table S3). CAT activity was influenced by growth phase (p<0.001), treatment (p<0.01) and their interaction (p<0.05) (Table S3). In detail, SOD activity was significantly increased after 5 days of exposure to BPAF, BPF and MIX, while after nine days no differences in SOD activity were observed (Figure 2B). As for CAT activity, exposure to MIX increased enzyme activity during the exponential phase, whereas no differences were recorded during the stationary phase (Figure 2C).
Regarding the glutathione related enzymes, GR activity was influenced only by growth phase (Table S3) (Figure SM3), while GST activity was altered by both treatment and its interaction with phase (p<0.001) (Table S3). Moreover, GST activity was significantly affected only during the stationary phase, with a marked increase in BPAF-treated group, followed by a significant reduction in BPF-, BPS- and MIX-treated groups (Figure 2D).
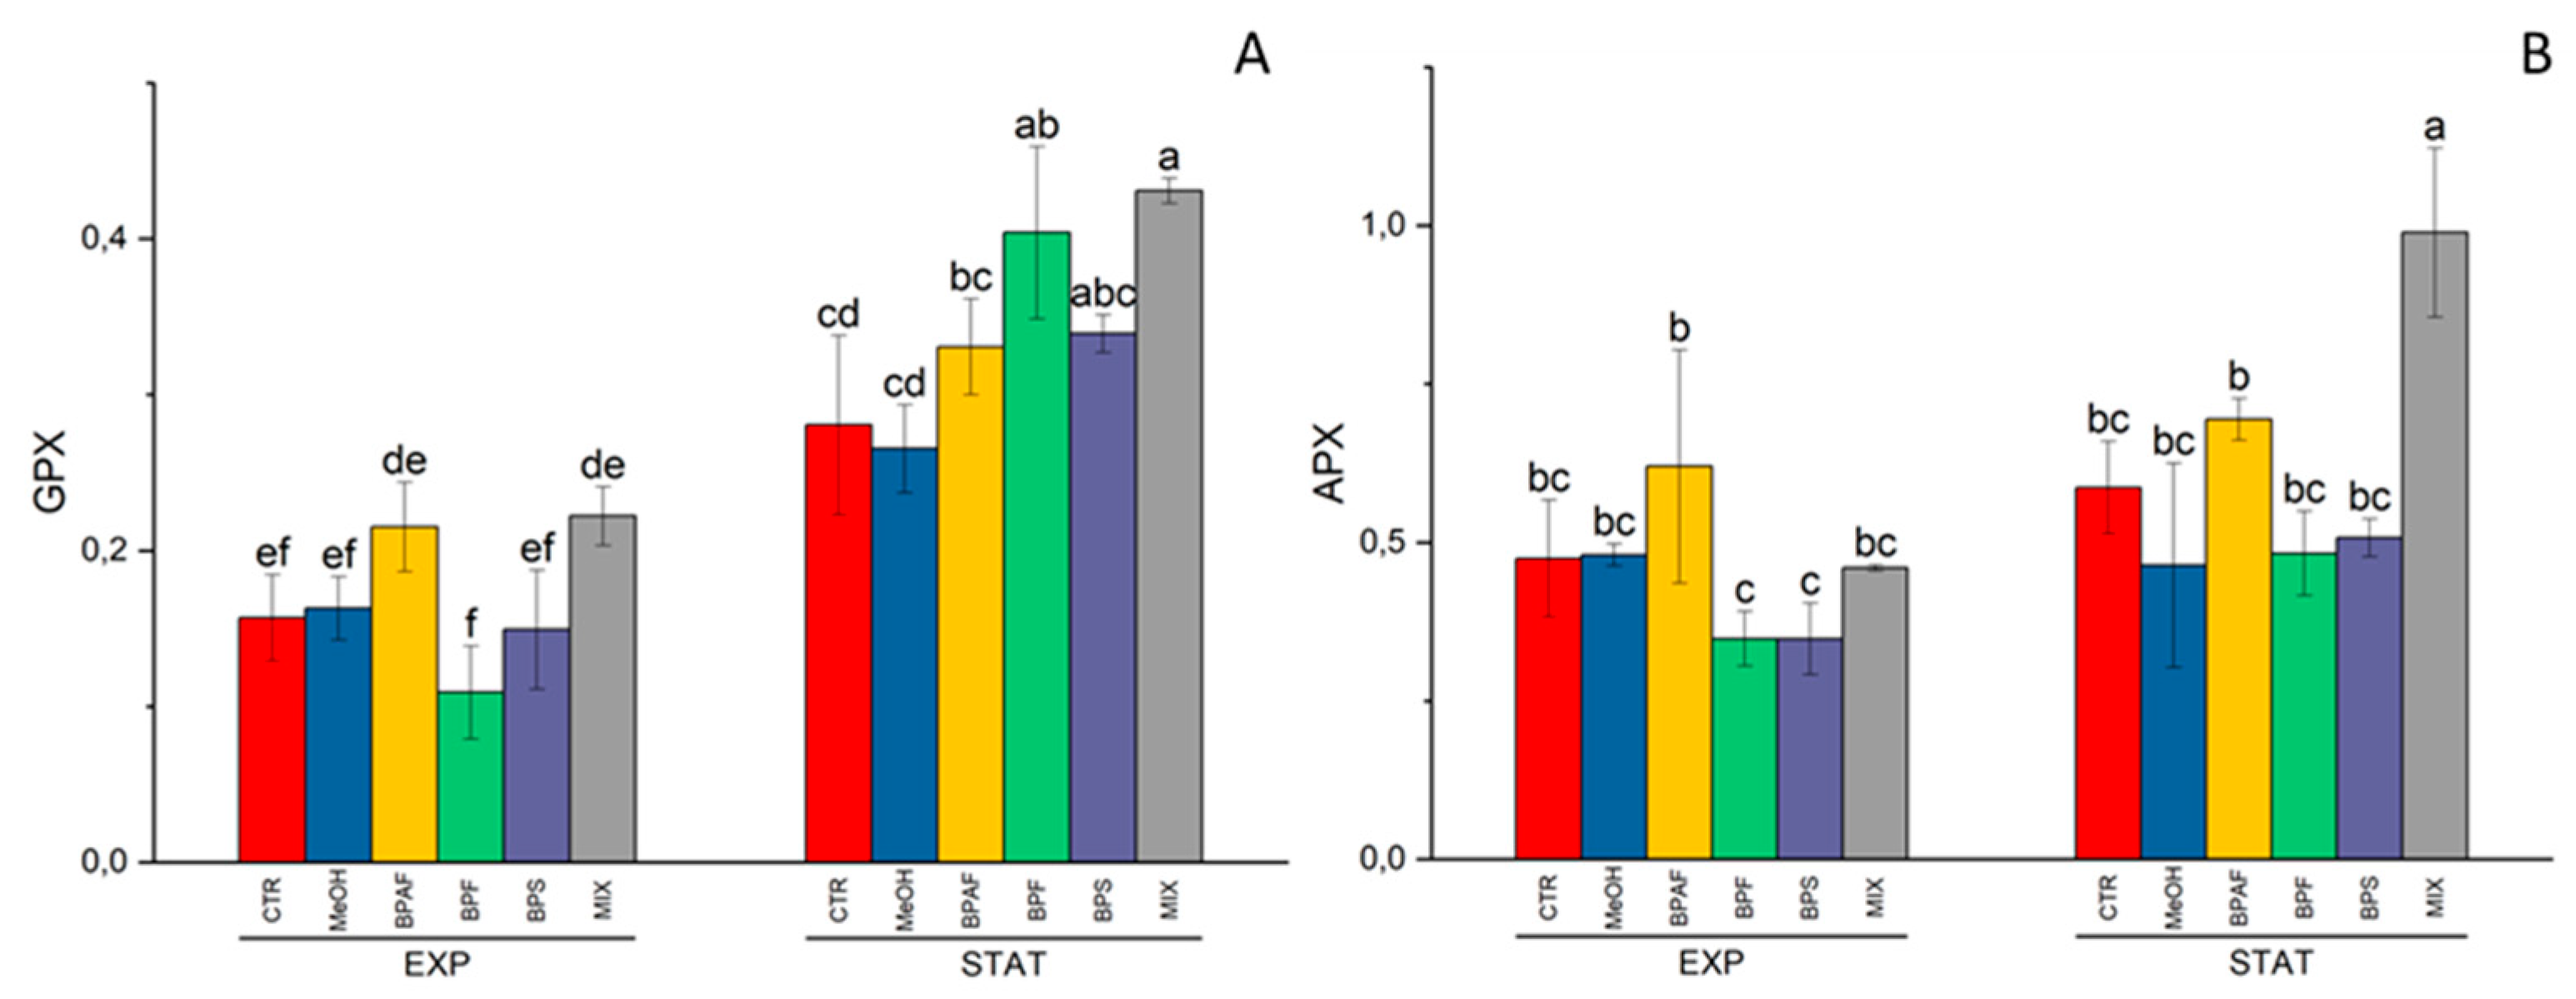
The two peroxidase enzymes, GPX and APX were altered by both growth phase (p<0.001 and p<0.01, respectively) and treatment (p<0.05) (Table S4). In detail, the GPX activity was significantly increased in the stationary phase by exposure to BPF and MIX (Figure 3A), while the ascorbate peroxidase was increased by exposure to MIX after 9 days of treatment (Figure 3B).
Lastly, in the case of oxidative damage the statistical analysis indicated that LPO was altered only by growth phase (p<0.01) (Table S4, Figure SM4A), while the PCC value was not affected by any of the independent factors (Table S4, Figure SM4B).
4. Discussion
4.1. Growth and Cell Size
In this study, we tested the effects of three of the main BPA analogs (BPAF, BPF, BPS) and their mixture on the diatom P. tricornutum. The growth curves were mainly affected by BPAF during the last part of the exposure. In addition, also the BPS caused a reduction of the cell density at day 9. The BPF did not cause any effect, while in the MIX treatment a general reduction of growth was observed, even if non-significantly. Other studies indicate that many algal species are very tolerant to BPA exposure in term of cell growth. Indeed, the EC50 values are in the order of mg/L [37]. However, some species can be more sensitive, such as the marine dinoflagellate Alexandrium pacificum, which showed the growth drastically inhibited by BPA at a concentration of 2 µg/L [38]. Our results are in accordance with those of Ding et al. [14] that reported no significant effects on the growth rate of Chlorella vulgaris after exposure to environmentally relevant concentrations (≤0.5 mg/L) of BPS and BPA, even if the growth decreased at higher concentrations. In other studies, the tested concentrations showed effects on the growth curve; however tested concentrations were higher than the environmental levels. Indeed, Tišler et al. [13] recorded a value of 50% inhibition of growth in Desmodesmus subspicatus after 72 h of exposure to both BPA and BPF (22.1 and 19.6 mg/L, respectively). In that study, BPAF showed a 50% of inhibition of growth at 3.0 mg/L, that is 1000 times higher than the concentration tested in the present study. Similarly, the growth of microalga Tetraselmis sp. was inhibited at 2.34, 4.69, 9.38 and 18.75 mg/ L of BPA after 24, 48, 72 and 96 hours of exposure [39]. In a recent study on Tetrahymena thermophila, several bisphenols were tested, namely BPA, BPAF, bisphenol B (BPB), bisphenol E (BPE) and BPS. The authors reported that there was a reduction of growth caused by BPA (13.0 μM), BPAF (13.0 μM), BPB (2.6 and 13.0 μM) and BPE (2.6 and 13.0 μM) after 30 hours of exposure, and these responses were maintained after 60 hours except for BPE treatments [40]. We observed that both cell diameter and cell volume were altered by the factors growth phase and its interaction with treatment. In detail, both diameter and volume increased during the time and reached the highest values after seven days of exposure, then they decreased. Recently, Li et al. [40] observed that bisphenols caused a decrease in cell size of Tetrahymena thermophila. Indeed, BPA (2.6 and 13.0 μM), BPAF (13.0 μM), BPB (13.0 μM) and BPS (13.0 μM) caused a significant reduction in cell volume after 12 hours of exposure in the adaptive growth phase and the trend was maintained after 30 hours of exposure. Furthermore, after 60 hours of exposure in the stable growth phase the cell volume was reduced in all the treatments, except for the BPE at a concentration of 2.6 μM [40]. P. tricornutum was used in another study to evaluate the effects of six different bisphenols BPA, BPS, BPAP, BPAF, BPFL and BPC tested various concentrations, namely 5, 20, 40, 80, 150 and 300 μM [41]. The authors observed that the growth of this microalga was inhibited by all the concentrations at all times of exposure, except for bisphenol C at 5 μM and 72 h. The authors ranked the toxicity of bisphenols for this species as follows: BPC < BPA < BPS < BPFL ≈ BPAF ≈ BPAP after 72 hours of exposure. In the same study, the authors evaluated the effects of bisphenols also on other two species of microalgae: Tetraselmis suecica, that was the most sensitive species, and Nannochloropsis gaditana, that was the species most resistant to bisphenols even if some effects have been observed also on this species [41]. Interestingly the authors observed that almost all the bisphenols tested caused a reduction of cell volume of P. tricornutum, apart from BPS, which provoked a significant increase for this parameter at the highest concentrations, and BPFL that did not cause any effect. On the contrary, T. suecica cells showed a significant increase in cell size, mainly at higher concentrations and after 72 h of incubation, while N. gaditana was less affected than the other two species. An alteration of the growth curve was also observed in the alga Chlorella pyrenoidosa exposed to BPA that caused an increased cell density at 2 mg/L on the first day of exposure, while the other treatment groups (5, 8, 11 and 15 mg/L) showed an inhibitory effect. However, on the 4th day, also the exposure to 2 mg/L caused growth inhibition [11]. In that study, BPS caused an increased density of algal cells at 5 mg/L, while higher concentrations (10, 15, 20 and 40 g/L) had an inhibitory effect. In addition, the combined effect of BPA and BPS in the mixture treatment was like that of the single compounds [11]. Concentrations of BPA lower than the previous ones, were tested in Chlorella pyrenoidosa that did not show significant alterations in cell density at concentrations of 0.1 and 1 mg/L during the first two days of exposure. However, at 10 mg/L there was a reduction in cell density. An increased cell density was observed after three days of exposure at 0.1, while 10 mg/L caused a decrease in cell density during all the five days of exposure. In addition, the authors also observed that the expression levels of ATP synthase and NADH dehydrogenase were significantly upregulated at 0.1 mg/L of BPA while at 10 mg/L the expression levels were significantly decreased [42]. It has been demonstrated that bisphenols caused different effects during acute or chronic exposure tests. Indeed, in an acute test, 25 mg/L and 50 mg/L of BPA significantly inhibited the growth rate of both C. pyrenoidosa and S. obliquus during 96 hours of exposure, except for 24 h of exposure of C. pyrenoidosa to 25 mg/L of BPA. On the contrary, both concentrations of 1 and 5 mg/L had a weak influence on the growth curve. During the chronic exposure, that lasted 30 days, BPA did not cause growth inhibition, while there was an increase in cell growth at both 1 and 50 mg/L of BPA with respect to the control [43]. Lastly, in a 16-days experiment with the microalga Stephanodiscus hantzschii treated with 0.01, 0.10, 1.00, 3.00, 5.00, 7.00 and 9.00 mg/L of BPA the authors observed that concentrations lower than 1 mg/L did not alter cell growth, while a concentration of 3 mg/L inhibited the algal growth during the first four days and then caused a growth stimulation. However, exposure to higher concentrations severely stopped algal growth and caused cell die when exposure time exceeded 8 days [44].
4.2. Biomarkers Response
In the present study, several biomarkers indicative of oxidative stress were measured in P. tricornutum treated with bisphenol analogs. Regarding the total antioxidant capacity, a reduction was observed in the microalga exposed for five days to BPS and MIX. Moreover, the same effect was also observed in the microalga after nine days of exposure to BPAF, BPF, BPS and MIX. SOD activity was significantly increased by BPAF, BPF and MIX exposure during the exponential growth phase. However, in the stationary phase any treatment caused effects. Similarly, in the case of CAT activity, it was significantly increased only by MIX after five days, while during the stationary phase there were not alterations. At our knowledge our study has adopted the lowest concentrations tested in literature, indeed many other studies observed alterations of antioxidant system but at very high concentrations of bisphenols, mainly BPA. However, our observations of an impairment in the microalgal antioxidant system are in accordance with the bisphenols capacity to produce ROS reported in many studies. Indeed, recently P. tricornutum showed an increase ROS production for most of the bisphenol tested (BPC, BPS, BPA, BPAF, BPAP and BPFL) over 72 h at different dosages (5, 20, 40, 80, 150 and 300 μM). In detail, BPAP showed the highest ROS production followed by BPFL>BPAF>BPA>BPS>BPC [41]. Similarly in Chlorella pyrenoidosa, BPA caused ROS increase at concentrations of 5, 8, 11 and 15 mg/L while BPS caused an increase of ROS level at higher concentrations, such as 15, 20 and 40 mg/L. Moreover, the mixture of the two bisphenols at a ratio of 1:1 caused an increased ROS level only at the two lowest concentrations [11]. Recently, the activities of both SOD and CAT were measured in the two freshwater algae Chlorella vulgaris and Navicula sp. exposed to BPS [45]. The authors observed that in C. vulgaris, SOD activity increased significantly at 1,5,10, 20 and 50 mg/L of BPS, while CAT activity increased at 20 and 100 mg/L of BPS. In an opposite way, in Navicula sp. there was a significant increase in the activity of these two enzymes at 1 mg/L only [45]. Similarly, after 4 and 8 days of exposure all the tested concentrations of BPA (4, 6, 8, 10 and 12 mg/L) increased SOD activity in Cyclotella caspia. However, such increment - respect to the control - was lower after 12, 16 and 20 days of exposure [46]. Interestingly, all the tested concentrations caused an increase in the activity of both SOD and CAT after 96 hours of exposure of Chlorella pyrenoidosa to BPA [43]. In another study with the cyanobacterium Microcystis aeruginosa the authors observed that SOD activity was not altered by BPA at a concentration range of 0.1–1.0 μM. However, higher concentrations (5−50 μM) caused a significant increase of SOD activity. Moreover, the authors observed that GSH content was significantly increased by the BPA tested concentrations after 3, 9 and 15 days of exposure [47]. The effects of another bisphenol analog, namely bisphenol BHPF, were tested in the microalga Chlorella vulgaris [48]). Contrary to our results, the authors found that SOD activity significantly decreased at 1, 10 and 20 mg/L of BHPF, while CAT activity remained unchanged after 72 hours of exposure. Alterations of both SOD and CAT activity were also observed during chronic exposure. Indeed, during a long-term exposure, SOD activity increased after 15 days at 1 mg/L and 10 mg/L of BPA while after 30 days only 1 mg/L of BPA had an effect, increasing SOD activity in Chlorella pyrenoidosa [43]. In the case of Scenedesmus obliquus, only after 15 days of exposure to 1 mg/L of BPA there was a SOD activity increase [43]. Moreover, the two algae showed an increased CAT activity at 50 mg /L of BPA after 15 and 30 days and in the case of S. obliquus the CAT activity was also increased at 10 mg/L after 15 days and at 1 mg/L and 10 mg/L of BPA after 30 days of exposure [43]. The GST enzyme is an antioxidant enzyme involved in the detoxification activity of xenobiotics. In our study, GST activity was increased after exposure to BPAF during the stationary phase, while BPF, BPS and MIX caused a significant reduction in enzyme activity. Conversely, exposure of Navicula incerta - another marine diatom species - to BPA increased both SOD and GST activity in a dose dependent manner, while the peroxidase activity was decreased at 5 mg/L of BPA [49]. In addition, an increased activity of both CAT and GST was reported in Picocystis sp. exposed to 25, 50 and 75 mg/L of BPA [50]. As for GR, that is an enzyme involved in the glutathione cycle, we did not observe any effects of the tested compounds during the exposure. On the contrary, Jiefeng et al. [51] observed a reduction of SOD, CAT, peroxidase, and GR activity at all the BPA-treatments (1, 5, 20, 50 mg/L), with a contemporary general increase of GSH levels. However, much higher concentrations were tested in that study. Moreover, the authors observed that 20 mg/L and 50 mg/L of BPA caused a significant reduction of the total antioxidant capacity (Jiefeng et al. [51]. Other two important enzymes that we assessed are glutathione peroxidase (GPX) and ascorbate peroxidase (APX). These two enzymes are fundamental antioxidant enzymes. Indeed, they detoxify the hydrogen peroxide, an important ROS species, using glutathione or ascorbate respectively. The GPX activity was increased after exposure to BPF and MIX during the stationary phase, while APX increased after nine days of exposure to MIX. Similarly, APX activity was increased by BPA exposure in the microalga Picocystis sp. treated for 1, 2, 3, 4 and 5 days with 25, 50 and 75 mg/L; in addition, after 4 and 5 days the APX activity was also increased by 10 mg/L of BPA. However, at 1 mg/L of BPA no alterations in APX activity were recorded [50]. In the latter study, the activity of APX measured in Graesiella sp. showed an opposite pattern of variation with respect to that of Picocystis sp., with a decreased enzyme activity at higher BPA concentrations [50].
The oxidative damage on macromolecules is caused by an excessive presence of ROS species that are not efficiently removed by the antioxidant system. The oxidative damage can be evaluated measuring the level of carbonyl groups in proteins using the PCC assay and the level of lipid peroxidation, through the LPO assay. Based on the results of PCC and LPO assays, we can exclude that bisphenol analogs can induce oxidative damage in P. tricornutum, at least under the experimental conditions adopted in our study. However, other studies reported that bisphenols can cause oxidative damage [37]. For instance, Yang et al. [47] reported oxidative damage to lipids (increased MDA level) after 3, 9 and 15 days of exposure of the cyanobacterium M. aeruginosa to 0.1 ,1, 5, 10 and 50 mg/L of BPA. However, the MDA levels decreased during the time course [47]. BPA was able to increase the MDA levels at dose above 5 mg/L in both the green alga Scenedesmus quadricauda and the cyanobacterium Cylindrospermopsis raciborskii, even if there was a decreased MDA levels in cyanobacterium at the concentration of 20 mg/L [52]. In addition, in C. vulgaris all the tested concentrations of BPS increased the MDA content, while in Navicula sp. there was an increased MDA level only at the two highest tested concentrations (50 mg/L and 100 mg/L) [45].
5. Conclusions
In the present study, we observed that bisphenol analogs at an environmentally realistic concentration affected the growth and the cell size of the diatom species P. tricornutum. In addition, we observed alterations of the antioxidant systems with some antioxidant enzyme activities that were affected. We observed that the mixture caused higher alterations on the measured biochemical parameters in comparison to the single bisphenols. Our results agree with those of similar studies testing the mixture effects, revealing a higher toxicity of mixture respect to the single compounds with a synergic effect between them [12, 15]. Concluding, bisphenol A analogs tested in this survey can be harmful for microalga, as previously observed for BPA. Studies on molecular interaction of bisphenols and their impact on the ultrastructure of microalga are needed to better determine the ecotoxicological profile of these compounds.
Supplementary Materials
The following supporting information can be downloaded at the website of this paper posted on Preprints.org.
Author Contributions
Conceptualization, Valerio Matozzo, Isabella Moro and Francesca Dalla Vecchia; methodology, Jacopo Fabrello, Maria Ciscato, Emanuela Moschin.; formal analysis, Jacopo Fabrello, Maria Ciscato, Emanuela Moschin; writing—original draft preparation, Jacopo Fabrello; writing—review and editing, Jacopo Fabrello, Valerio Matozzo, Isabella Moro, Francesca Dalla Vecchia, Emanuela Moschin; supervision, Valerio Matozzo. All authors have read and agreed to the published version of the manuscript.
Funding
This research received no external funding.
Institutional Review Board Statement
Not applicable.
Informed Consent Statement
Not applicable.
Data Availability Statement
Not applicable.
Conflicts of Interest
The authors declare no conflict of interest.
References
- Vandenberg, L.N.; Hauser, R.; Marcus, M.; Olea, N.; Welshons, W.V. Human exposure to bisphenol A (BPA). Reprod Toxicol. 2007, 24, 139–177. [Google Scholar] [CrossRef]
- EU. Commission regulation 2016/2235 of 12 December 2016 amending annex XVII to regulation (EC) No 1907/2006 of the European parliament and of the council concerning the registration, evaluation, authorisation and restriction of chemicals (REACH) as regards bisphenol A. Off. J. Eur. Union 2016, L337, 3–5. [CrossRef]
- Chen, D.; Kannan, K.; Tan, H.; Zheng, Z.; Feng, Y.L.; Wu, Y.; Widelka, M. Bisphenol analogues other than BPA: Environmental occurrence, human exposure, and toxicity—A review. Environ. Sci. Technol. 2016, 50, 5438–5453. [Google Scholar] [CrossRef]
- Usman, A.; Ikhlas, S.; Ahmad, M. Occurrence, toxicity and endocrine disrupting potential of Bisphenol-B and Bisphenol-F: A mini-review. Toxicol. Lett. 2019, 312, 222–227. [Google Scholar] [CrossRef]
- EFSA; FitzGerald, R.; Van Loveren, H.; Civitella, C.; Castoldi, A.F.; Giovanni Bernasconi, G. Assessment of New Information on Bisphenol S (BPS) Submitted in Response to the Decision under REACH Regulation (EC) No 1907/2006; EFSA Supporting Publication; European Food Safety Authority (EFSA): Parma, Italy, 2020; p. 39.
- ECHA. Inclusion of BPA as a Substance of Very High Concern (Reason for Inclusion: Endocrine Disrupting Properties—Article 57f Environment) in the Candidate List for Eventual Inclusion in Annex XIV; Decision of the European Chemicals Agency; European Chemicals Agency: Helsinki, Finland, 2018.
- Hu, Y.; Zhu, Q.; Yan, X.; Liao, C.; Jiang, G. Occurrence, fate and risk assessment of BPA and its substituents in wastewater treatment plant: A review. Environ. Res. 2019, 178, 108732. [Google Scholar] [CrossRef]
- ECHA. Bisphenol AF, Substance Infocard. Available online: https://echa.europa.eu/substance-information/-/substanceinfo/100.014.579 (accessed on 15 July 2023).
- Frankowski, R.; Zgoła-Grześkowiak, A.; Smułek, W.; Grześkowiak, T. Removal of bisphenol A and its potential substitutes by biodegradation. Appl. Biochem. Biotechnol. 2020, 191, 1100–1110. [Google Scholar] [CrossRef] [PubMed]
- Commission of the European Communities. Technical Guidance Document in Support of Commission Directive 93/67/EEC on Risk Assessment for New Notified Substances and Commission Regulation (EC) No 1488/94 on Risk Assessment. Office for Existing Substances. Part II; Environmental Risk Assessment. Office for Official Publications of the European Communities, Luxembourg,1996.
- Li, J.; Wang, Y.; Li, N.; He, Y.; Xiao, H.; Fang, D.; Chen, C. Toxic effects of bisphenol A and bisphenol S on Chlorella pyrenoidosa under single and combined action. Int. J. Environ. Res. Public Health 2022, 19, 4245. [Google Scholar] [CrossRef]
- Yadav, N.; Ahn, H.J.; Kurade, M.B.; Ahn, Y.; Park, Y.K.; Khan, M.A.; Salama, E.S.; Li, X.; Jeon, B.H. Fate of five bisphenol derivatives in Chlamydomonas mexicana: Toxicity, removal, biotransformation and microalgal metabolism. J. Hazard. Mater. 2023, 454, 131504. [Google Scholar] [CrossRef] [PubMed]
- Tišler, T.; Krel, A.; Gerželj, U.; Erjavec, B.; Dolenc, M.S.; Pintar, A. Hazard identification and risk characterization of bisphenols A, F and AF to aquatic organisms. Environ. Pollut. 2016, 212, 472–479. [Google Scholar] [CrossRef]
- Ding, T.; Li, W.; Yang, M.; Yang, B.; Li, J. Toxicity and biotransformation of bisphenol S in freshwater green alga Chlorella vulgaris. Sci. Total Environ. 2020, 747, 141144. [Google Scholar] [CrossRef] [PubMed]
- Czarny-Krzymińska, K.; Krawczyk, B.; Szczukocki, D. Toxicity of bisphenol A and its structural congeners to microalgae Chlorella vulgaris and Desmodesmus armatus. J. Appl. Phycol. 2022, 34, 1397–1410. [Google Scholar] [CrossRef]
- Elersek, T.; Notersberg, T.; Kovačič, A.; Heath, E.; Filipič, M. The effects of bisphenol A, F and their mixture on algal and cyanobacterial growth: from additivity to antagonism. Environ. Sci. Pollut. Res. 2021, 28, 3445–3454. [Google Scholar] [CrossRef] [PubMed]
- Wang, Y.; Zhao, T.; Yang, X.; Liu, H. Insight Into The Aquatic Toxicity And Ecological Risk of Bisphenol B, And Comparison With That of Bisphenol A. 22 November 2021, available at Research Square. [CrossRef]
- Fabrello, J.; Matozzo, V. Bisphenol analogs in aquatic environments and their effects on marine species—a review. J. Mar. Sci. Eng. 2022, 10, 1271. [Google Scholar] [CrossRef]
- EU. European Union Updated Risk Assessment Report. Environment Addendum of April 2008 (To be Read in Conjunction with Published EU RAR of BPA, 2003) 4,4′-ISOPROPYLIDENEDIPHENOL (Bisphenol-A) Part 1 Environment; European Commission, Joint Research Centre, Institute for Health and Consumer Protection: Luxembourg, 2008.
- Wang, Q.; Chen, M.; Shan, G.; Chen, P.; Cui, S.; Yi, S.; Zhu, L. Bioaccumulation and biomagnification of emerging bisphenol analogues in aquatic organisms from Taihu Lake, China. Sci. Total Environ. 2017, 598, 814–820. [Google Scholar] [CrossRef]
- Huang, C.; Wu, L.H.; Liu, G.Q.; Shi, L.; Guo, Y. Occurrence and ecological risk assessment of eight endocrine-disrupting chemicals in urban river water and sediments of South China. Arch. Environ. Contam. Toxicol. 2018, 75, 224–235. [Google Scholar] [CrossRef]
- Yamazaki, E.; Yamashita, N.; Taniyasu, S.; Lam, J.; Lam, P.K.; Moon, H.B.; Jeong, Y.; Kannan, P.; Achyuthan, H.; Munuswamy, N.; et al. Bisphenol A and other bisphenol analogues including BPS and BPF in surface water samples from Japan, China, Korea and India. Ecotoxicol. Environ. Saf. 2015, 122, 565–572. [Google Scholar] [CrossRef] [PubMed]
- Zhao, X.; Qiu, W.; Zheng, Y.; Xiong, J.; Gao, C.; Hu, S. Occurrence, distribution, bioaccumulation, and ecological risk of bisphenol analogues, parabens and their metabolites in the Pearl River Estuary, South China. Ecotoxicol. Environ. Saf. 2019, 180, 43–52. [Google Scholar] [CrossRef] [PubMed]
- Guillard, R.R. Culture of phytoplankton for feeding marine invertebrates. In Culture of marine invertebrate animals: proceedings—1st conference on culture of marine invertebrate animals greenport, 1975, 29-60. Boston, MA: Springer US.
- Bradford, M.M. A Rapid and sensitive method for the quantitation of microgram quantities of protein utilizing the principle of protein-dye binding. Anal. Biochem. 1976, 72, 248–254. [Google Scholar] [CrossRef] [PubMed]
- Apak, R.; Güçlü, K.; Özyürek, M.; Karademir, S.E. Novel total antioxidant capacity index for dietary polyphenols and vitamins C and E, using their cupric ion reducing capability in the presence of neocuproine: CUPRAC method. J. Agric. Food Chem. 2004, 52, 7970–7981. [Google Scholar] [CrossRef] [PubMed]
- Crapo, J.D.; McCord, J.M.; Fridovich, I. Preparation and assay of superioxide dismutases. Methods Enzymol. 1978, 53, 382–393. [Google Scholar] [CrossRef]
- Aebi, H. Catalase in Vitro. Methods Enzymol. 1984, 105, 121–126. [Google Scholar] [PubMed]
- Smith, I.K.; Vierheller, T.L.; Thorne, C.A. Assay of glutathione reductase in crude tissue homogenates using 5,5′-Dithiobis(2-Nitrobenzoic Acid). Anal. Biochem. 1988, 175, 408–413. [Google Scholar] [CrossRef]
- Habig, W.H.; Pabst, M.J.; Jakoby, W.B. Glutathione S Transferases. The first enzymatic step in mercapturic acid formation. J. Biol. Chem. 1974, 249, 7130–7139. [Google Scholar] [CrossRef] [PubMed]
- Lawrence, R.A.; Burk, R.F. Glutathione peroxidase activity in selenium-deficient rat liver. Biochem Biophys Res Commun. 1976, 71, 952–958. [Google Scholar] [CrossRef]
- Nakano, Y.; Asada, K. Hydrogen Peroxide Is Scavenged by Ascorbate-Specific Peroxidase in Spinach Chloroplasts. Plant Cell Physiol. 1981, 22, 867–880. [Google Scholar] [CrossRef]
- Janknegt, P.J.; De Graaff, C.M.; Van de Poll, W.H.; Visser, R.J.; Rijstenbil, J.W.; Buma, A.G. Short-term antioxidative responses of 15 microalgae exposed to excessive irradiance including ultraviolet radiation. Eur. J. Phycol. 2009, 44, 525–539. [Google Scholar] [CrossRef]
- Mecocci, P.; Fanó, G.; Fulle, S.; MacGarvey, U.; Shinobu, L.; Polidori, M.C.; Cherubini, A.; Vecchiet, J.; Senin, U.; Beal, M.F. Age-dependent increases in oxidative damage to DNA, lipids, and proteins in human skeletal muscle. Free Radic. Biol. Med. 1999, 26, 303–308. [Google Scholar] [CrossRef] [PubMed]
- Buege, J.A.; Aust, S.D. Microsomal lipid peroxidation. Methods Enzymol. 1978, 52, 302–310. [Google Scholar]
- Damiens, G.; Gnassia-Barelli, M.; Loquès, F.; Roméo, M.; Salbert, V. Integrated biomarker response index as a useful tool for environmental assessment evaluated using transplanted mussels. Chemosphere 2007, 66, 574–583. [Google Scholar] [CrossRef] [PubMed]
- Azizullah, A.; Khan, S.; Gao, G.; Gao, K. The interplay between bisphenol A and algae–A review. J. King Saud Univ. Sci. 2022, 34, 102050. [Google Scholar] [CrossRef]
- M'Rabet, C.; Pringault, O.; Zmerli-Triki, H.; Gharbia, H.B.; Couet, D.; Yahia, O. K. D. Impact of two plastic-derived chemicals, the Bisphenol A and the di-2-ethylhexyl phthalate, exposure on the marine toxic dinoflagellate Alexandrium pacificum. Mar. Pollut. Bull. 2018, 126, 241–249. [Google Scholar] [CrossRef]
- Naveira, C.; Rodrigues, N.; Santos, F.S.; Santos, L.N.; Neves, R.A. Acute toxicity of Bisphenol A (BPA) to tropical marine and estuarine species from different trophic groups. Environ. Pollut. 2021, 268, 115911. [Google Scholar] [CrossRef] [PubMed]
- Li, J.; Wang, J.; Hou, S.; Huang, Y.; Chen, H.; Sun, Z.; Chen, D. Exposure to bisphenol analogues interrupts growth, proliferation, and fatty acid compositions of protozoa Tetrahymena thermophila. J. Hazard. Mater. 2020, 395, 122643. [Google Scholar] [CrossRef] [PubMed]
- Sendra, M.; Moreno-Garrido, I.; Blasco, J. Single and multispecies microalgae toxicological tests assessing the impact of several BPA analogues used by industry. Environ. Pollut. 2023, 122073. [Google Scholar] [CrossRef]
- Duan, L.; Chen, Q.; Duan, S. Transcriptional analysis of Chlorella pyrenoidosa exposed to bisphenol A. Int. J. Environ. Res. Public Health 2019, 16, 1374. [Google Scholar] [CrossRef]
- Zhang, W.; Xiong, B.; Sun, W.F.; An, S.; Lin, K.F.; Guo, M.J.; Cui, X.H. Acute and chronic toxic effects of bisphenol a on Chlorella pyrenoidosa and Scenedesmus obliquus. Environ. Toxicol. 2014, 29, 714–722. [Google Scholar] [CrossRef]
- Li, R.; Chen, G. Z.; Tam, N.F.Y.; Luan, T.G.; Shin, P.K.; Cheung, S.G.; Liu, Y. Toxicity of bisphenol A and its bioaccumulation and removal by a marine microalga Stephanodiscus hantzschii. Ecotoxicol. Environ. Saf. 2009, 72, 321–328. [Google Scholar] [CrossRef] [PubMed]
- Li, R.; Liu, Y.; Chen, G.; Tam, N. F.; Shin, P. K.; Cheung, S. G.; Luan, T. Physiological responses of the alga Cyclotella caspia to bisphenol A exposure. Bot. Mar. 2008, 51, 360–369. [Google Scholar] [CrossRef]
- Yang, M.; Fan, Z.; Xie, Y.; Fang, L.; Wang, X.; Yuan, Y.; Li, R. Transcriptome analysis of the effect of bisphenol A exposure on the growth, photosynthetic activity and risk of microcystin-LR release by Microcystis aeruginosa. J. Hazard. Mater. 2020, 397, 122746. [Google Scholar] [CrossRef]
- Zhang, H.; Ding, T.; Luo, X.; Li, J. Toxic effect of fluorene-9-bisphenol to green algae Chlorella vulgaris and its metabolic fate. Ecotoxicol. Environ. Saf. 2021, 216, 112158. [Google Scholar] [CrossRef] [PubMed]
- Liu, Y.; Guan, Y.; Gao, Q.; Tam, N.F.Y.; Zhu, W. Cellular responses, biodegradation and bioaccumulation of endocrine disrupting chemicals in marine diatom Navicula incerta. Chemosphere 2010, 80, 592–599. [Google Scholar] [CrossRef]
- Ben Ouada, S.; Ben Ali, R.; Leboulanger, C.; Zaghden, H.; Choura, S.; Ben Ouada, H.; Sayadi, S. Effect and removal of bisphenol A by two extremophilic microalgal strains (Chlorophyta). J. Appl. Phycol. 2018, 30, 1765–1776. [Google Scholar] [CrossRef]
- Jiefeng, L.; Xufa, M.; Yu, L.; Shenjuan, Z.; Boli, Z.; Jie, H. Effects of bisphenol A on growth, photosynthesis pigment and antioxidant system of Spirodela polyrrhiza. Asian Journal of Ecotoxicology 2019, 6, 144–151. [Google Scholar]
- Xiang, R.; Shi, J.; Yu, Y.; Zhang, H.; Dong, C.; Yang, Y.; Wu, Z. The effect of bisphenol A on growth, morphology, lipid peroxidation, antioxidant enzyme activity, and PS II in Cylindrospermopsis raciborskii and Scenedesmus quadricauda. Arch. Environ. Contam. Toxicol. 2018, 74, 515–526. [Google Scholar] [CrossRef] [PubMed]
Figure 1.
Growth of P. tricornutum expressed as number of cells* 104/mL during exposure to bisphenols: BPAF, BPF, BPS and to their mixture (MIX). Control is reported as CTR, control+solvent (methanol) is reported as MeOH. Each point is the mean of three replicates ± SD.
Figure 1.
Growth of P. tricornutum expressed as number of cells* 104/mL during exposure to bisphenols: BPAF, BPF, BPS and to their mixture (MIX). Control is reported as CTR, control+solvent (methanol) is reported as MeOH. Each point is the mean of three replicates ± SD.
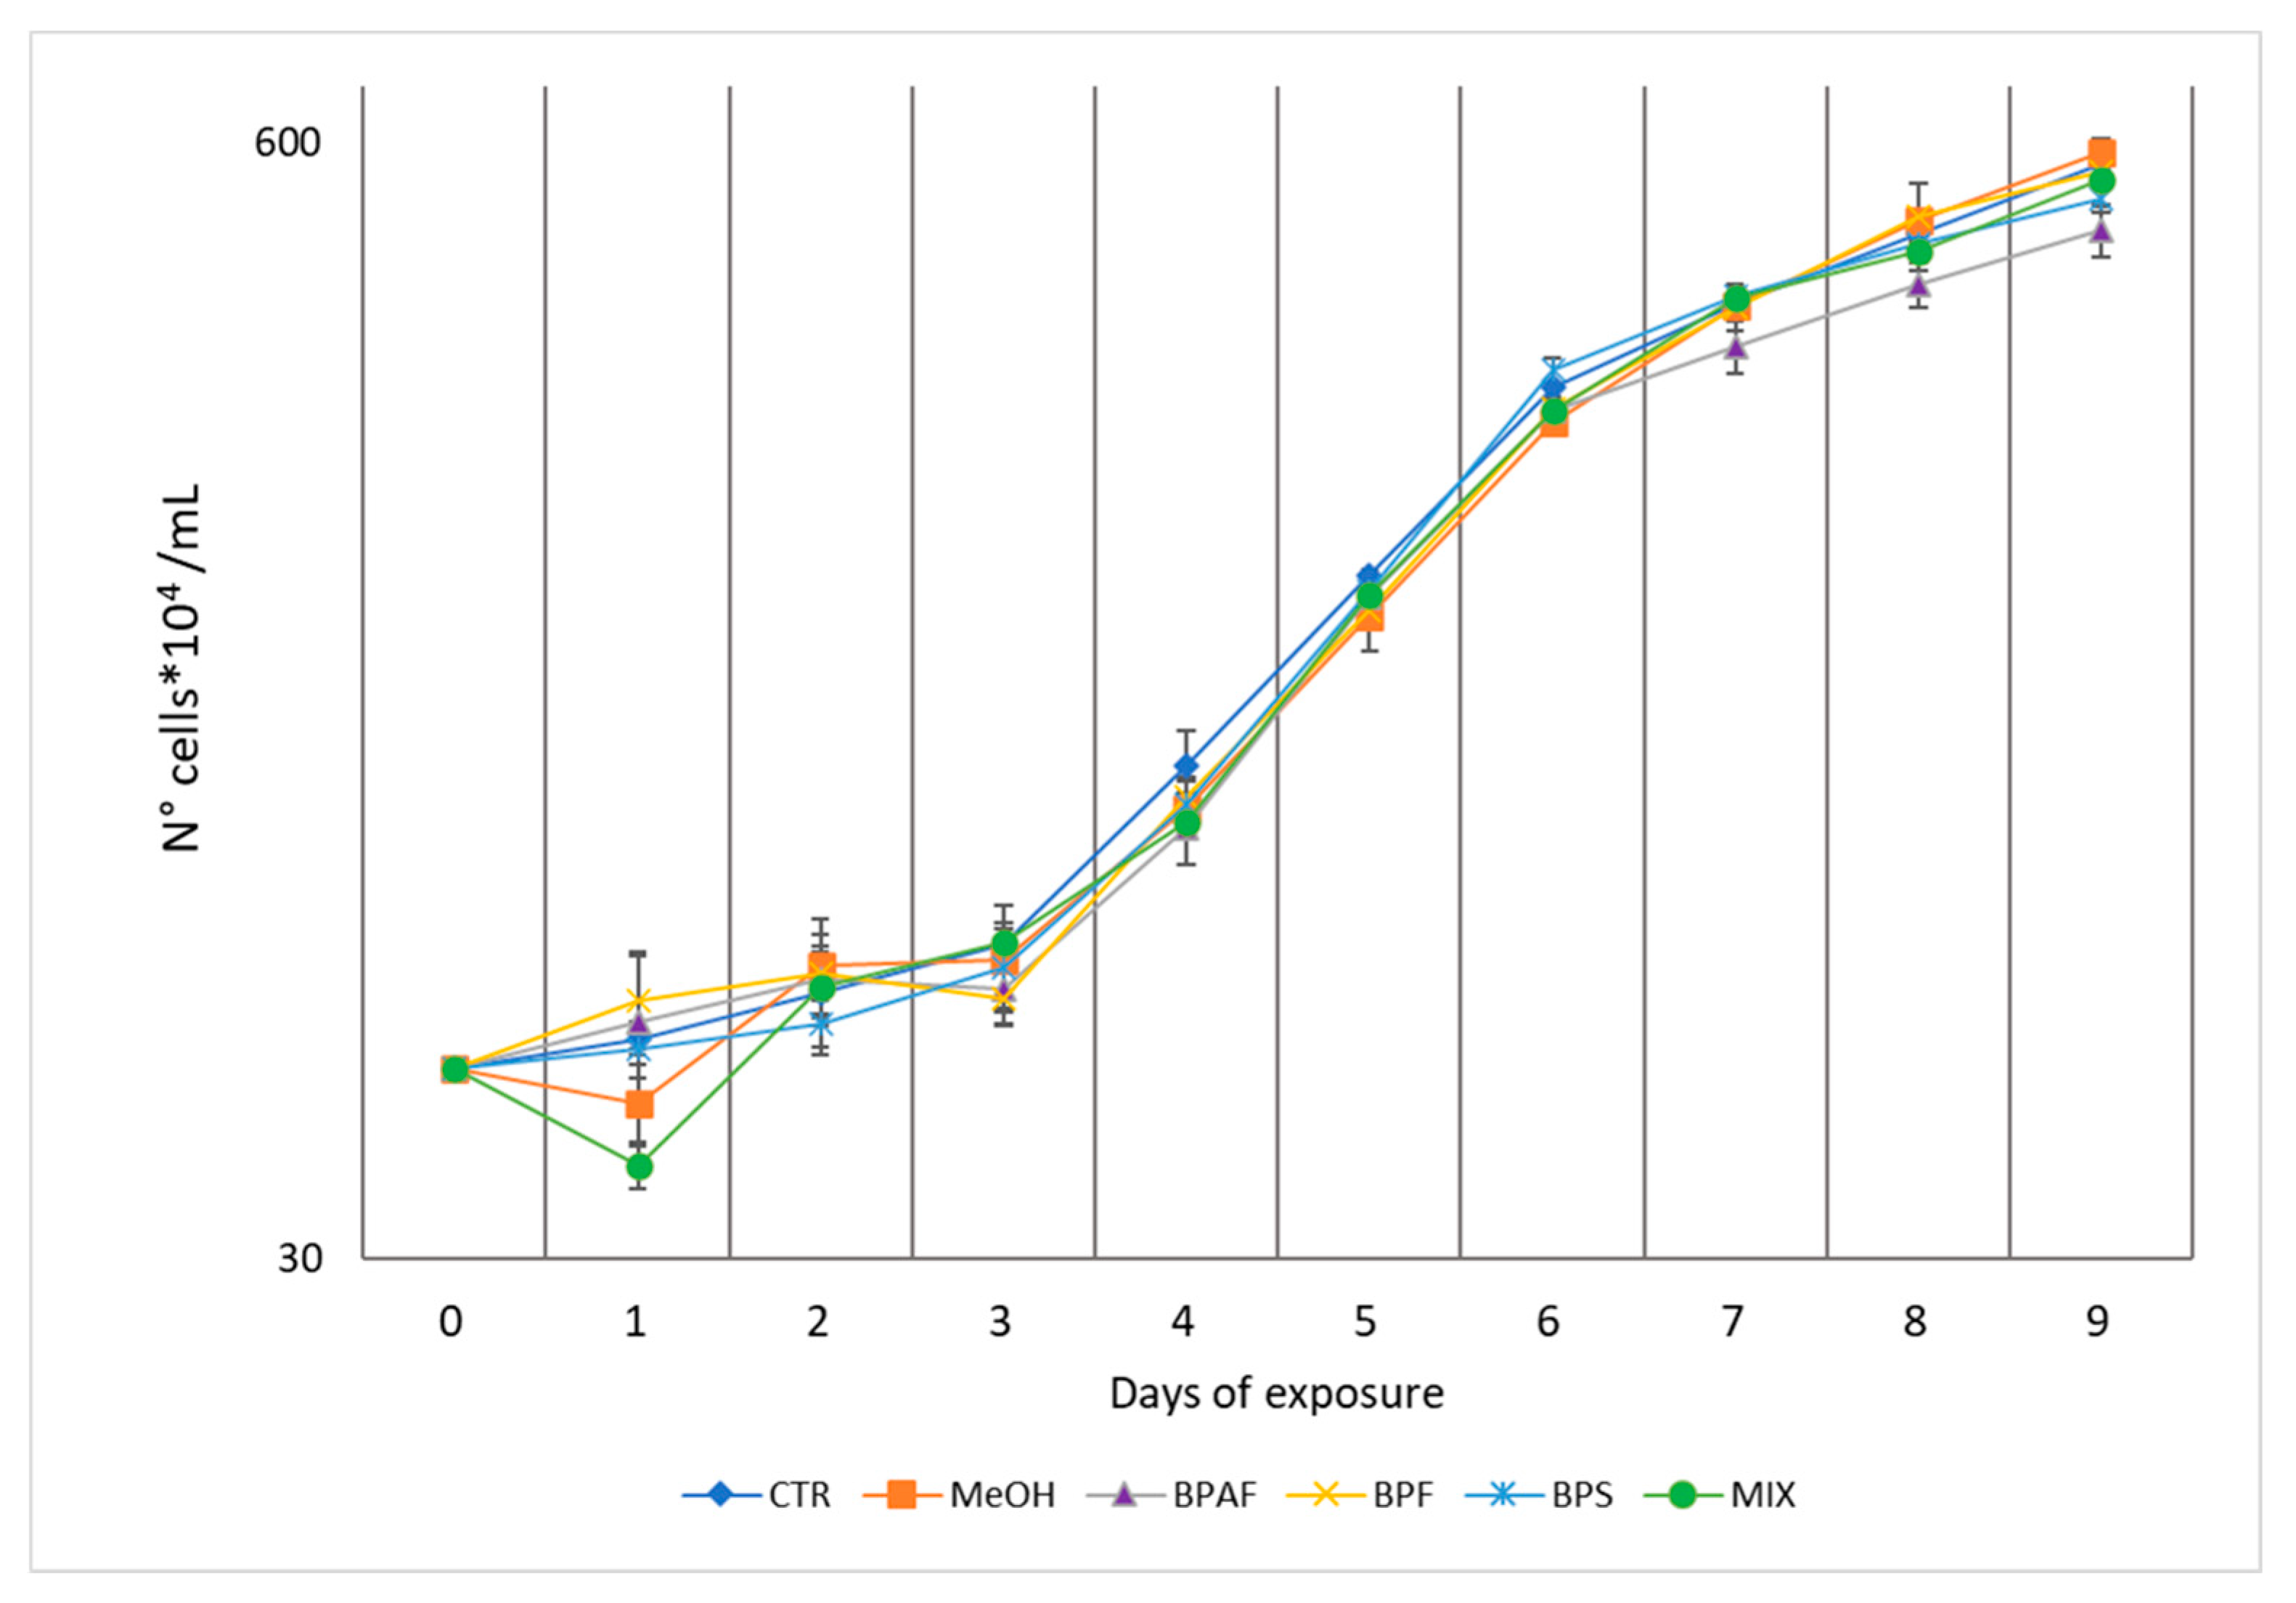
Figure 2.
CUPRAC levels expressed as mM of Trolox equivalents/mg protein (A), SOD activity, expressed as U SOD/mg protein (B), CAT activity, expressed as U CAT/mg protein (C), GST activity, expressed as nmol/min/mg protein (D) in the exponential (EXP) and stationary (STAT) growth phases. The values are mean ± SD (n = 3). The letters indicate significant differences in comparison with the related control.
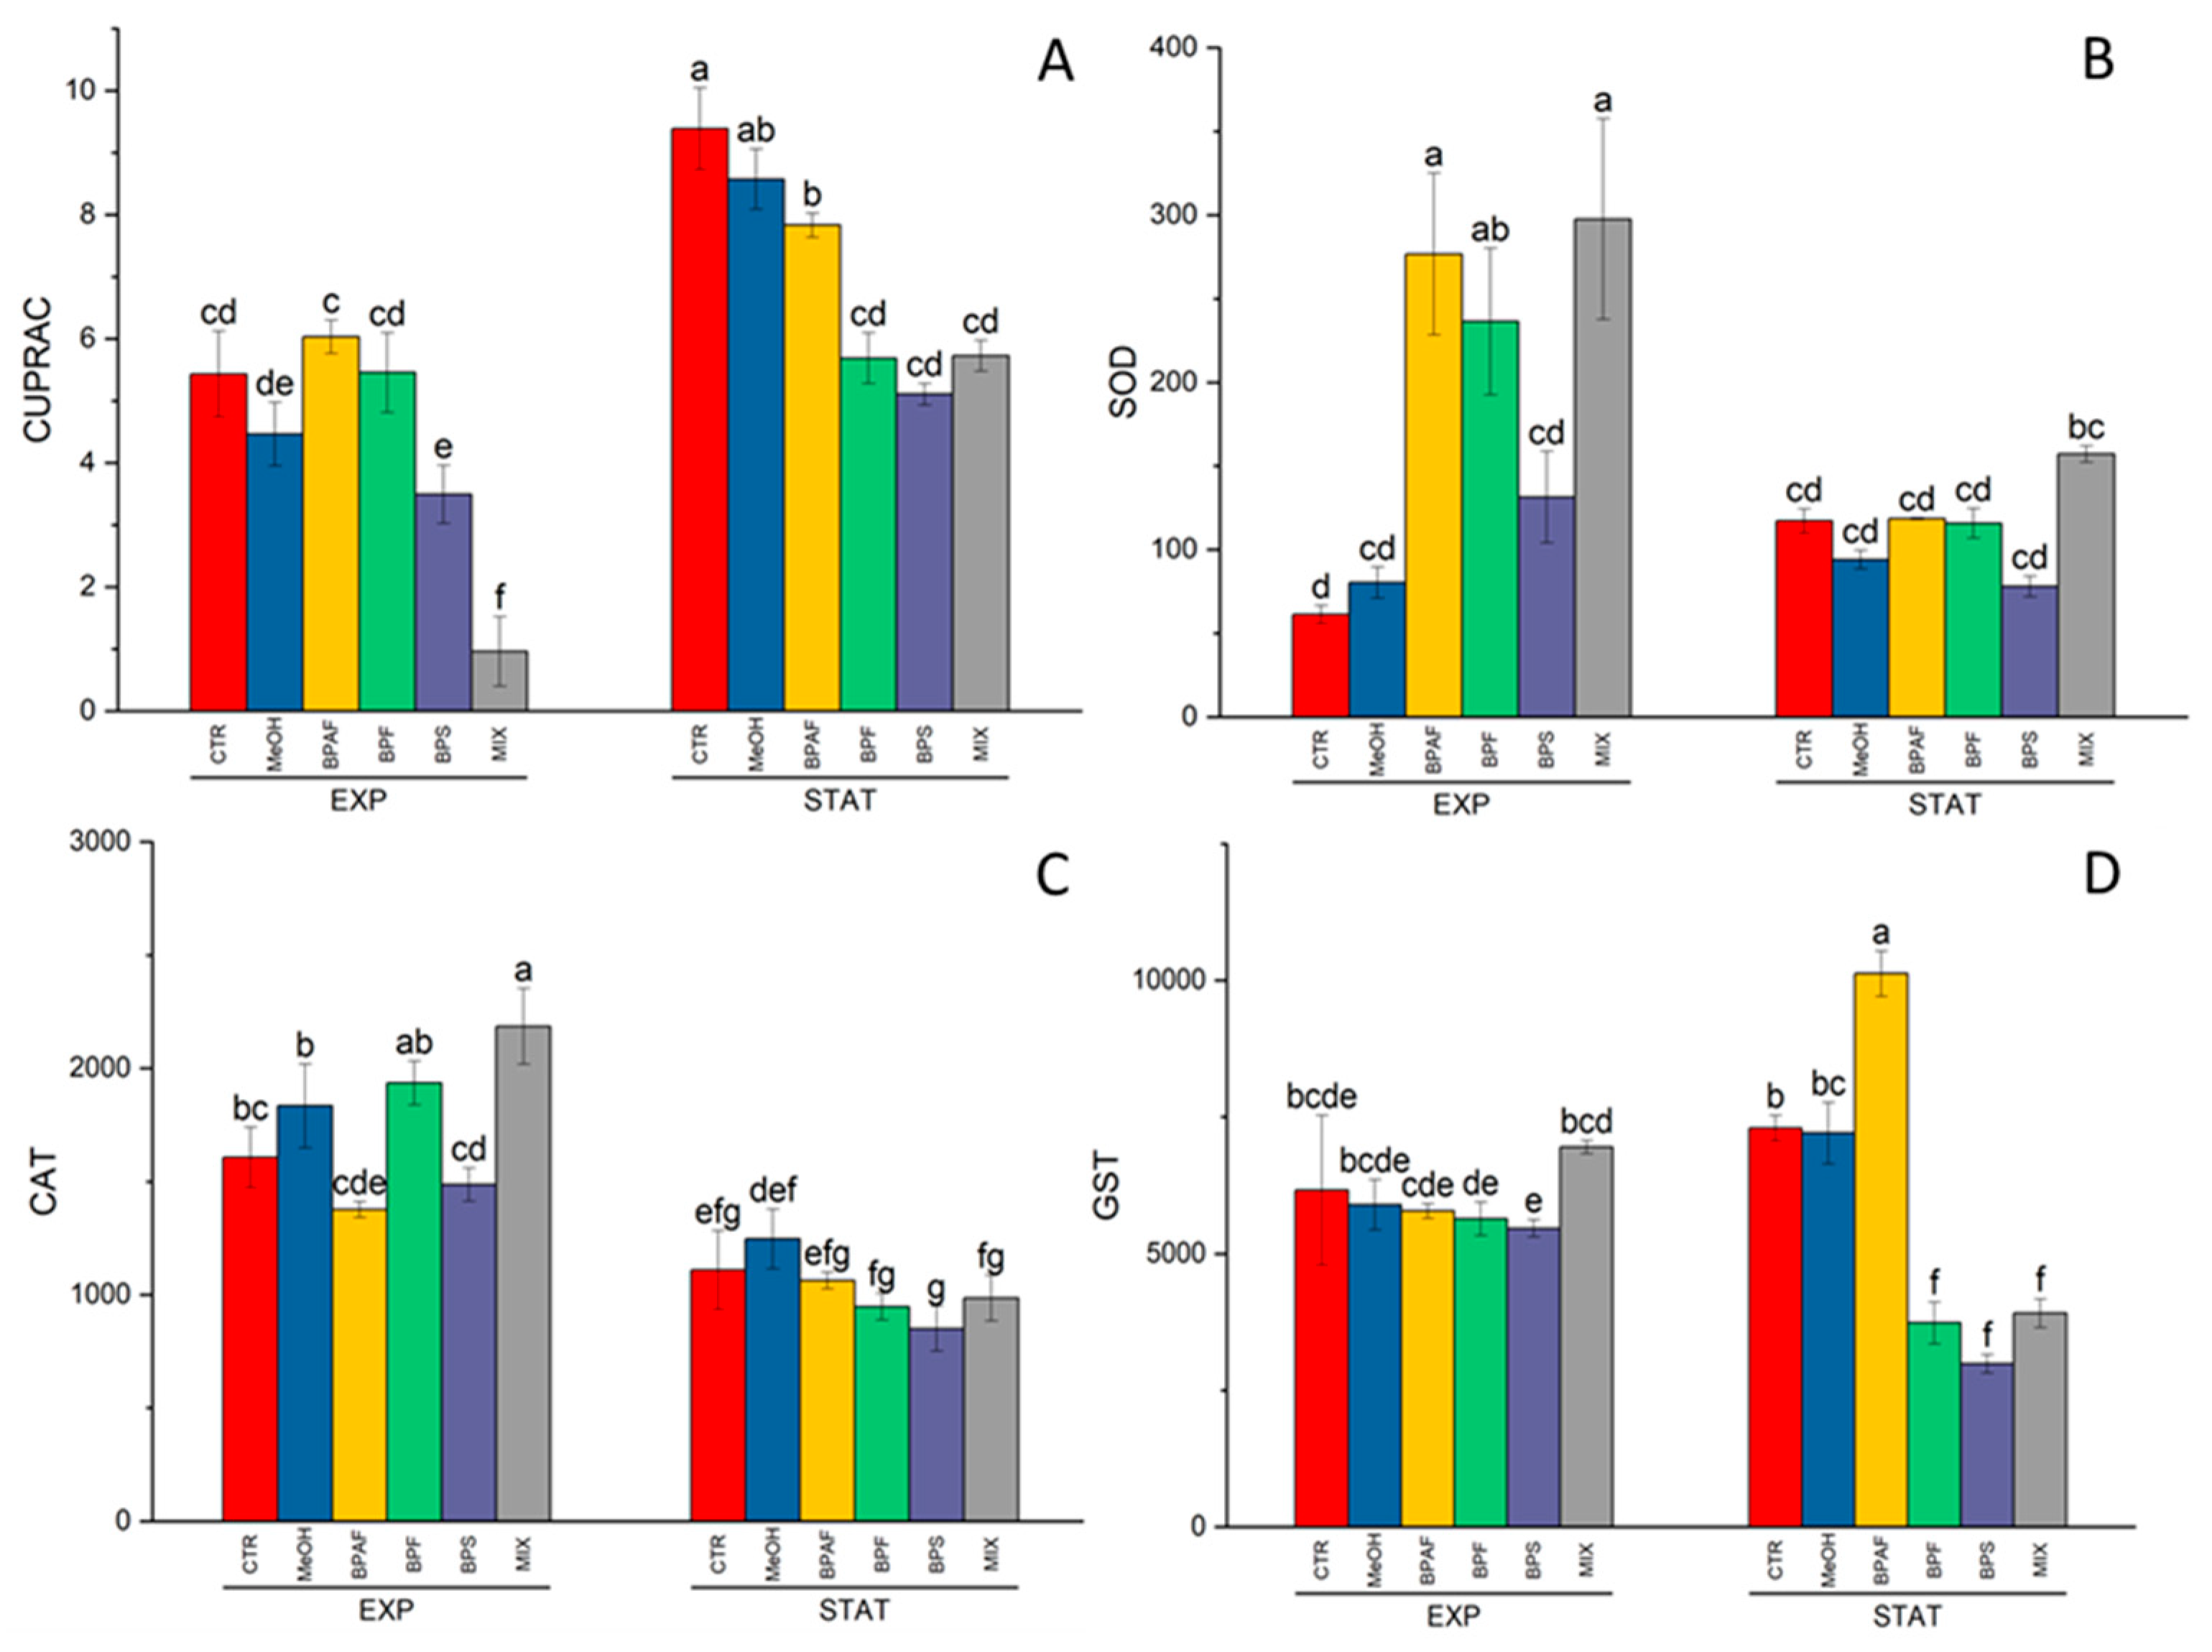
Figure 3.
GPX activity expressed as U GPX/mg protein (A), APX activity, expressed as U APX/mg protein (B) in the exponential (EXP) and stationary (STAT) growth phases. The values are mean ± SD (n = 3). The letters indicate significant differences in comparison with the related control.
Figure 3.
GPX activity expressed as U GPX/mg protein (A), APX activity, expressed as U APX/mg protein (B) in the exponential (EXP) and stationary (STAT) growth phases. The values are mean ± SD (n = 3). The letters indicate significant differences in comparison with the related control.
Disclaimer/Publisher’s Note: The statements, opinions and data contained in all publications are solely those of the individual author(s) and contributor(s) and not of MDPI and/or the editor(s). MDPI and/or the editor(s) disclaim responsibility for any injury to people or property resulting from any ideas, methods, instructions or products referred to in the content. |
© 2023 by the authors. Licensee MDPI, Basel, Switzerland. This article is an open access article distributed under the terms and conditions of the Creative Commons Attribution (CC BY) license (http://creativecommons.org/licenses/by/4.0/).
Copyright: This open access article is published under a Creative Commons CC BY 4.0 license, which permit the free download, distribution, and reuse, provided that the author and preprint are cited in any reuse.


